Images
Displayed in these plots are satellite images that are either shown in gray scale or with
one of a few color enhancements.
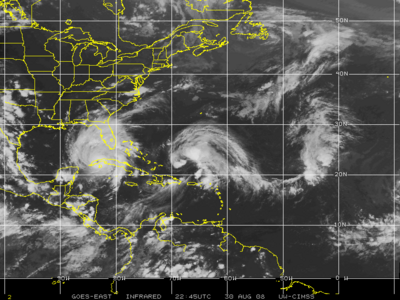
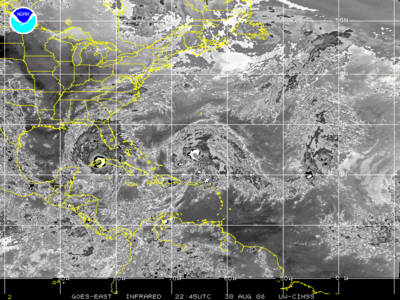
• Infrared Satellite Image
|
Longwave IR image displayed in gray scale. |
 |
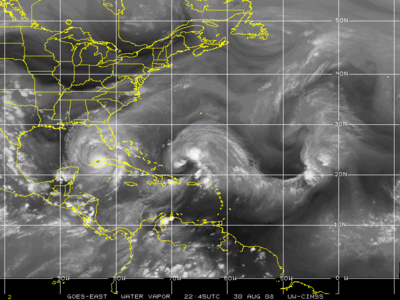
• Water Vapor Satellite Image
|
WV band image displayed in gray scale. |
 |
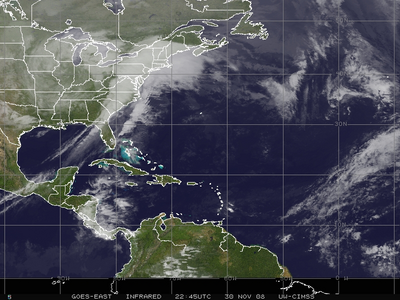
• Infrared Satellite Image Color Background
|
Longwave IR image displayed in gray scale over a NASA Big Blue Marble background. |
 |
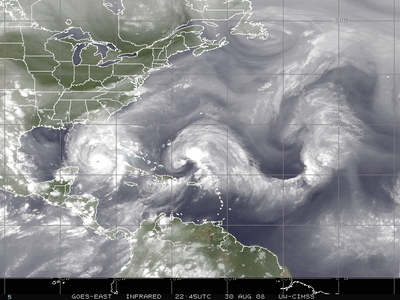
• Water Vapor Satellite Image Color Background
|
WV band image displayed in gray scale over a NASA Big Blue Marble background. |
 |
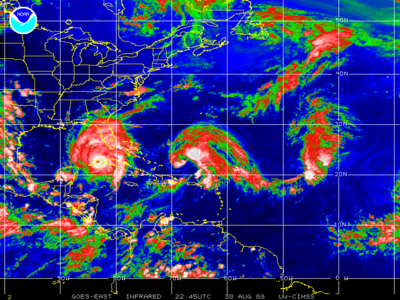
• IR Satellite Image NHC Enhancement
|
IR band image with NHC enhancement for highlighting storm features in a color presentation. A detailed description
of the NHC enhancement can be found here. |
 |
• IR Satellite Image BD Enhancement
|
IR band image with BD enhancement which is used in estimating storm intensity. A detailed description
of the BD enhancement can be found here. |
 |
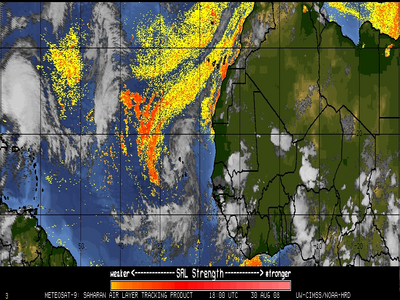
• Dry Air/Sharan Air Layer
|
Enhanced dry air signal split window product. A detailed description
of the dry air/Saharan air layer product can be found here. |
 |
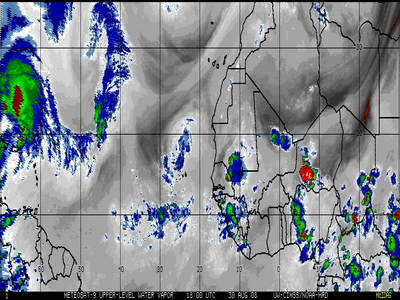
• Upper Level Water Vapor Enhanced for Dry Air
|
Enhanced upper atmospheric dry air signal from water vapor imagery. A detailed description
of this enhanced water vapor imagery product can be found here. |
 |
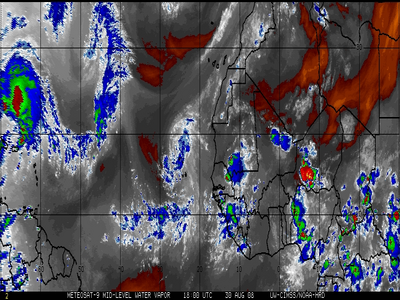
• Mid Level Water Vapor Enhanced for Dry Air
|
Enhanced mid atmospheric dry air signal from water vapor imagery. A detailed description
of this enhanced water vapor imagery product can be found here. |
 |
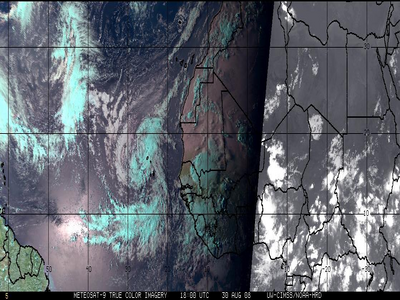
• True Color Image
|
Multi band composite image which mimics a color photo from the satellite. A detailed description
of this product can be found here. |
 |
Overlays
Displayed in these plots are various products derived from satellite imagery such as atmospheric
motion vectors.
"Large" scale or "Storm" zoom
Many products are available in either a basin wide large scale plot or a storm event or regional
based zoom. These examples are for the northwest Atlantic:
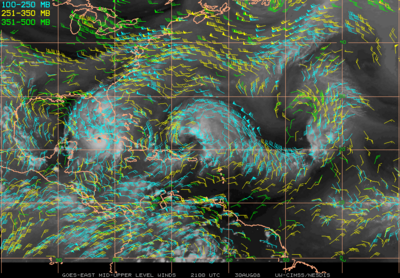
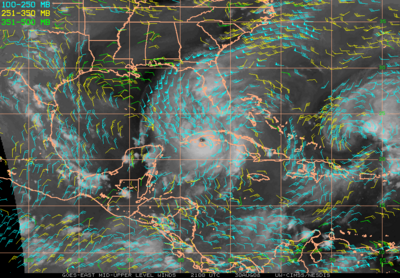
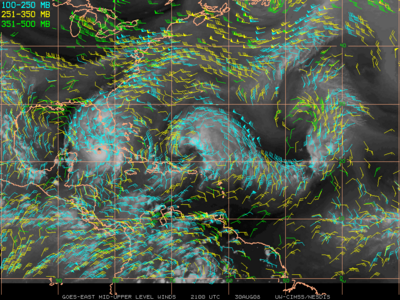
• Mid-Upper Layer Winds
|
Upper layer atmospheric motion vectors plotted over a satellite image background. A detailed description
of the CIMSS atmospheric motion vector products can be found here. |
 |
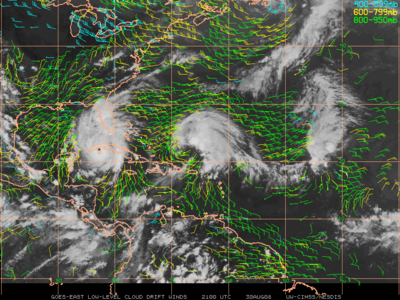
• Mid-Lower Layer Winds
|
Lower layer atmospheric motion vectors plotted over a satellite image background. A detailed description
of the CIMSS atmospheric motion vector products can be found here. |
 |
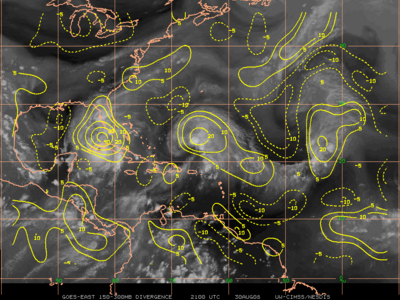
• Upper Level Divergence
|
Upper level divergence displayed over a satellite image background. A detailed description
of the CIMSS atmospheric motion vector based divergence product can be found here. |
 |
• Lower Level Convergence
|
Lower level divergence displayed over a satellite image background. A detailed description
of the CIMSS atmospheric motion vector based convergence product can be found here. |
 |
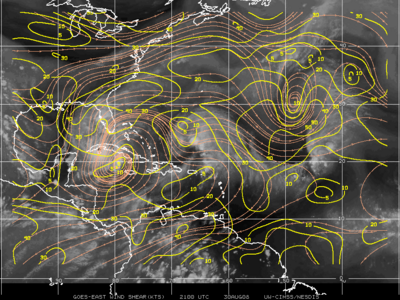
• Deep Layer Shear
|
Deep layer speed shear displayed over a satellite image background. A detailed description
of the CIMSS atmospheric motion vector based shear product can be found here. |
 |
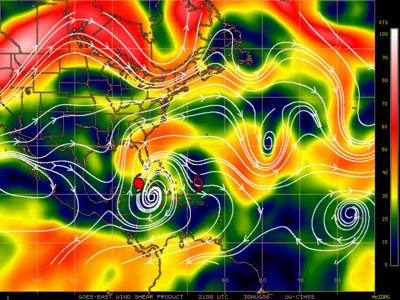
• Deep Layer Shear Color Filled
|
Color contour plot of deep layer speed shear. A detailed description
of the CIMSS atmospheric motion vector based shear product can be found here. |
 |
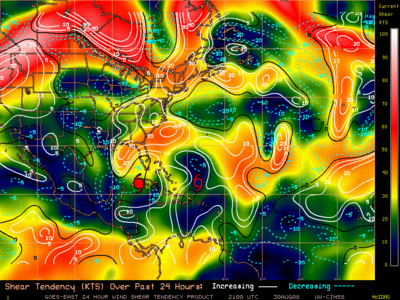
• Deep Layer 24 Hour Shear Tendency
|
Color contour plot of the 24 hour change in deep layer speed shear. A detailed description
of the CIMSS atmospheric motion vector based shear tendency product can be found here. |
 |
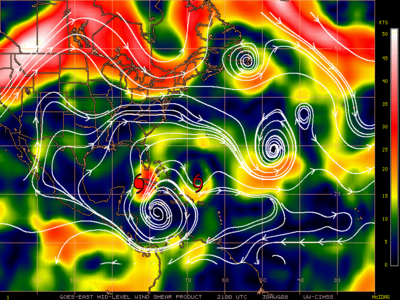
• Mid Layer Shear
|
Color contour plot of mid layer speed shear. A detailed description
of the CIMSS atmospheric motion vector based mid layer shear product can be found here. |
 |
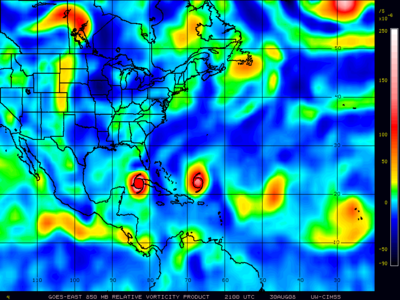
• Relative Vorticity
|
Color contour display of relative vorticity. The 850 mb level is available for most basins and 200 mb, 500 mb, and 700 mb
level plots are available for the northwest Atlantic. A detailed description
of the CIMSS atmospheric motion vector based relative vorticity products can be found here. |
 |
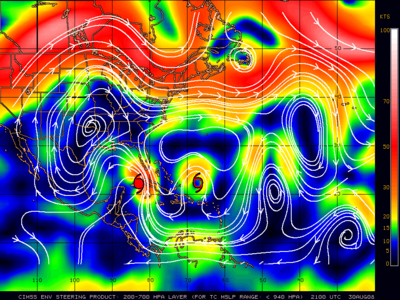
• Deep Layer Mean Steering
|
Color contour plots of deepp layer mean steering products, available for 700-850 mb, 500-850 mb, 400-850 mb, 300-850 mb,
250-850 mb, and 200-700 mb layers. A detailed description
of the CIMSS atmospheric motion vector based deep layer mean steering product can be found here. |
 |
McIDAS Format MD Files
These files contain our atmospheric motion vector products stored in McIDAS MD file format.
Text Files
These files contain our atmospheric motion vector products in digital text format. The "all winds" files
include all atmospheric motion vectors regardless of location. The "ocean only" files include only those
motion vectors over water. We have basic text files and
text files that include some quality control information, CIMSS RFF with EUMETSAT QI.