|
|
Background and Application
The GOES-R Hurricane Intenisty Estimation (HIE) algorithm is a derivative of the UW-CIMSS
Advanced Dvorak Technique (ADT) which utilizes longwave-infrared, temperature
measurements from geostationary satellites to estimate tropical cyclone (TC) intensity.
The HIE/ADT is based upon the operational
Dvorak Technique
(DT) developed by Vern Dvorak of NOAA over 30 years ago. This step-by-step
technique relies upon the user to determine a primary cloud pattern and measure
various TC cloud top parameters in order to derive an initial intensity estimate. Various
rules regarding TC development and intensity change over time are employed to guide
the user in the scene selection process and govern the rate in intensity change over a
given time period. The ADT/HIE has advanced beyond the scope of the original DT using
new image analysis techniques to further improve upon the original methodology.
Dvorak Technique flowchart.
The Dvorak Technique continues to be the standard method for estimating TC intensity where
aircraft reconnaissance is not available (all tropical regions outside the North Atlantic
and Caribbean Sea), however it has several important limitations and flaws. The primary
issue centers upon the inherent subjectivity of the storm center selection and scene type
determination proceedures. Secondly, learning the Dvorak Technique and its regional nuances
and adjustments can take a significant time to master. Finally, the technique was developed
more or less empirically by Dvorak and his colleagues, without the aid of computer analysis,
to determine statistical relationships between various environmental parameters and intensity.
The ADT/HIE (and its predecessors the ODT and AODT) sought to alleviate many of the limitations
found within the Dvorak Technique and previous objective algorithms based upon methods
outlined by Dvorak. The ADT/HIE currently utilizes a state-of-the-art objective storm center determination
scheme and cloud pattern determination logic to remove the subjectivity aspect from the
intensity estimation process. It also can be applied to all phases of the TC lifecycle;
something that previous objective schemes could not do. Additionally, the ADT/HIE makes use
of statistical analysis results obtained from a 10+ year sample of North Atlantic storms, along
with a significant sample of West and East Pacific storms, covering the entire spectrum of
TC intensities to derive a regression-based intensity value estimate for various phases
of the TC lifecycle. Finally, the ADT/HIE can intelligently make use of multi-platform
satellite information to help alleviate "problem areas" where IR imagery does not
provide sufficient information to allow the ADT/HIE to work properly (e.g. during the
"central dense overcast" stage prior to the appearance of an eye in the IR imagery).
The ADT/HIE is a powerful but easy-to-use TC intensity estimation guidance tool
possessing an accuracy on par with estimates obtained by experienced TC forecasters
using the Dvorak Technique.
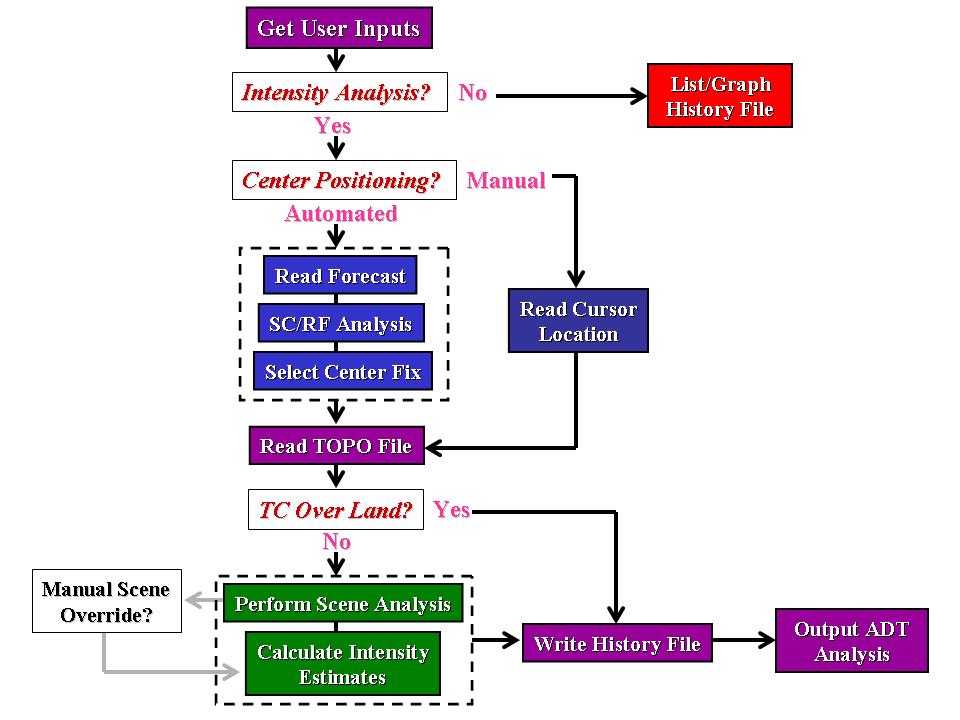
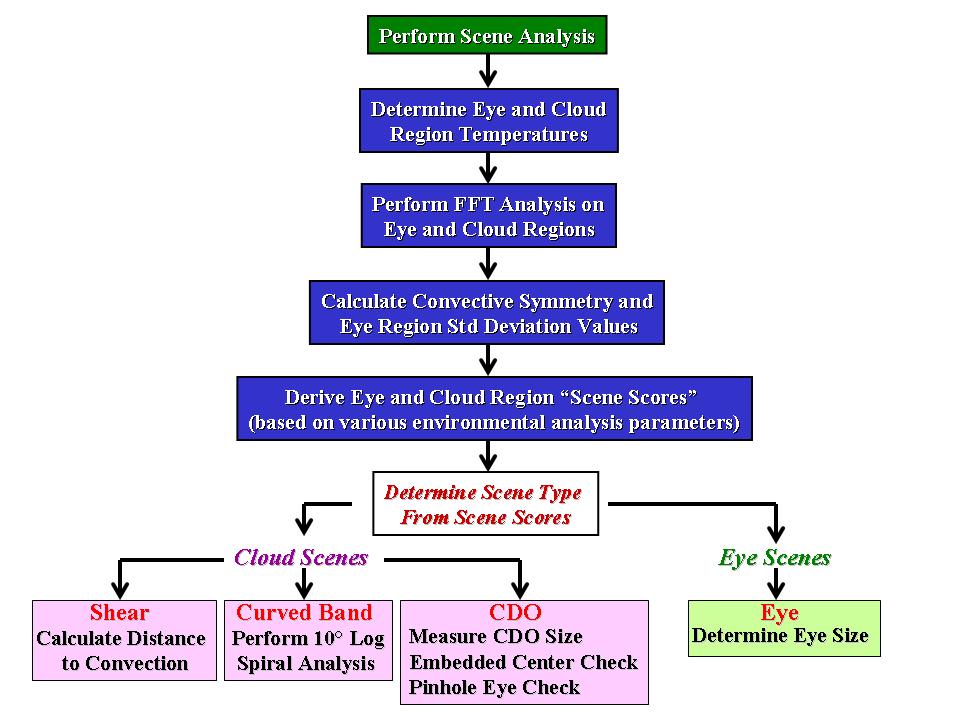
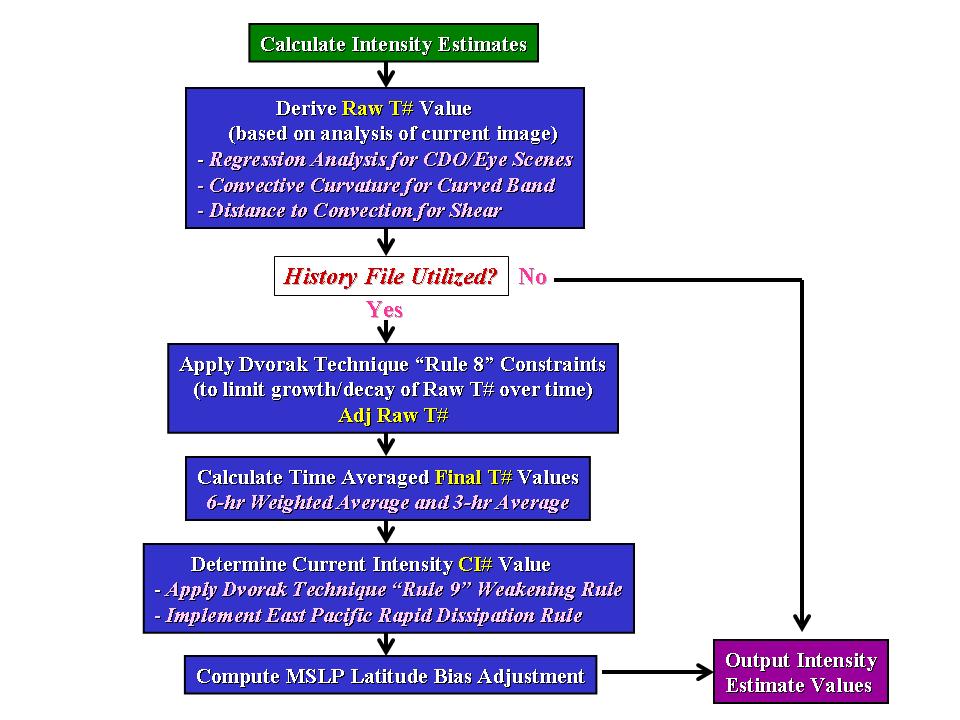
ADT flowcharts :
Overview |
Scene Selection |
Intensity Calculations
Monitoring and Analysis
The ADT/HIE provides real-time intensity estimates in terms of a current intensity "bulletin"
as well as a complete intensity estimate record of the ADT/HIE over the entire TC lifecycle.
An ADT/HIE intensity "bulletin" shows not only the current storm intensity but also various
analysis parameters that went into determining the current storm intensity. It is the primary
output of the ADT/HIE algorithm.
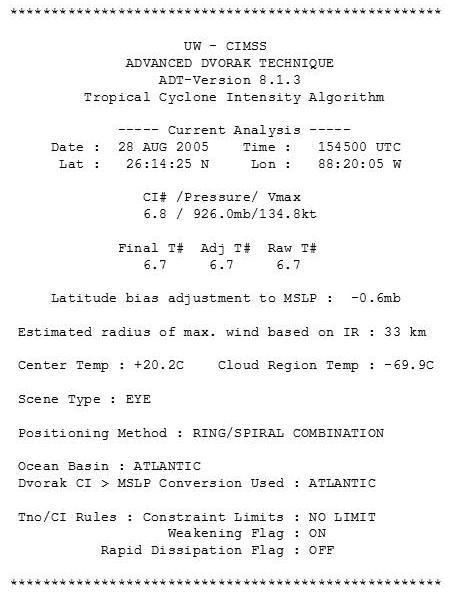
ADT/HIE Intensity "Bulletin" example
More detail regarding the parameters listed in the intensity bulletin can be found in the
ADT Users Guide
The timeline example below not only shows the ADT/HIE intensity estimate (blue) but also the
corresponding estimate timeline obtained from NOAA/SAB using the DT (red) and the Final NHC
"Best Track" (green), which primarily utilizes aircraft reconnaissace as ground truth. The
ADT/HIE history can also be view in a text listing which contains more information such as
storm location, cloud and eye temperature values, and other ADT/HIE analysis-specific information.
ADT/HIE Intensity Timeline example
Real-Time Processing
During the 2011 Atlantic Hurricane season, the ADT/HIE will provide intensity estimates in
real-time for continued evaluation of the algorithm performance. The criteria to be used for
analysis are:
• Will utilize MSG SEVERI imagery on all systems east of 60W (analysis every 15 minutes)
• Will utilize GOES-East imagery on systems west of 60W and north of 15N (analysis every 30 minutes)
• Automatically initated upon official NHC declaration of a tropical cyclone event
(depression or greater strength)
• Will utilize ADT Version 8.1.3 (with use of MW "eye score" information)
Real-time GOES-R Proving Ground ADT/HIE estimates can be found
here.
Validation
Validation of the ADT/HIE performance was conducted previously for the GOES-R AWG. This study
utilized MSG SEVERI (MSG) and simulated GOES-R ABI (SABI) imagery for seven eastern Atlantic
tropical cyclones during the 2006-2008 TC seasons. The storms were:
• 2008 - Bertha, Ike, and Omar
• 2007 - Dean and Karen
• 2006 - Gordon and Helene
The study compared 30-minute versus 15-minute image availability to assess the impact of improved
temporal resolution imagery. Validation was performed versus NHC "Best Track" wind speed
estimates interpolated to image times. The image resolution for all images was 3km, and all
statistics are conducted on a homogeneous data sample.
| (units m/s) |
Bias |
|Bias| |
RMSE |
AbsErr |
StdDev |
Num |
| SABI-30min |
-0.28 |
0.28 |
8.51 |
6.78 |
8.50 |
2455 |
| SABI-15min |
-0.01 |
0.01 |
8.42 |
6.77 |
8.42 |
2455 |
| MSG-30min |
-0.79 |
0.79 |
8.37 |
6.63 |
8.34 |
2455 |
| MSG-15min |
-0.38 |
0.38 |
8.21 |
6.52 |
8.20 |
2455 |
Note: Accuracy=|Bias| ; Precision=StdDev
Overall, the ADT/HIE statistics were very close to meeting GOES-R AWG specifications. The ADT/HIE
accuracy was well below GOES-R specification of 5.0 m/s, but the precision was found
to be slightly above the desired specification of 8.0 m/s. One possible source for error could
be the poor viewing angles for many of the images in the sample (near or greater than 50 degrees).
Large viewing angles will affect not only the interpretation of the cloud scene types, but will also
result in poorly sample eye regions, affecting the determination of the structure and temperature
of the eye and resulting in weaker intensity estimates. This is reflected in the overall negative
(weak) biases for all of the data sample statistics listed in the above table.
Storm track (left) and image with poor viewing angle (right) for Hurricane Helene
(17 Sept 2006/19:15UTC).
|
|
|
|
|
