|
|
GOES Split Window:
Background:
This imagery is created by differencing the 12.3 (“dirty” IR longwave band) and
10.3 µm (“clean” IR longwave band) infrared channels on the GOES-East satellite.
The “split window” algorithm is sensitive to the presence of dry and/or dusty air
in the lower to middle levels of the atmosphere (~600-925 hPa or ~4,500-800 m)
and is denoted by yellow to pink shading (Dunion and Velden 2004).
Uses:
This imagery is useful for monitoring the position and movement of dry air masses
such as the Saharan Air Layer (SAL) and mid-latitude dry air intrusions (Dunion 2011).
Animations of the imagery are useful for tracking these features and can also
help identify the source of the dry and/or dusty air that is indicated in the imagery.
Notes:
• Lower to middle level dry air and suspended aerosols (e.g. Saharan dust)
both contribute to a positive "SAL" signal in this imagery, but the relative
contribution of each cannot be determined from this imagery alone. Dry air will
produce a positive signal in the imagery and the presence of dust can significantly
enhance that signal.
• Dry air originating from the mid-latitudes produces a positive signal
that is similar to that of the SAL. This is because both air masses contain
substantial dry air in the lower to middle levels of the atmosphere.
• Areas of cold ocean temperatures (e.g. west of northern South America)
can also produce a positive signal in the imagery. These regions can be fairly
easily identified using animations, since they tend not to move or change form
over time.
• Animations of the split window imagery are useful for determining which
type of air mass is being indicated in the imagery. Additional analysis tools such
as aerosol analysis models (e.g. NRL NAAPS), satellite imagery (e.g. aerosol optical
depth, and natural color imagery), and model backward trajectories (e.g. NOAA HYSPLIT)
are also useful for determining the origins of the air masses that are being tracked
in the split window imagery.
References:
• Dunion, J.P., 2011: Re-Writing the Climatology of the Tropical North
Atlantic and Caribbean Sea Atmosphere. J. Climate., 24, 893-908.
• Dunion, J.P., and C.S. Velden, 2004: The impact of the Saharan Air
Layer on Atlantic tropical cyclone activity. Bull. Amer. Meteor. Soc.,
85 no. 3, 353-365.
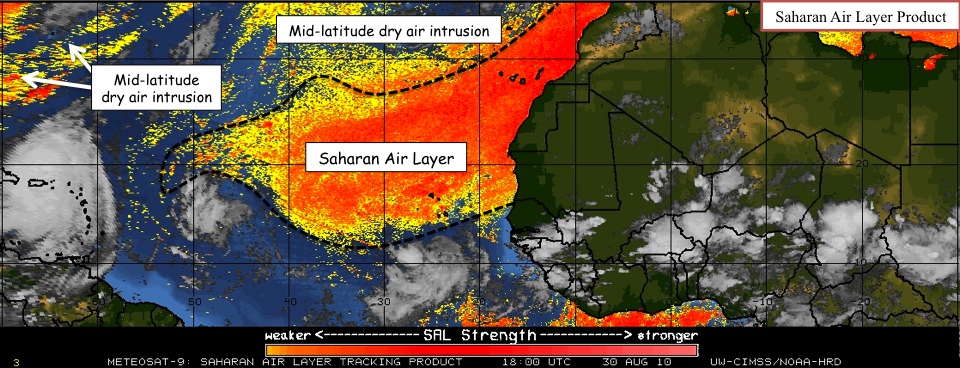
Example of a split window "SAL" image.
For more SAL information, please visit the
SAL Background Information
page.
|
|
|