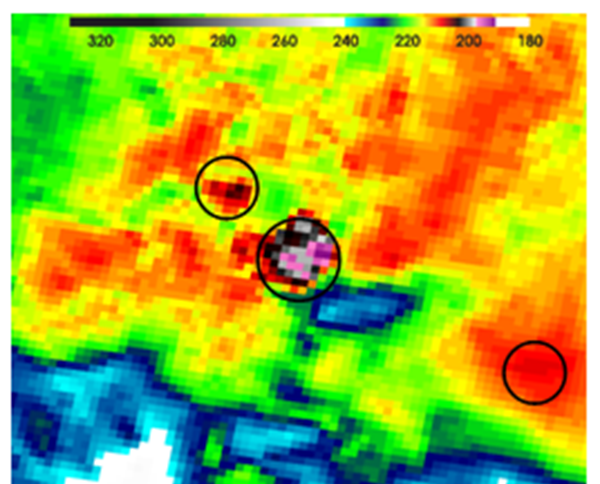
About the algorithmThe objective satellite-based overshooting cloud top (OT) detection algorithm is formulated around the premise that OTs appear as small clusters of pixels (&le 15 km diameter) that are significantly colder than the surrounding anvil cloud. Relative BT minima that are lower than 215 K are first identified. Checks are then performed to ensure that no minima are located within 15 km of each other so that portions of the same OT are not classified as two independent tops.
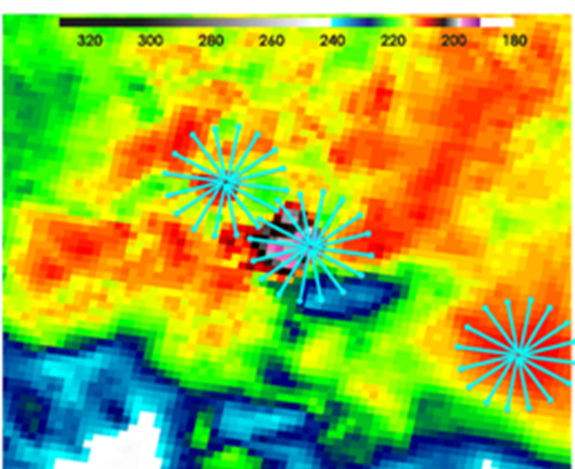
The IRW BT of the anvil cloud surrounding the potential OT is then sampled at an ~8 km radius in 16 directions. The surrounding anvil pixels must have an IRW temperature at or colder than 225 K to be included in the mean computation. At least 5 valid anvil pixels must be present. The 5-of-16 pixel criterion is imposed to ensure that the anvil is of relatively large horizontal extent but allows an anvil to occupy as small as a 90° quadrant which might be the case when strong jet-level winds are present.
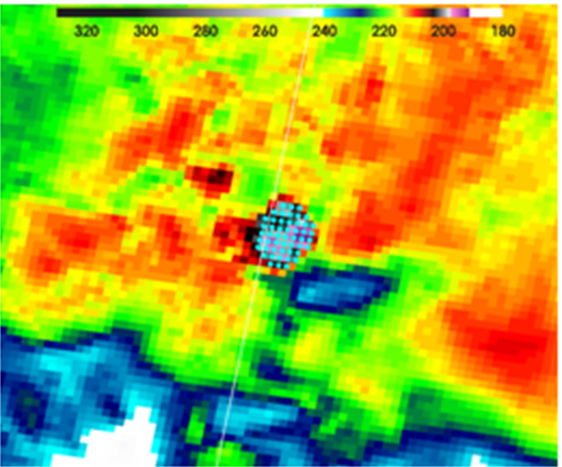
A pixel is classified as an overshooting top if it is &le 9 K colder than the mean BT of the surrounding anvil cloud. This would imply that the pixel is approximately 1.2 km above the anvil (Adler et al. 1983). As this process identifies only one pixel at the location of an OT minimum BT, a filling procedure is performed when necessary to capture the remaining neighboring pixels that comprise the entire OT.
Using a combination of synthetic satellite imagery and cloud top height derived from a cloud-resolving NWP simulation, Bedka et al. (2010) show that both a greater OT-anvil BT difference (magnitude of the overshooting top) and a greater number of pixels included in the mean can be used to reduce the false alarm ratio (FAR) of OT detections. Their results show a FAR ranging from 4.2 to 38.8% depending on the values of these two parameters. Comparison of GOES-12 OT detections with CloudSat observed OT events indicates an algorithm false alarm rate of ~18% when 5 of 16 pixels are included in the mean anvil BT computation. For this research, 9 pixels were included in the mean. In addition, candidate overshooting top pixels can be compared NWP tropopause temperature to verify that these pixels are indeed cloud tops &ldquo overshooting &rdquo their equilibrium levels in the tropopause region. However, this research attempts to look at &ldquo vortical &rdquothis hot towers. Since, Liu and Zipser (2005) indicates precipitation features (PF) from the TRMM radar reaching the with a temperature colder than the tropopause is ~7 times less than PFs reaching 14 km, the NWP tropopause temperature requirement is not employed to allow for greater capturing of hot towers. In addtion, this research attempts to produce a climatology of pre-genesis OTs and therefore does not want to rely on the availability of GFS tropopause data from past years. For a full description, please see Bedka et al. (2010).
|