Typhoon 27S
|
Passive Microwave (PMW) Intensity Information Advanced Dvorak Technique Version 9.1 |
--Overpass-- --ARCHER-- Ring Ring Eye BT -Forecast-
Date Time Sat Lat Lon Diam Pct TbDiff Score Meaning Vmax Lat Lon
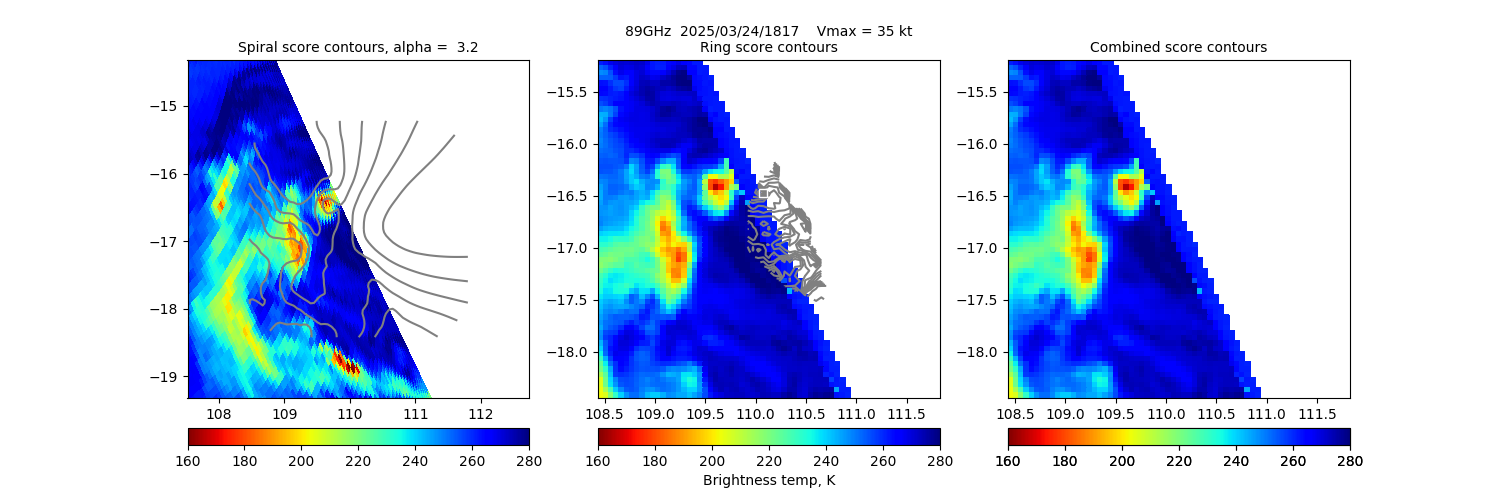
20250324 181705 GMI -16.7 110.9 N/A N/A N/A N/A N/A 35.0 -16.8 110.1 Analysis Plot
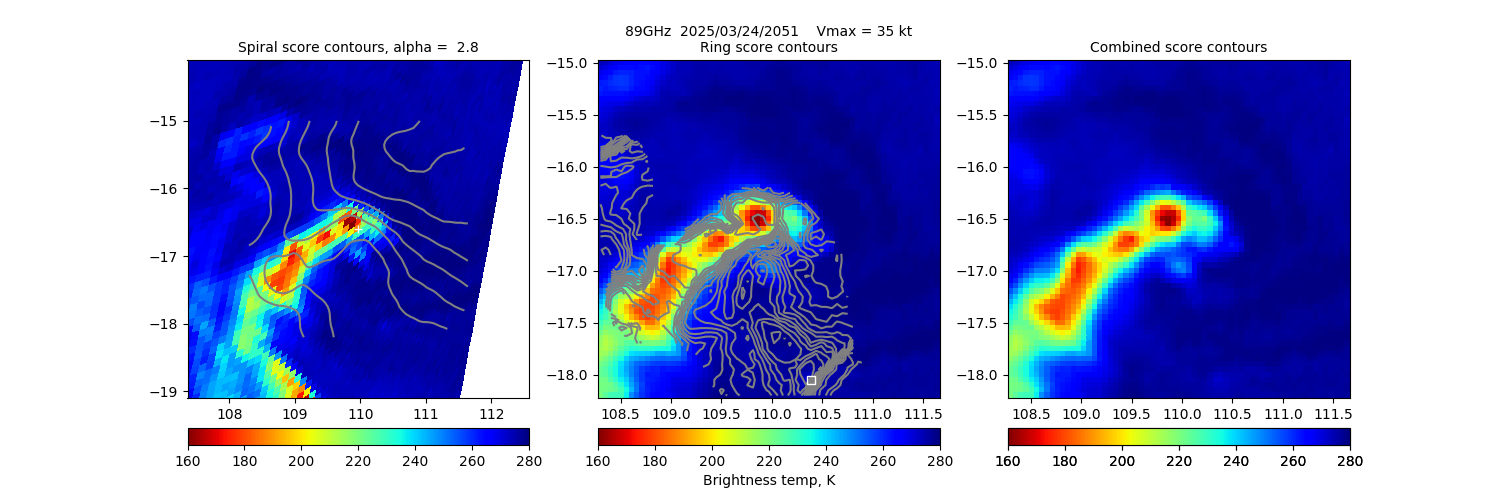
20250324 205145 SSMISF18 -17.0 110.0 68 38% 0.64 -0.64 N/A 35.0 -16.6 110.0 Analysis Plot
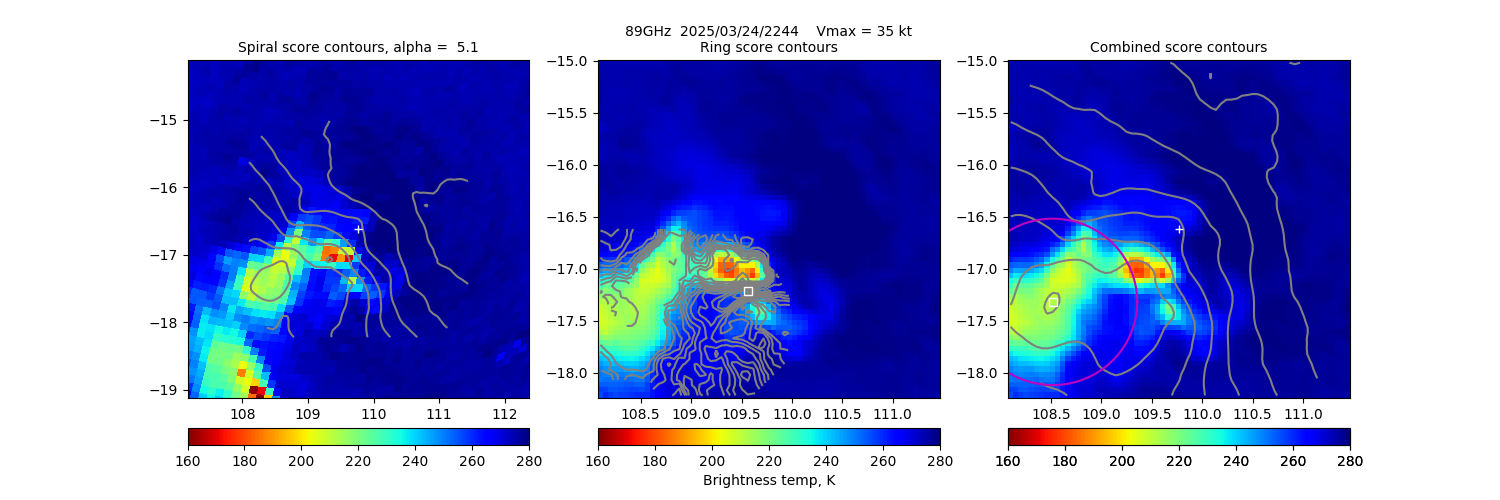
20250324 224427 SSMISF17 -17.3 108.5 N/A N/A N/A N/A N/A 35.0 -16.6 109.8 Analysis Plot
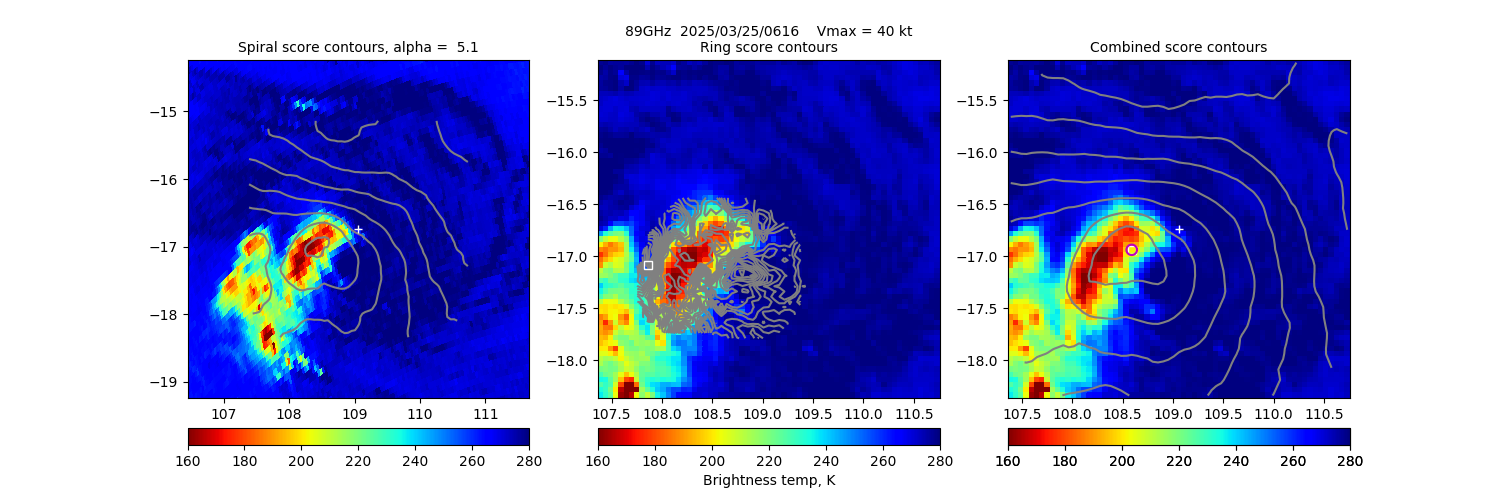
20250325 061626 AMSR2 -16.9 108.6 N/A N/A N/A N/A N/A 40.0 -16.7 109.1 Analysis Plot
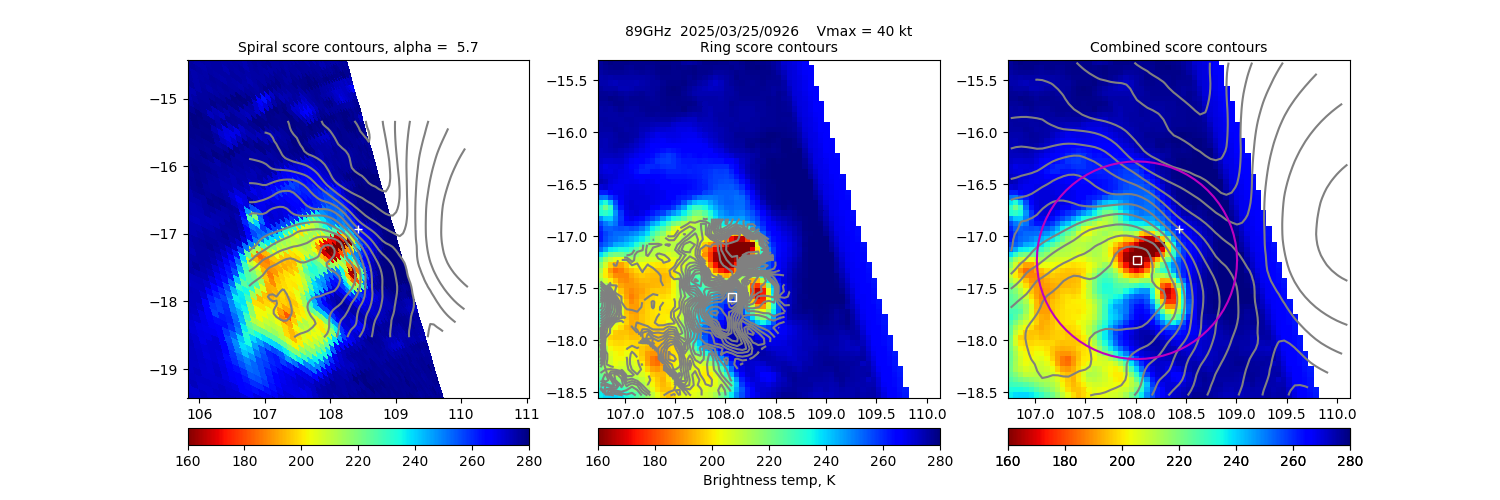
20250325 092646 SSMISF18 -17.2 108.0 201 26% 3.17 -3.17 N/A 40.0 -16.9 108.4 Analysis Plot
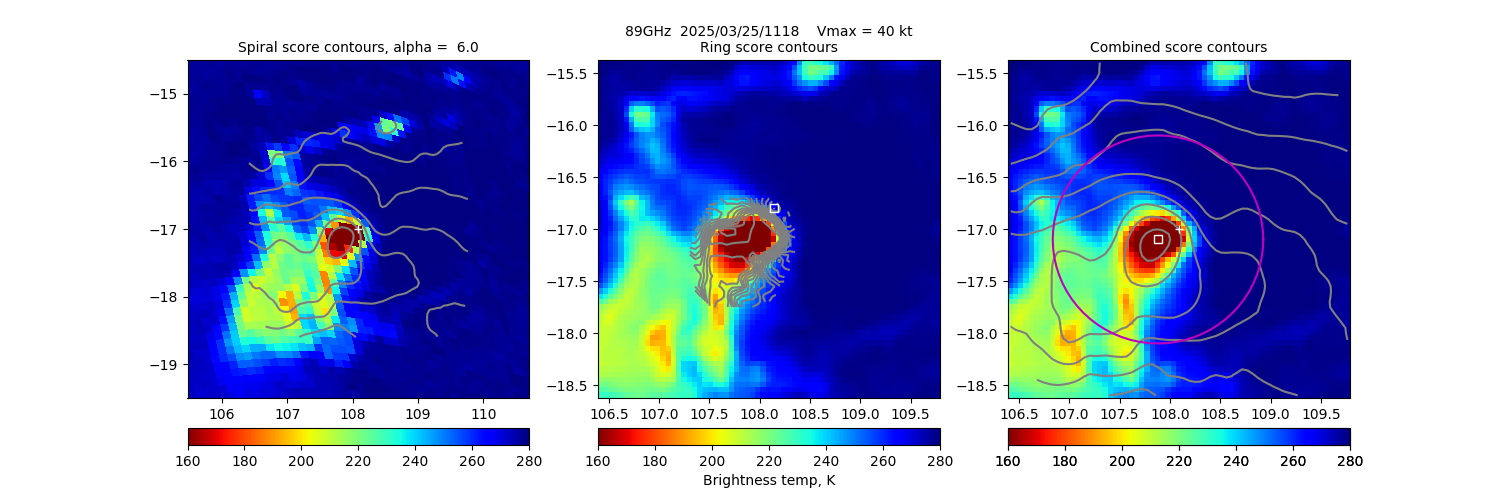
20250325 111842 SSMISF17 -17.1 107.9 212 17% 1.38 -1.38 N/A 40.0 -17.0 108.1 Analysis Plot
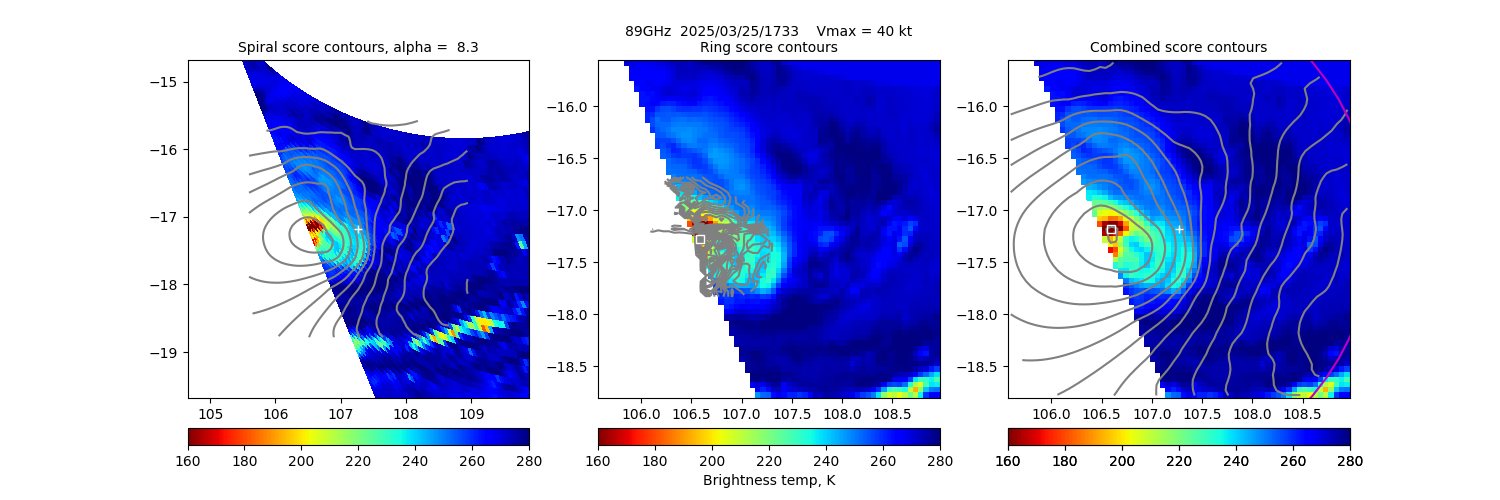
20250325 173357 GMI -17.2 106.6 N/A N/A N/A N/A N/A 40.0 -17.2 107.3 Analysis Plot
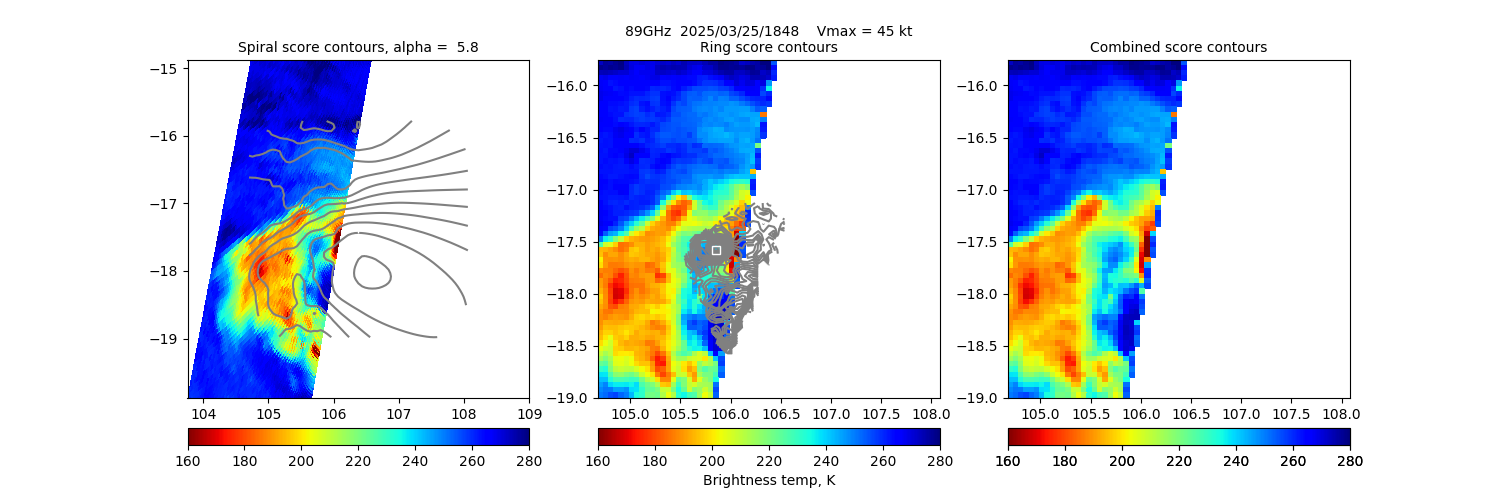
20250325 184826 AMSR2 -17.8 106.3 N/A N/A N/A N/A N/A 45.0 -17.4 106.4 Analysis Plot
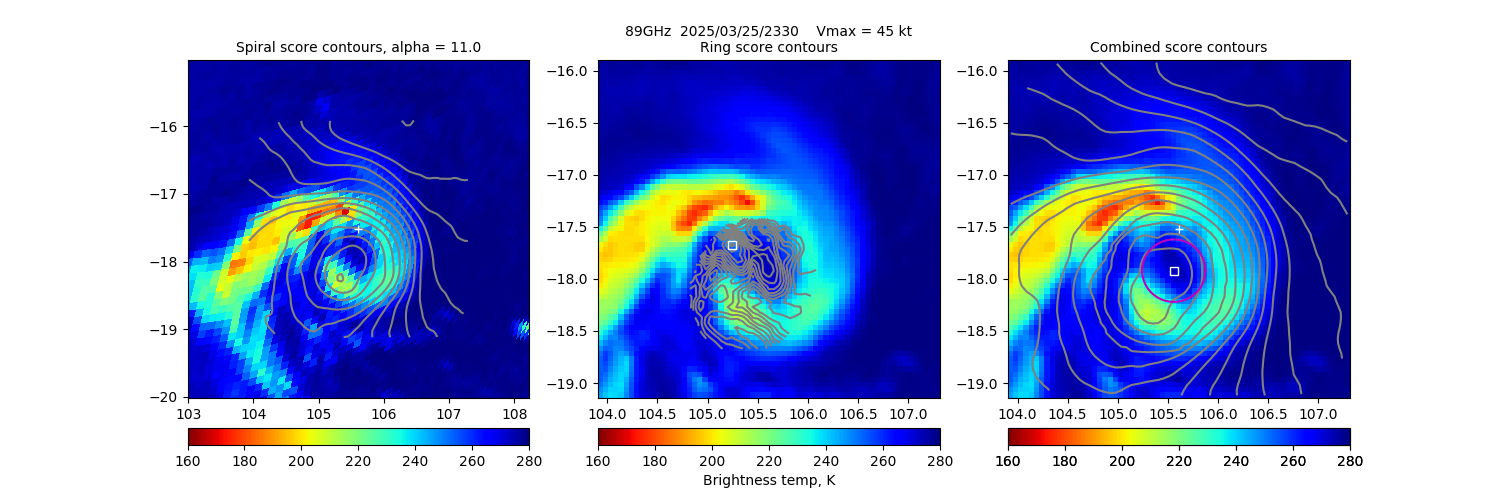
20250325 233032 SSMISF16 -17.9 105.6 57 18% 13.56 -13.56 N/A 45.0 -17.5 105.6 Analysis Plot
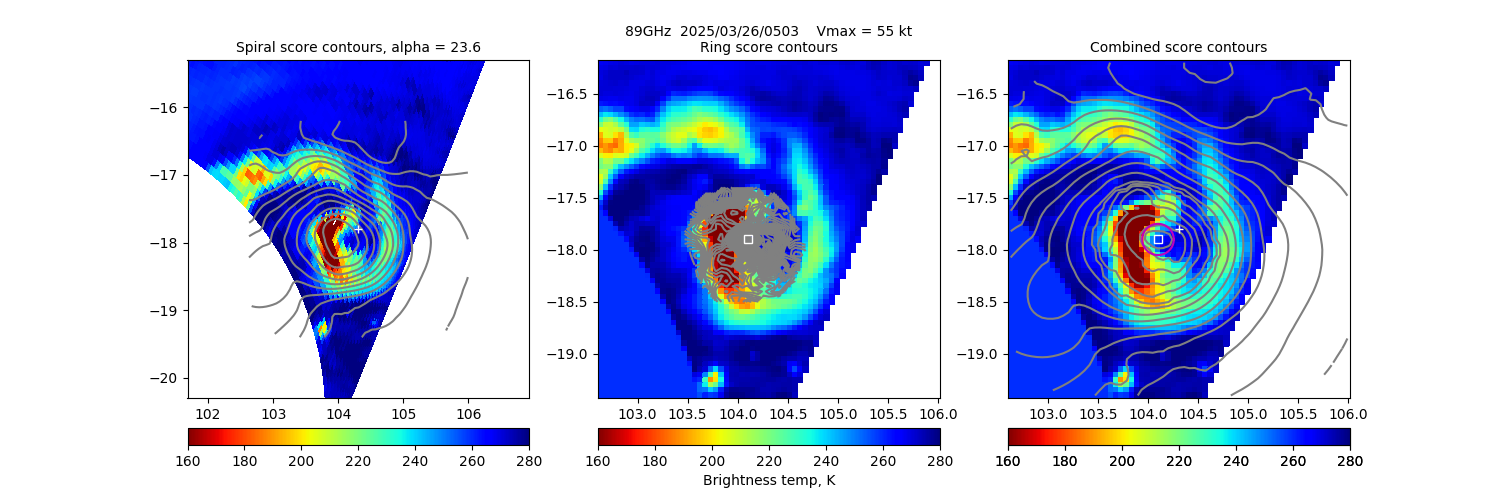
20250326 050349 GMI -17.9 104.1 23 50% 0.40 0.40 N/A 55.0 -17.8 104.3 Analysis Plot
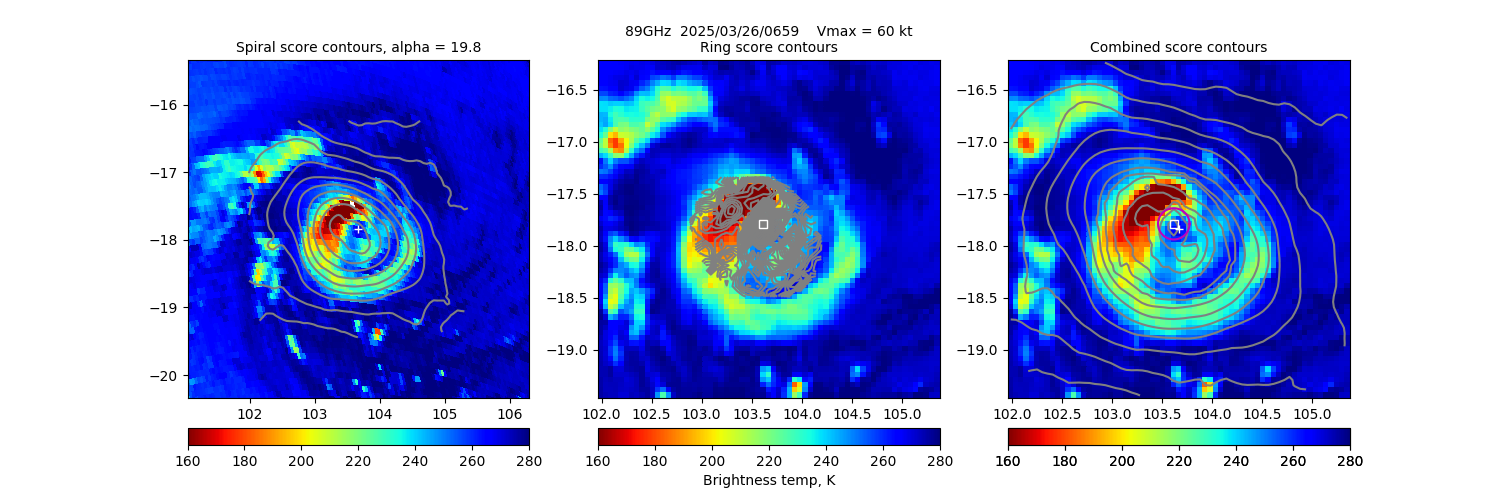
20250326 065908 AMSR2 -17.8 103.6 23 90% 16.82 31.82 >65 kts 60.0 -17.8 103.7 Analysis Plot
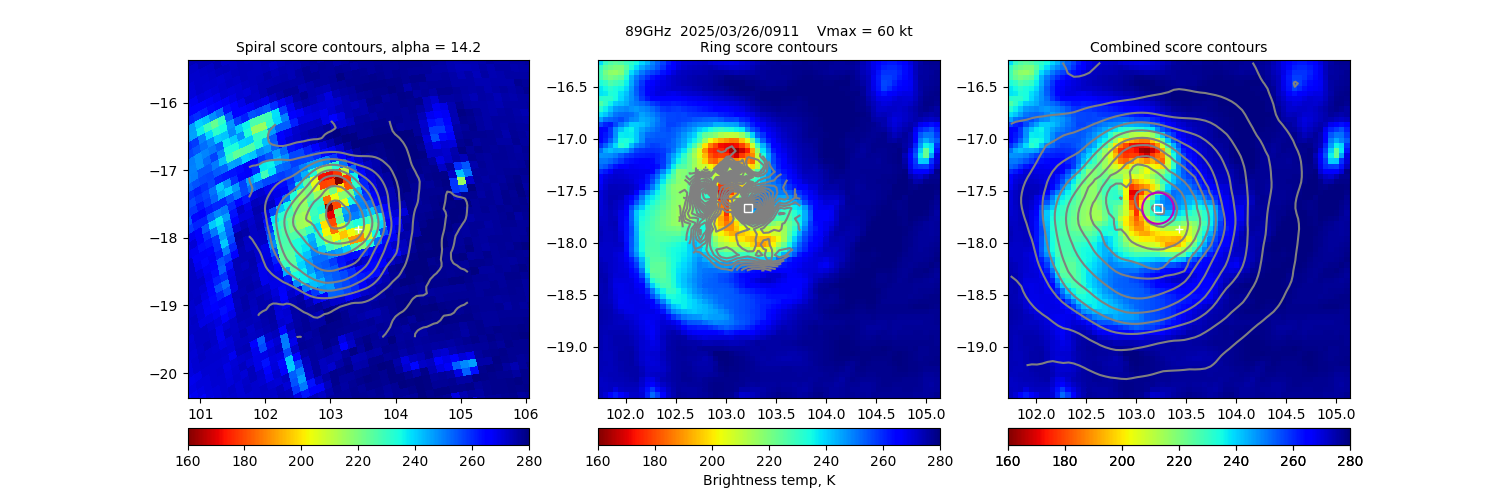
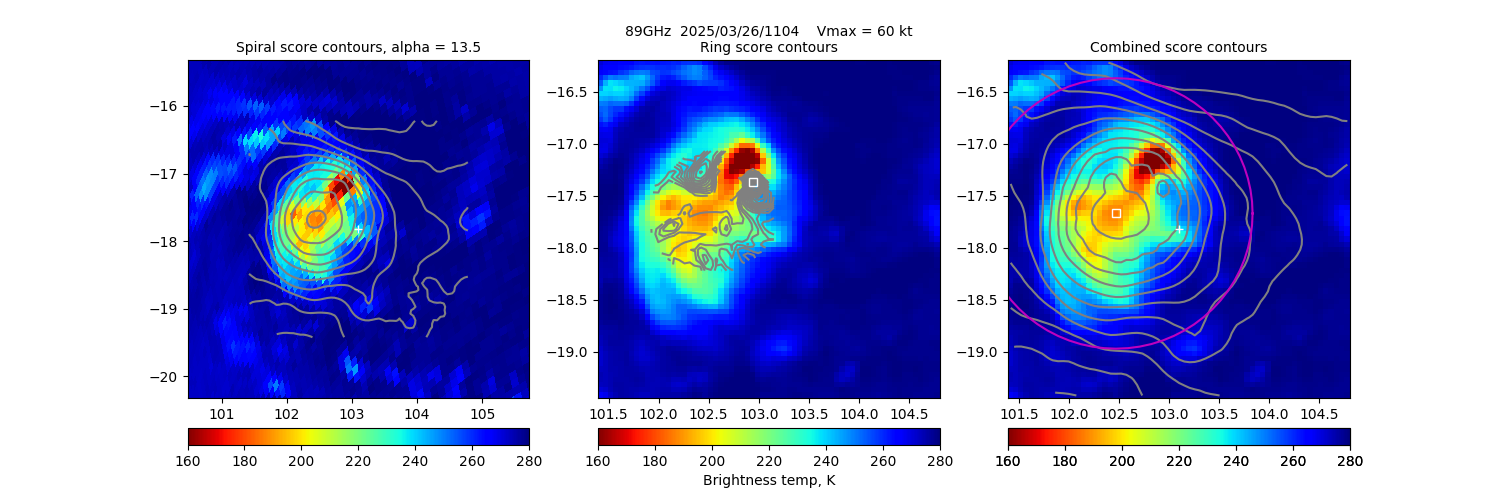
20250326 091137 SSMISF18 -17.7 103.2 23 78% 1.77 1.77 N/A 60.0 -17.9 103.4 Analysis Plot
20250326 110452 SSMISF17 -17.7 102.5 N/A N/A N/A N/A N/A 60.0 -17.8 103.1 Analysis Plot
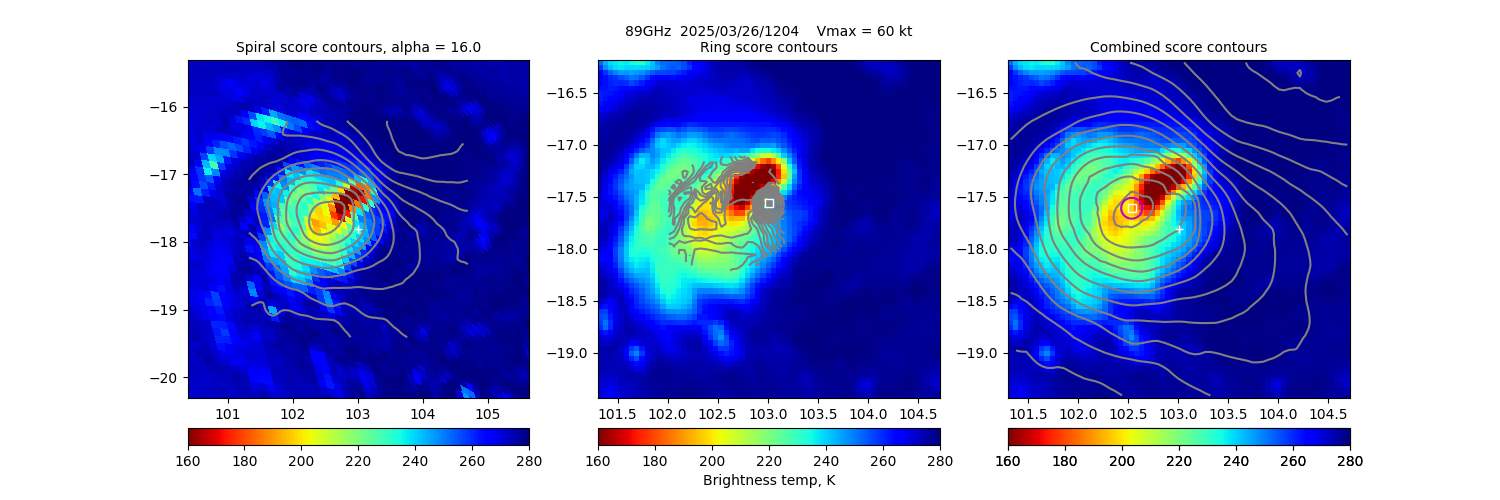
20250326 120436 SSMISF16 -17.6 102.5 N/A N/A N/A N/A N/A 60.0 -17.8 103.0 Analysis Plot
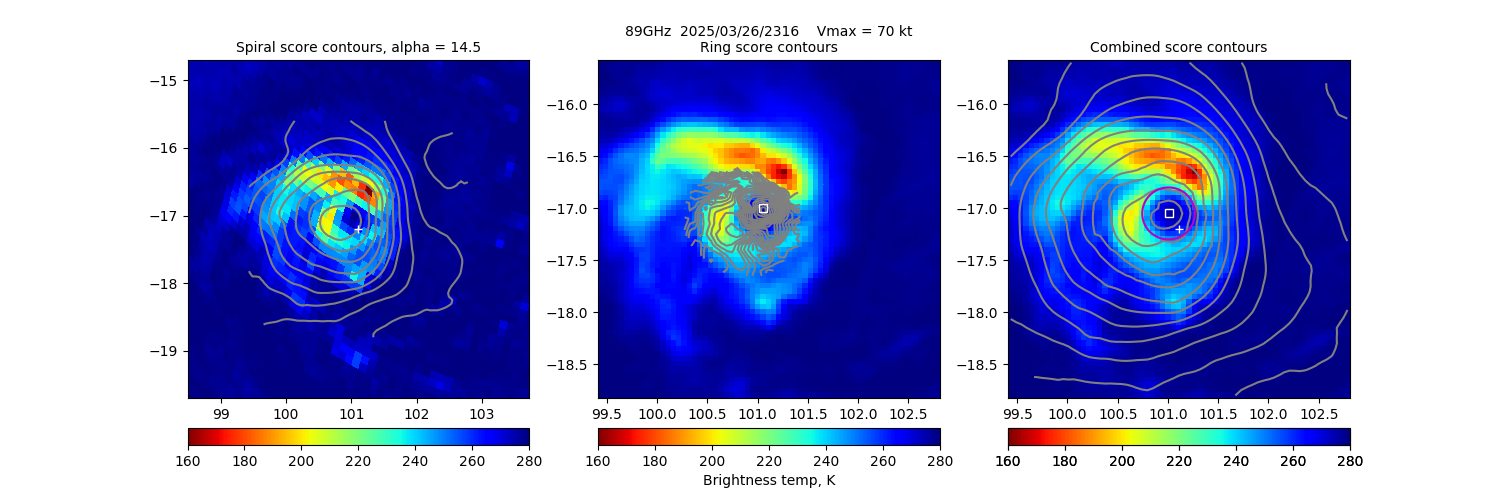
20250326 231650 SSMISF16 -17.0 101.0 46 100% 25.07 40.07 >65 kts 70.0 -17.2 101.1 Analysis Plot
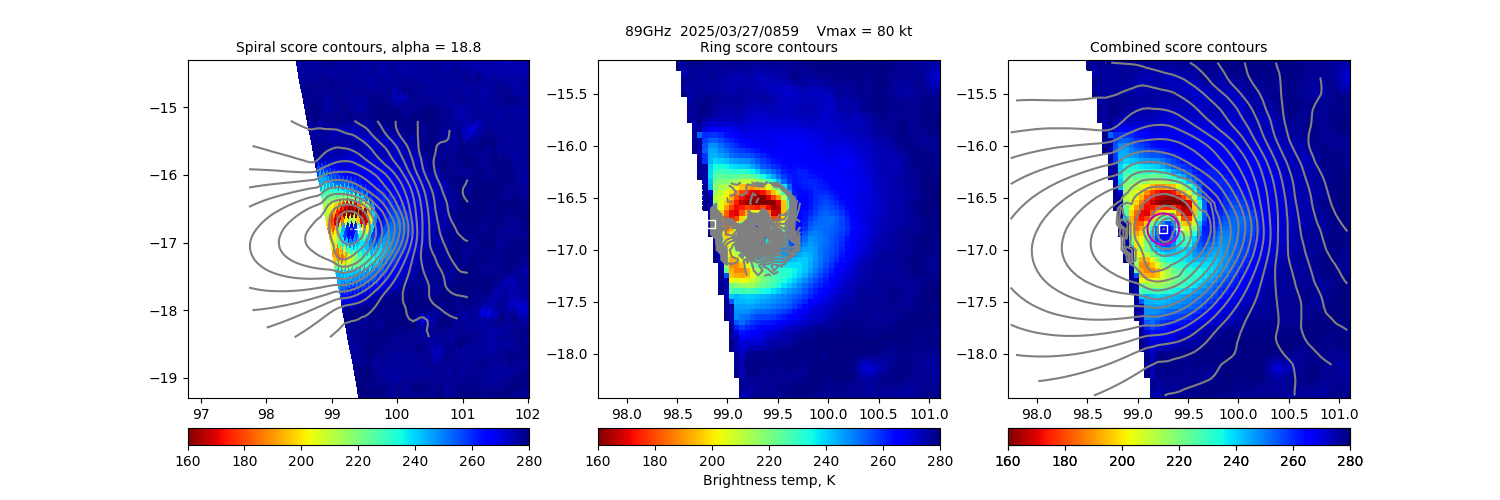
20250327 085926 SSMISF18 -16.8 99.3 23 100% 24.85 39.85 >65 kts 80.0 -16.8 99.4 Analysis Plot
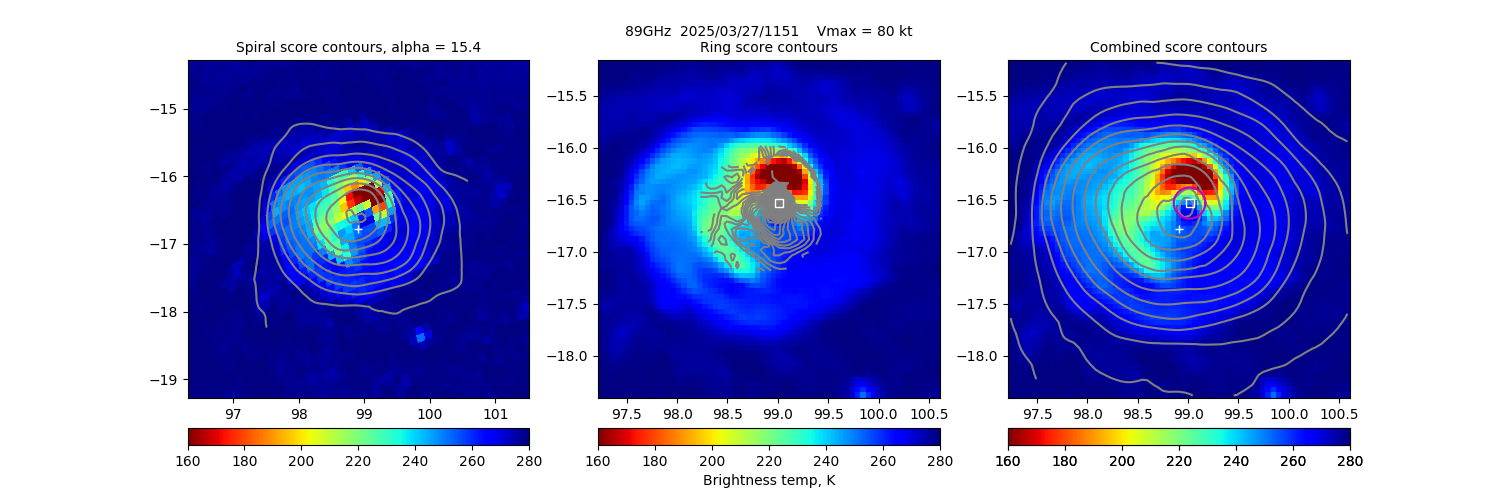
20250327 115107 SSMISF16 -16.5 99.0 23 60% 11.53 11.53 N/A 80.0 -16.8 98.9 Analysis Plot
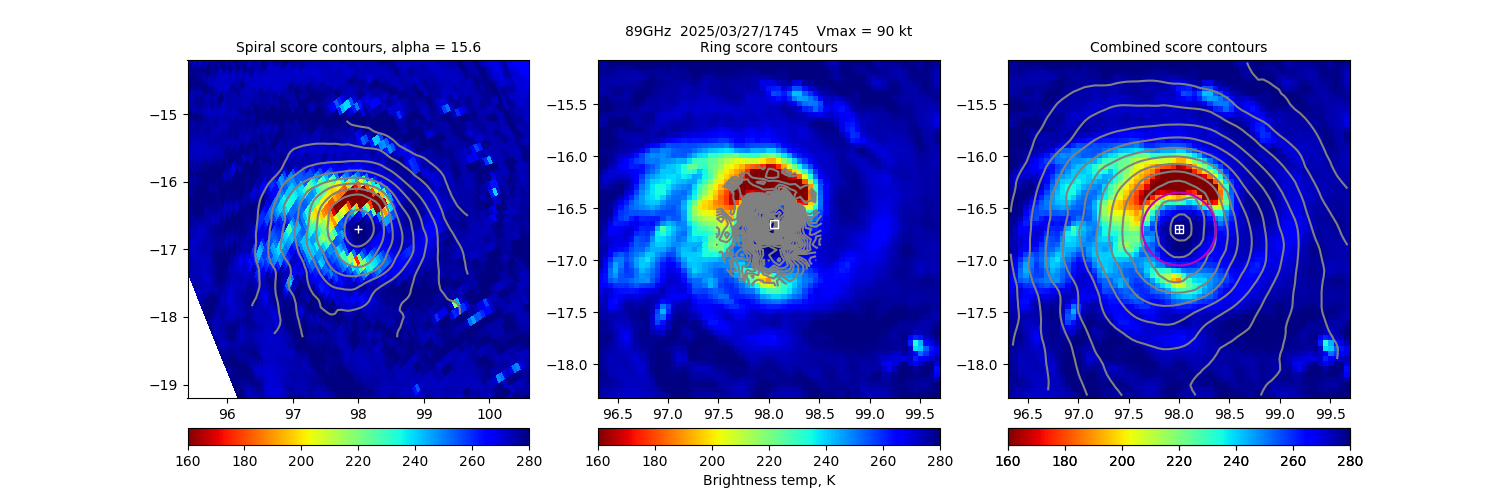
20250327 174516 GMI -16.7 98.0 68 40% 12.78 12.78 N/A 90.0 -16.7 98.0 Analysis Plot
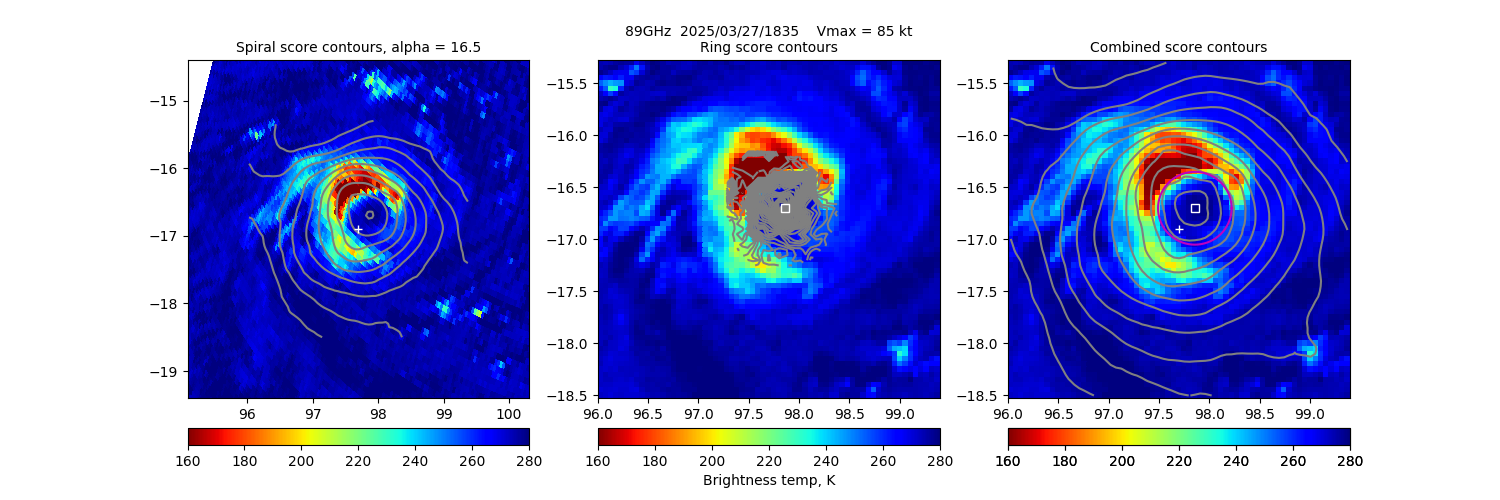
20250327 183511 AMSR2 -16.7 97.9 68 60% 17.47 17.47 N/A 85.0 -16.9 97.7 Analysis Plot
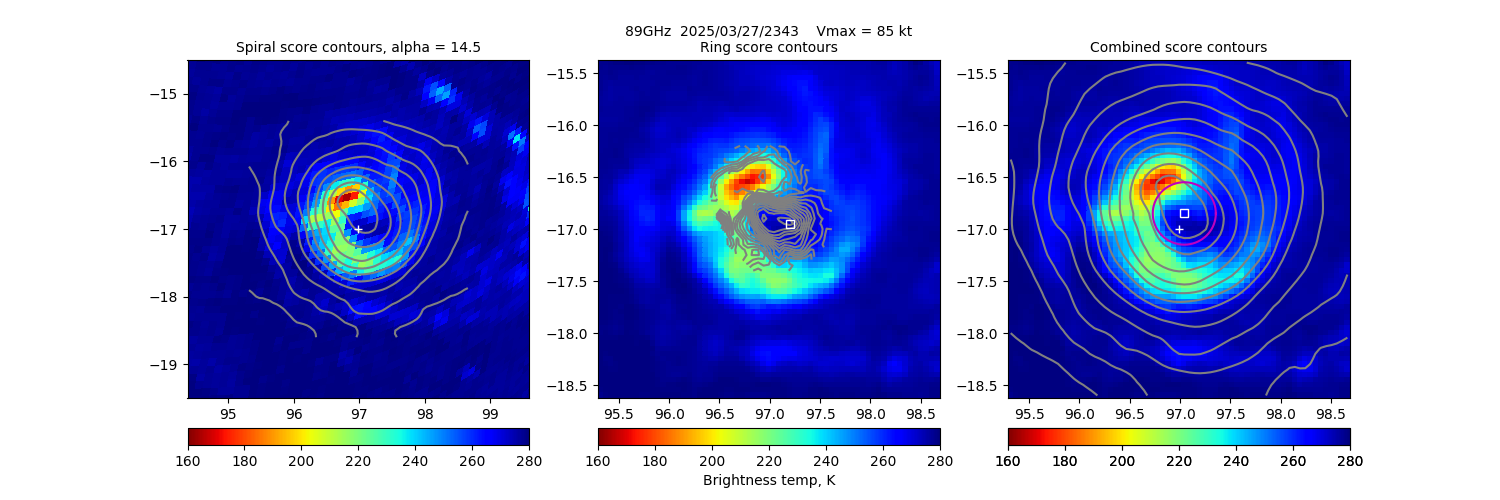
20250327 234343 SSMISF17 -16.9 97.0 57 38% 15.51 15.51 N/A 85.0 -17.0 97.0 Analysis Plot
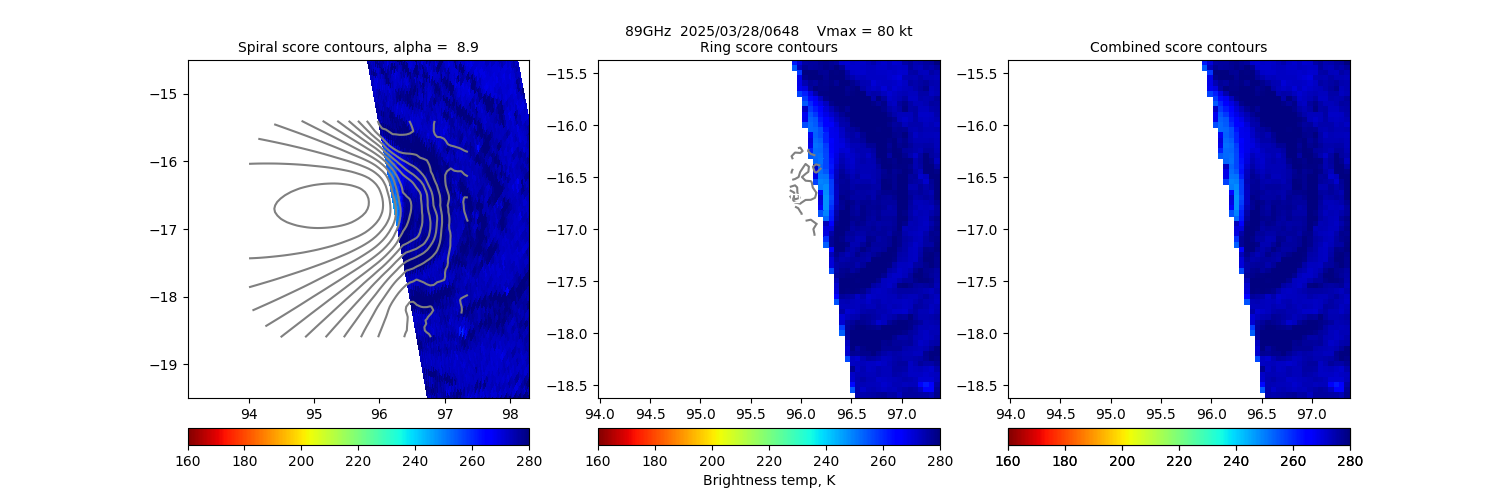
20250328 064847 AMSR2 -16.7 95.5 N/A N/A N/A N/A N/A 80.0 -17.0 95.7 Analysis Plot
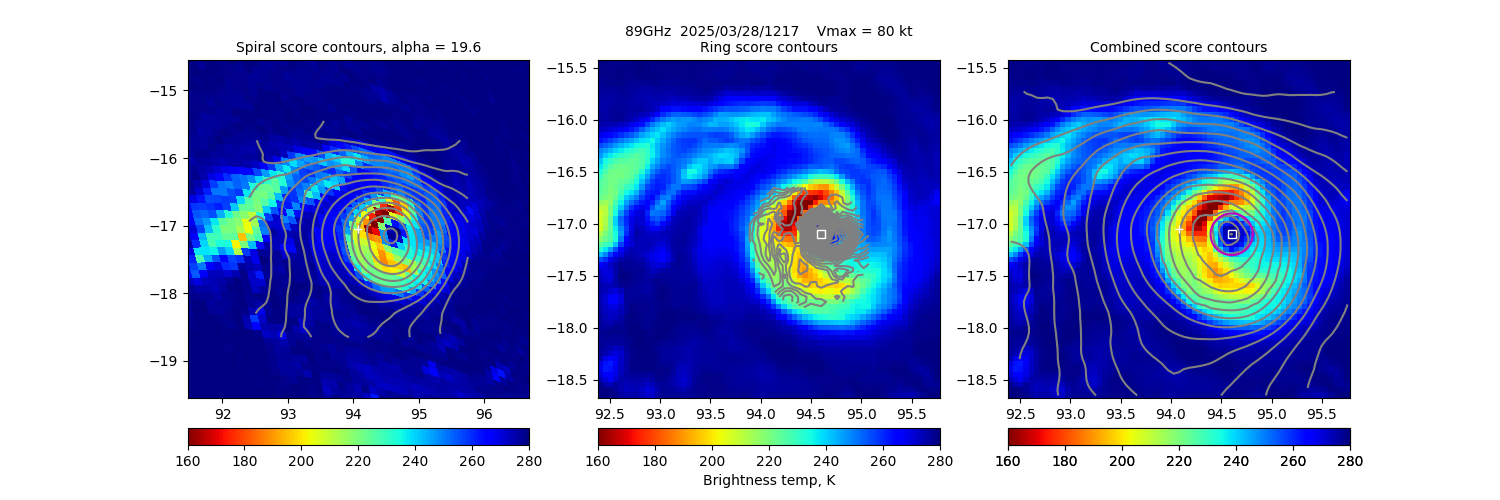
20250328 121749 SSMISF17 -17.1 94.6 34 100% 37.38 52.38 >65 kts 80.0 -17.0 94.1 Analysis Plot
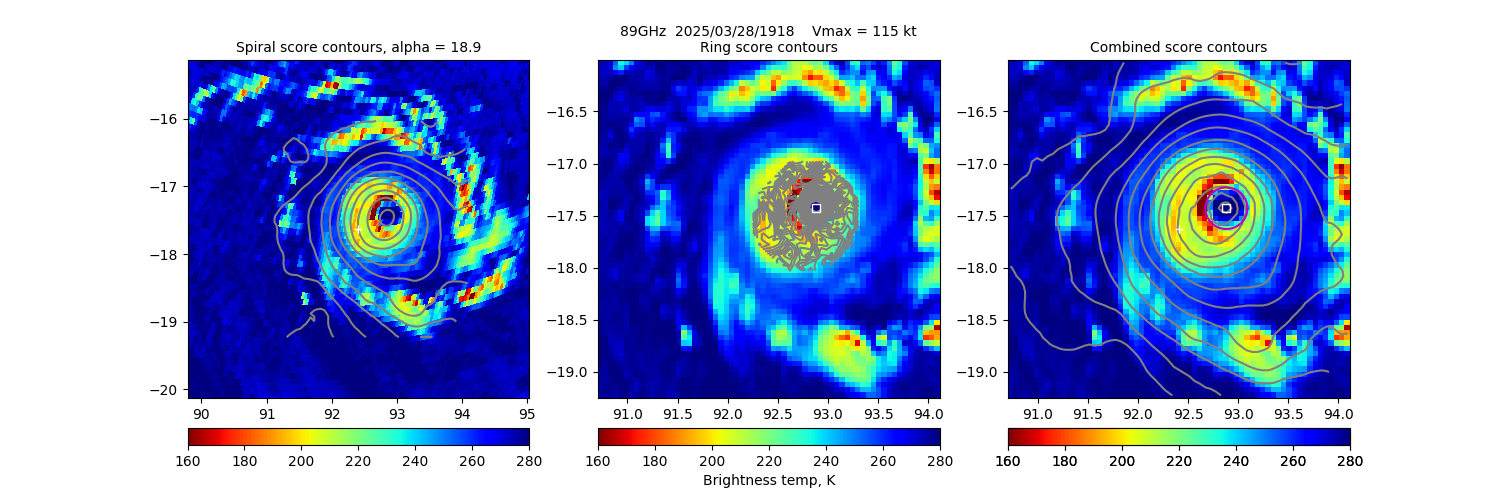
20250328 191803 AMSR2 -17.4 92.9 34 100% 50.06 65.06 >85 kts 115.0 -17.6 92.4 Analysis Plot
|
|
Legend - Overpass Date/Time are determined from satellite overpass of targeted TC (position determined from Best Track Lat/Lon position). Date is YYYYMMDD and time in HHMMSS (UTC). - Forecast (Best Track) and ARCHER positions (deg) of the TC center at overpass day/time. Positive/Negative: Latitude = North/South Hemisphere; Longitude = Eastern/Western Hemisphere. - BT Vmax is the concurrent ATCF Best Track (BT) wind speed intensity estimate (Vmax) value from either NOAA/National Hurricane Center (NHC) (North Atlantic and Northeast Pacific), NOAA/Central Pacific Hurricane Center (CPHC) (North-central Pacific) or Joint Typhoon Warning Center (JTWC) (Northwest Pacific, Indian Ocean, or Southwest Pacific). - Sat is the satellite descriptor providing the overpass. Currently the satellites used are the DMSP/SSMIS-16/17/18, GPM/GMI, and GCOM/AMSR2. - Ring Diam (km) indicates the estimated surface eyewall diameter if one is analyzed in the PMW imagery. The value listed is the average PMW-estimated inner eyewall edge diameter minus 10 km for eyewall slope. N/A indicates no appreciable eyewall is analyzed. - Ring Pct is the percentage of the analyzed "ring" (eyewall inner boundary) that is 1) colder than the eye Tb (the "hot spot" -- warmest eye pixel) by at least 20K, or 2) that is colder than 232K and colder than the eye Tb by 10K, whichever is greater. Values are red if Ring % ≤65,yellow/brown if Ring % ≤85 and green if Ring % >85. N/A indicates no appreciable eyewall is analyzed. A value over 85% is used in the intensity score by adding 15 points to it. - TbDiff is the difference between the warmest eye pixel and the warmest pixel on the eyewall. This value is used in the Intensity Score. N/A indicates no appreciable eyewall is analyzed. - Eye Score values are based on the strength and organization of the convective/eyewall signatures in the PMW imagery, and based on the ARCHER center location. They normally range from 0 to 100 with empirically-determined thresholds related to intensity (Vmax) in the "Meaning" column (≥20 suggests ≥65kts; ≥60 suggests ≥85kts). Scores are listed as negative, and not used by the ADT, when the NHC, CPHC, or JTWC Best Track Vmax is <55 kts in order to filter out occasional "false eye" cases. A value of -920 is used when the warmest eye pixel is <200K to prevent false positives; -930 means edge of overpass and <85% of eyewall is captured and therefore can't fully be analyzed. |