Tropical Depression 30Y_12
|
Passive Microwave (PMW) Intensity Information Hurricane Intensity Estimation (HIE) Algorithm Version 9.0 |
Overpass Inten Ring Ring Wind Forecast Final Target
Date Time Score Meaning Pct Diam BTdiff Est Sat Lat Lon Lat Lon Lat Lon
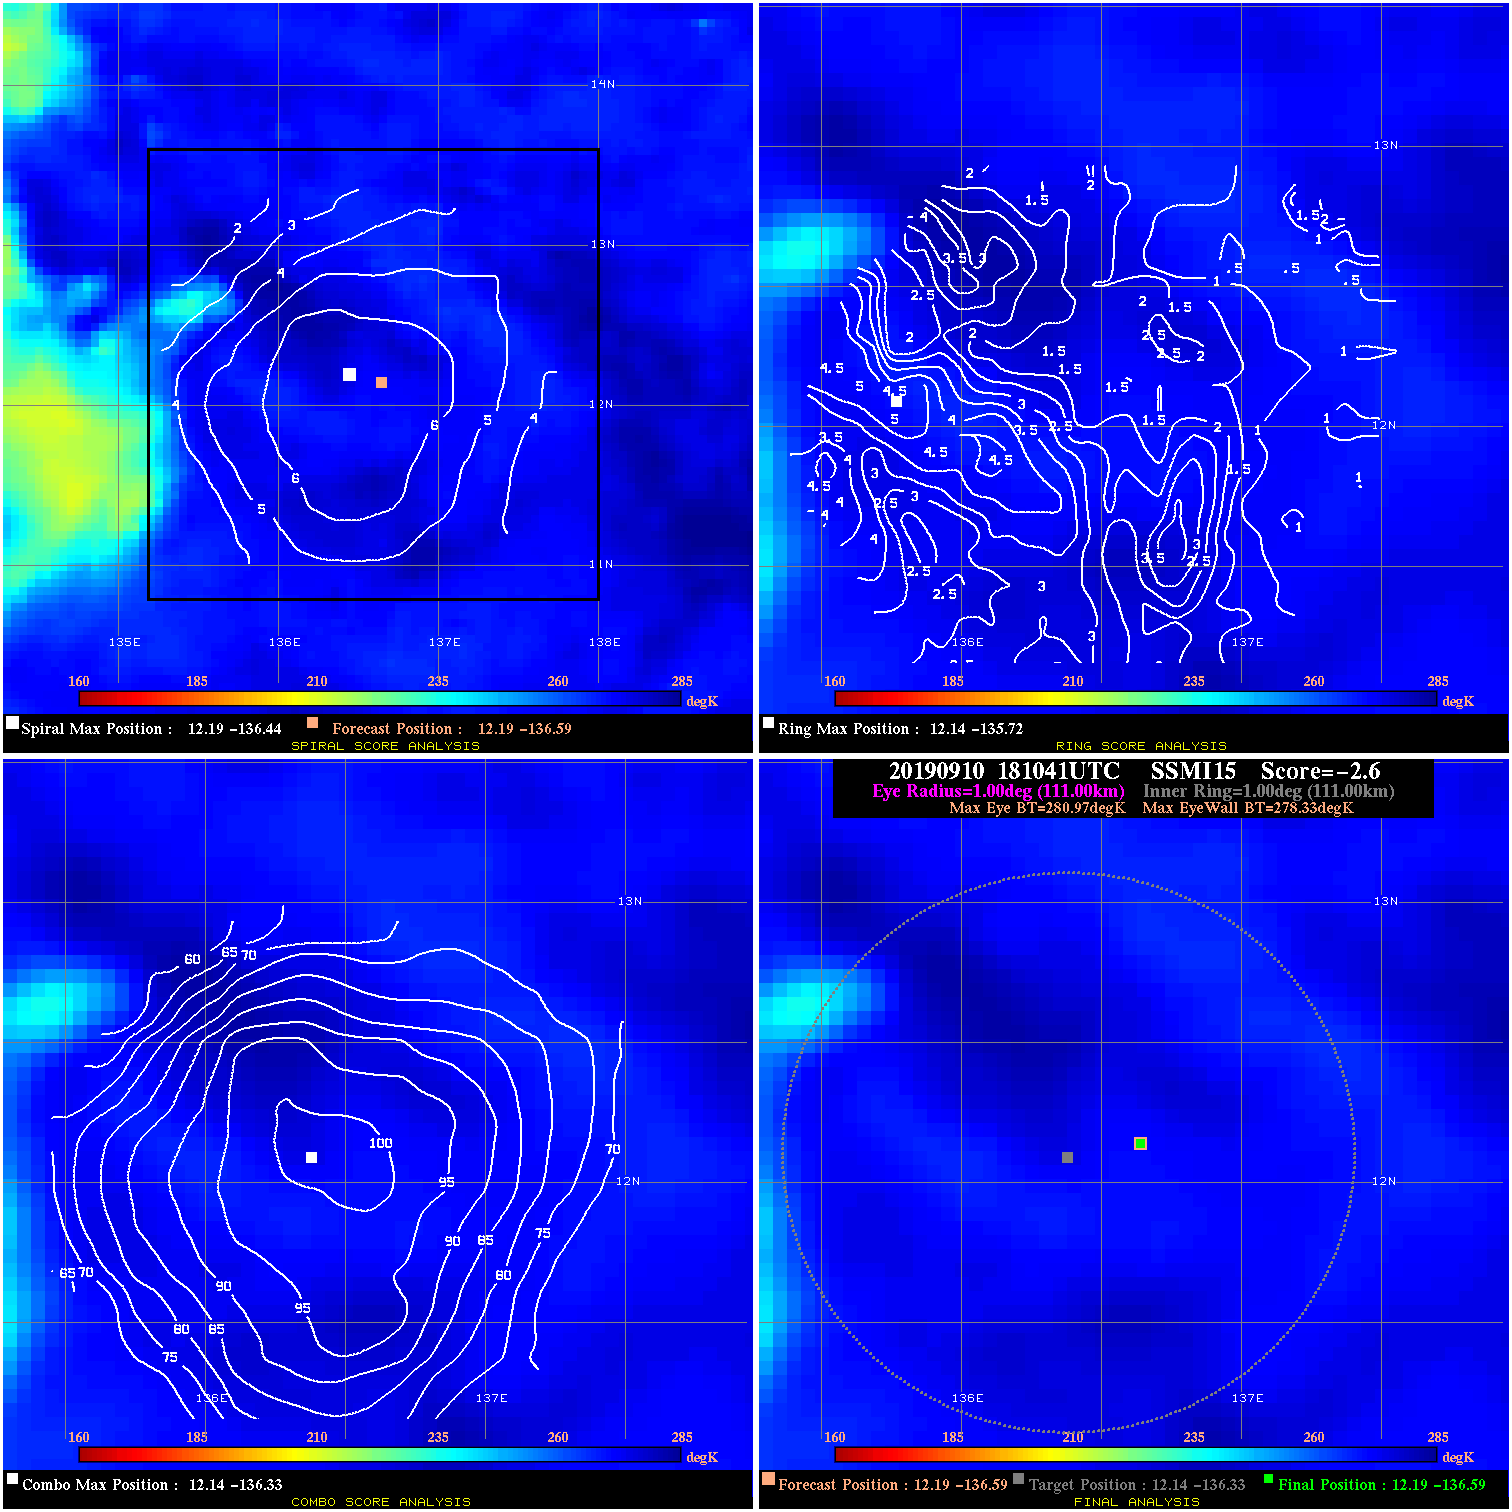
20190910 181041 -2.6 N/A N/A 222.20 2.64 30.0 SSMI15 12.2 -136.6 12.2 -136.6 12.1 -136.3 Analysis Plot
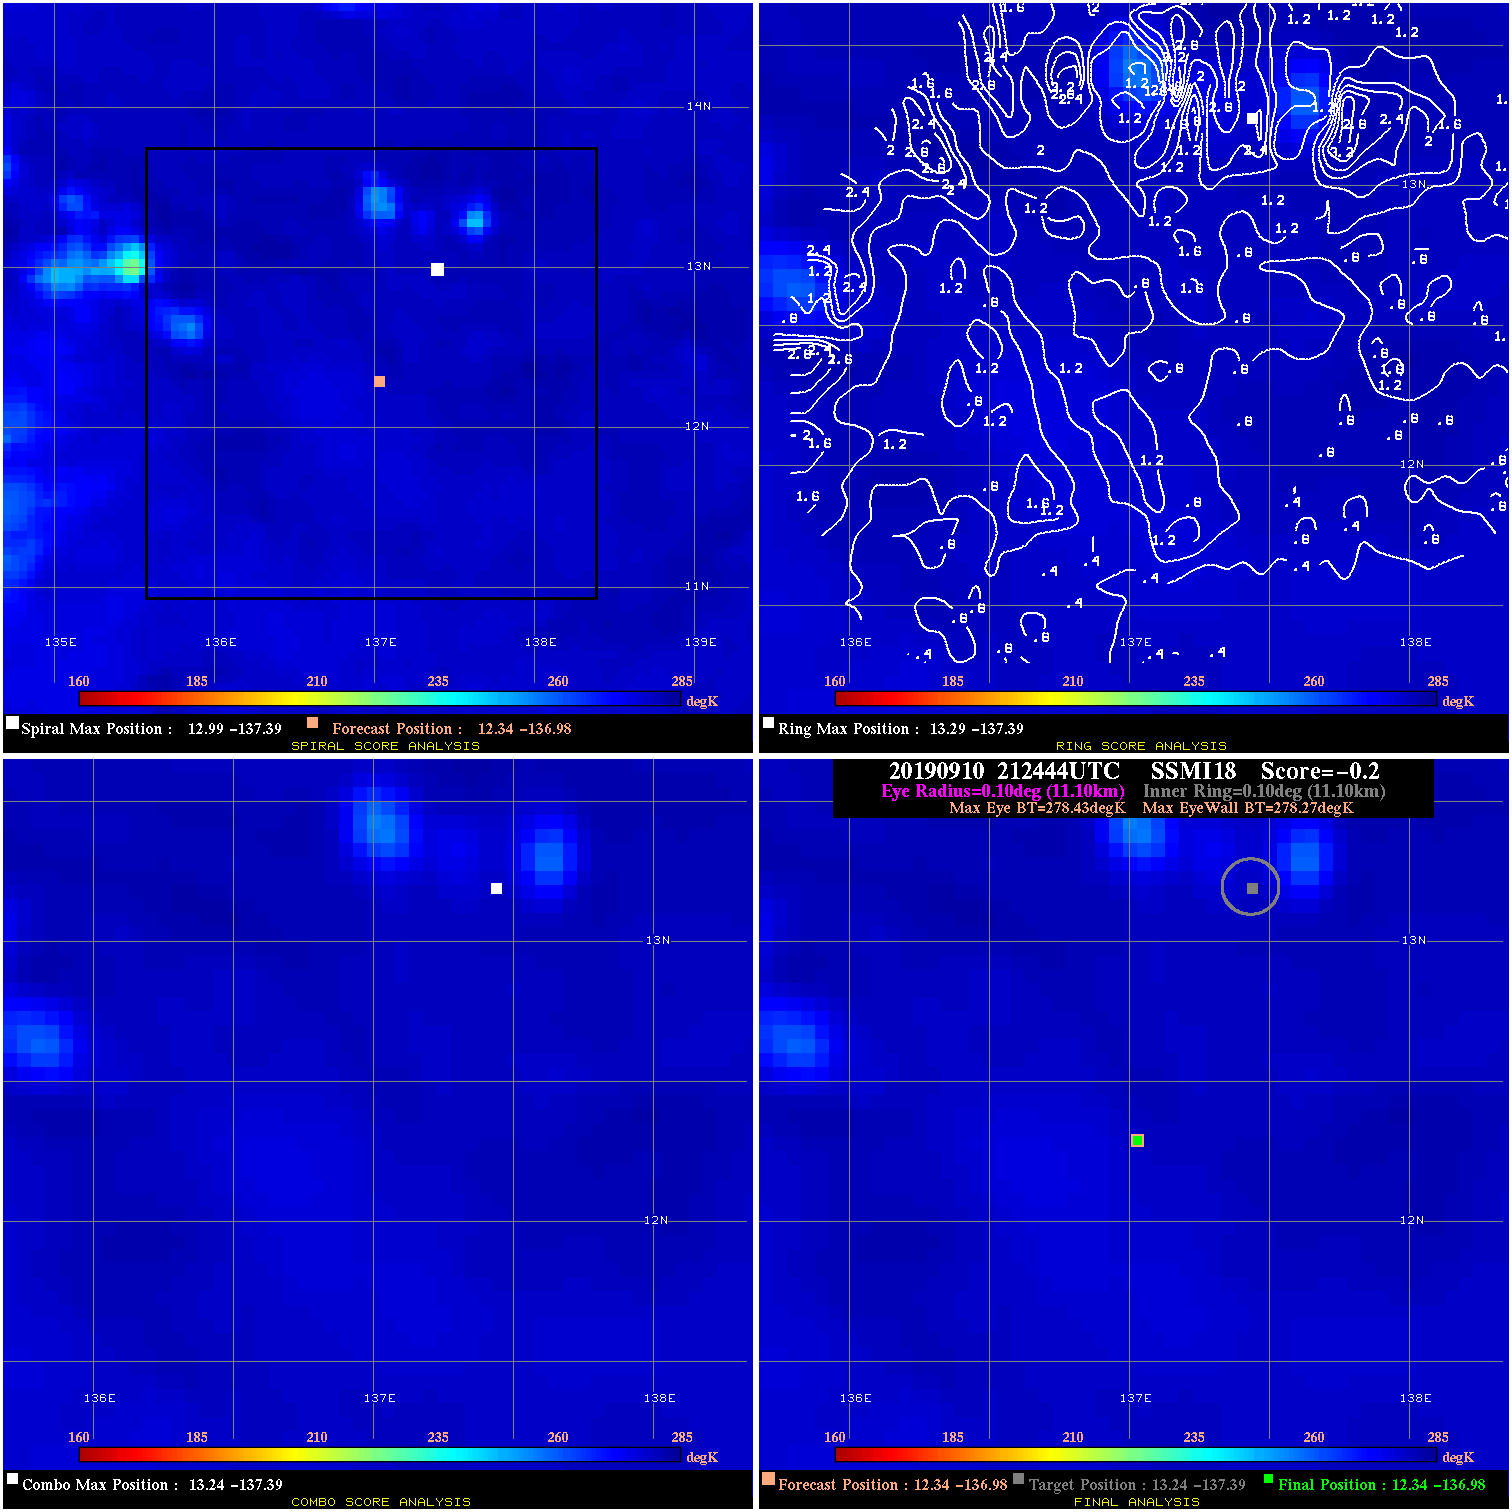
20190910 212444 -0.2 N/A N/A 22.22 .16 30.0 SSMI18 12.3 -137.0 12.3 -137.0 13.2 -137.4 Analysis Plot
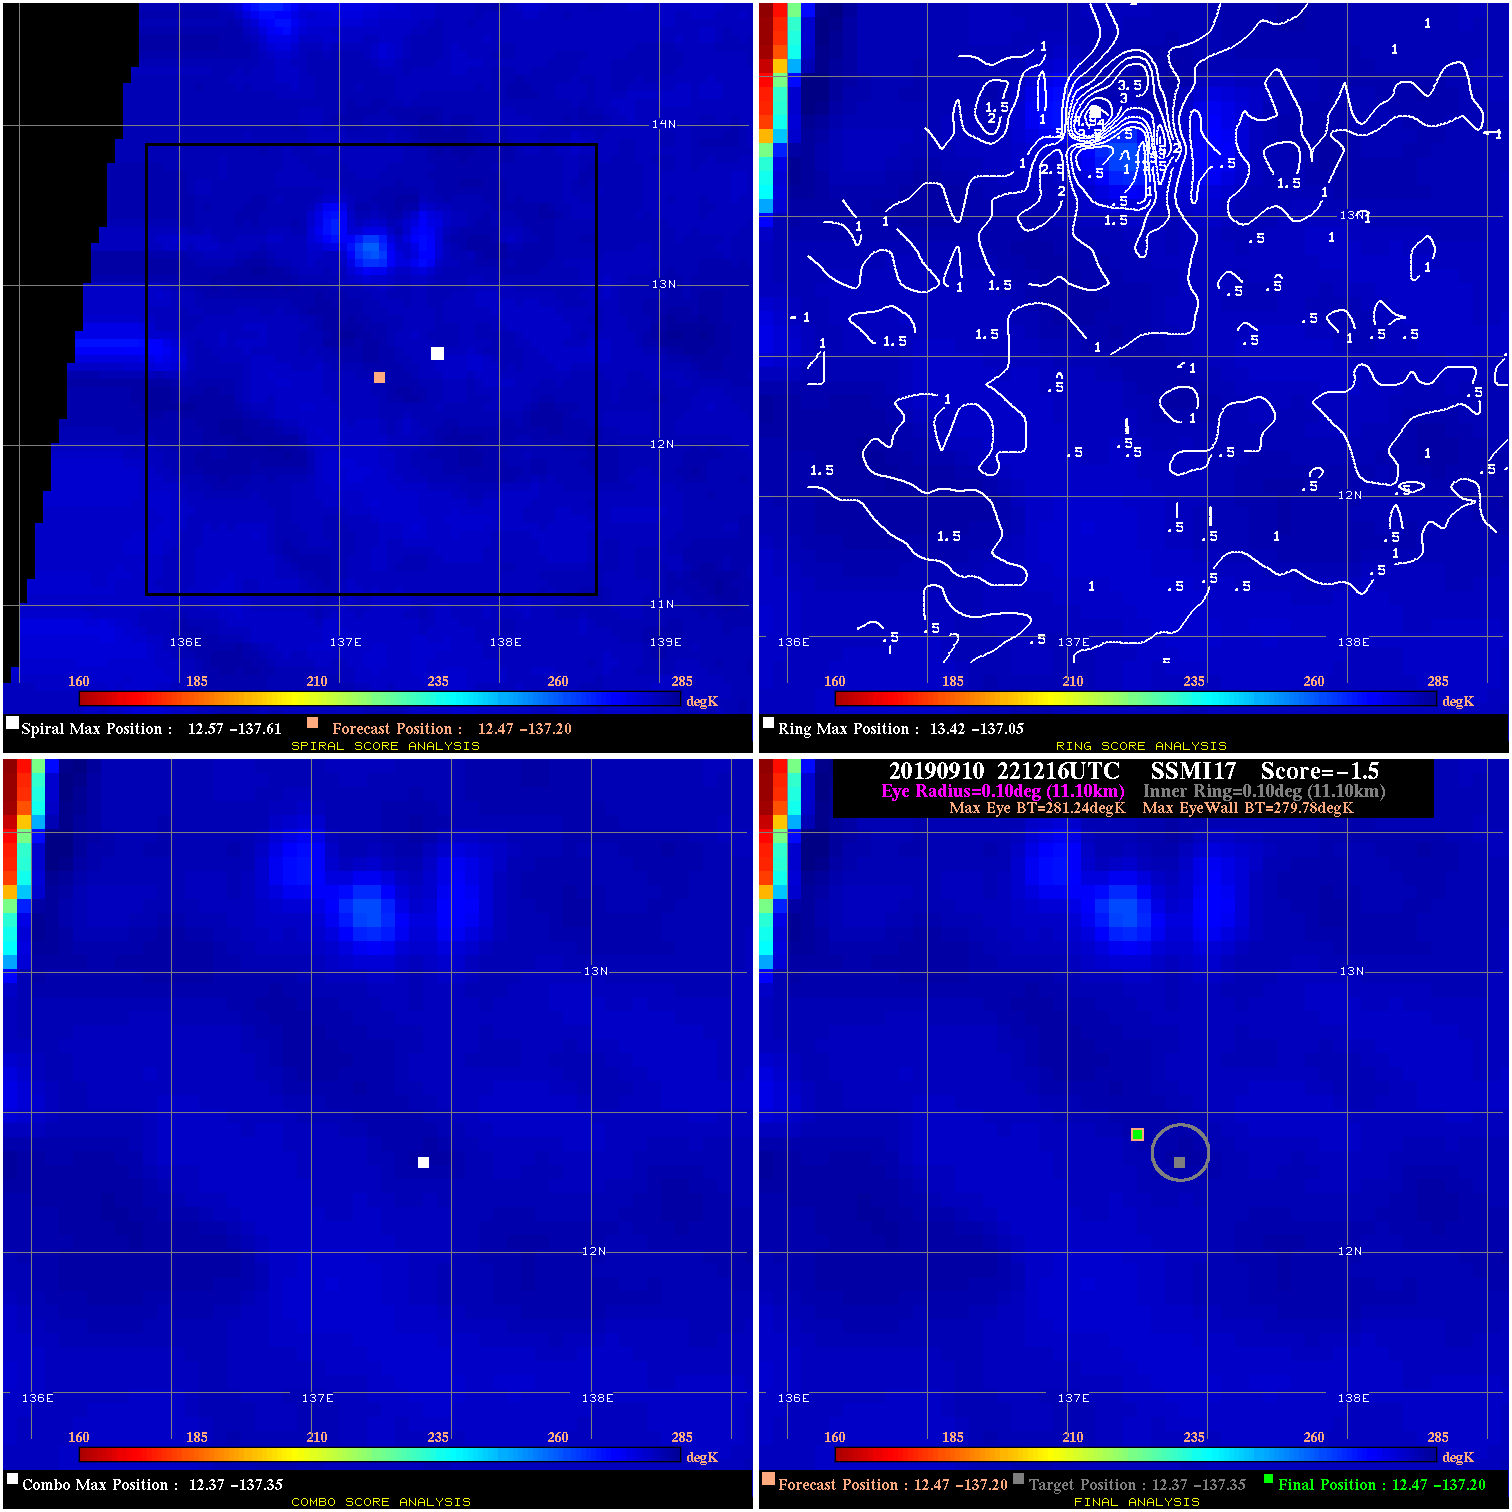
20190910 221216 -1.5 N/A N/A 22.22 1.46 30.0 SSMI17 12.5 -137.2 12.5 -137.2 12.4 -137.4 Analysis Plot
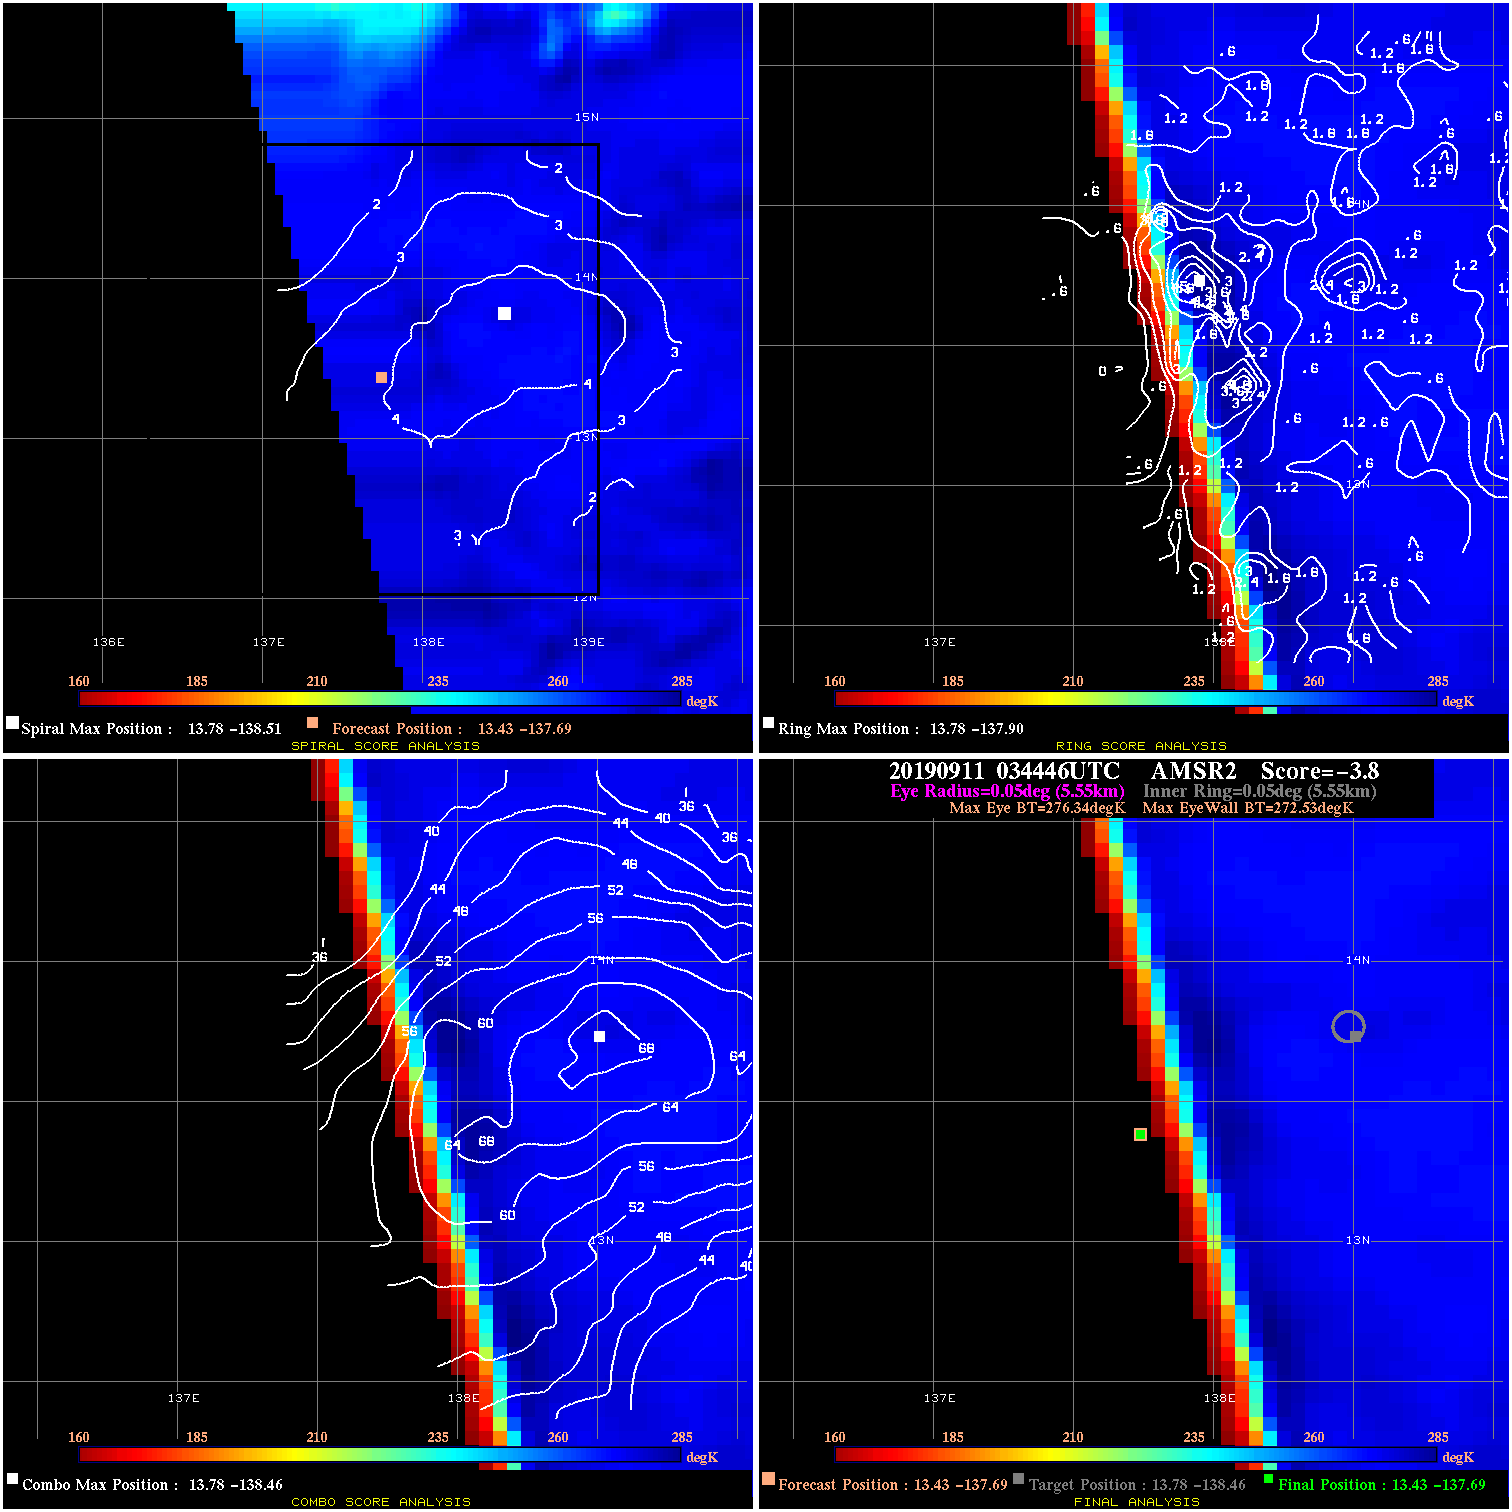
20190911 034446 -3.8 N/A N/A 11.11 3.81 30.0 AMSR2 13.4 -137.7 13.4 -137.7 13.8 -138.5 Analysis Plot
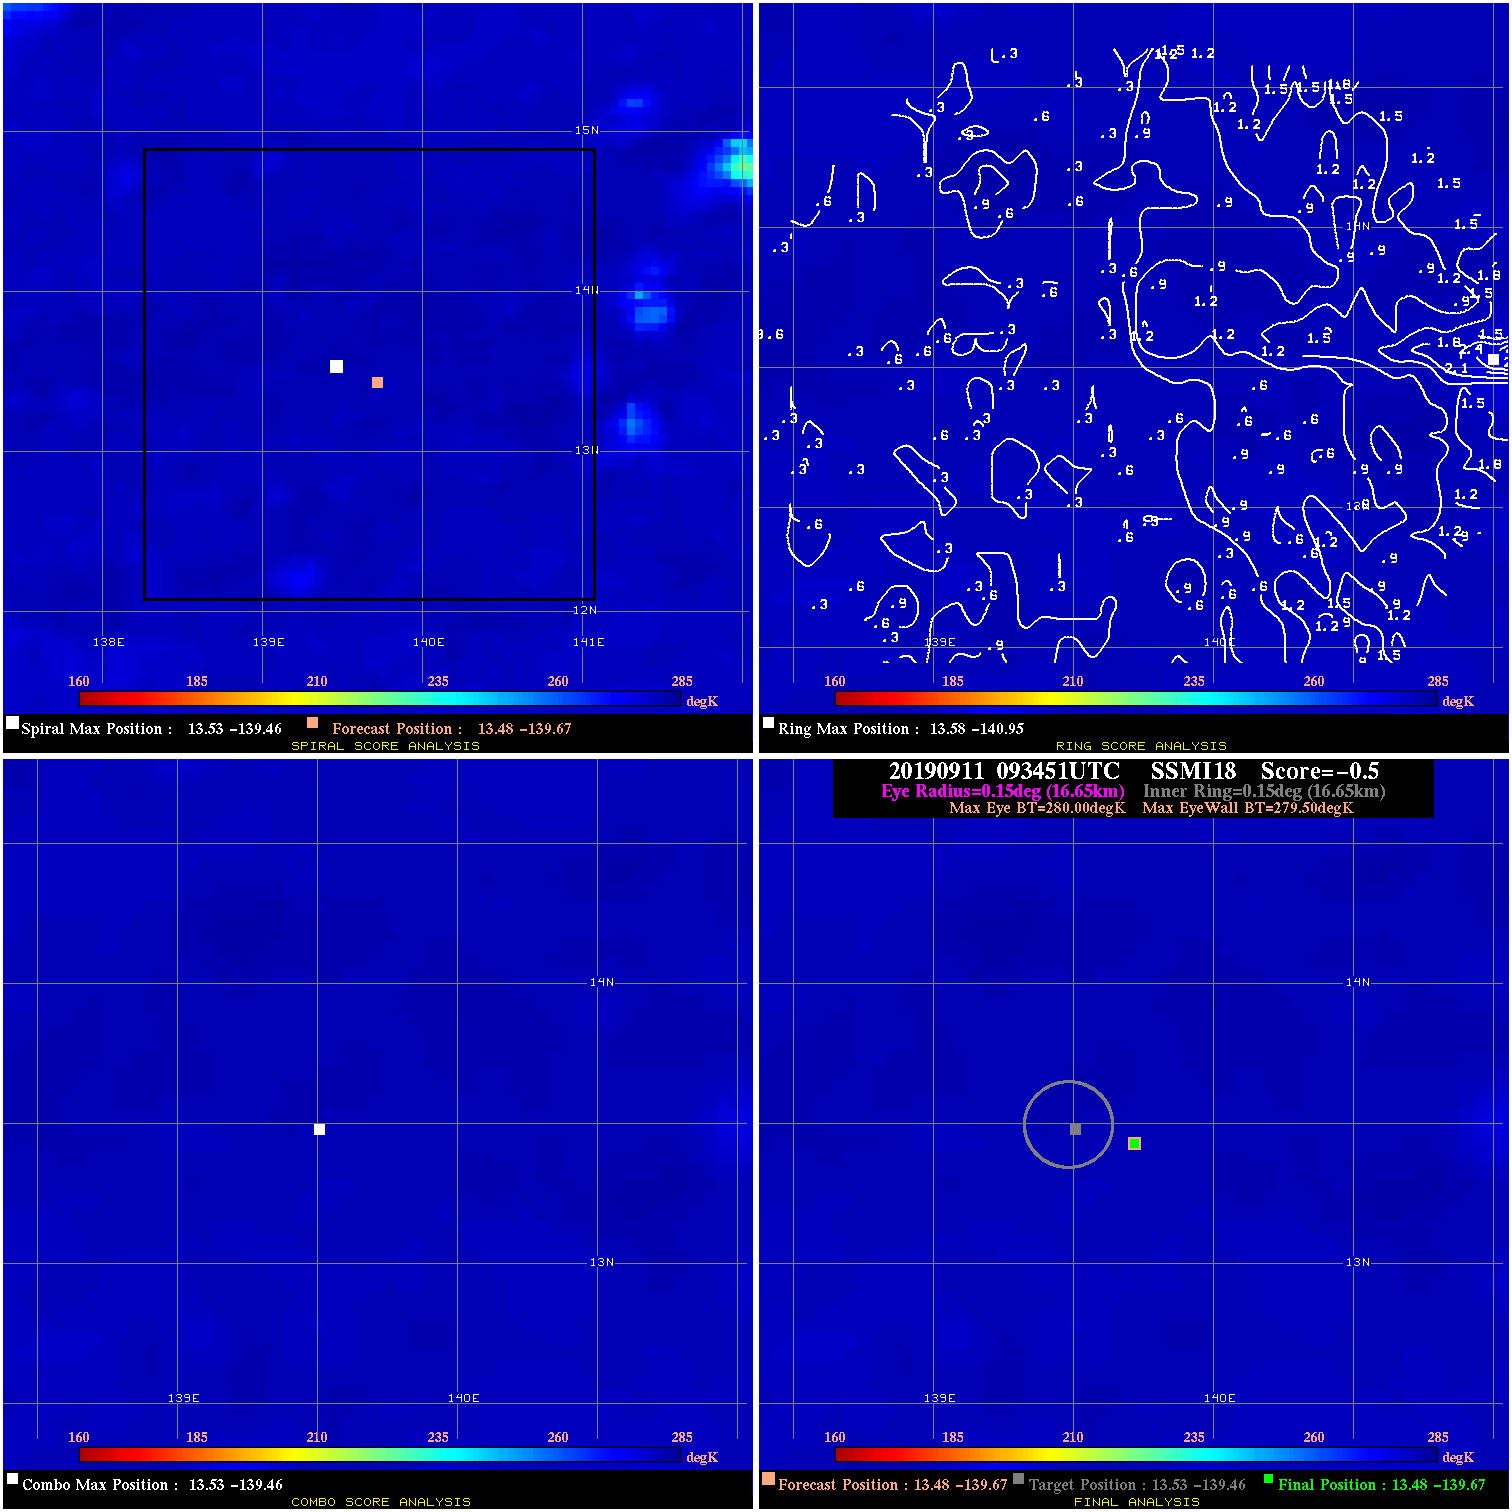
20190911 093451 -0.5 N/A N/A 33.33 .50 30.0 SSMI18 13.5 -139.7 13.5 -139.7 13.5 -139.5 Analysis Plot
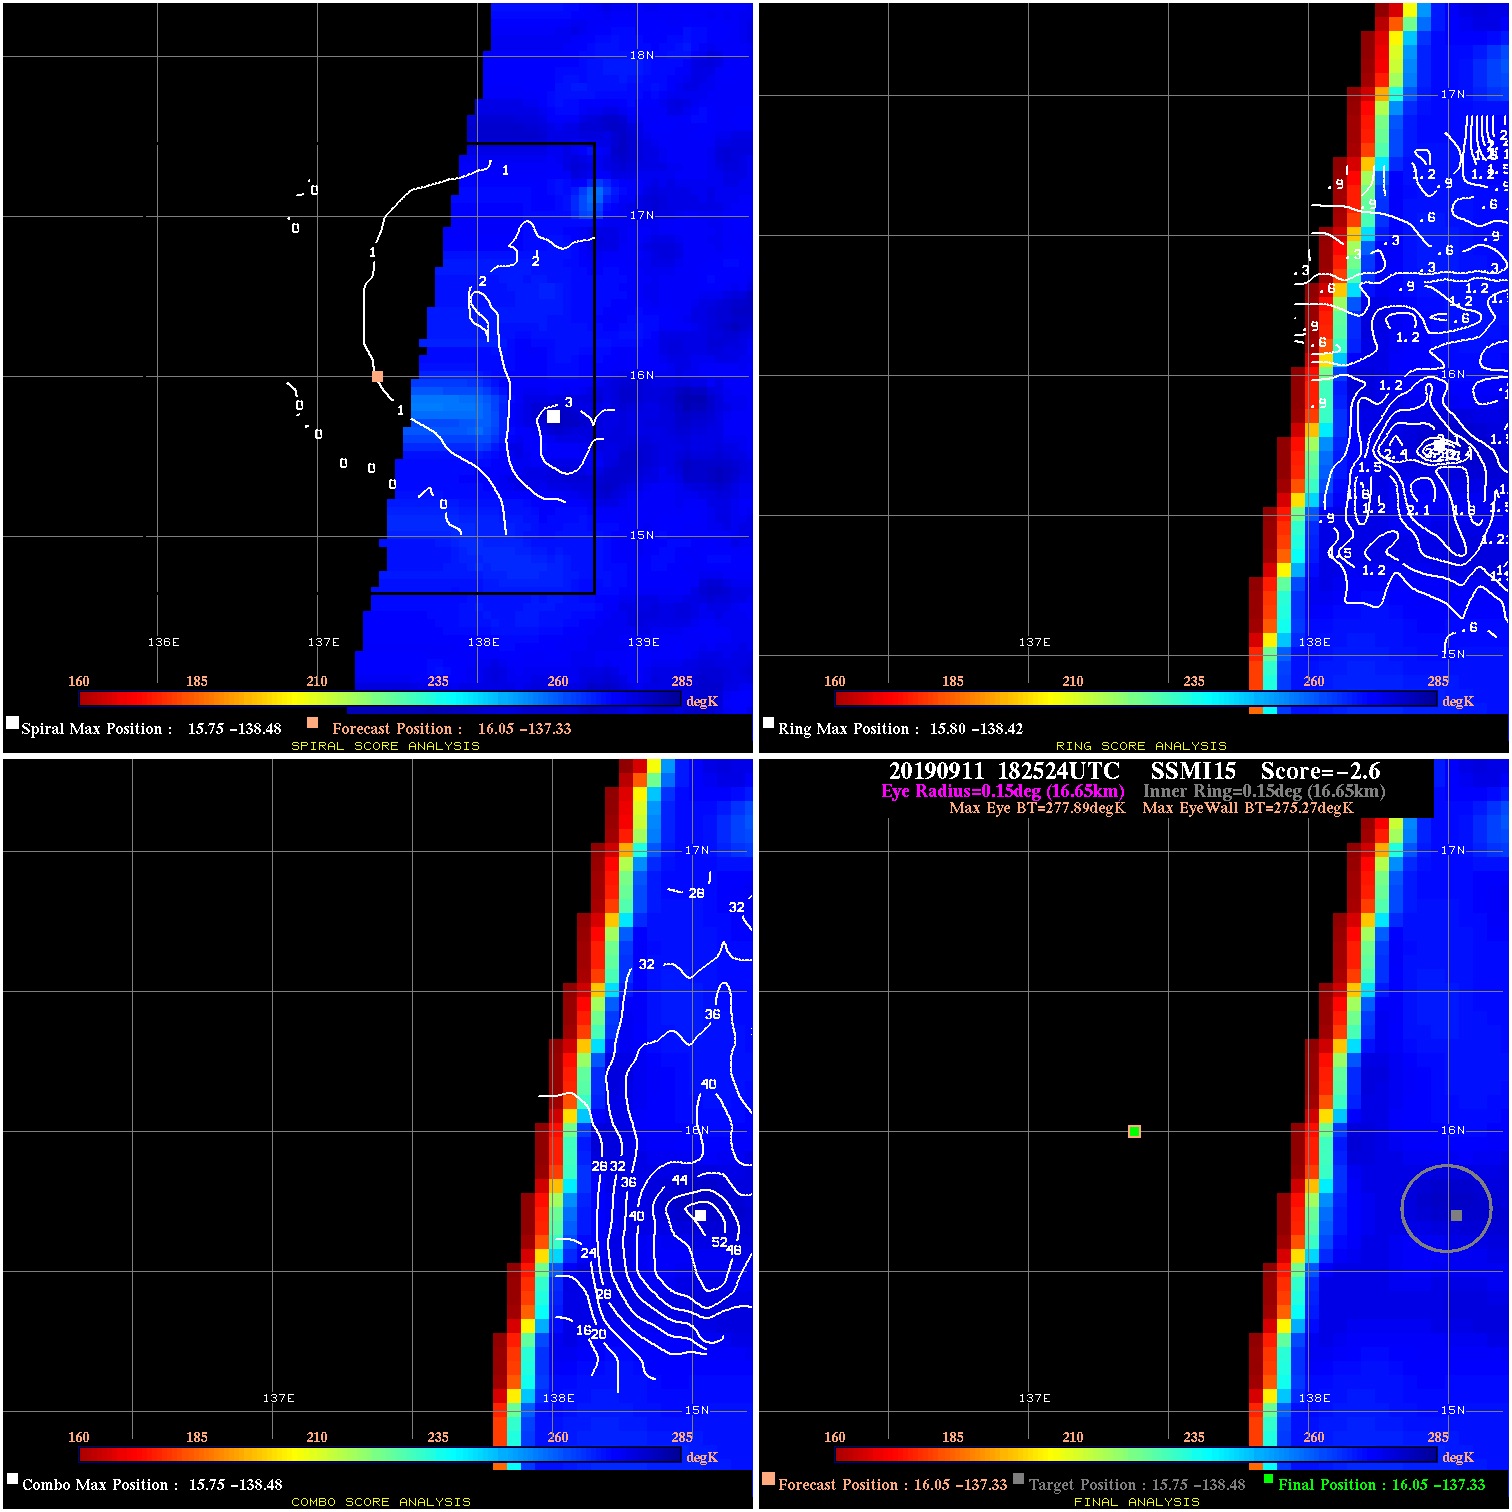
20190911 182524 -2.6 N/A N/A 33.33 2.62 30.0 SSMI15 16.0 -137.3 16.0 -137.3 15.8 -138.5 Analysis Plot
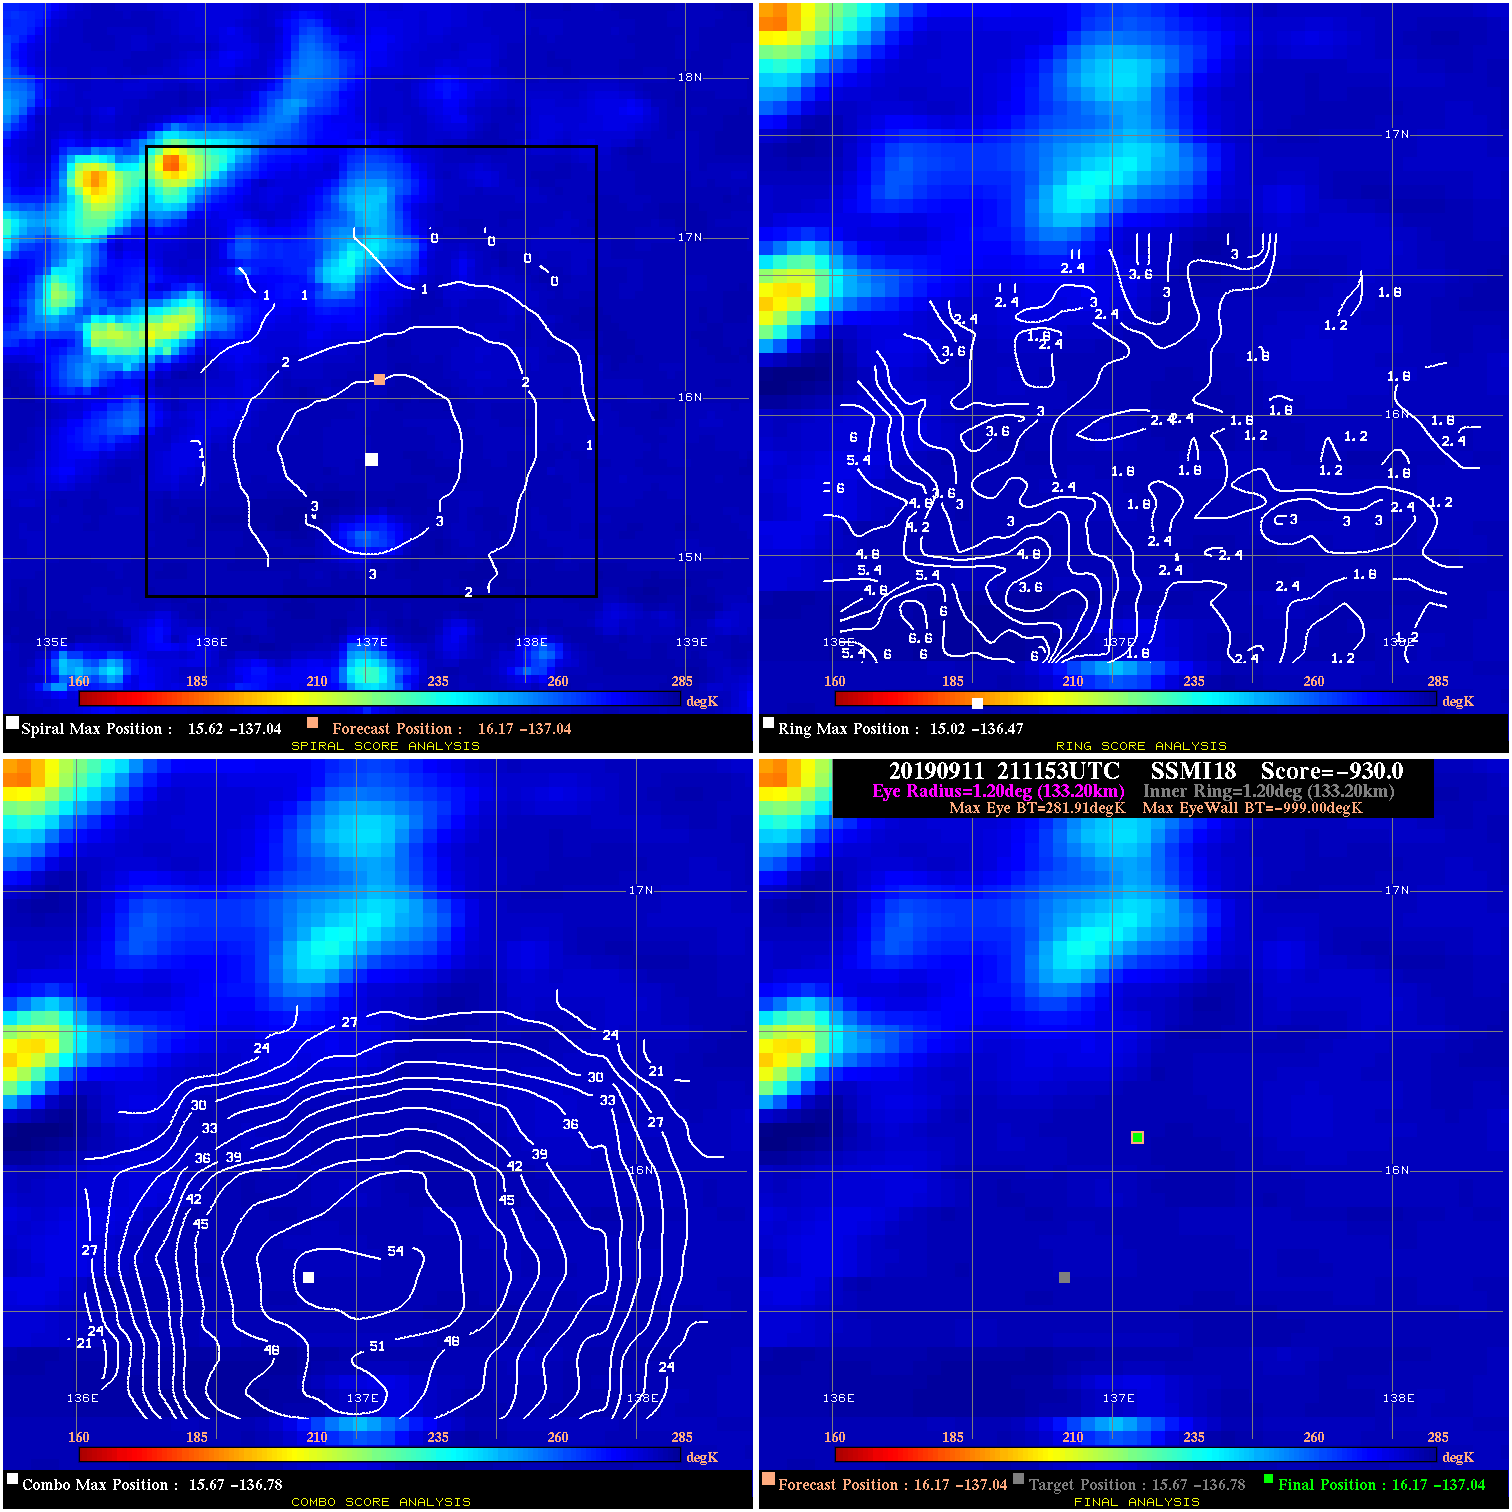
20190911 211153 -930.0 N/A N/A N/A 0.00 30.0 SSMI18 16.2 -137.0 16.2 -137.0 15.7 -136.8 Analysis Plot
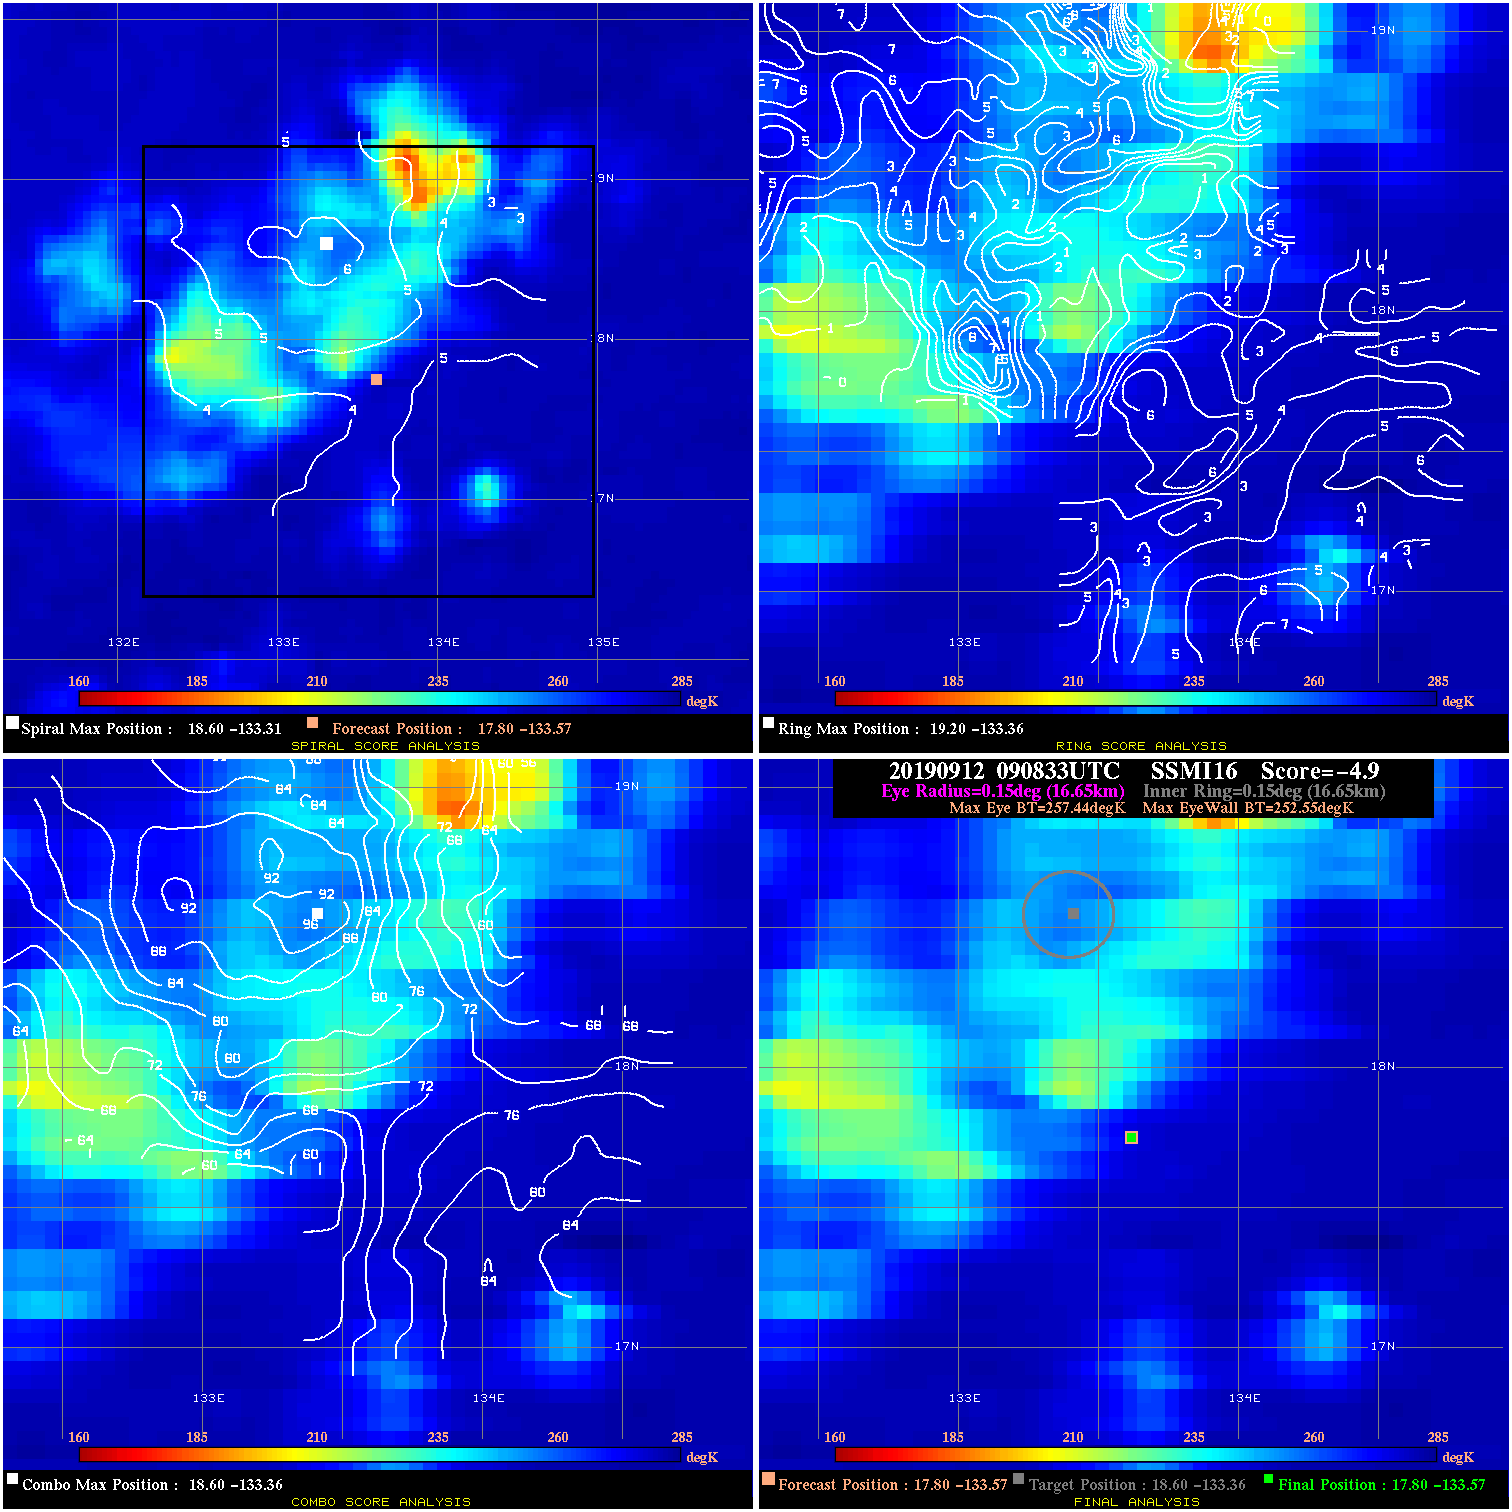
20190912 090833 -4.9 N/A N/A 33.33 4.89 30.0 SSMI16 17.8 -133.6 17.8 -133.6 18.6 -133.4 Analysis Plot
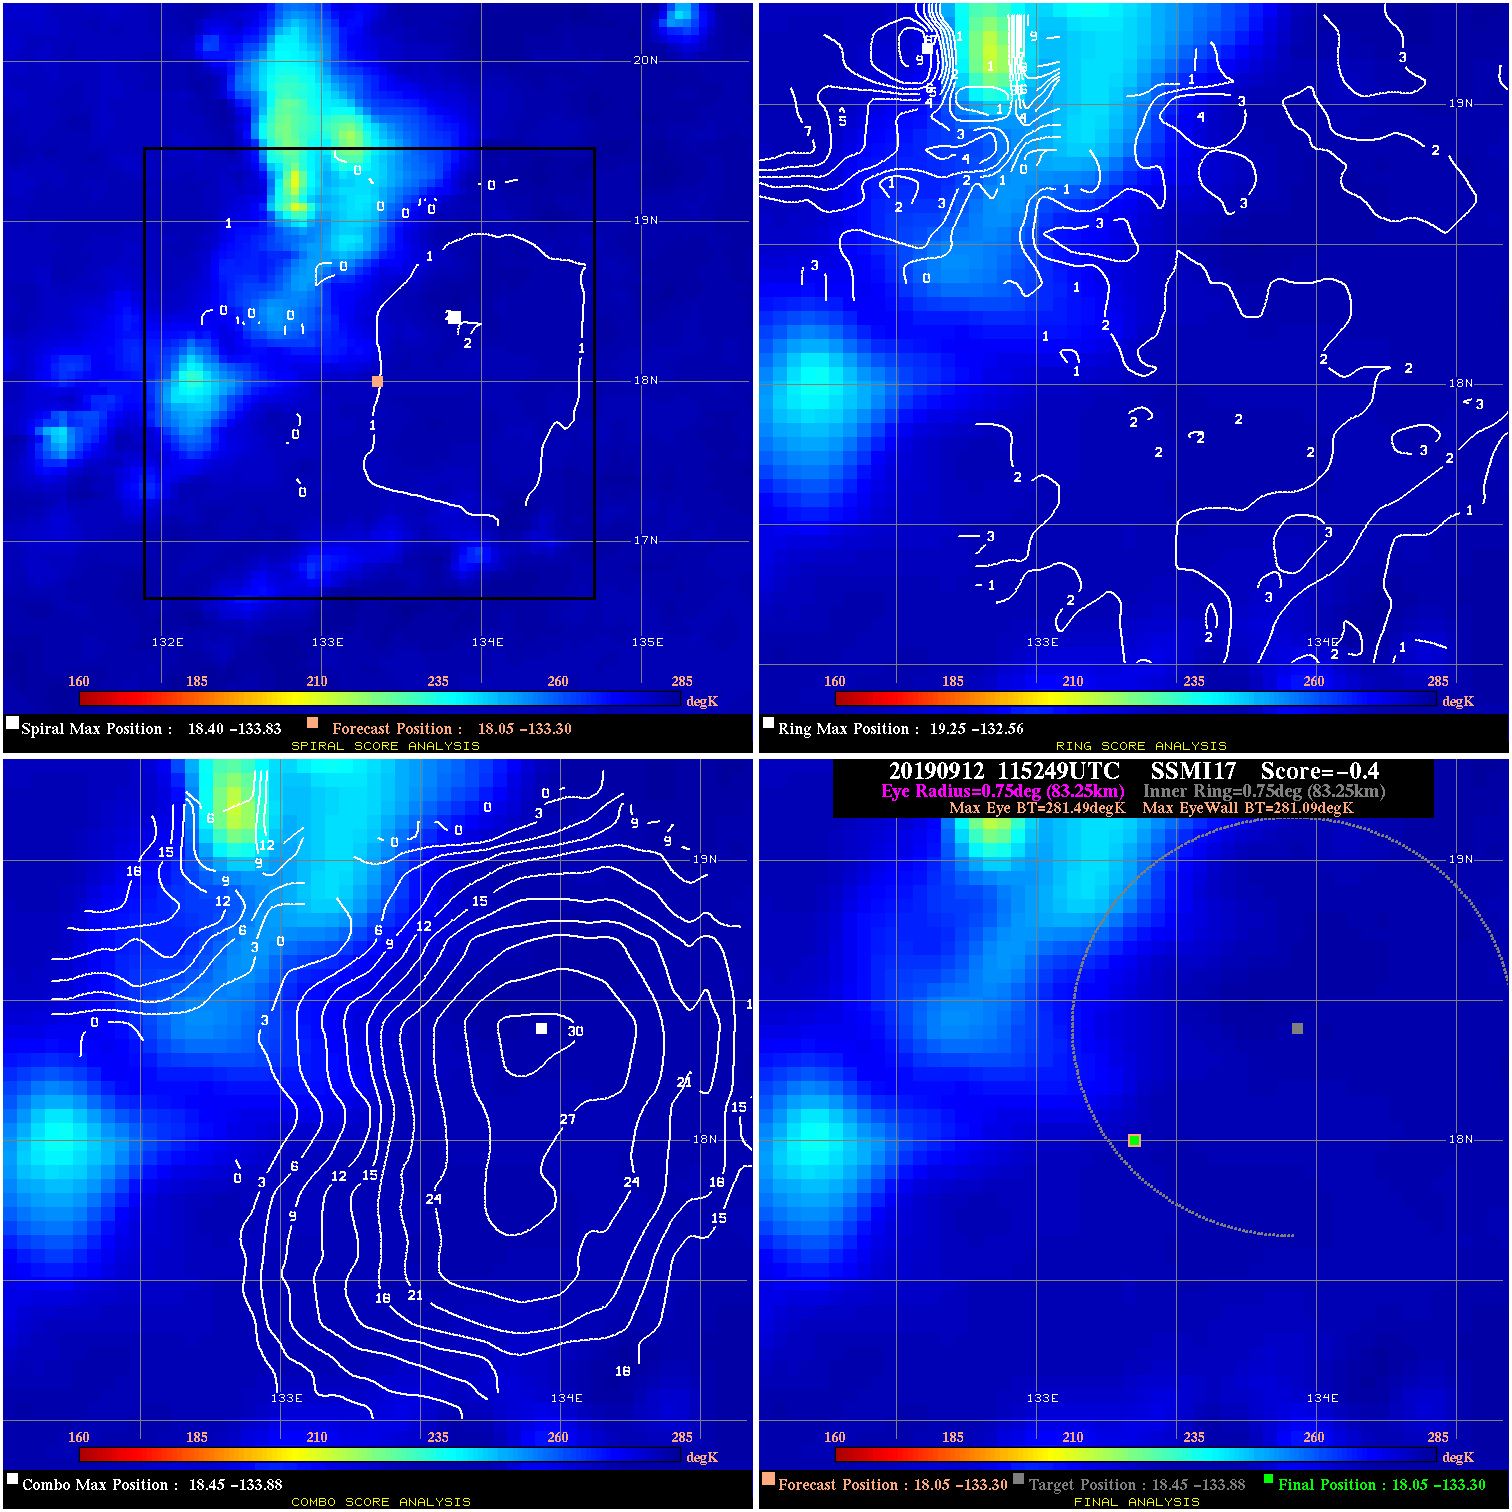
20190912 115249 -0.4 N/A N/A 166.65 .40 30.0 SSMI17 18.0 -133.3 18.0 -133.3 18.5 -133.9 Analysis Plot
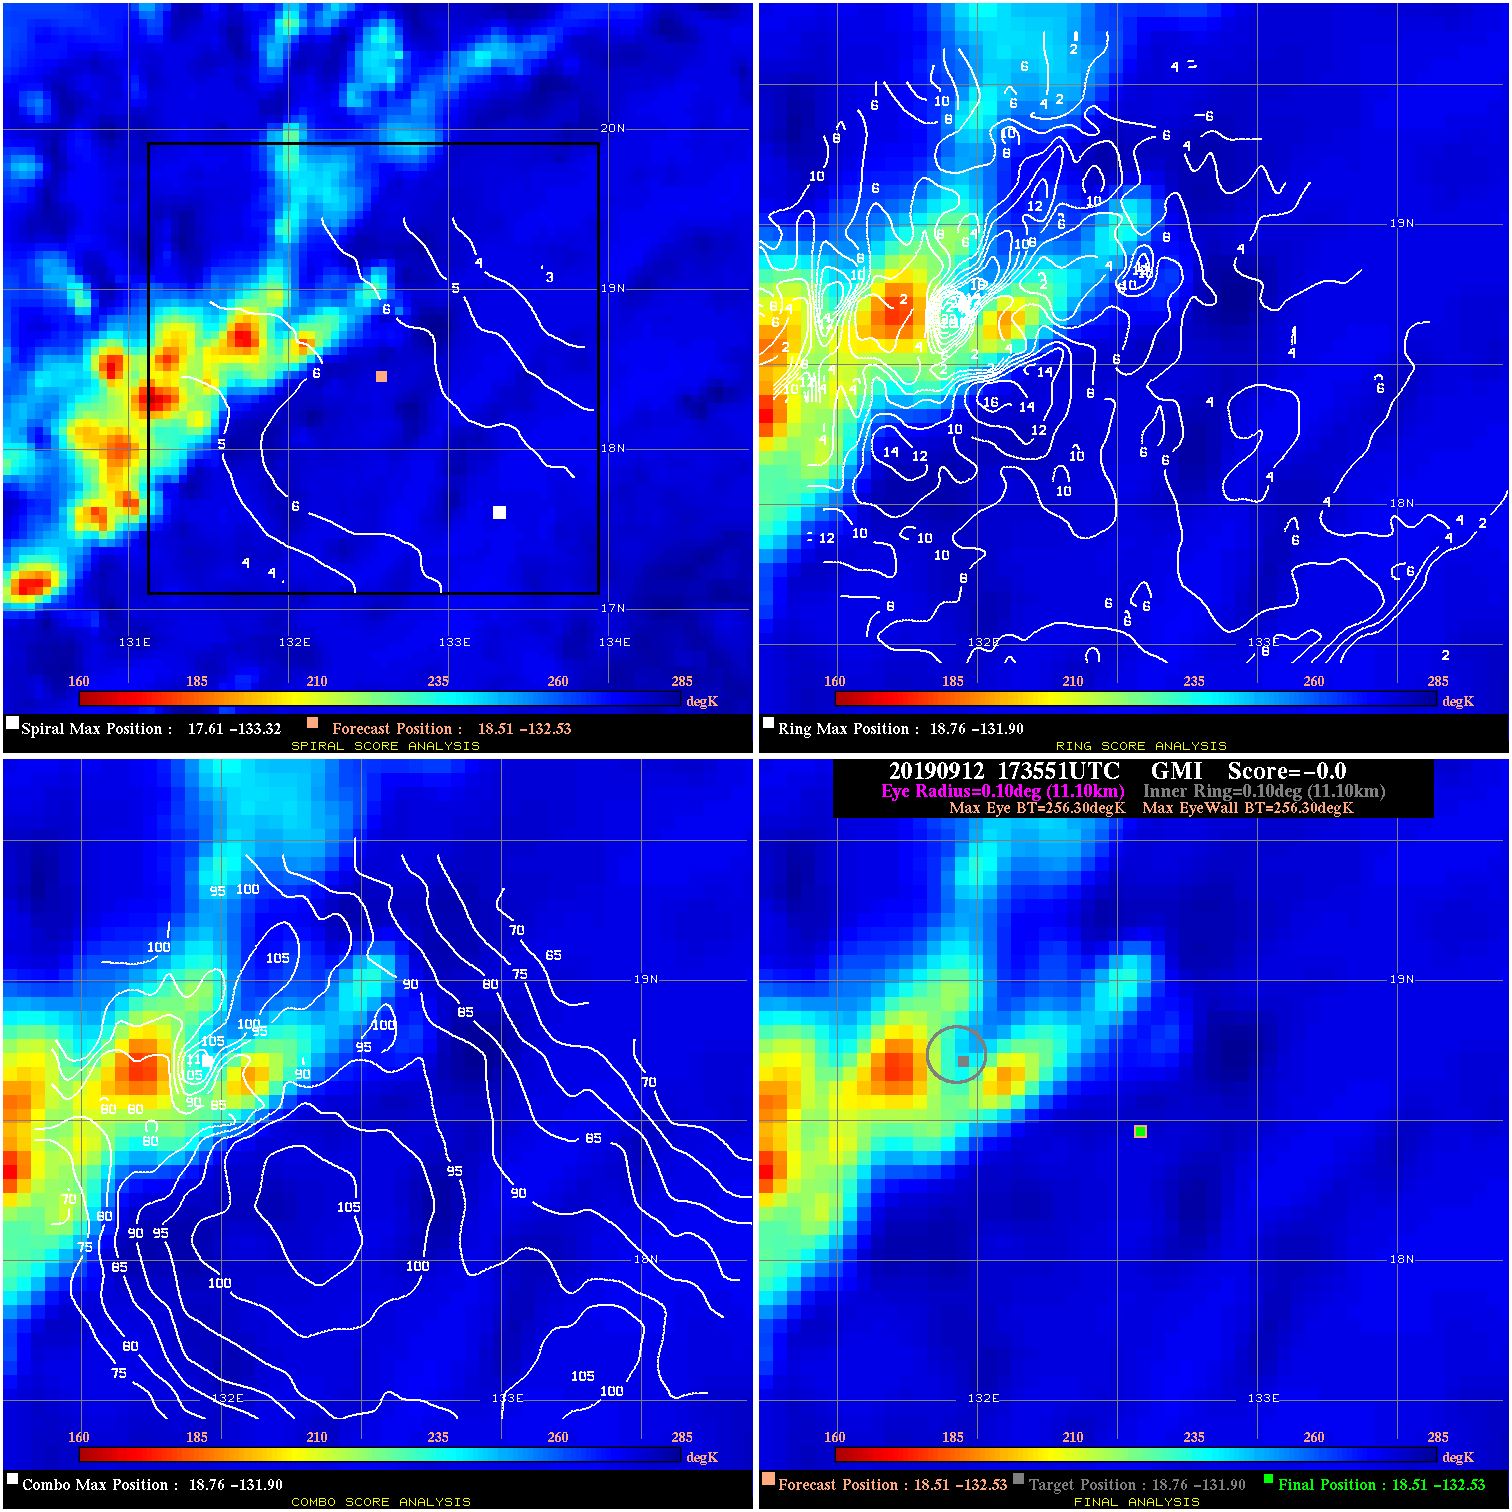
20190912 173551 N/A N/A N/A N/A N/A 30.0 GMI 18.5 -132.5 18.5 -132.5 18.8 -131.9 Analysis Plot
20190912 203454 -930.0 N/A N/A N/A 0.00 30.0 SSMI16 18.4 -132.6 18.4 -132.6 17.6 -132.3 Analysis Plot
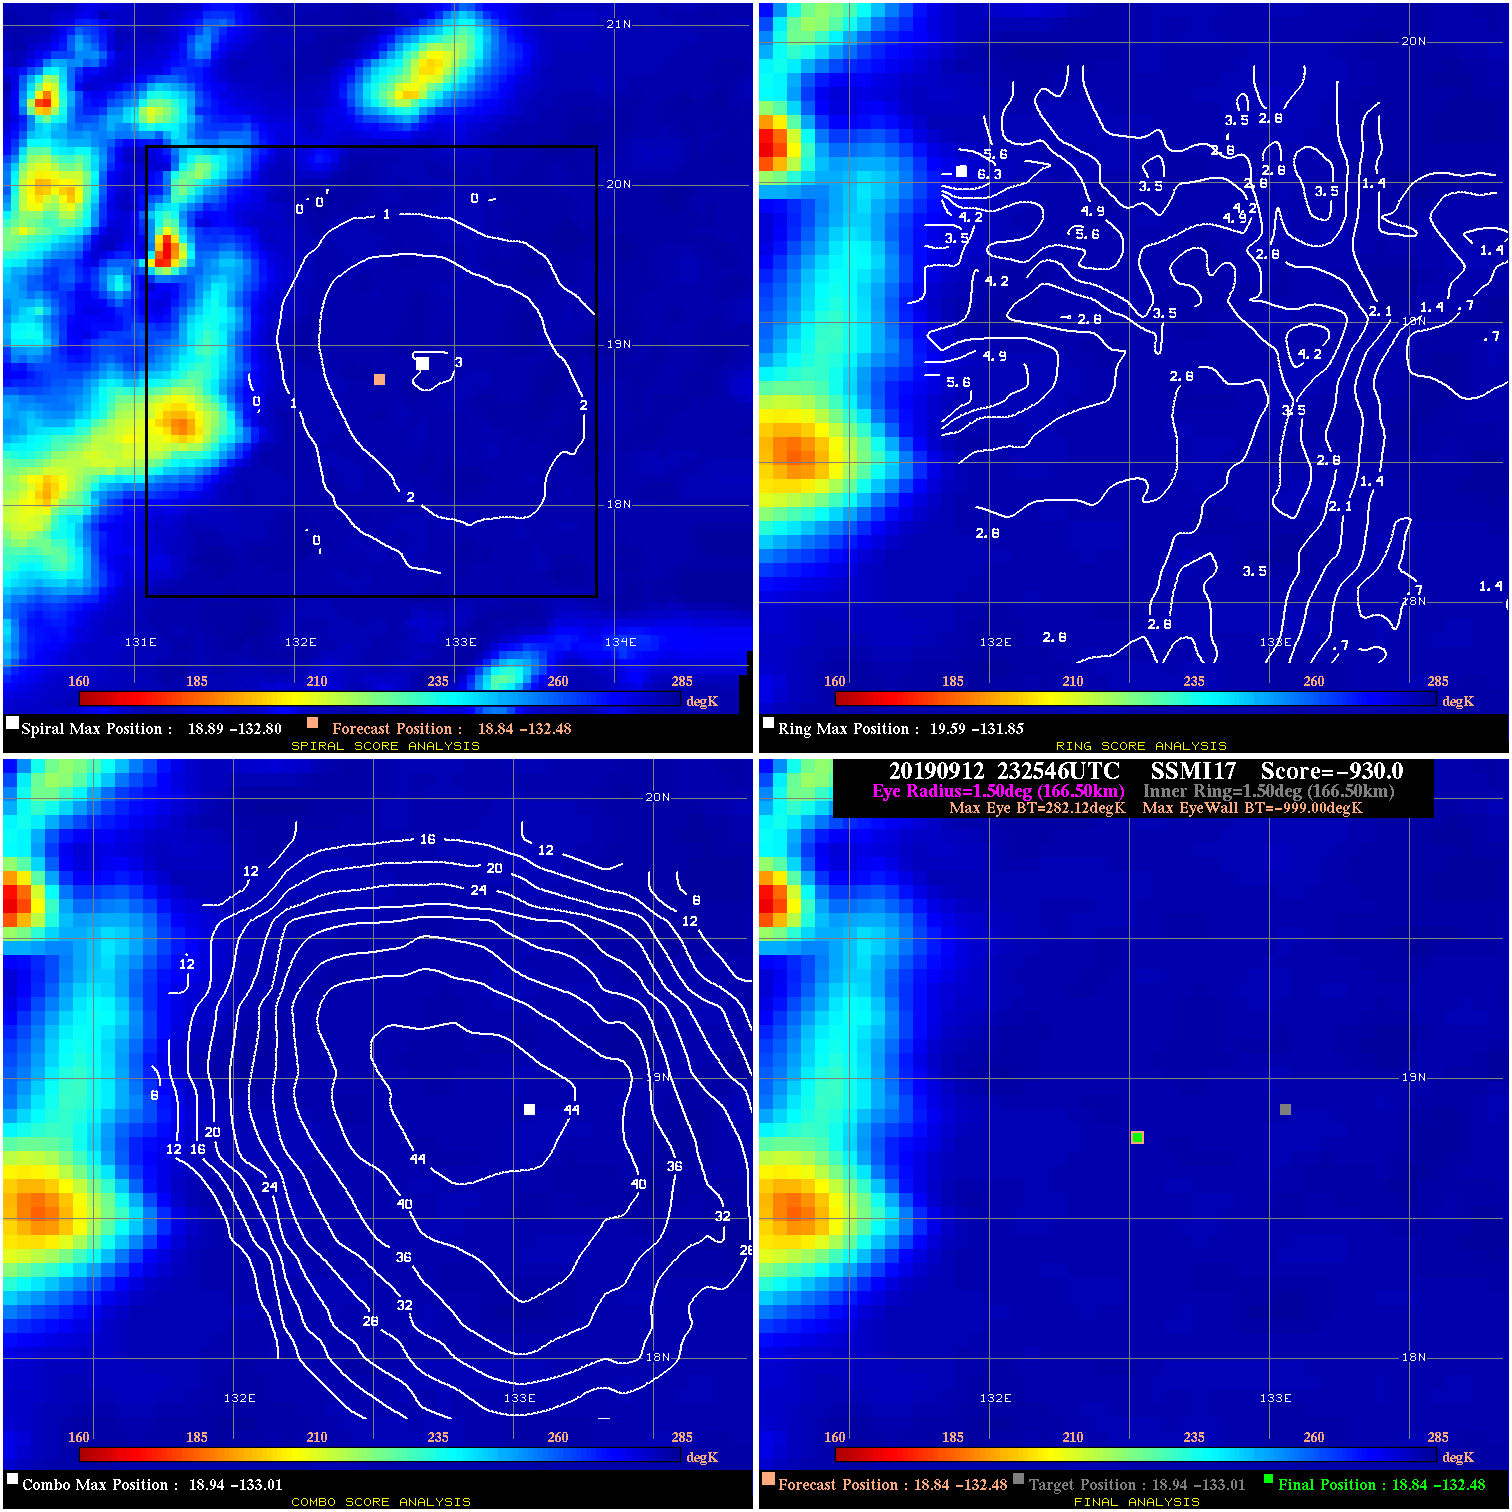
20190912 232546 -930.0 N/A N/A N/A 0.00 30.0 SSMI17 18.8 -132.5 18.8 -132.5 18.9 -133.0 Analysis Plot
20190913 085522 -0.8 N/A N/A 211.09 .80 30.0 SSMI16 19.4 -132.4 19.4 -132.4 19.6 -132.6 Analysis Plot
20190913 114528 -1.1 N/A N/A 233.31 1.06 30.0 SSMI17 19.9 -132.4 19.9 -132.4 20.2 -132.8 Analysis Plot
|
|
Legend: - Date/Time are determined from PMW imagery at Forecast (initial guess) Lat/Lon position. - Positive/Negative Latitude = North/South Hemisphere; Longitude = Western/Eastern Hemisphere. - "Ring Diam" value indicates the estimated surface eyewall diameter in km (the MI eyewall edge diameter minus 10 km). - "Ring Pct" is the percentage of the "ring" (eyewall inner boundary) that is 1) colder than the "hot spot" (warmest eye pixel) in the eye by 20K, or 2) the percentage that is a) colder than 232K and b) colder than the "hot spot" by 10K, whichever is greater. - Values are red if Ring % <= 65, yellow/brown if Ring % <= 85 and green if Ring % > 85. - "Tb diff" is the difference between the "hot spot" (warmest eye pixel) and the warmest pixel on the eyewall. - Intensity score are listed as negative, and not used, when the JTWC or NHC estimated Vmax is <55 kts in order to rule out weak but highly symmetric TCs. - Error messages in intensity scores: -920 is used when the hottest pixel in the eye is <200K, to prevent false positives; -930 means <85% of eyewall has observations/data. |