Typhoon 31Y_03
|
Passive Microwave (PMW) Intensity Information Hurricane Intensity Estimation (HIE) Algorithm Version 9.0 |
Overpass Inten Ring Ring Wind Forecast Final Target
Date Time Score Meaning Pct Diam BTdiff Est Sat Lat Lon Lat Lon Lat Lon
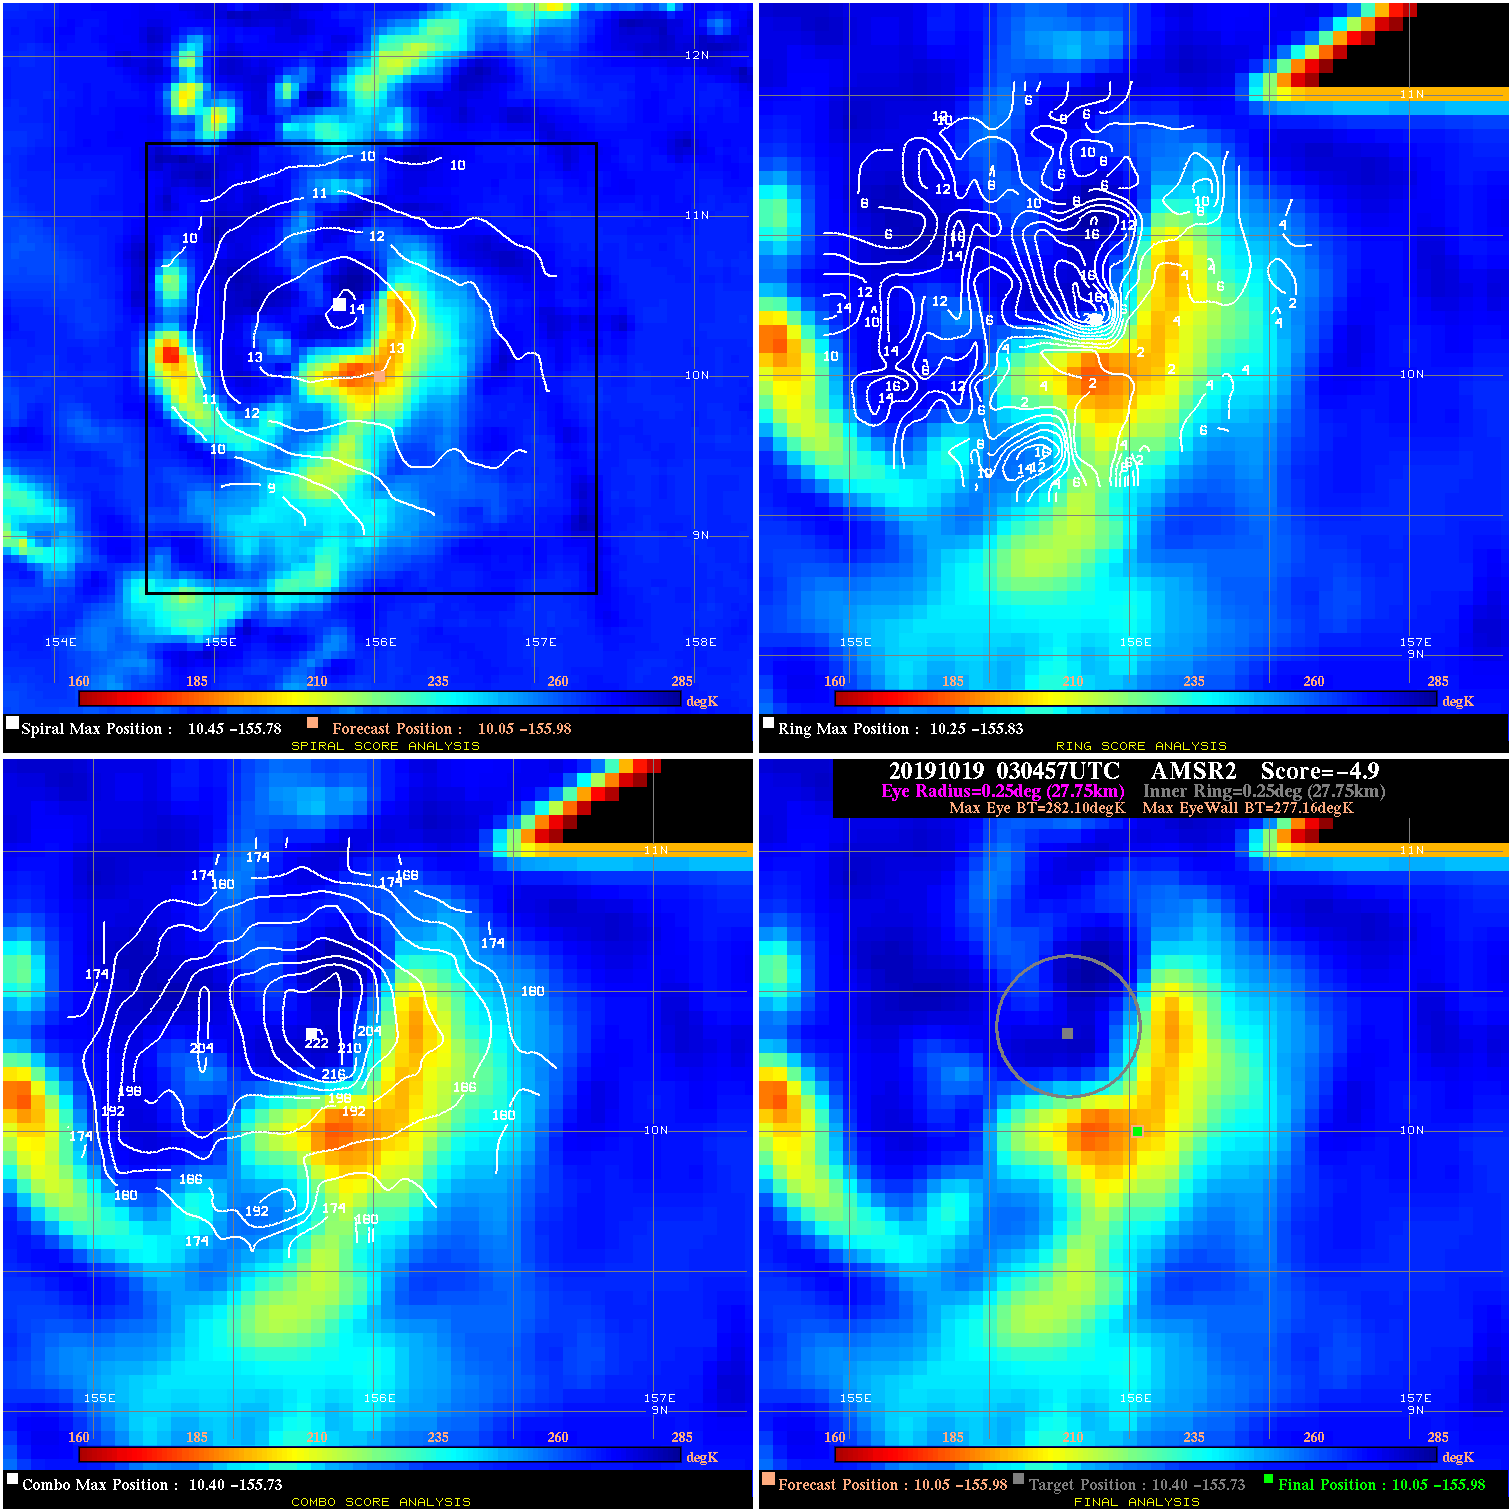
20191019 030457 -4.9 N/A 46.6% 55.55 4.94 30.0 AMSR2 10.1 -156.0 10.1 -156.0 10.4 -155.7 Analysis Plot
20191019 055853 -1.8 N/A 38.4% 66.66 1.82 30.0 SSMI16 10.3 -155.4 10.3 -155.4 10.4 -155.0 Analysis Plot
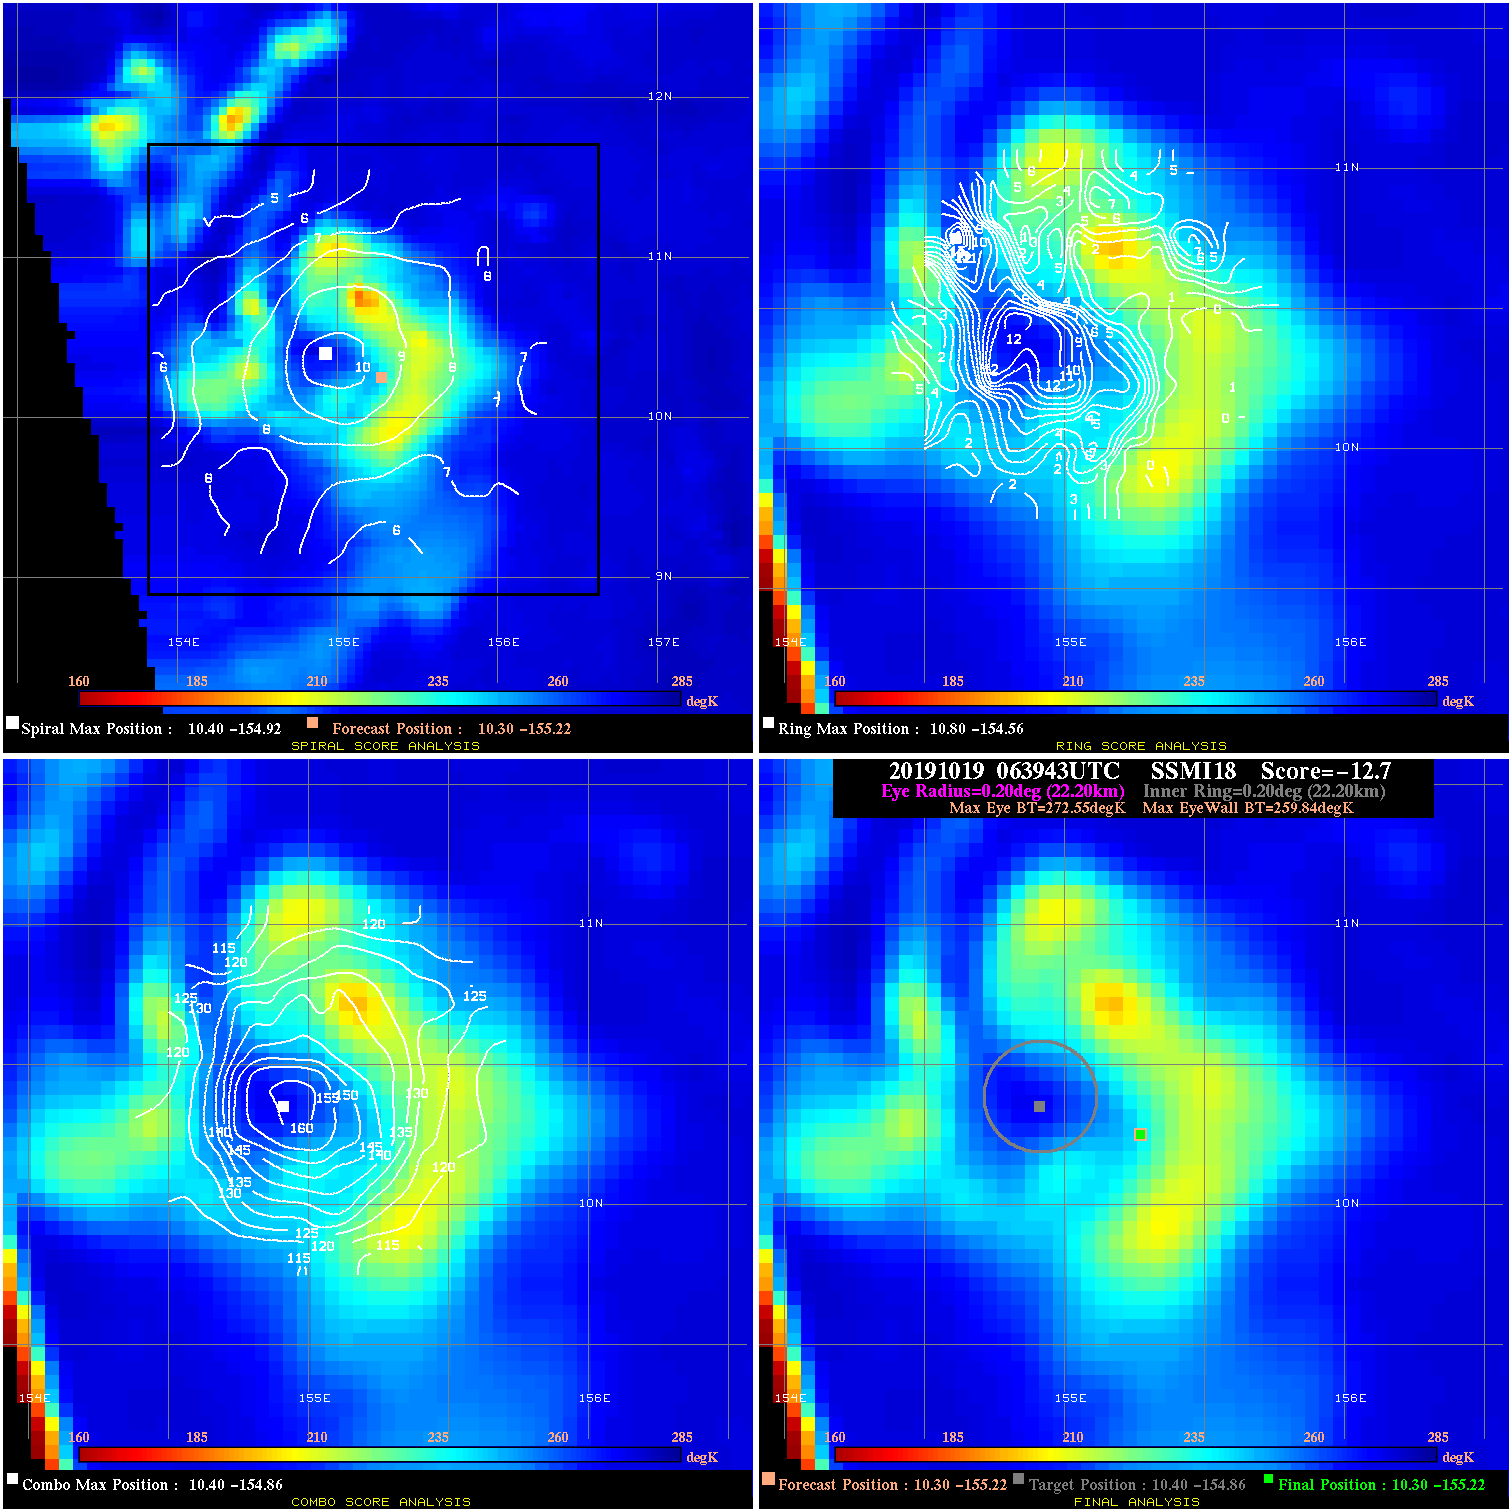
20191019 063943 -12.7 N/A 46.6% 44.44 12.71 30.0 SSMI18 10.3 -155.2 10.3 -155.2 10.4 -154.9 Analysis Plot
20191019 152052 -2.7 N/A 16.4% 99.99 2.71 35.0 AMSR2 10.9 -152.9 11.0 -152.7 11.0 -152.7 Analysis Plot
20191019 192548 -11.7 N/A 37.0% 222.20 11.66 40.0 SSMI16 10.9 -152.3 10.9 -152.3 11.4 -152.1 Analysis Plot
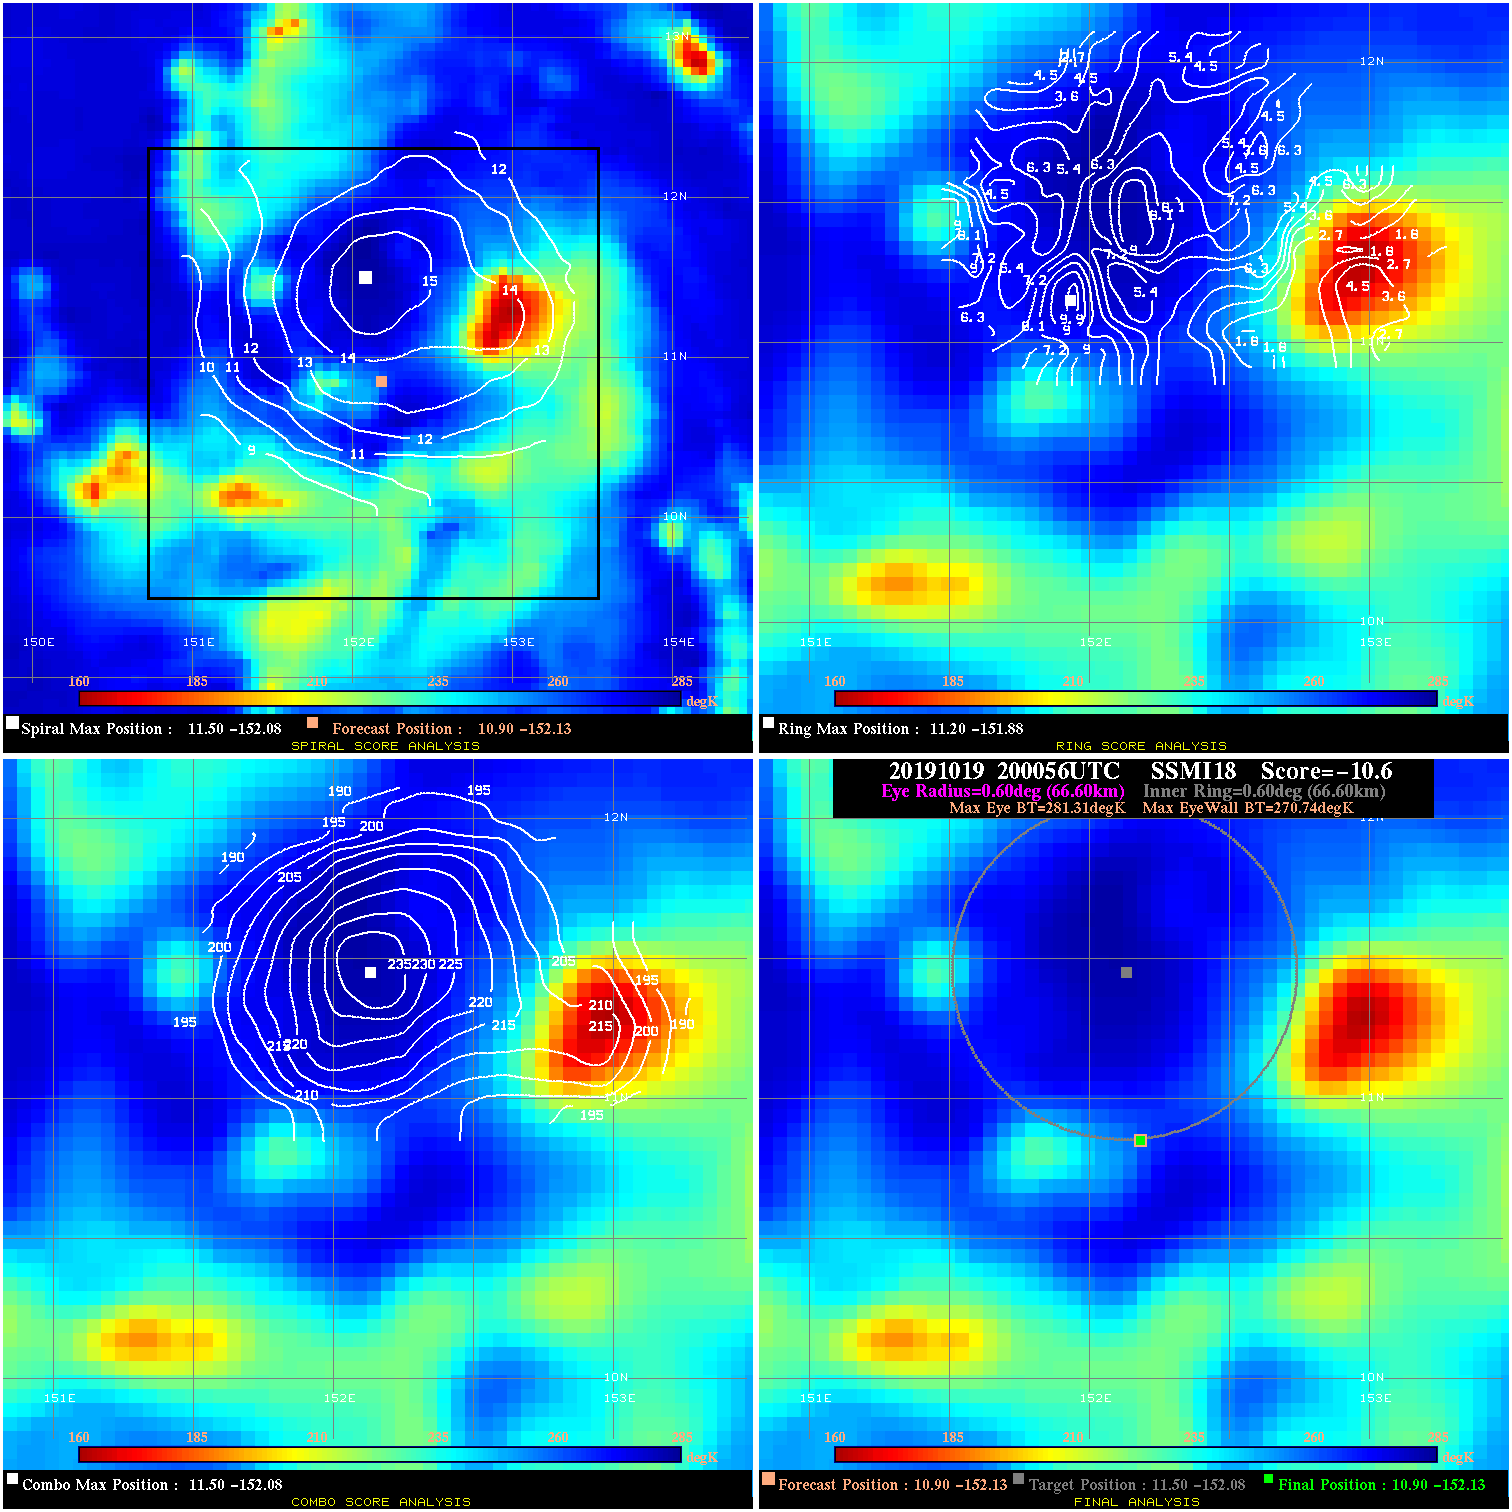
20191019 200056 -10.6 N/A 6.8% 133.32 10.57 40.0 SSMI18 10.9 -152.1 10.9 -152.1 11.5 -152.1 Analysis Plot
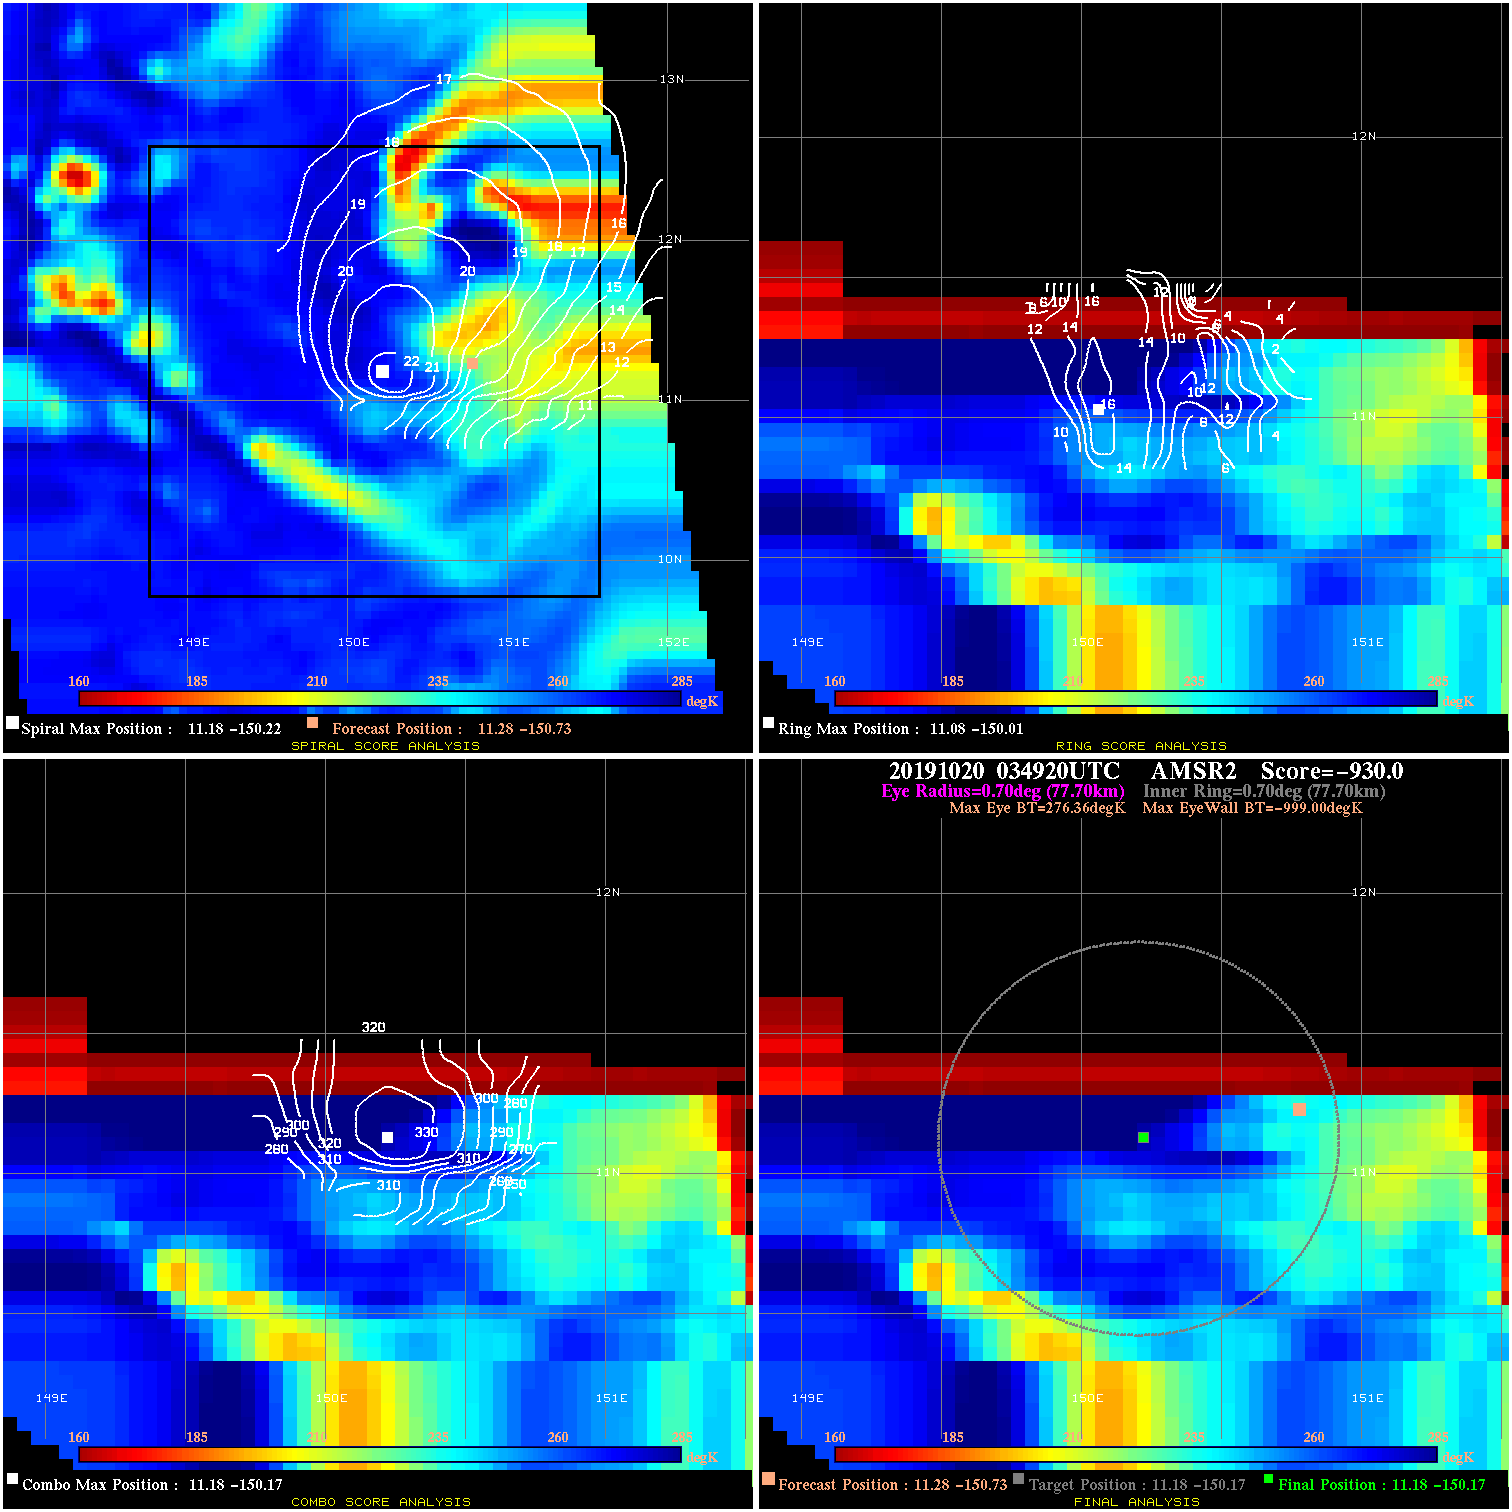
20191020 034920 -930.0 N/A N/A N/A 0.00 50.0 AMSR2 11.3 -150.7 11.2 -150.2 11.2 -150.2 Analysis Plot
20191020 072707 17.7 N/A 21.9% 44.44 17.72 55.0 SSMI16 11.6 -150.3 11.6 -150.3 12.2 -150.7 Analysis Plot
20191020 160343 21.9 >65 kts 75.3% 33.33 21.88 60.0 AMSR2 13.1 -149.3 13.1 -149.4 13.1 -149.4 Analysis Plot
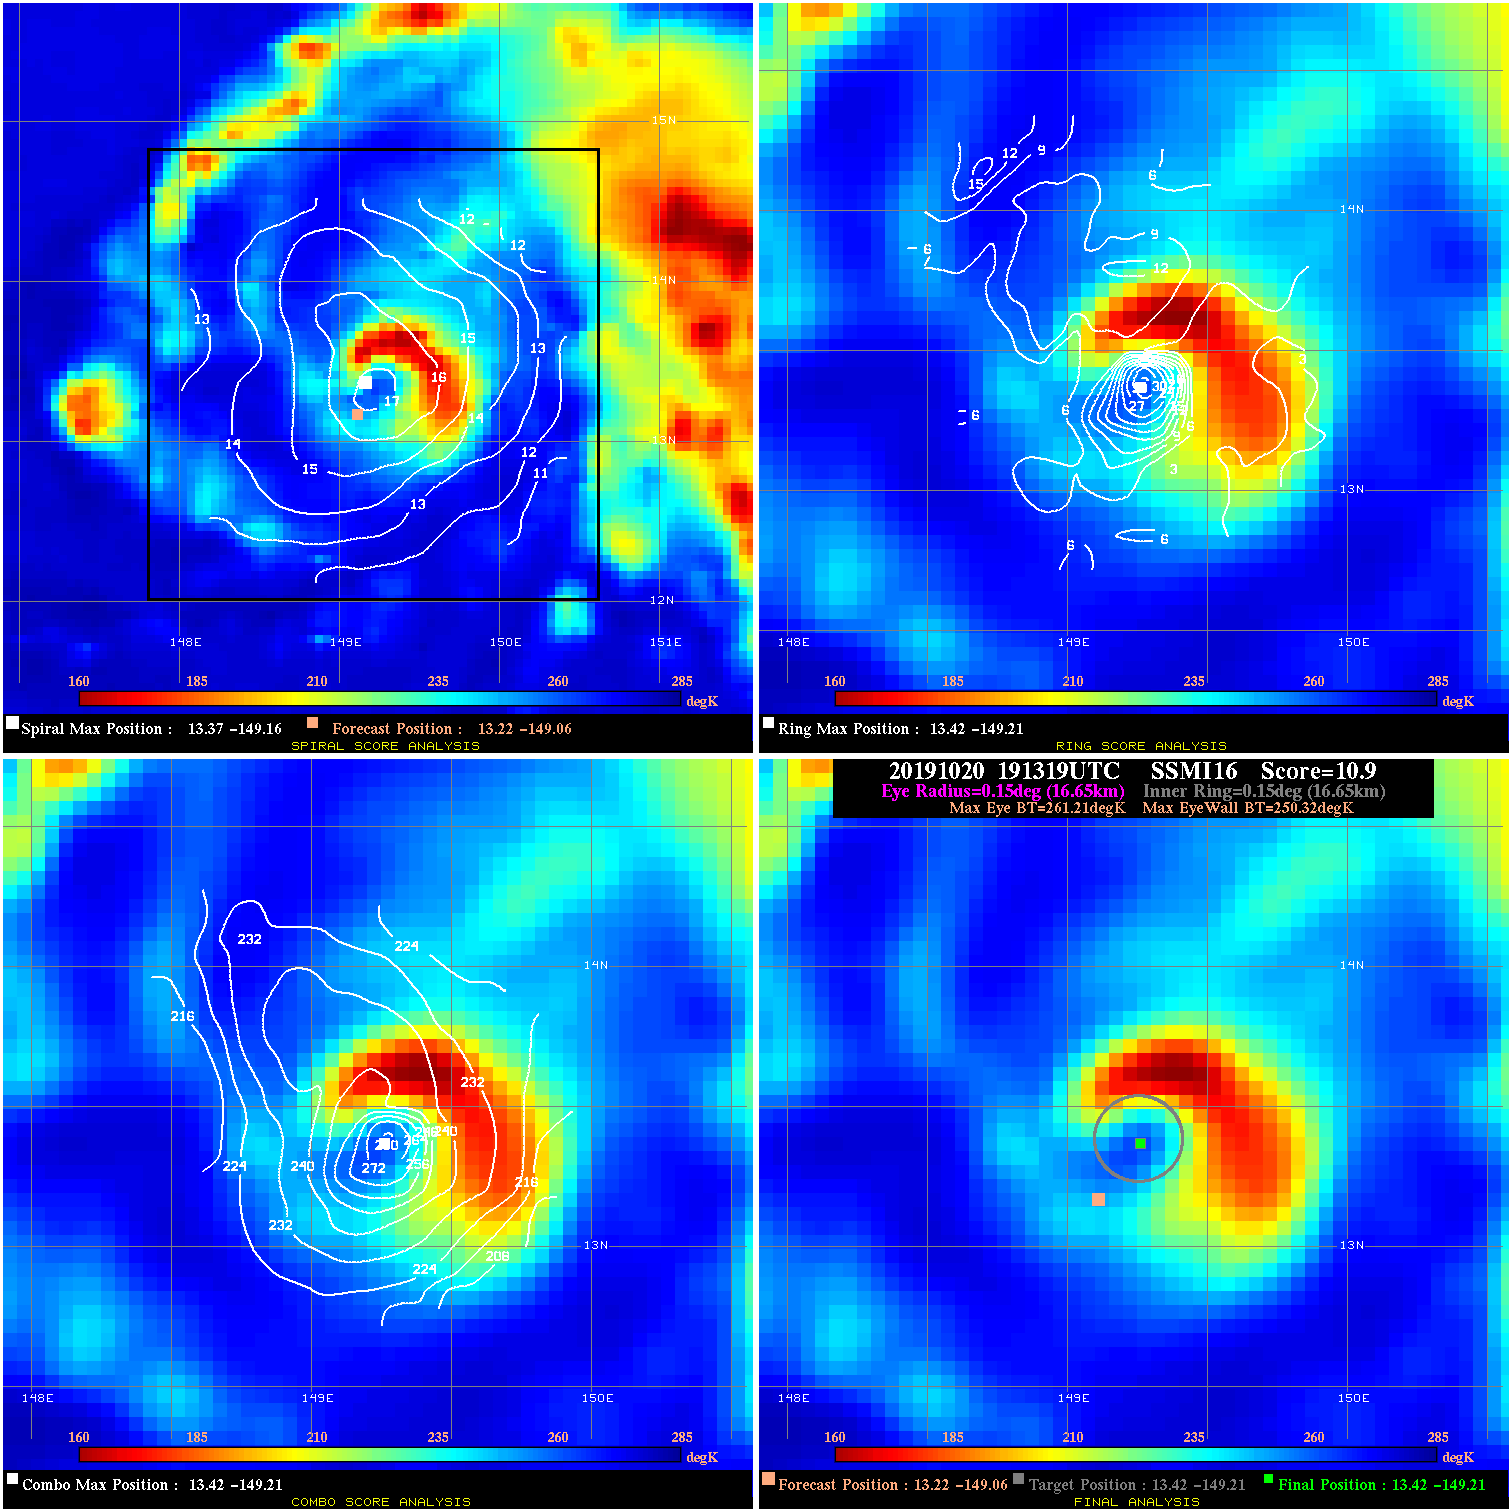
20191020 191319 10.9 N/A 72.6% 33.33 10.89 60.0 SSMI16 13.2 -149.1 13.4 -149.2 13.4 -149.2 Analysis Plot
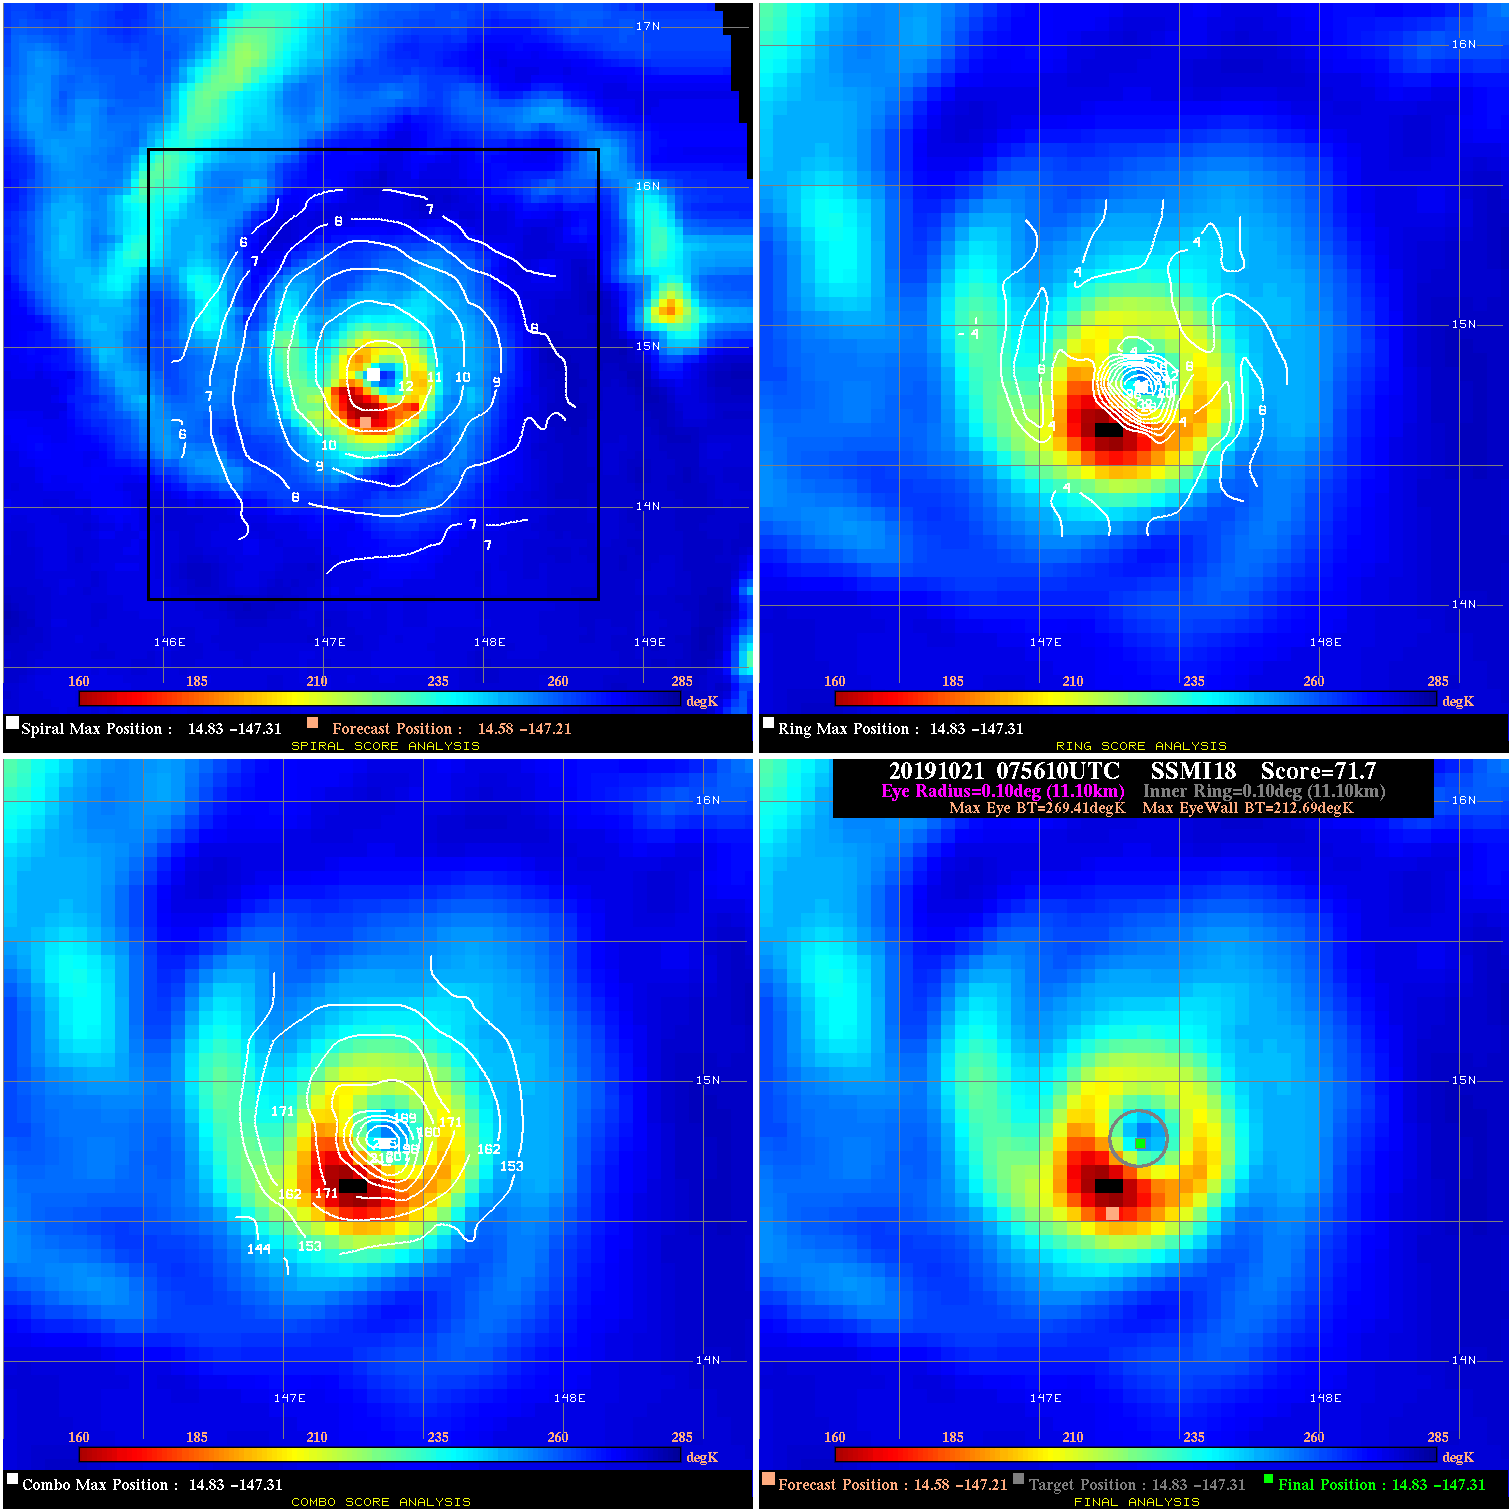
20191021 075610 71.7 >85 kts 100.0% 22.22 56.72 80.0 SSMI18 14.6 -147.2 14.8 -147.3 14.8 -147.3 Analysis Plot
20191022 033808 91.8 >85 kts 100.0% 33.33 76.84 85.0 AMSR2 17.7 -144.5 17.7 -144.6 17.7 -144.6 Analysis Plot
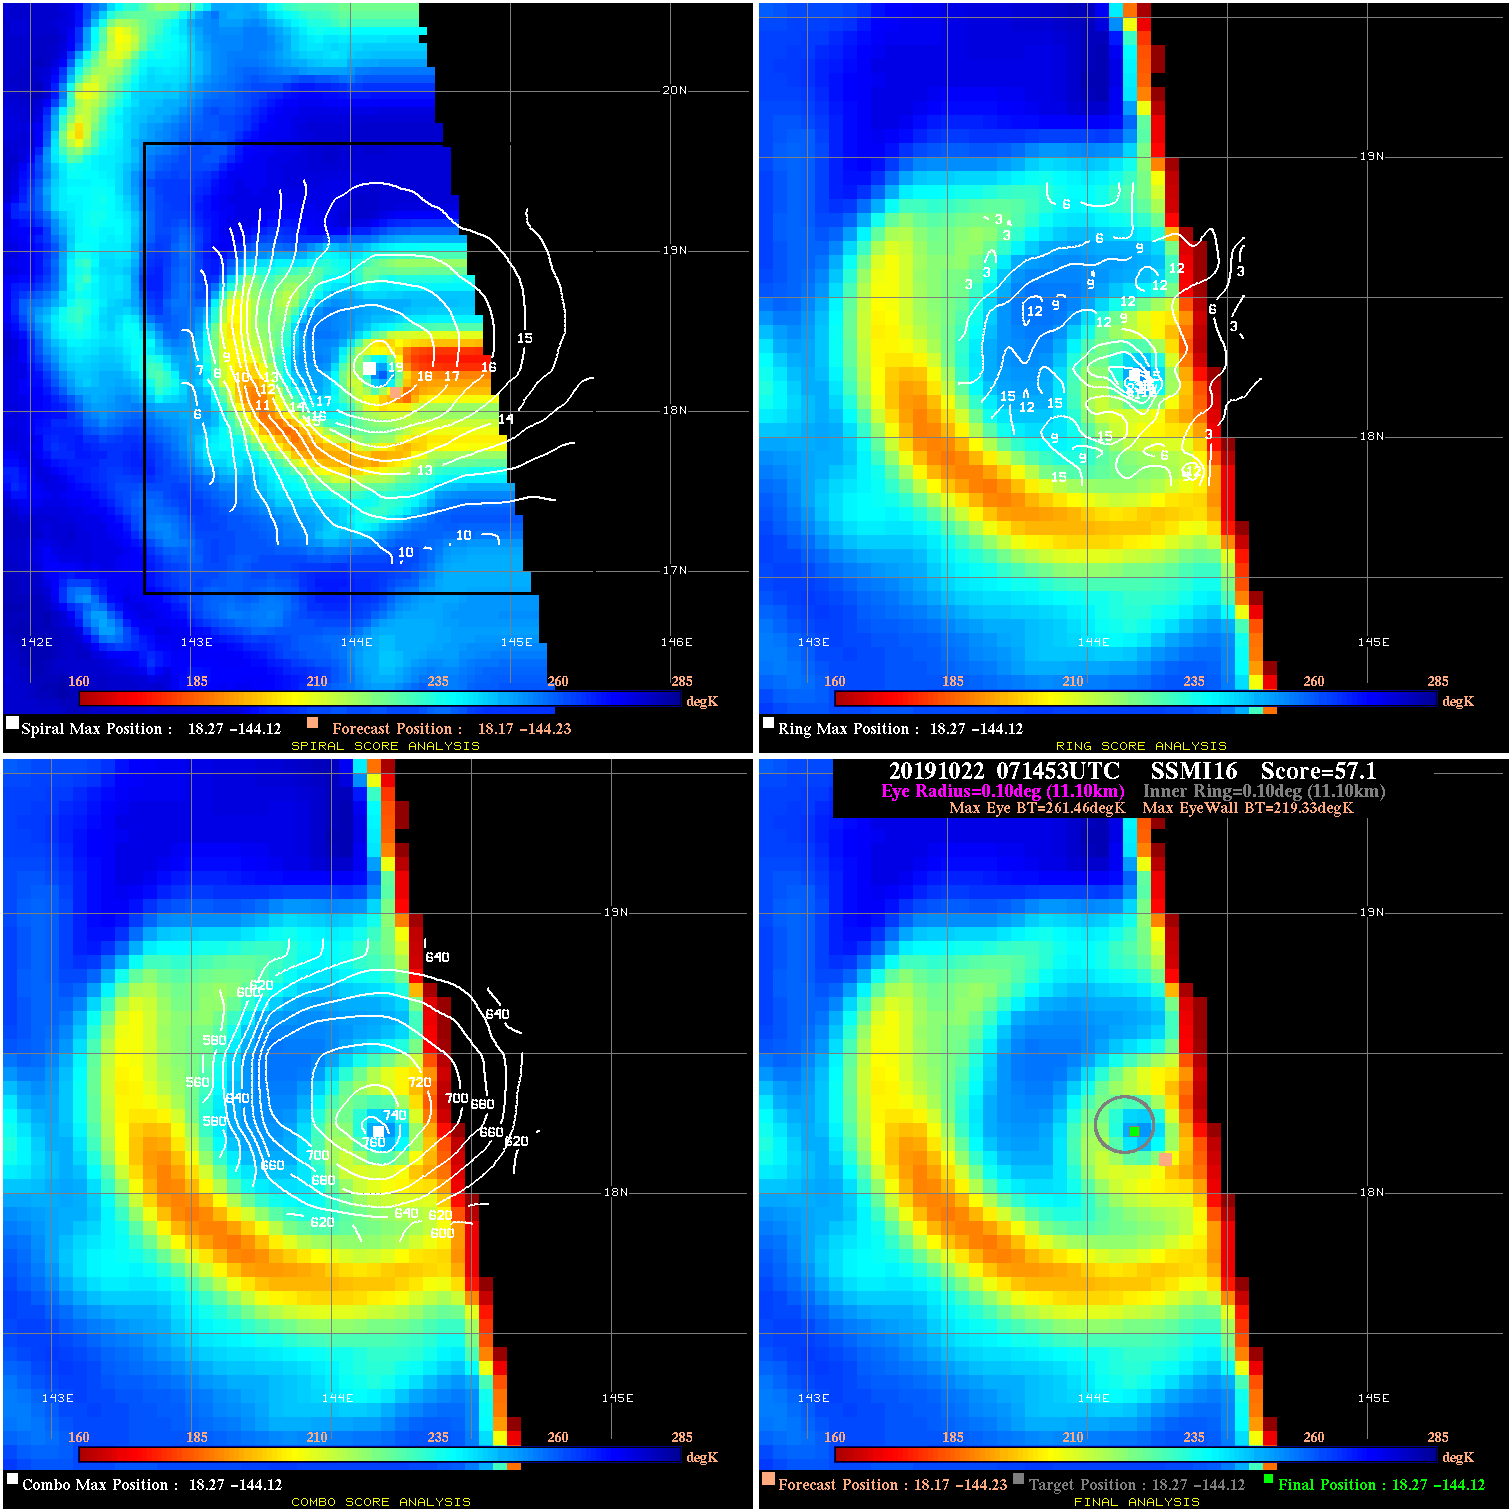
20191022 071453 57.1 >65 kts 100.0% 22.22 42.13 95.0 SSMI16 18.2 -144.2 18.3 -144.1 18.3 -144.1 Analysis Plot
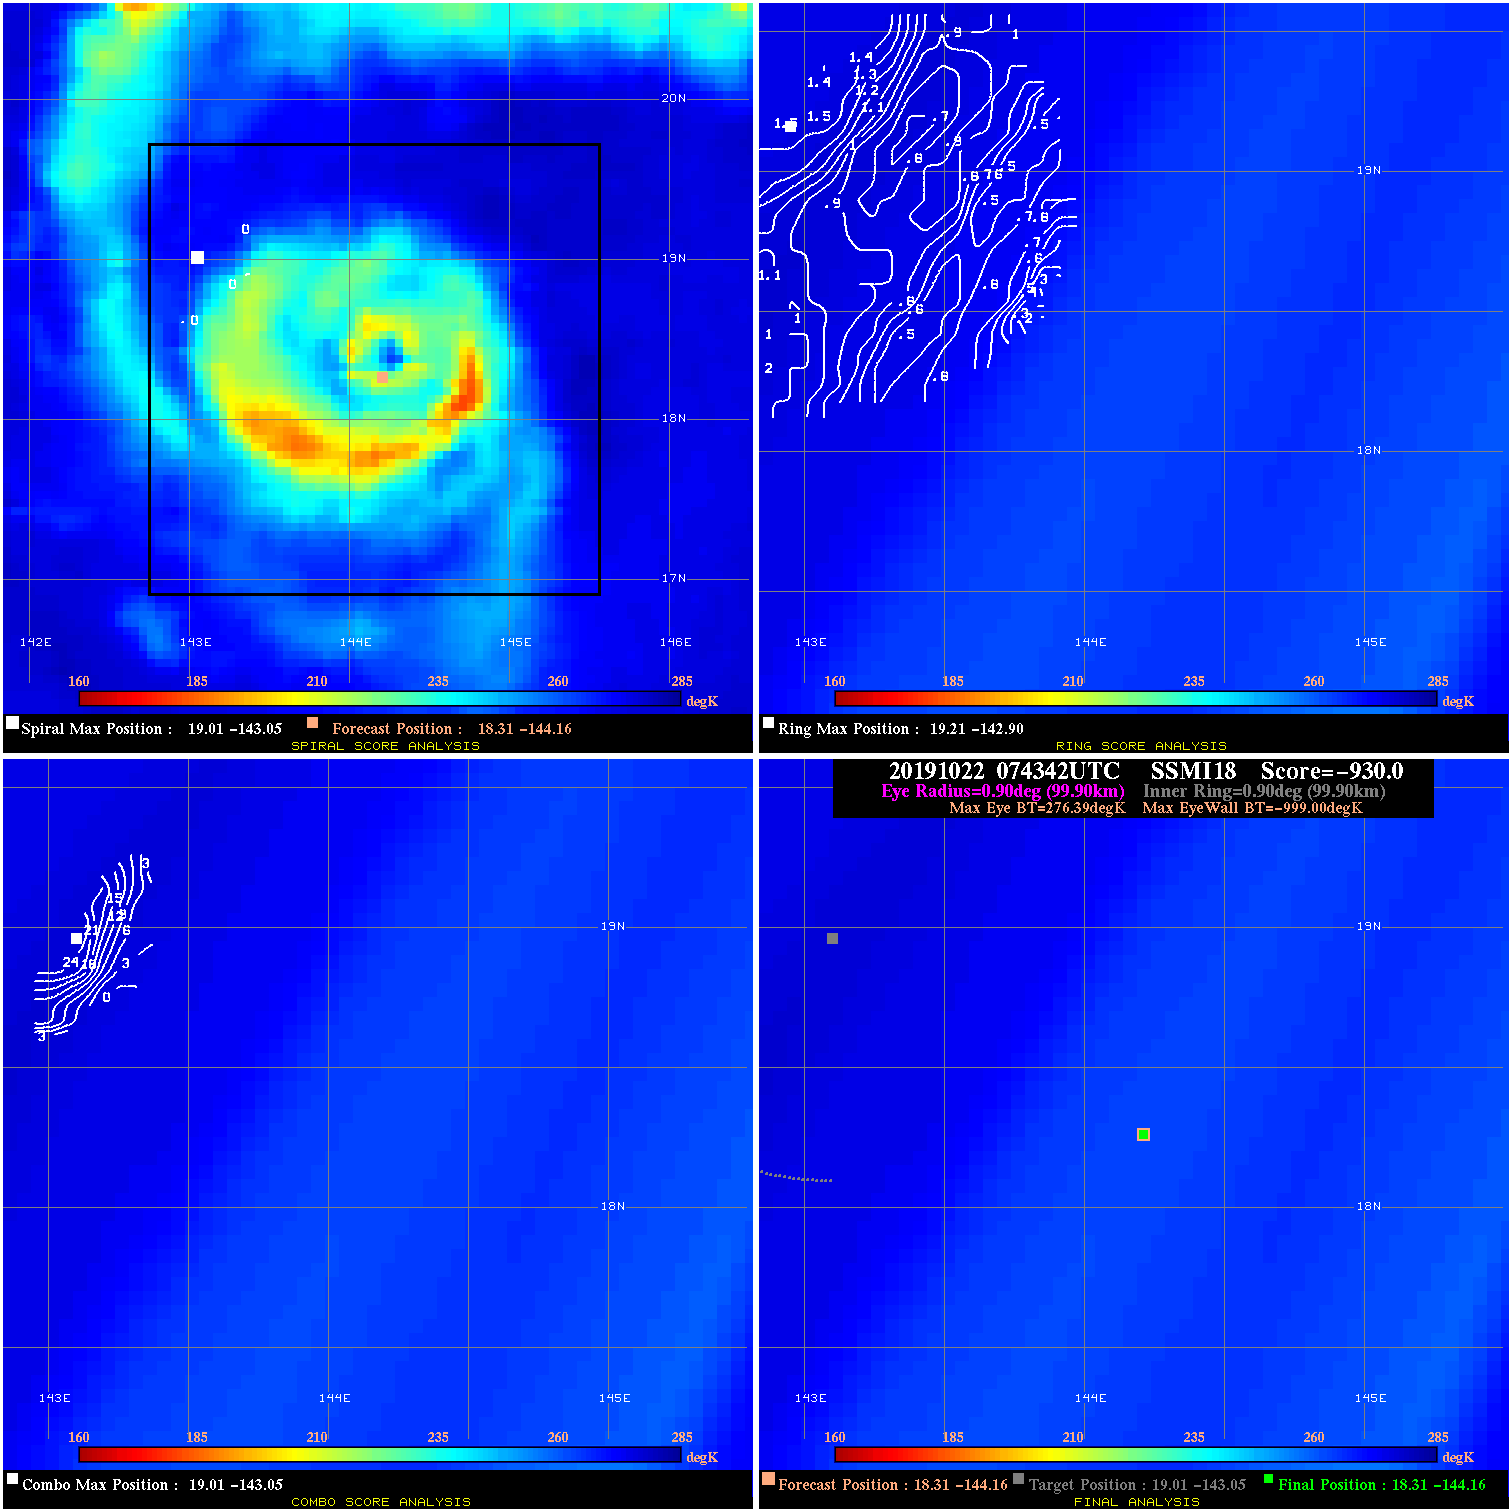
20191022 074342 -930.0 N/A N/A N/A 0.00 95.0 SSMI18 18.3 -144.2 18.3 -144.2 19.0 -143.1 Analysis Plot
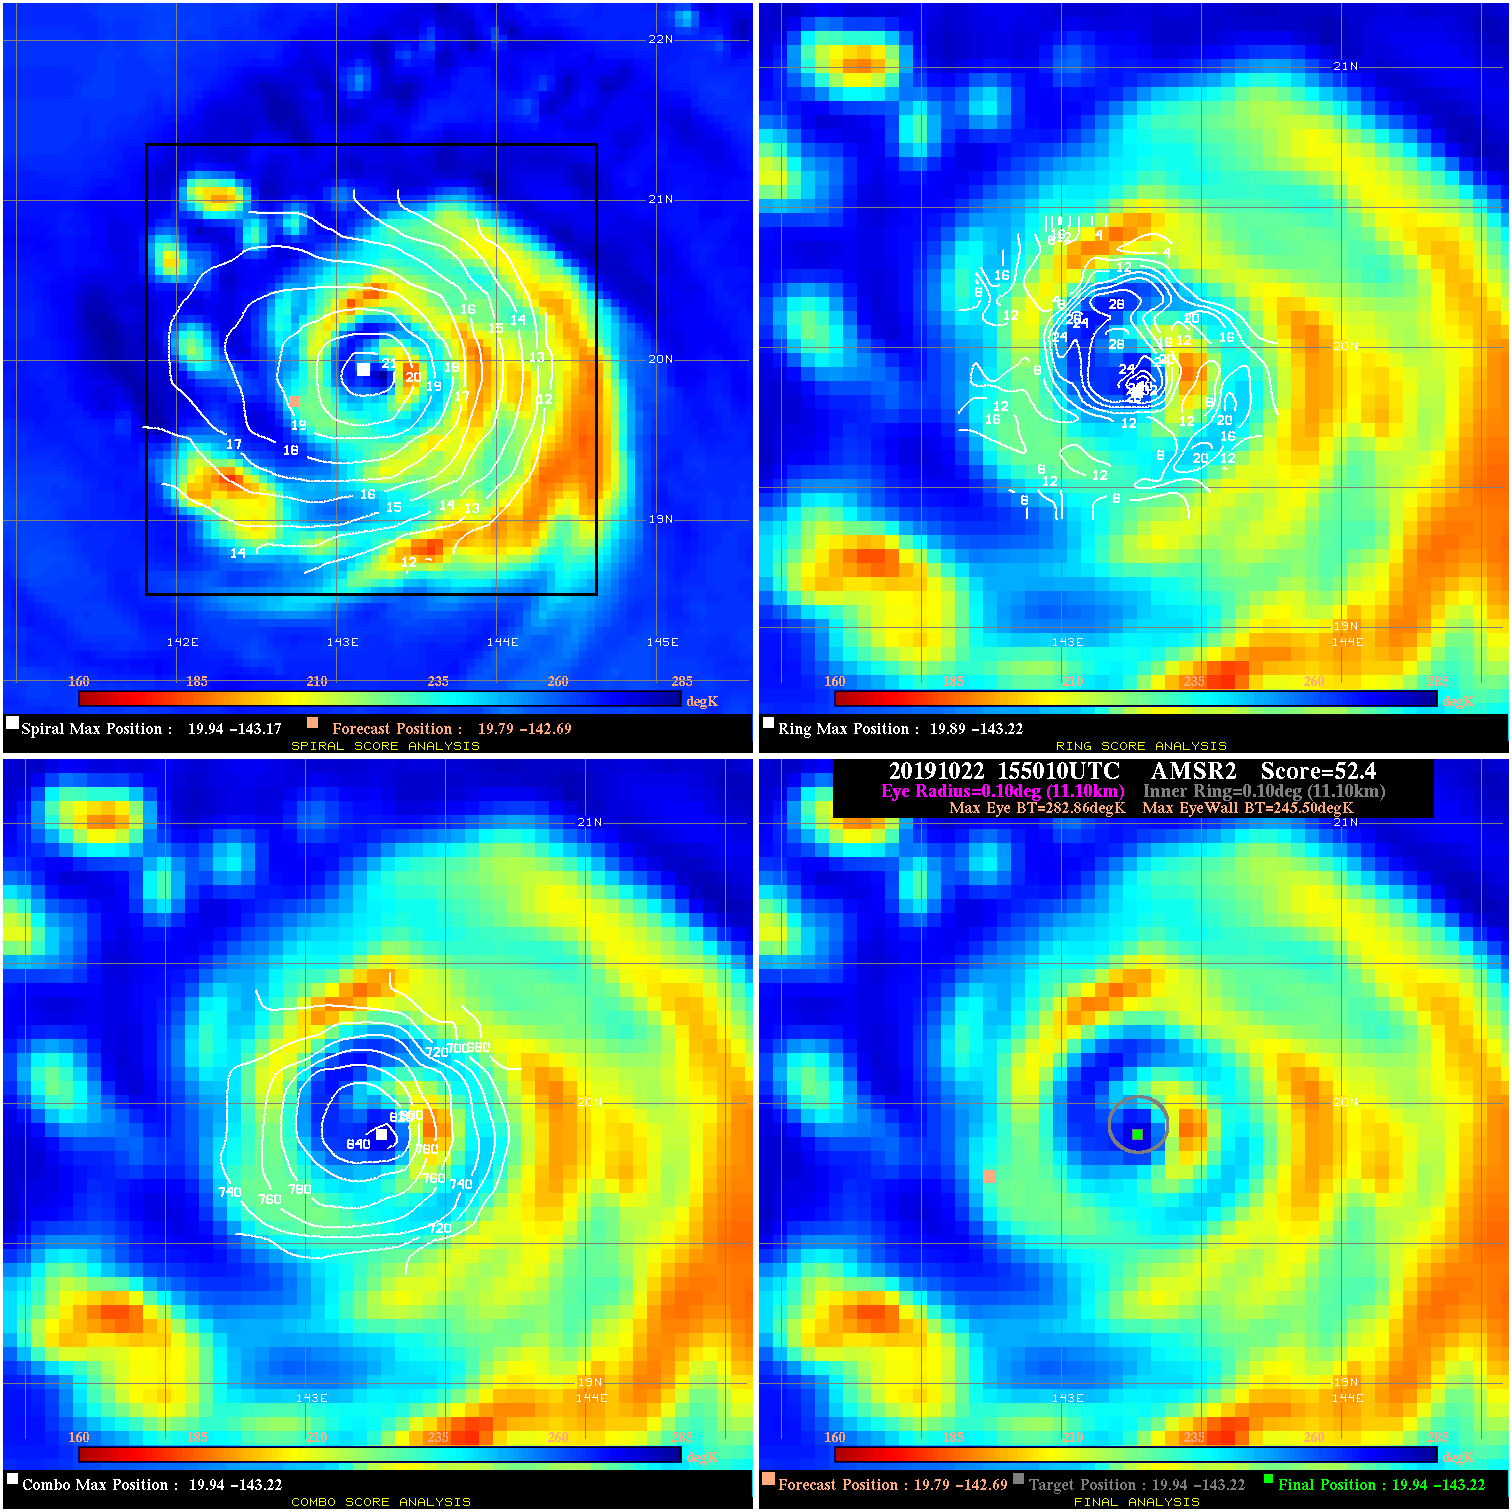
20191022 155010 52.4 >65 kts 100.0% 22.22 37.36 100.0 AMSR2 19.8 -142.7 19.9 -143.2 19.9 -143.2 Analysis Plot
20191022 210228 12.8 N/A 17.8% 44.44 12.78 100.0 SSMI18 20.6 -142.9 20.9 -142.7 20.9 -142.7 Analysis Plot
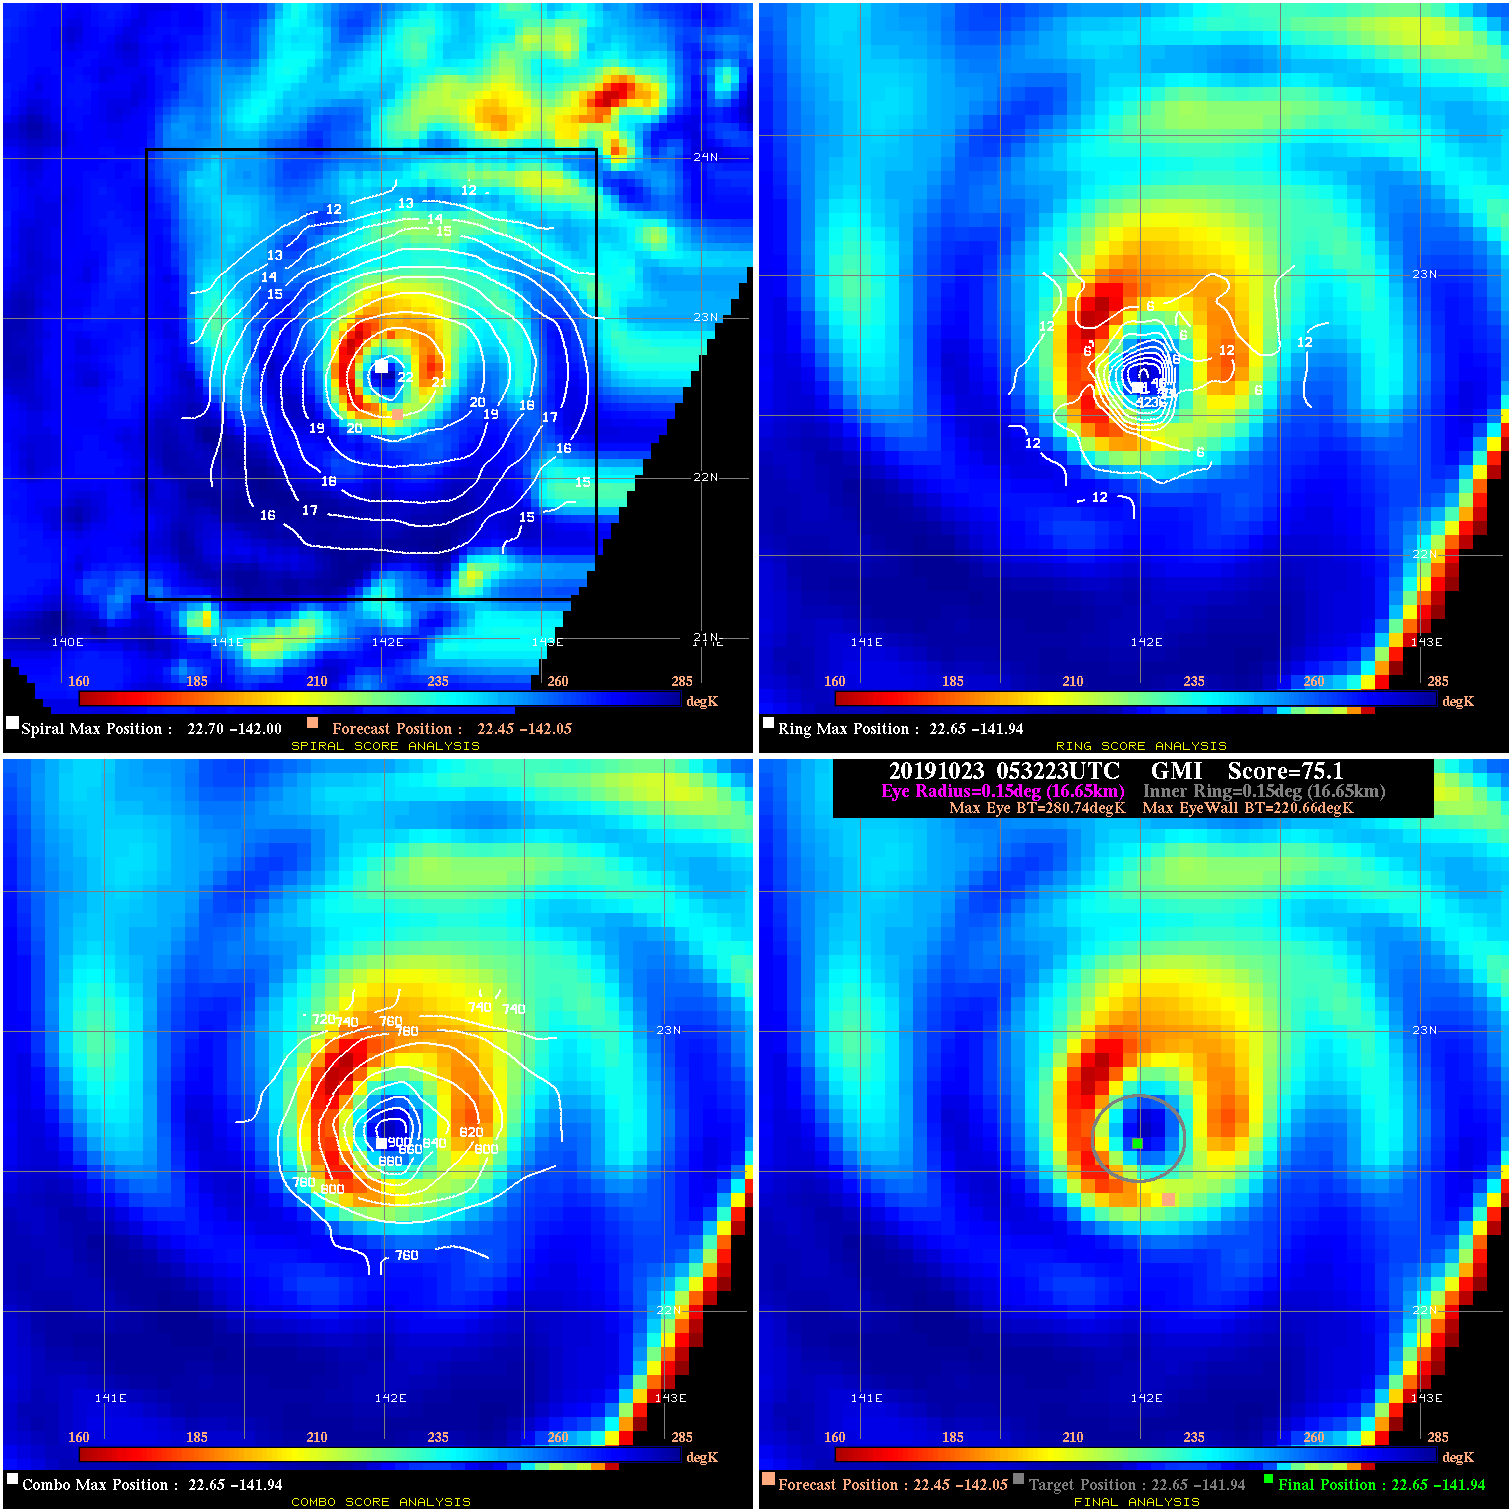
20191023 053223 75.1 >85 kts 100.0% 33.33 60.08 100.0 GMI 22.5 -142.1 22.6 -141.9 22.6 -141.9 Analysis Plot
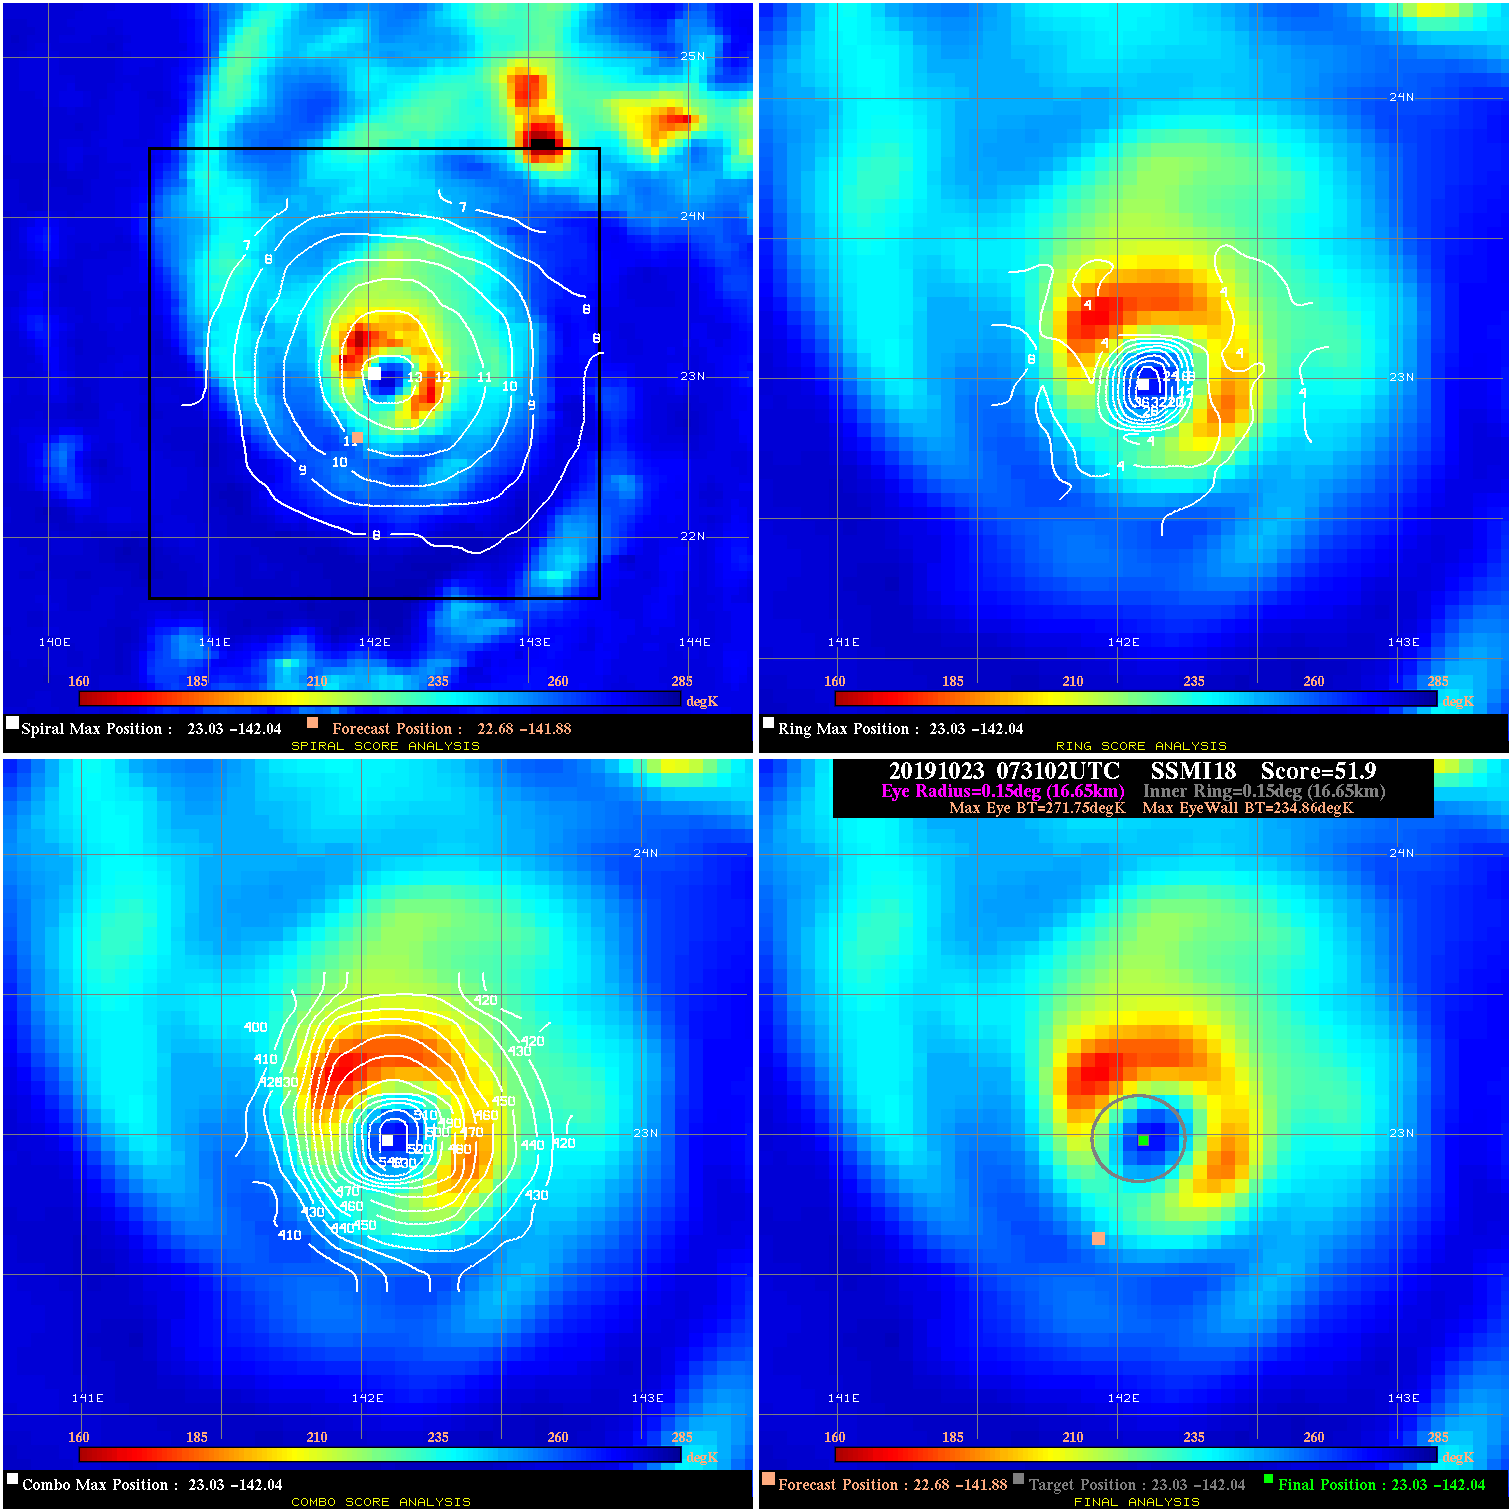
20191023 073102 51.9 >65 kts 100.0% 33.33 36.89 95.0 SSMI18 22.7 -141.9 23.0 -142.0 23.0 -142.0 Analysis Plot
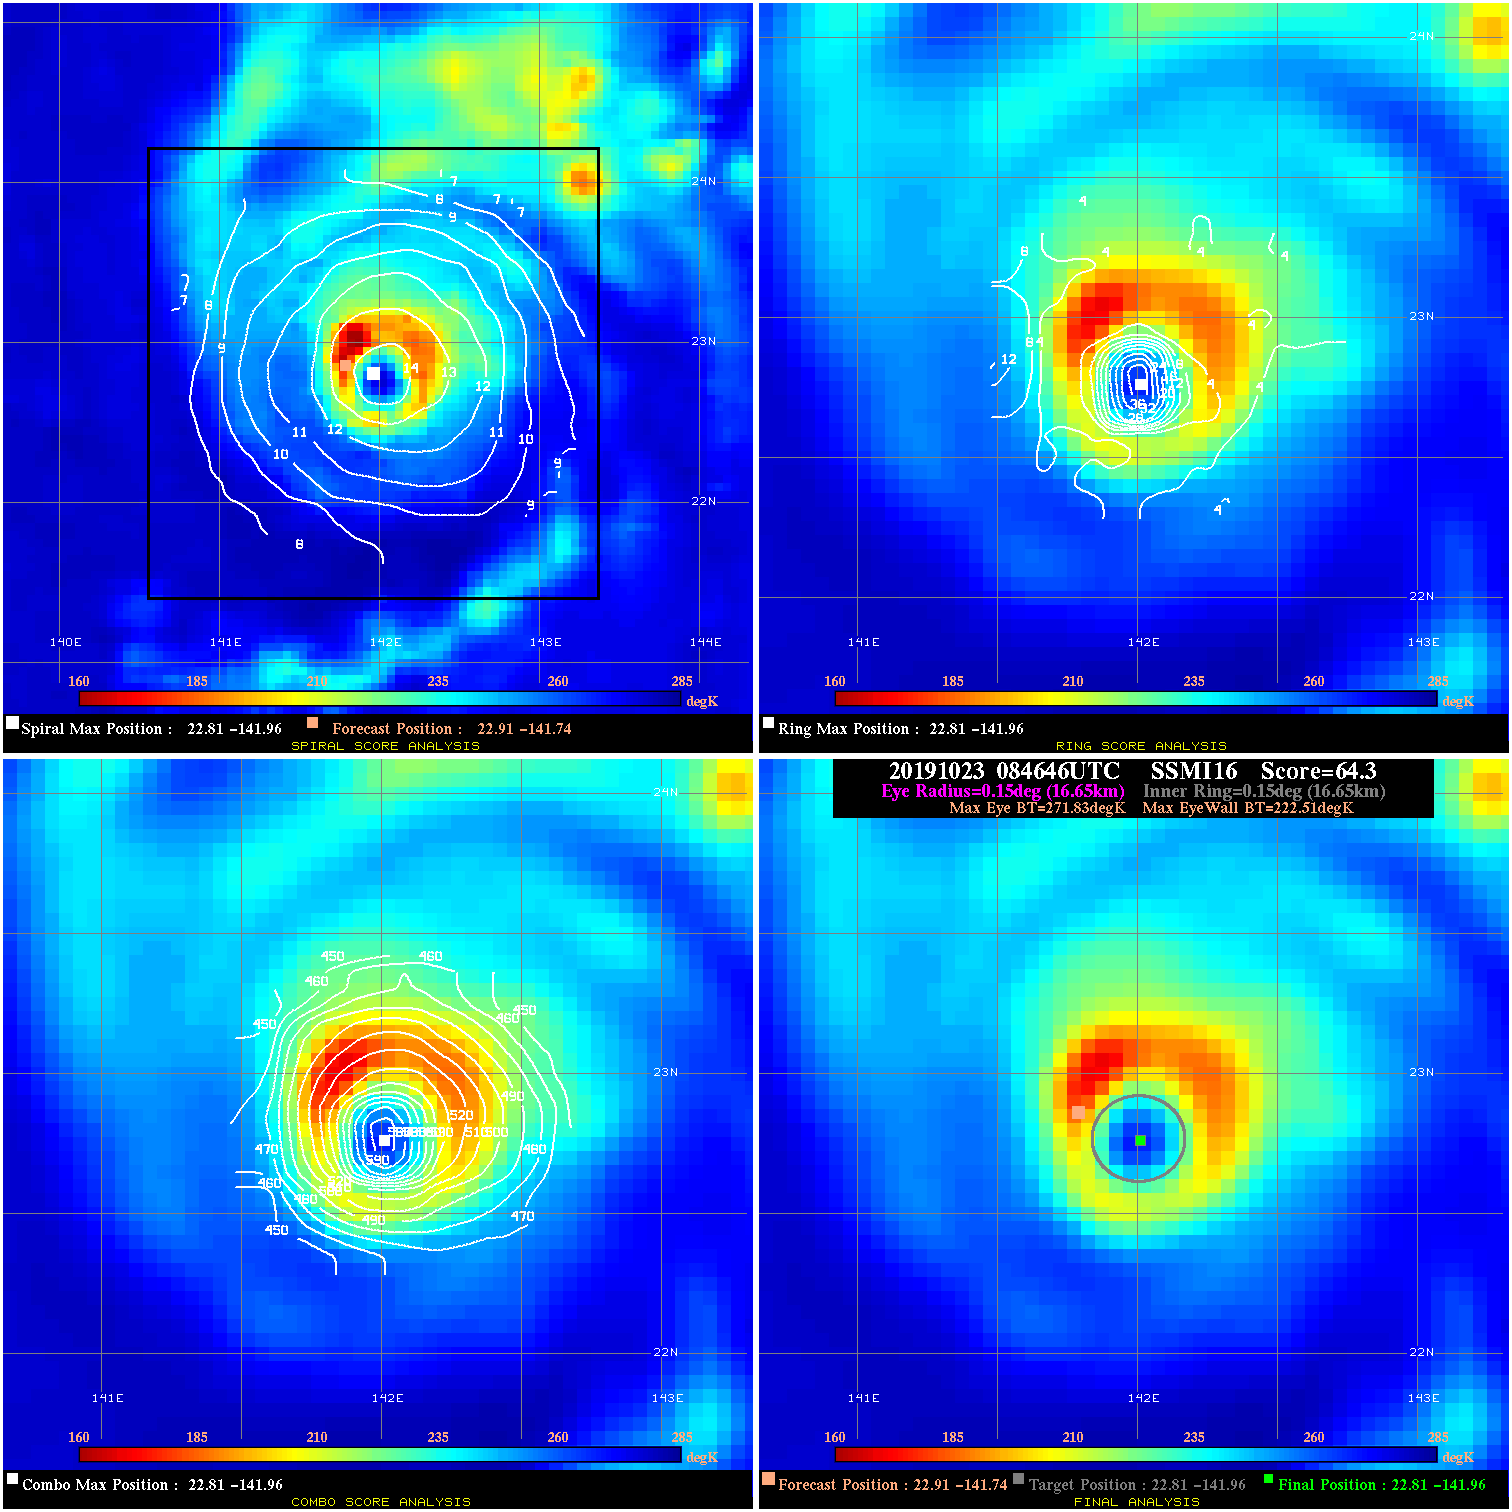
20191023 084646 64.3 >85 kts 100.0% 33.33 49.32 95.0 SSMI16 22.9 -141.7 22.8 -142.0 22.8 -142.0 Analysis Plot
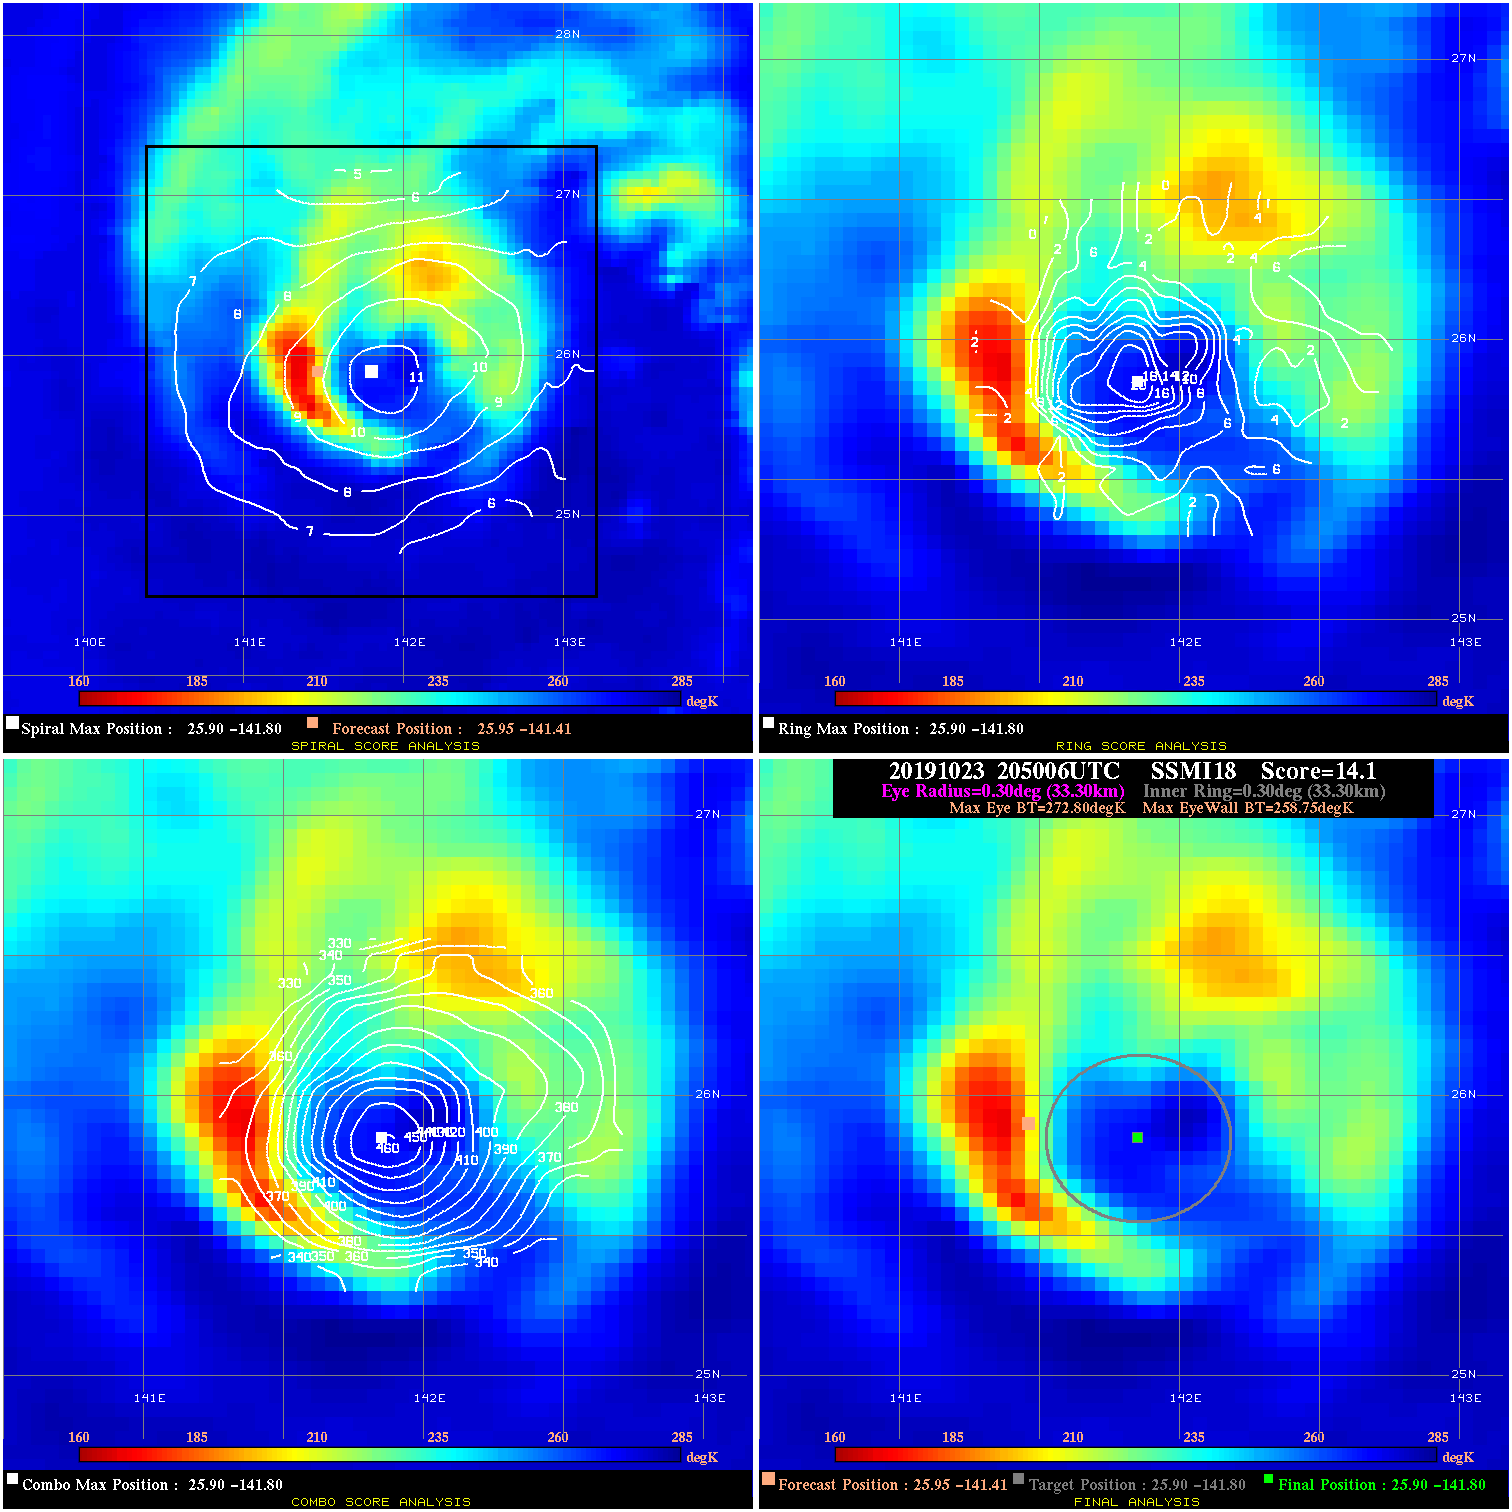
20191023 205006 14.1 N/A 68.5% 66.66 14.05 90.0 SSMI18 26.0 -141.4 25.9 -141.8 25.9 -141.8 Analysis Plot
20191024 032858 18.3 N/A 34.2% 55.55 18.31 90.0 AMSR2 27.6 -142.1 27.8 -142.3 27.8 -142.3 Analysis Plot
20191024 063441 16.9 N/A 61.6% 55.55 16.93 85.0 SSMI16 28.3 -142.4 28.4 -142.6 28.4 -142.6 Analysis Plot
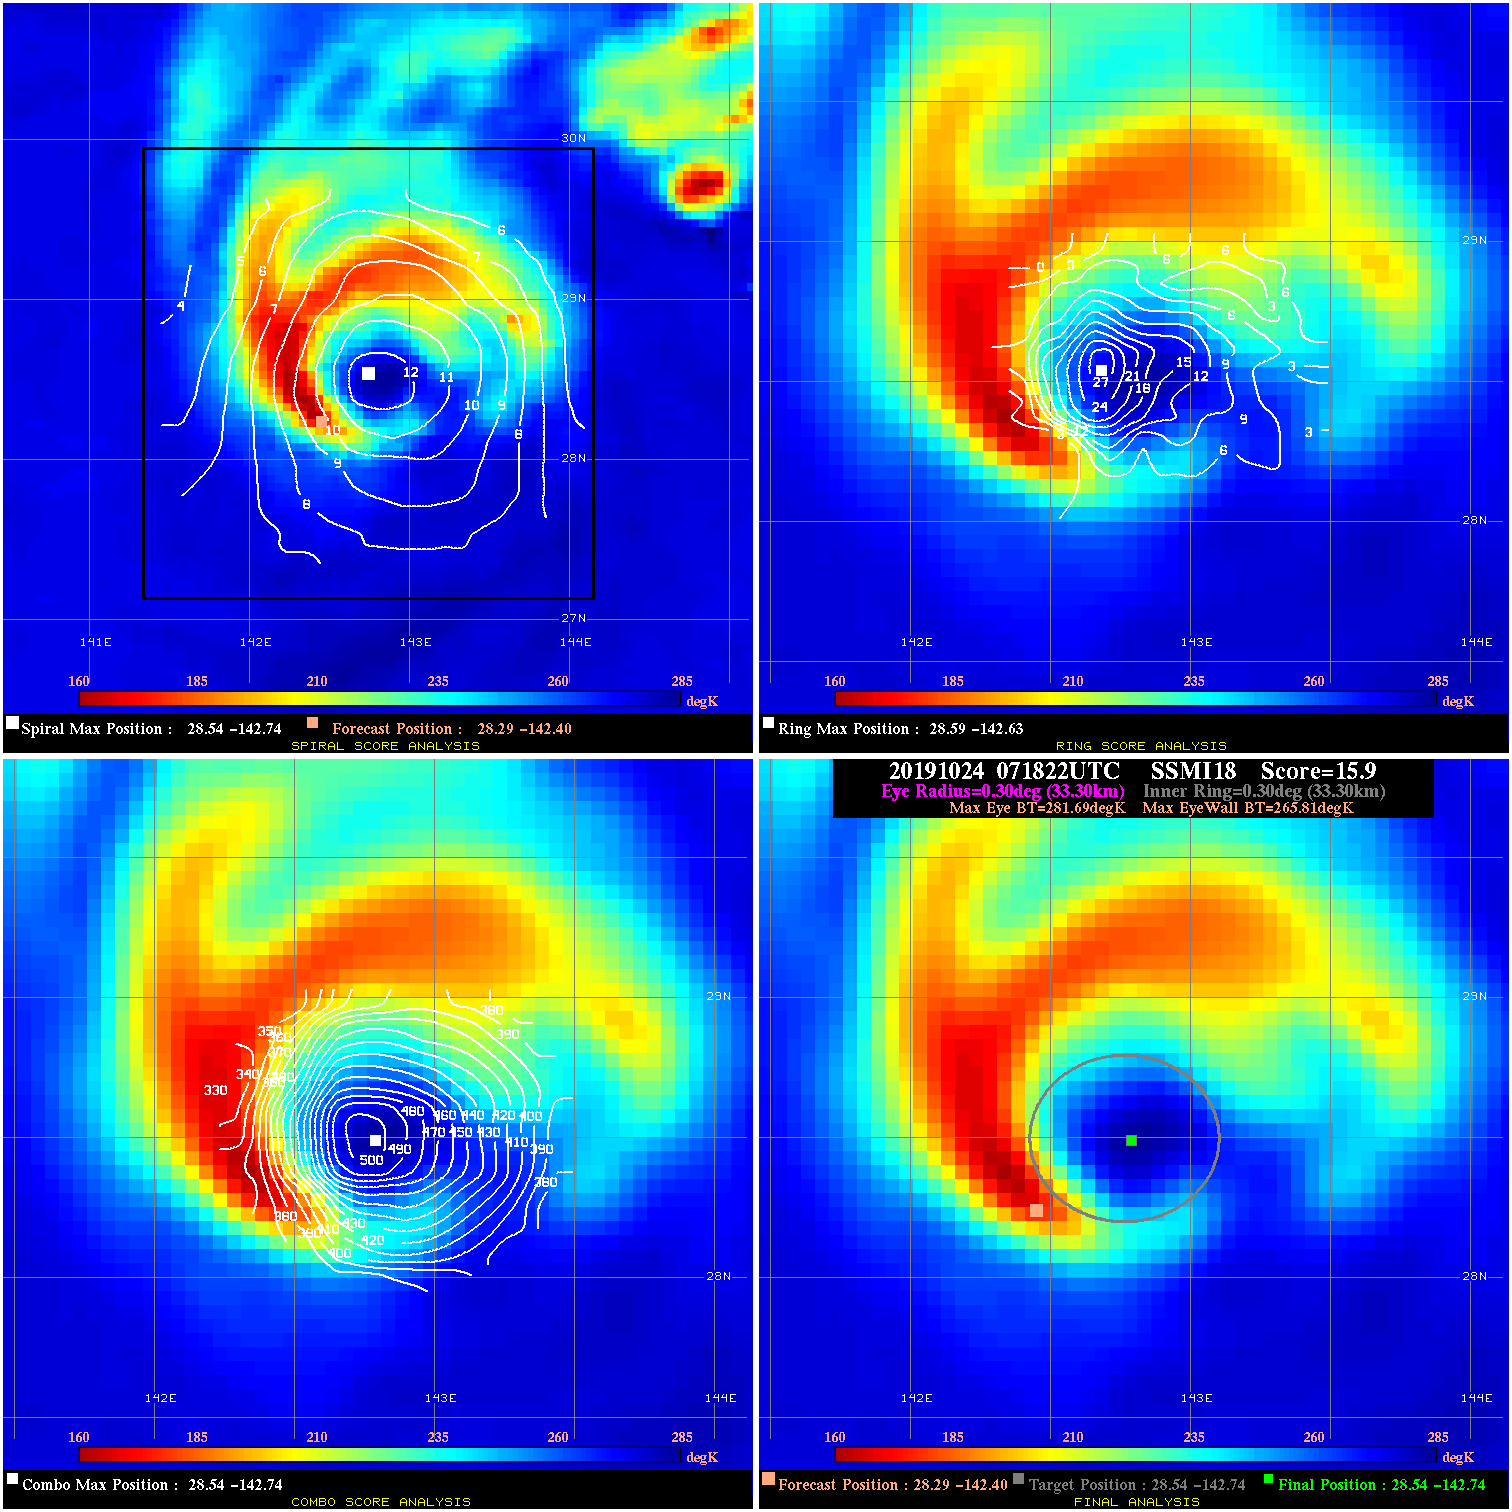
20191024 071822 15.9 N/A 23.3% 66.66 15.88 85.0 SSMI18 28.3 -142.4 28.5 -142.7 28.5 -142.7 Analysis Plot
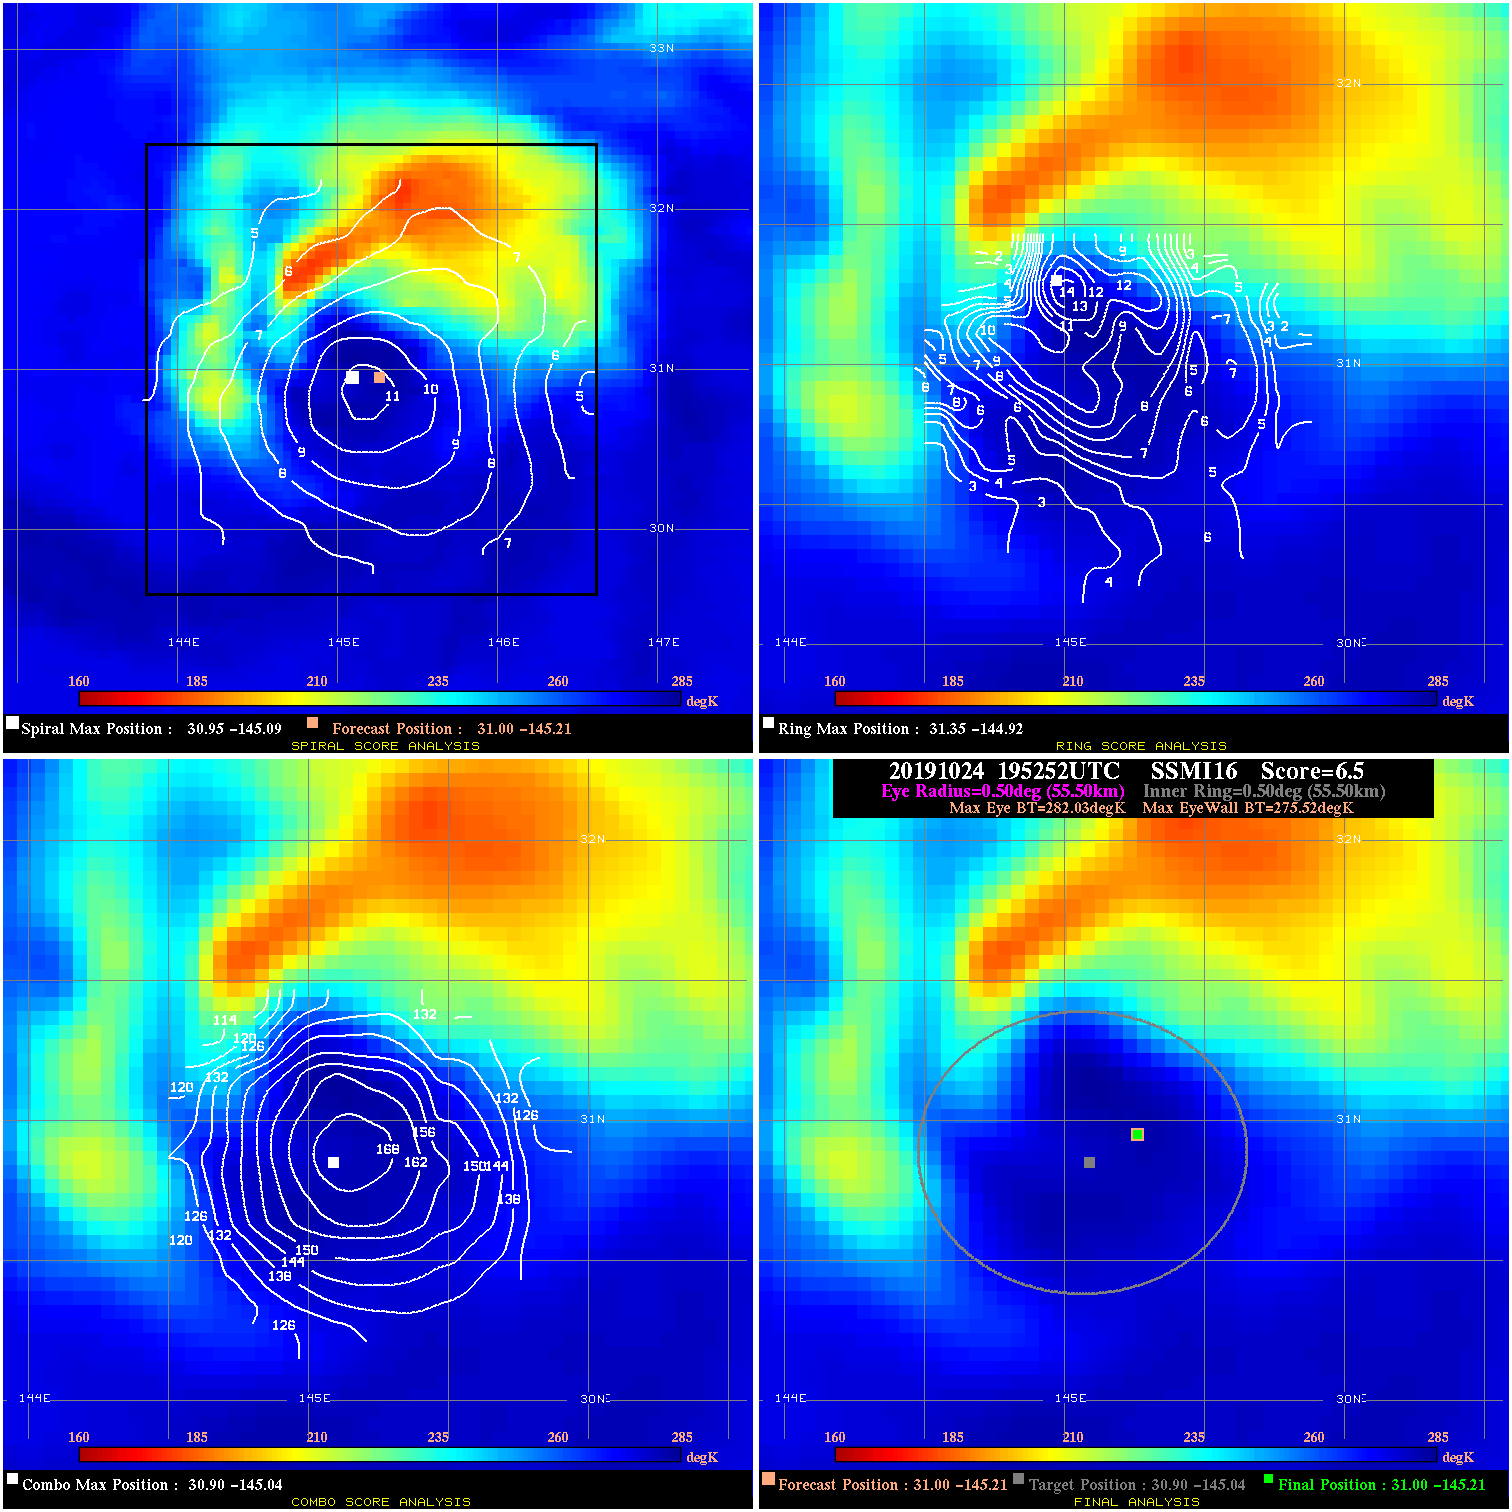
20191024 195252 6.5 N/A N/A 111.10 6.51 80.0 SSMI16 31.0 -145.2 31.0 -145.2 30.9 -145.0 Analysis Plot
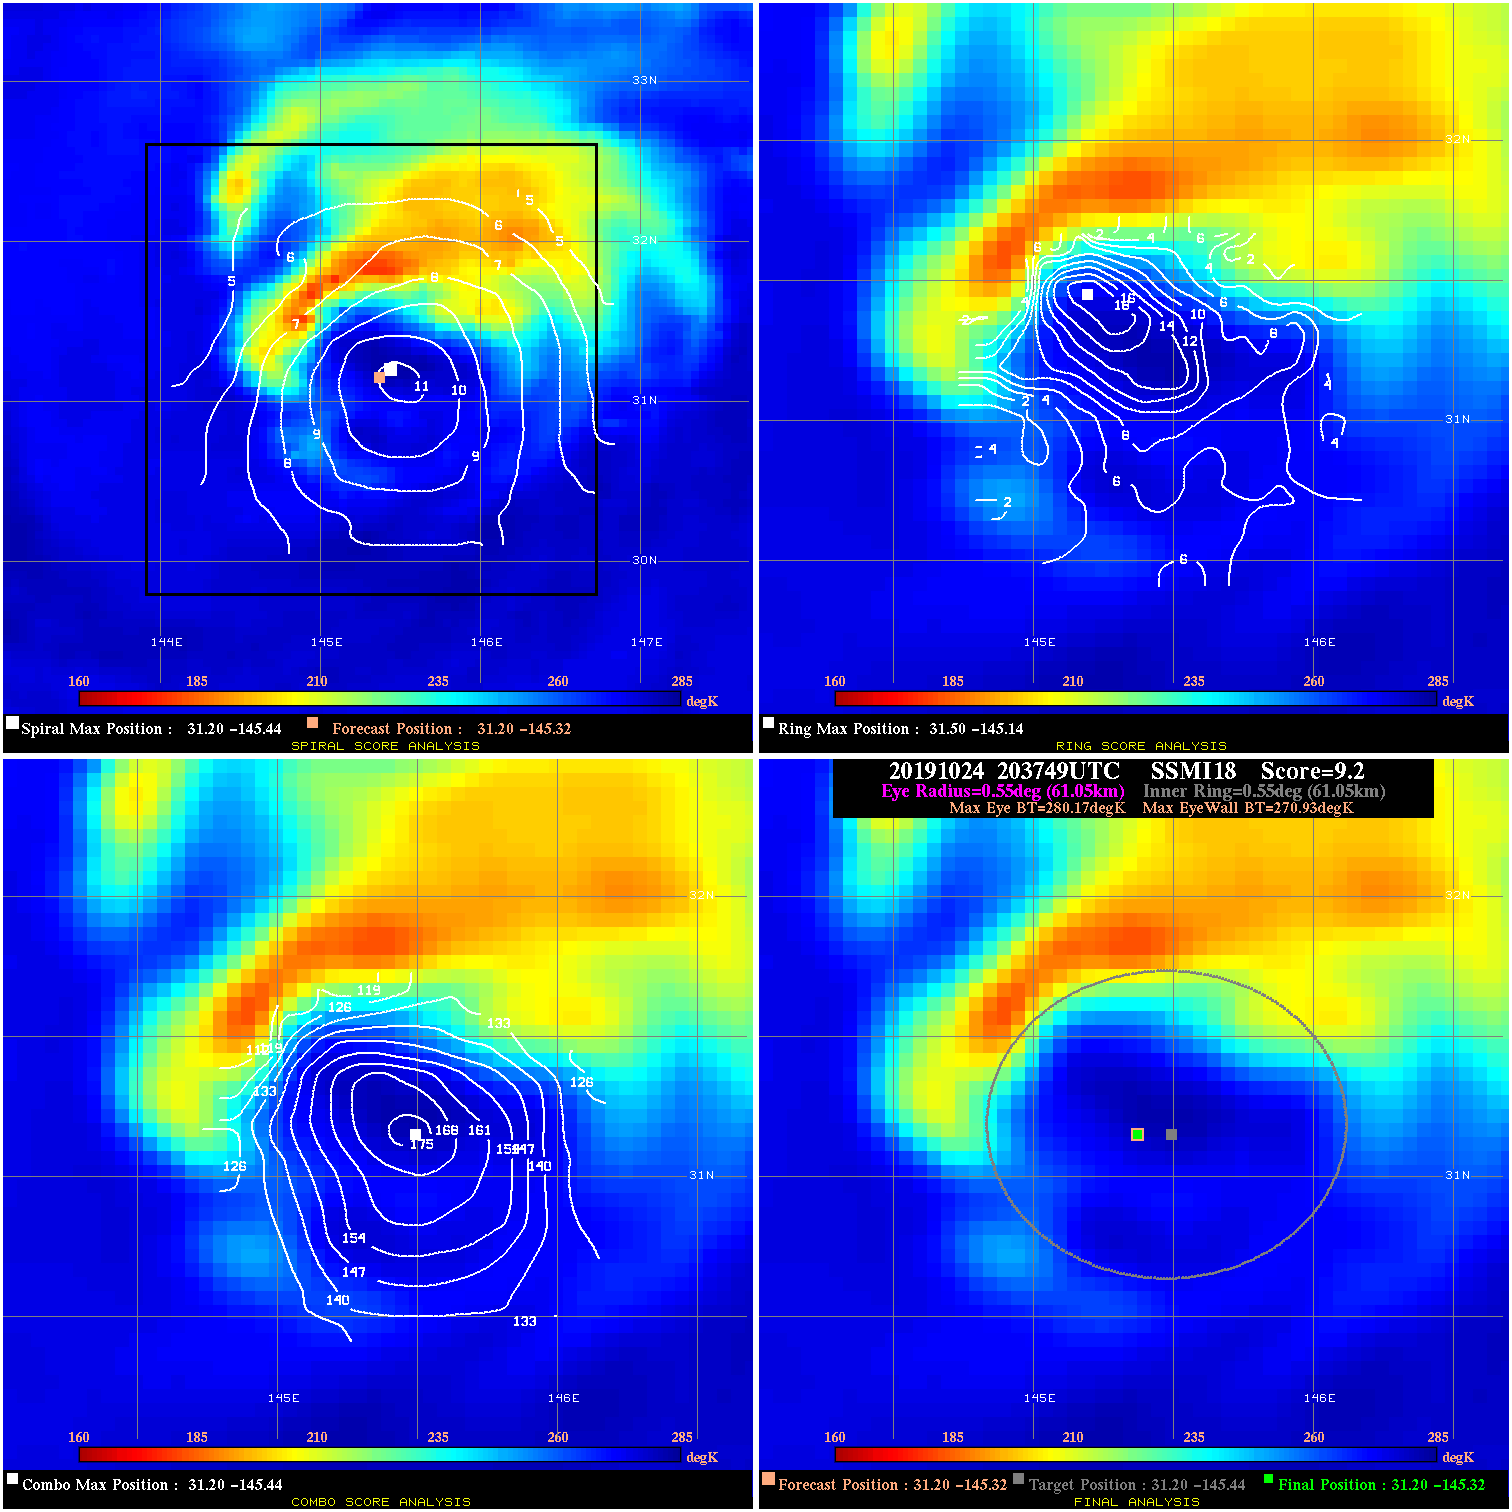
20191024 203749 9.2 N/A 42.5% 122.21 9.24 80.0 SSMI18 31.2 -145.3 31.2 -145.3 31.2 -145.4 Analysis Plot
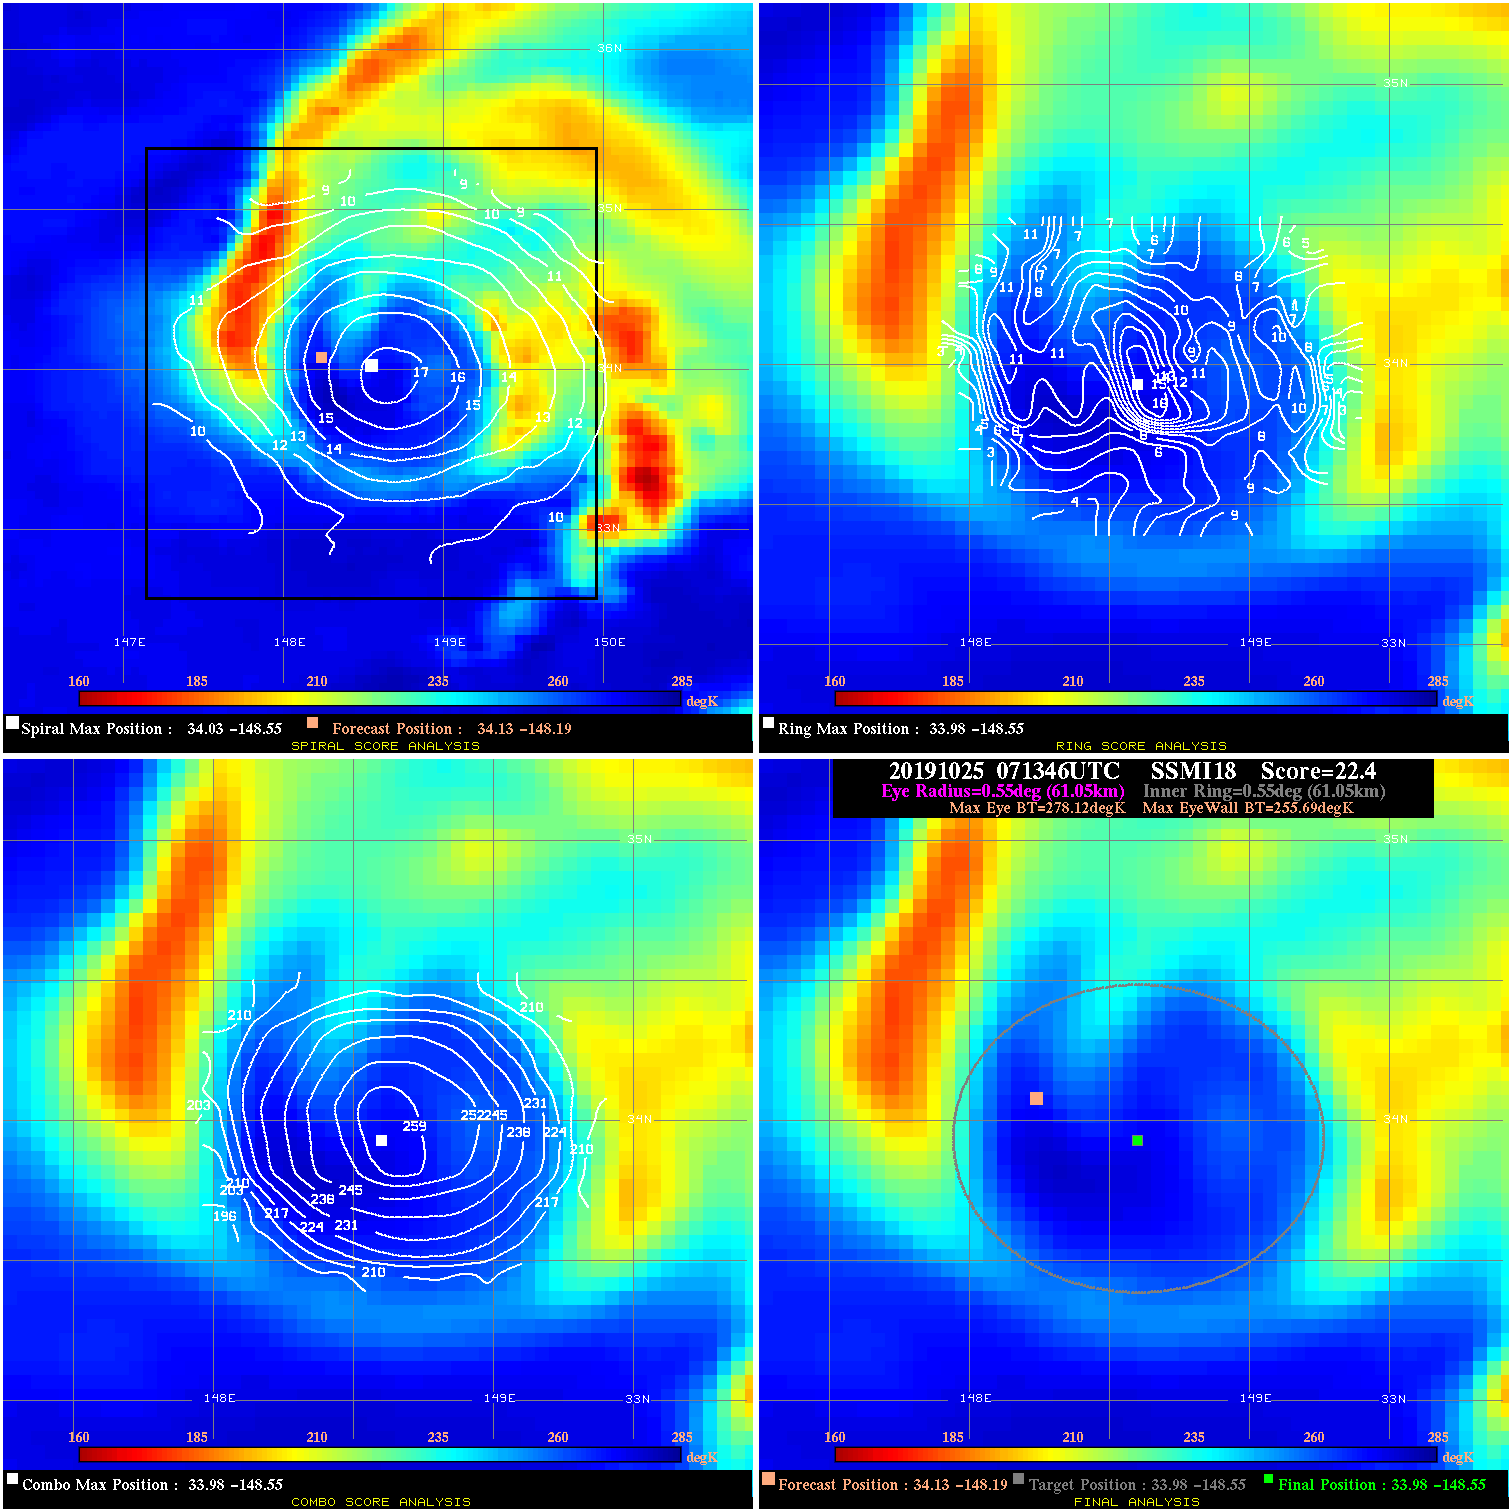
20191025 071346 22.4 >65 kts 45.2% 122.21 22.43 65.0 SSMI18 34.1 -148.2 34.0 -148.6 34.0 -148.6 Analysis Plot
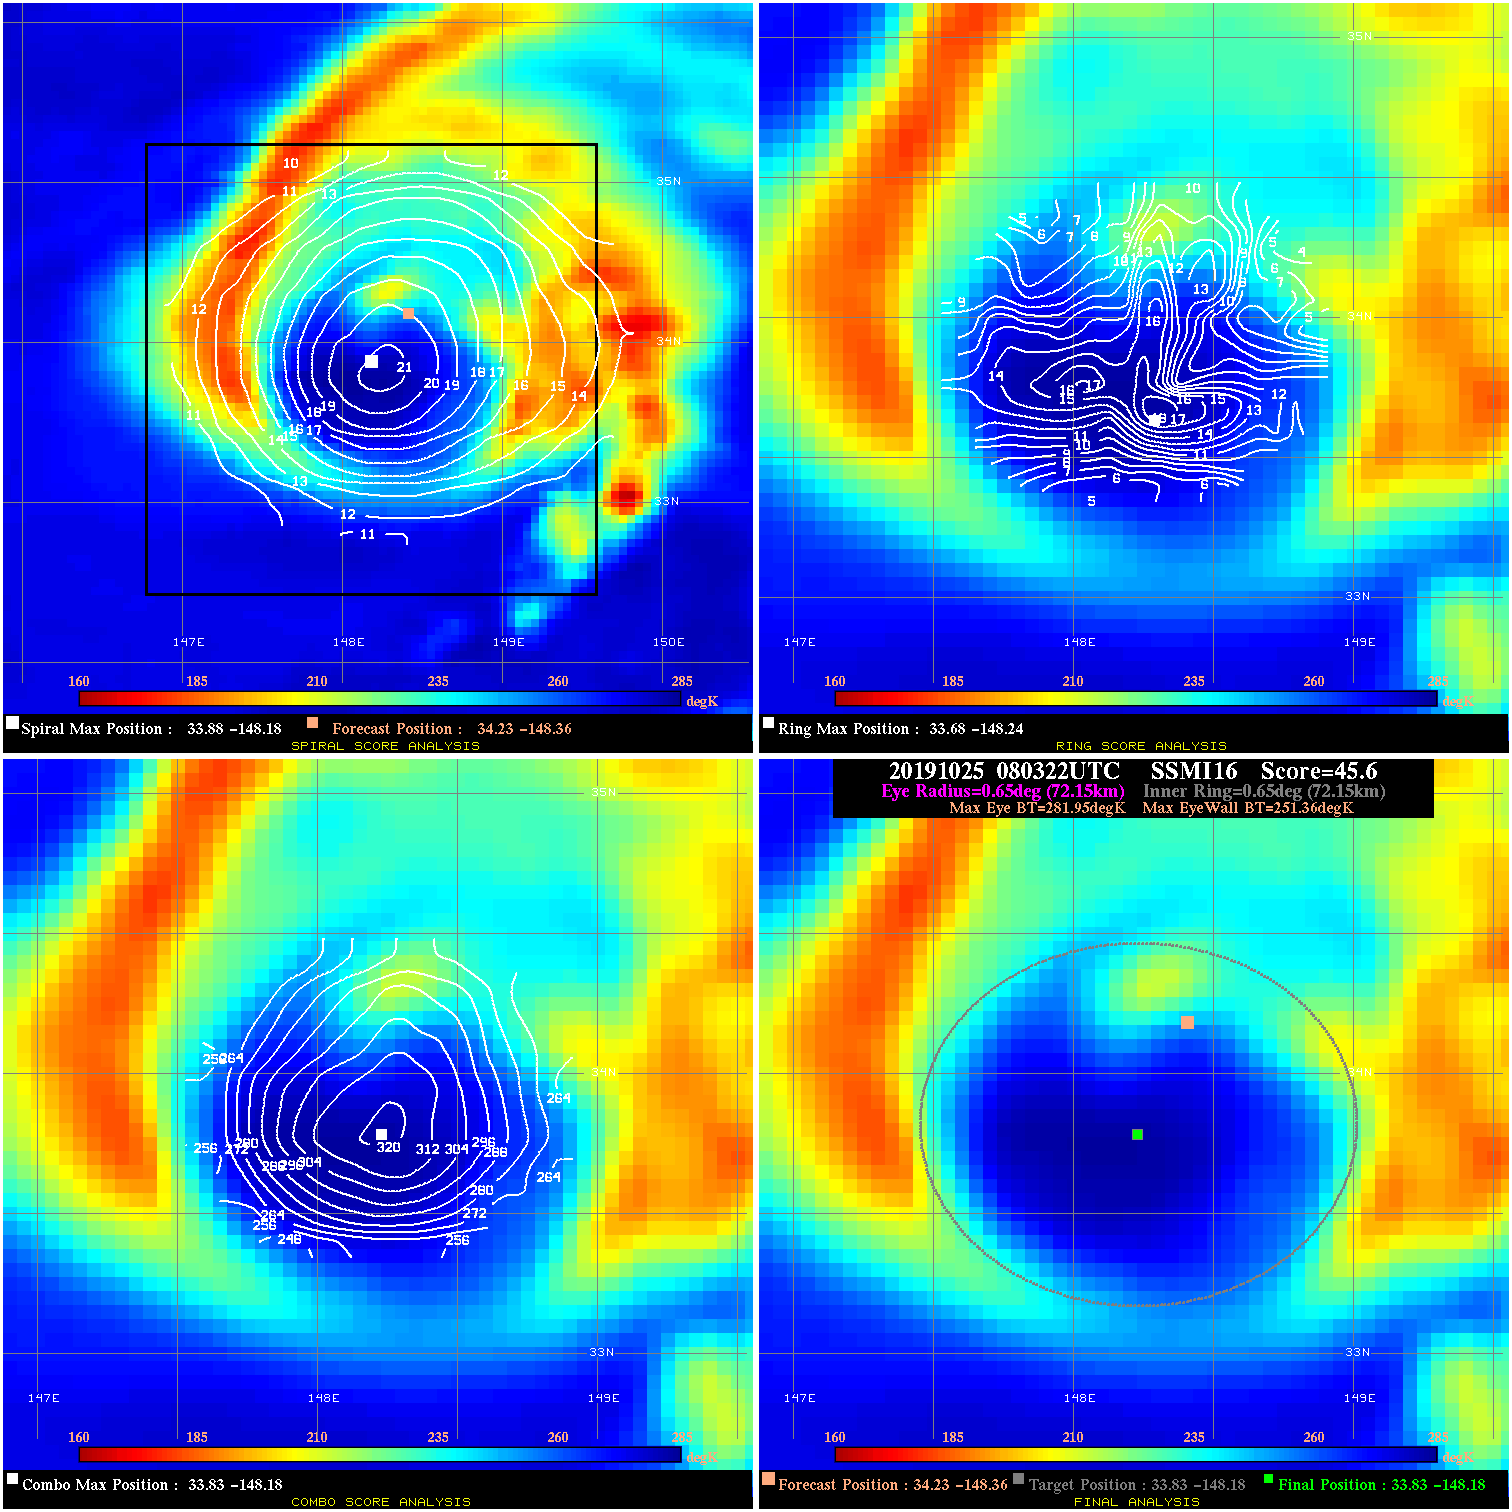
20191025 080322 45.6 >65 kts 100.0% 144.43 30.59 65.0 SSMI16 34.2 -148.4 33.8 -148.2 33.8 -148.2 Analysis Plot
|
|
Legend: - Date/Time are determined from PMW imagery at Forecast (initial guess) Lat/Lon position. - Positive/Negative Latitude = North/South Hemisphere; Longitude = Western/Eastern Hemisphere. - "Ring Diam" value indicates the estimated surface eyewall diameter in km (the MI eyewall edge diameter minus 10 km). - "Ring Pct" is the percentage of the "ring" (eyewall inner boundary) that is 1) colder than the "hot spot" (warmest eye pixel) in the eye by 20K, or 2) the percentage that is a) colder than 232K and b) colder than the "hot spot" by 10K, whichever is greater. - Values are red if Ring % <= 65, yellow/brown if Ring % <= 85 and green if Ring % > 85. - "Tb diff" is the difference between the "hot spot" (warmest eye pixel) and the warmest pixel on the eyewall. - Intensity score are listed as negative, and not used, when the JTWC or NHC estimated Vmax is <55 kts in order to rule out weak but highly symmetric TCs. - Error messages in intensity scores: -920 is used when the hottest pixel in the eye is <200K, to prevent false positives; -930 means <85% of eyewall has observations/data. |