Tropical Depression 20N_02
|
Passive Microwave (PMW) Intensity Information Hurricane Intensity Estimation (HIE) Algorithm Version 9.0 |
Overpass Inten Ring Ring Wind Forecast Final Target
Date Time Score Meaning Pct Diam BTdiff Est Sat Lat Lon Lat Lon Lat Lon
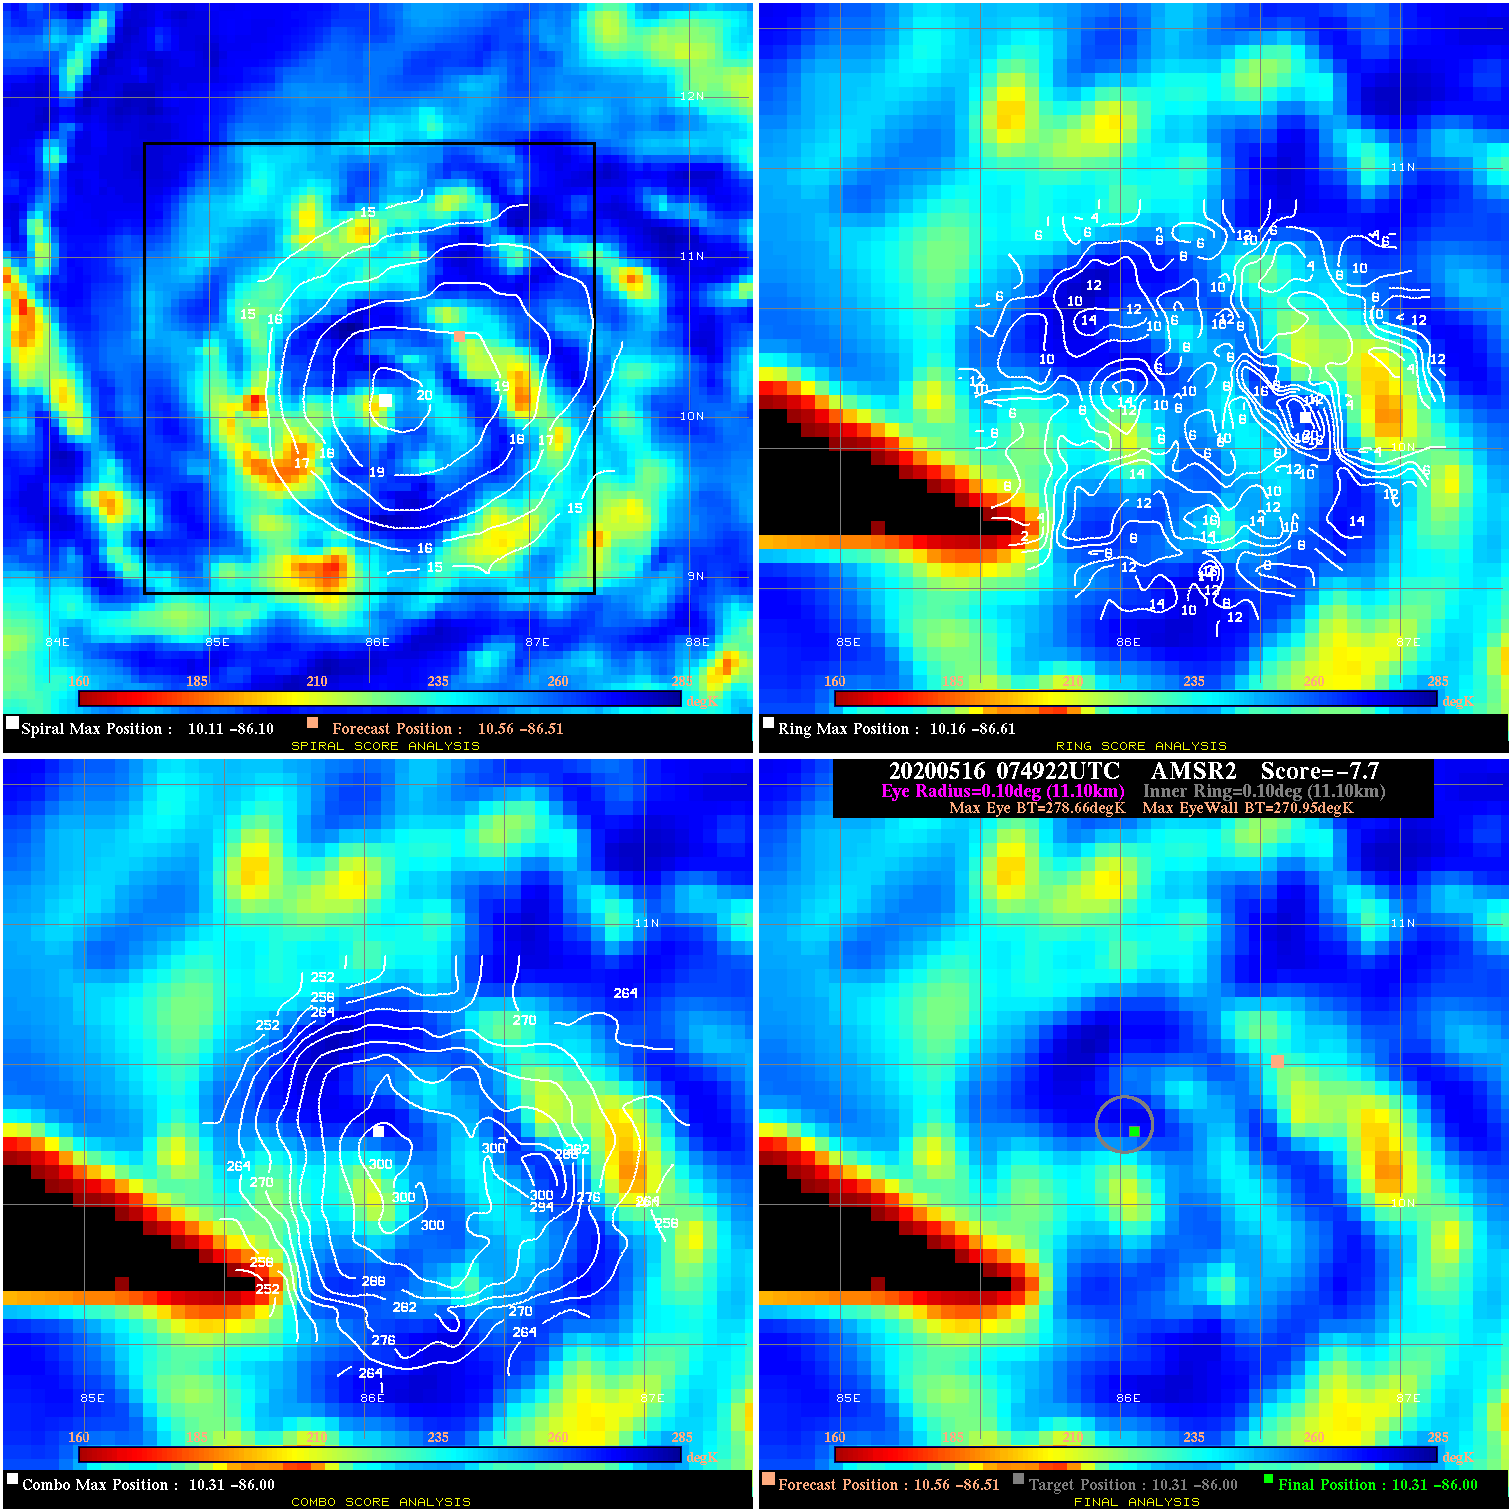
20200516 074922 -7.7 N/A 23.3% 22.22 7.71 25.0 AMSR2 10.6 -86.5 10.3 -86.0 10.3 -86.0 Analysis Plot
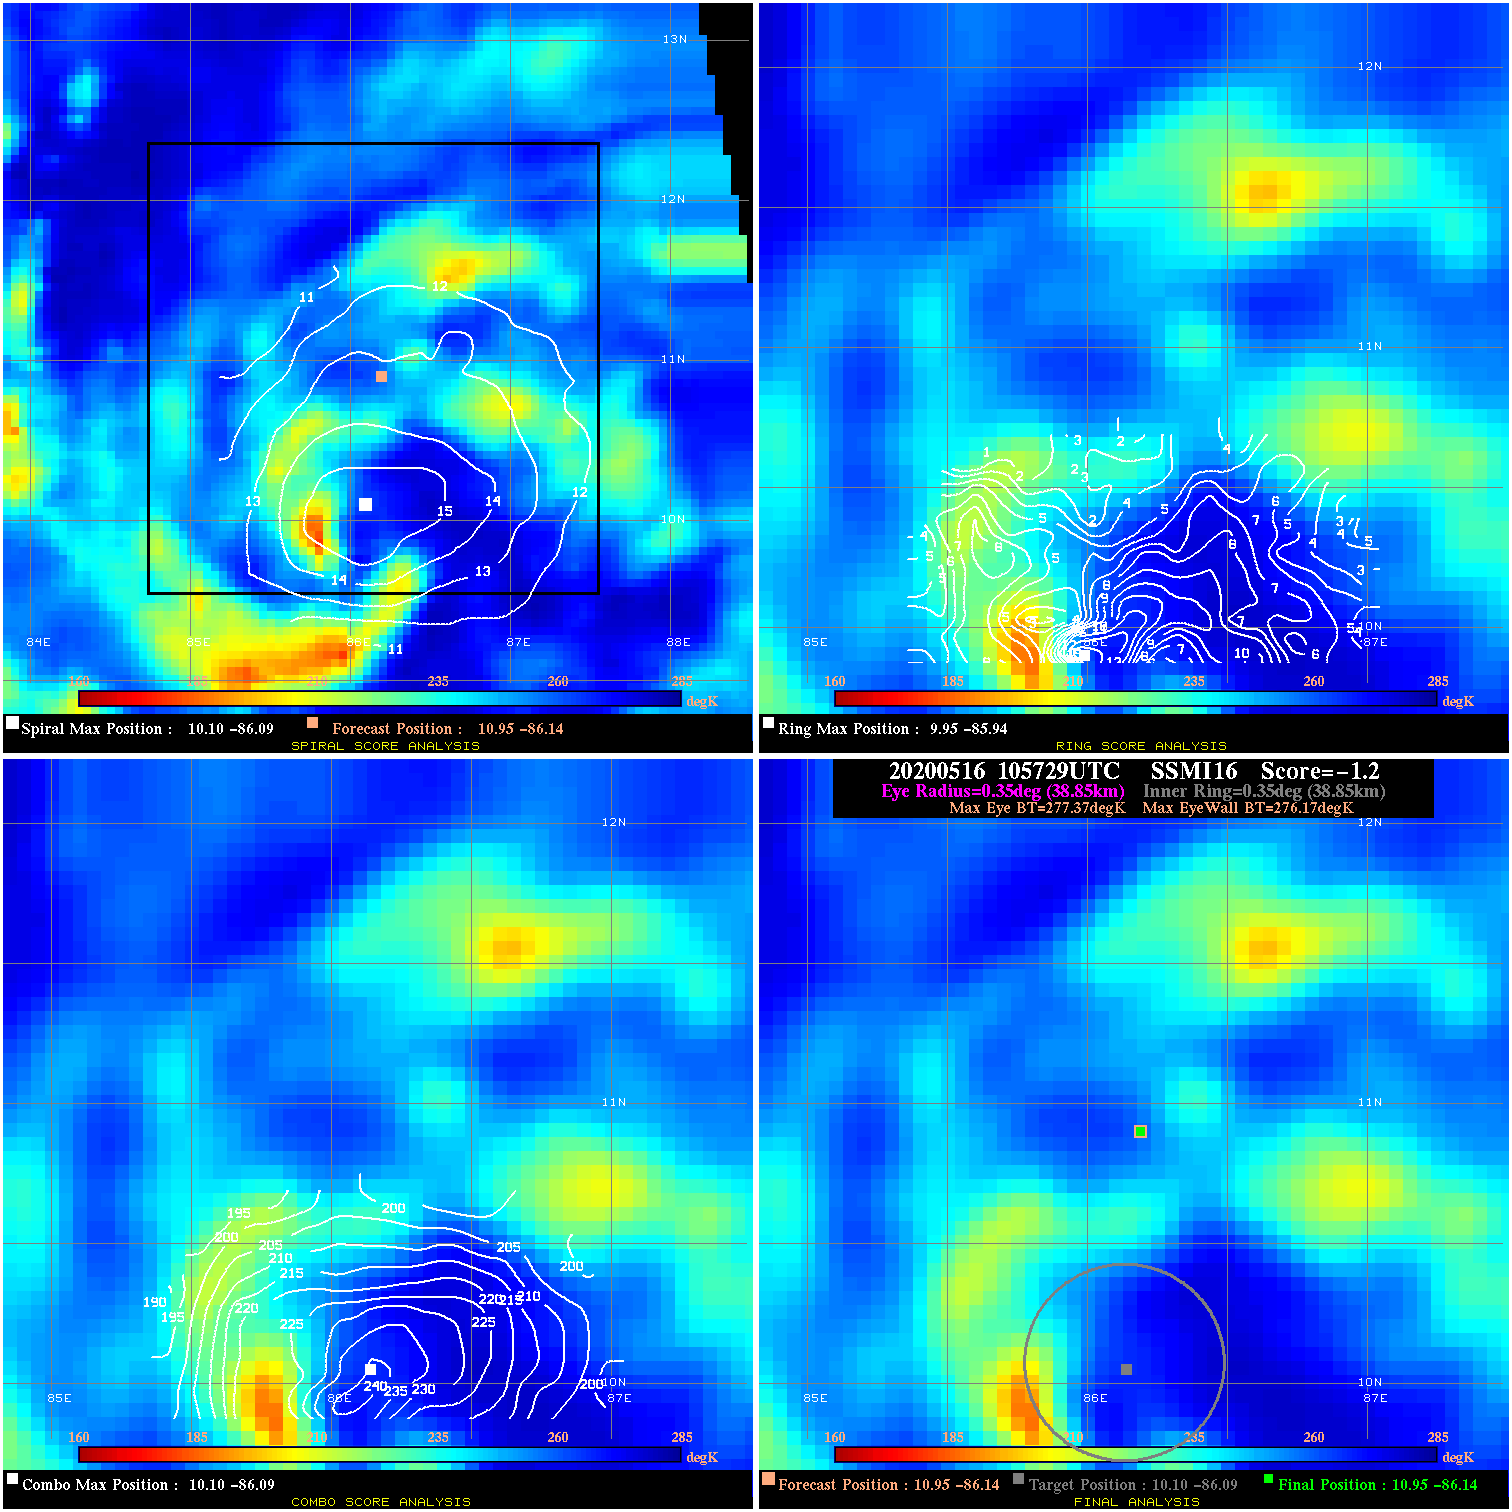
20200516 105729 -1.2 N/A 28.8% 77.77 1.20 25.0 SSMI16 10.9 -86.1 10.9 -86.1 10.1 -86.1 Analysis Plot
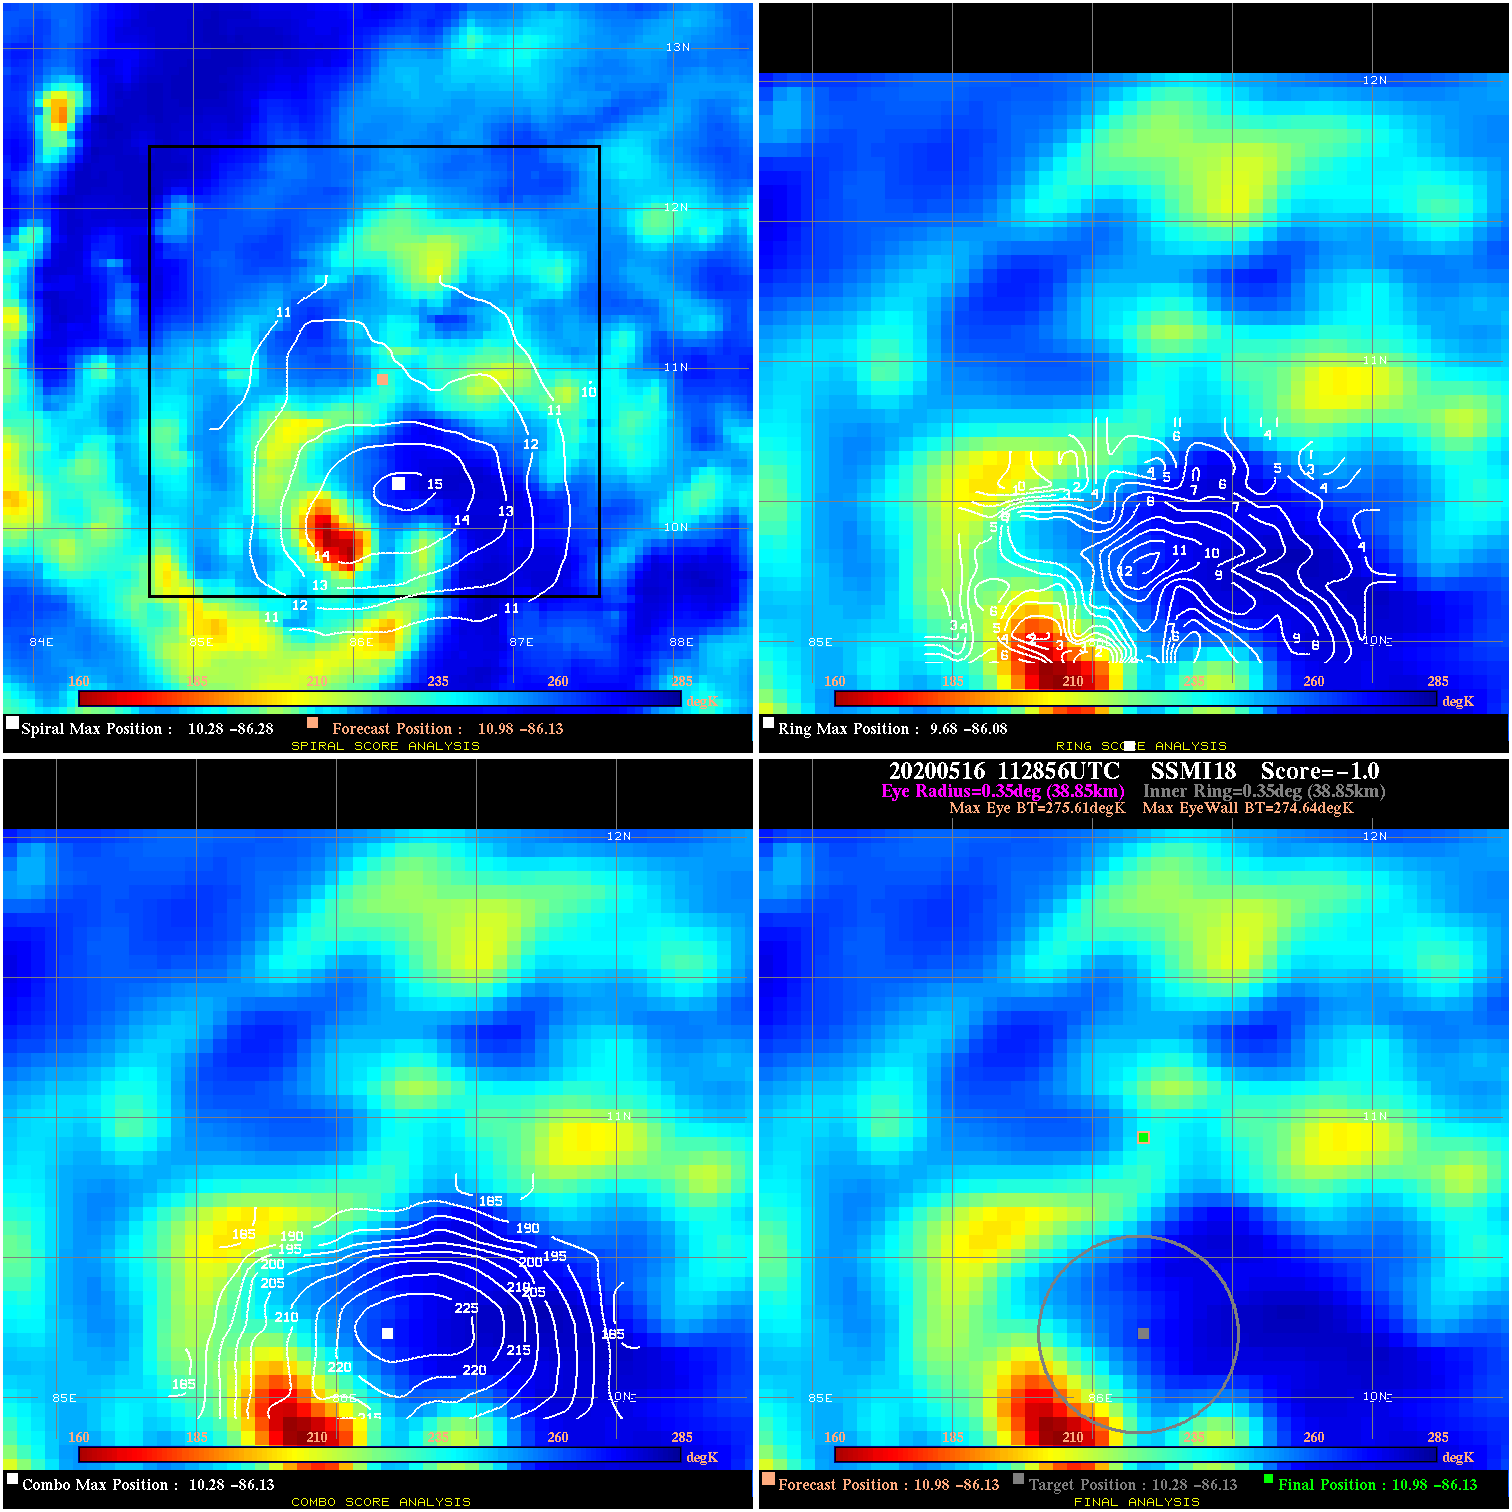
20200516 112856 -1.0 N/A 37.0% 77.77 .97 25.0 SSMI18 11.0 -86.1 11.0 -86.1 10.3 -86.1 Analysis Plot
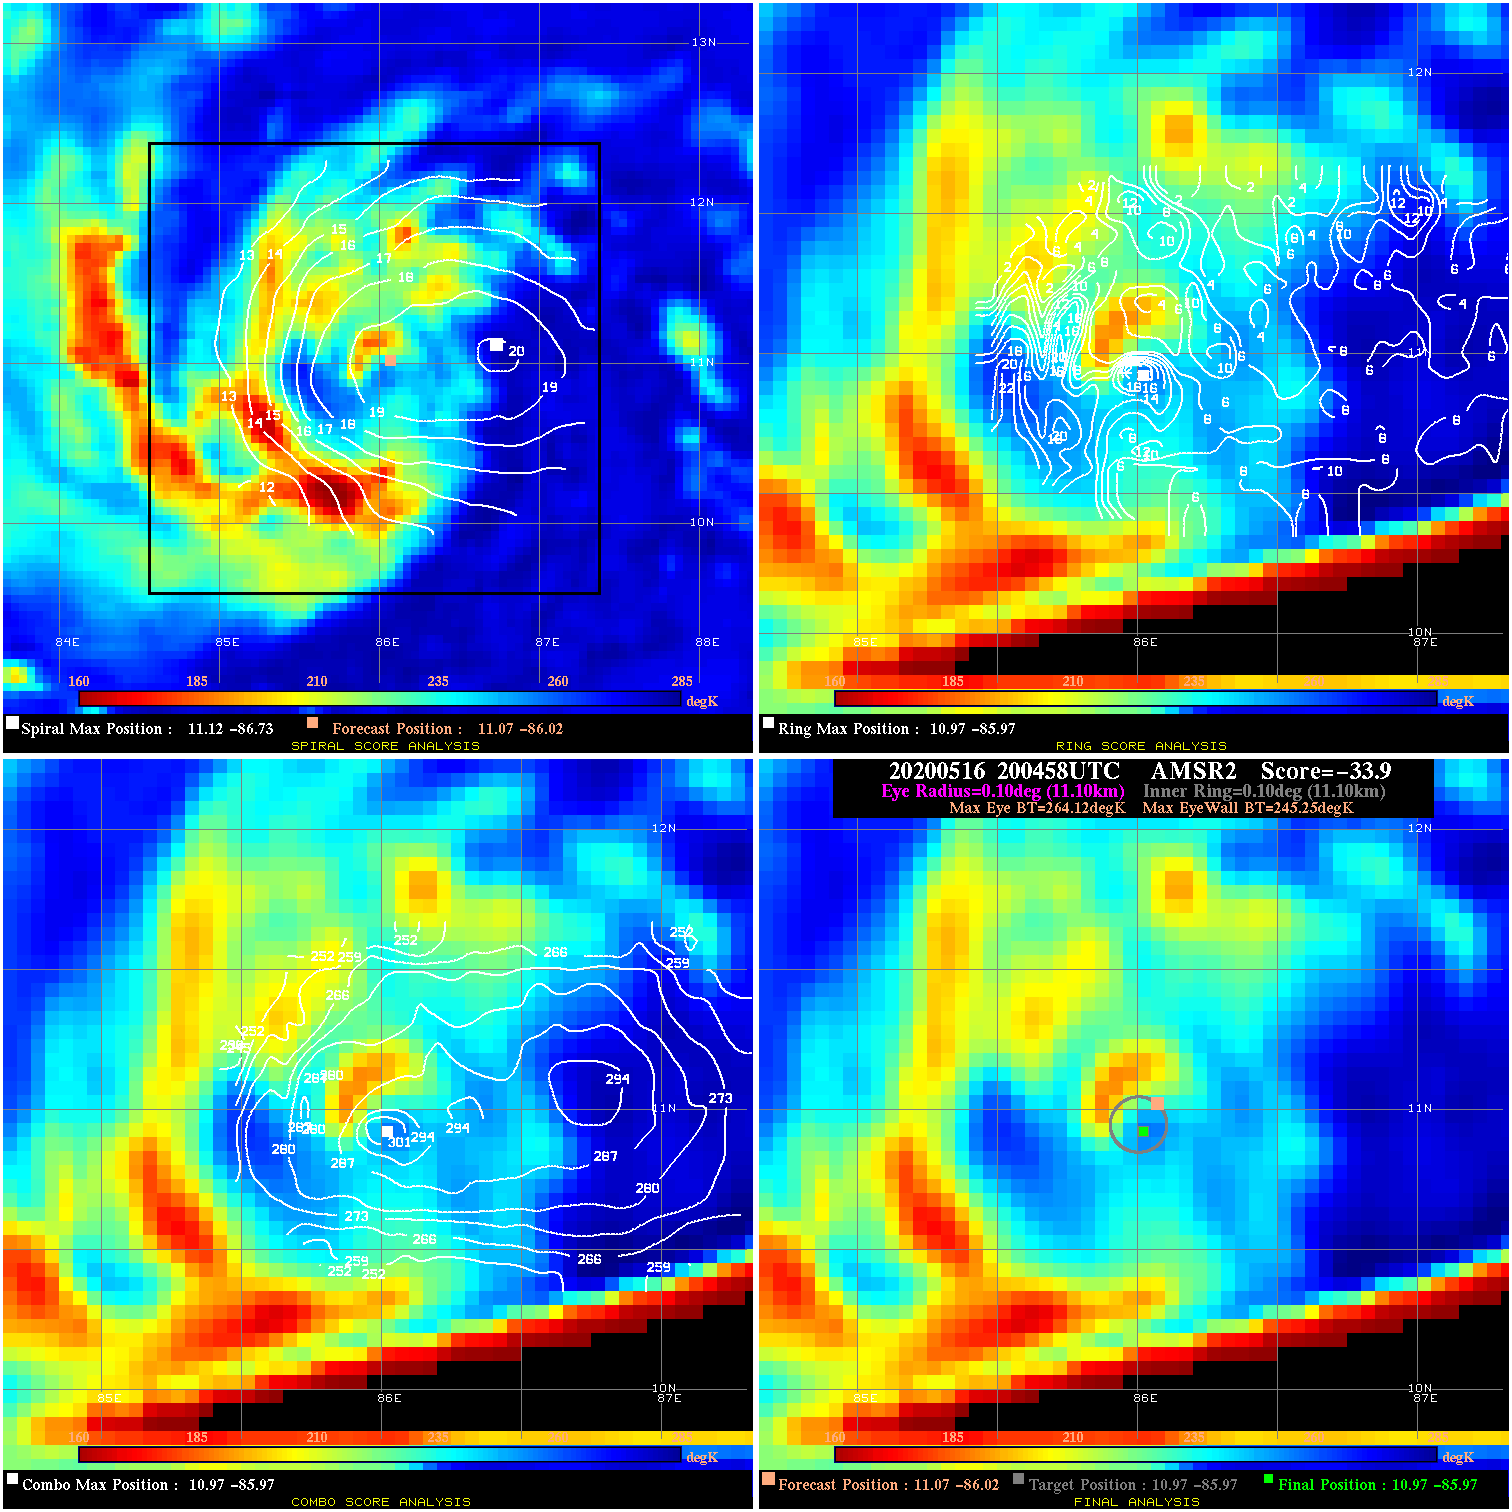
20200516 200458 -33.9 N/A 94.5% 22.22 18.87 35.0 AMSR2 11.1 -86.0 11.0 -86.0 11.0 -86.0 Analysis Plot
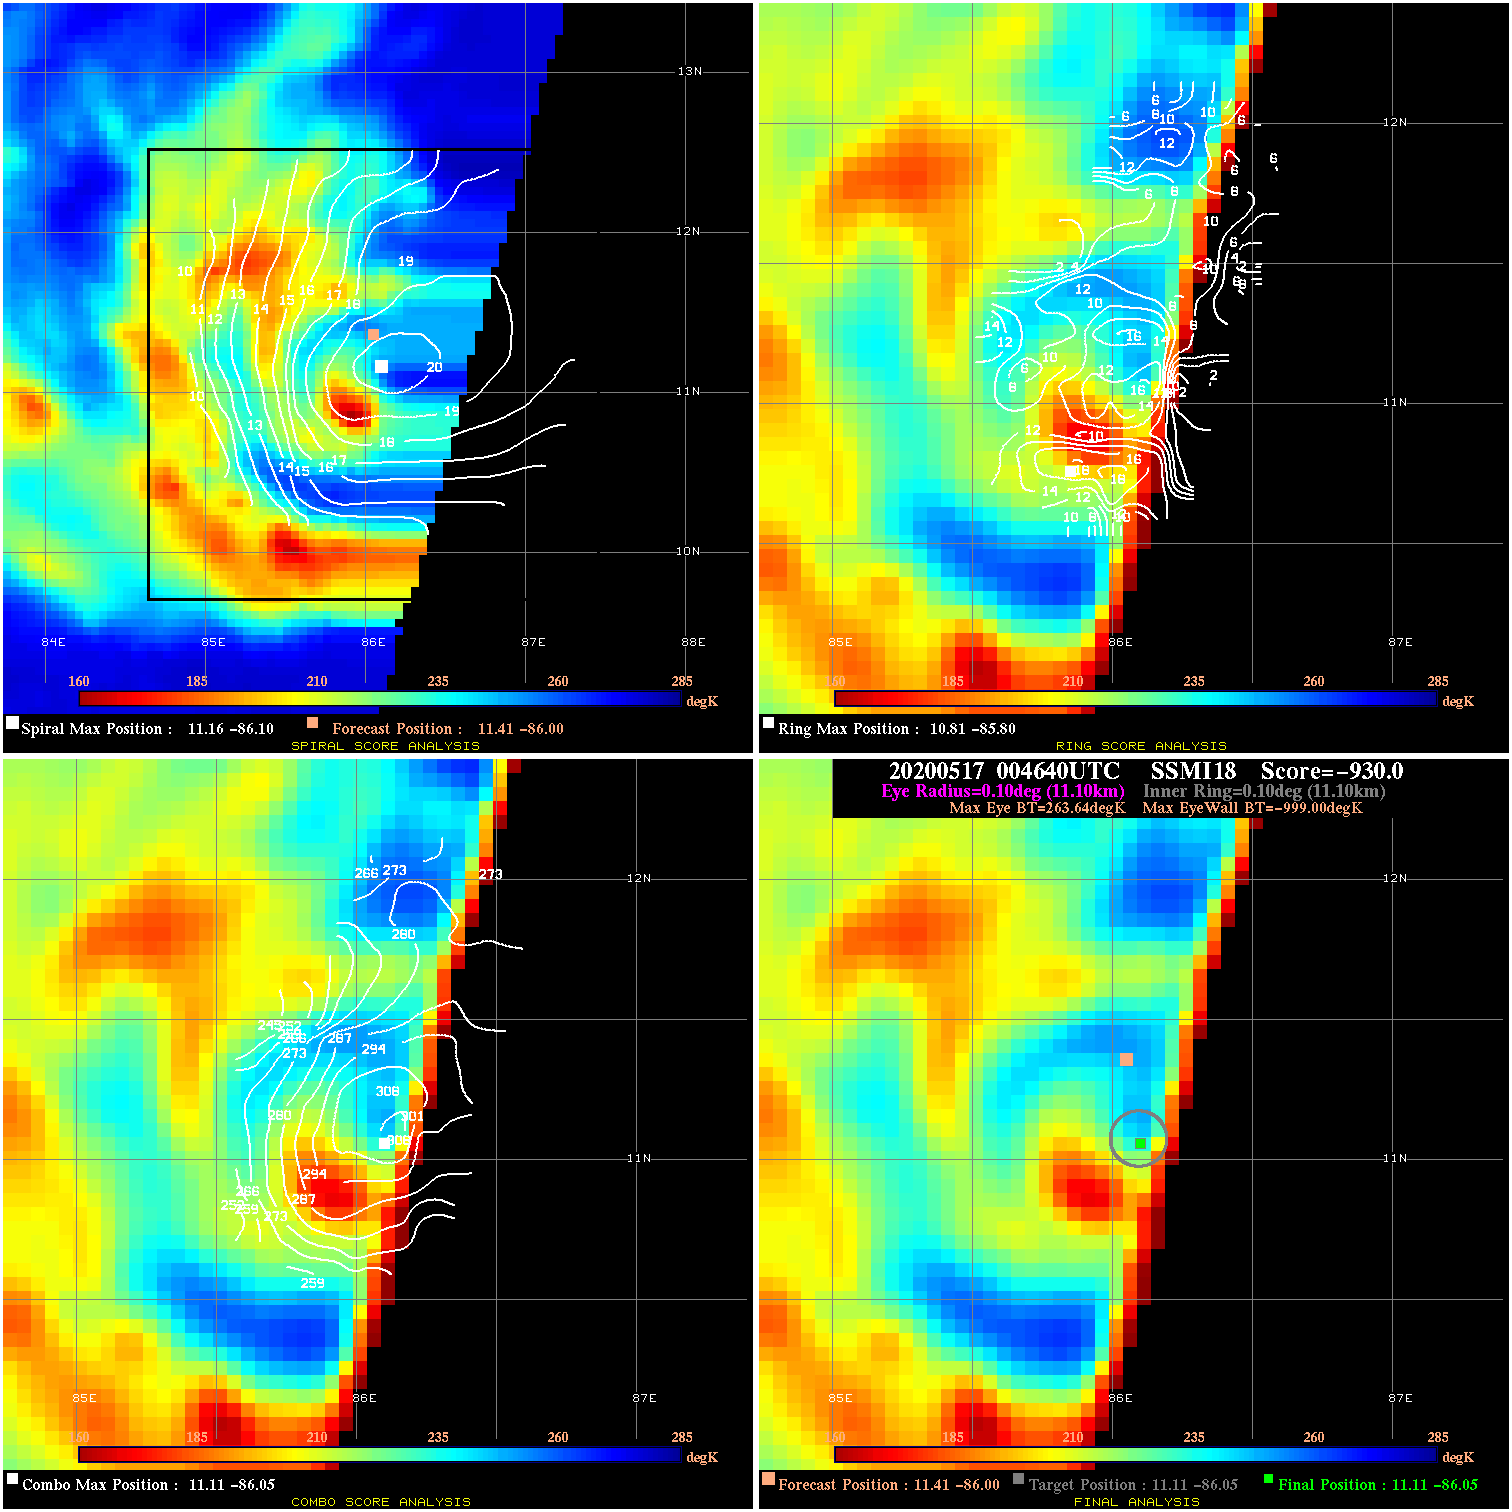
20200517 004640 -930.0 N/A N/A N/A 0.00 35.0 SSMI18 11.4 -86.0 11.1 -86.1 11.1 -86.1 Analysis Plot
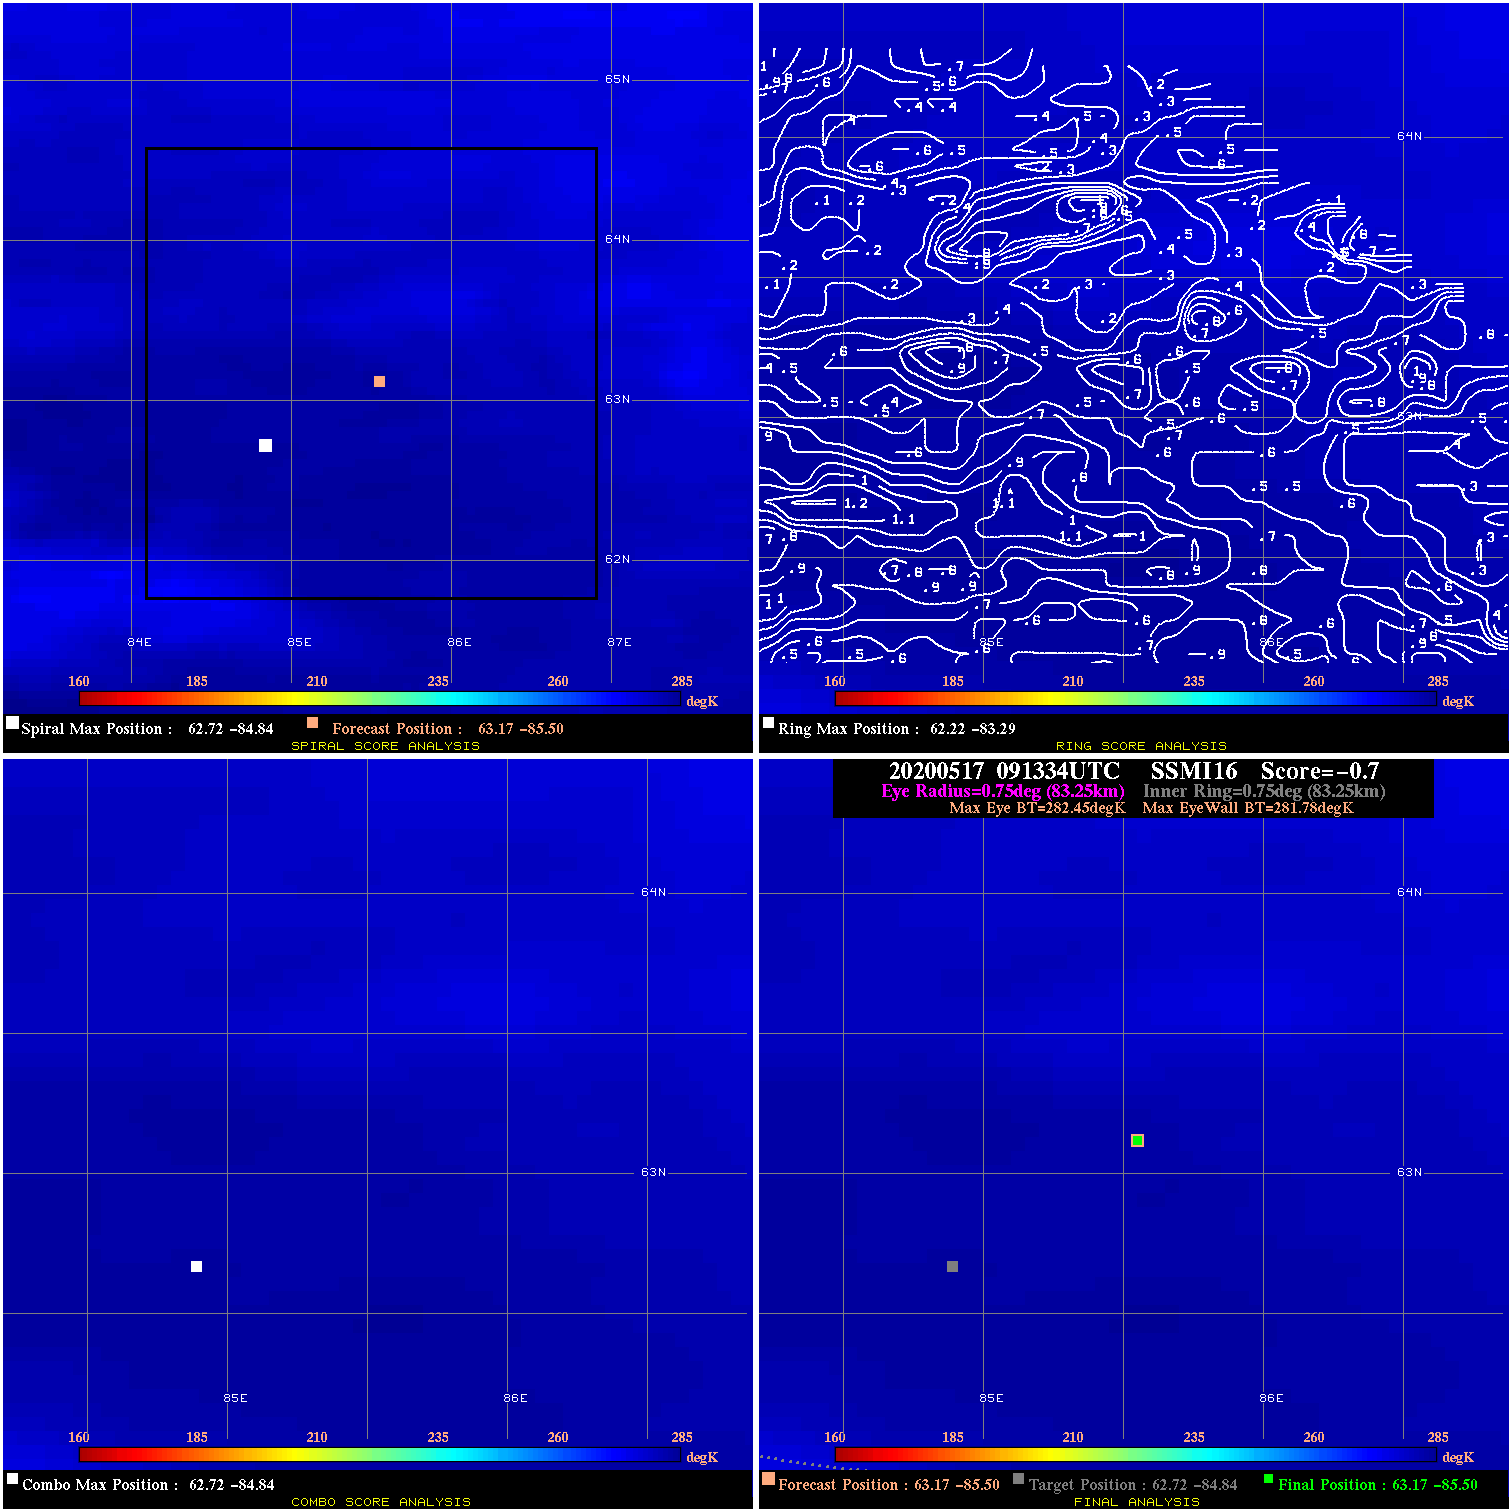
20200517 091334 -0.7 N/A N/A 166.65 .67 45.0 SSMI16 63.2 -85.5 63.2 -85.5 62.7 -84.8 Analysis Plot
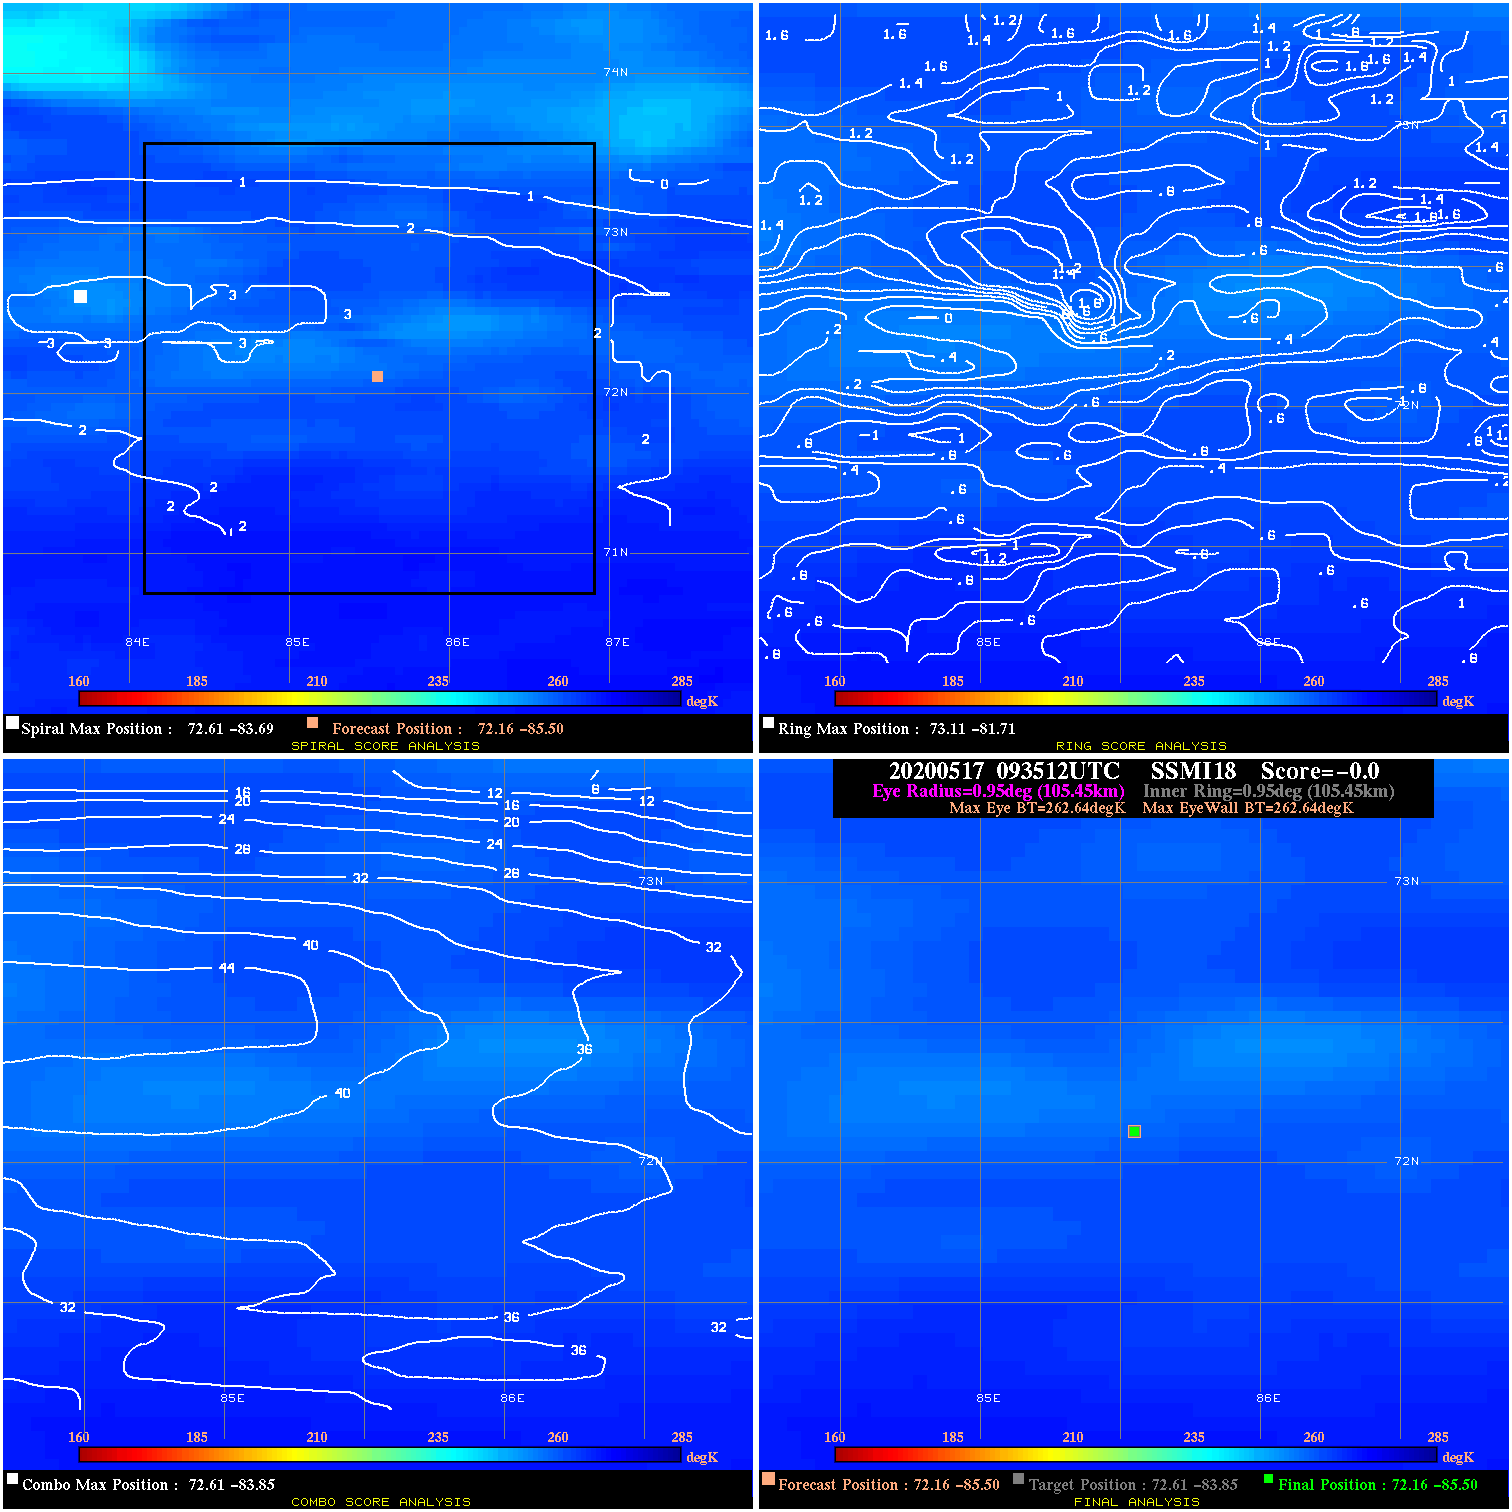
20200517 093512 N/A N/A N/A N/A N/A 45.0 SSMI18 72.2 -85.5 72.2 -85.5 72.6 -83.8 Analysis Plot
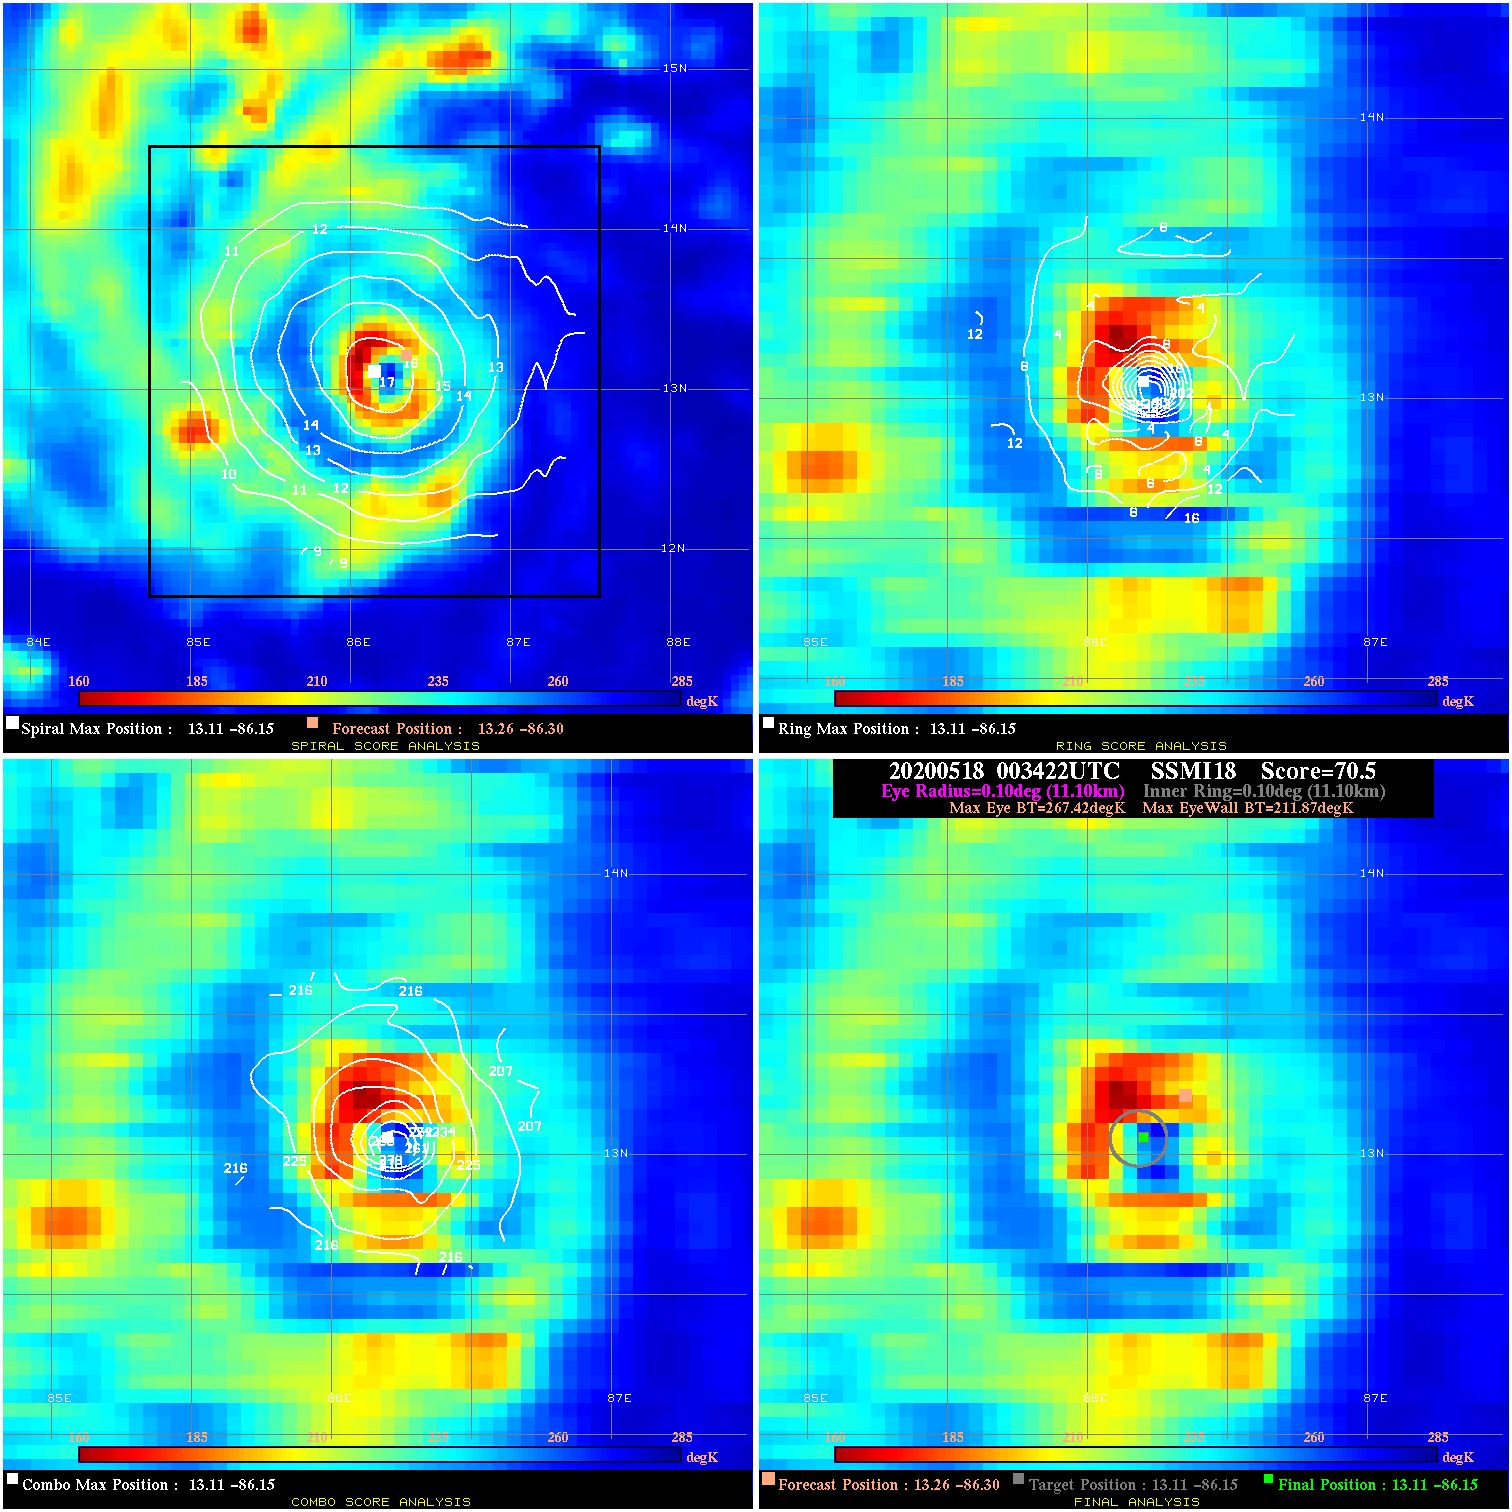
20200518 003422 70.5 >85 kts 100.0% 22.22 55.55 80.0 SSMI18 13.3 -86.3 13.1 -86.2 13.1 -86.2 Analysis Plot
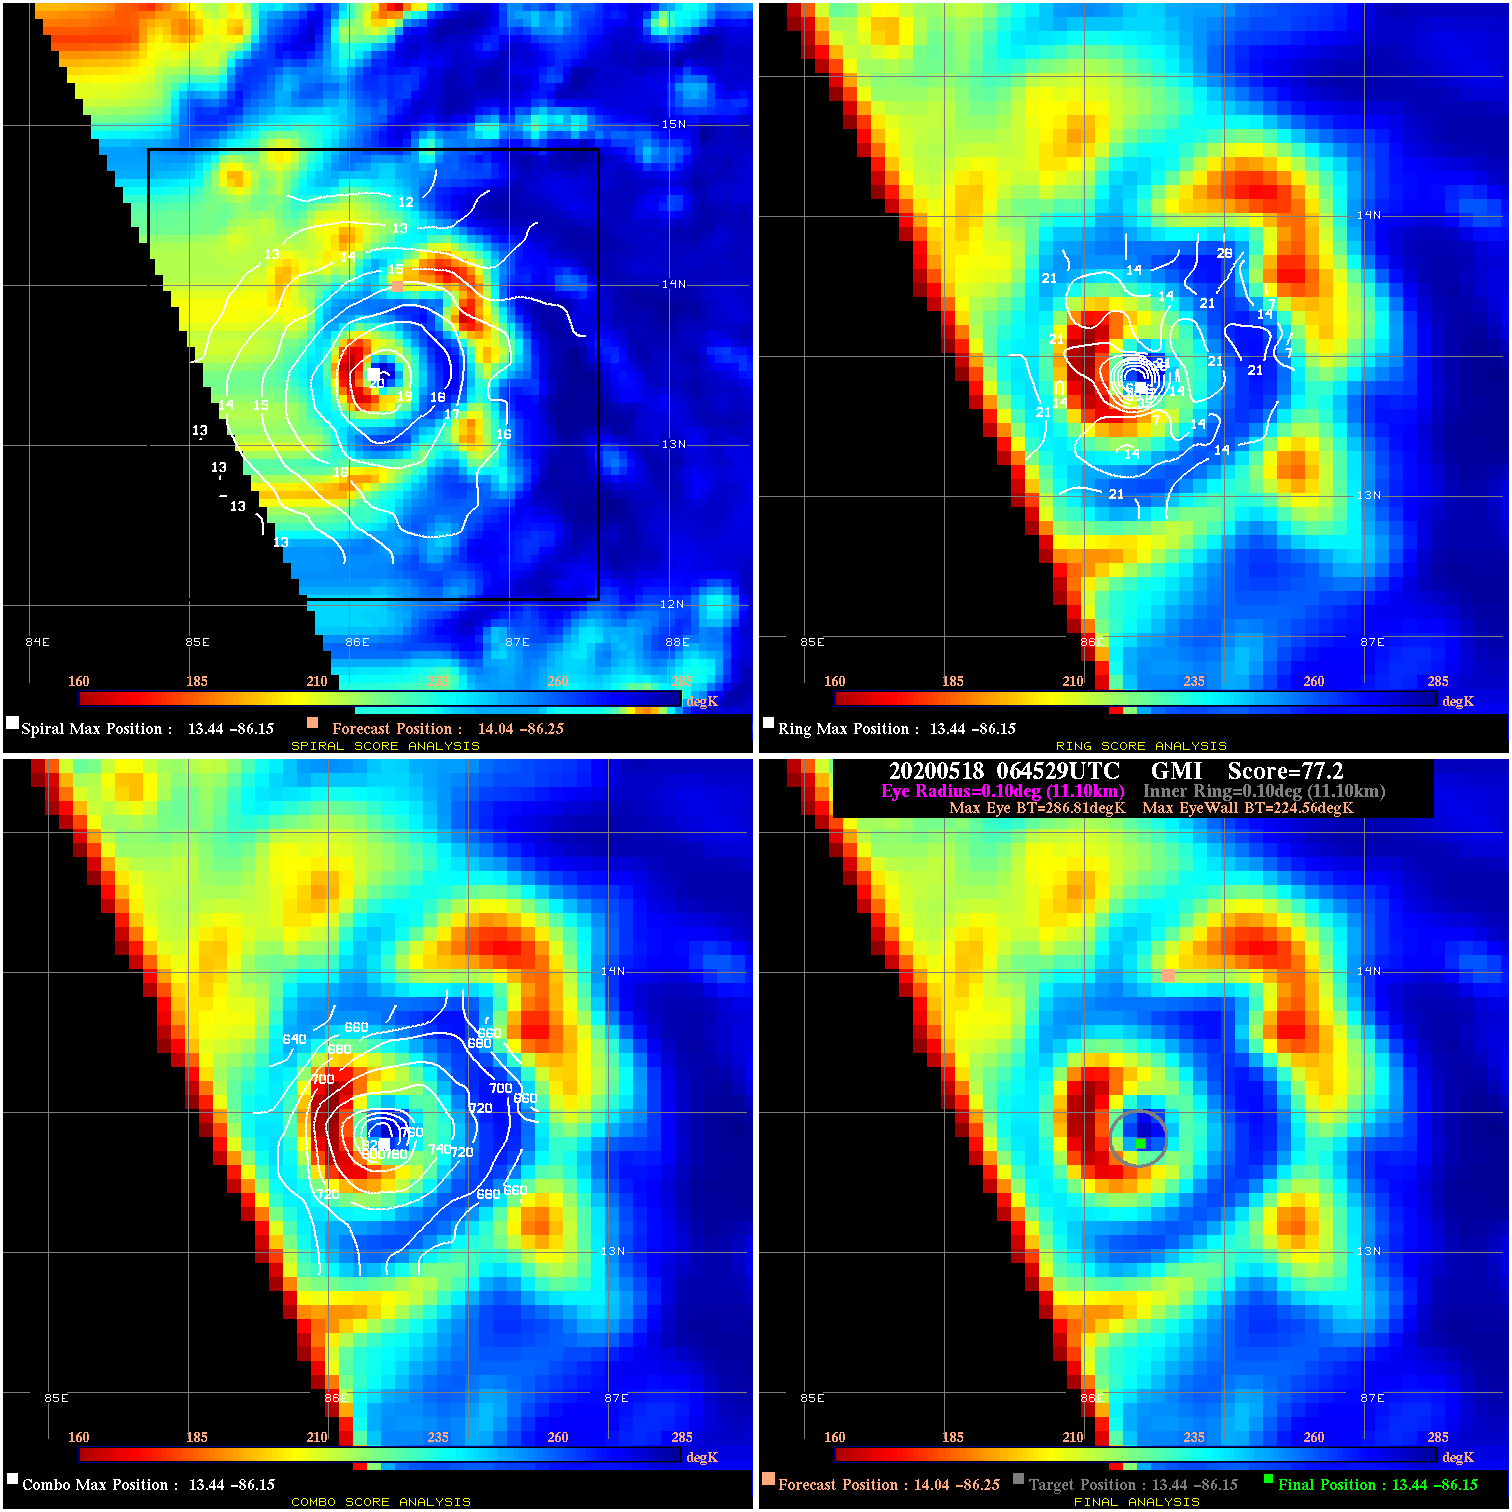
20200518 064529 77.2 >85 kts 100.0% 22.22 62.25 100.0 GMI 14.0 -86.3 13.4 -86.2 13.4 -86.2 Analysis Plot
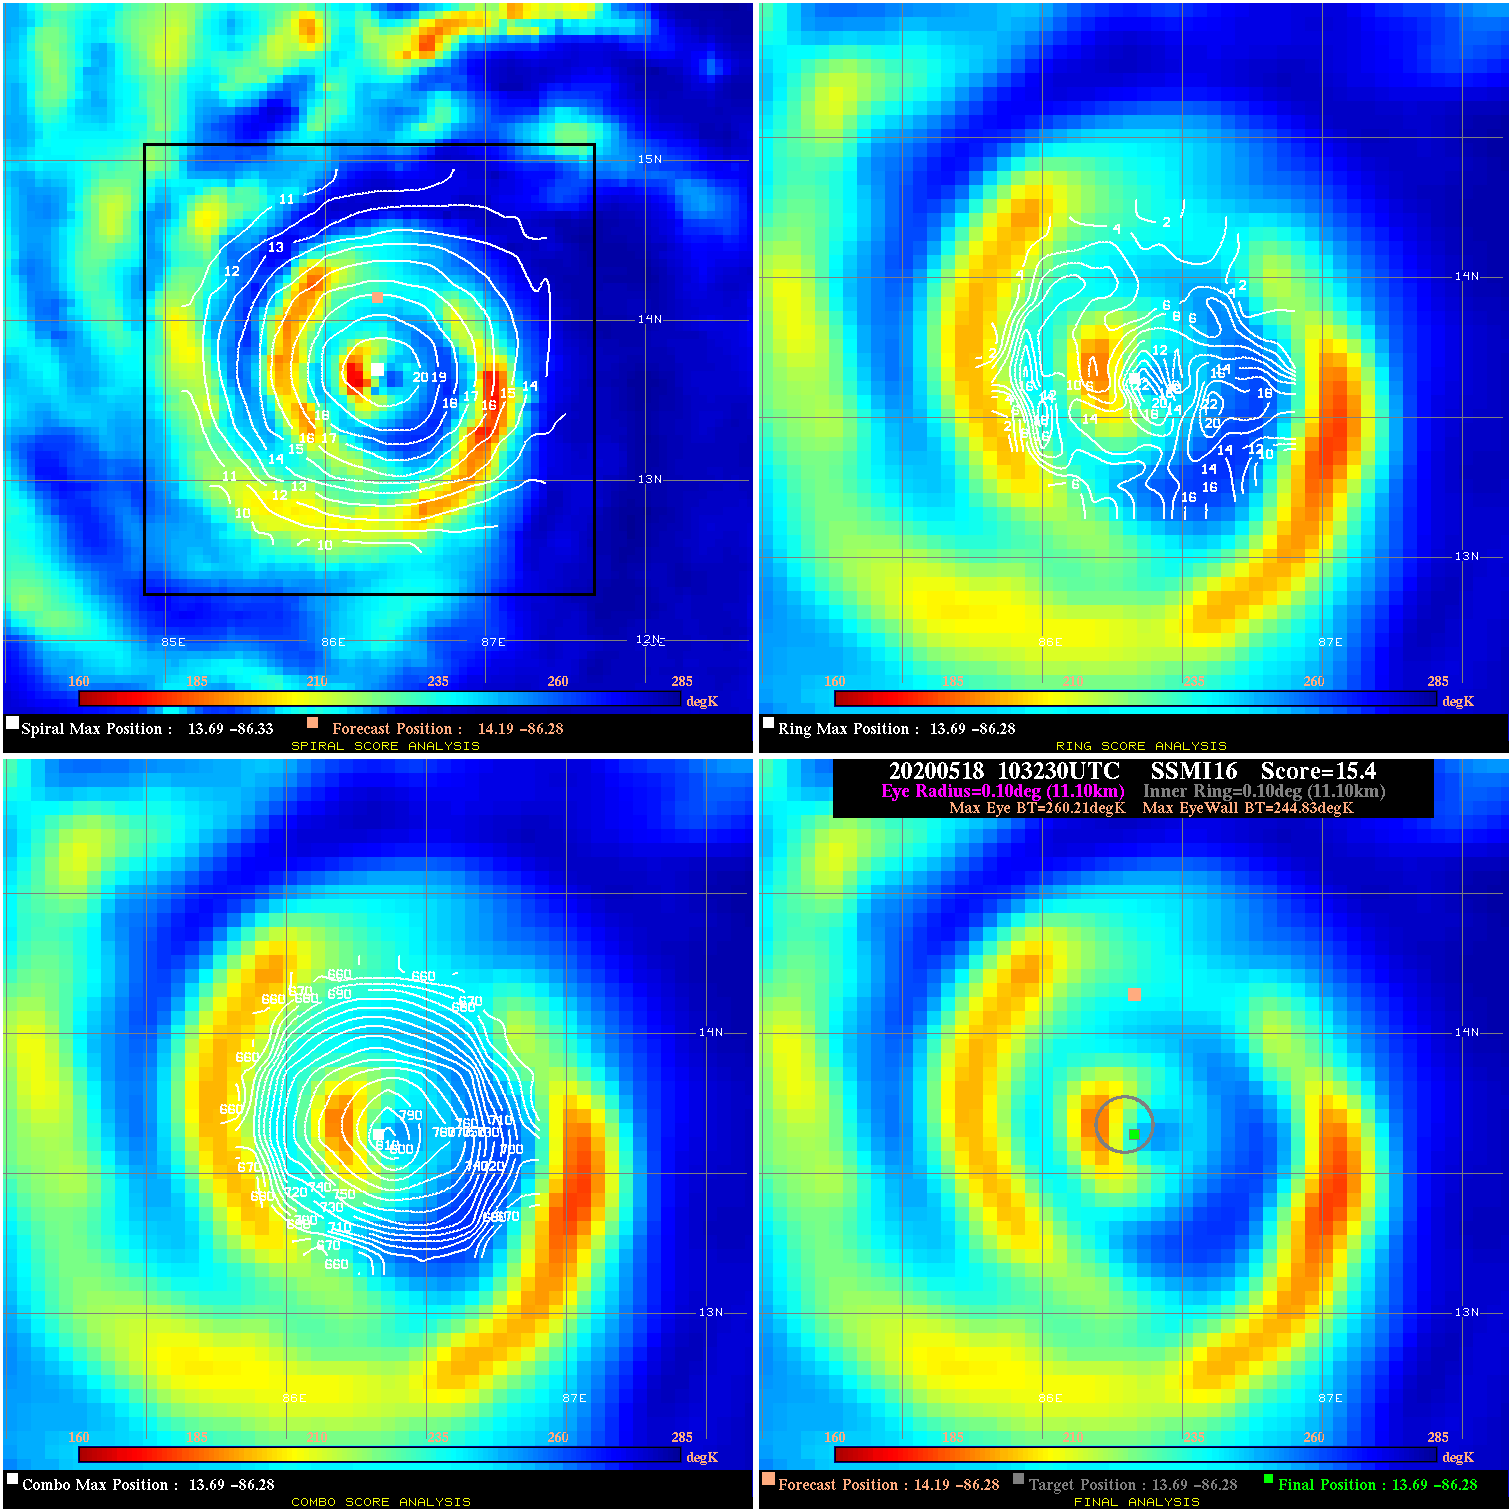
20200518 103230 15.4 N/A 71.2% 22.22 15.38 100.0 SSMI16 14.2 -86.3 13.7 -86.3 13.7 -86.3 Analysis Plot
20200518 110341 39.3 >65 kts 100.0% 22.22 24.25 100.0 SSMI18 14.2 -86.3 13.8 -86.3 13.8 -86.3 Analysis Plot
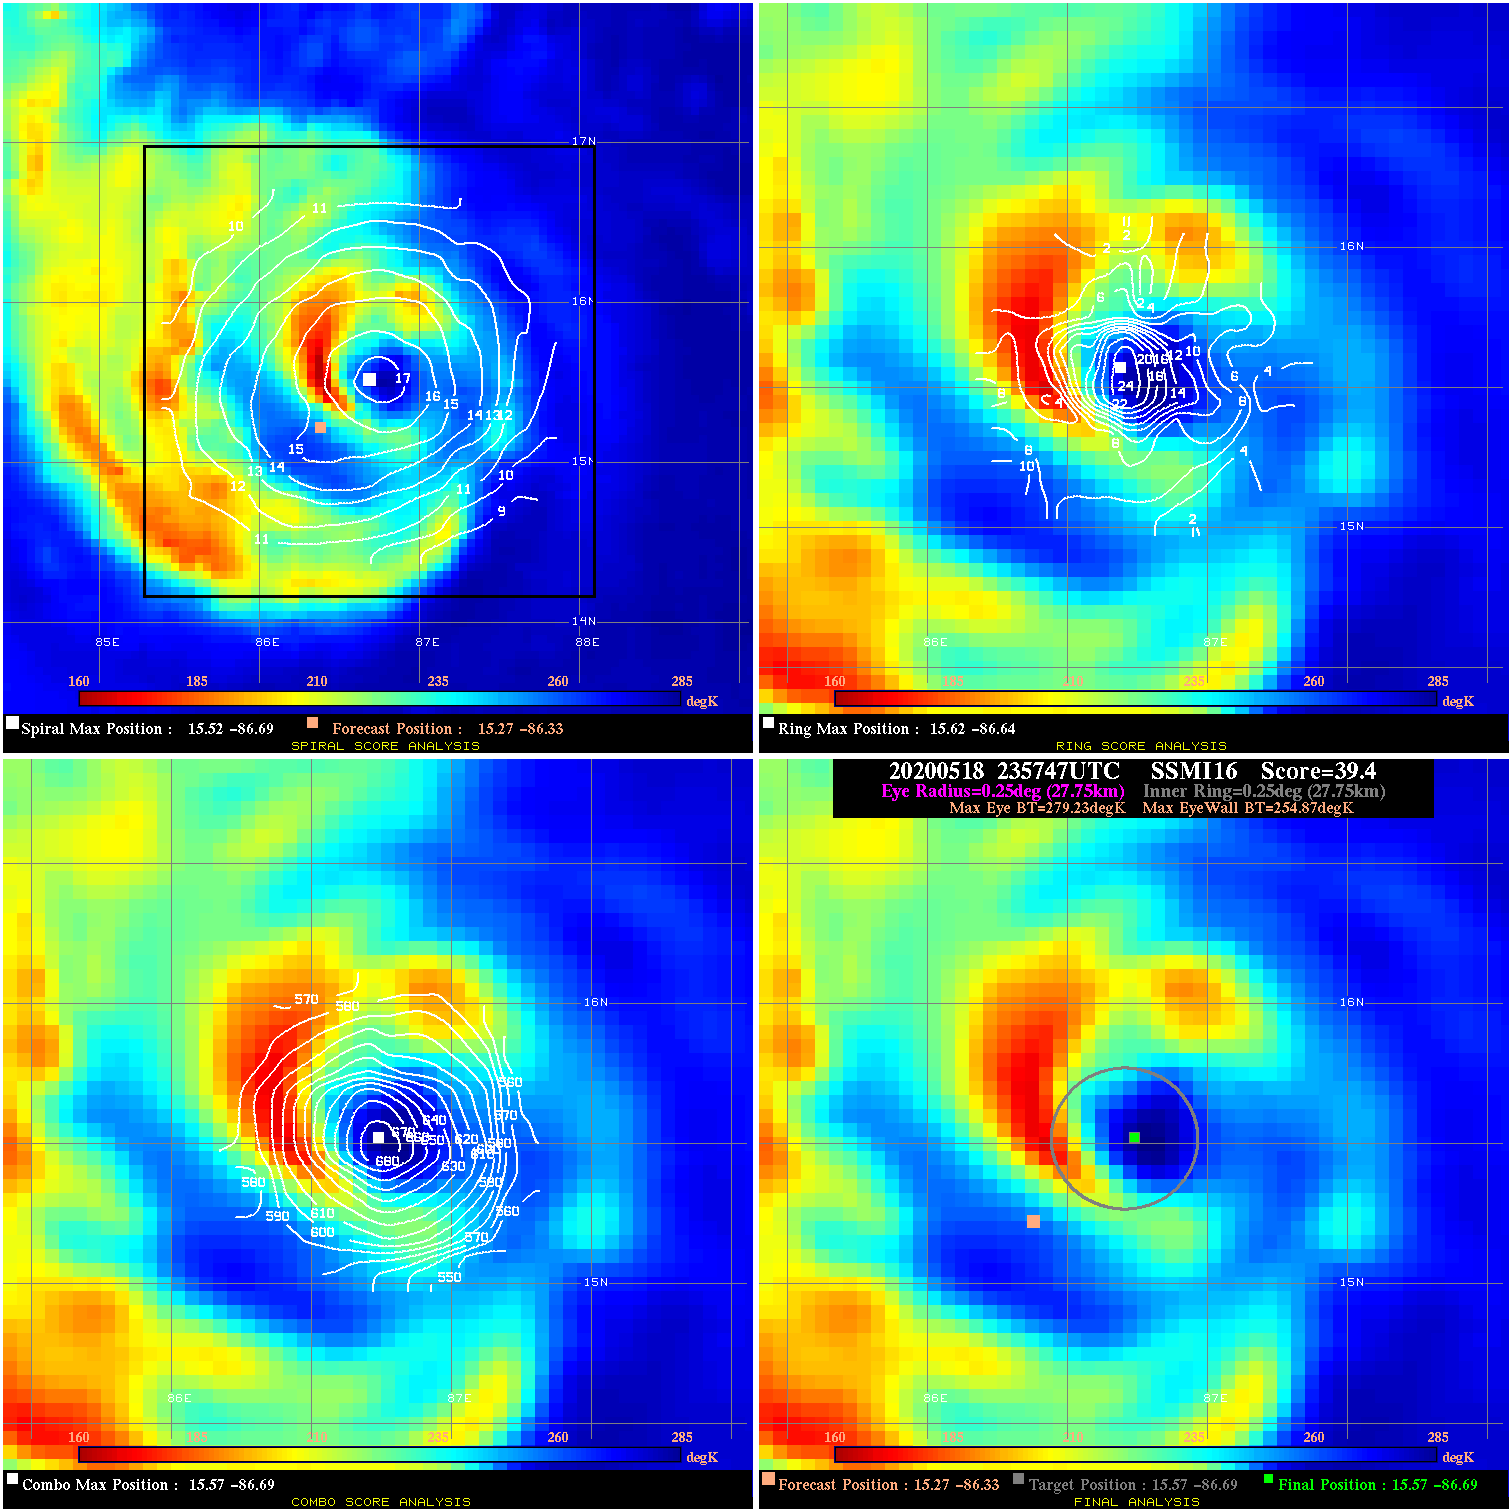
20200518 235747 39.4 >65 kts 100.0% 55.55 24.36 125.0 SSMI16 15.3 -86.3 15.6 -86.7 15.6 -86.7 Analysis Plot
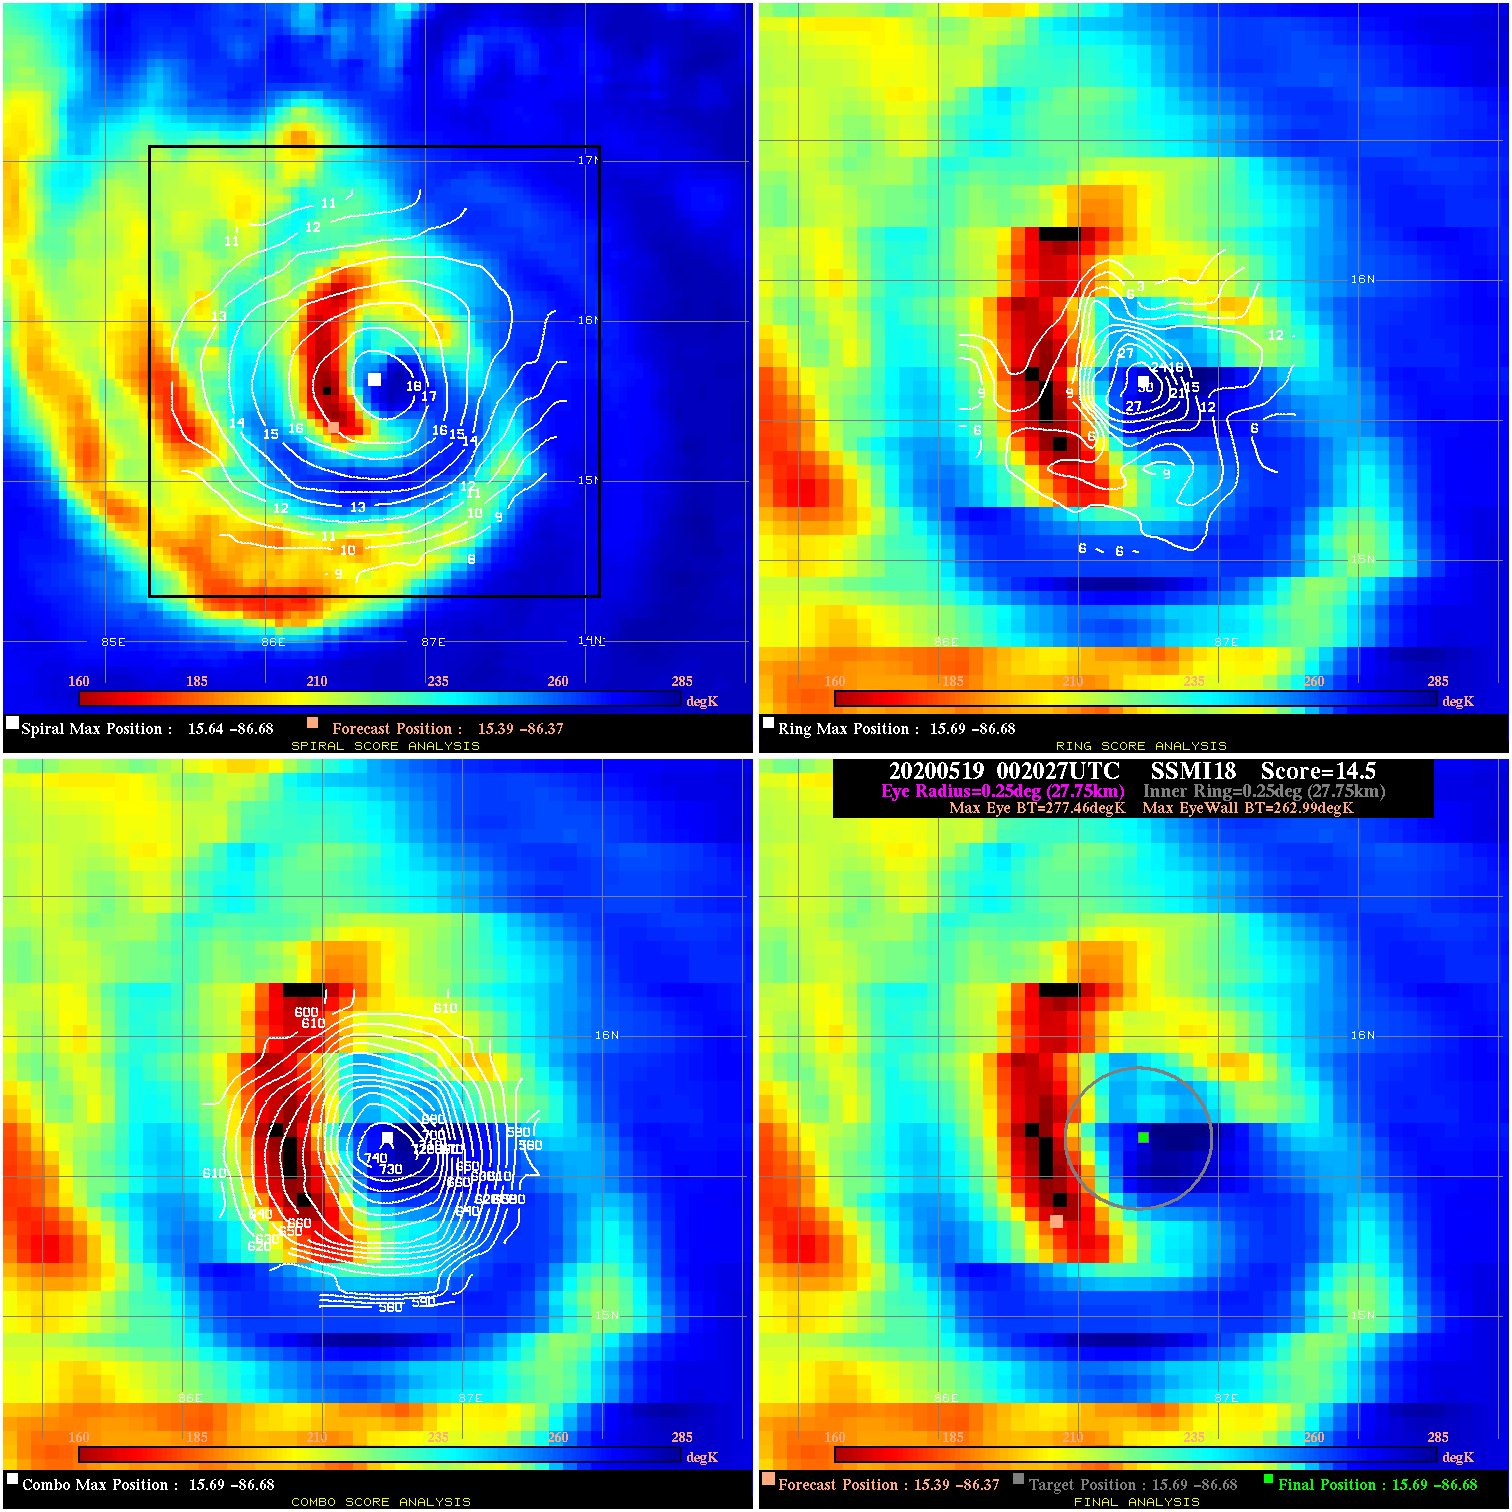
20200519 002027 14.5 N/A 72.6% 55.55 14.47 125.0 SSMI18 15.4 -86.4 15.7 -86.7 15.7 -86.7 Analysis Plot
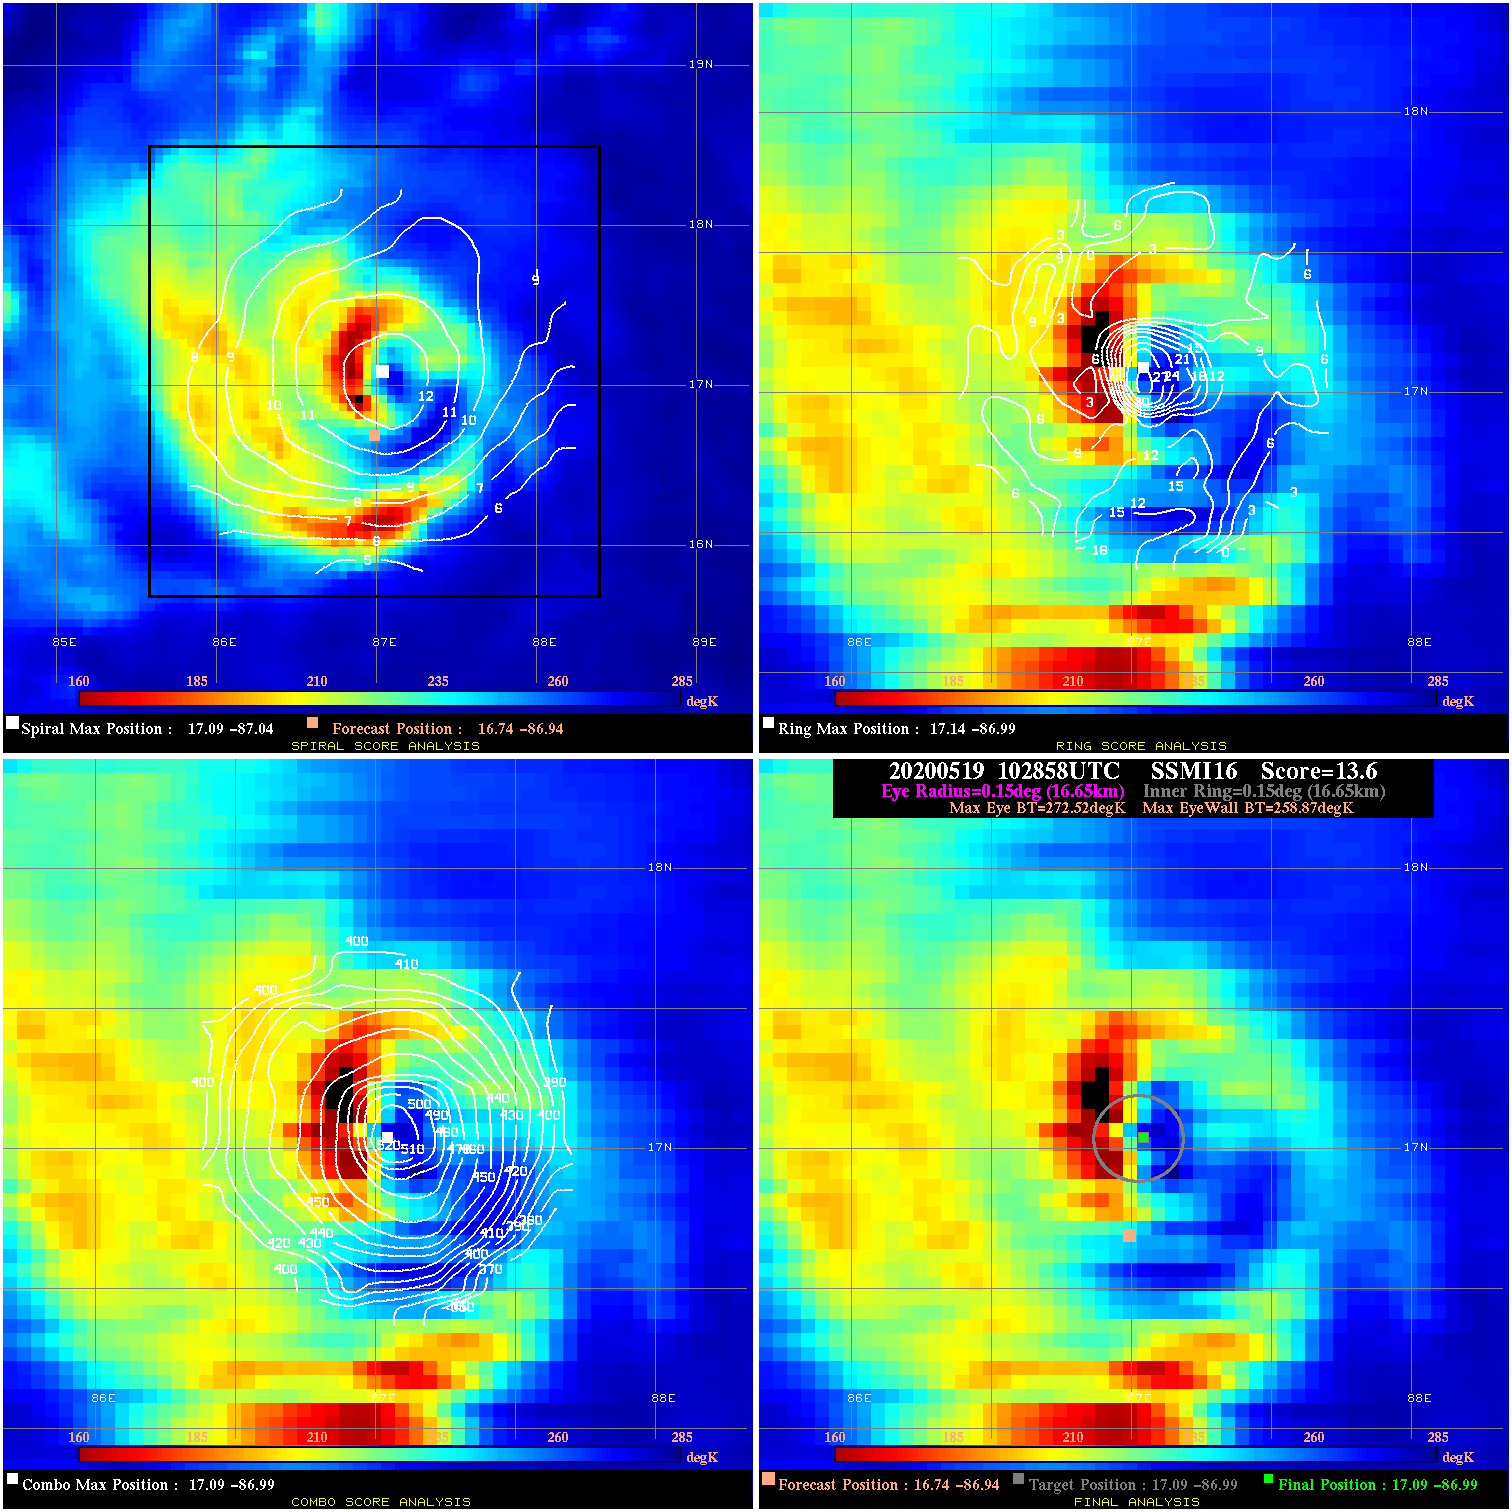
20200519 102858 13.6 N/A 76.7% 33.33 13.65 115.0 SSMI16 16.7 -86.9 17.1 -87.0 17.1 -87.0 Analysis Plot
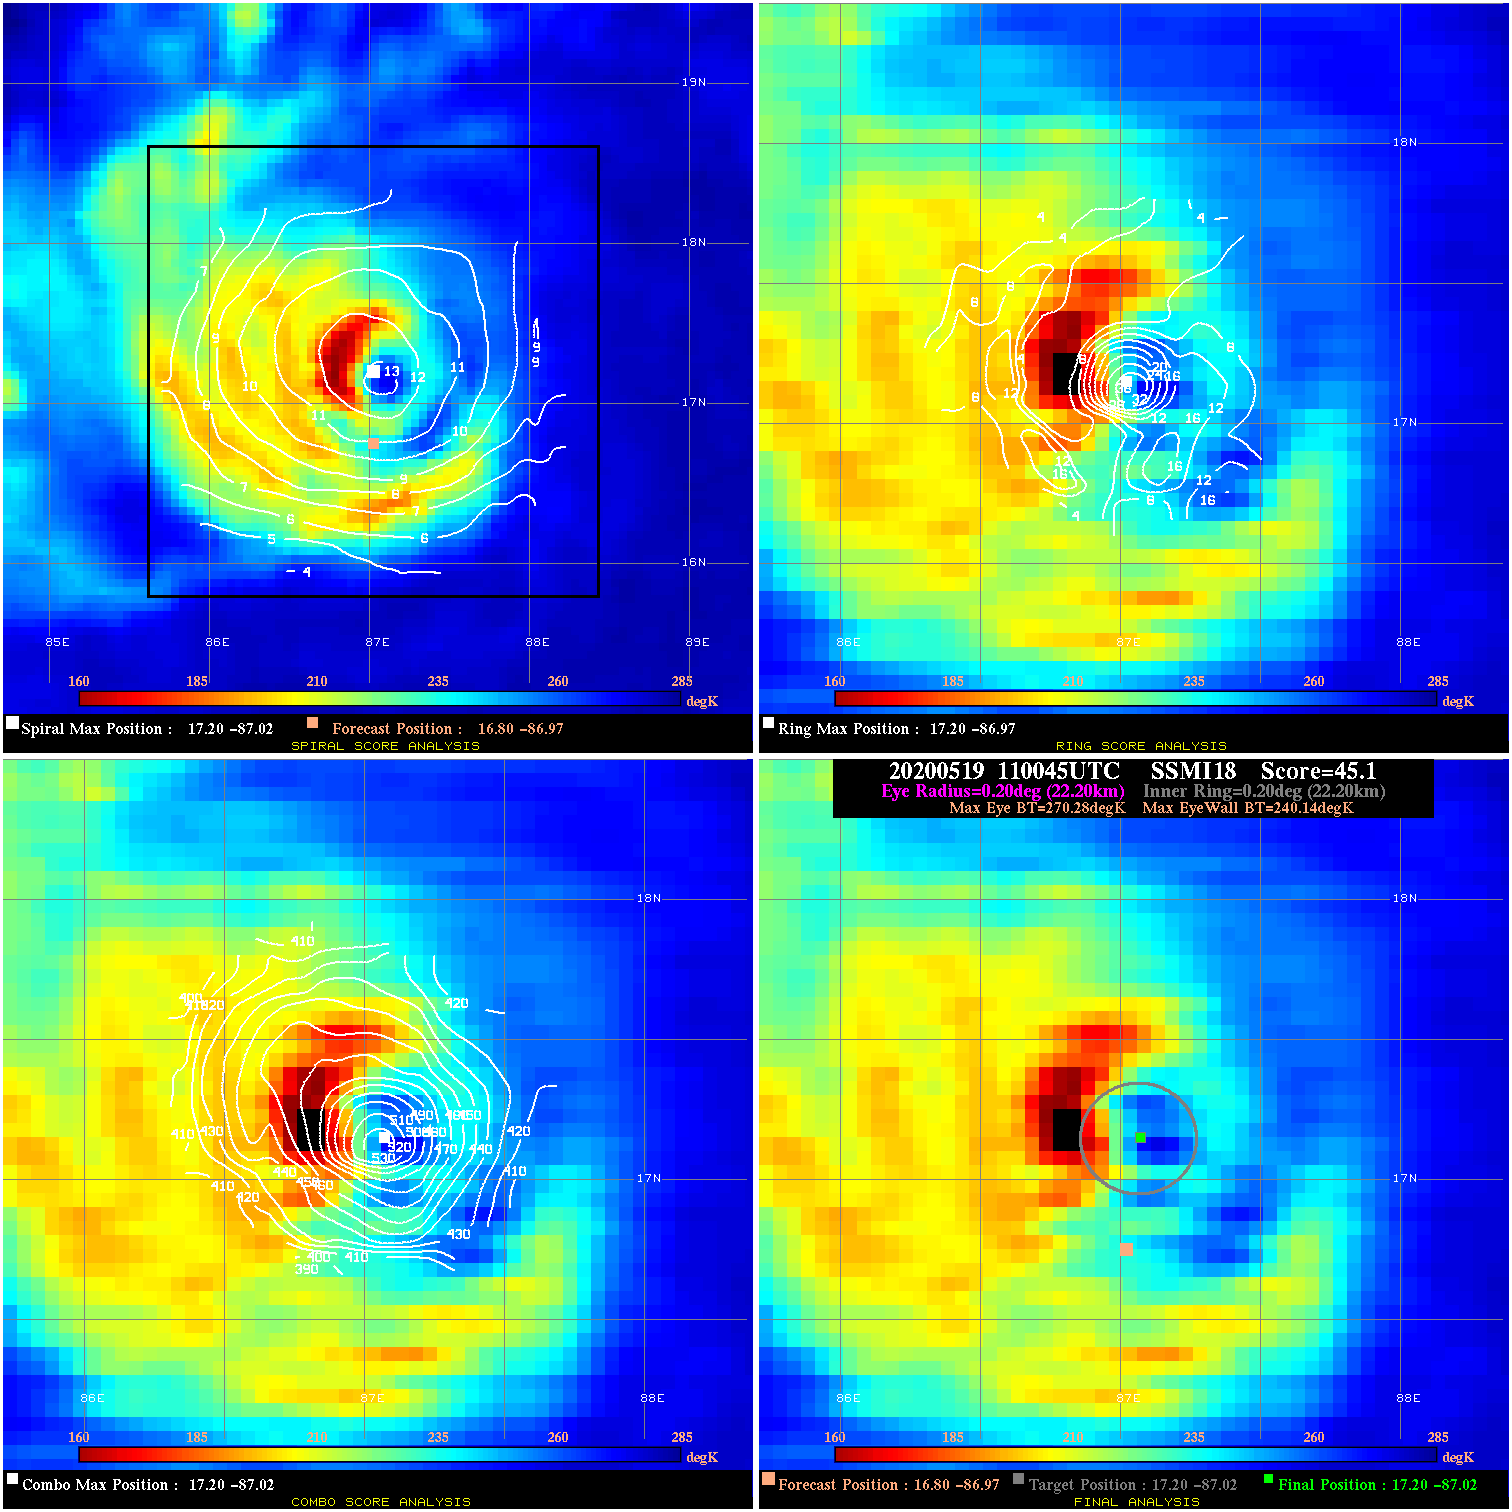
20200519 110045 45.1 >65 kts 100.0% 44.44 30.14 115.0 SSMI18 16.8 -87.0 17.2 -87.0 17.2 -87.0 Analysis Plot
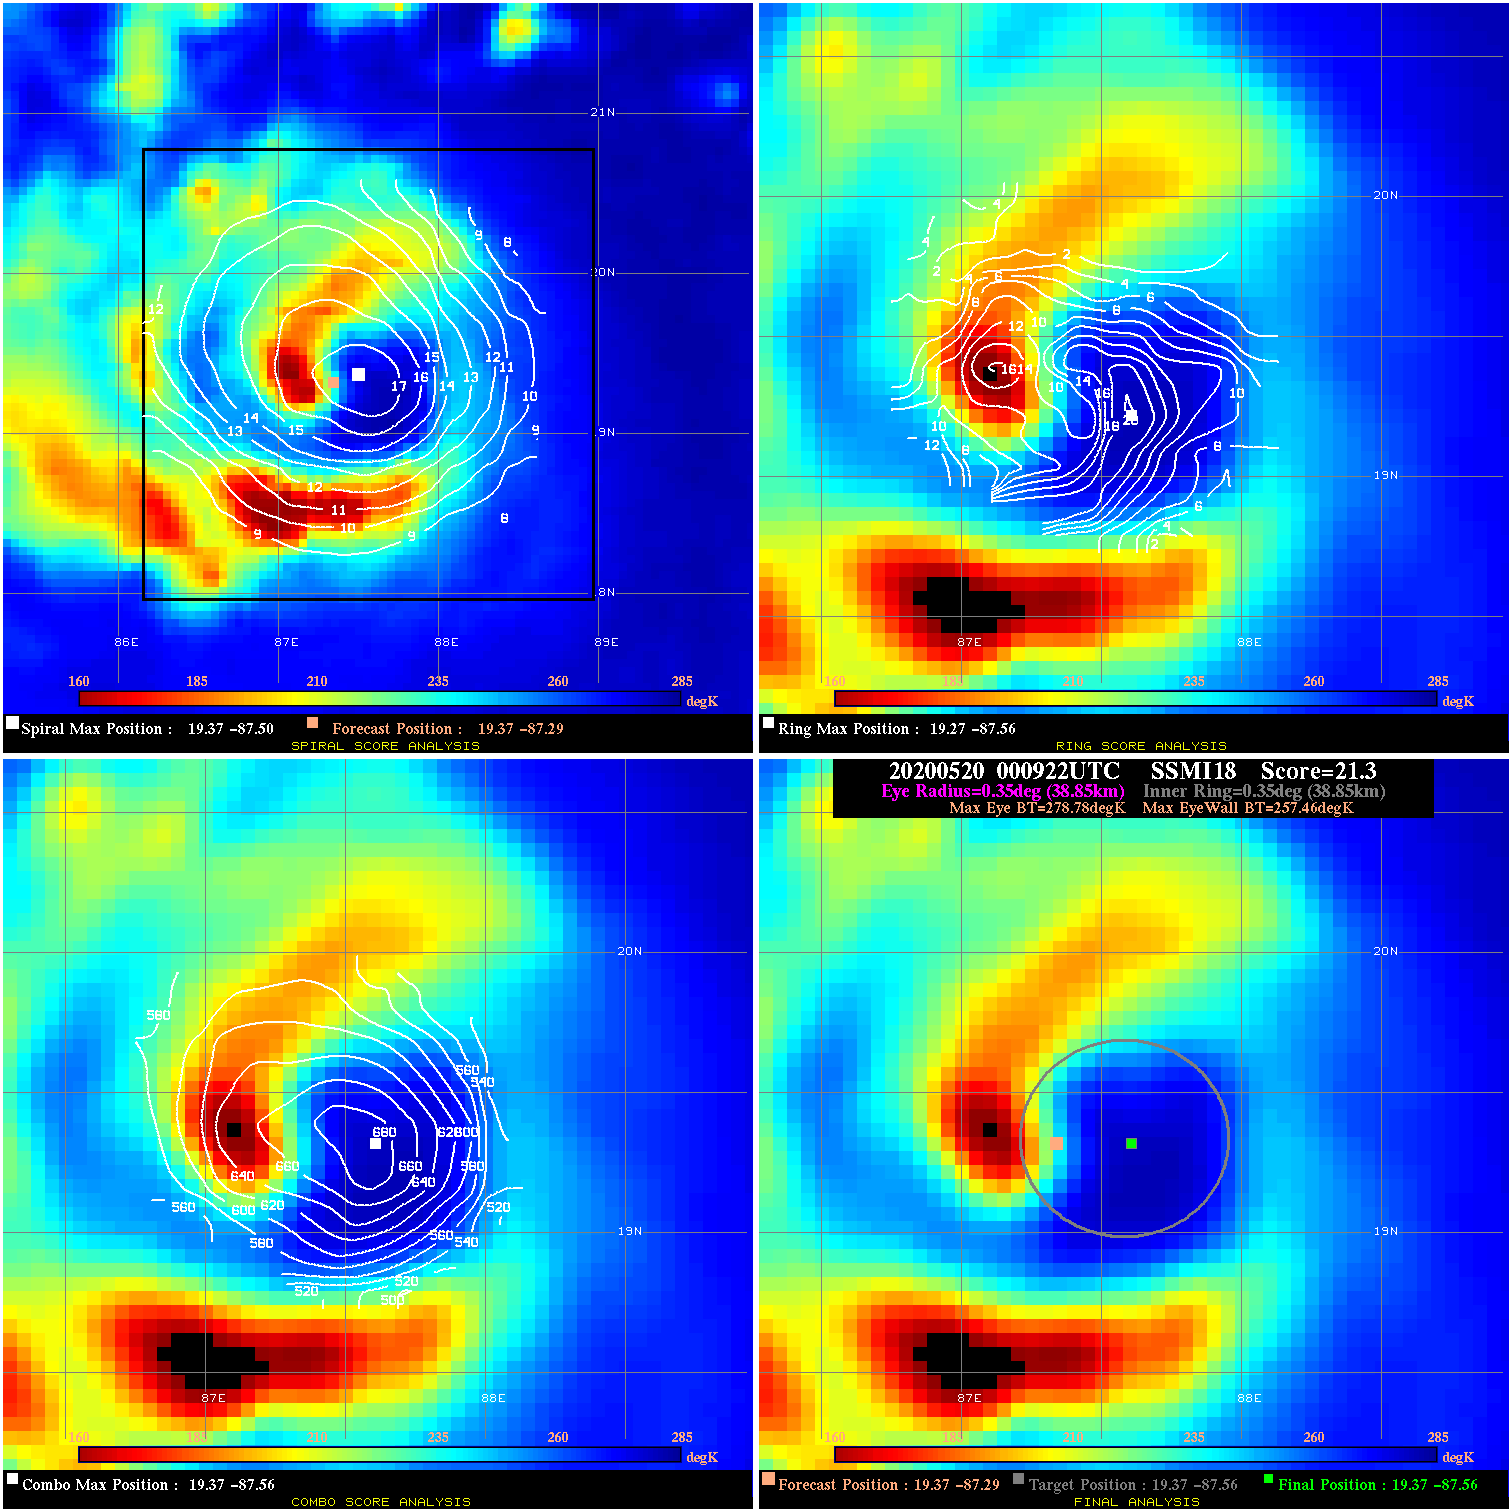
20200520 000922 21.3 >65 kts 58.9% 77.77 21.32 100.0 SSMI18 19.4 -87.3 19.4 -87.6 19.4 -87.6 Analysis Plot
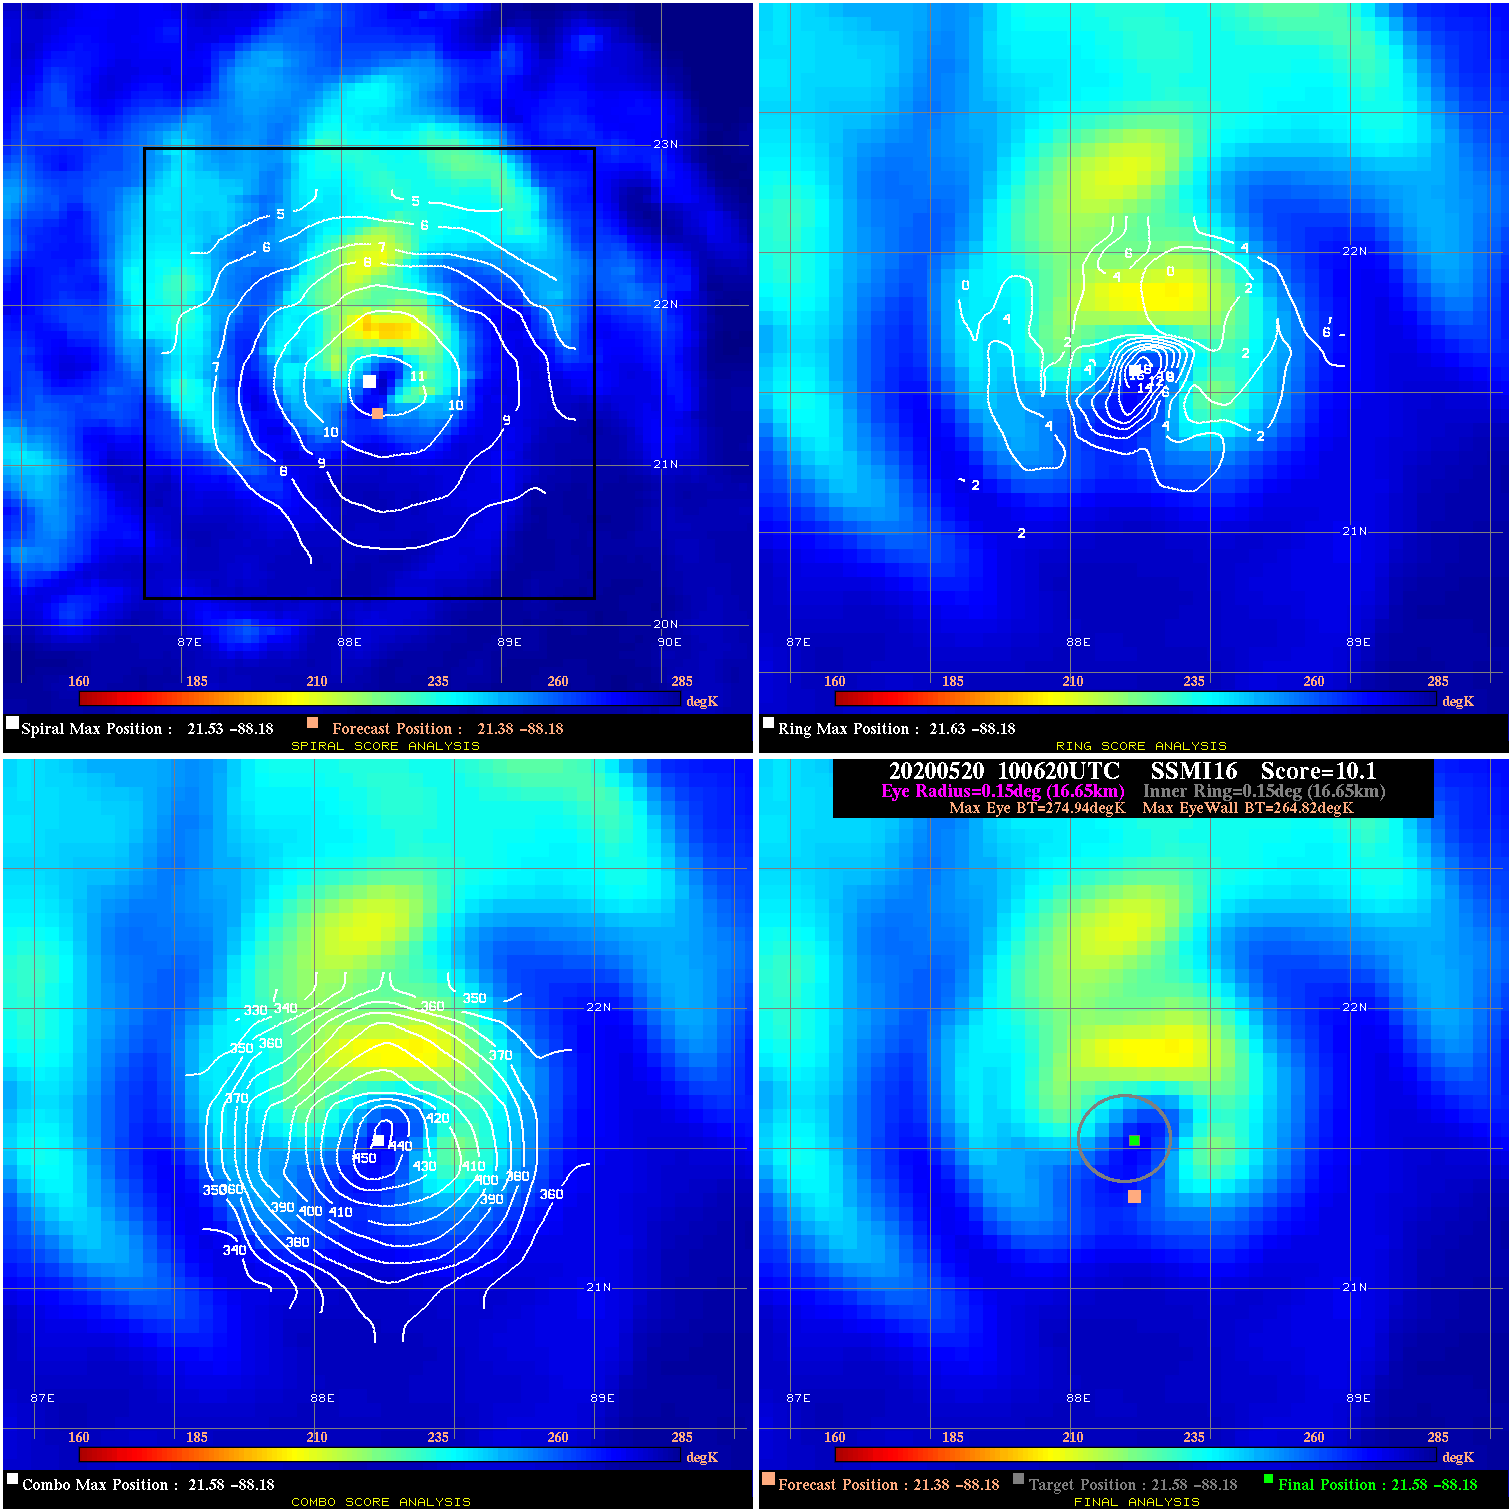
20200520 100620 10.1 N/A 42.5% 33.33 10.12 90.0 SSMI16 21.4 -88.2 21.6 -88.2 21.6 -88.2 Analysis Plot
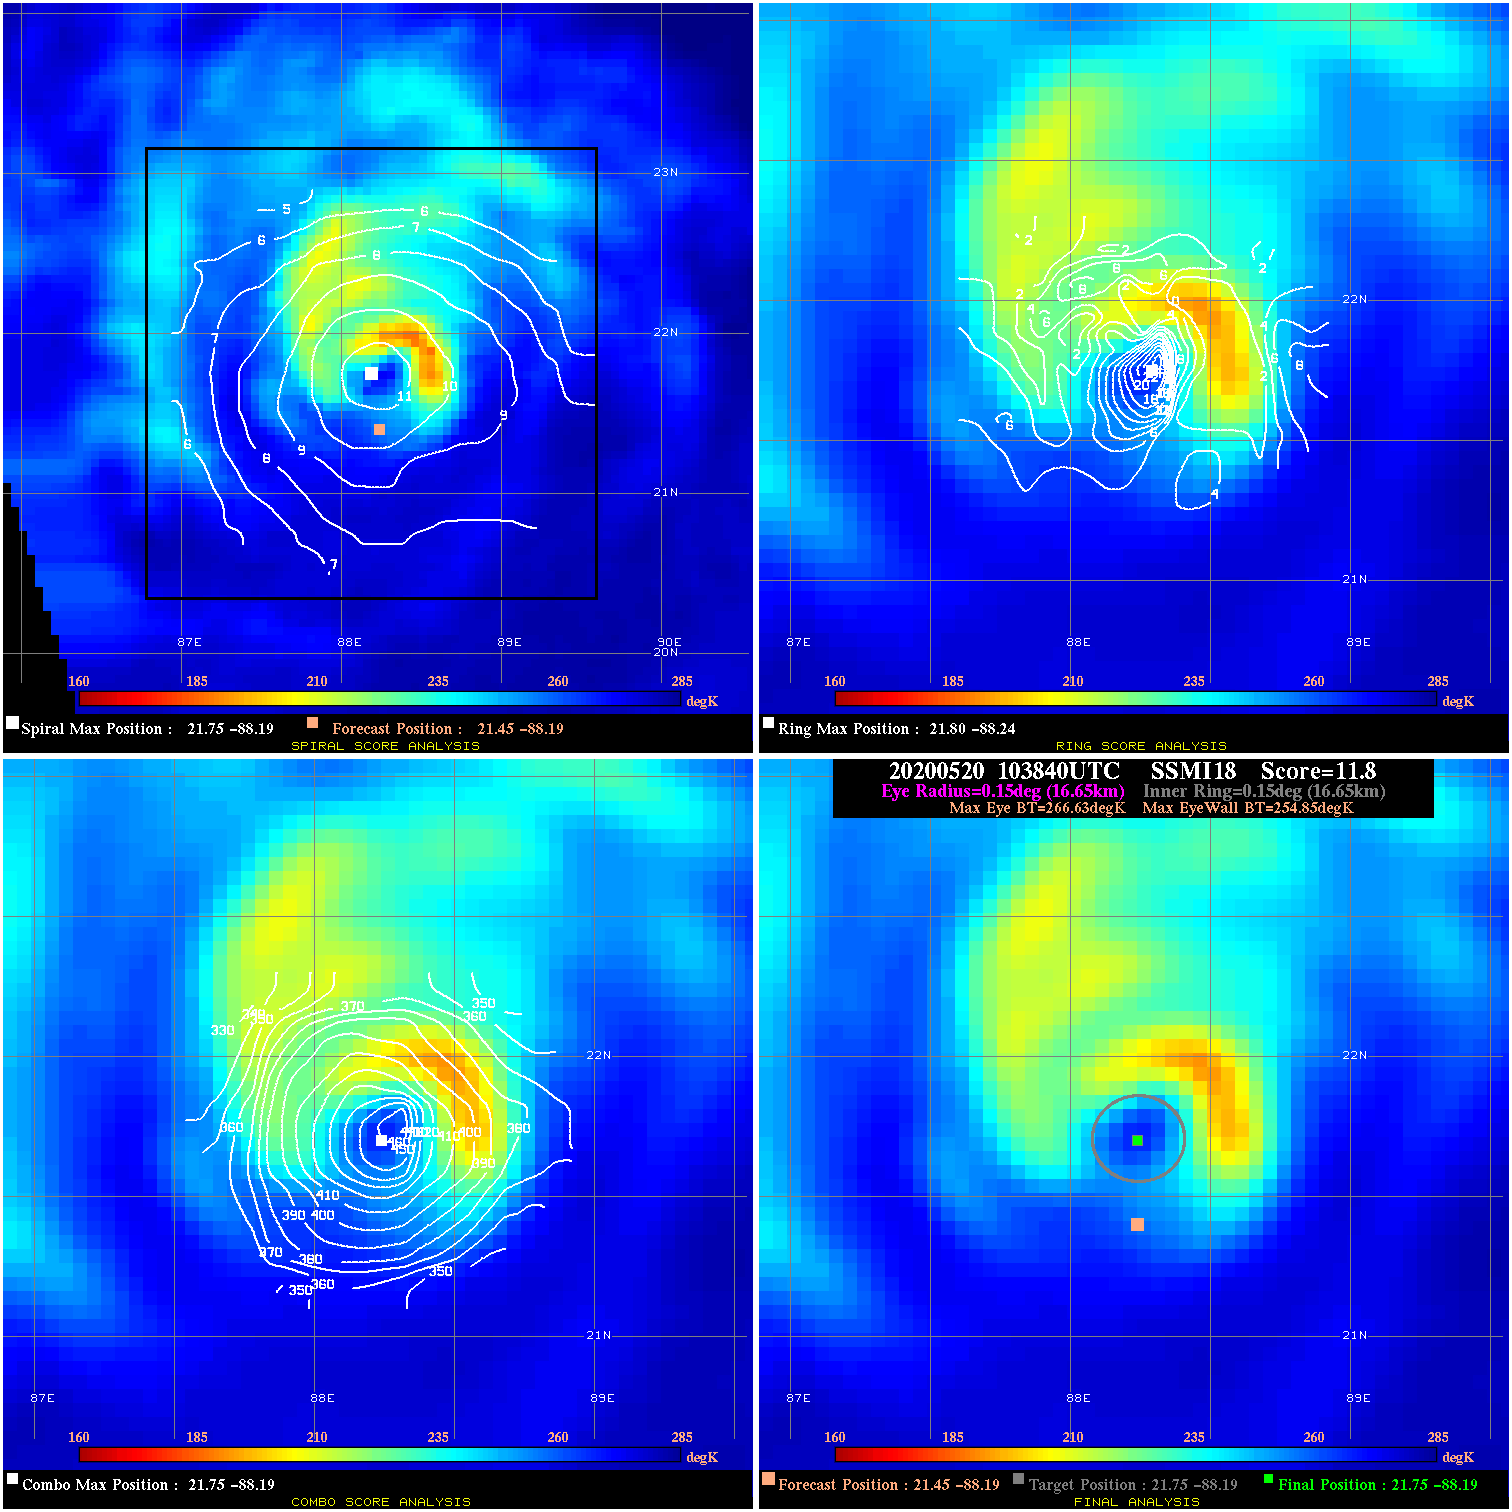
20200520 103840 11.8 N/A 72.6% 33.33 11.78 90.0 SSMI18 21.5 -88.2 21.8 -88.2 21.8 -88.2 Analysis Plot
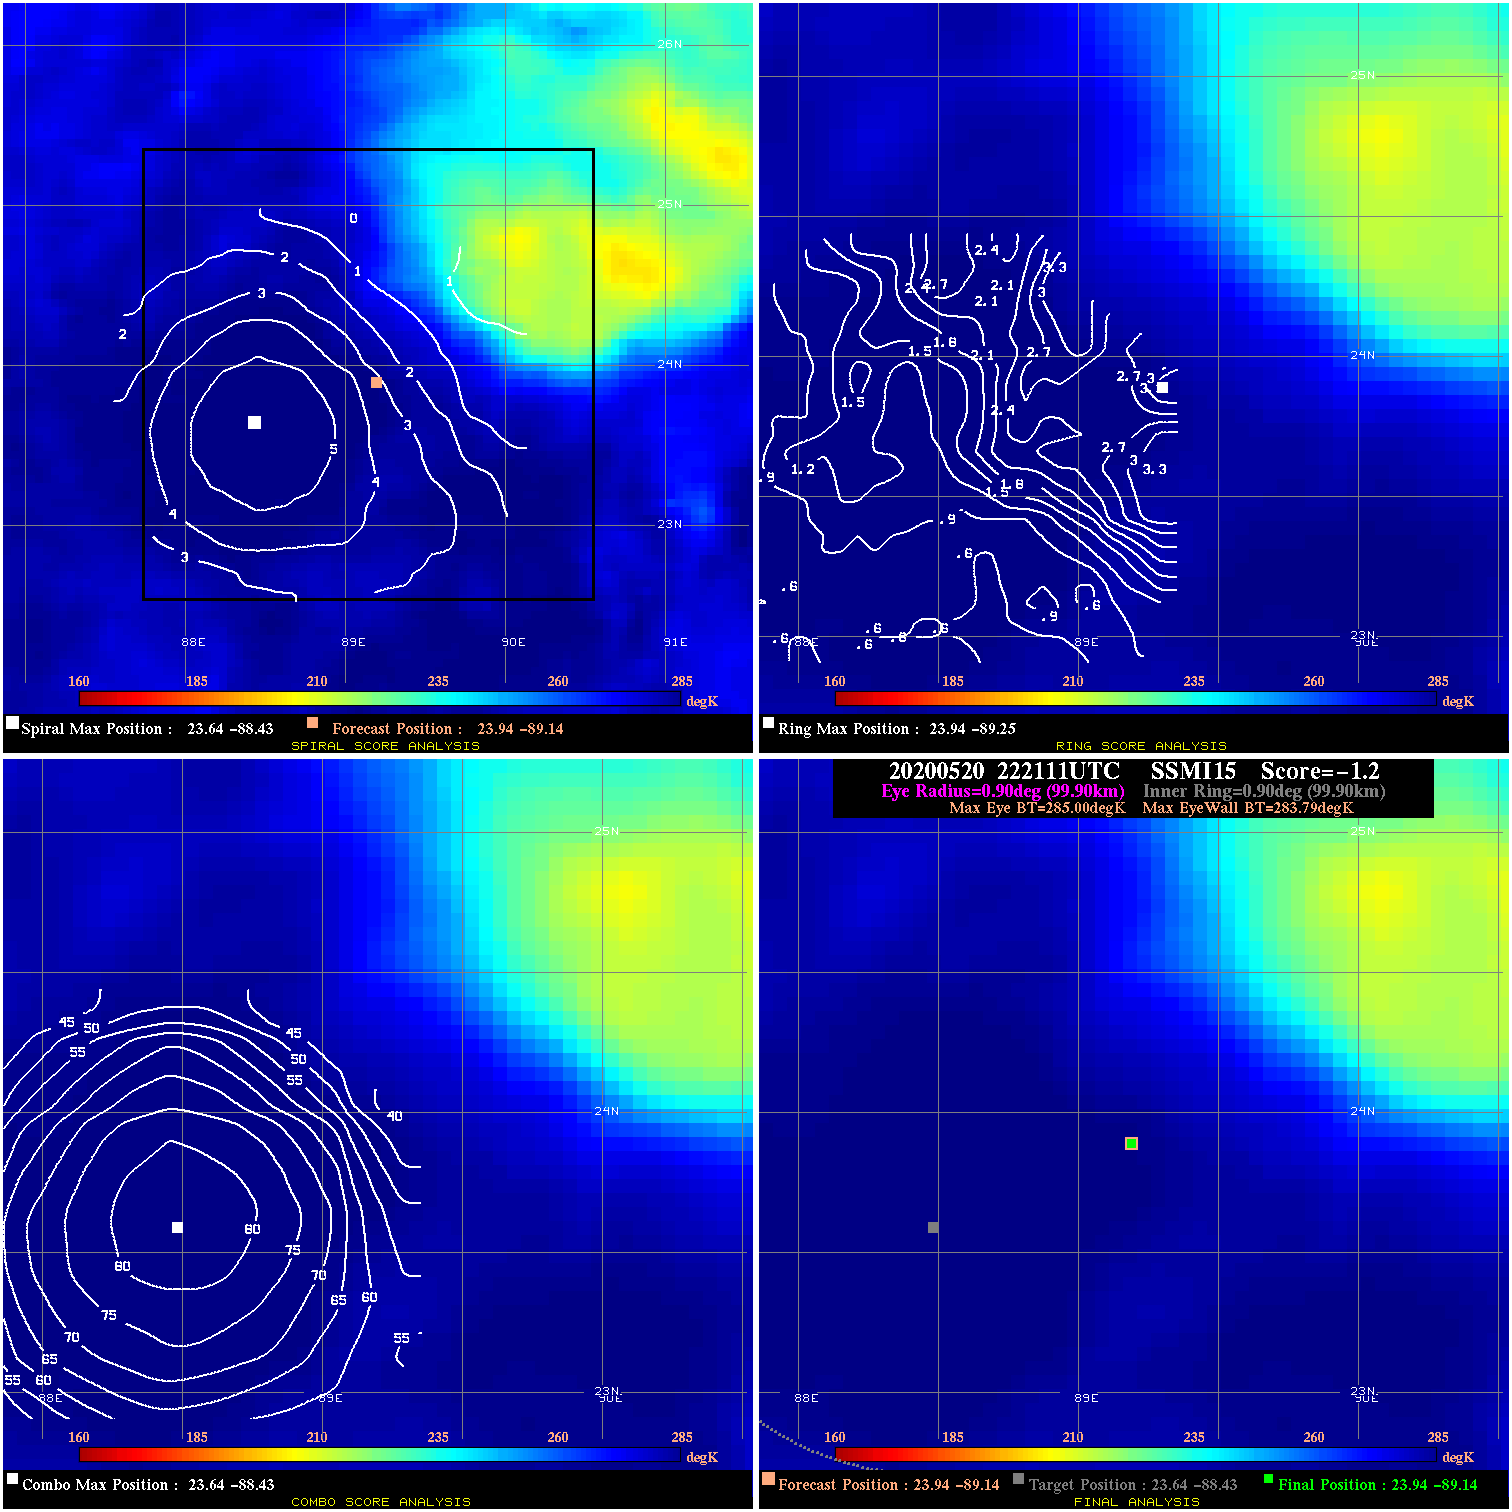
20200520 222111 -1.2 N/A N/A 199.98 1.21 50.0 SSMI15 23.9 -89.1 23.9 -89.1 23.6 -88.4 Analysis Plot
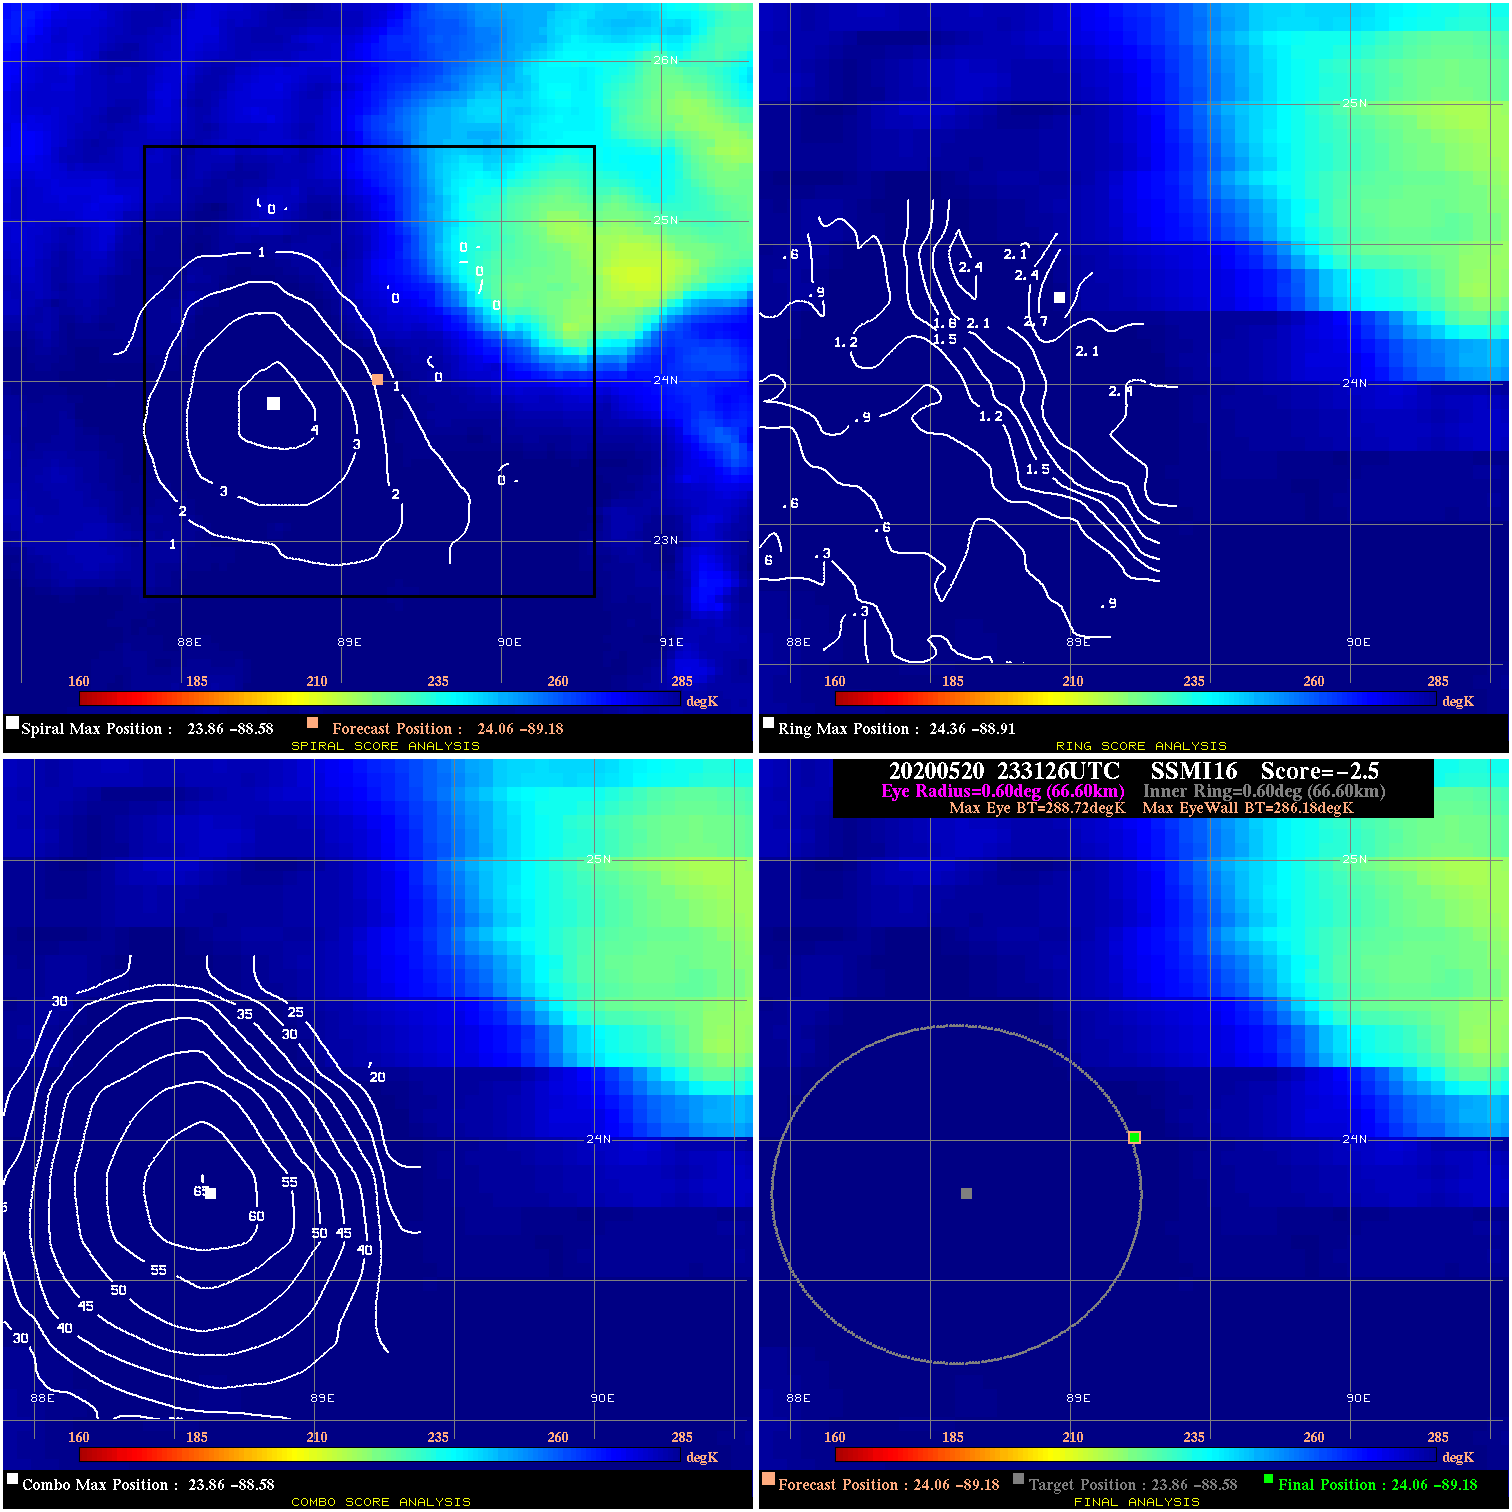
20200520 233126 -2.5 N/A N/A 133.32 2.54 50.0 SSMI16 24.1 -89.2 24.1 -89.2 23.9 -88.6 Analysis Plot
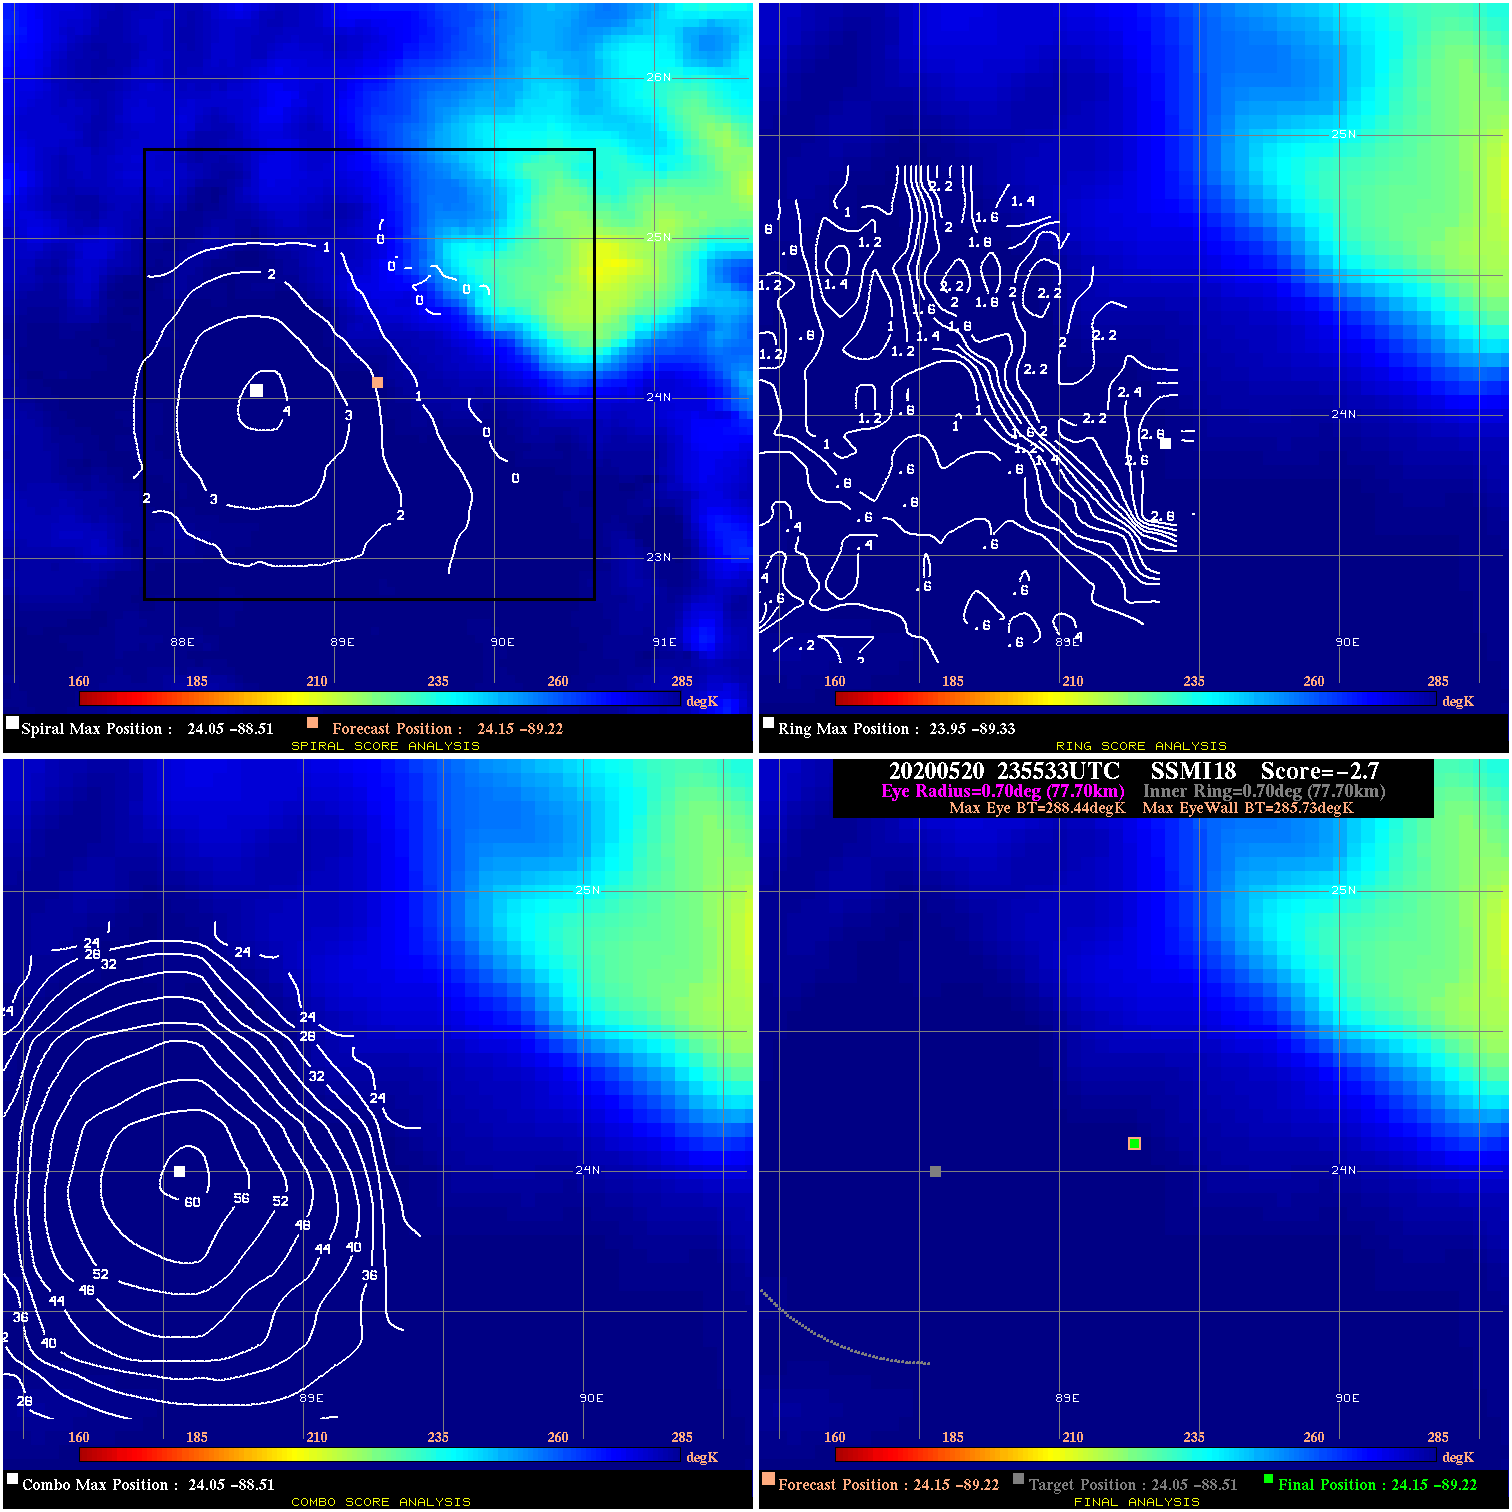
20200520 235533 -2.7 N/A N/A 155.54 2.71 50.0 SSMI18 24.1 -89.2 24.1 -89.2 24.0 -88.5 Analysis Plot
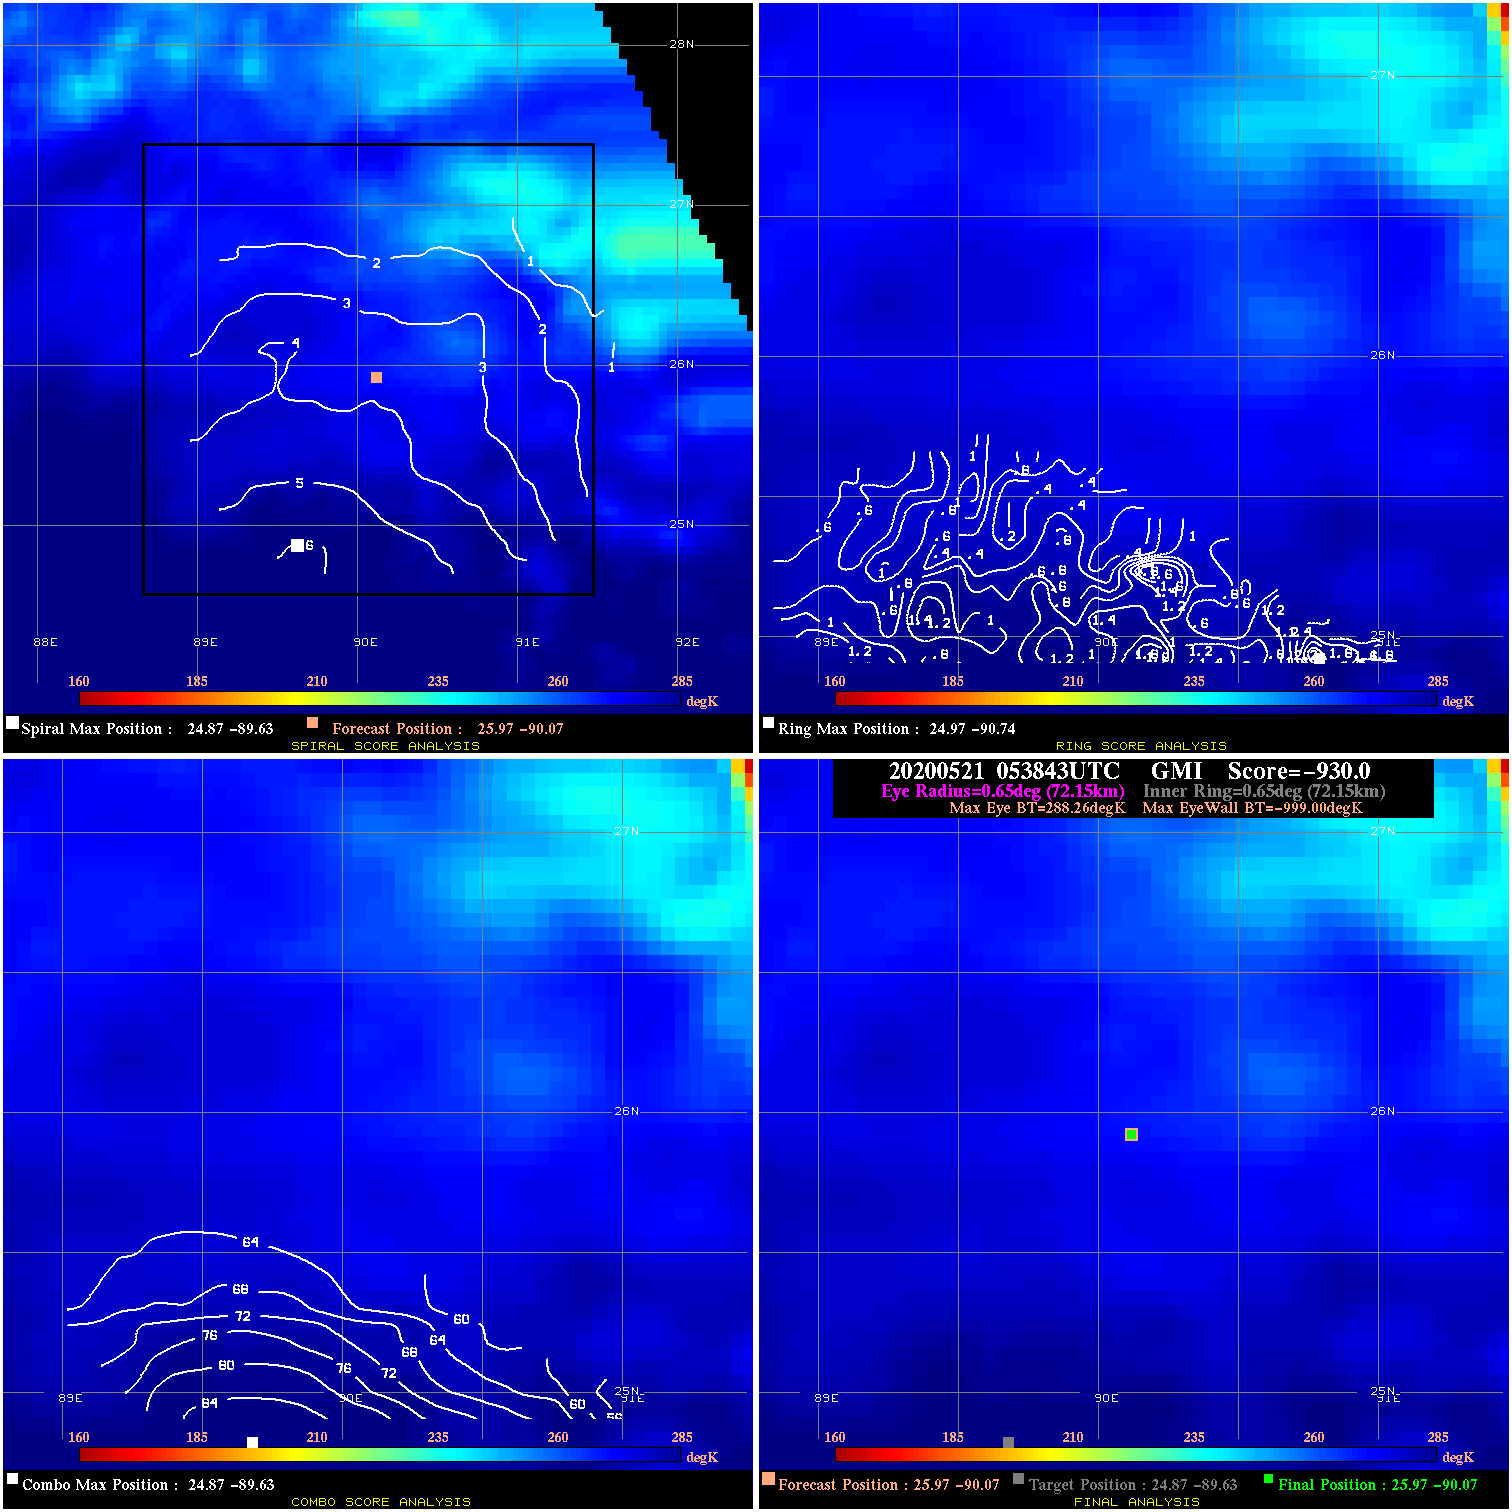
20200521 053843 -930.0 N/A N/A N/A 0.00 35.0 GMI 26.0 -90.1 26.0 -90.1 24.9 -89.6 Analysis Plot
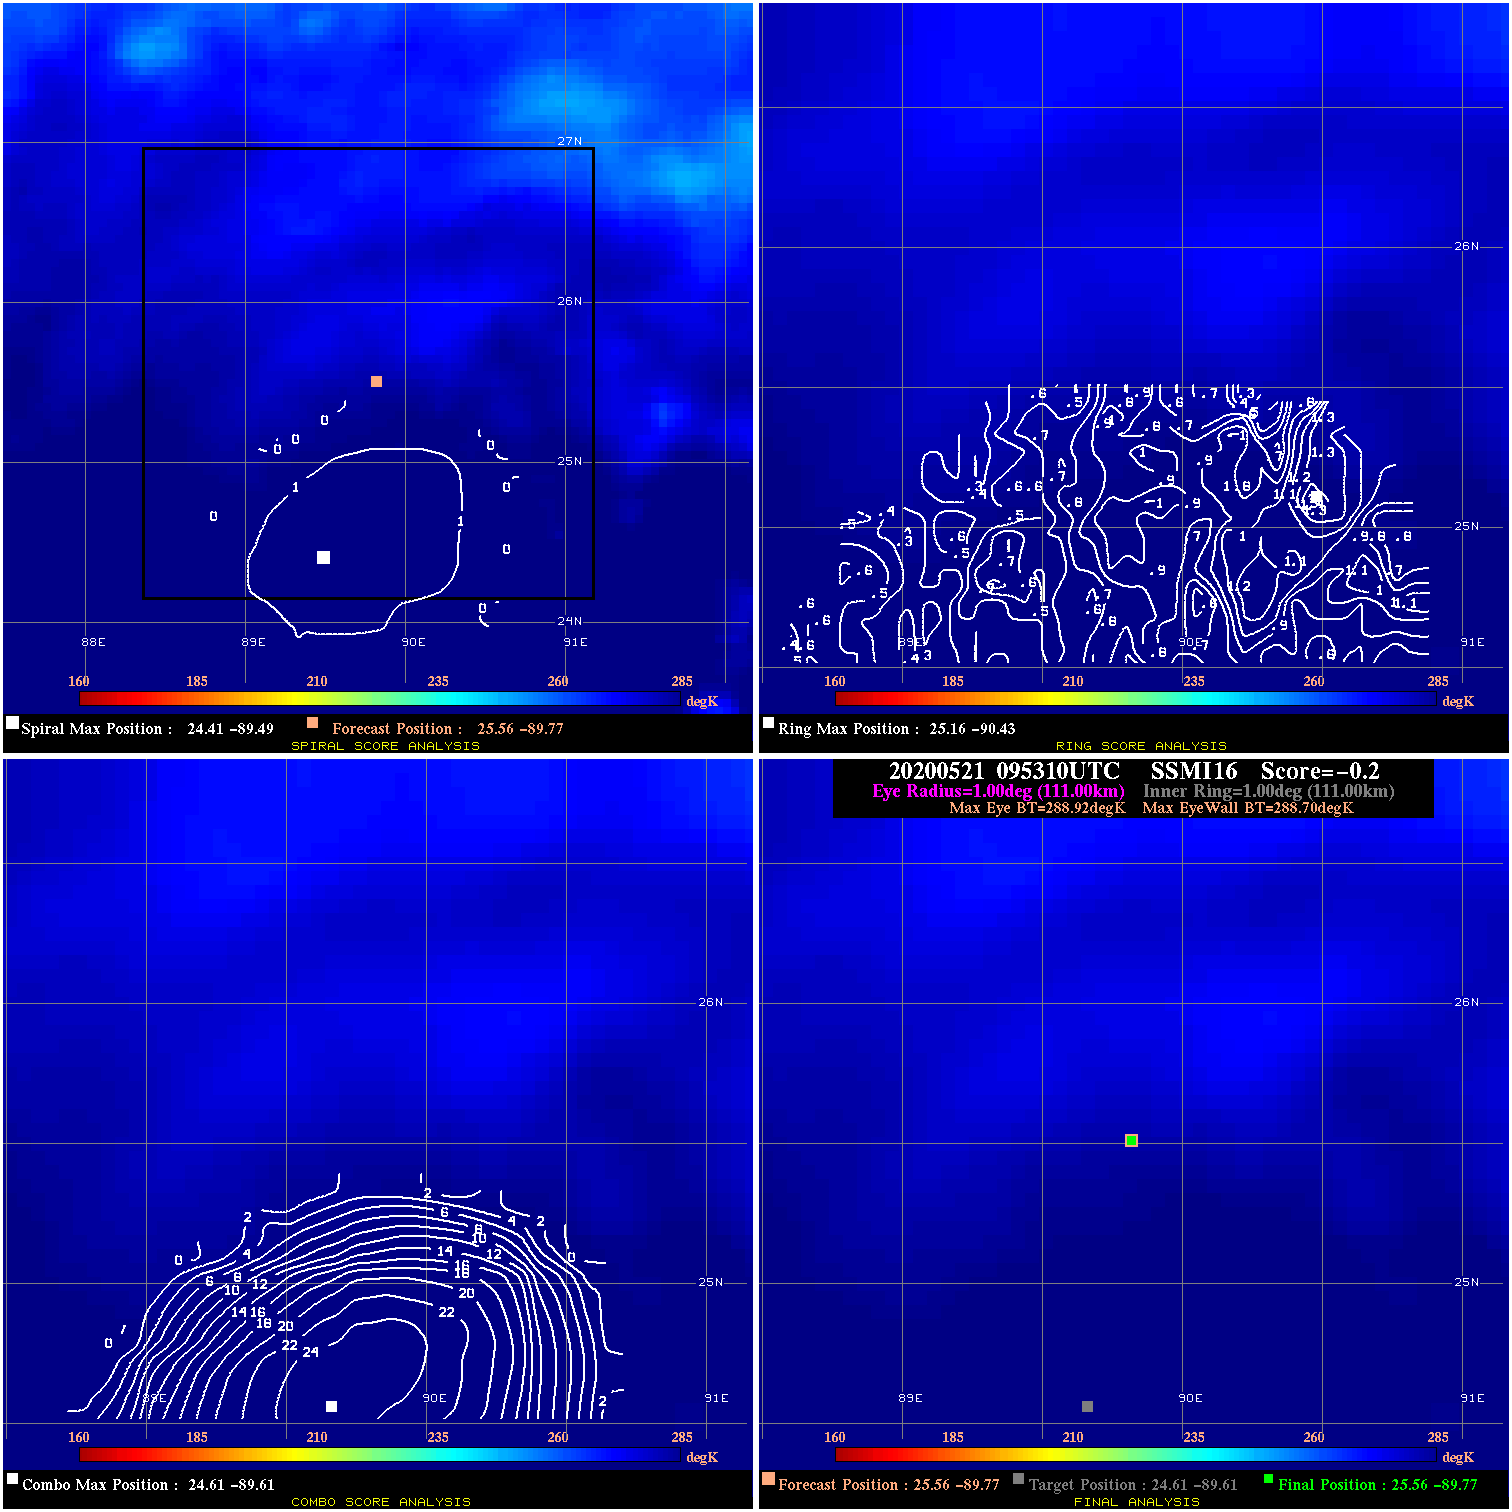
20200521 095310 -0.2 N/A N/A 222.20 .22 30.0 SSMI16 25.6 -89.8 25.6 -89.8 24.6 -89.6 Analysis Plot
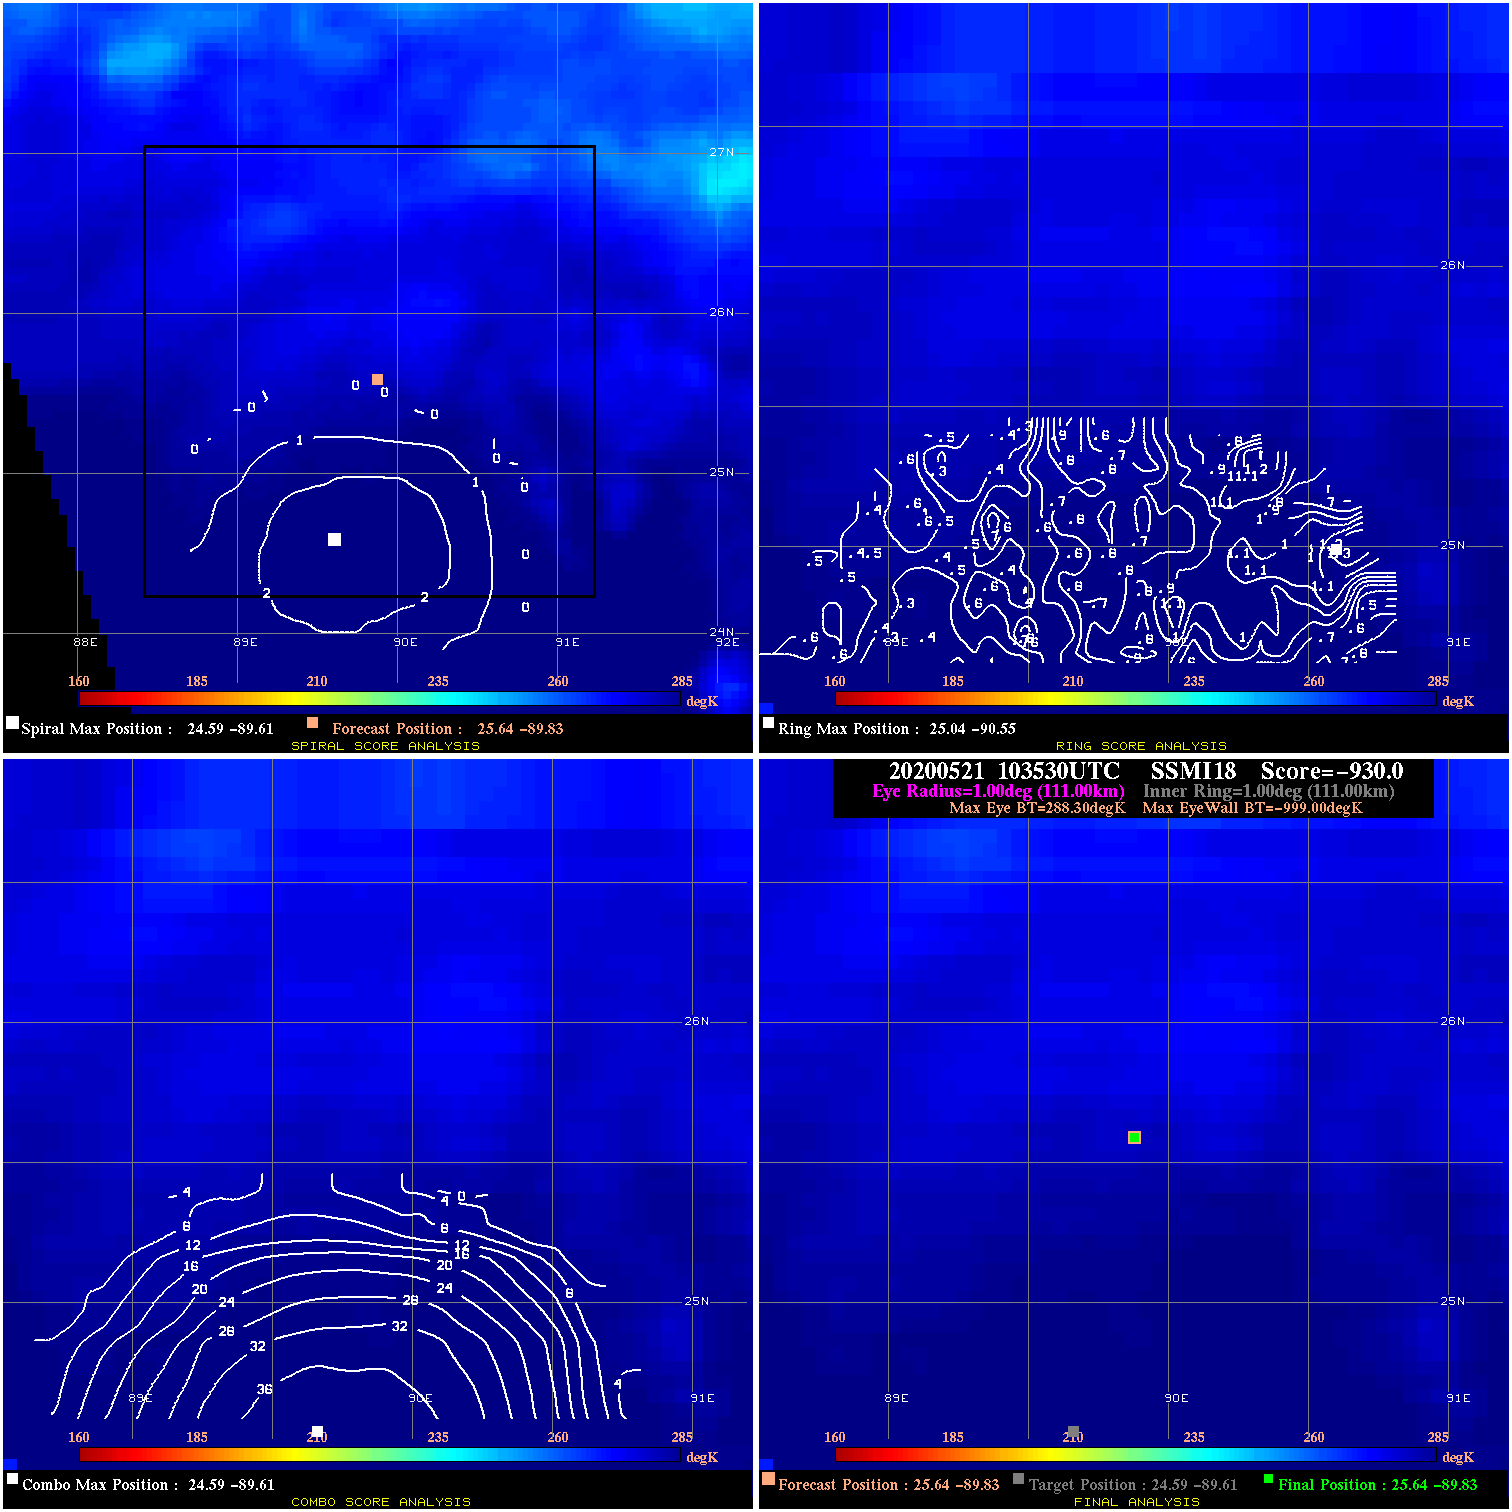
20200521 103530 -930.0 N/A N/A N/A 0.00 30.0 SSMI18 25.6 -89.8 25.6 -89.8 24.6 -89.6 Analysis Plot
|
|
Legend: - Date/Time are determined from PMW imagery at Forecast (initial guess) Lat/Lon position. - Positive/Negative Latitude = North/South Hemisphere; Longitude = Western/Eastern Hemisphere. - "Ring Diam" value indicates the estimated surface eyewall diameter in km (the MI eyewall edge diameter minus 10 km). - "Ring Pct" is the percentage of the "ring" (eyewall inner boundary) that is 1) colder than the "hot spot" (warmest eye pixel) in the eye by 20K, or 2) the percentage that is a) colder than 232K and b) colder than the "hot spot" by 10K, whichever is greater. - Values are red if Ring % <= 65, yellow/brown if Ring % <= 85 and green if Ring % > 85. - "Tb diff" is the difference between the "hot spot" (warmest eye pixel) and the warmest pixel on the eyewall. - Intensity score are listed as negative, and not used, when the JTWC or NHC estimated Vmax is <55 kts in order to rule out weak but highly symmetric TCs. - Error messages in intensity scores: -920 is used when the hottest pixel in the eye is <200K, to prevent false positives; -930 means <85% of eyewall has observations/data. |