Tropical Storm 30Y_04
|
Passive Microwave (PMW) Intensity Information Hurricane Intensity Estimation (HIE) Algorithm Version 9.0 |
Overpass Inten Ring Ring Wind Forecast Final Target
Date Time Score Meaning Pct Diam BTdiff Est Sat Lat Lon Lat Lon Lat Lon
20210906 213348 -2.2 N/A 21.9% 222.20 2.19 45.0 SSMI18 11.8 -125.3 11.8 -125.3 12.0 -124.6 Analysis Plot
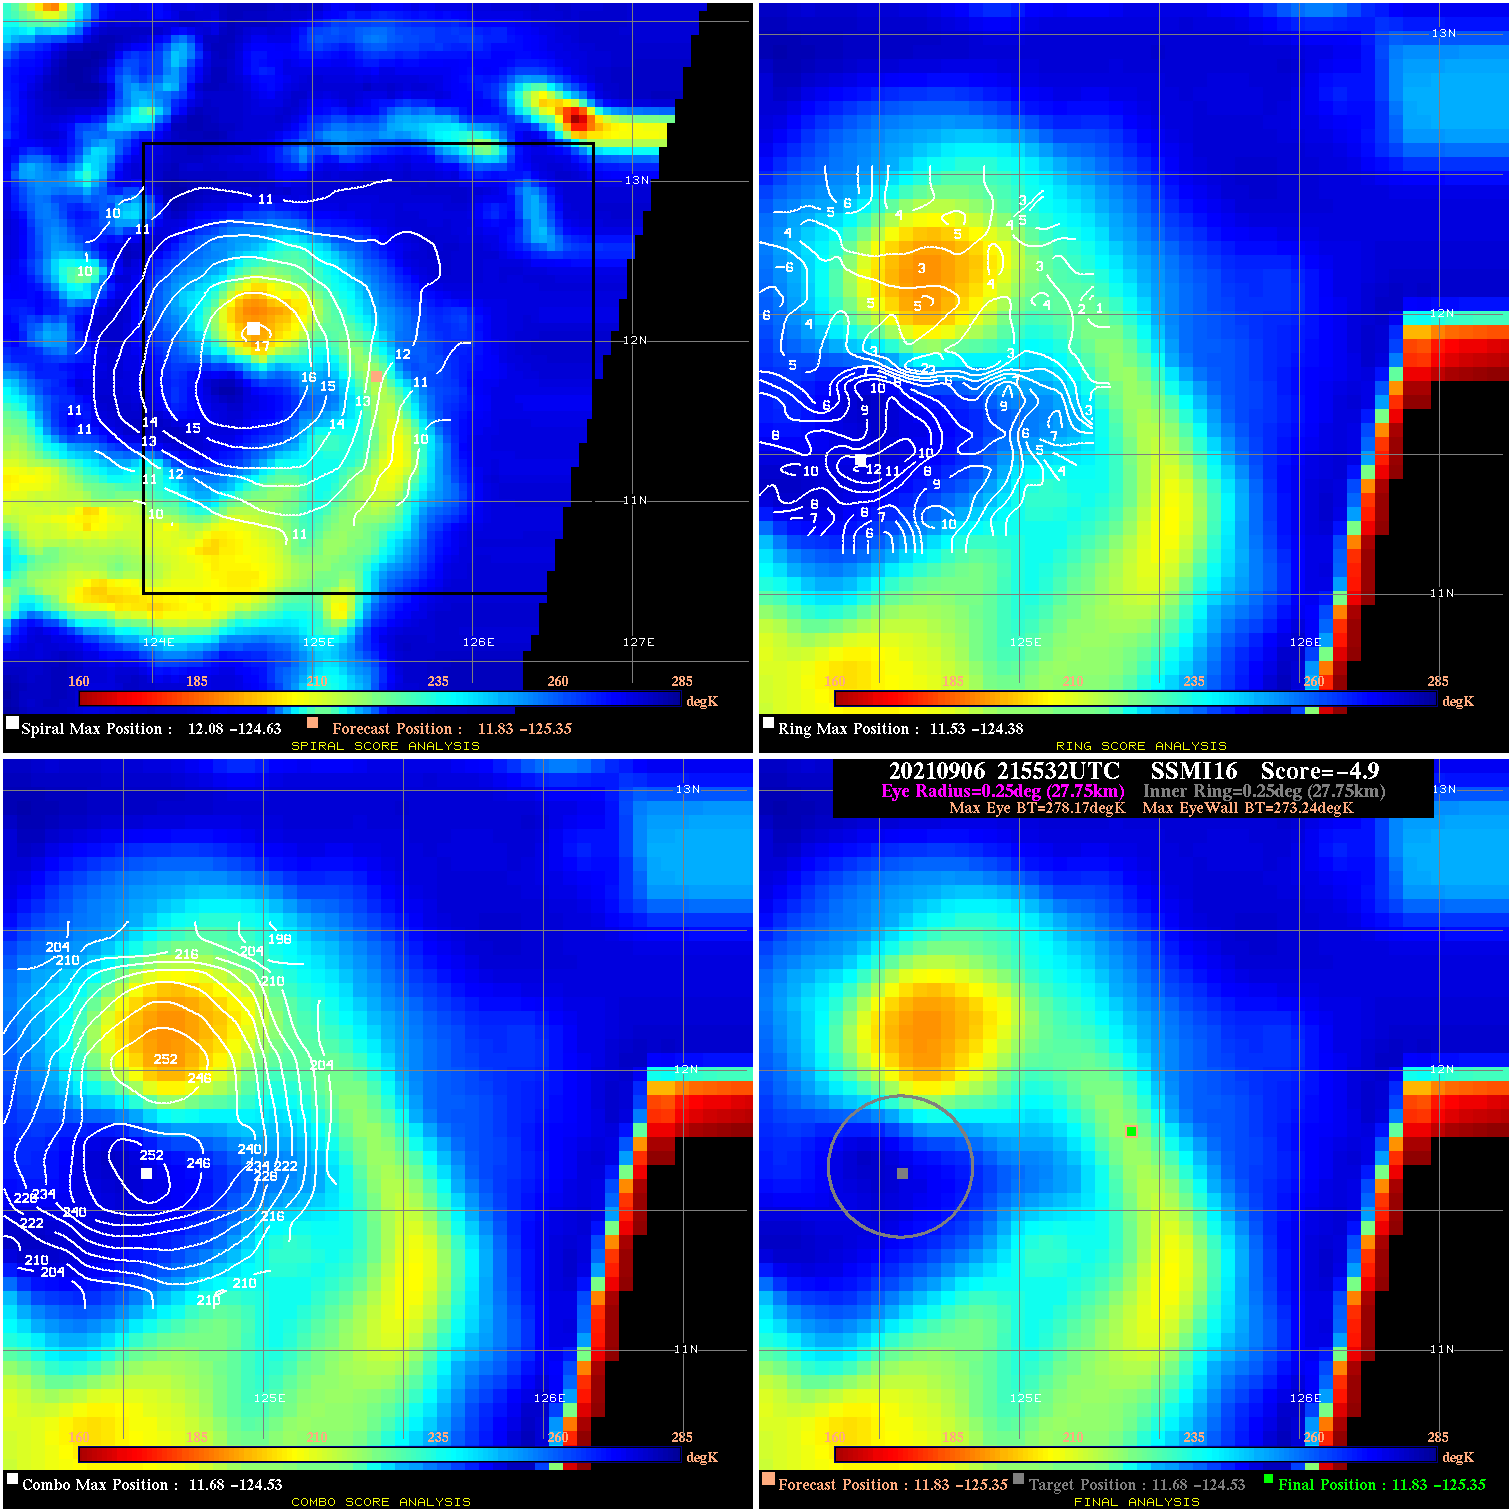
20210906 215532 -4.9 N/A 17.8% 55.55 4.93 45.0 SSMI16 11.8 -125.3 11.8 -125.3 11.7 -124.5 Analysis Plot
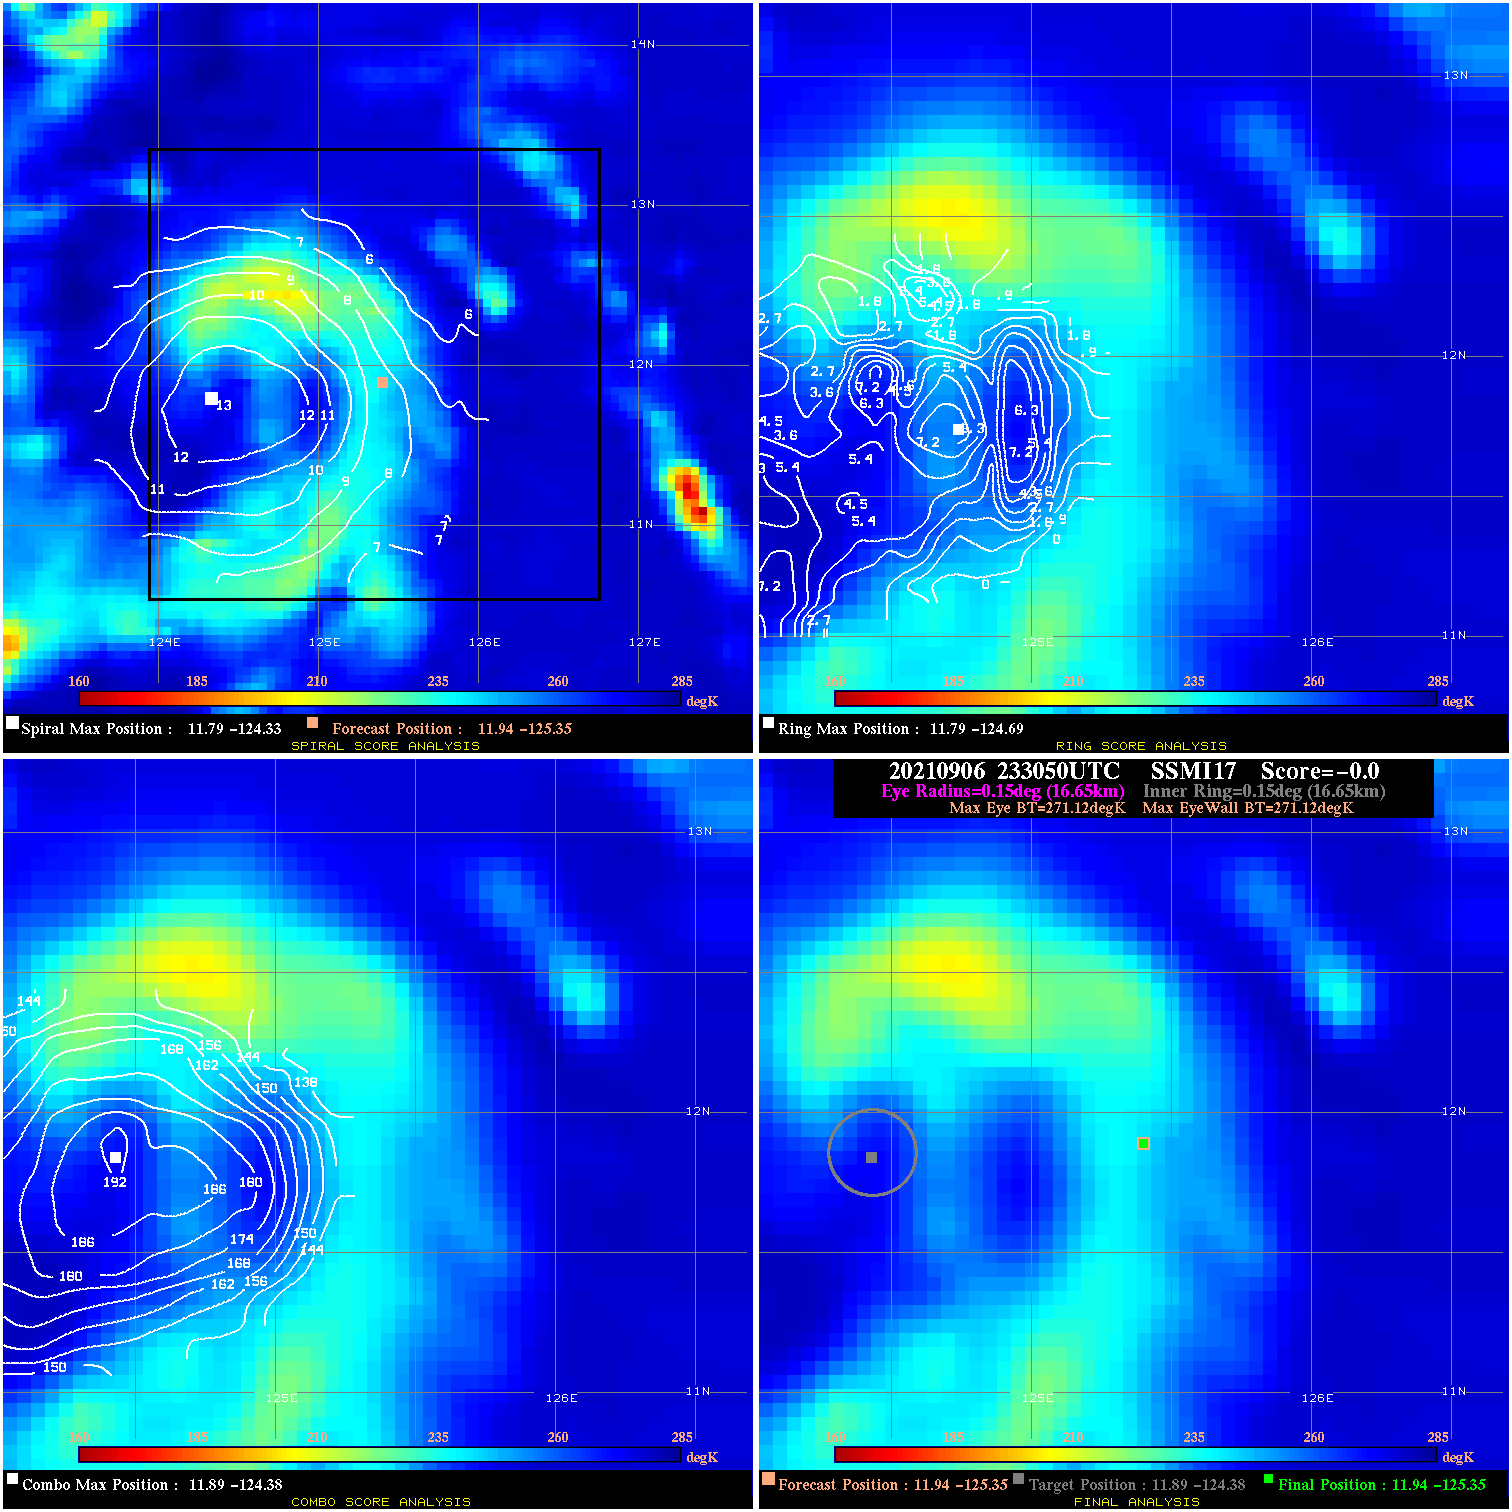
20210906 233050 N/A N/A N/A N/A N/A 45.0 SSMI17 11.9 -125.3 11.9 -125.3 11.9 -124.4 Analysis Plot
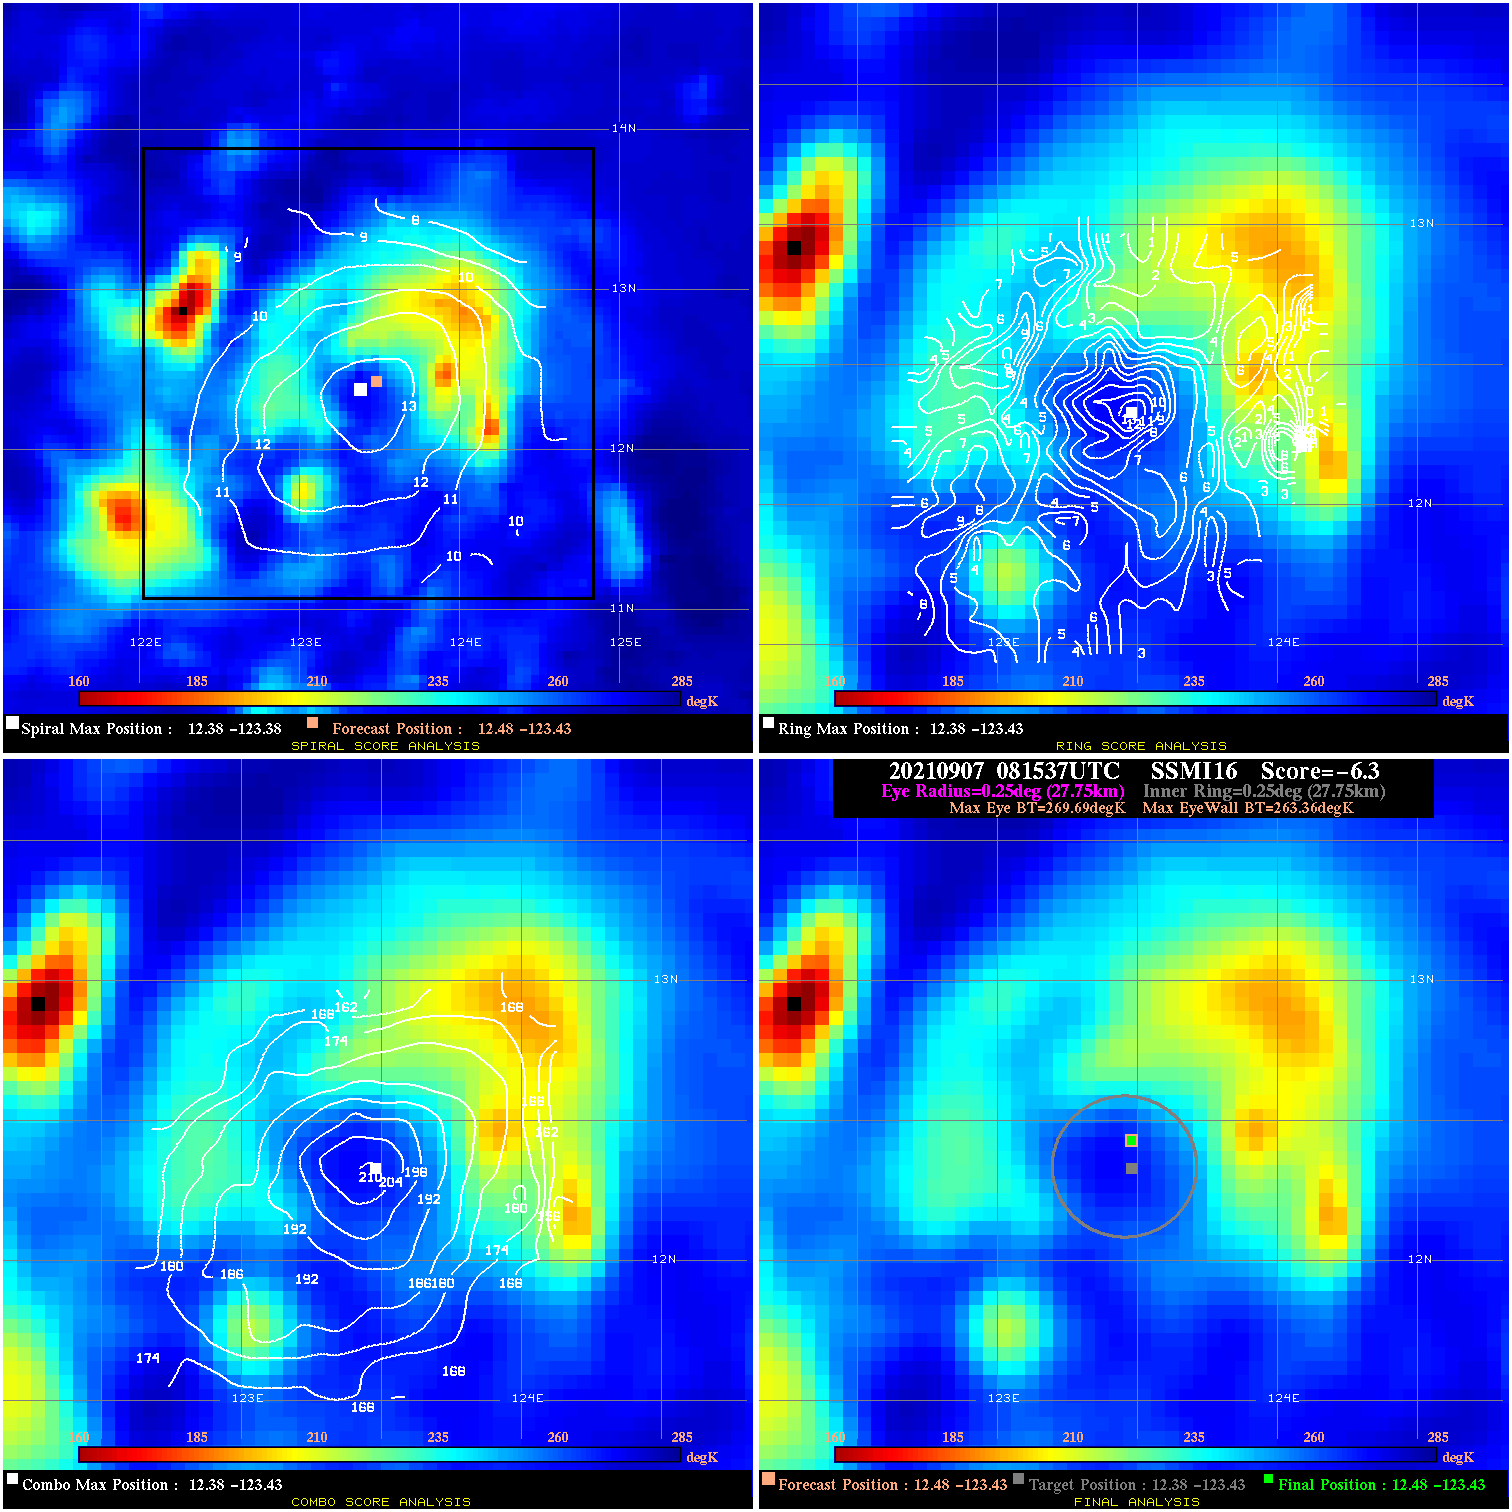
20210907 081537 -6.3 N/A 9.6% 55.55 6.33 45.0 SSMI16 12.5 -123.4 12.5 -123.4 12.4 -123.4 Analysis Plot
20210907 094330 -2.0 N/A 46.6% 55.55 1.98 45.0 SSMI18 12.6 -123.5 12.6 -123.5 12.3 -123.4 Analysis Plot
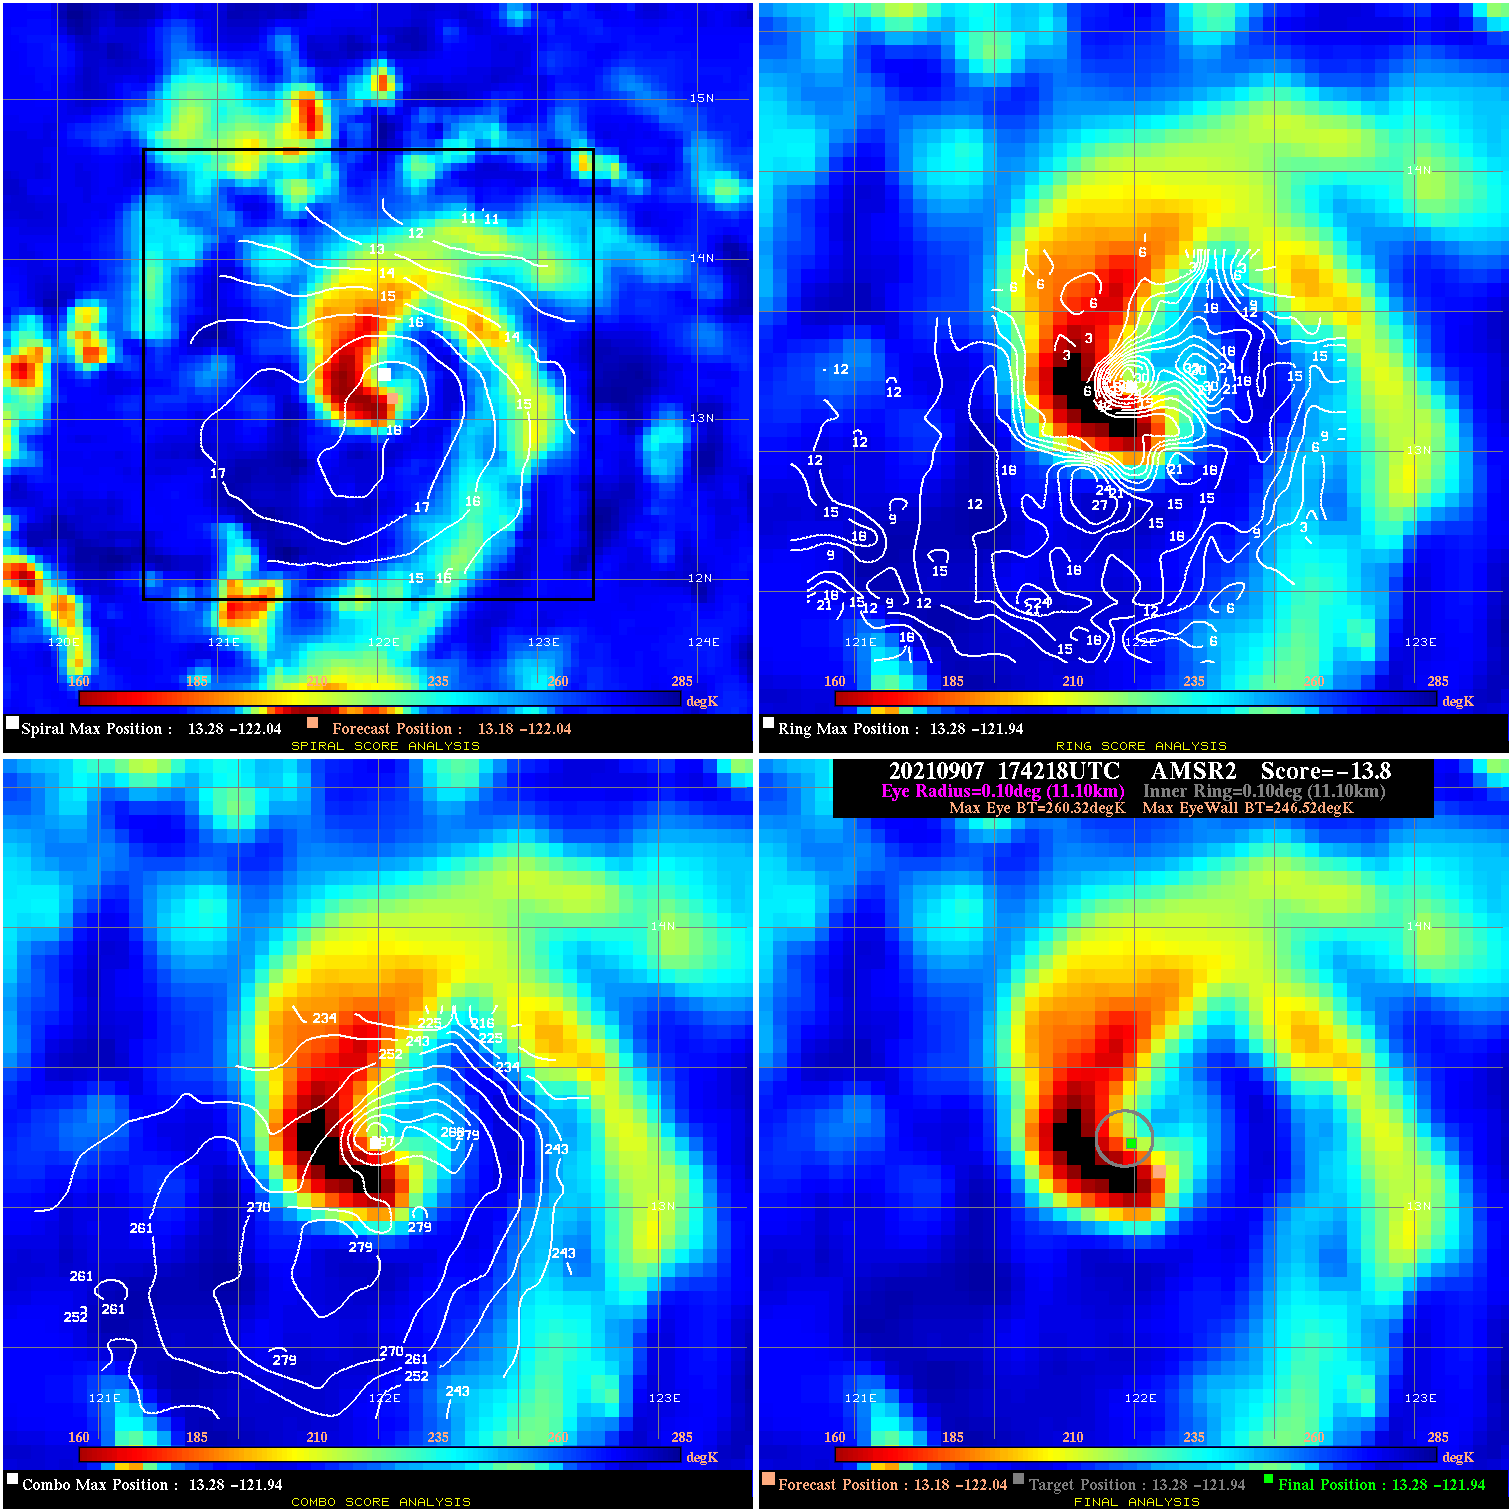
20210907 174218 -13.8 N/A 84.9% 22.22 13.80 40.0 AMSR2 13.2 -122.0 13.3 -121.9 13.3 -121.9 Analysis Plot
20210907 214248 -6.1 N/A 38.4% 44.44 6.13 40.0 SSMI16 12.9 -121.9 12.9 -121.9 13.5 -121.8 Analysis Plot
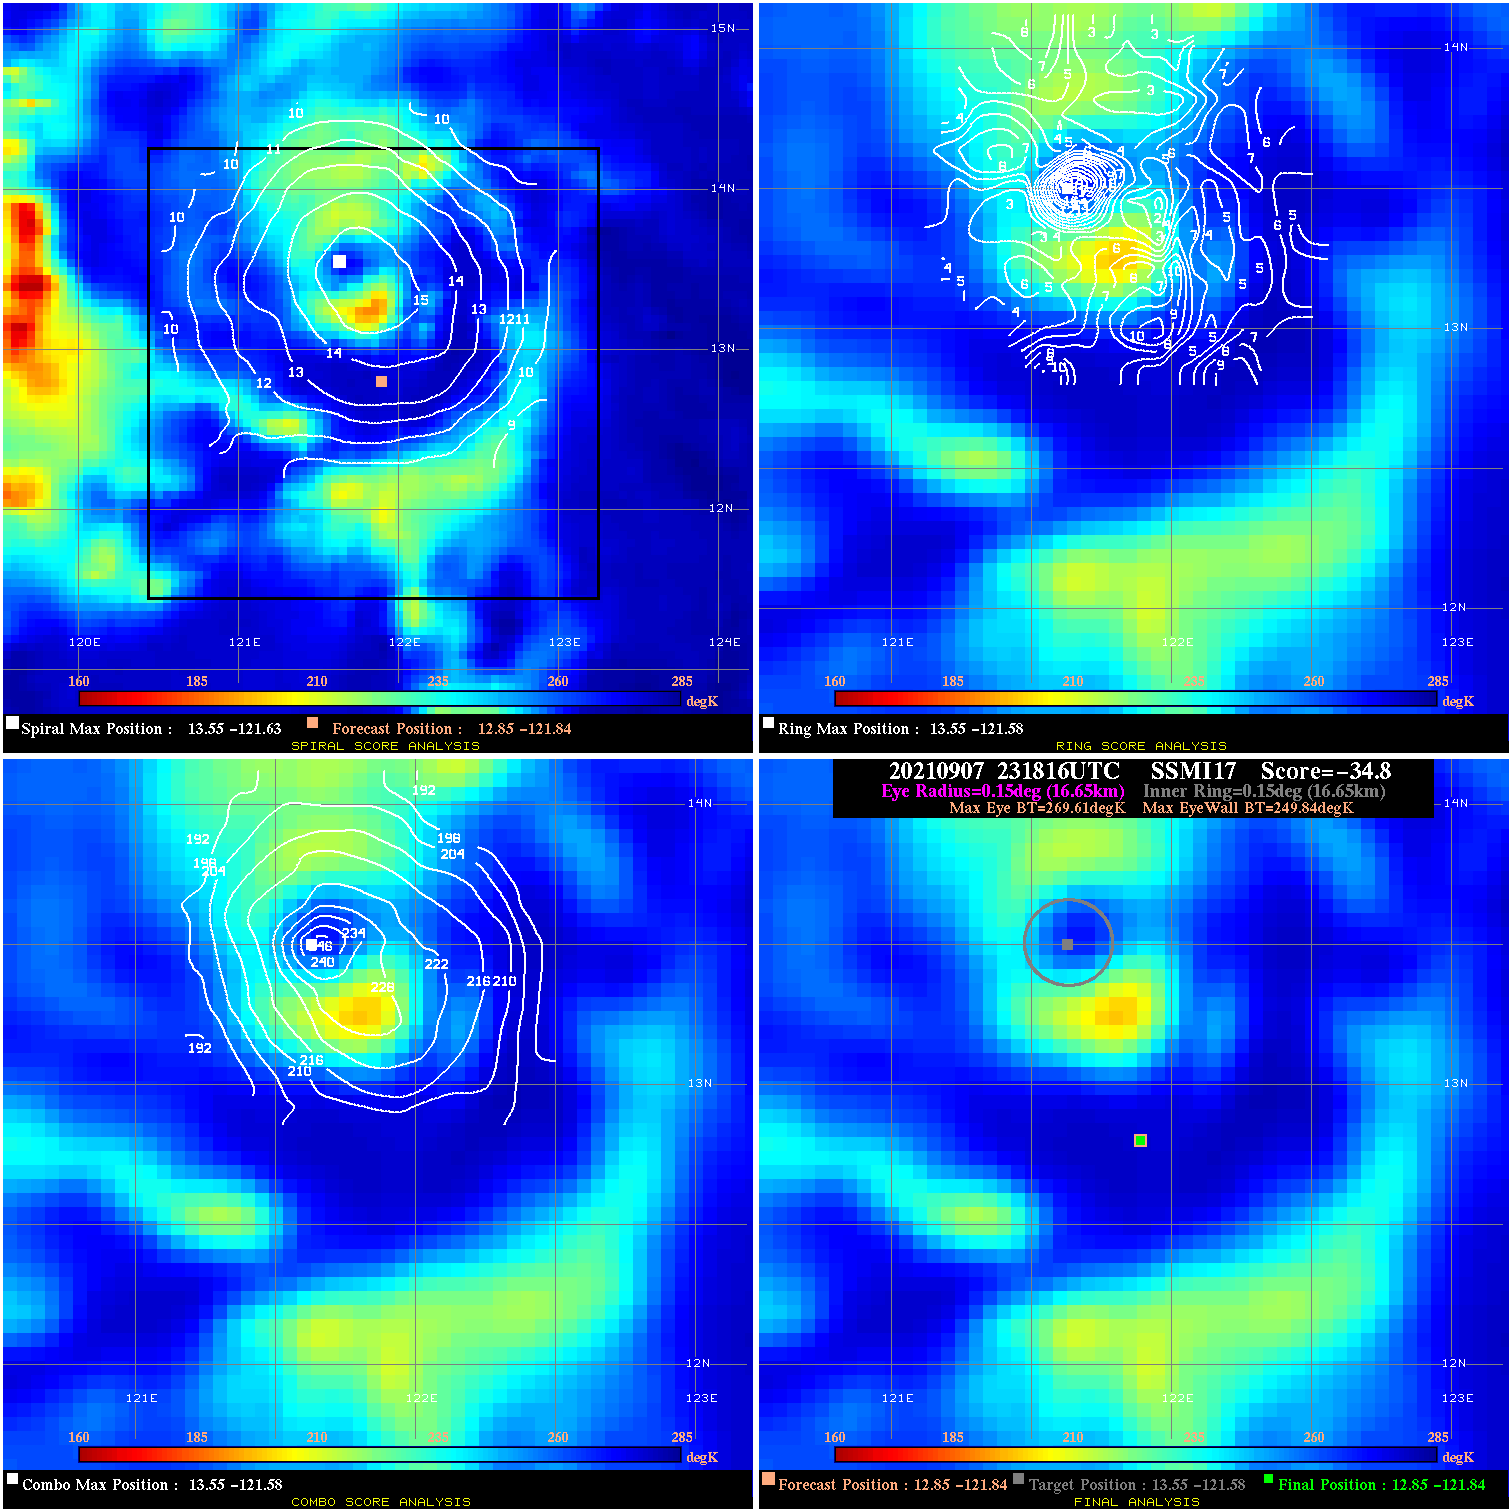
20210907 231816 -34.8 N/A 95.9% 33.33 19.77 40.0 SSMI17 12.9 -121.8 12.9 -121.8 13.6 -121.6 Analysis Plot
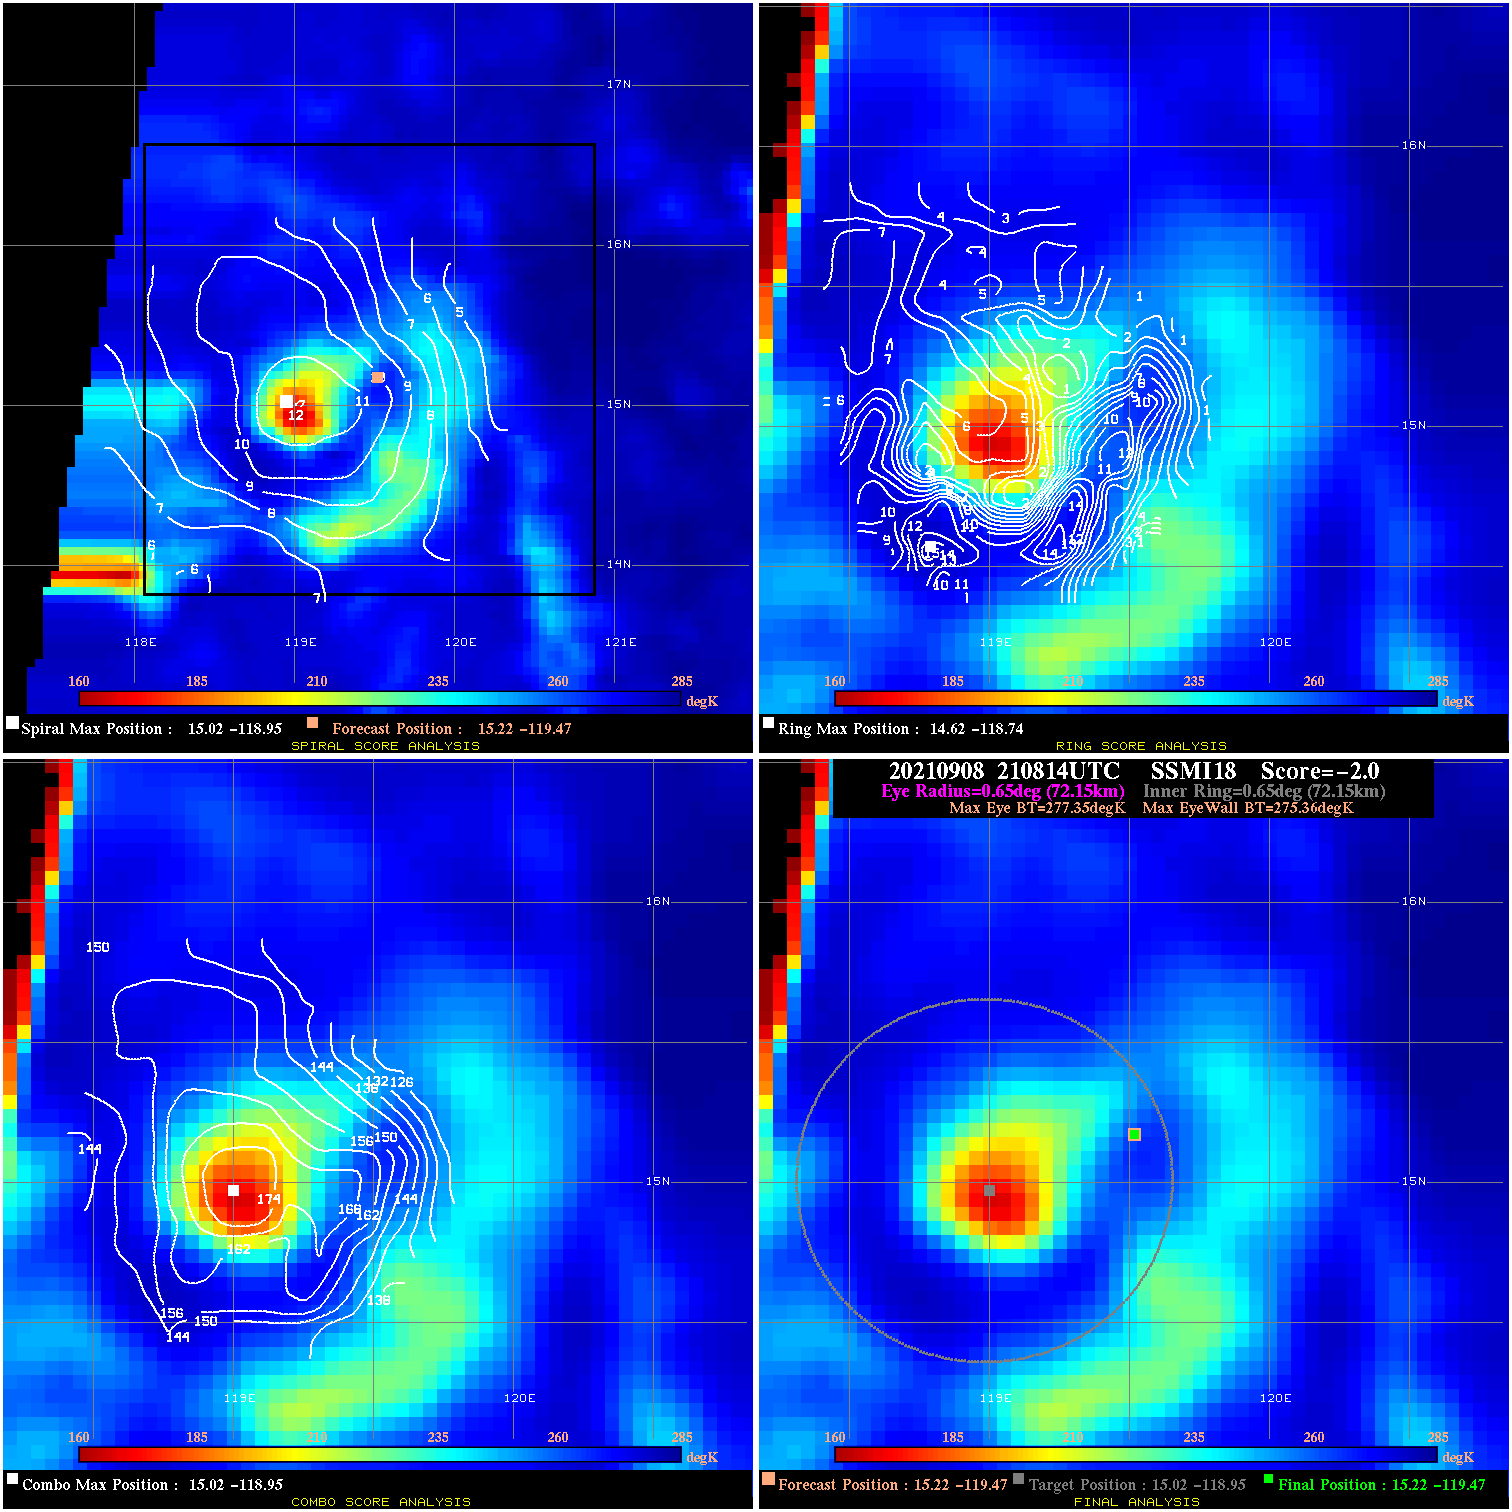
20210908 210814 -2.0 N/A 4.1% 144.43 1.99 45.0 SSMI18 15.2 -119.5 15.2 -119.5 15.0 -118.9 Analysis Plot
20210908 213024 -1.9 N/A 13.7% 33.33 1.89 45.0 SSMI16 15.2 -119.5 15.2 -119.5 14.7 -119.3 Analysis Plot
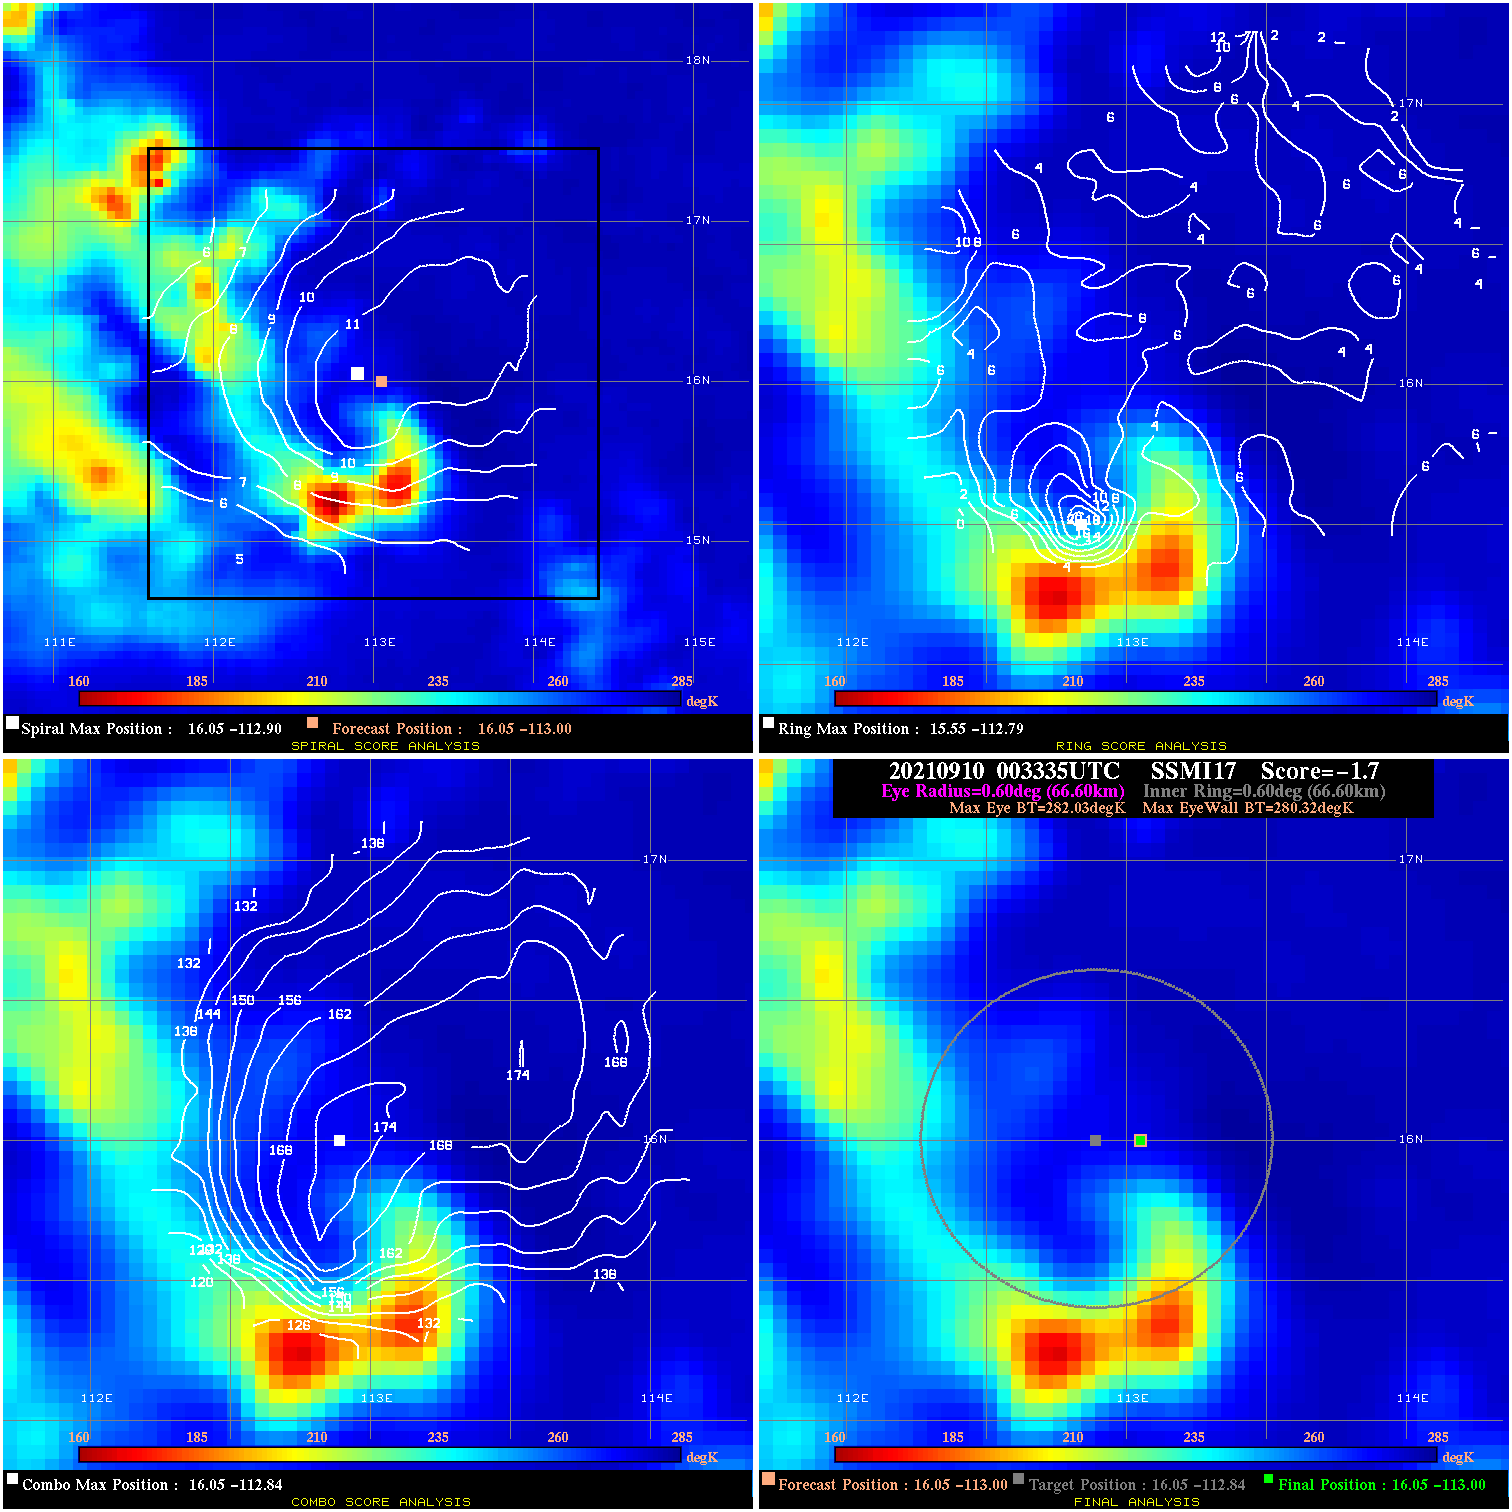
20210910 003335 -1.7 N/A 21.9% 133.32 1.71 50.0 SSMI17 16.0 -113.0 16.0 -113.0 16.0 -112.8 Analysis Plot
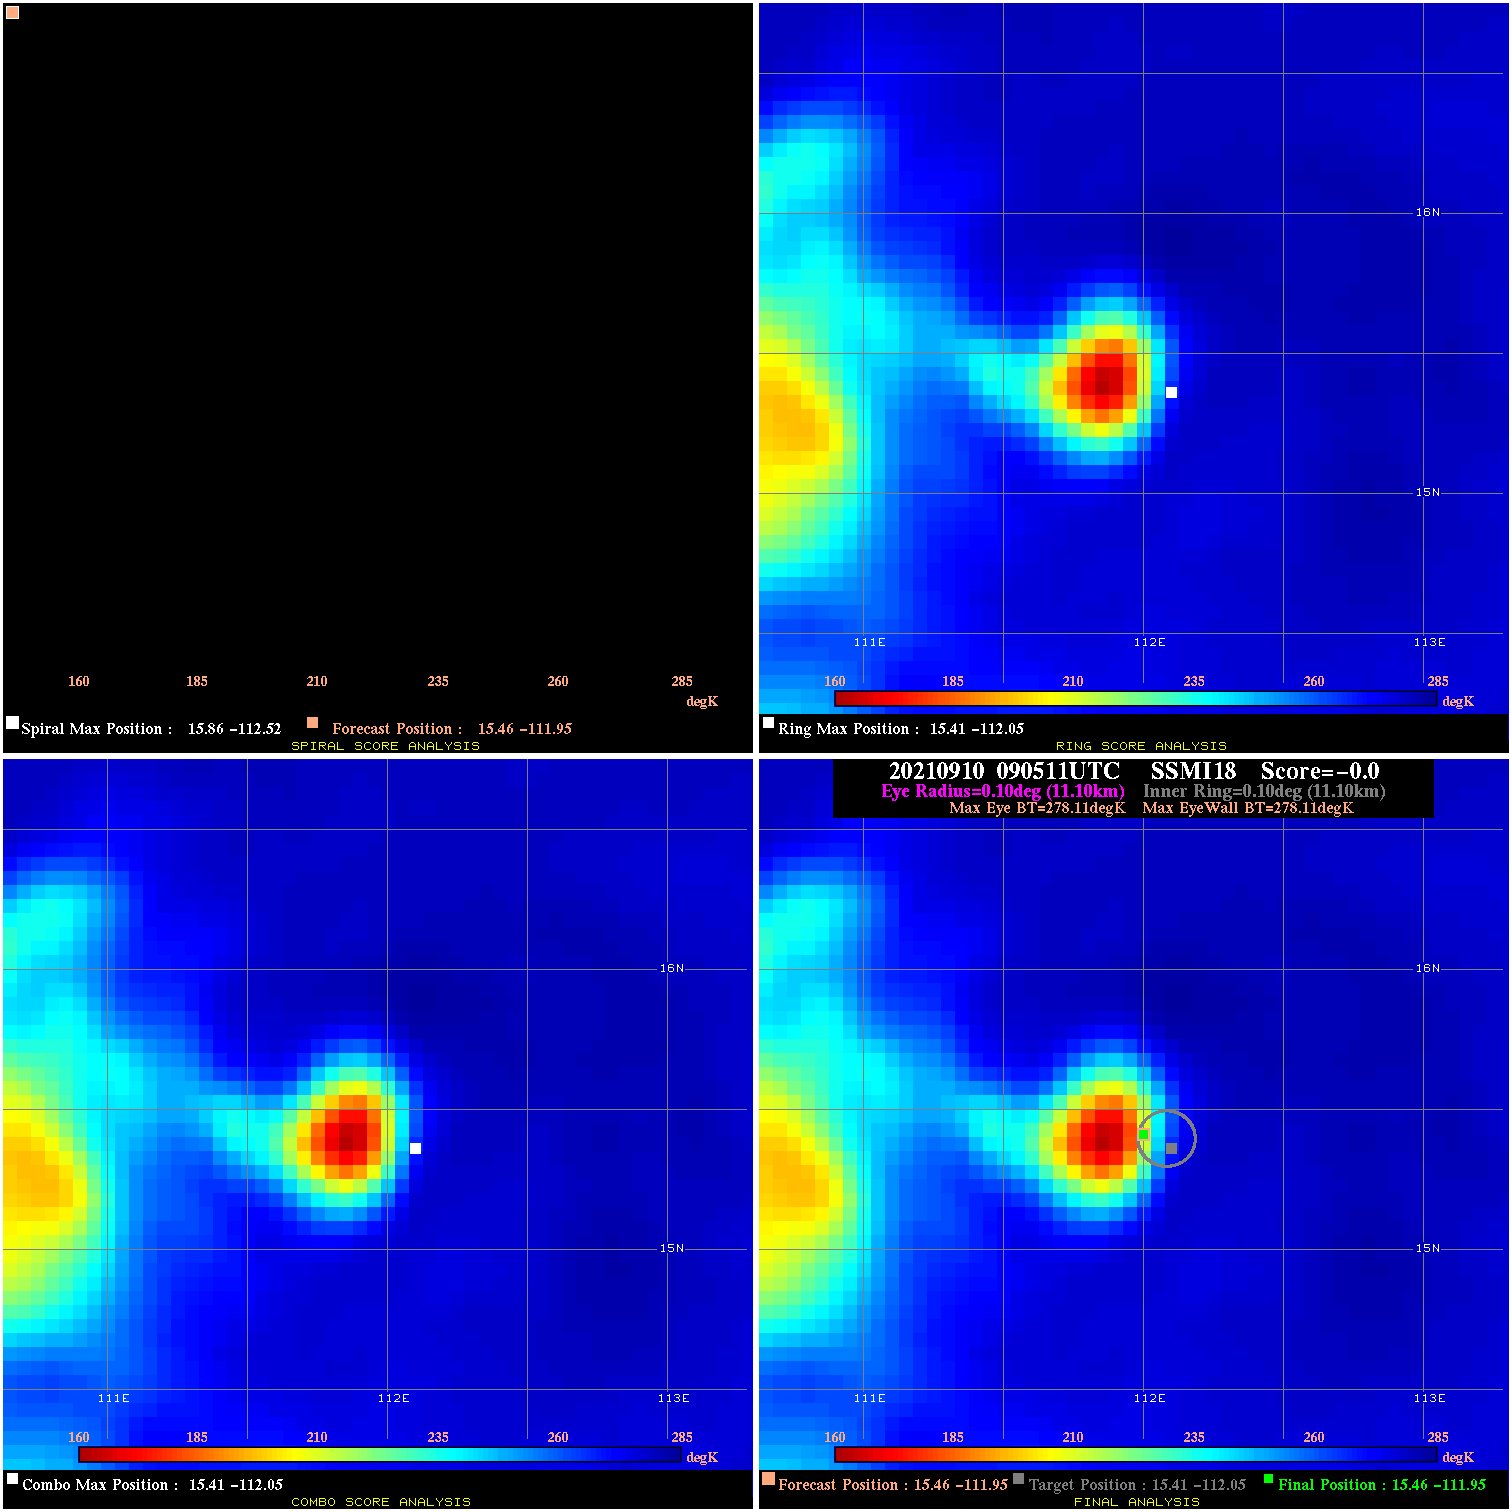
20210910 090511 N/A N/A N/A N/A N/A 50.0 SSMI18 15.5 -111.9 15.5 -111.9 15.4 -112.1 Analysis Plot
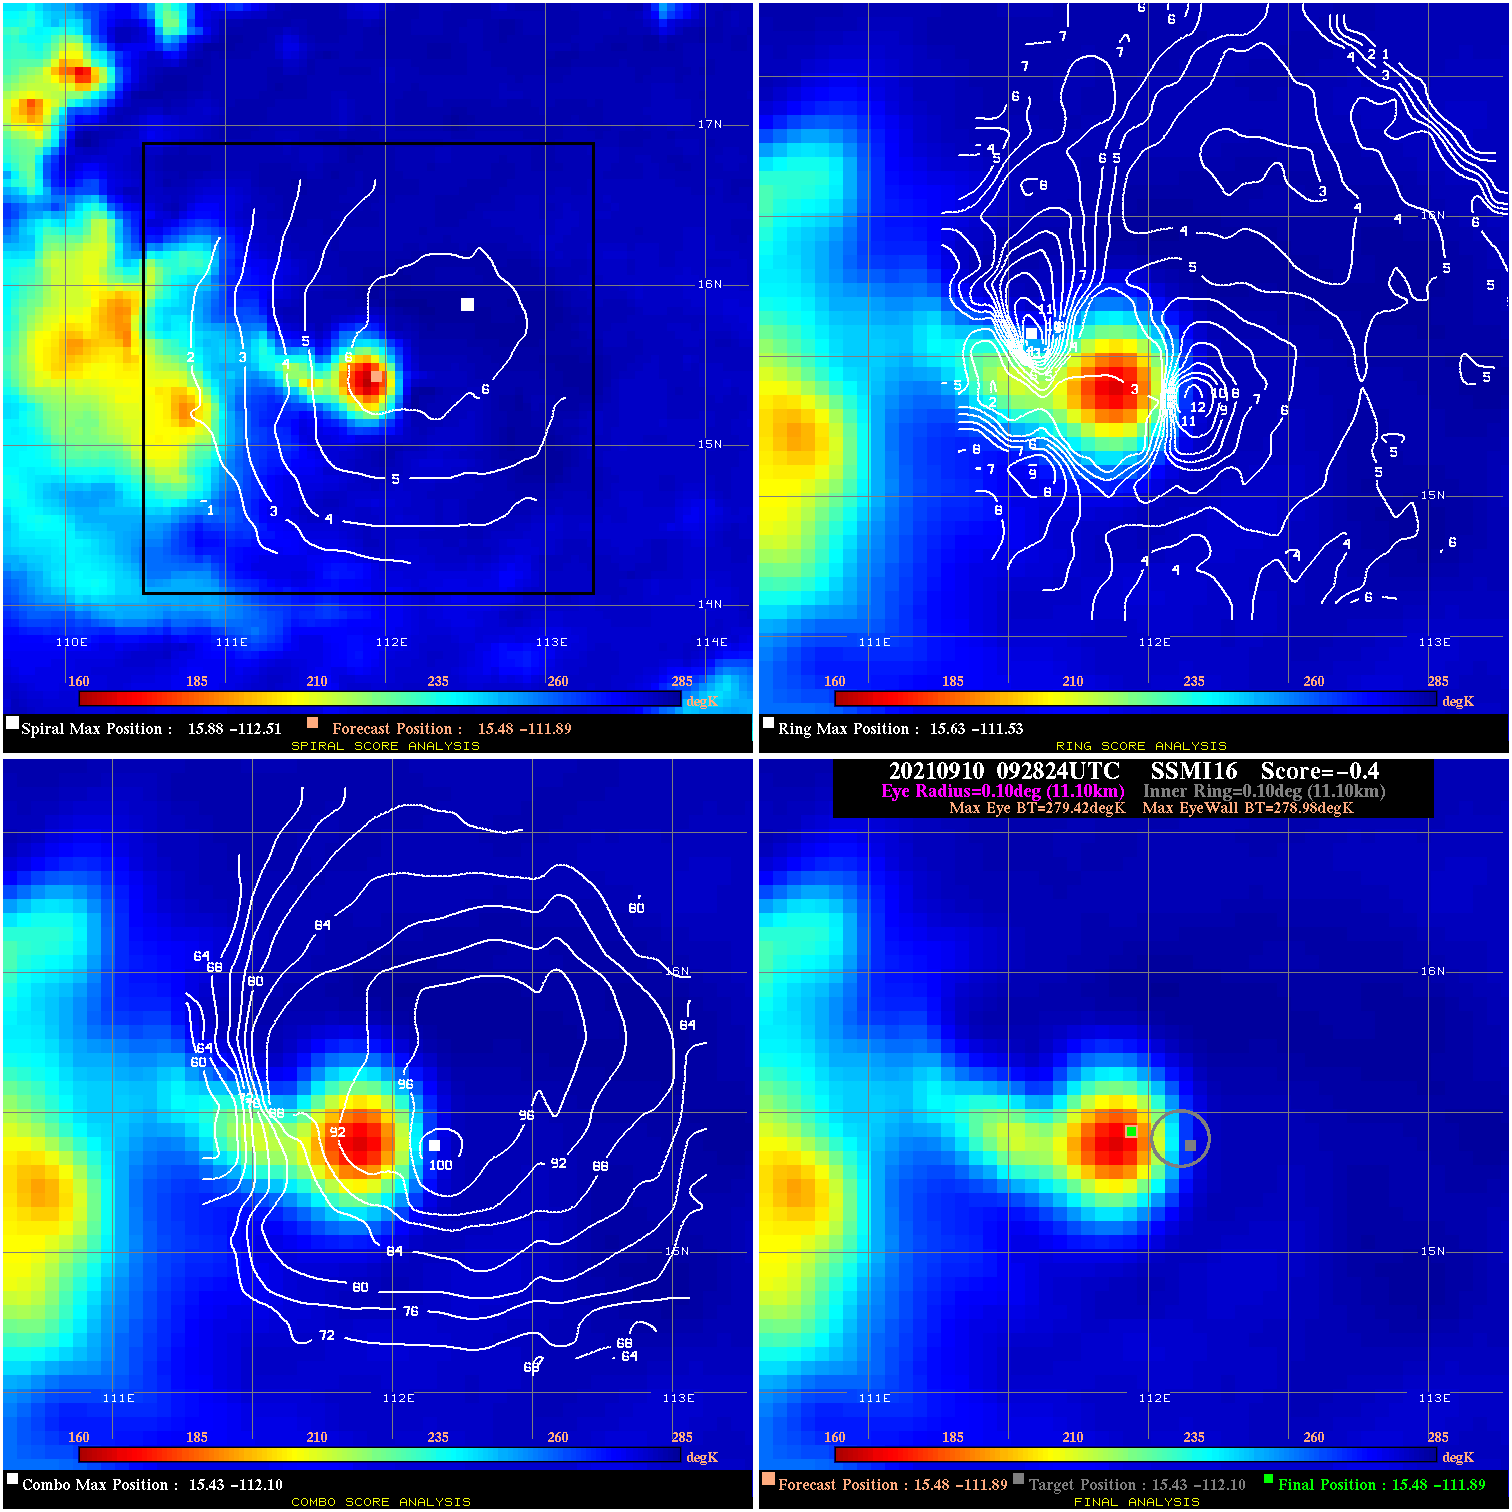
20210910 092824 -0.4 N/A 17.8% 22.22 .44 50.0 SSMI16 15.5 -111.9 15.5 -111.9 15.4 -112.1 Analysis Plot
20210910 110044 -1.4 N/A 6.8% 122.21 1.39 50.0 SSMI17 15.5 -111.8 15.5 -111.8 15.6 -112.2 Analysis Plot
20210910 181240 2.3 N/A 8.2% 33.33 2.30 55.0 AMSR2 15.4 -110.9 15.4 -110.9 15.7 -110.8 Analysis Plot
20210910 222429 N/A N/A N/A N/A N/A 55.0 SSMI18 15.4 -110.7 15.4 -110.7 15.6 -109.6 Analysis Plot
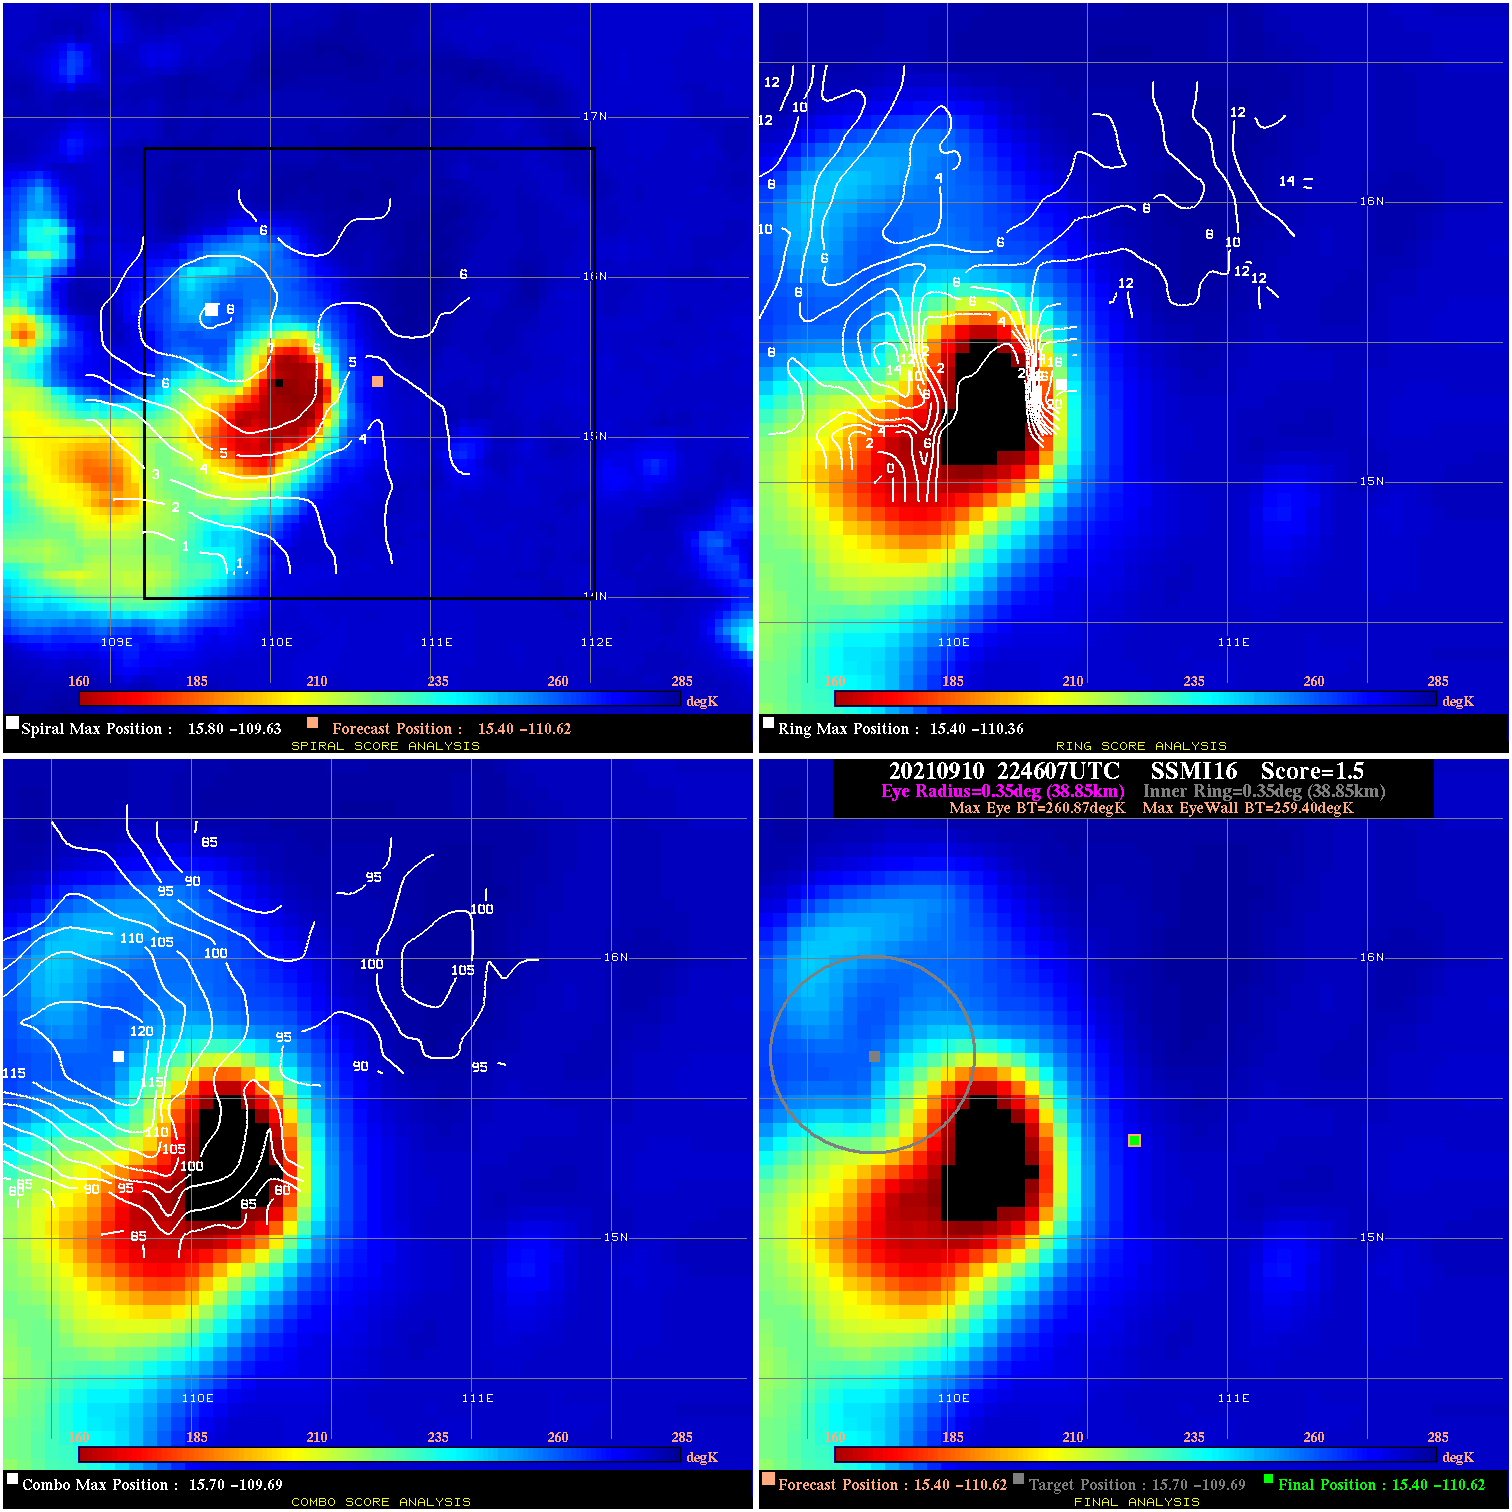
20210910 224607 1.5 N/A 32.9% 77.77 1.47 55.0 SSMI16 15.4 -110.6 15.4 -110.6 15.7 -109.7 Analysis Plot
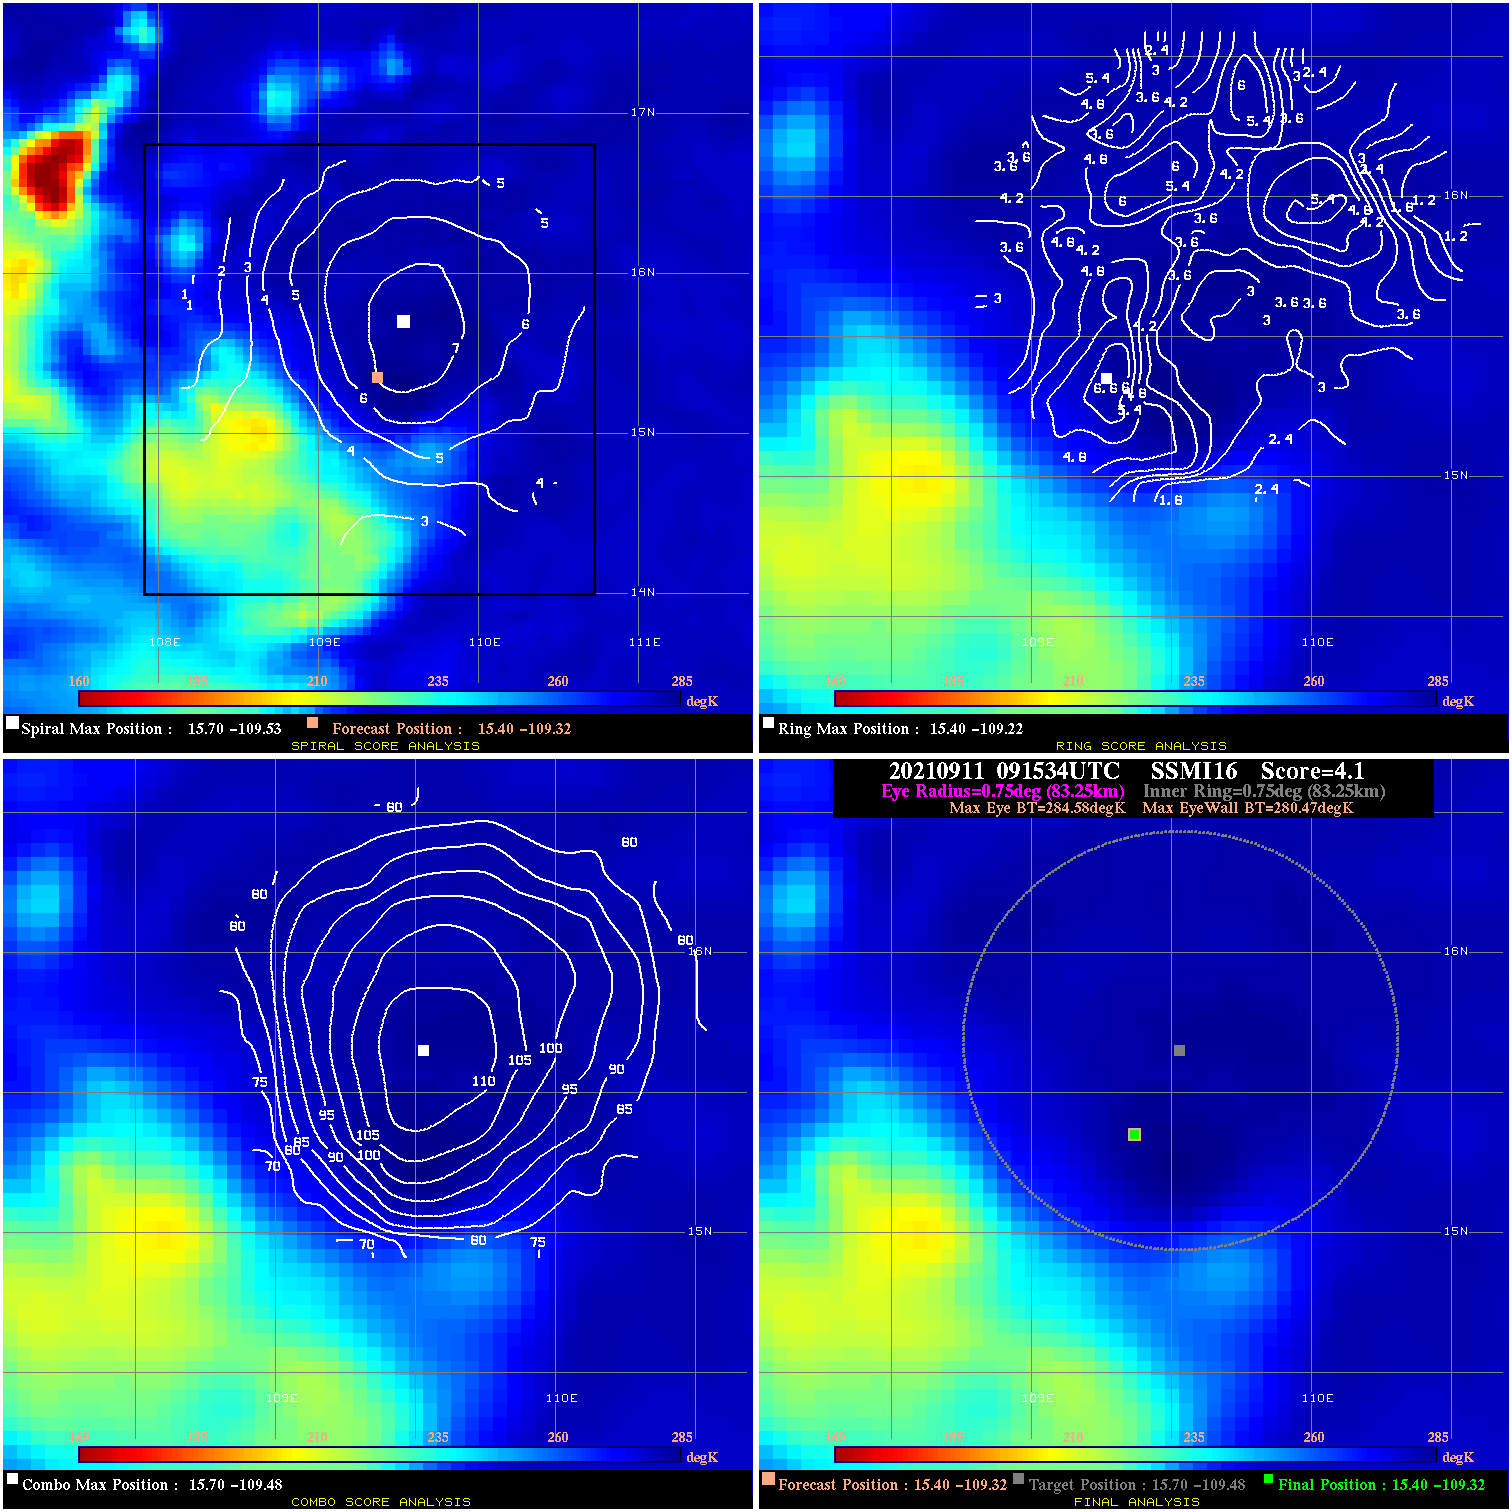
20210911 091534 4.1 N/A 8.2% 166.65 4.11 55.0 SSMI16 15.4 -109.3 15.4 -109.3 15.7 -109.5 Analysis Plot
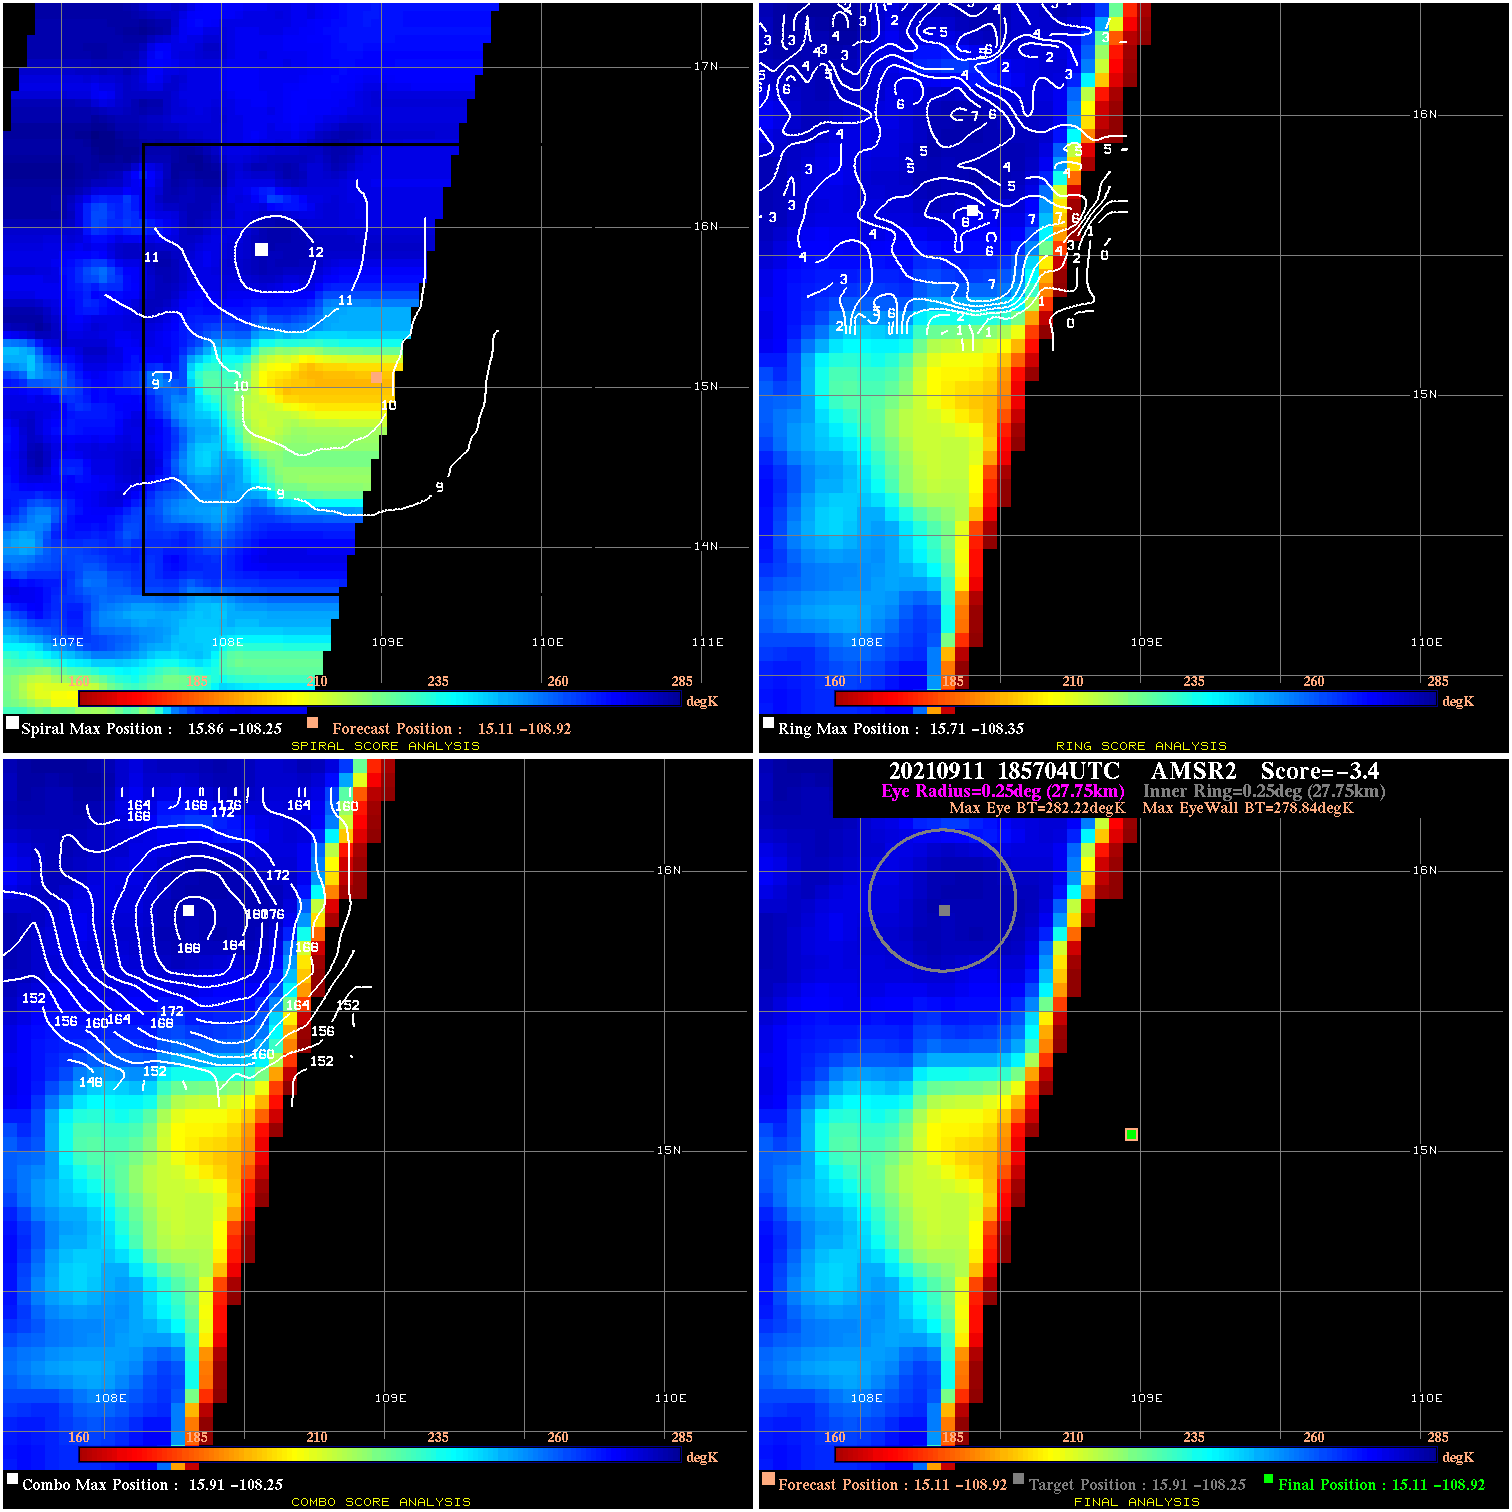
20210911 185704 -3.4 N/A N/A 55.55 3.38 40.0 AMSR2 15.1 -108.9 15.1 -108.9 15.9 -108.3 Analysis Plot
20210911 221218 -1.4 N/A N/A 33.33 1.44 40.0 SSMI18 15.1 -108.8 15.1 -108.8 15.6 -108.2 Analysis Plot
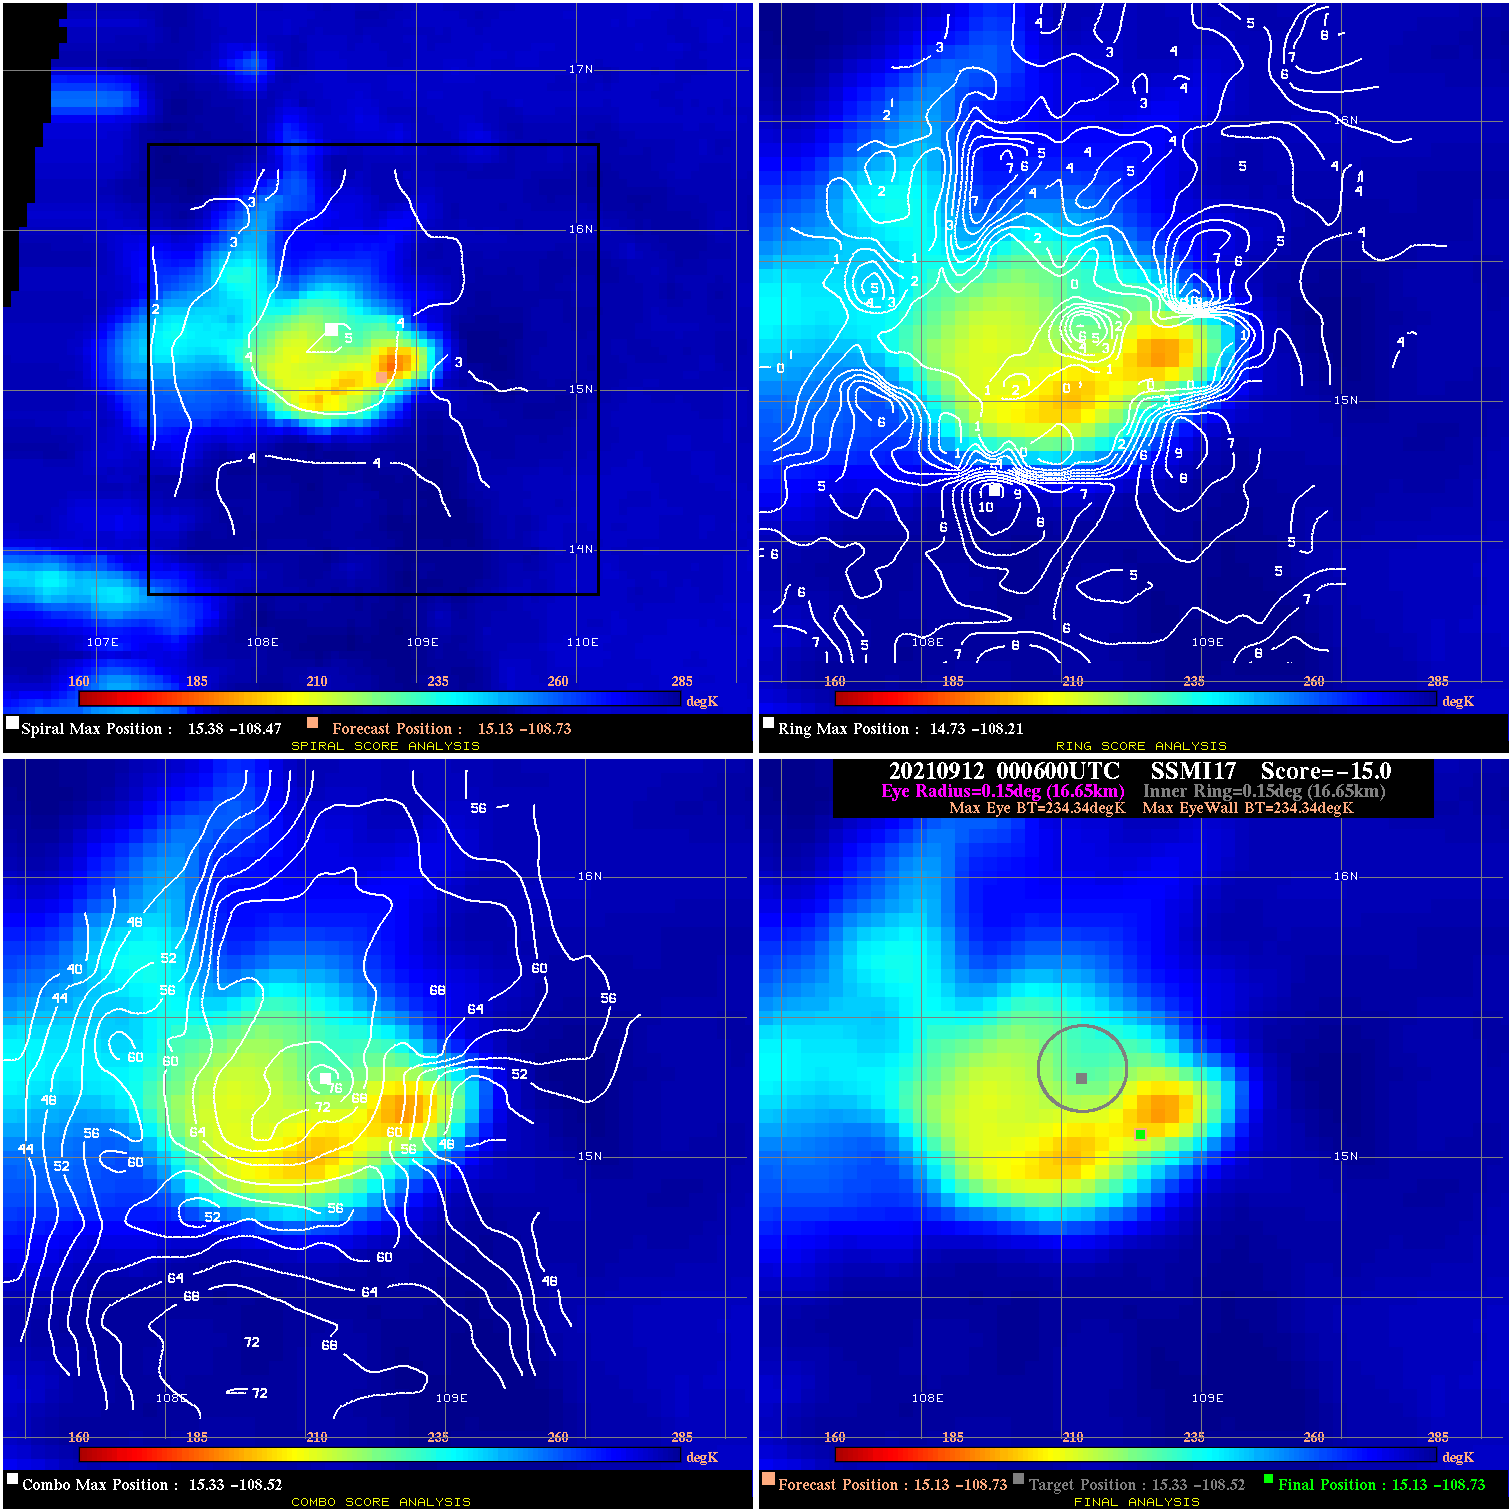
20210912 000600 N/A N/A N/A N/A N/A 40.0 SSMI17 15.1 -108.7 15.1 -108.7 15.3 -108.5 Analysis Plot
|
|
Legend: - Date/Time are determined from PMW imagery at Forecast (initial guess) Lat/Lon position. - Positive/Negative Latitude = North/South Hemisphere; Longitude = Western/Eastern Hemisphere. - "Ring Diam" value indicates the estimated surface eyewall diameter in km (the MI eyewall edge diameter minus 10 km). - "Ring Pct" is the percentage of the "ring" (eyewall inner boundary) that is 1) colder than the "hot spot" (warmest eye pixel) in the eye by 20K, or 2) the percentage that is a) colder than 232K and b) colder than the "hot spot" by 10K, whichever is greater. - Values are red if Ring % <= 65, yellow/brown if Ring % <= 85 and green if Ring % > 85. - "Tb diff" is the difference between the "hot spot" (warmest eye pixel) and the warmest pixel on the eyewall. - Intensity score are listed as negative, and not used, when the JTWC or NHC estimated Vmax is <55 kts in order to rule out weak but highly symmetric TCs. - Error messages in intensity scores: -920 is used when the hottest pixel in the eye is <200K, to prevent false positives; -930 means <85% of eyewall has observations/data. |