Tropical Storm 32Y_03
|
Passive Microwave (PMW) Intensity Information Hurricane Intensity Estimation (HIE) Algorithm Version 9.0 |
Overpass Inten Ring Ring Wind Forecast Final Target
Date Time Score Meaning Pct Diam BTdiff Est Sat Lat Lon Lat Lon Lat Lon
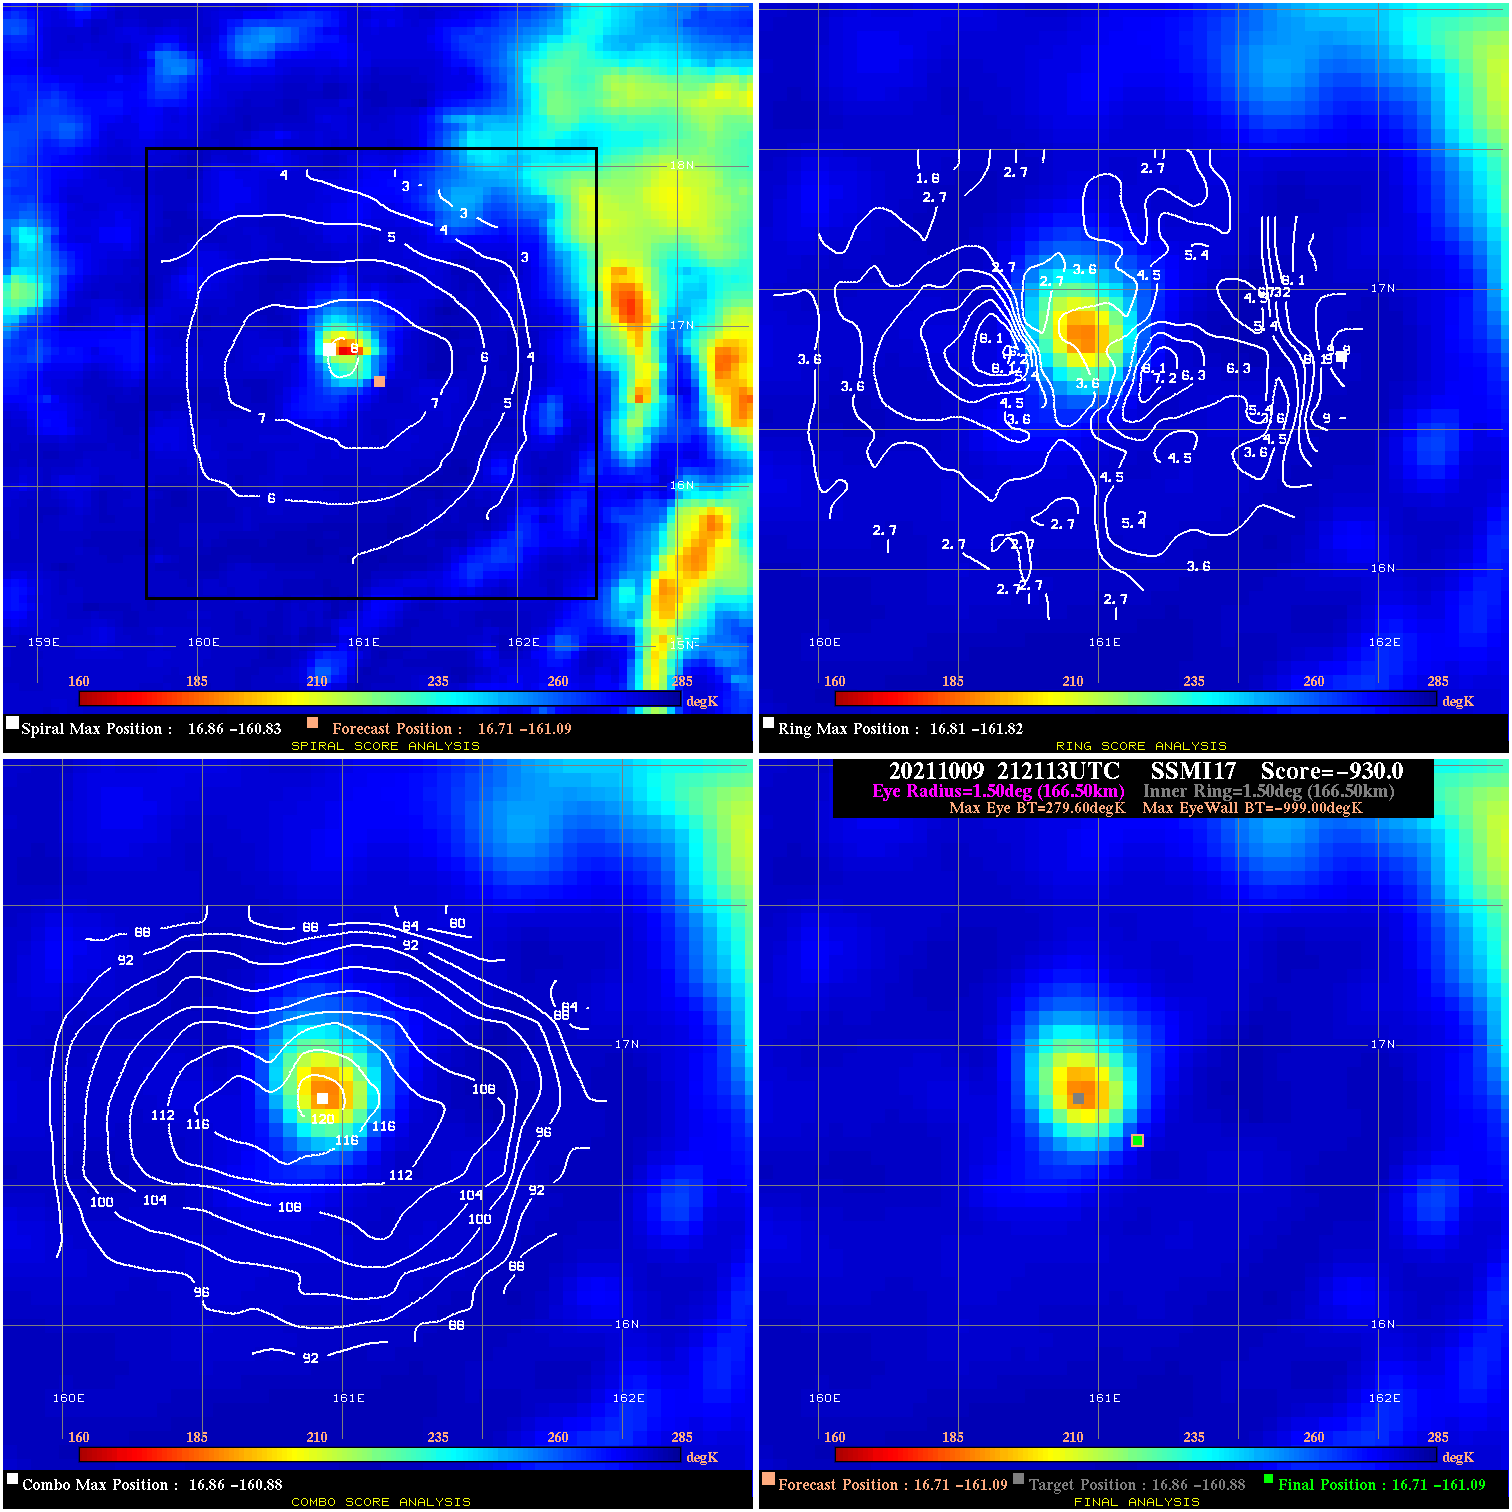
20211009 212113 -930.0 N/A N/A N/A 0.00 30.0 SSMI17 16.7 -161.1 16.7 -161.1 16.9 -160.9 Analysis Plot
20211010 074004 -0.4 N/A 28.8% 77.77 .44 35.0 SSMI17 17.1 -159.3 17.1 -159.3 17.3 -160.6 Analysis Plot
20211010 192510 -930.0 N/A N/A N/A 0.00 35.0 SSMI18 17.1 -158.2 17.1 -158.2 17.5 -158.1 Analysis Plot
20211010 200126 -930.0 N/A N/A N/A 0.00 35.0 SSMI16 17.1 -158.2 17.1 -158.2 17.8 -158.6 Analysis Plot
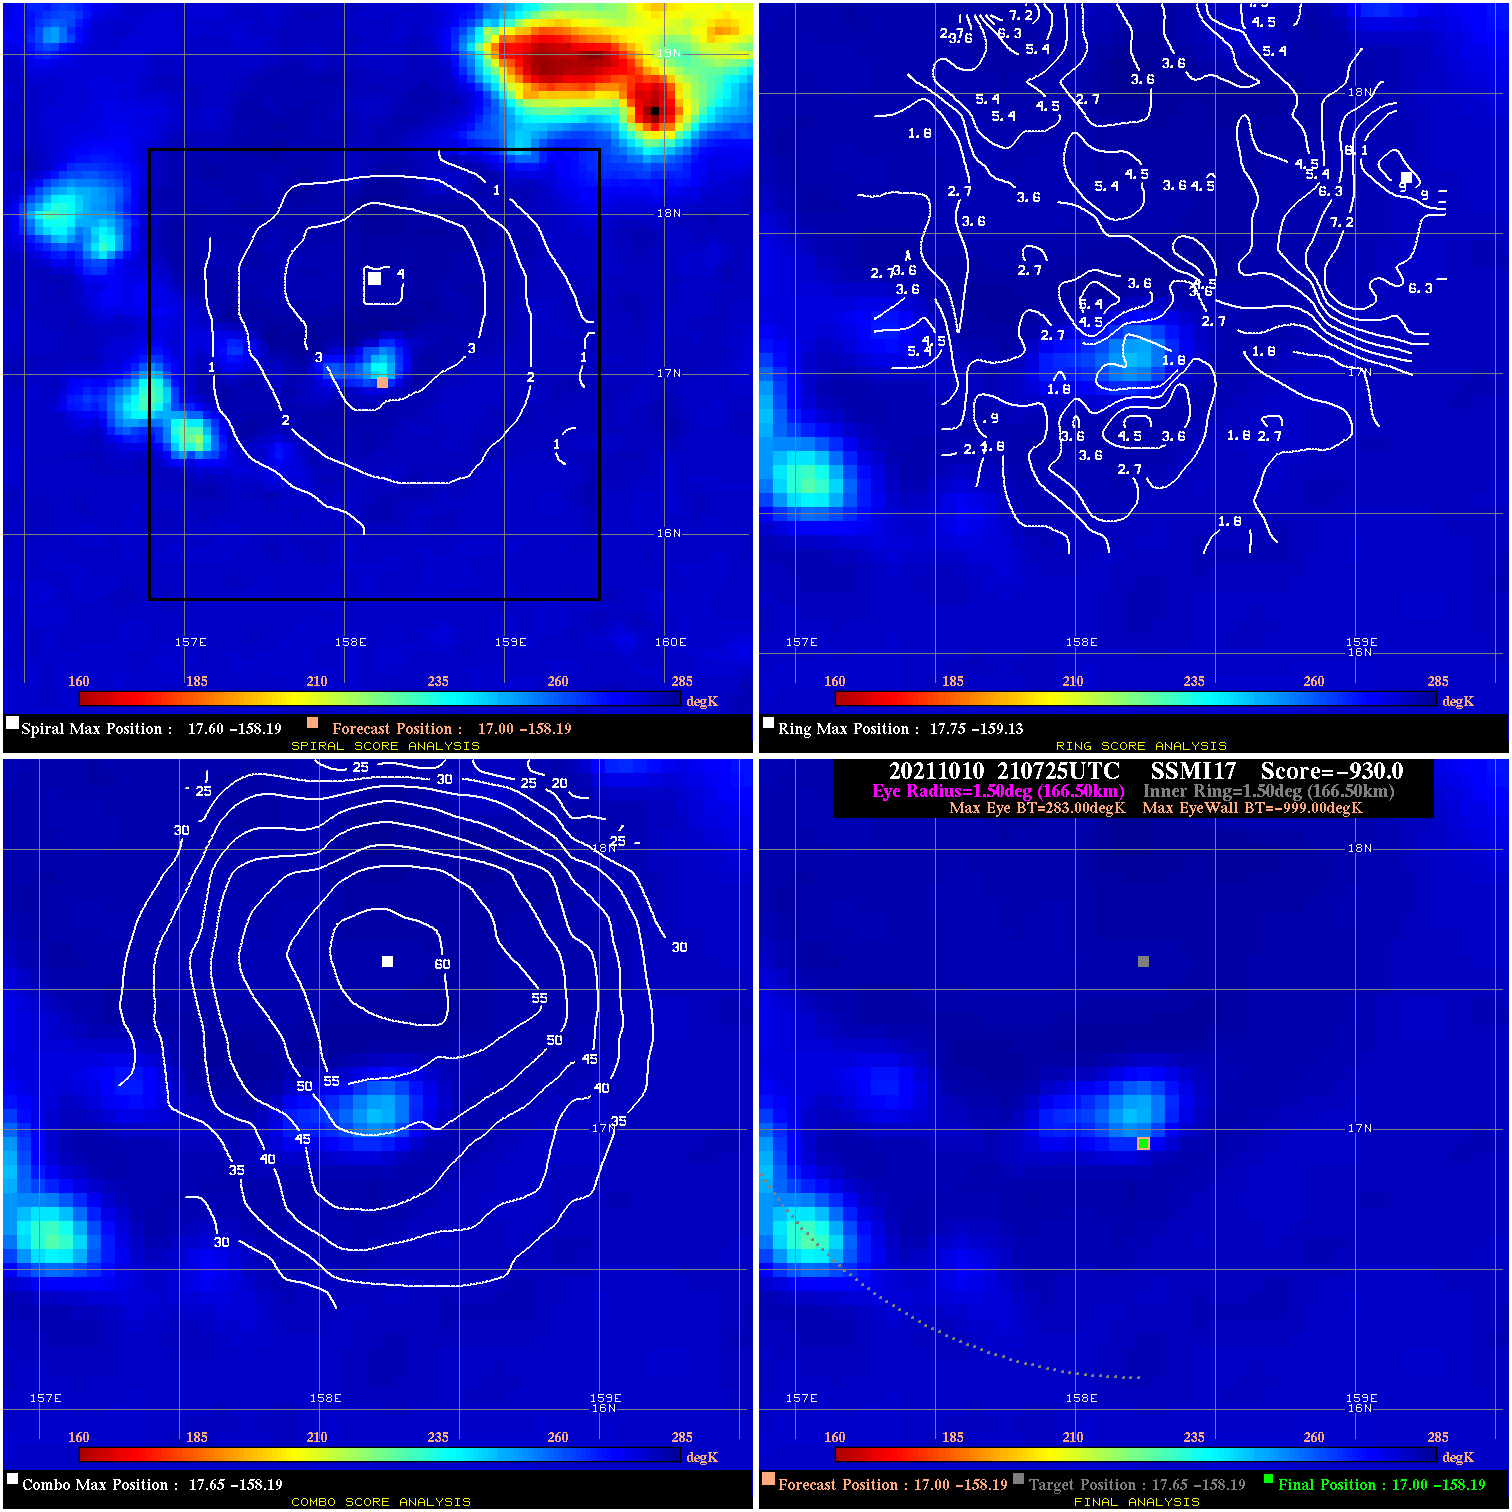
20211010 210725 -930.0 N/A N/A N/A 0.00 35.0 SSMI17 17.0 -158.2 17.0 -158.2 17.6 -158.2 Analysis Plot
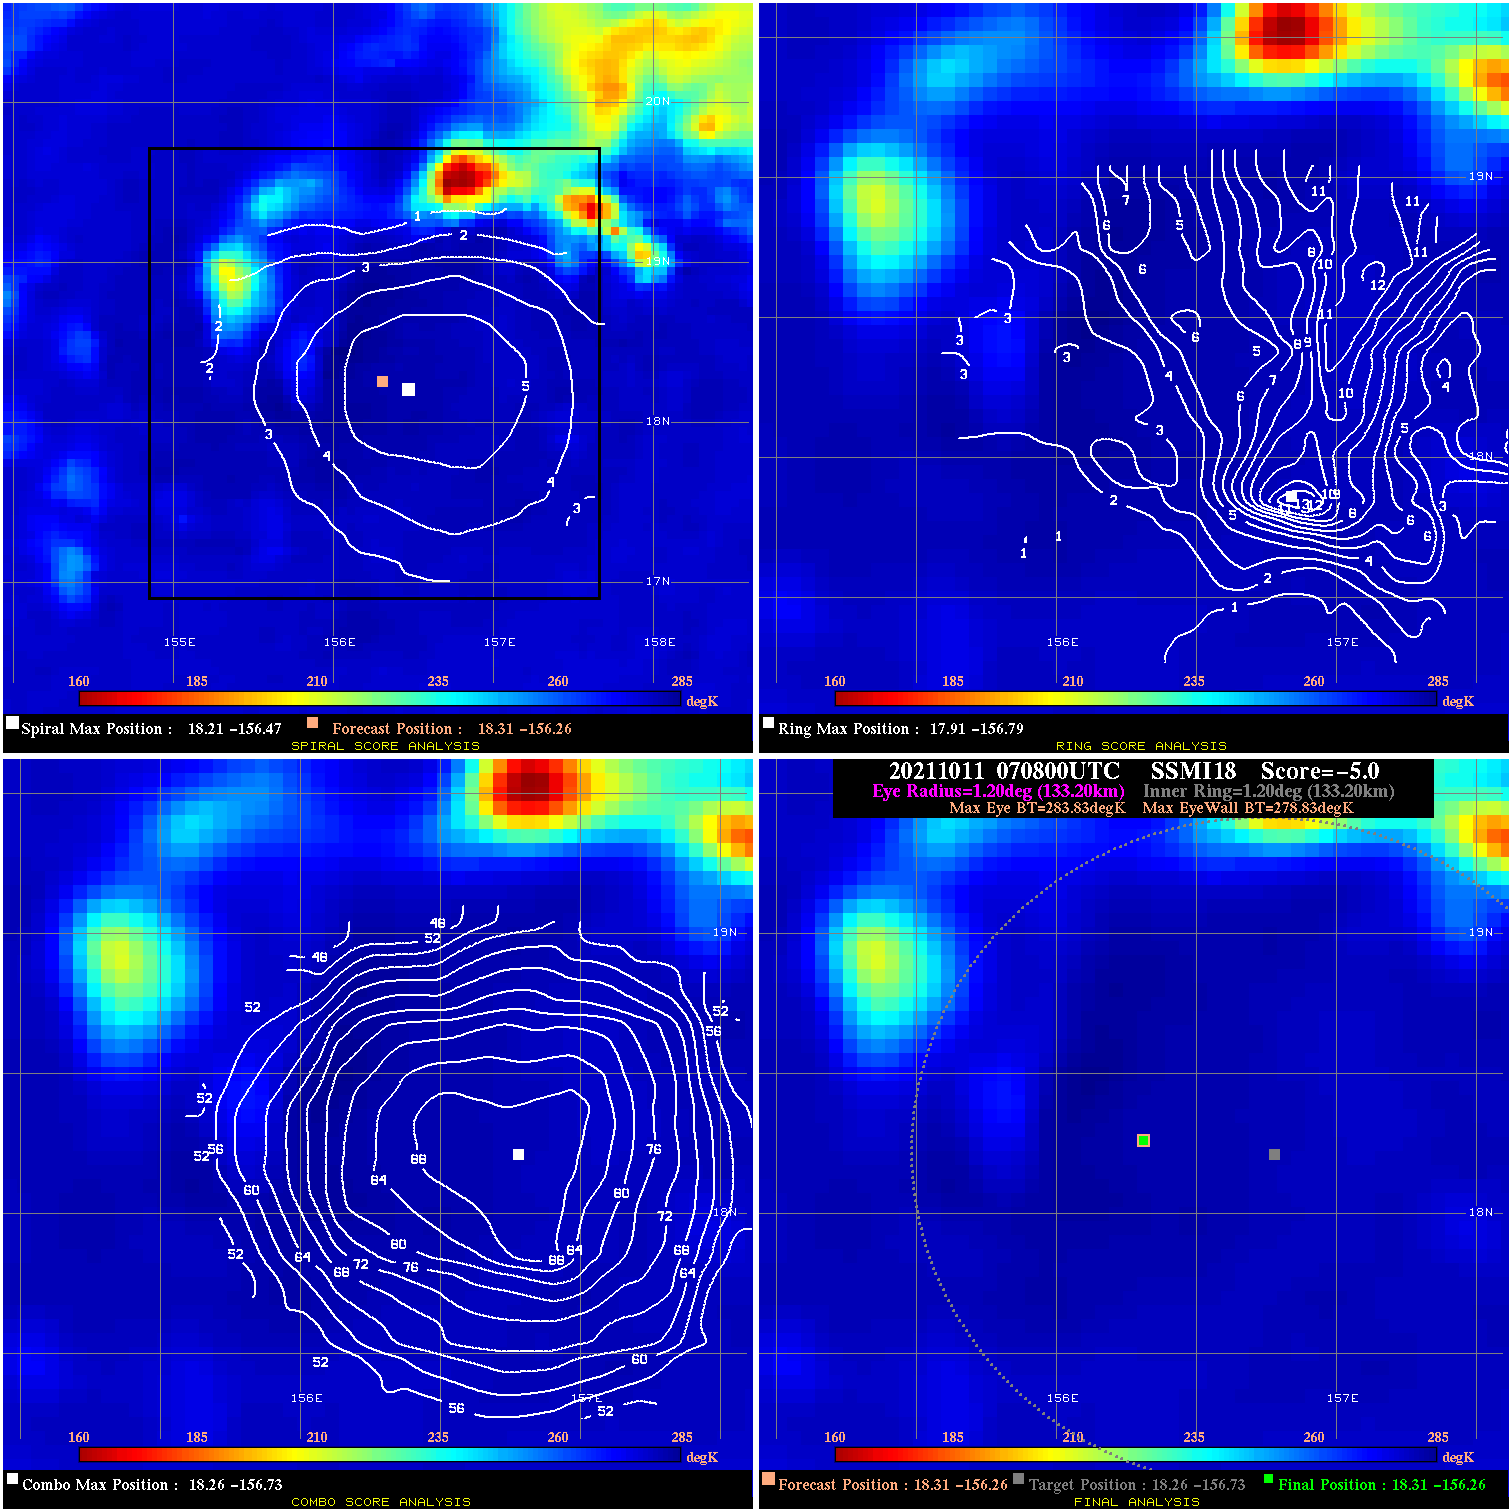
20211011 070800 -5.0 N/A 16.4% 266.64 5.00 35.0 SSMI18 18.3 -156.3 18.3 -156.3 18.3 -156.7 Analysis Plot
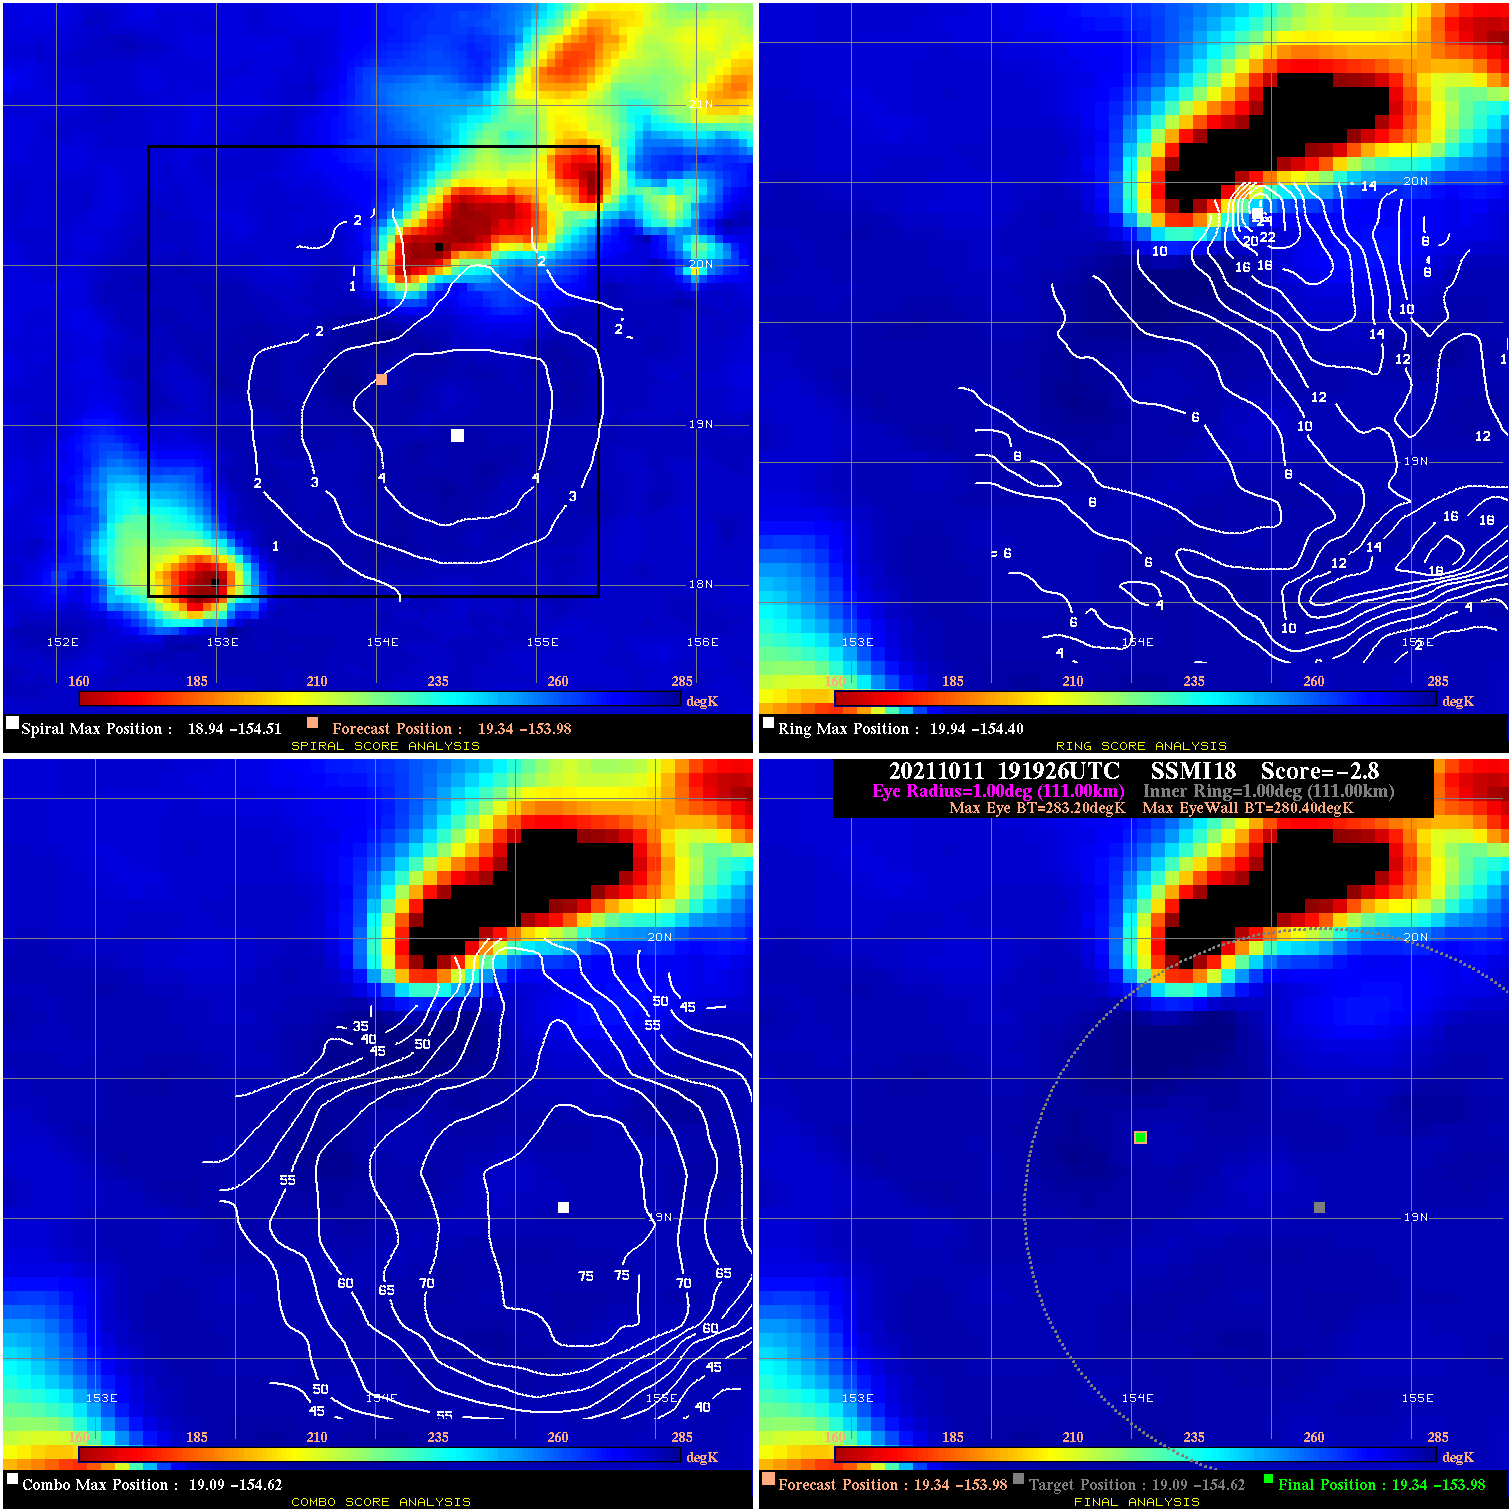
20211011 191926 -2.8 N/A 15.1% 222.20 2.80 40.0 SSMI18 19.3 -154.0 19.3 -154.0 19.1 -154.6 Analysis Plot
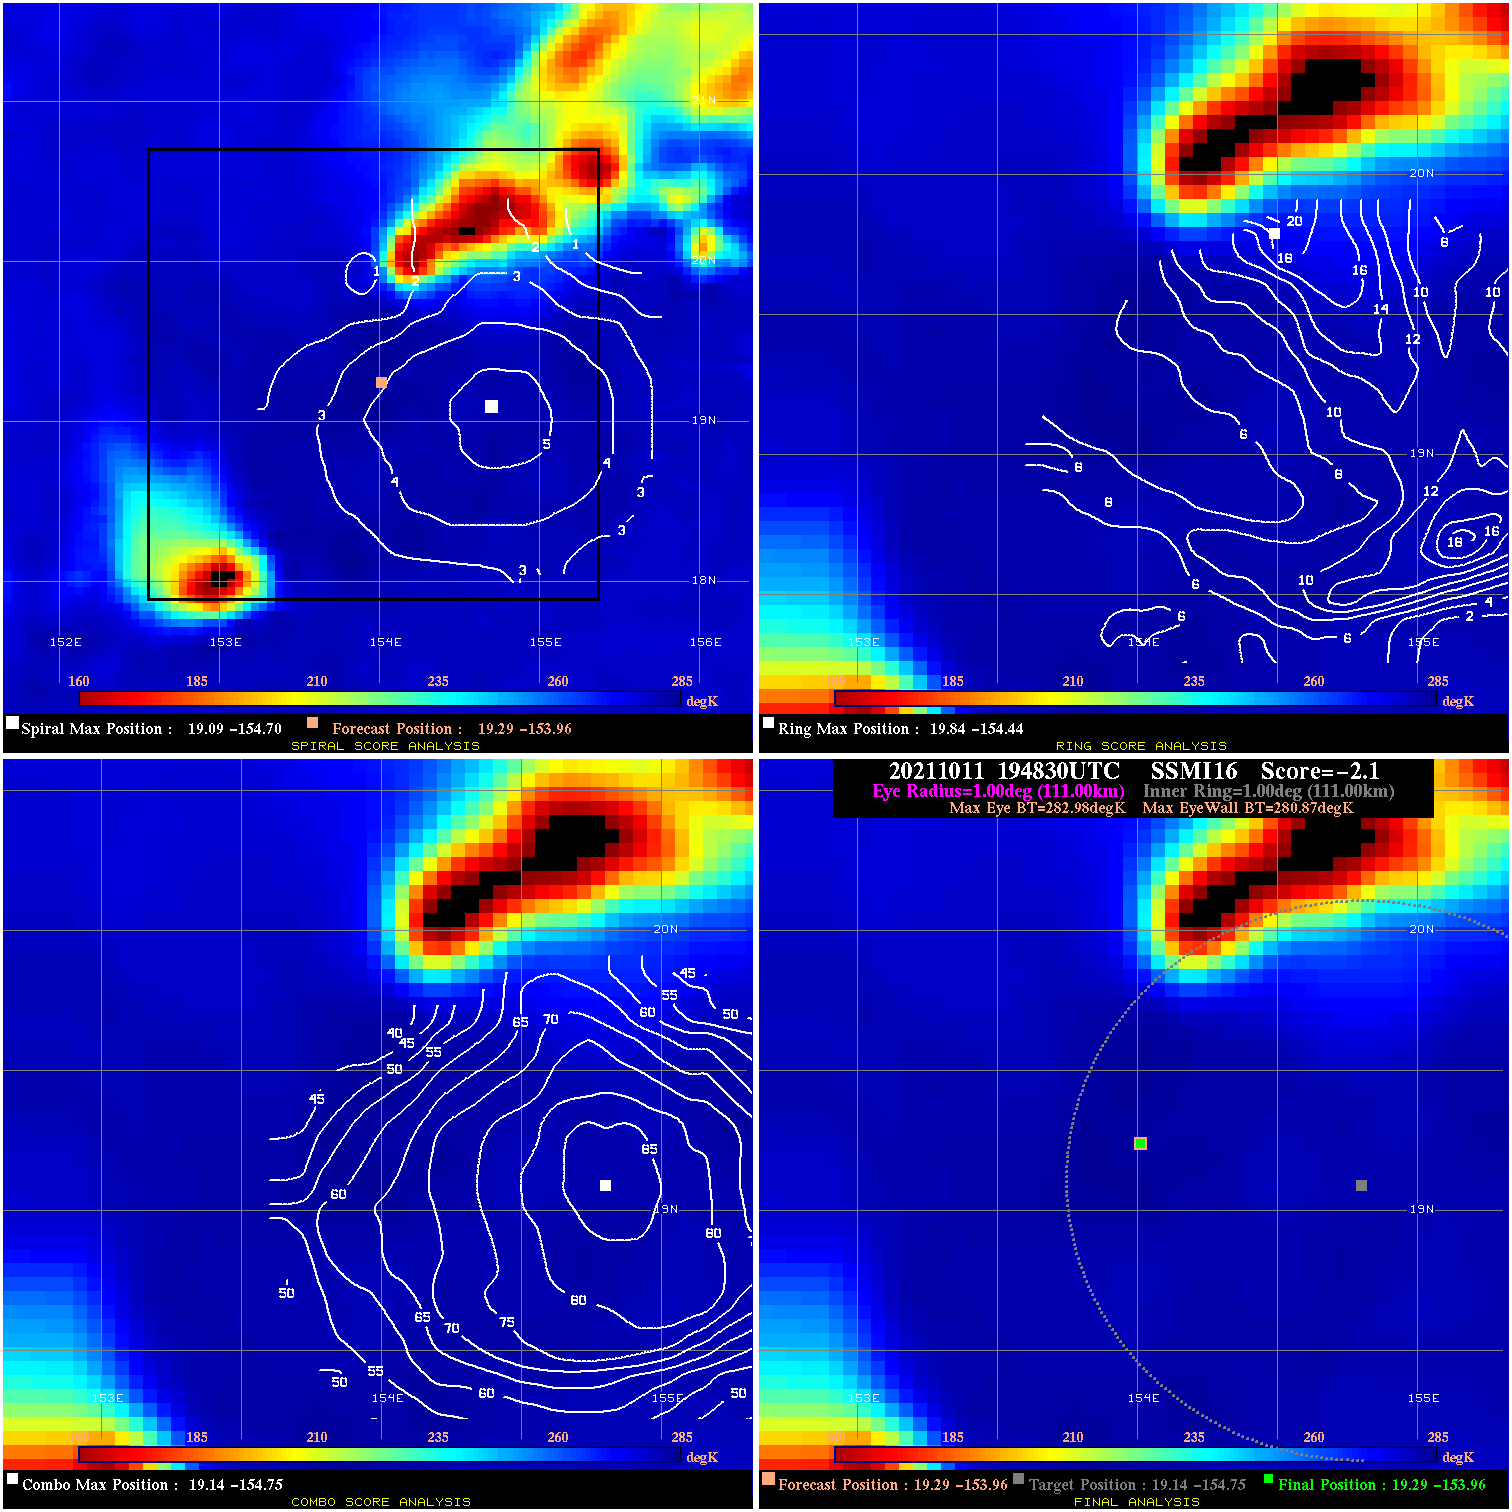
20211011 194830 -2.1 N/A 16.4% 222.20 2.11 40.0 SSMI16 19.3 -154.0 19.3 -154.0 19.1 -154.8 Analysis Plot
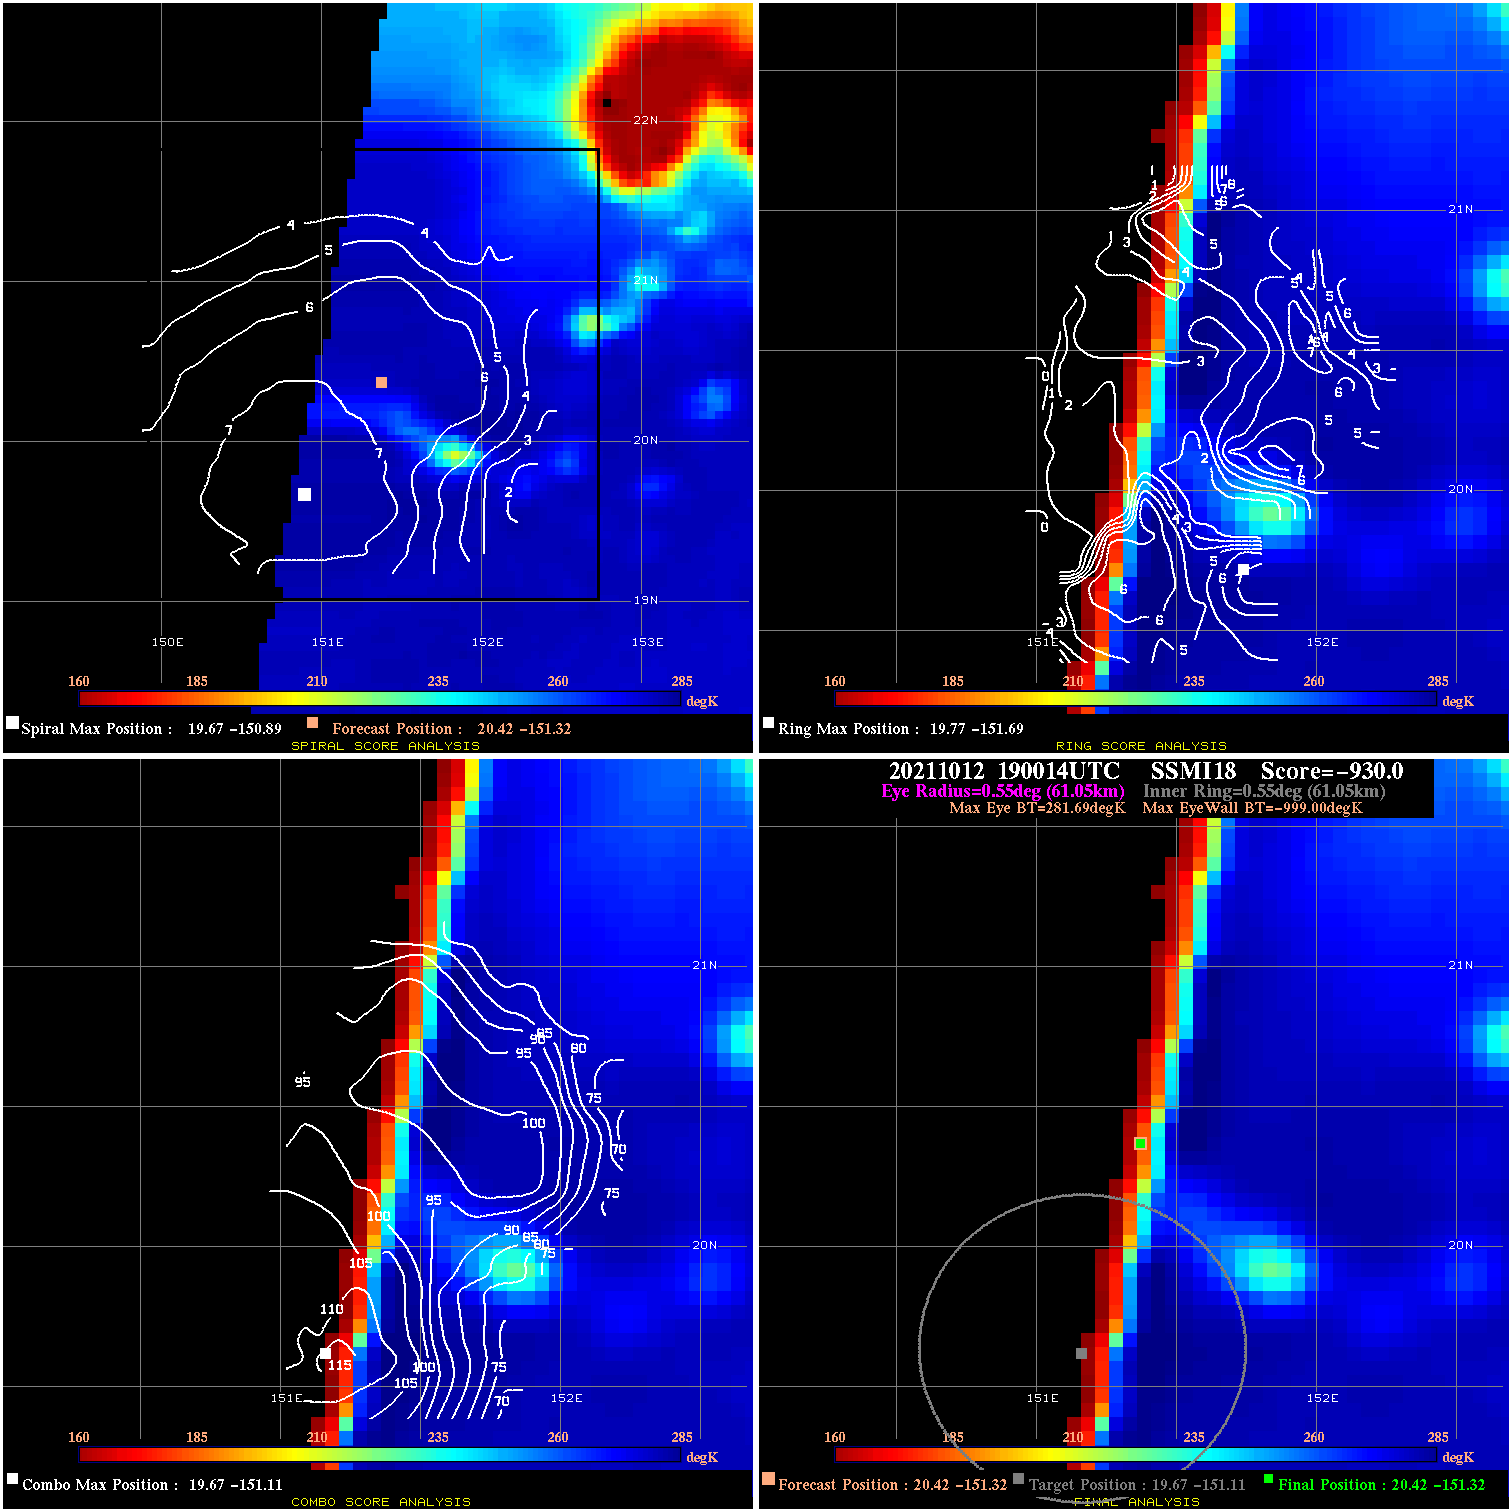
20211012 190014 -930.0 N/A N/A N/A 0.00 40.0 SSMI18 20.4 -151.3 20.4 -151.3 19.7 -151.1 Analysis Plot
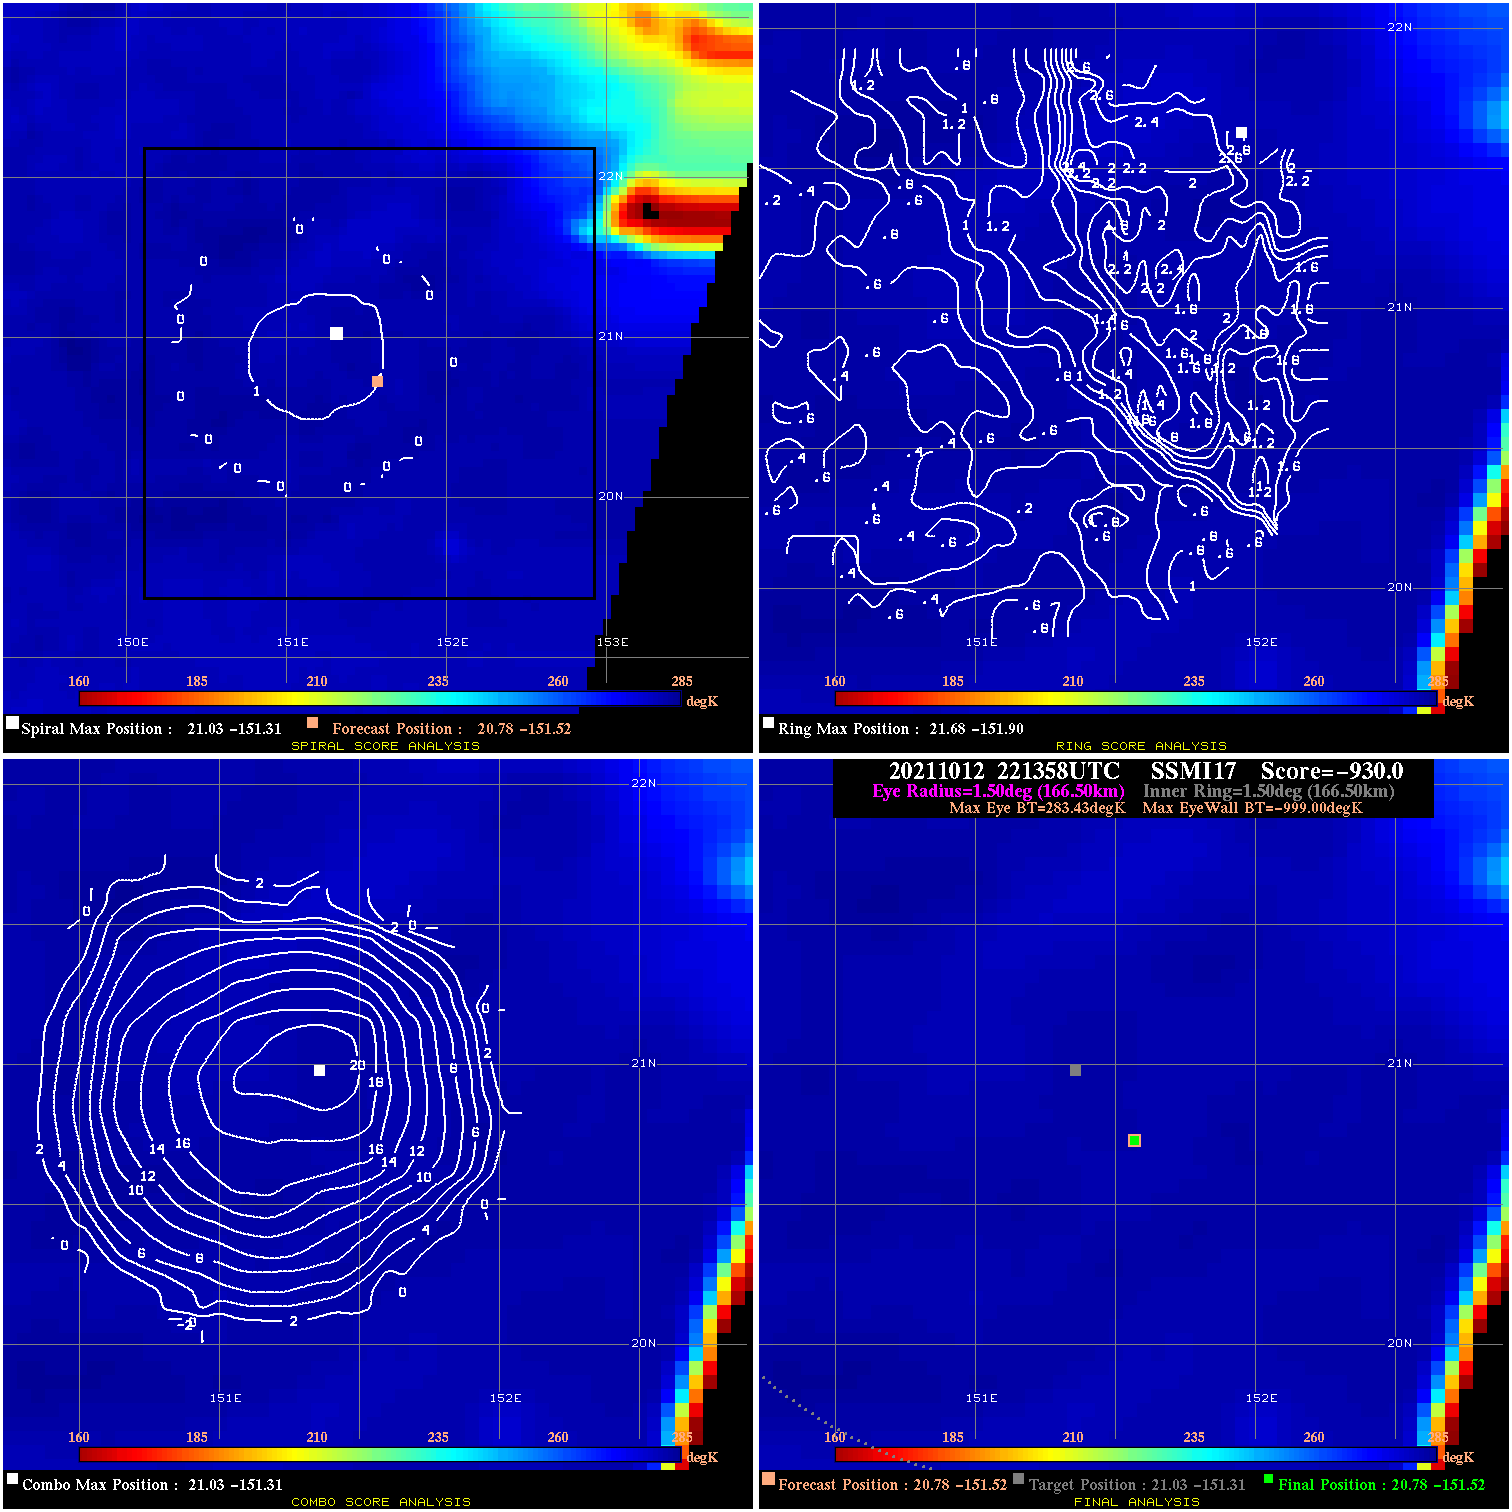
20211012 221358 -930.0 N/A N/A N/A 0.00 40.0 SSMI17 20.8 -151.5 20.8 -151.5 21.0 -151.3 Analysis Plot
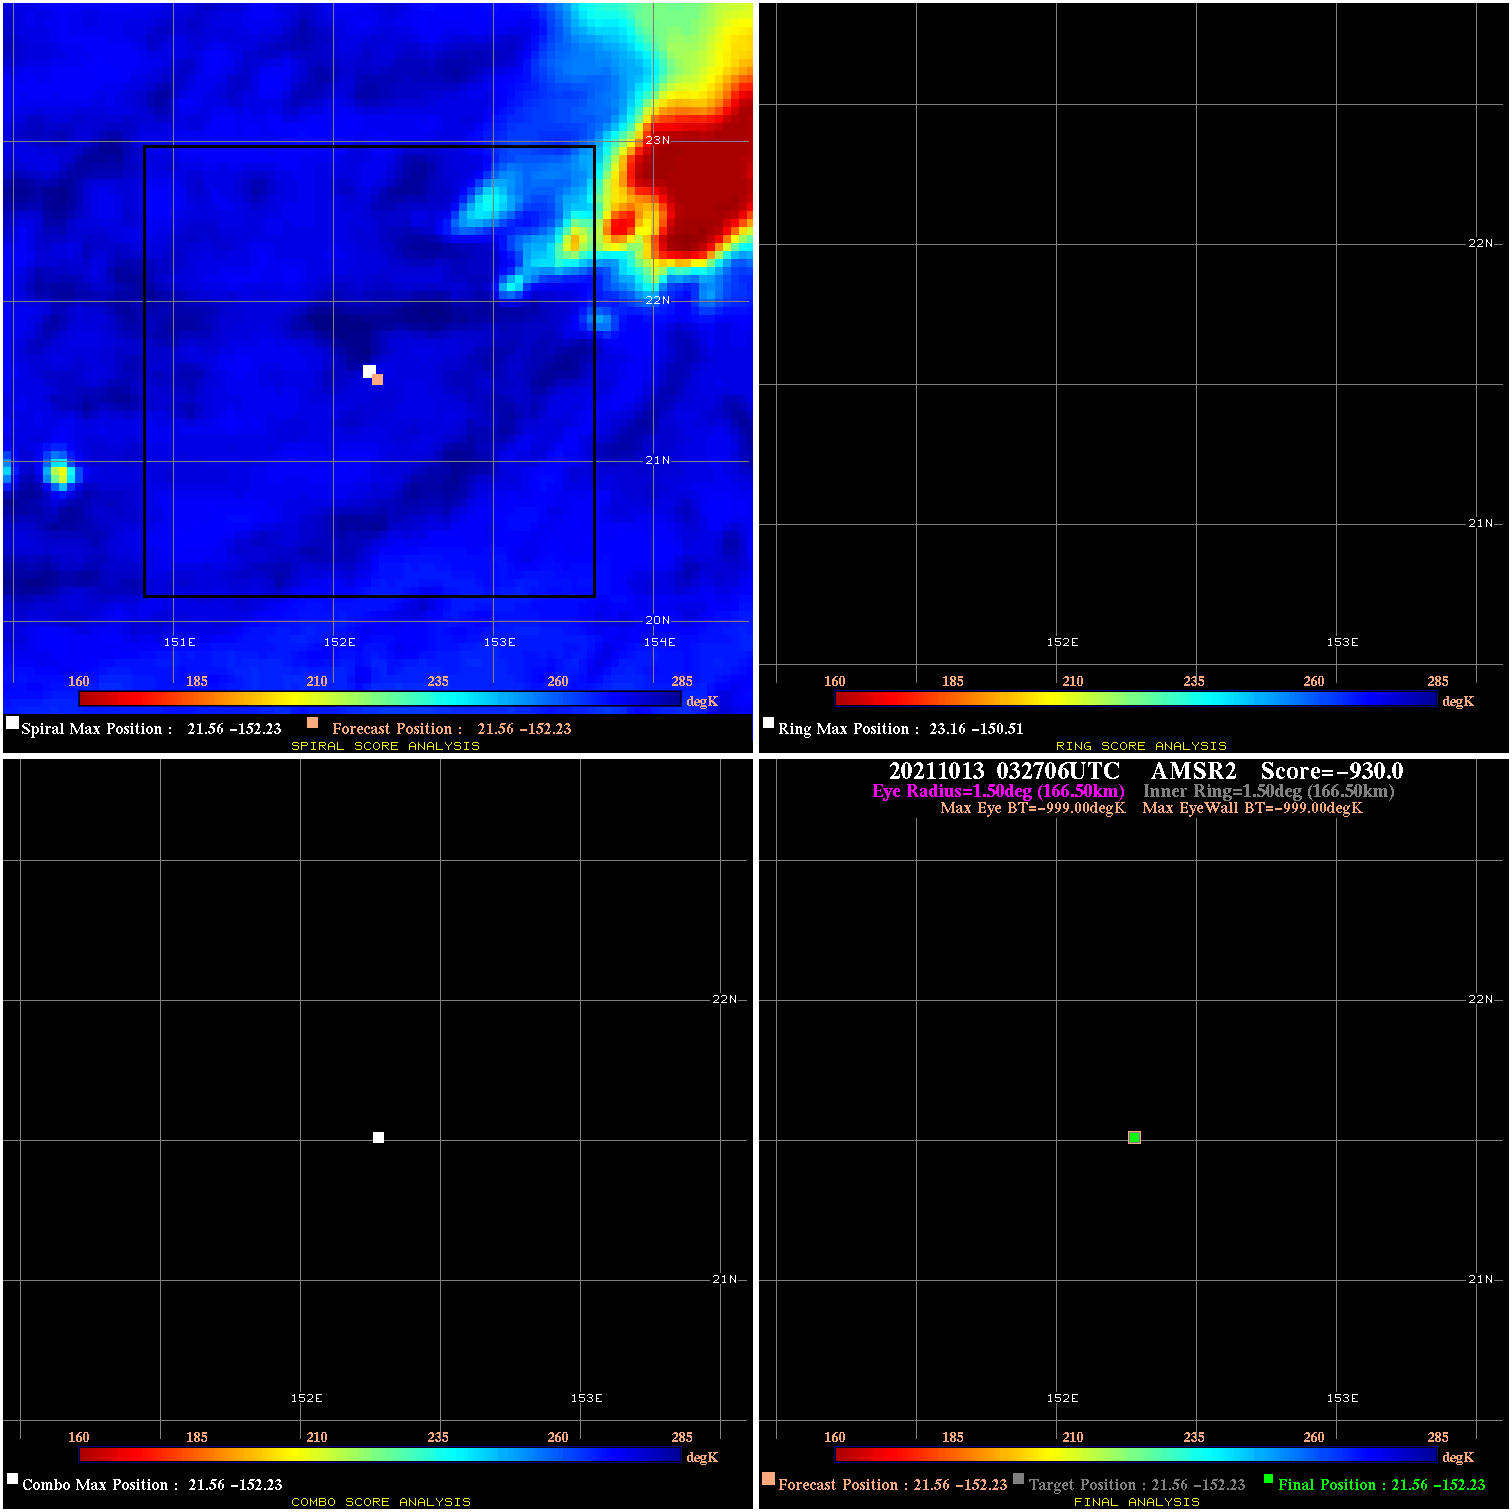
20211013 032706 N/A N/A N/A N/A N/A 40.0 AMSR2 21.6 -152.2 21.6 -152.2 21.6 -152.2 Analysis Plot
20211013 095810 -0.7 N/A N/A 11.11 .69 40.0 SSMI17 22.0 -152.2 22.0 -152.2 21.9 -152.4 Analysis Plot
20211013 153620 -4.5 N/A N/A 11.11 4.51 40.0 AMSR2 22.7 -153.1 22.7 -153.1 23.5 -153.5 Analysis Plot
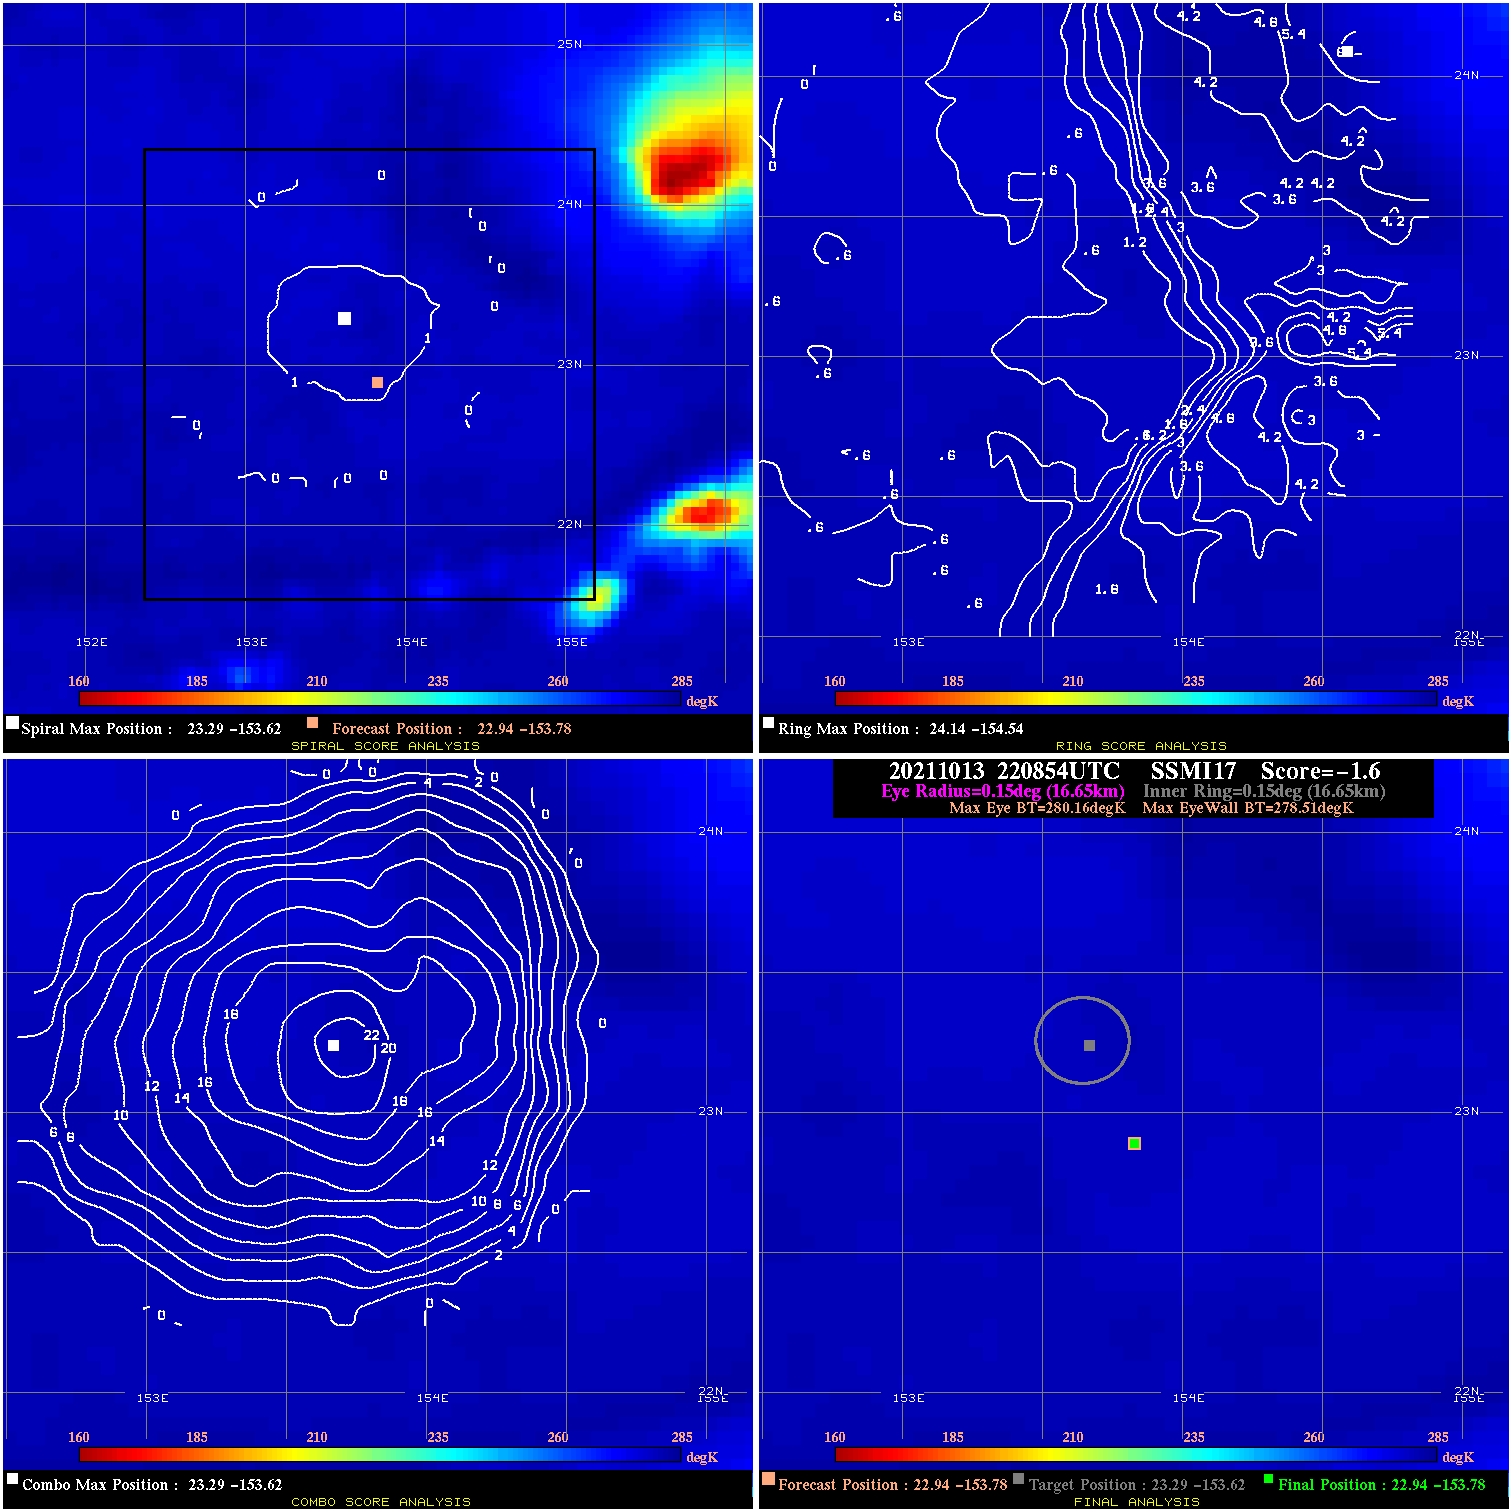
20211013 220854 -1.6 N/A N/A 33.33 1.65 40.0 SSMI17 22.9 -153.8 22.9 -153.8 23.3 -153.6 Analysis Plot
20211014 023301 -930.0 N/A N/A N/A 0.00 40.0 AMSR2 23.9 -155.0 23.9 -155.0 24.2 -156.1 Analysis Plot
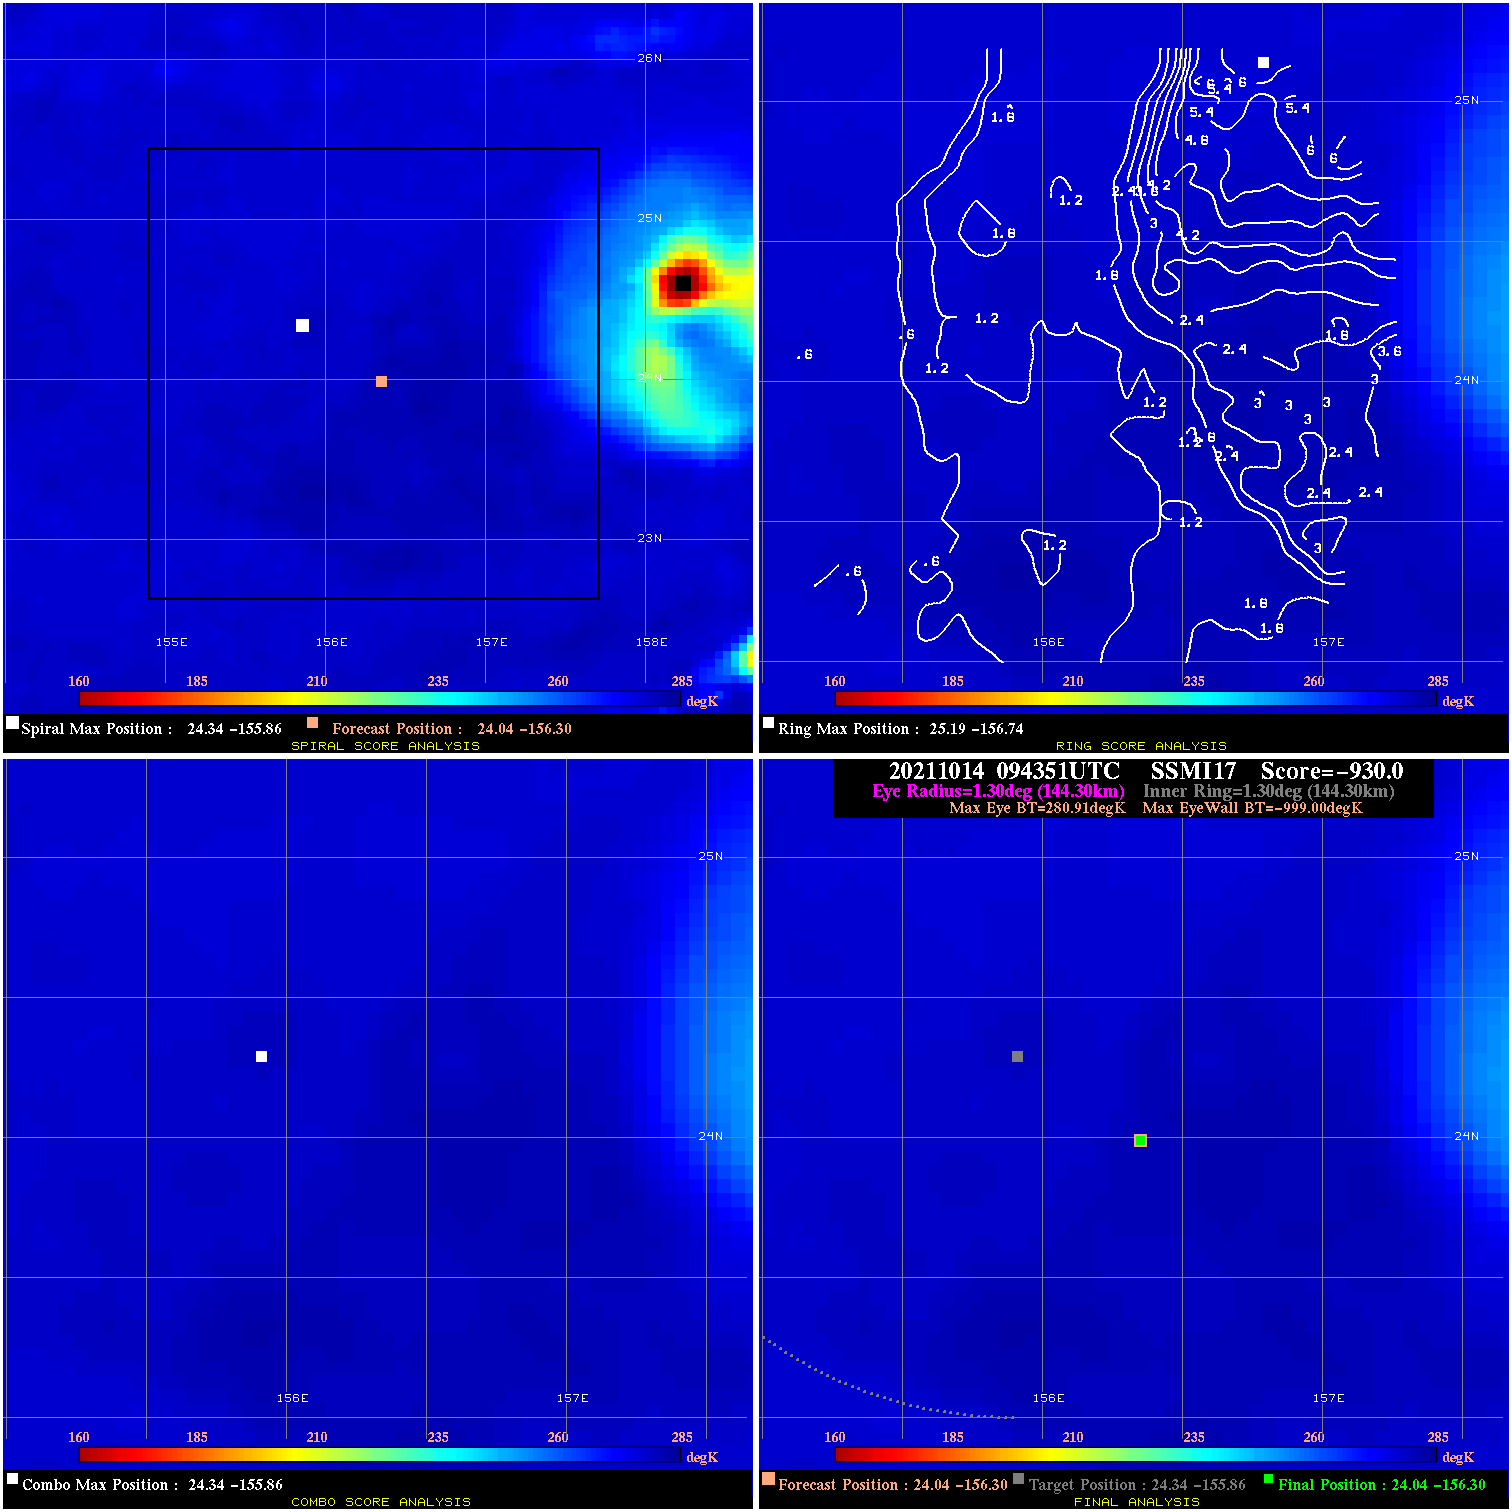
20211014 094351 -930.0 N/A N/A N/A 0.00 45.0 SSMI17 24.0 -156.3 24.0 -156.3 24.3 -155.9 Analysis Plot
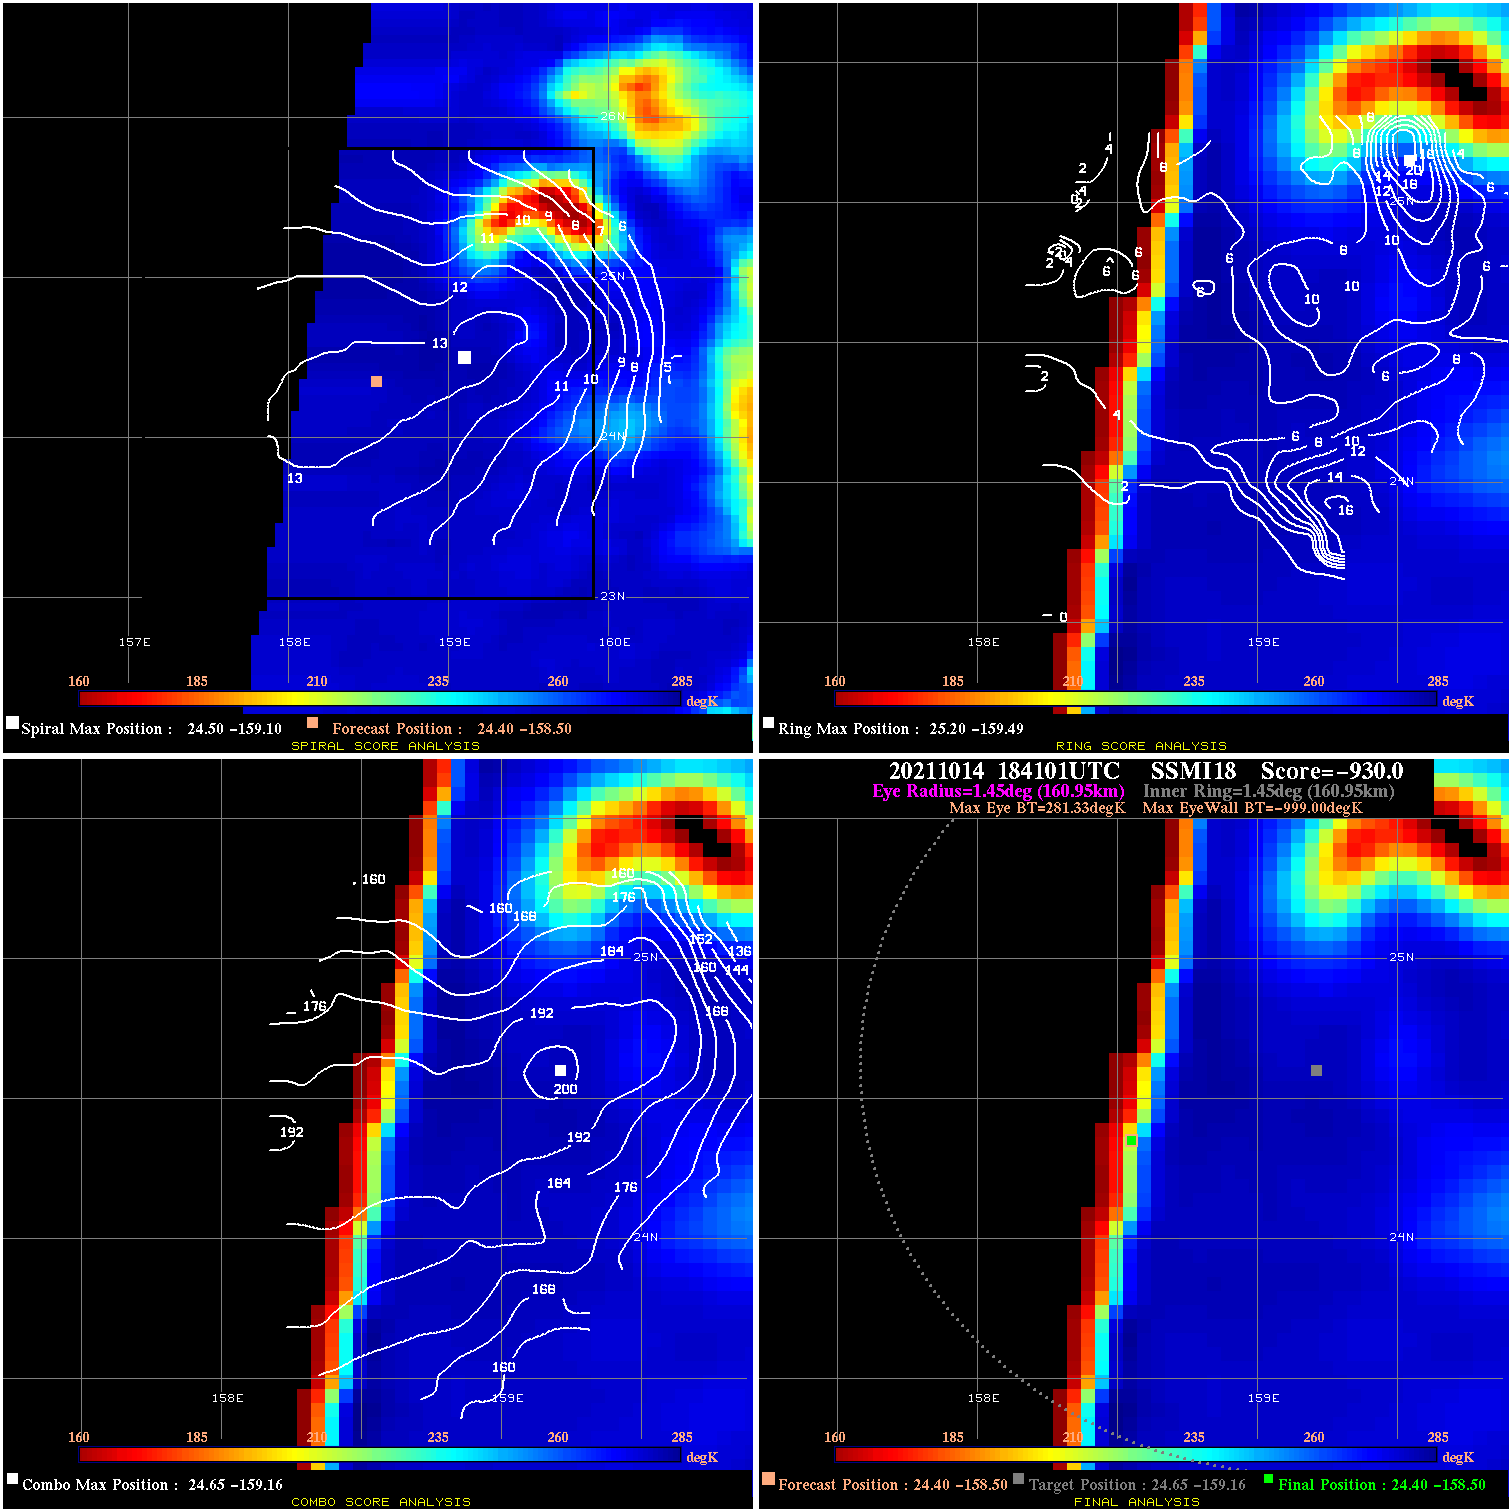
20211014 184101 -930.0 N/A N/A N/A 0.00 45.0 SSMI18 24.4 -158.5 24.4 -158.5 24.6 -159.2 Analysis Plot
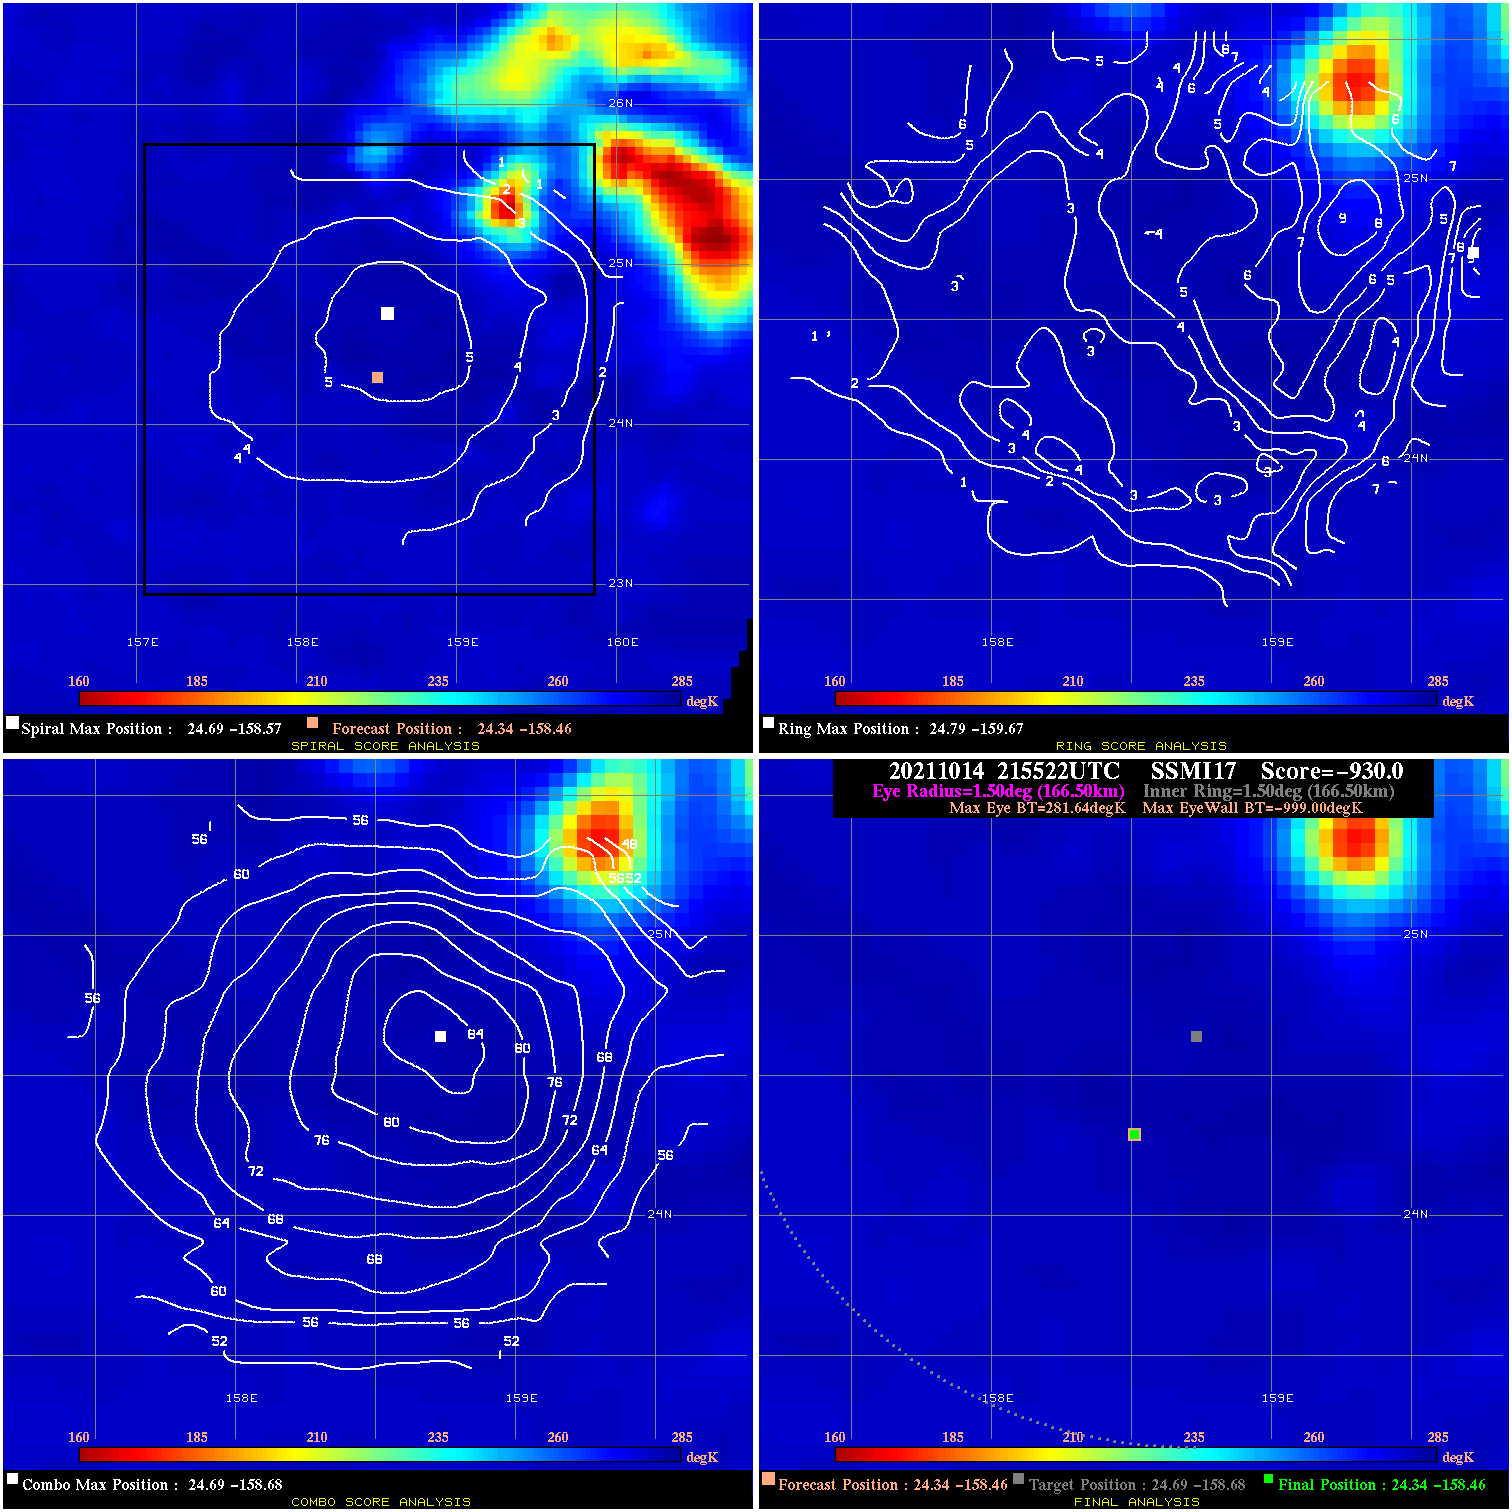
20211014 215522 -930.0 N/A N/A N/A 0.00 45.0 SSMI17 24.3 -158.5 24.3 -158.5 24.7 -158.7 Analysis Plot
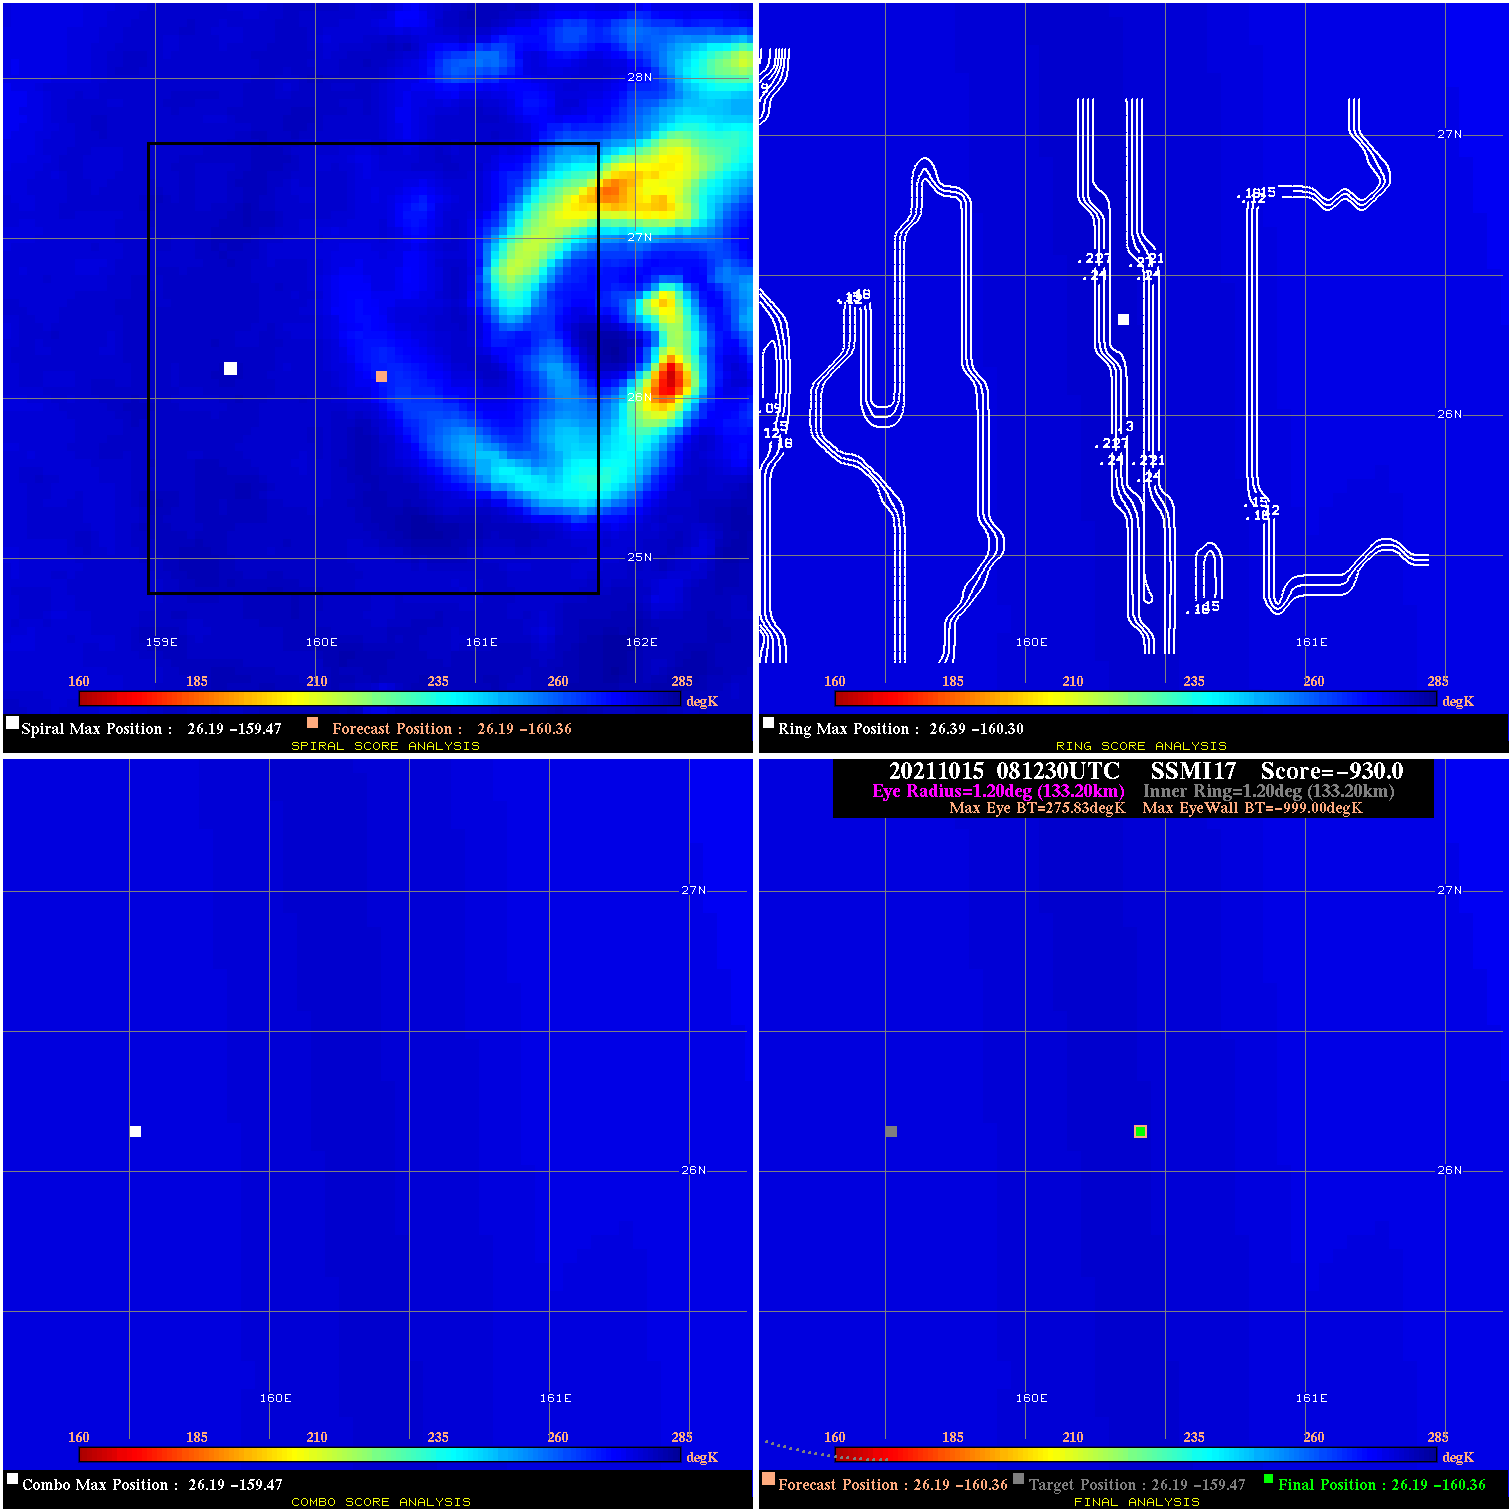
20211015 081230 -930.0 N/A N/A N/A 0.00 45.0 SSMI17 26.2 -160.4 26.2 -160.4 26.2 -159.5 Analysis Plot
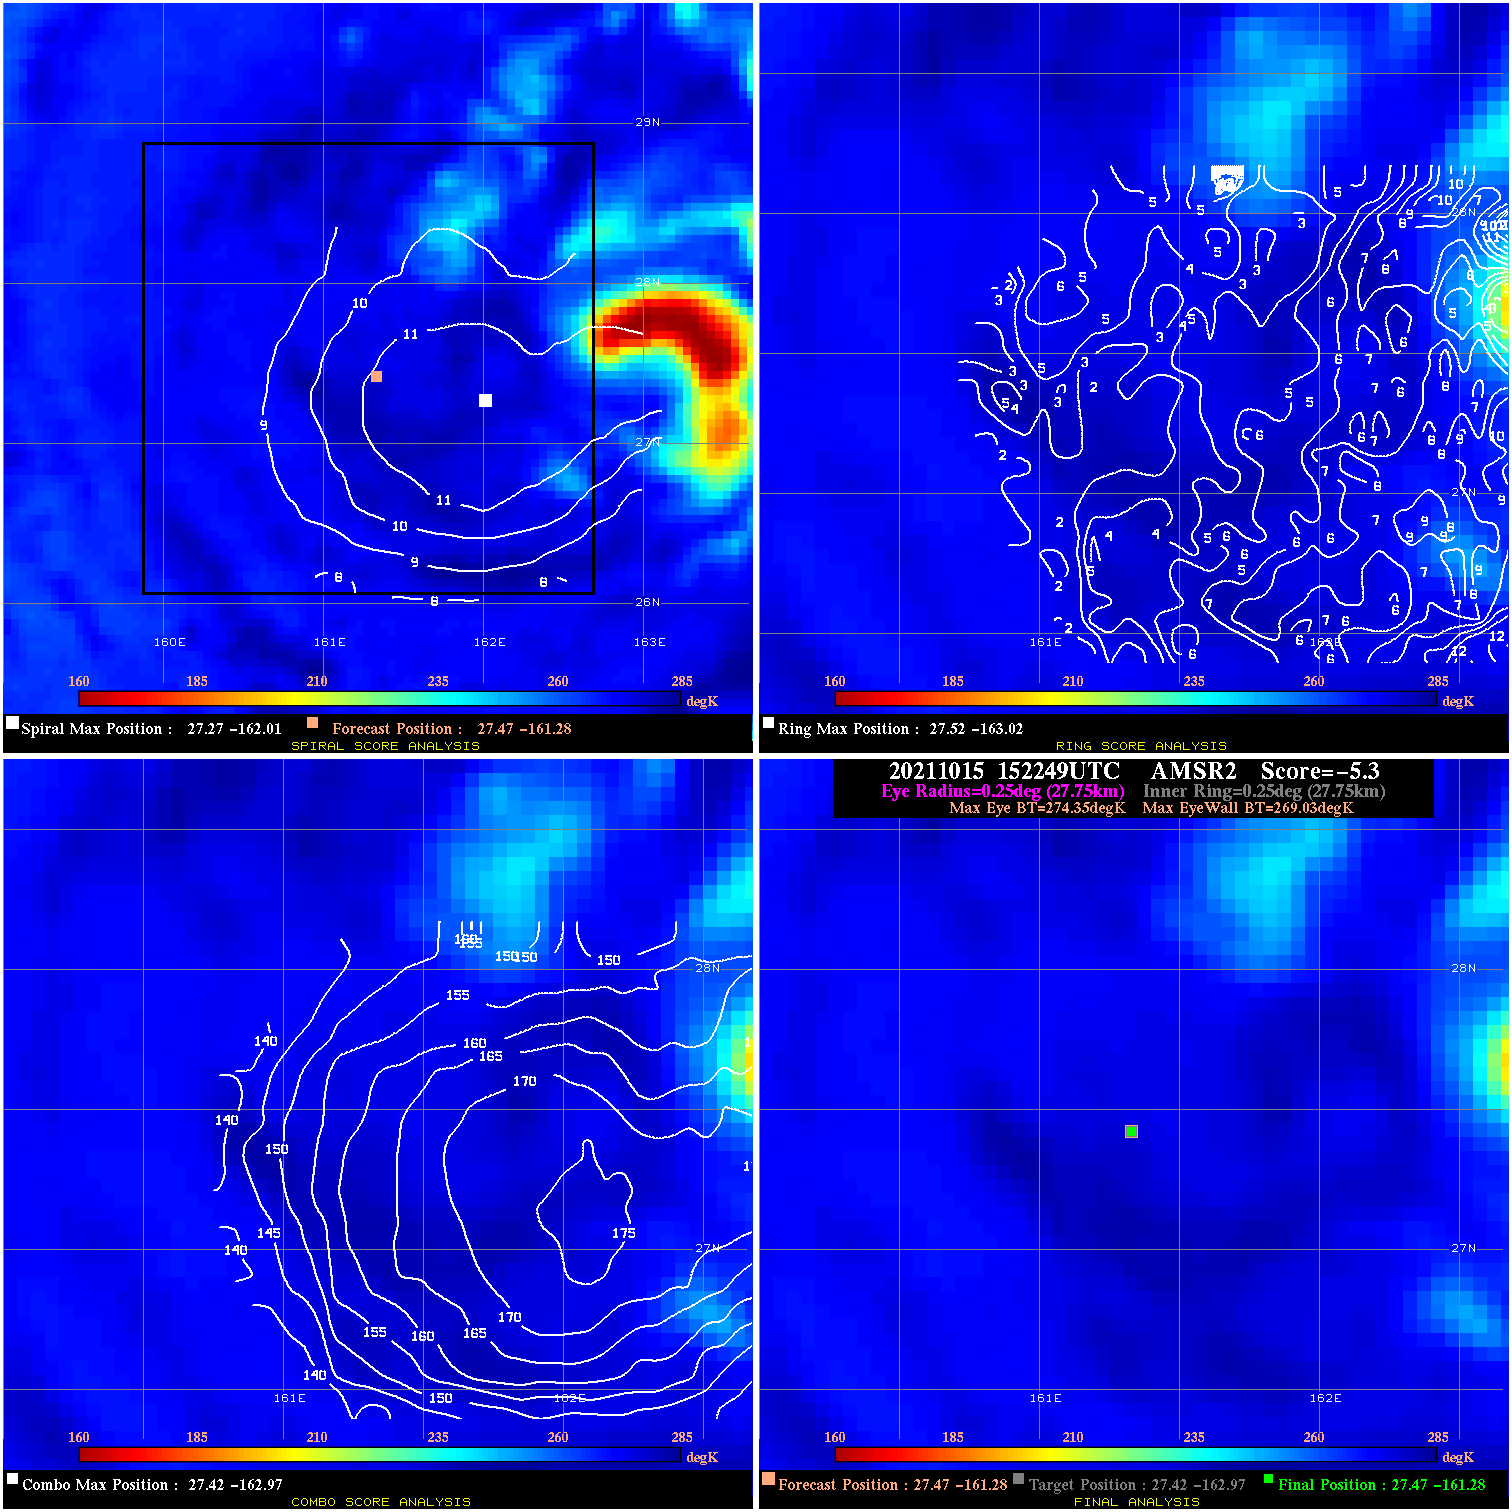
20211015 152249 -5.3 N/A 58.9% 55.55 5.32 45.0 AMSR2 27.5 -161.3 27.5 -161.3 27.4 -163.0 Analysis Plot
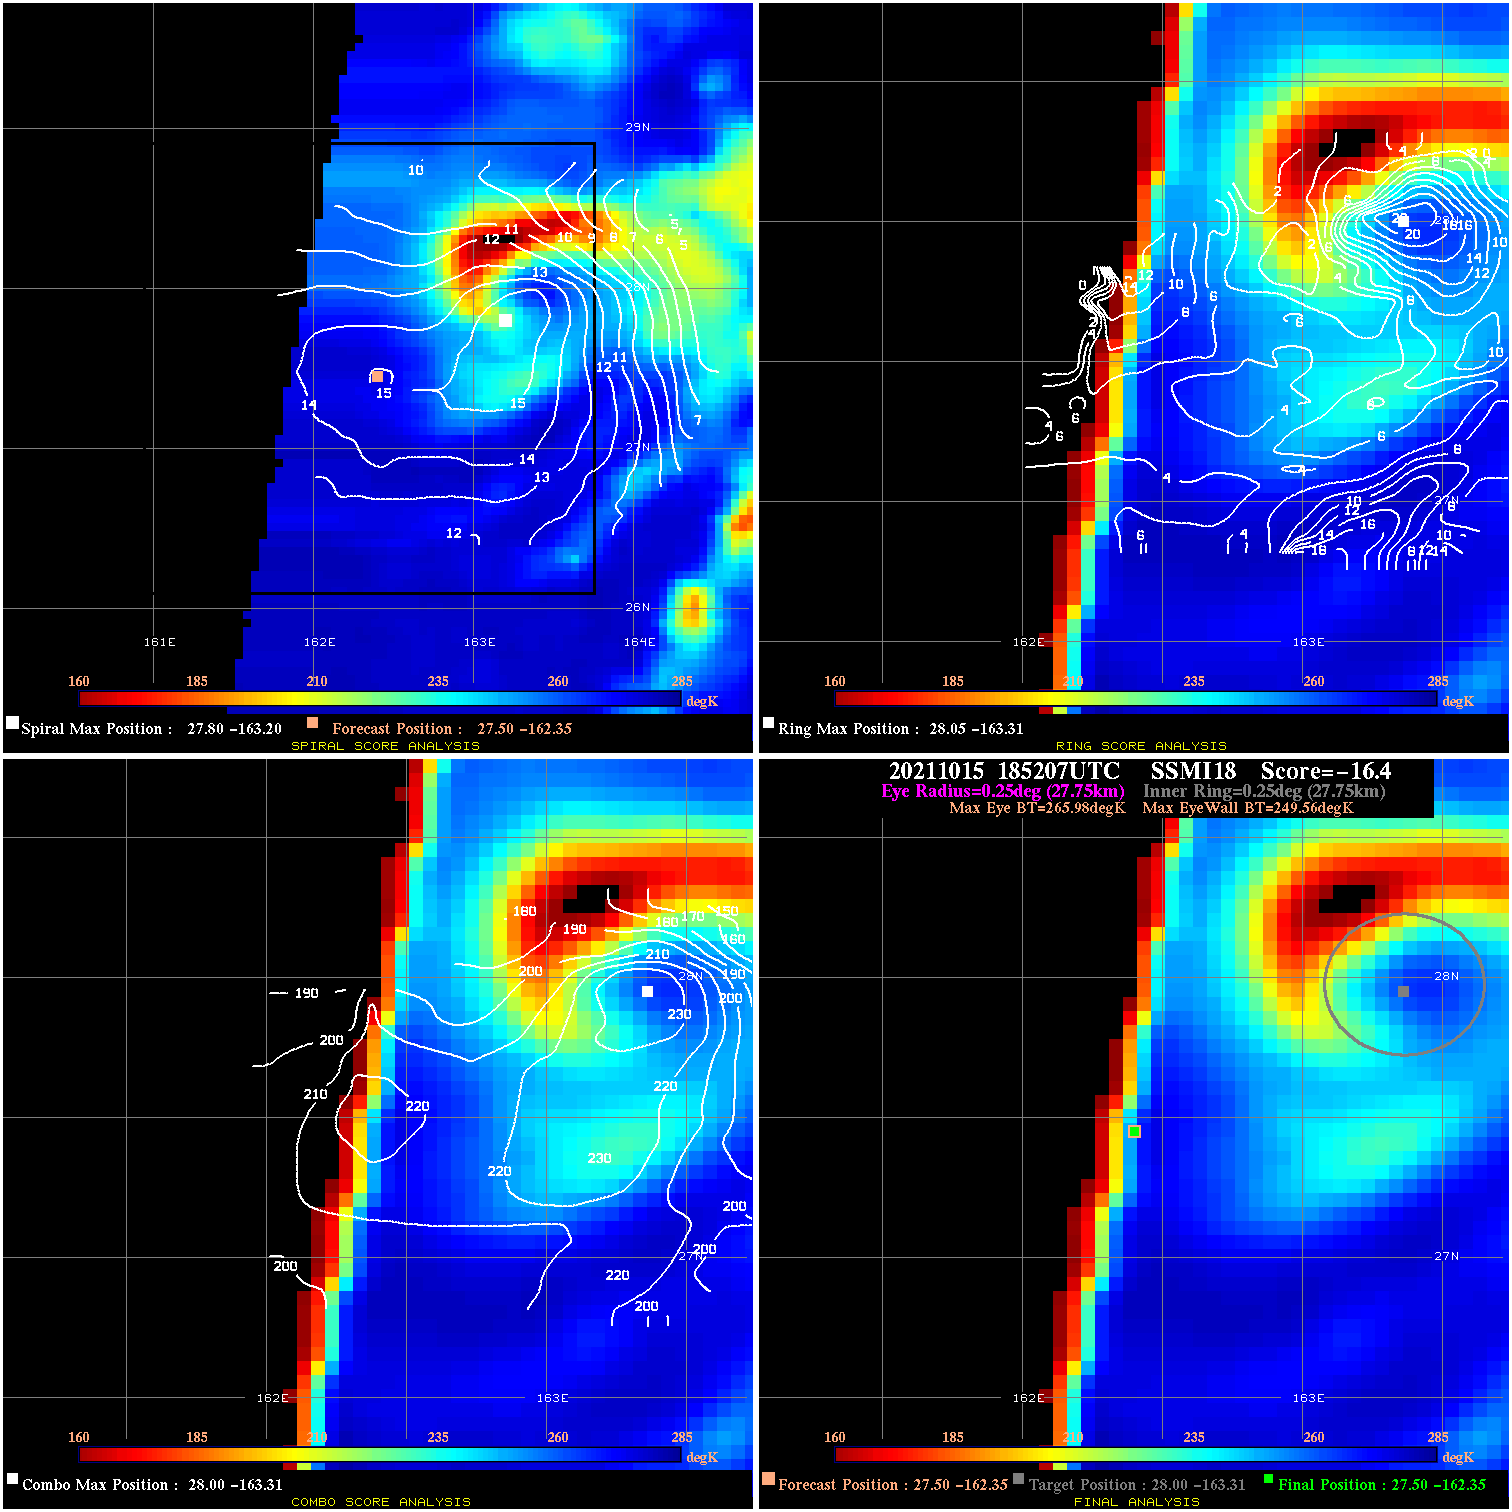
20211015 185207 -16.4 N/A 79.5% 55.55 16.42 45.0 SSMI18 27.5 -162.4 27.5 -162.4 28.0 -163.3 Analysis Plot
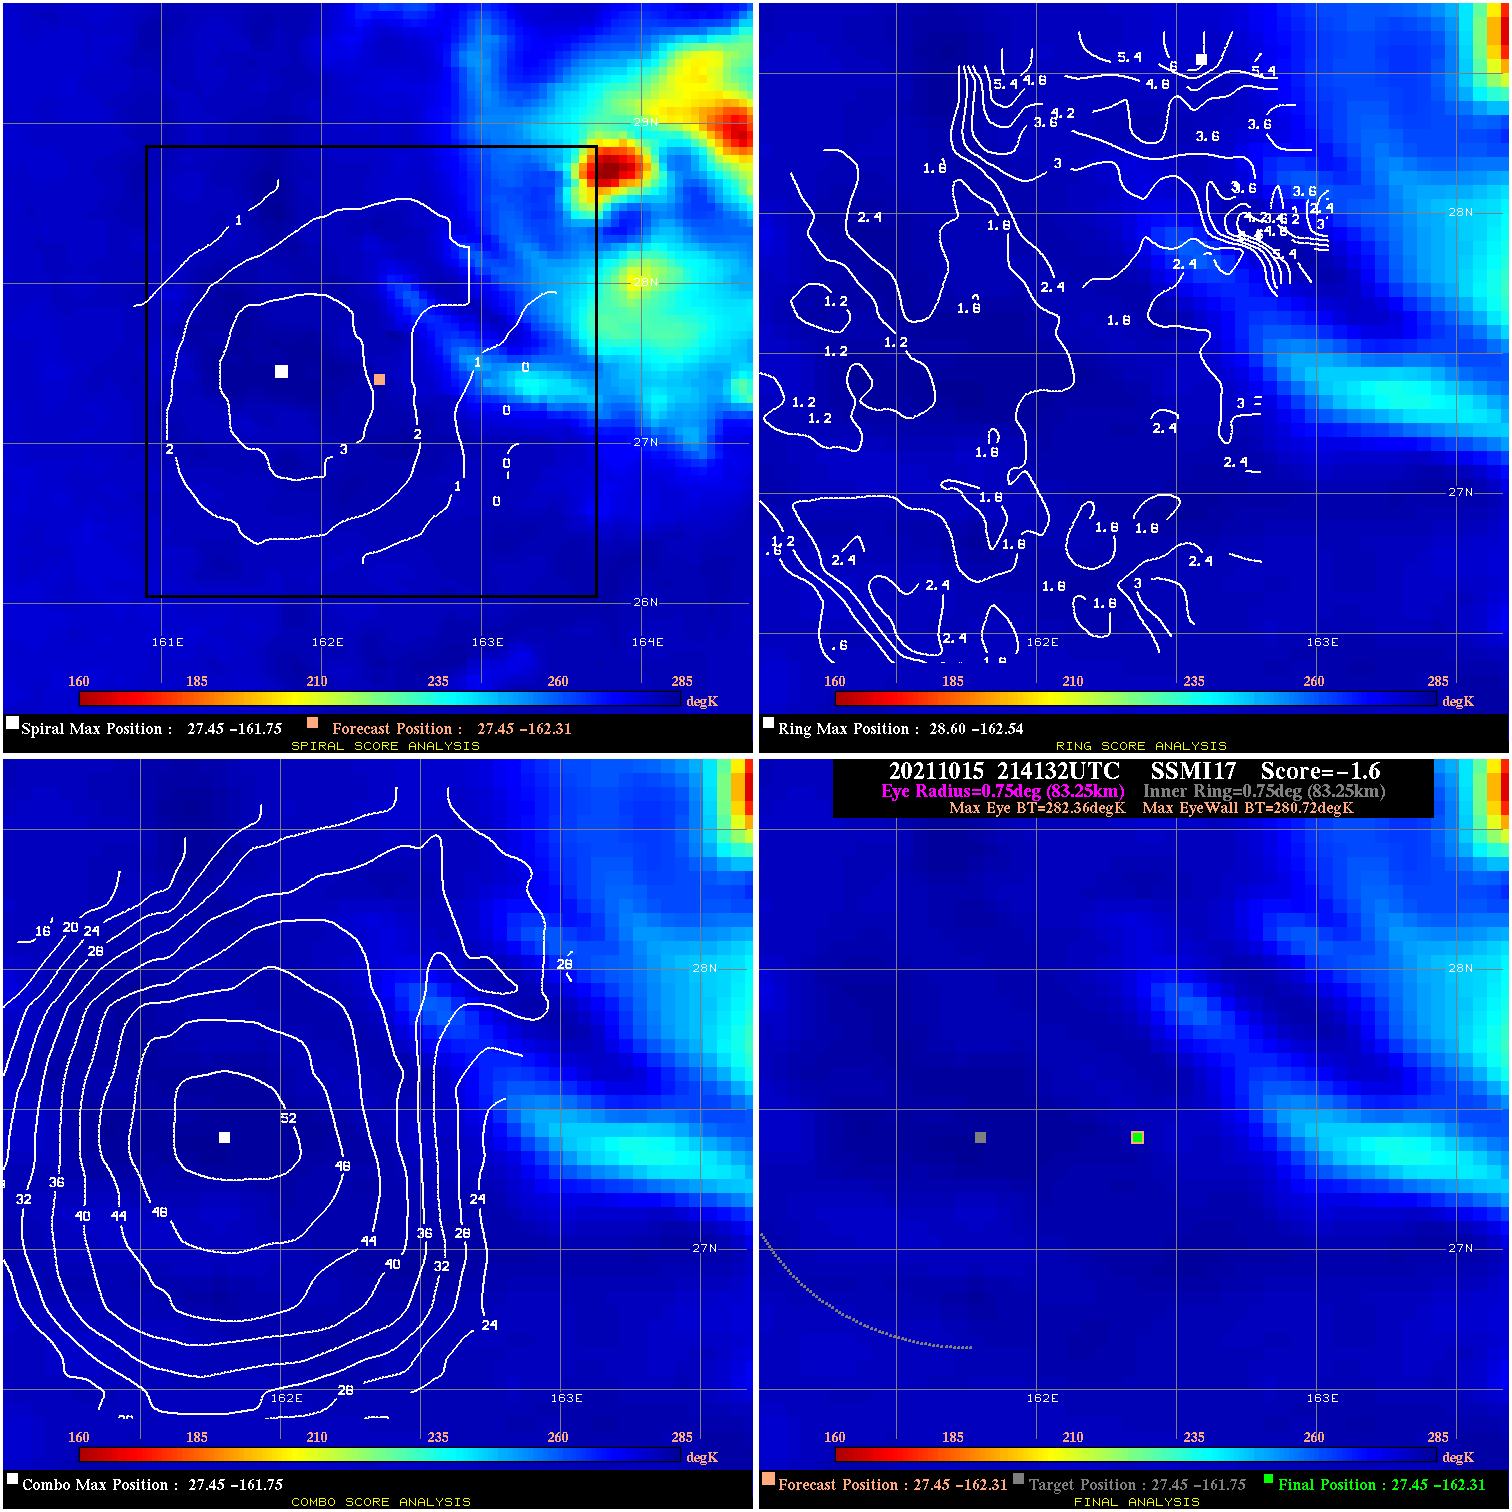
20211015 214132 -1.6 N/A N/A 166.65 1.64 45.0 SSMI17 27.5 -162.3 27.5 -162.3 27.5 -161.8 Analysis Plot
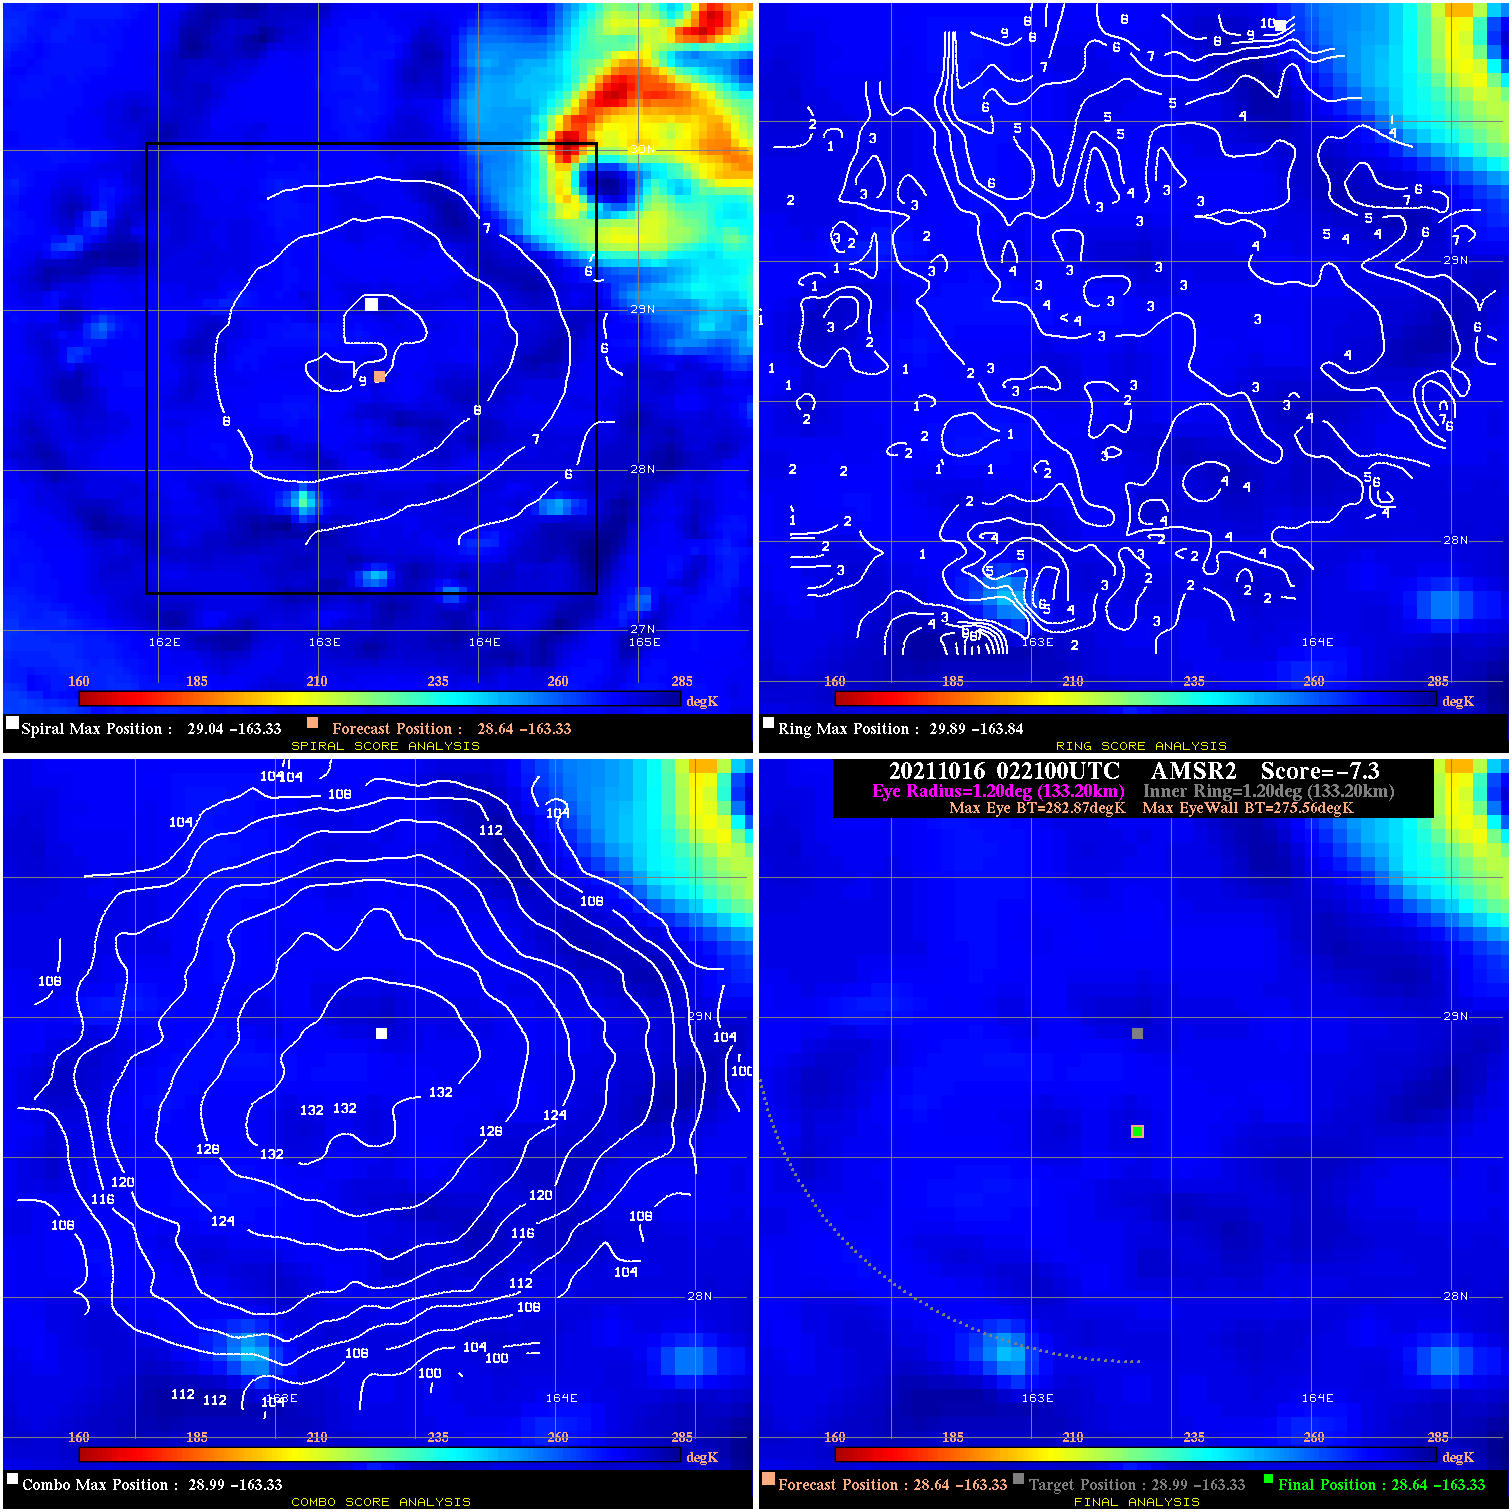
20211016 022100 -7.3 N/A 5.5% 266.64 7.31 45.0 AMSR2 28.6 -163.3 28.6 -163.3 29.0 -163.3 Analysis Plot
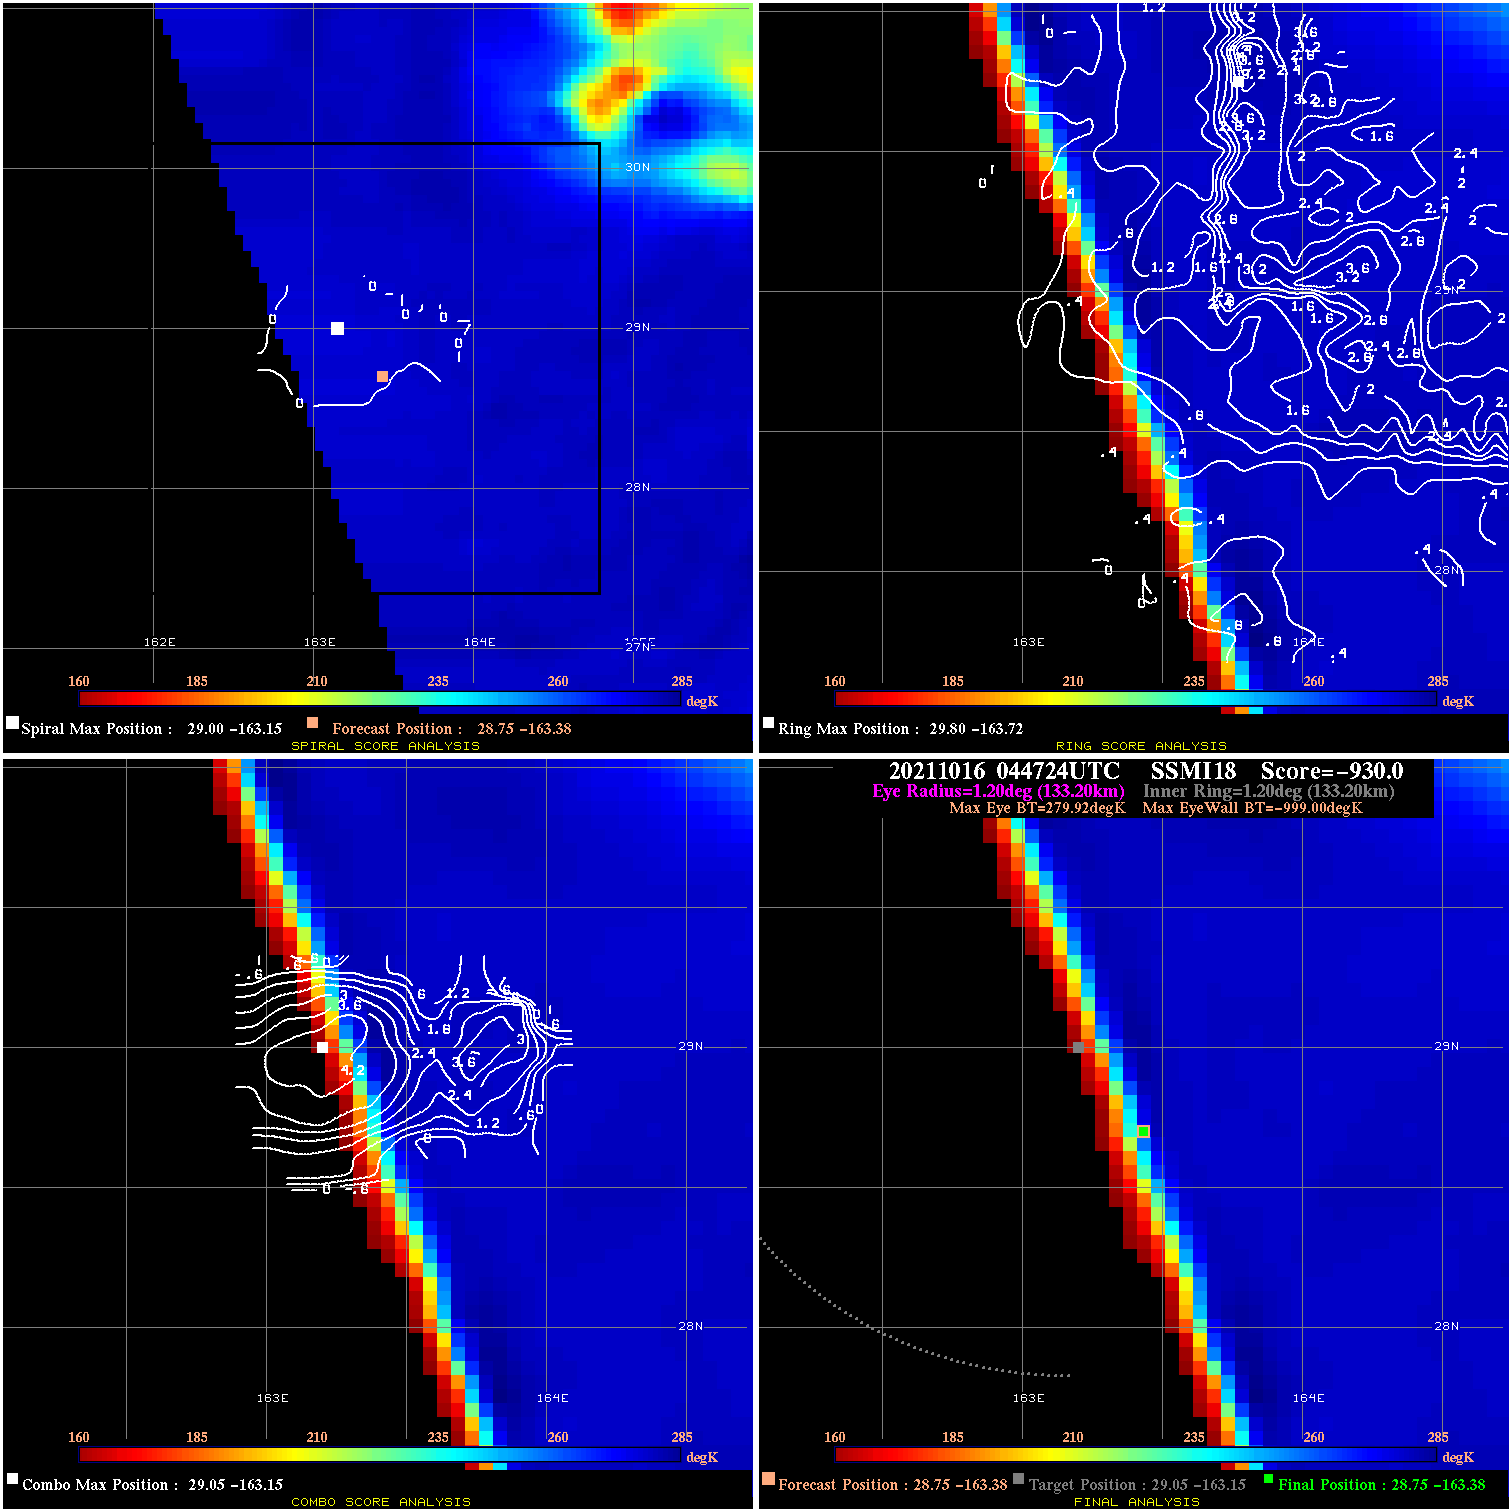
20211016 044724 -930.0 N/A N/A N/A 0.00 45.0 SSMI18 28.8 -163.4 28.8 -163.4 29.0 -163.1 Analysis Plot
20211016 091659 -930.0 N/A N/A N/A 0.00 45.0 SSMI17 30.1 -164.7 30.1 -164.7 31.1 -165.6 Analysis Plot
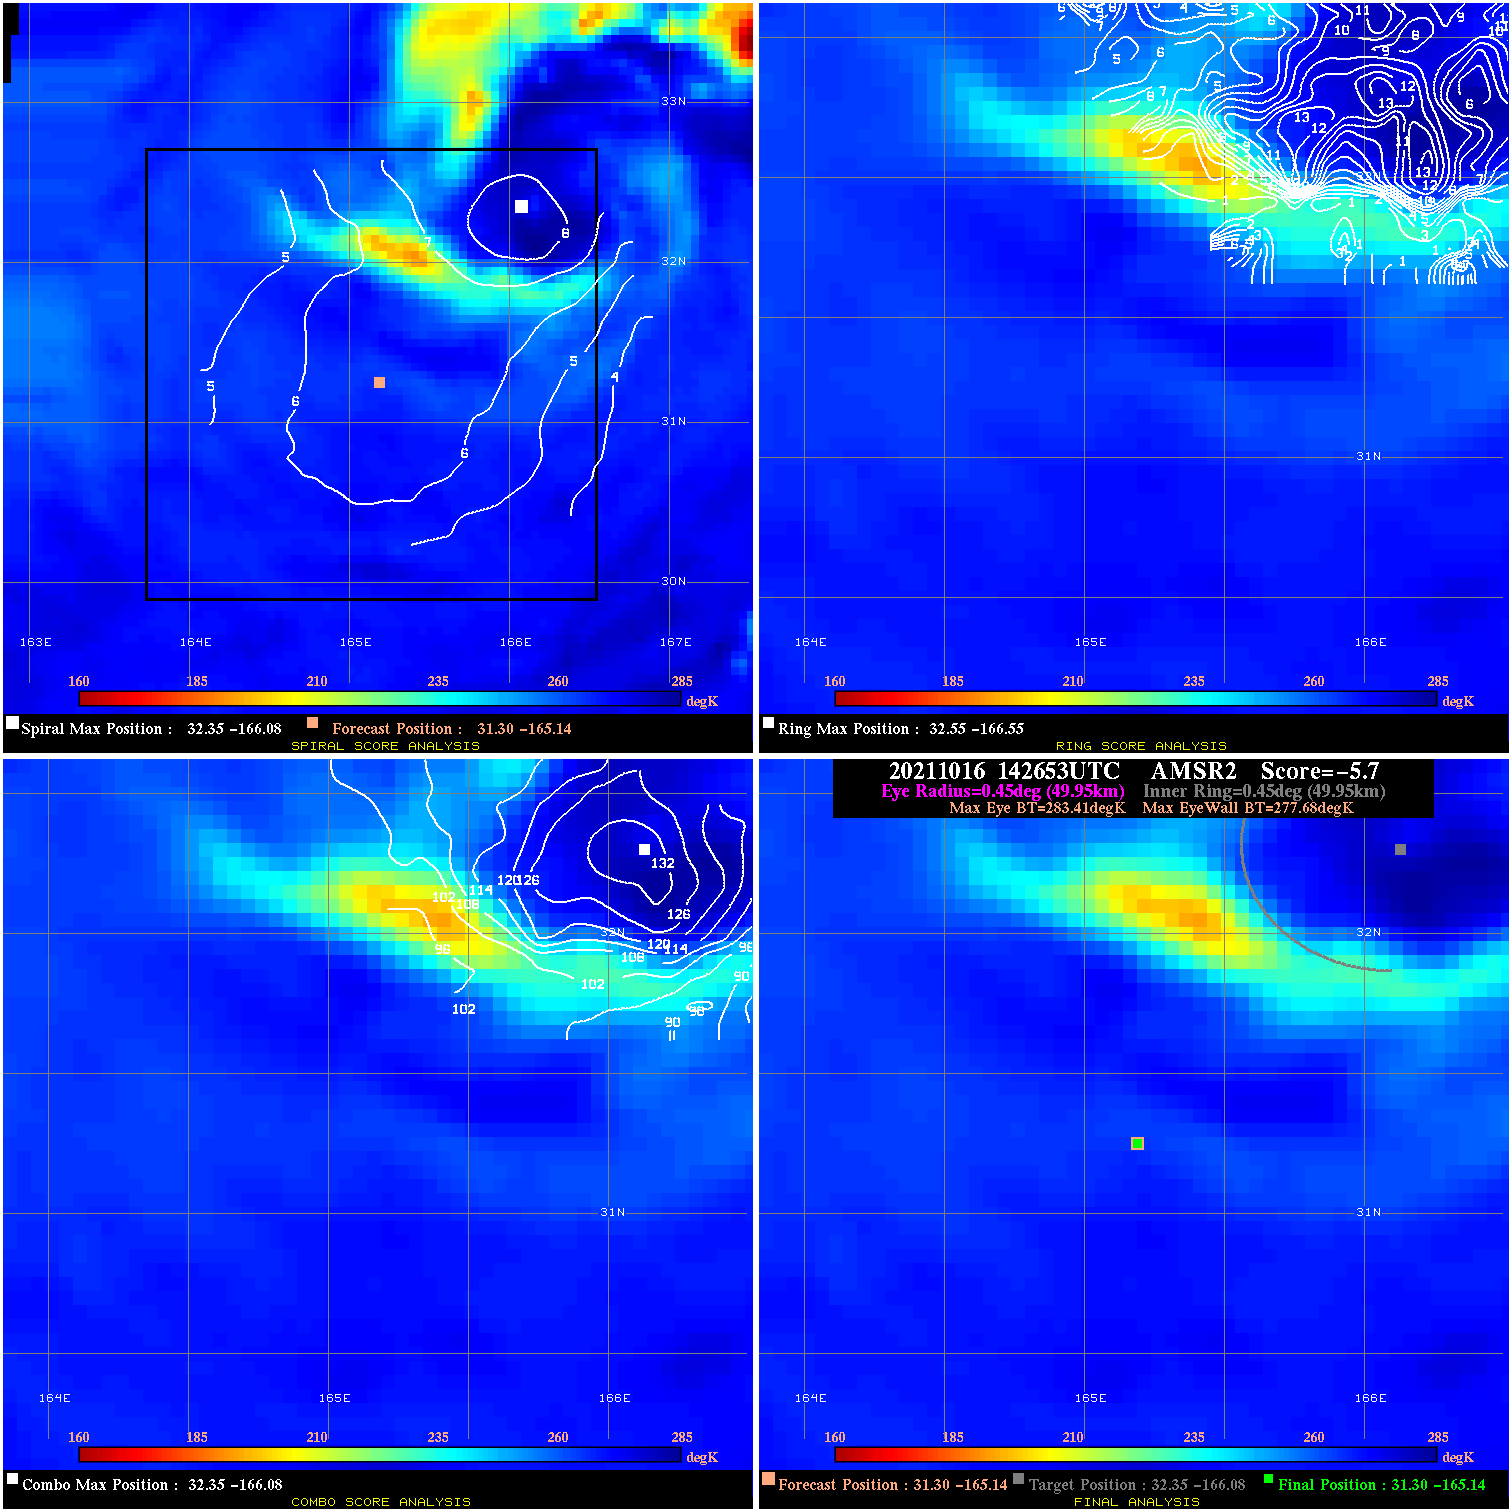
20211016 142653 -5.7 N/A 5.5% 99.99 5.73 50.0 AMSR2 31.3 -165.1 31.3 -165.1 32.3 -166.1 Analysis Plot
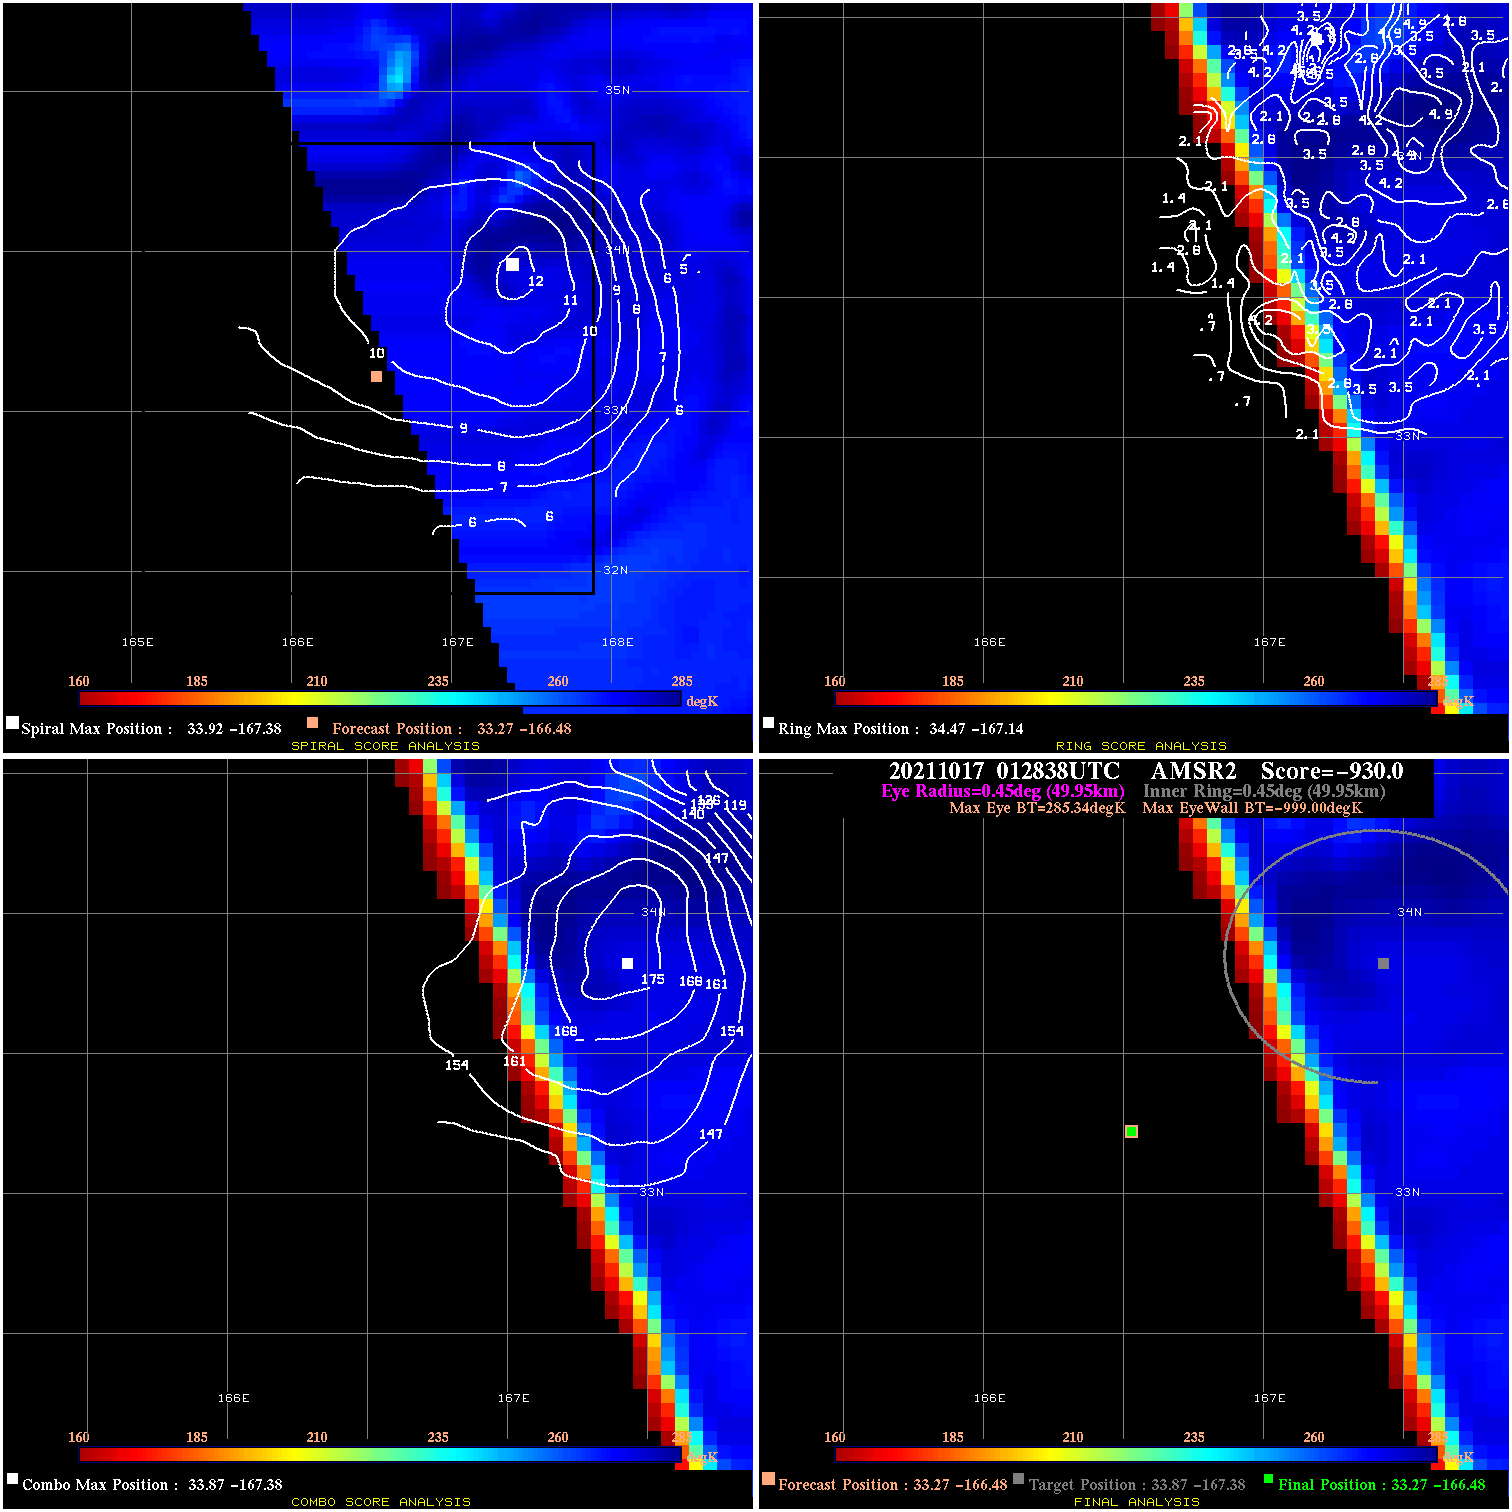
20211017 012838 -930.0 N/A N/A N/A 0.00 40.0 AMSR2 33.3 -166.5 33.3 -166.5 33.9 -167.4 Analysis Plot
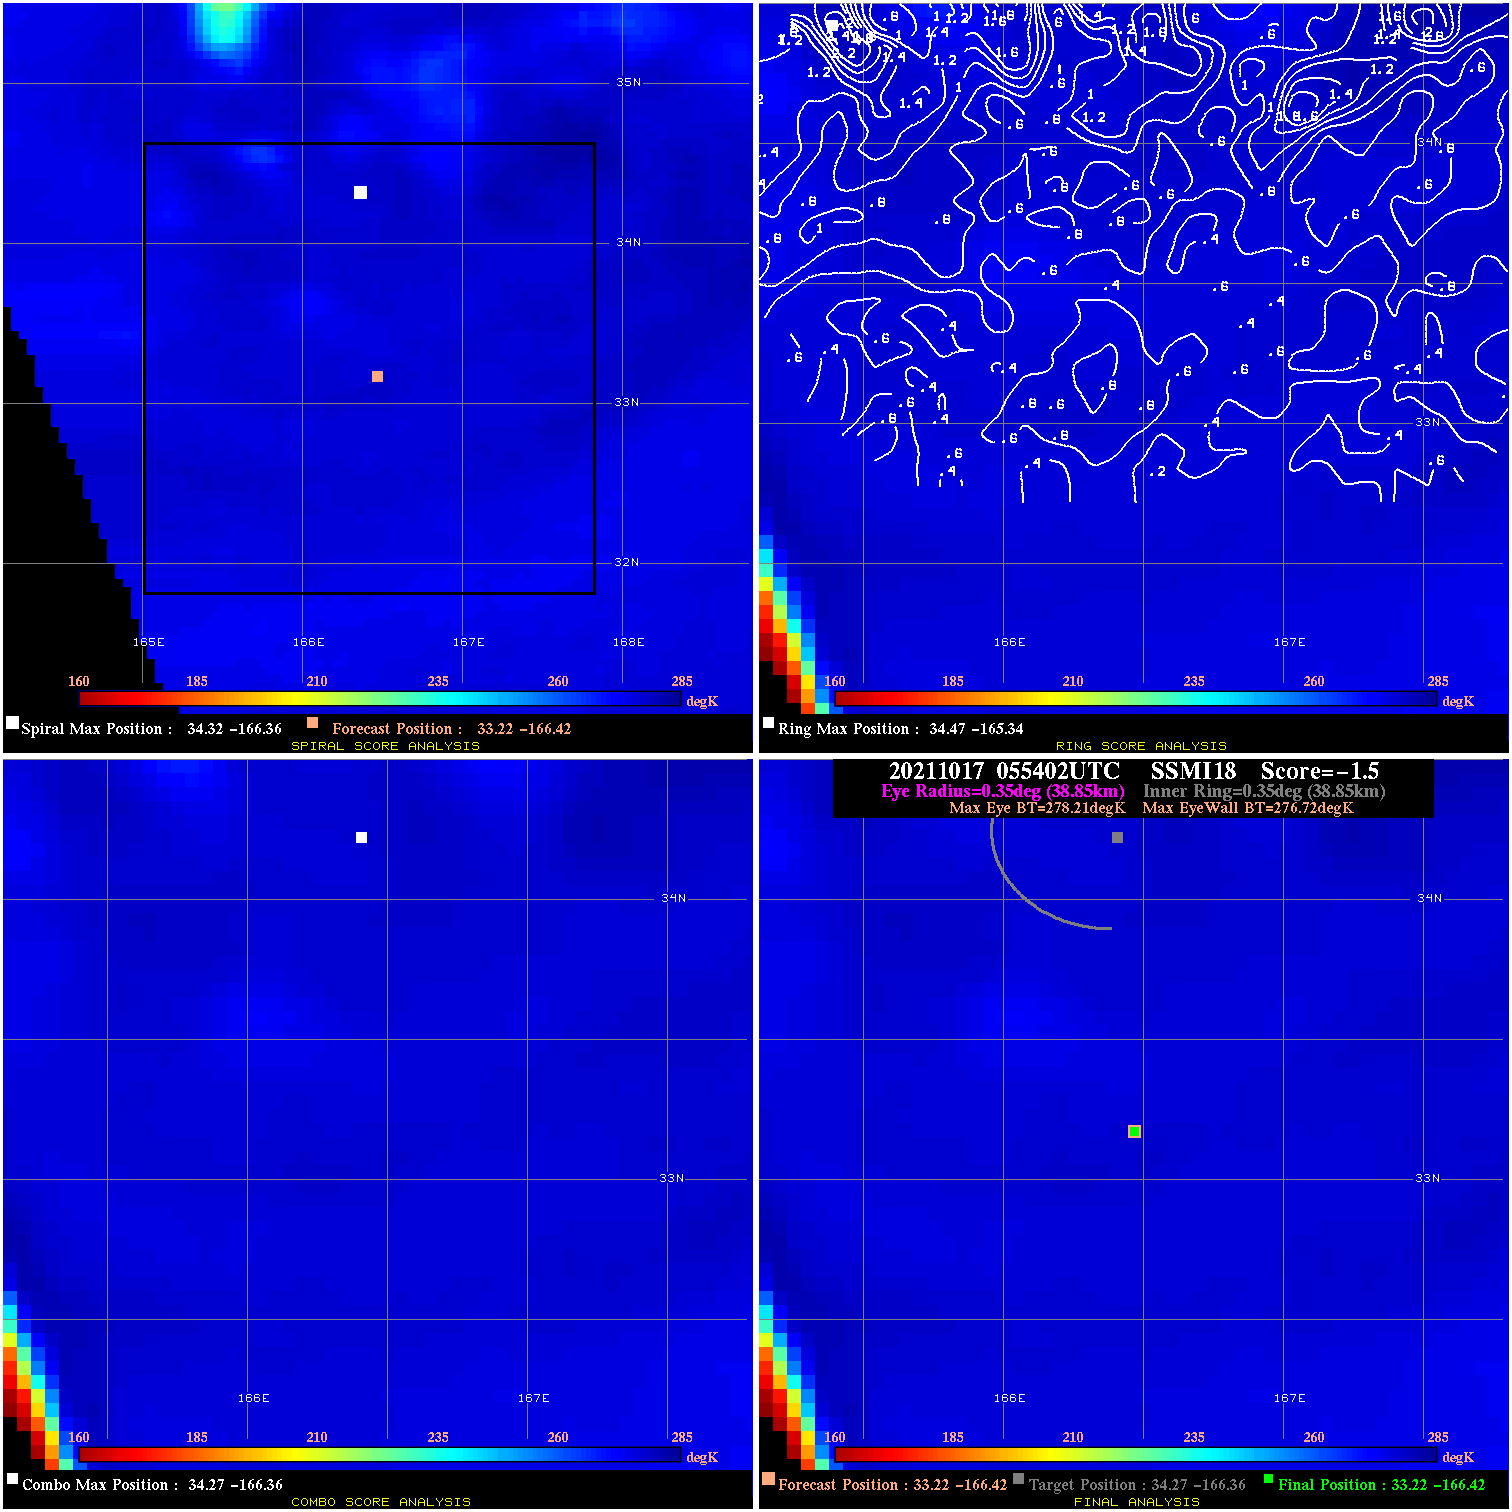
20211017 055402 -1.5 N/A N/A 77.77 1.49 40.0 SSMI18 33.2 -166.4 33.2 -166.4 34.3 -166.4 Analysis Plot
|
|
Legend: - Date/Time are determined from PMW imagery at Forecast (initial guess) Lat/Lon position. - Positive/Negative Latitude = North/South Hemisphere; Longitude = Western/Eastern Hemisphere. - "Ring Diam" value indicates the estimated surface eyewall diameter in km (the MI eyewall edge diameter minus 10 km). - "Ring Pct" is the percentage of the "ring" (eyewall inner boundary) that is 1) colder than the "hot spot" (warmest eye pixel) in the eye by 20K, or 2) the percentage that is a) colder than 232K and b) colder than the "hot spot" by 10K, whichever is greater. - Values are red if Ring % <= 65, yellow/brown if Ring % <= 85 and green if Ring % > 85. - "Tb diff" is the difference between the "hot spot" (warmest eye pixel) and the warmest pixel on the eyewall. - Intensity score are listed as negative, and not used, when the JTWC or NHC estimated Vmax is <55 kts in order to rule out weak but highly symmetric TCs. - Error messages in intensity scores: -920 is used when the hottest pixel in the eye is <200K, to prevent false positives; -930 means <85% of eyewall has observations/data. |