Tropical Storm 08S
|
Passive Microwave (PMW) Intensity Information Advanced Dvorak Technique (ADT) Version 8.1.4 (experimental) |
Overpass Inten Ring Ring Wind Final Forecast Target
Date Time Score Meaning Pct Diam BTdiff Est Sat Lat Lon Lat Lon Lat Lon
20130109 211107 N/A N/A N/A N/A N/A 75.0 SSMI15 -14.2 -115.6 -14.3 -115.5 -14.3 -115.5 Analysis Plot
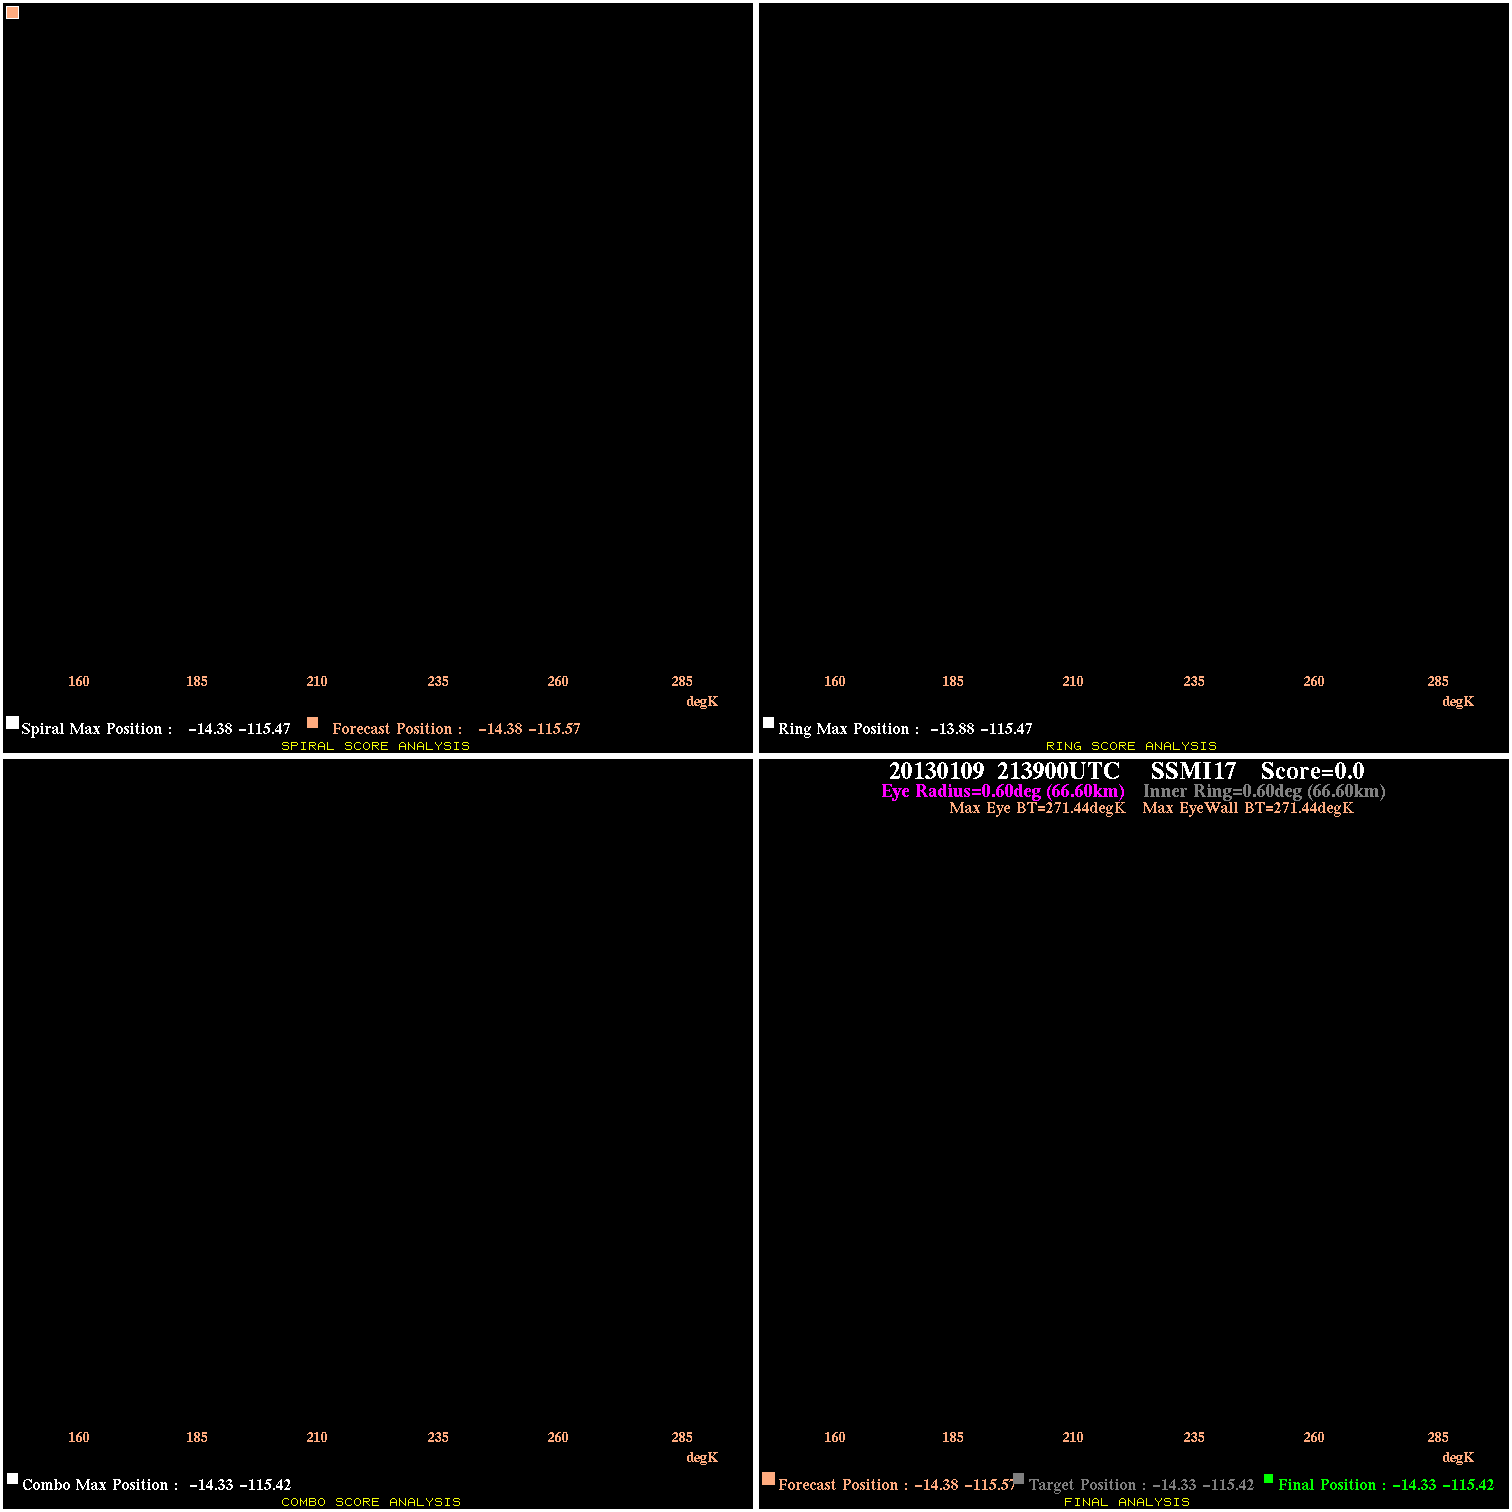
20130109 213900 N/A N/A N/A N/A N/A 75.0 SSMI17 -14.4 -115.6 -14.3 -115.4 -14.3 -115.4 Analysis Plot
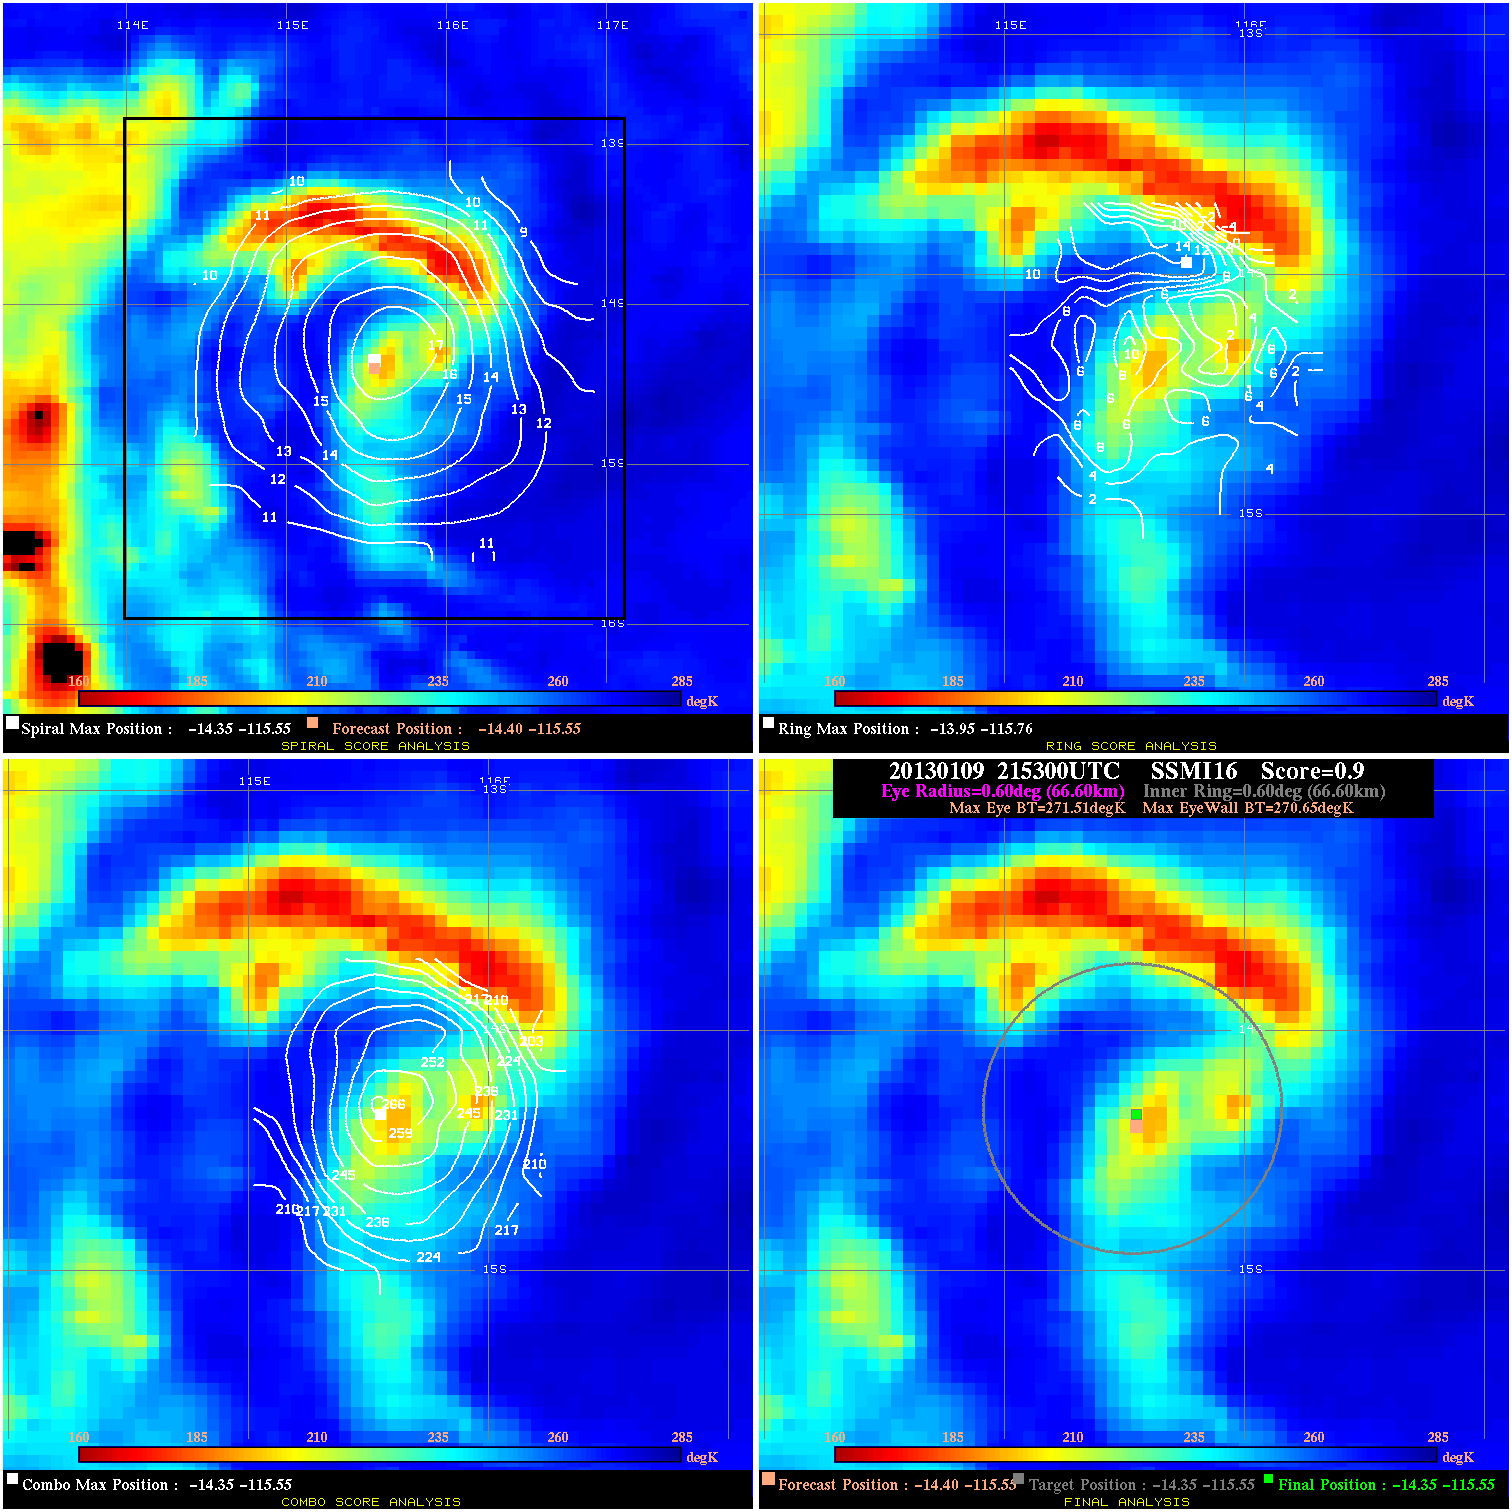
20130109 215300 0.9 N/A 21.9% 133.32 .86 75.0 SSMI16 -14.4 -115.5 -14.3 -115.5 -14.3 -115.5 Analysis Plot
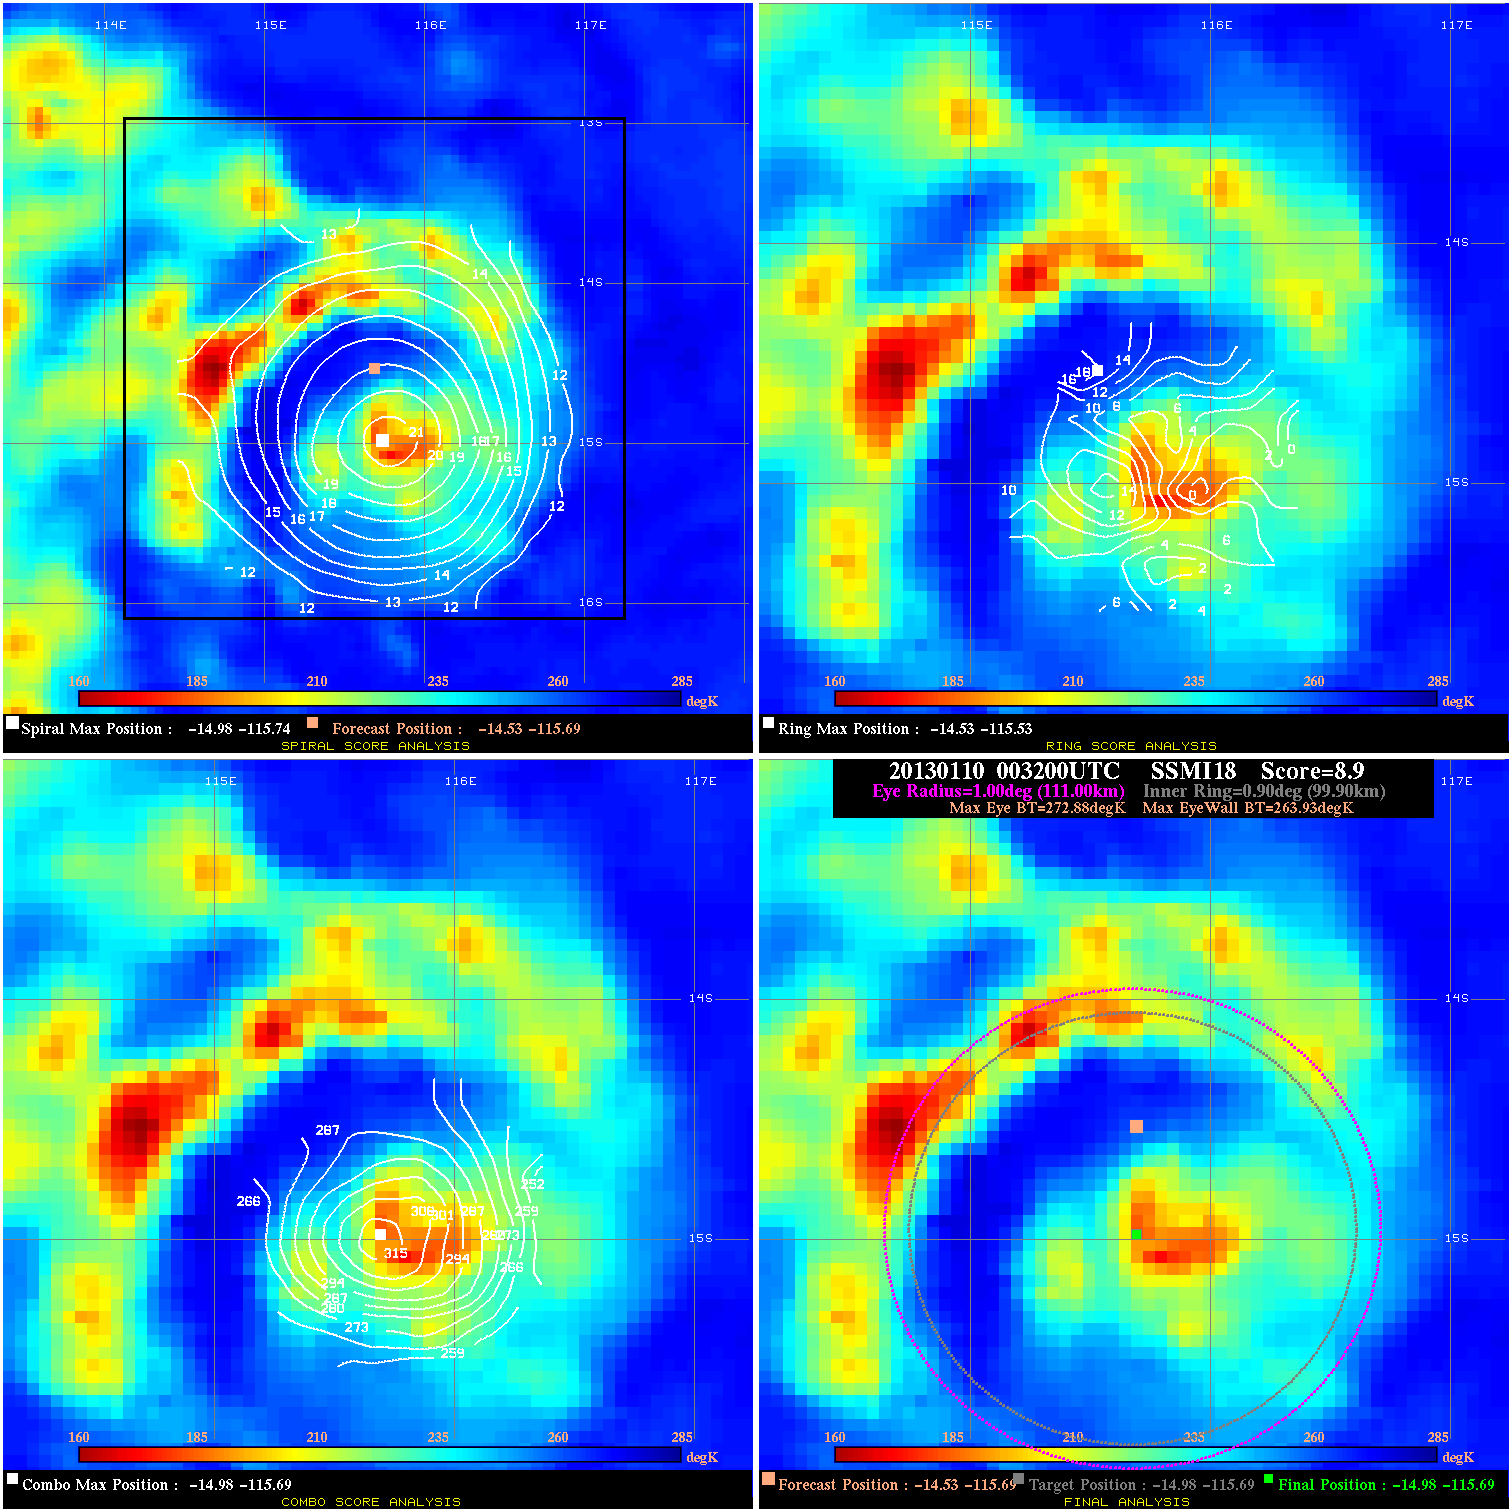
20130110 003200 8.9 N/A 37.0% 222.20 8.95 75.0 SSMI18 -14.5 -115.7 -15.0 -115.7 -15.0 -115.7 Analysis Plot
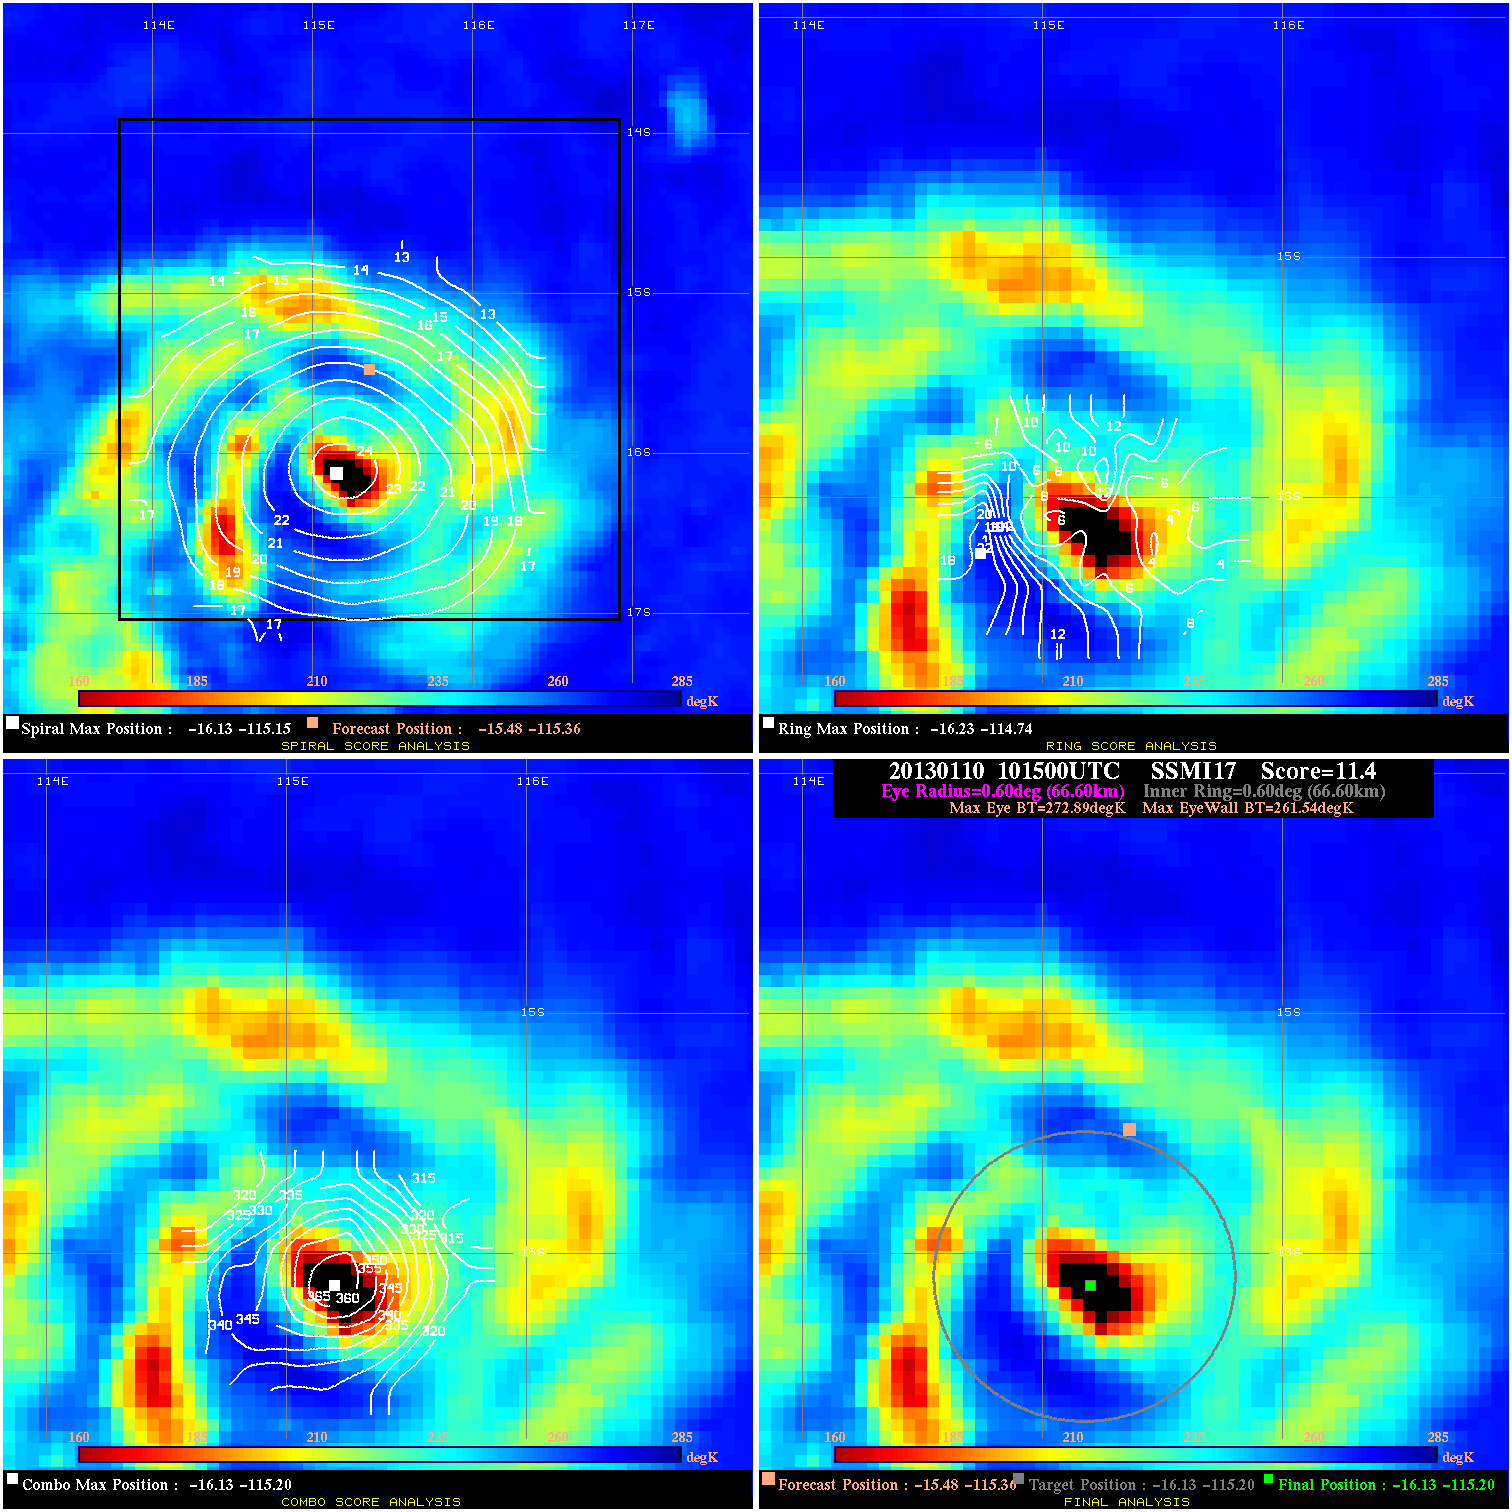
20130110 101500 11.4 N/A 37.0% 133.32 11.35 75.0 SSMI17 -15.5 -115.4 -16.1 -115.2 -16.1 -115.2 Analysis Plot
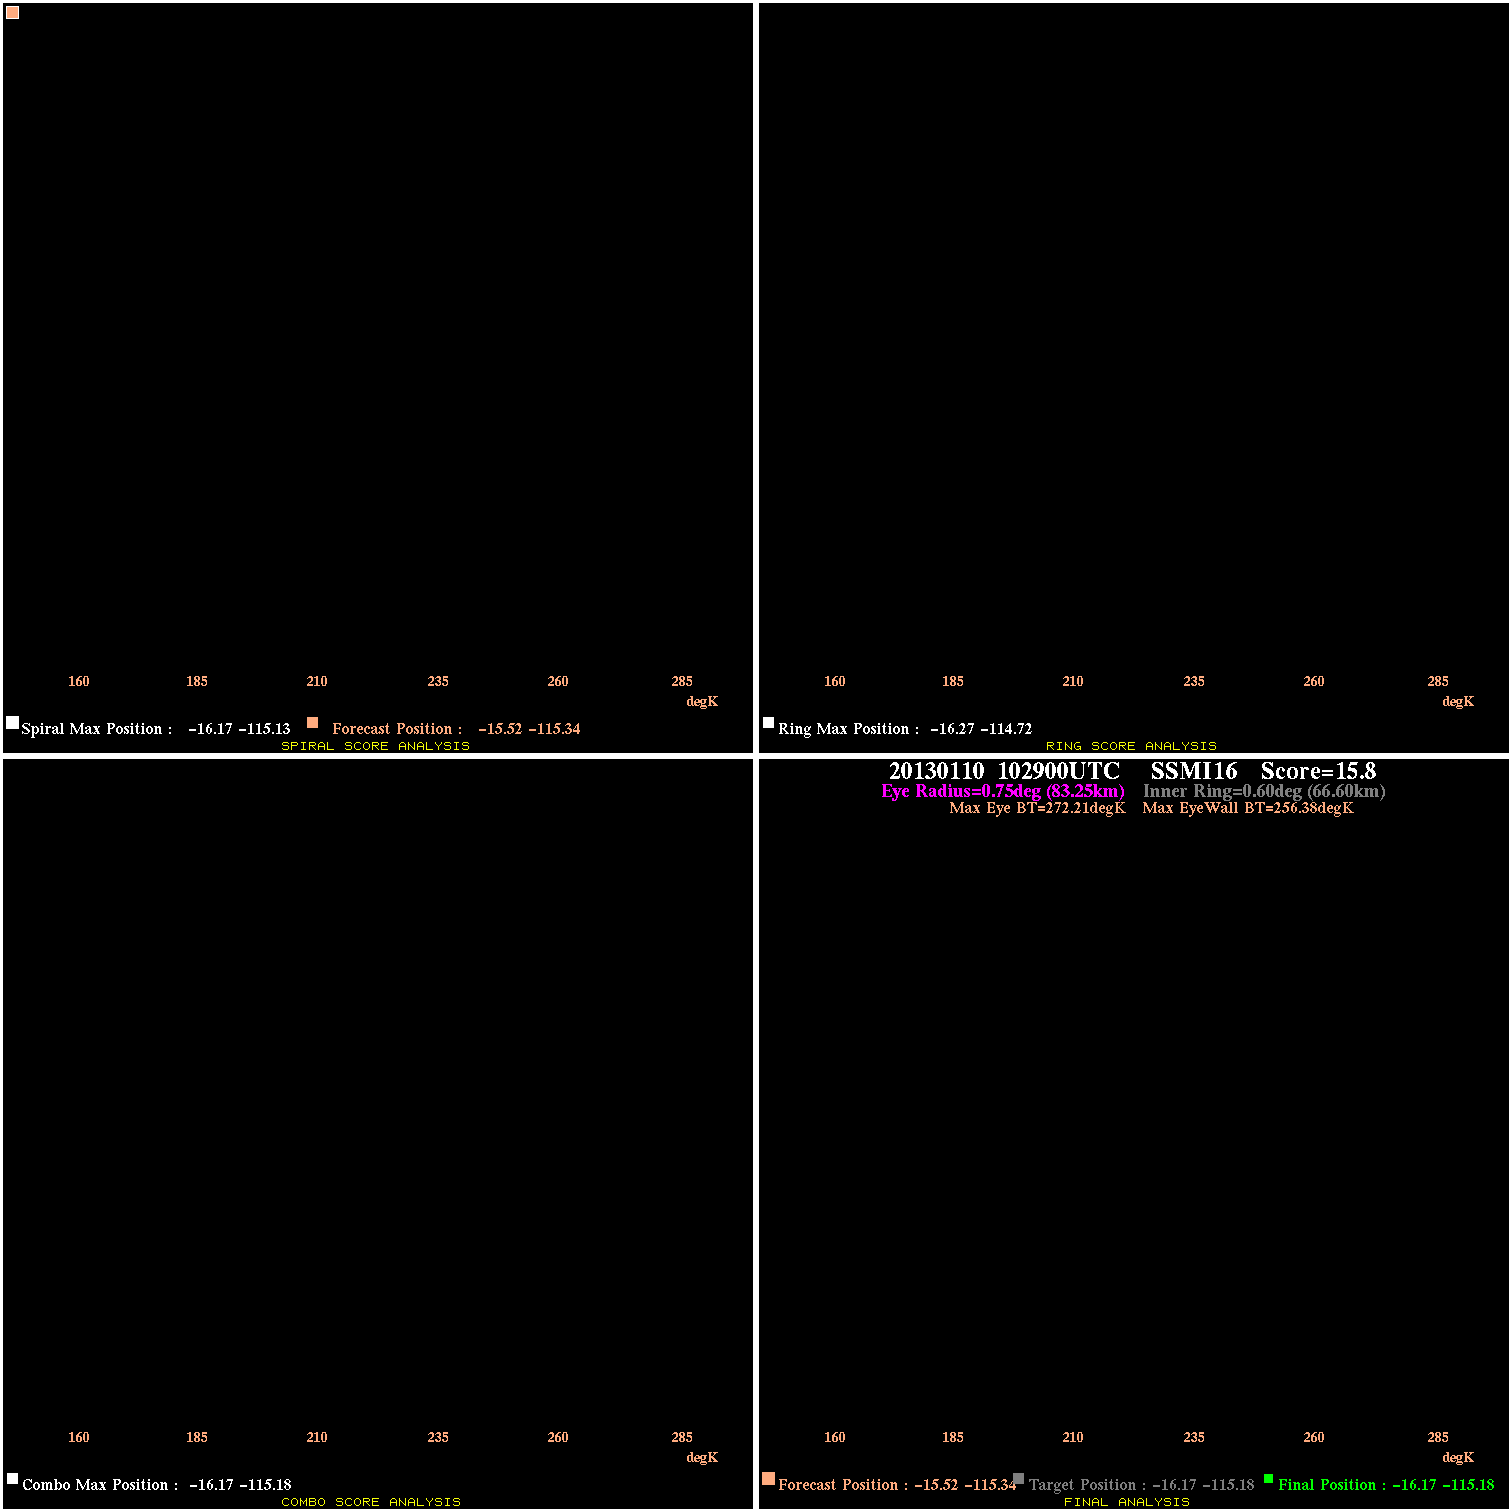
20130110 102900 15.8 N/A 50.7% 166.65 15.83 75.0 SSMI16 -15.5 -115.3 -16.2 -115.2 -16.2 -115.2 Analysis Plot
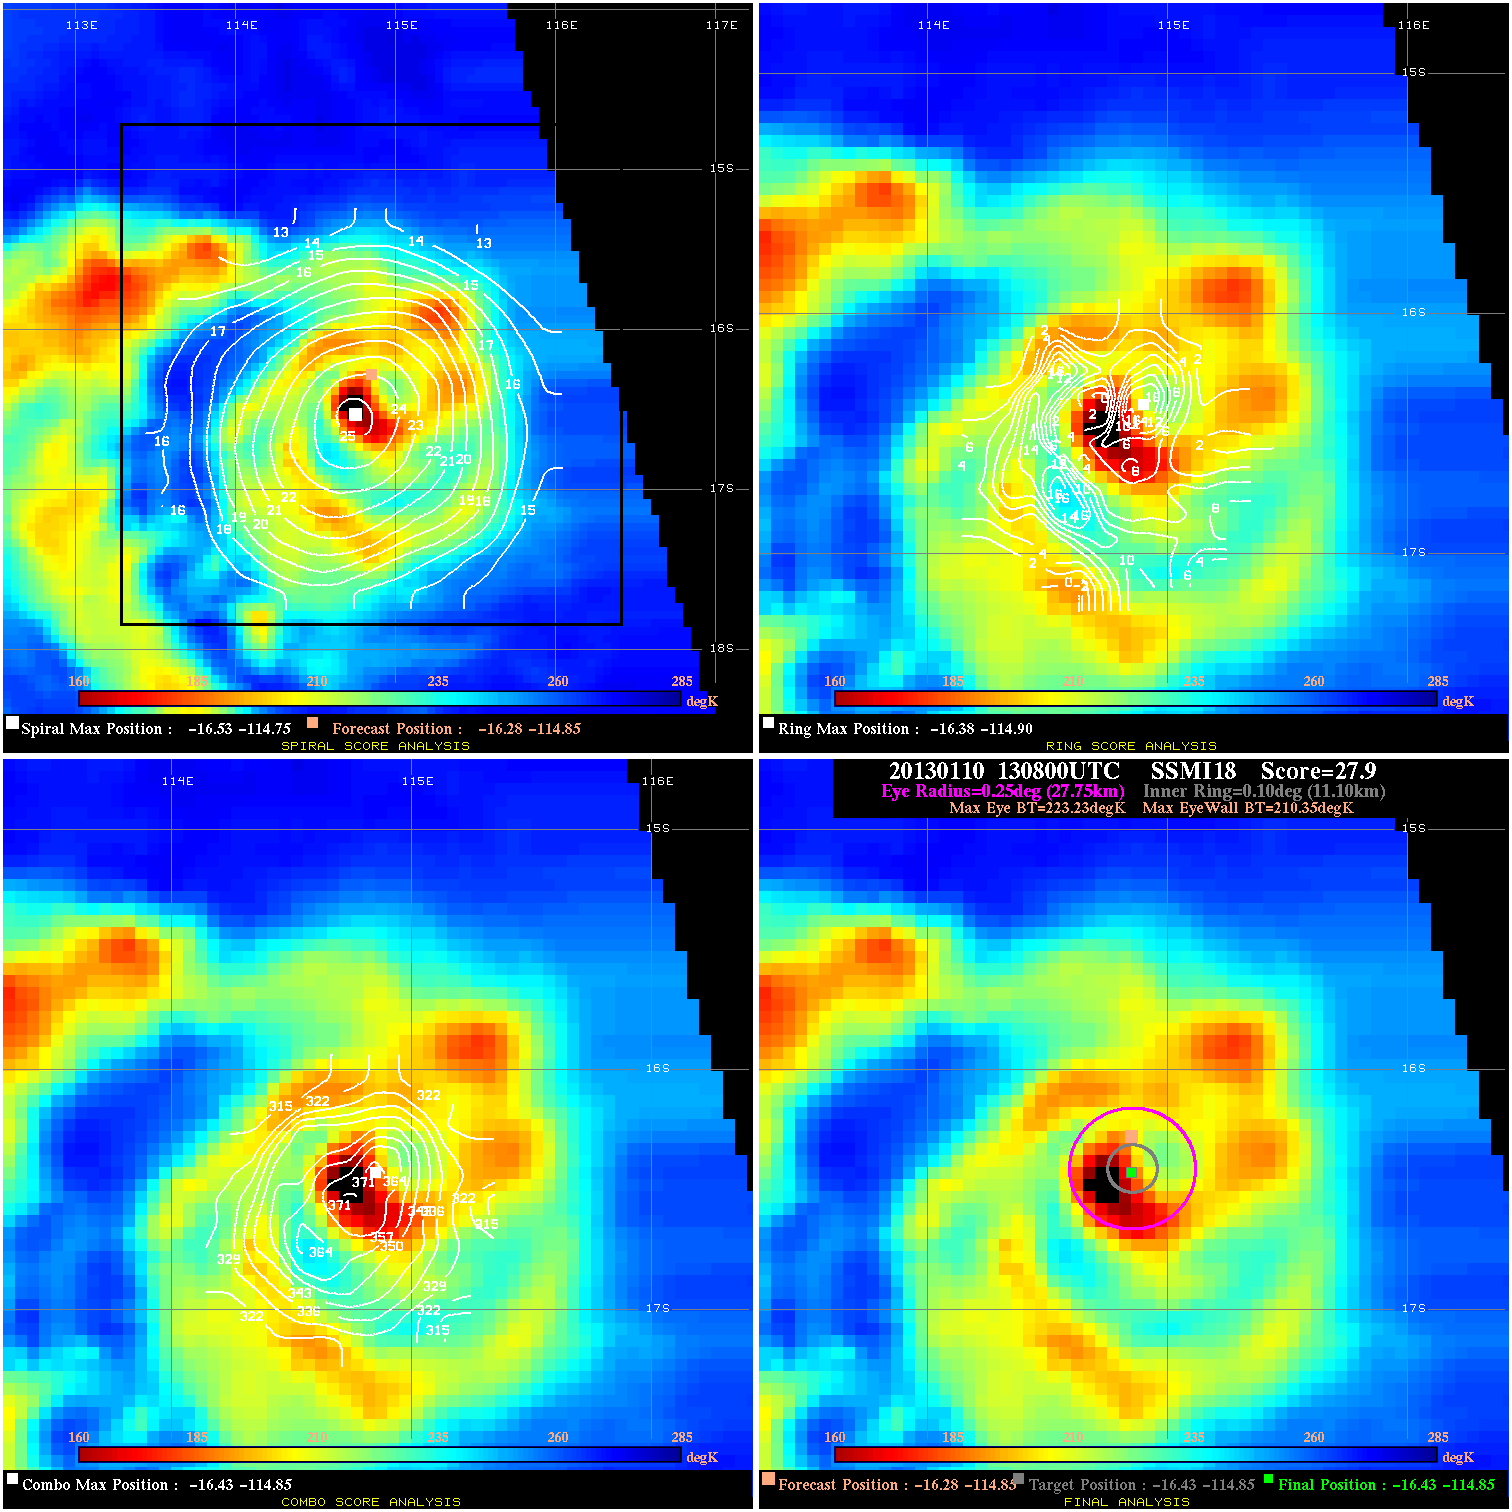
20130110 130800 27.9 >65 kts 100.0% 55.55 12.88 80.0 SSMI18 -16.3 -114.8 -16.4 -114.8 -16.4 -114.8 Analysis Plot
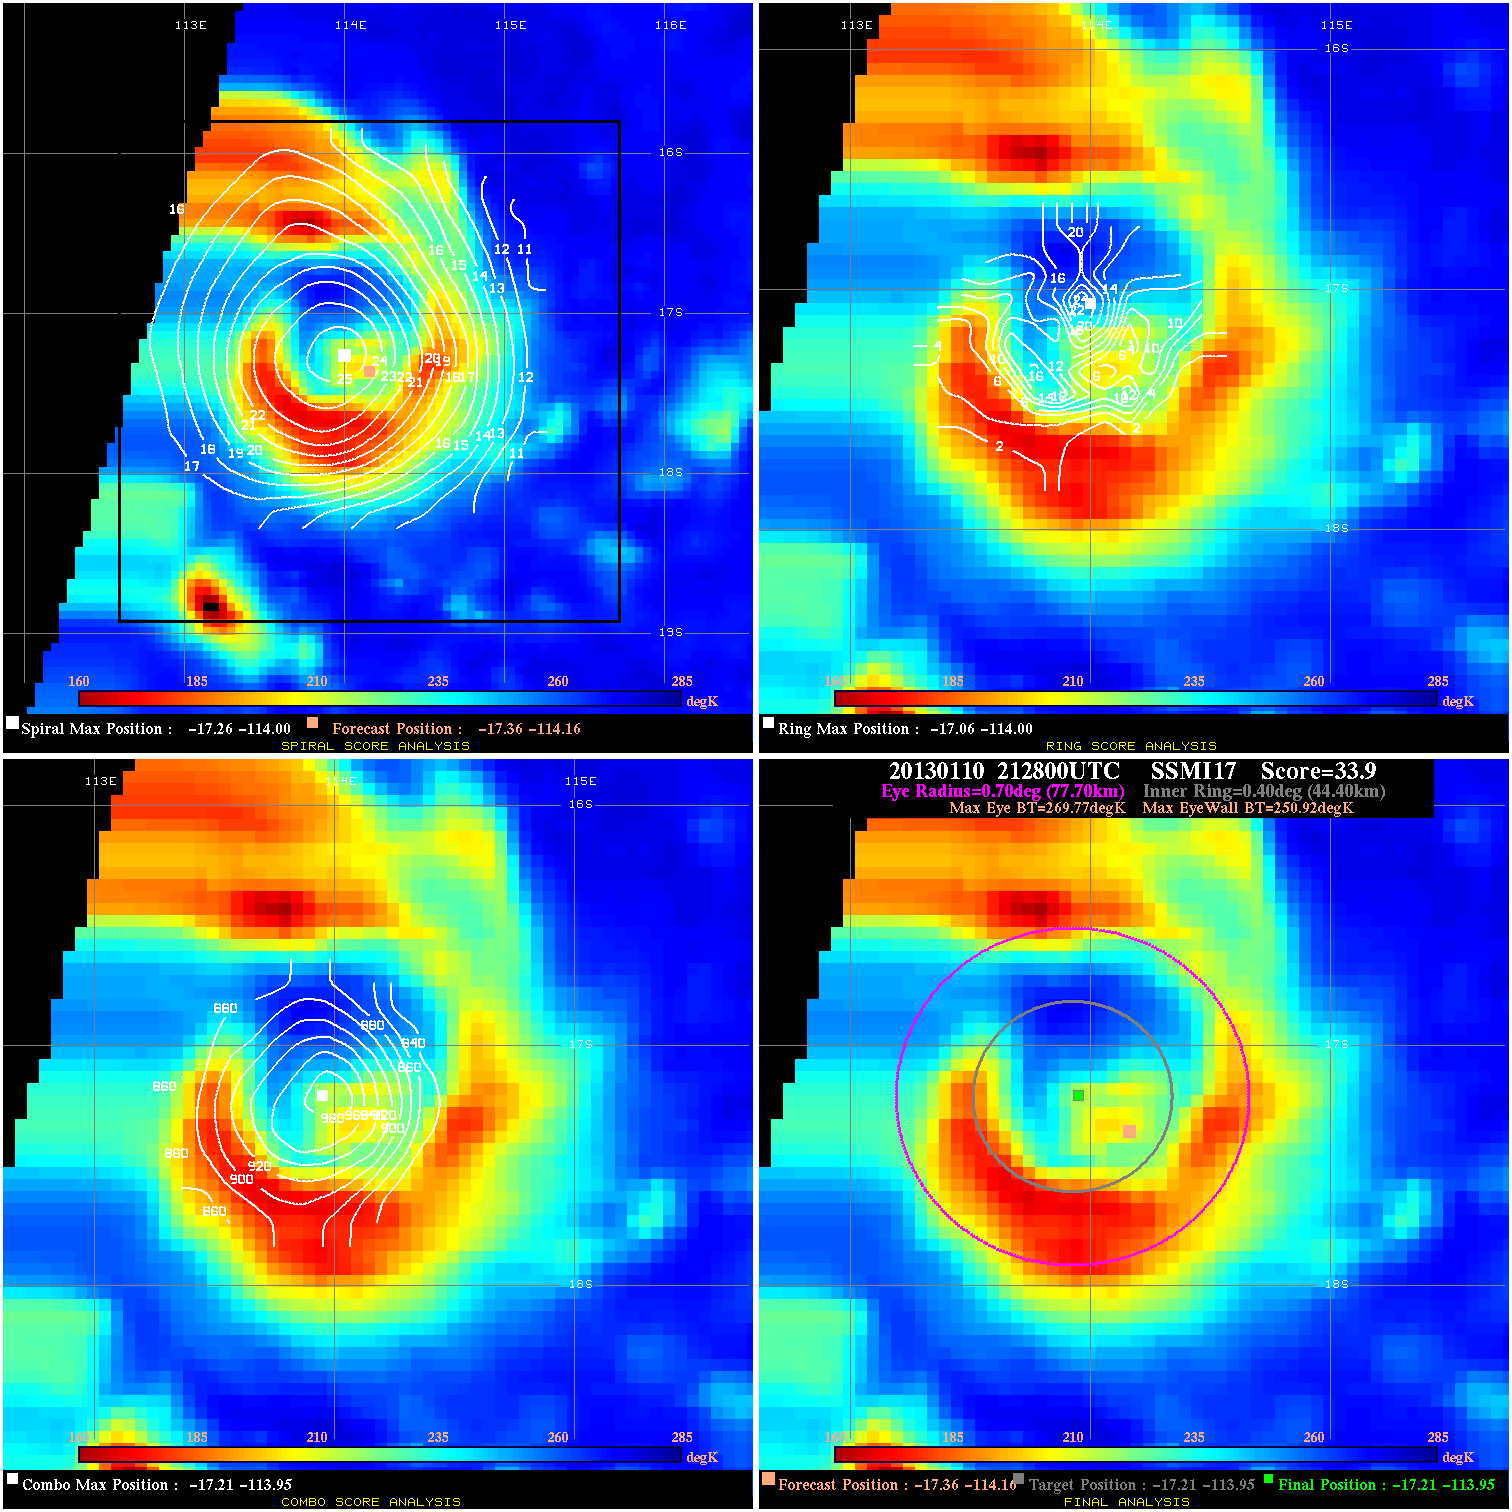
20130110 212800 33.9 >65 kts 97.3% 155.54 18.85 85.0 SSMI17 -17.4 -114.2 -17.2 -114.0 -17.2 -114.0 Analysis Plot
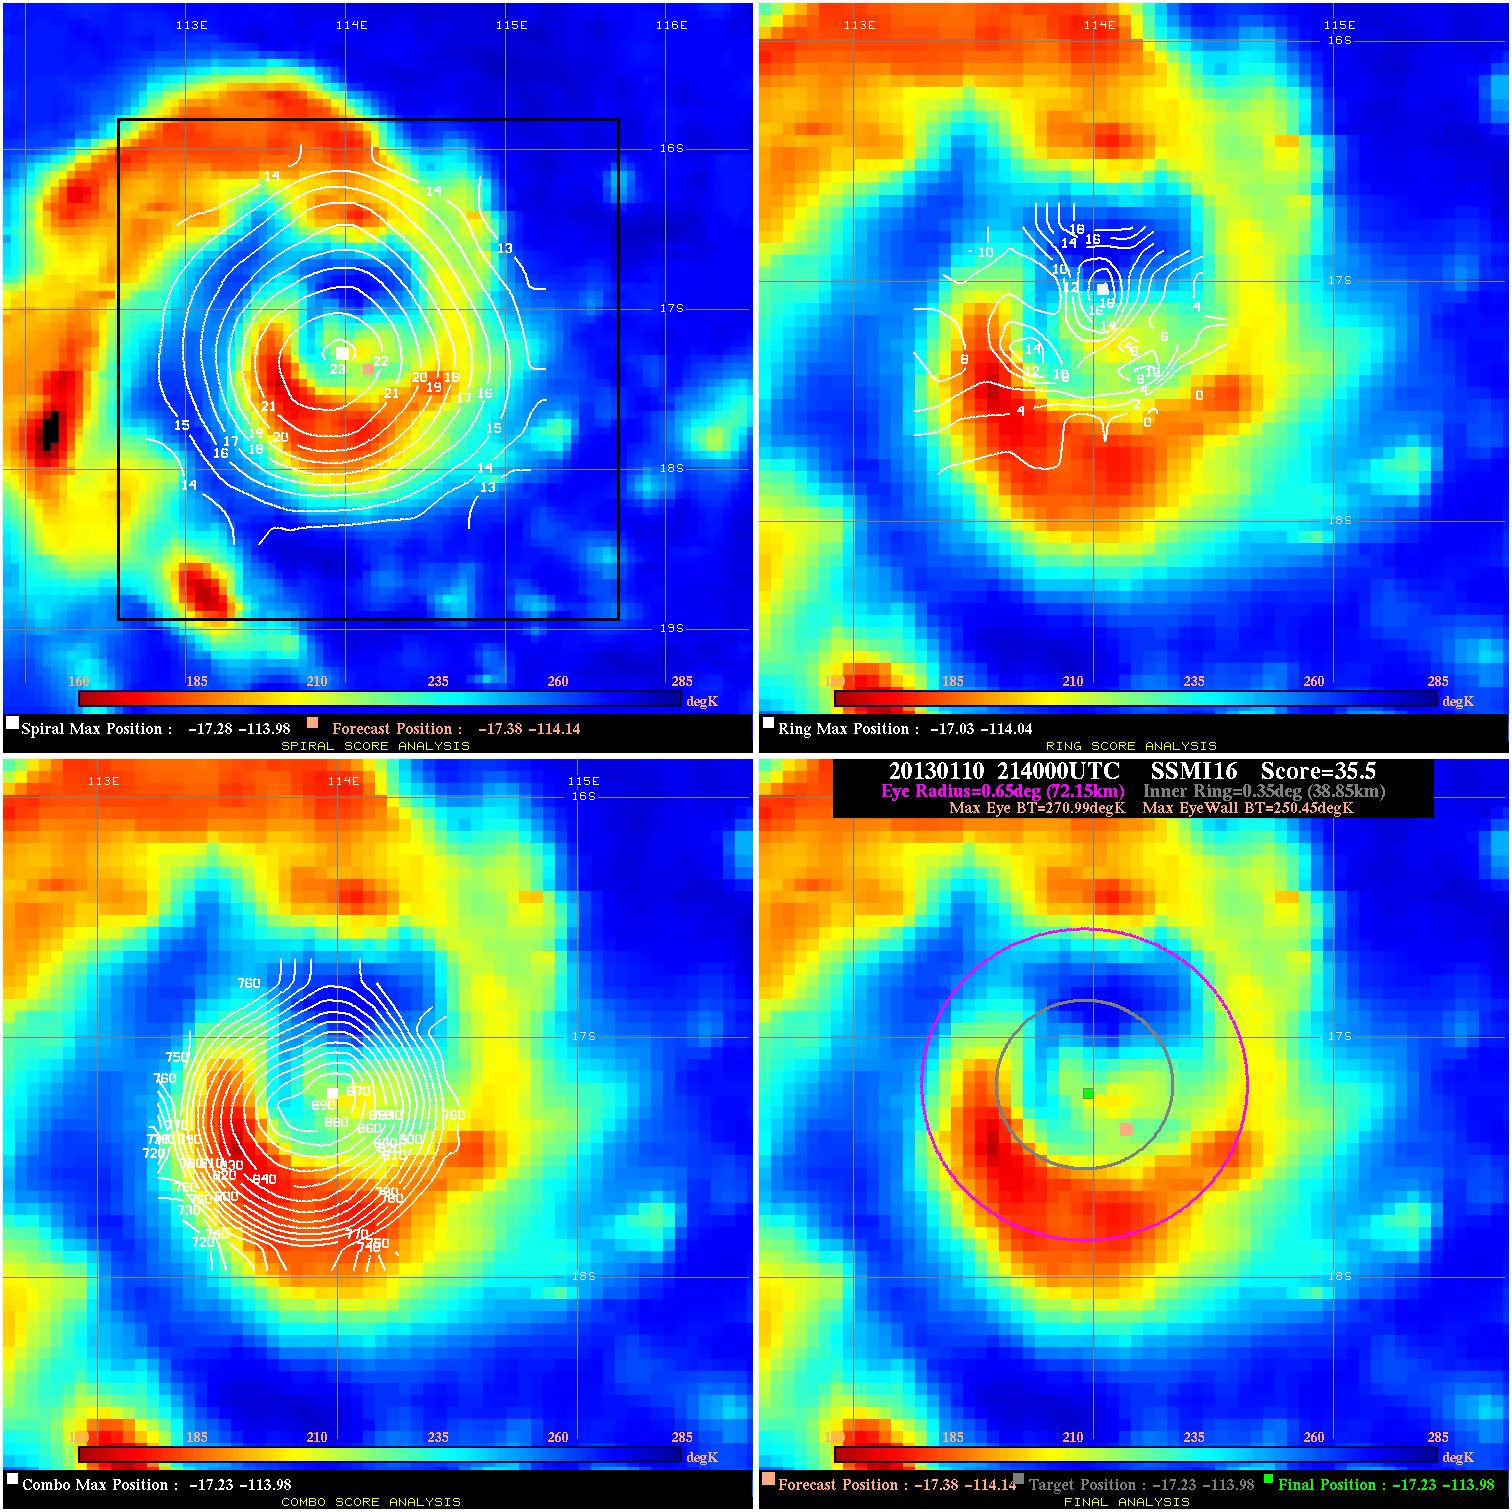
20130110 214000 35.5 >65 kts 100.0% 144.43 20.54 85.0 SSMI16 -17.4 -114.1 -17.2 -114.0 -17.2 -114.0 Analysis Plot
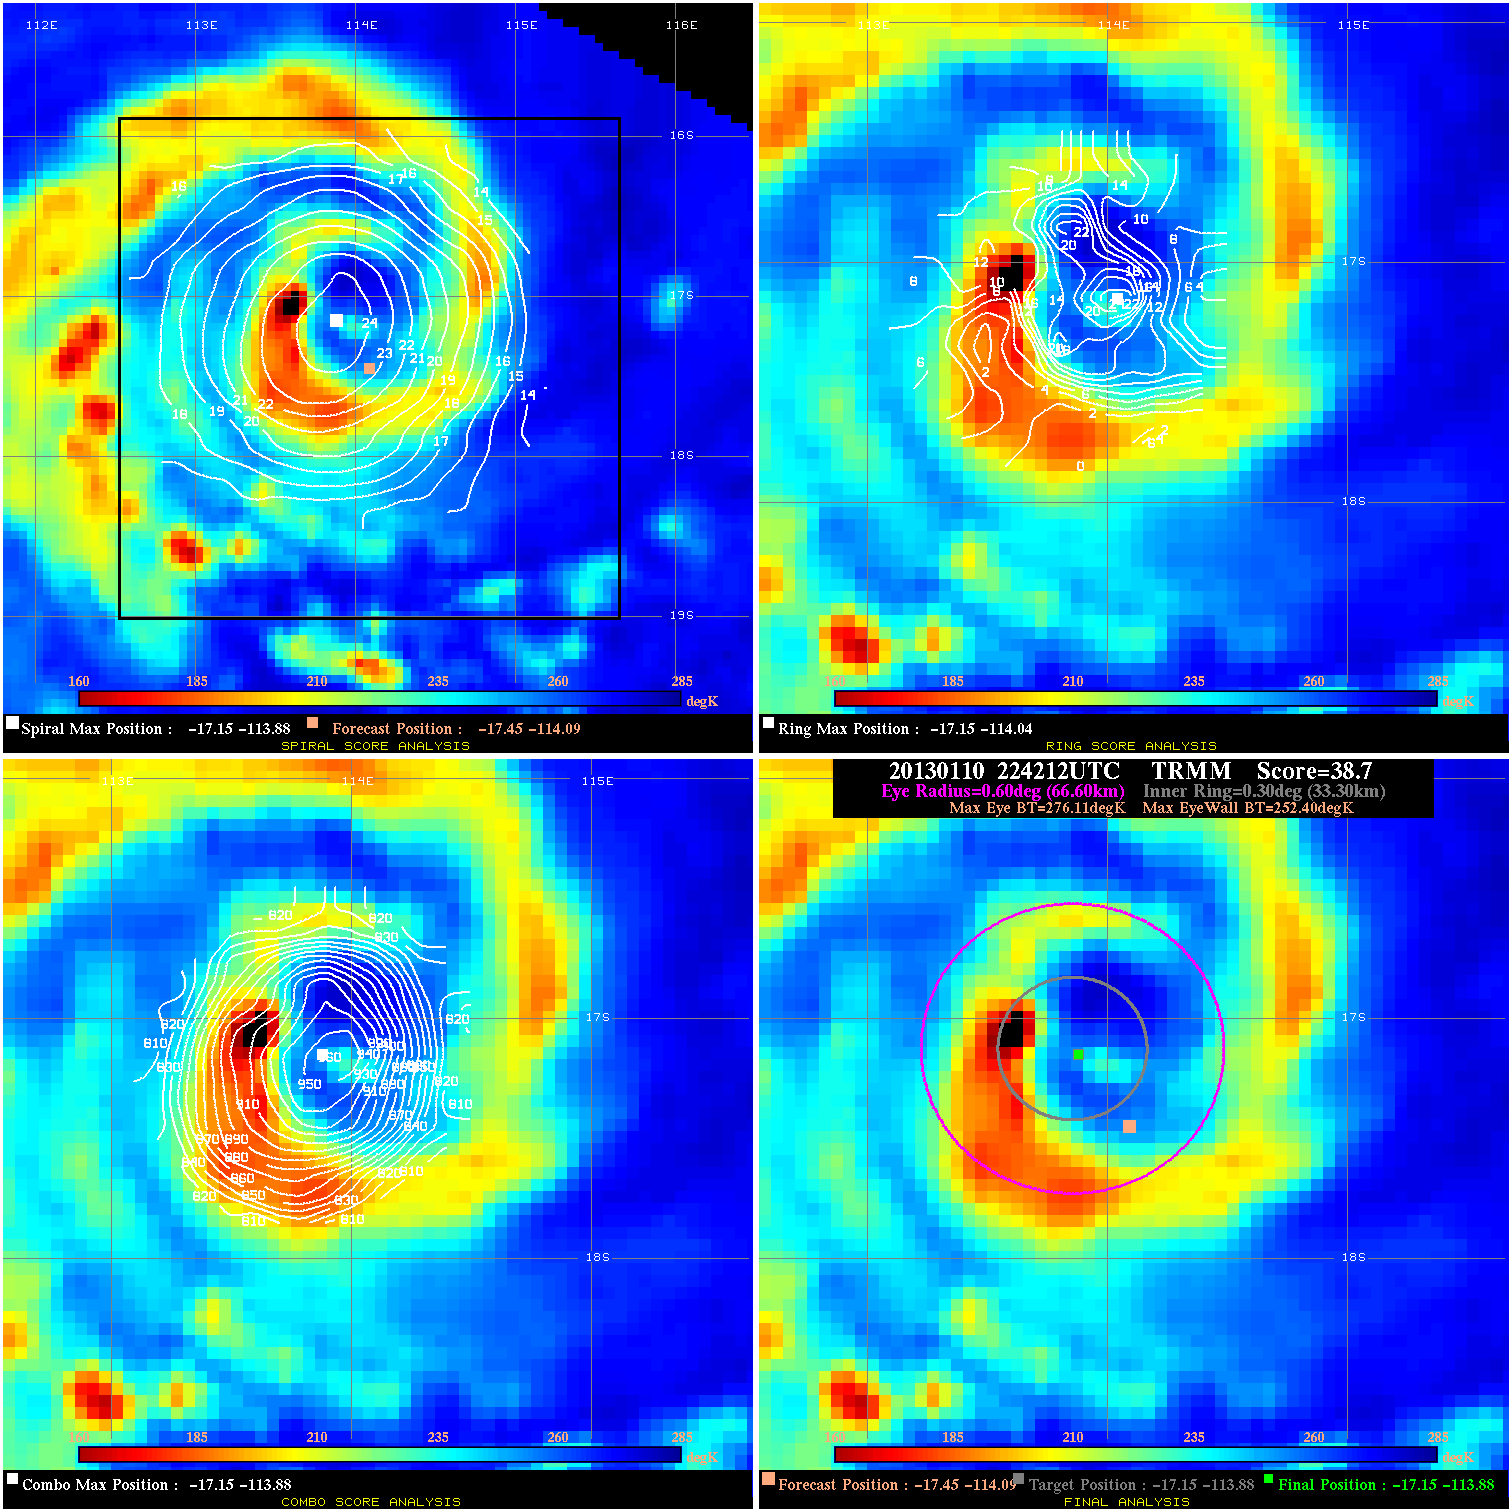
20130110 224212 38.7 >65 kts 100.0% 133.32 23.71 85.0 TRMM -17.4 -114.1 -17.1 -113.9 -17.1 -113.9 Analysis Plot
20130111 002000 54.2 >65 kts 100.0% 122.21 39.16 85.0 SSMI18 -17.6 -113.9 -17.3 -113.6 -17.3 -113.6 Analysis Plot
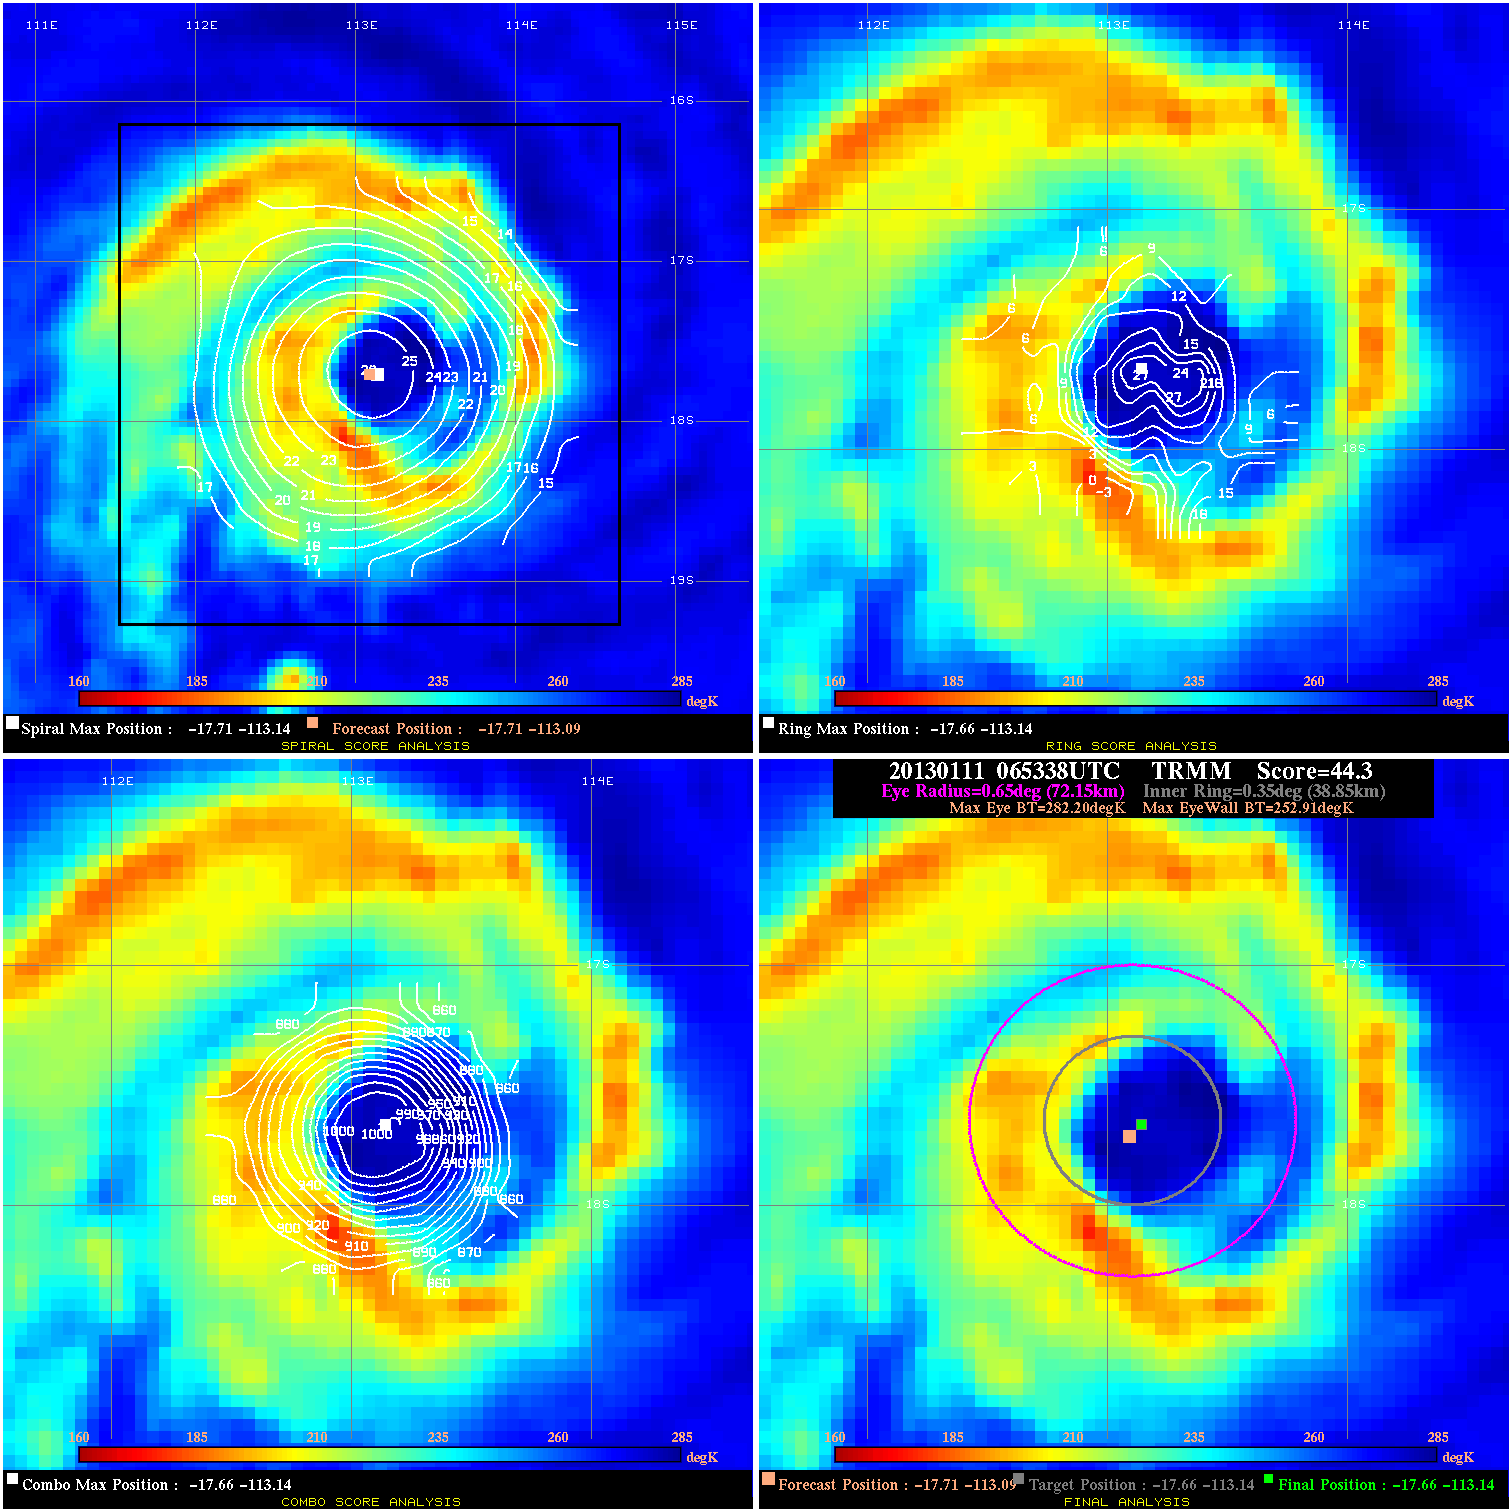
20130111 065338 44.3 >65 kts 100.0% 144.43 29.29 110.0 TRMM -17.7 -113.1 -17.7 -113.1 -17.7 -113.1 Analysis Plot
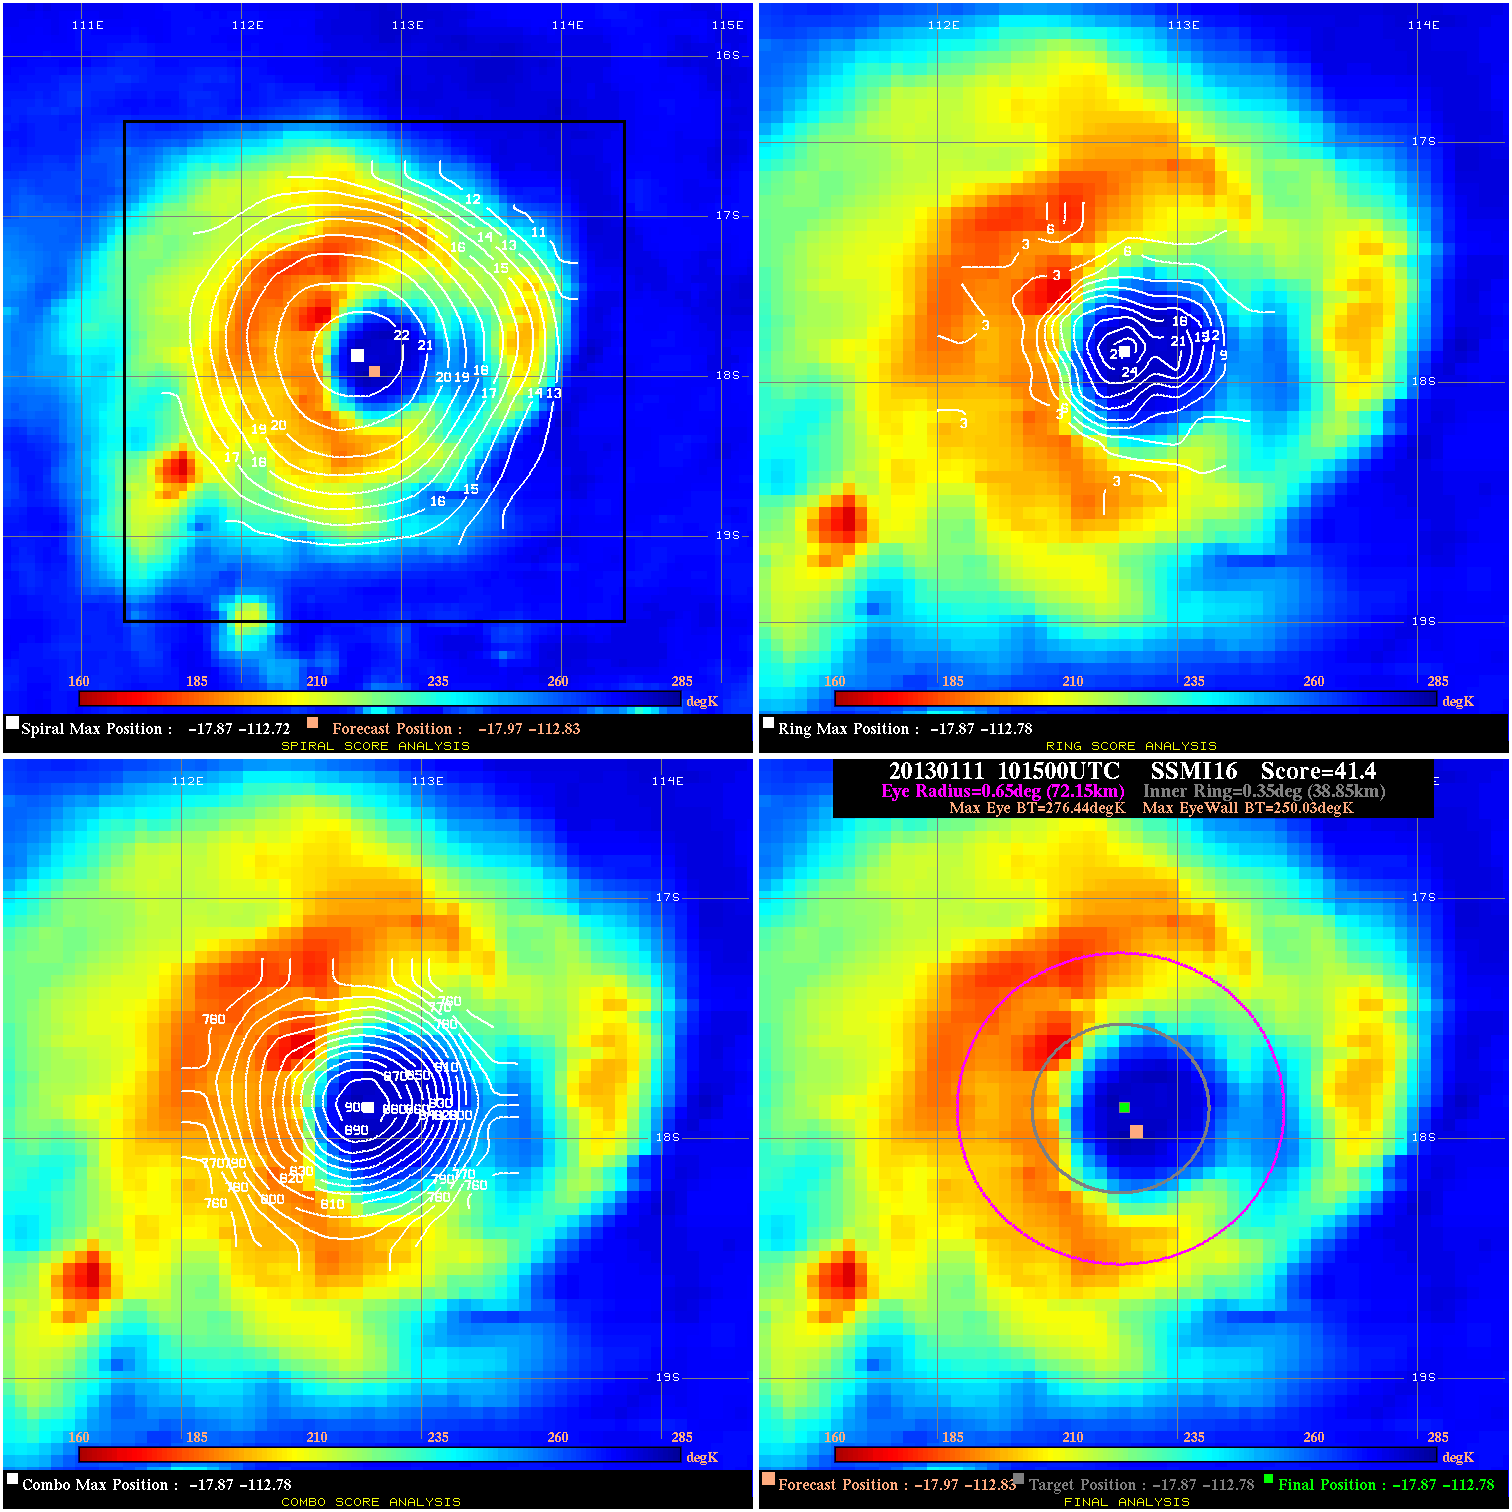
20130111 101500 41.4 >65 kts 100.0% 144.43 26.41 110.0 SSMI16 -18.0 -112.8 -17.9 -112.8 -17.9 -112.8 Analysis Plot
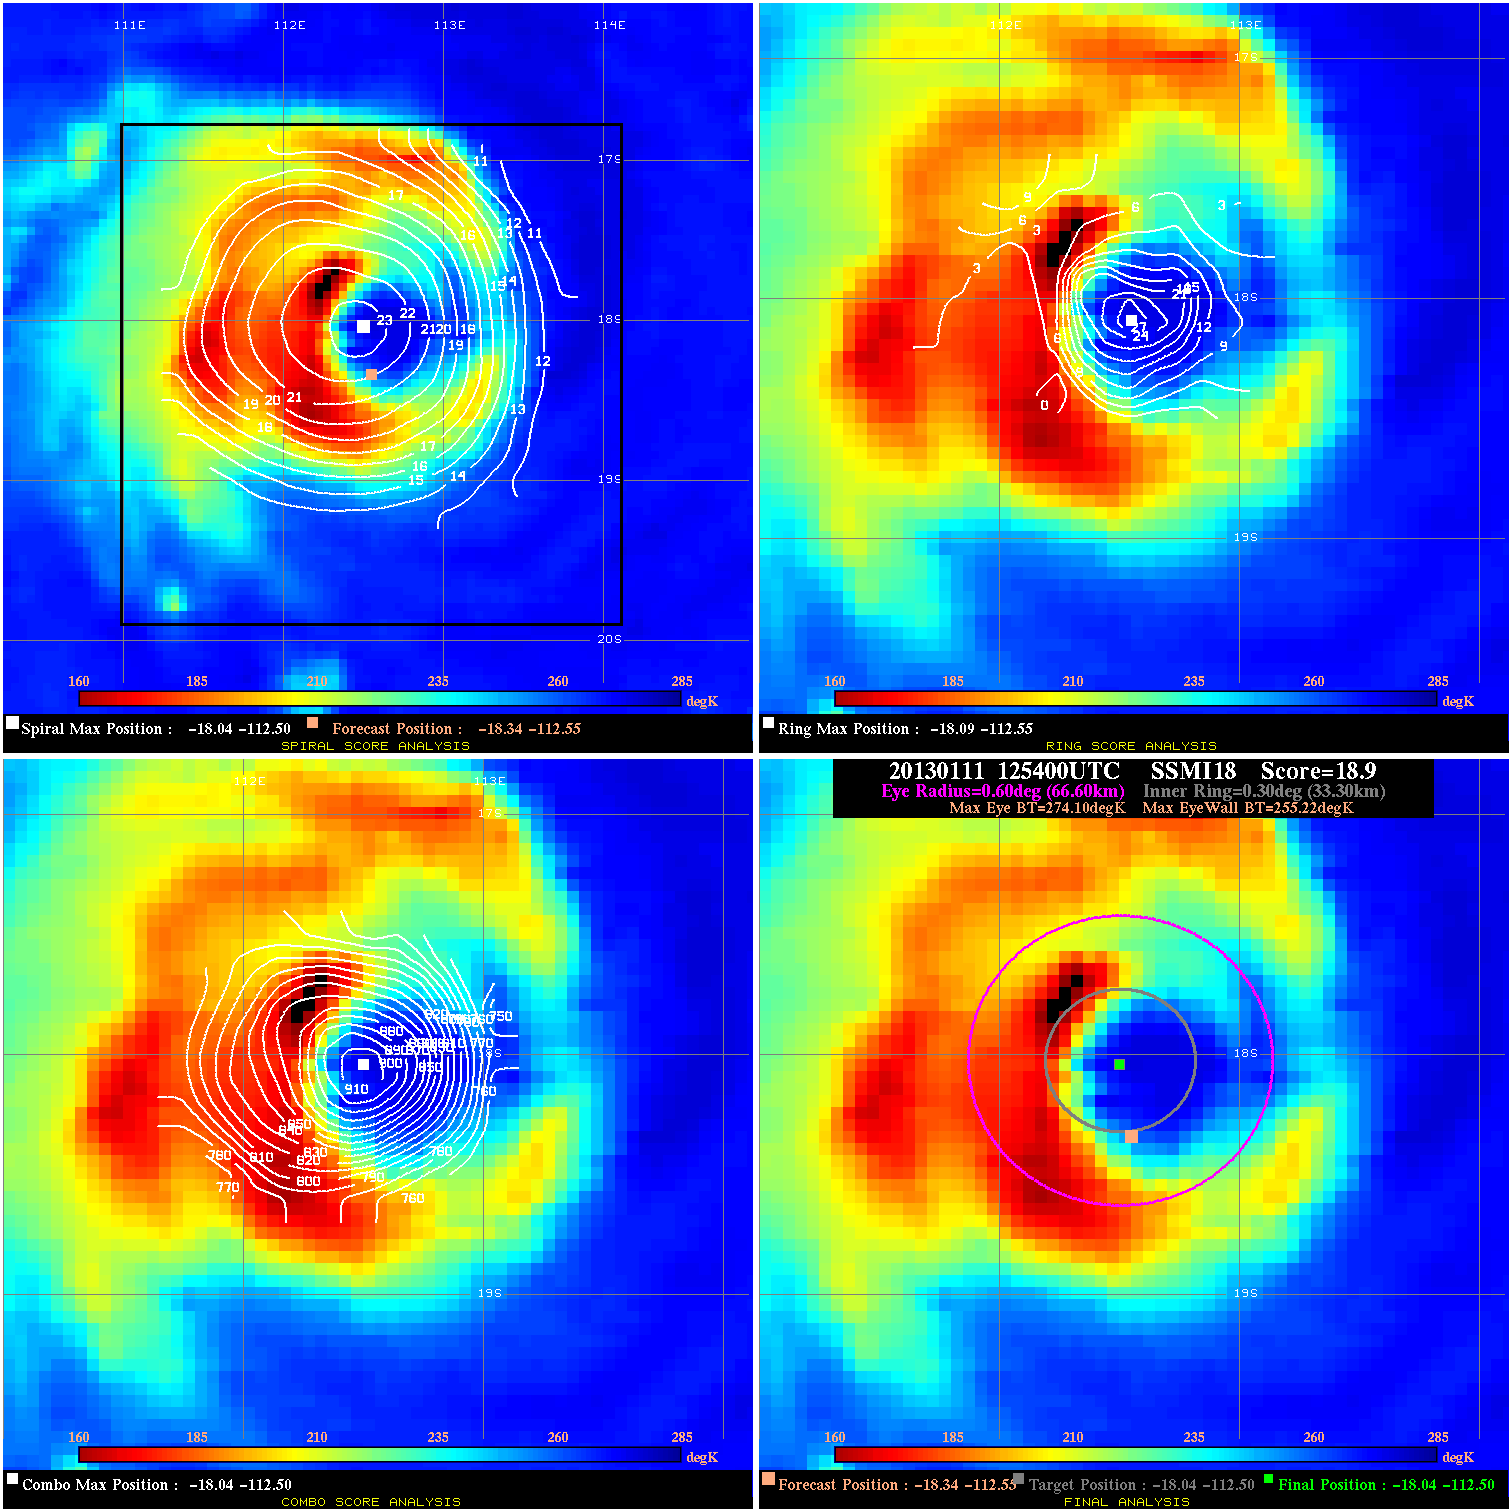
20130111 125400 18.9 N/A 74.0% 133.32 18.88 115.0 SSMI18 -18.3 -112.5 -18.0 -112.5 -18.0 -112.5 Analysis Plot
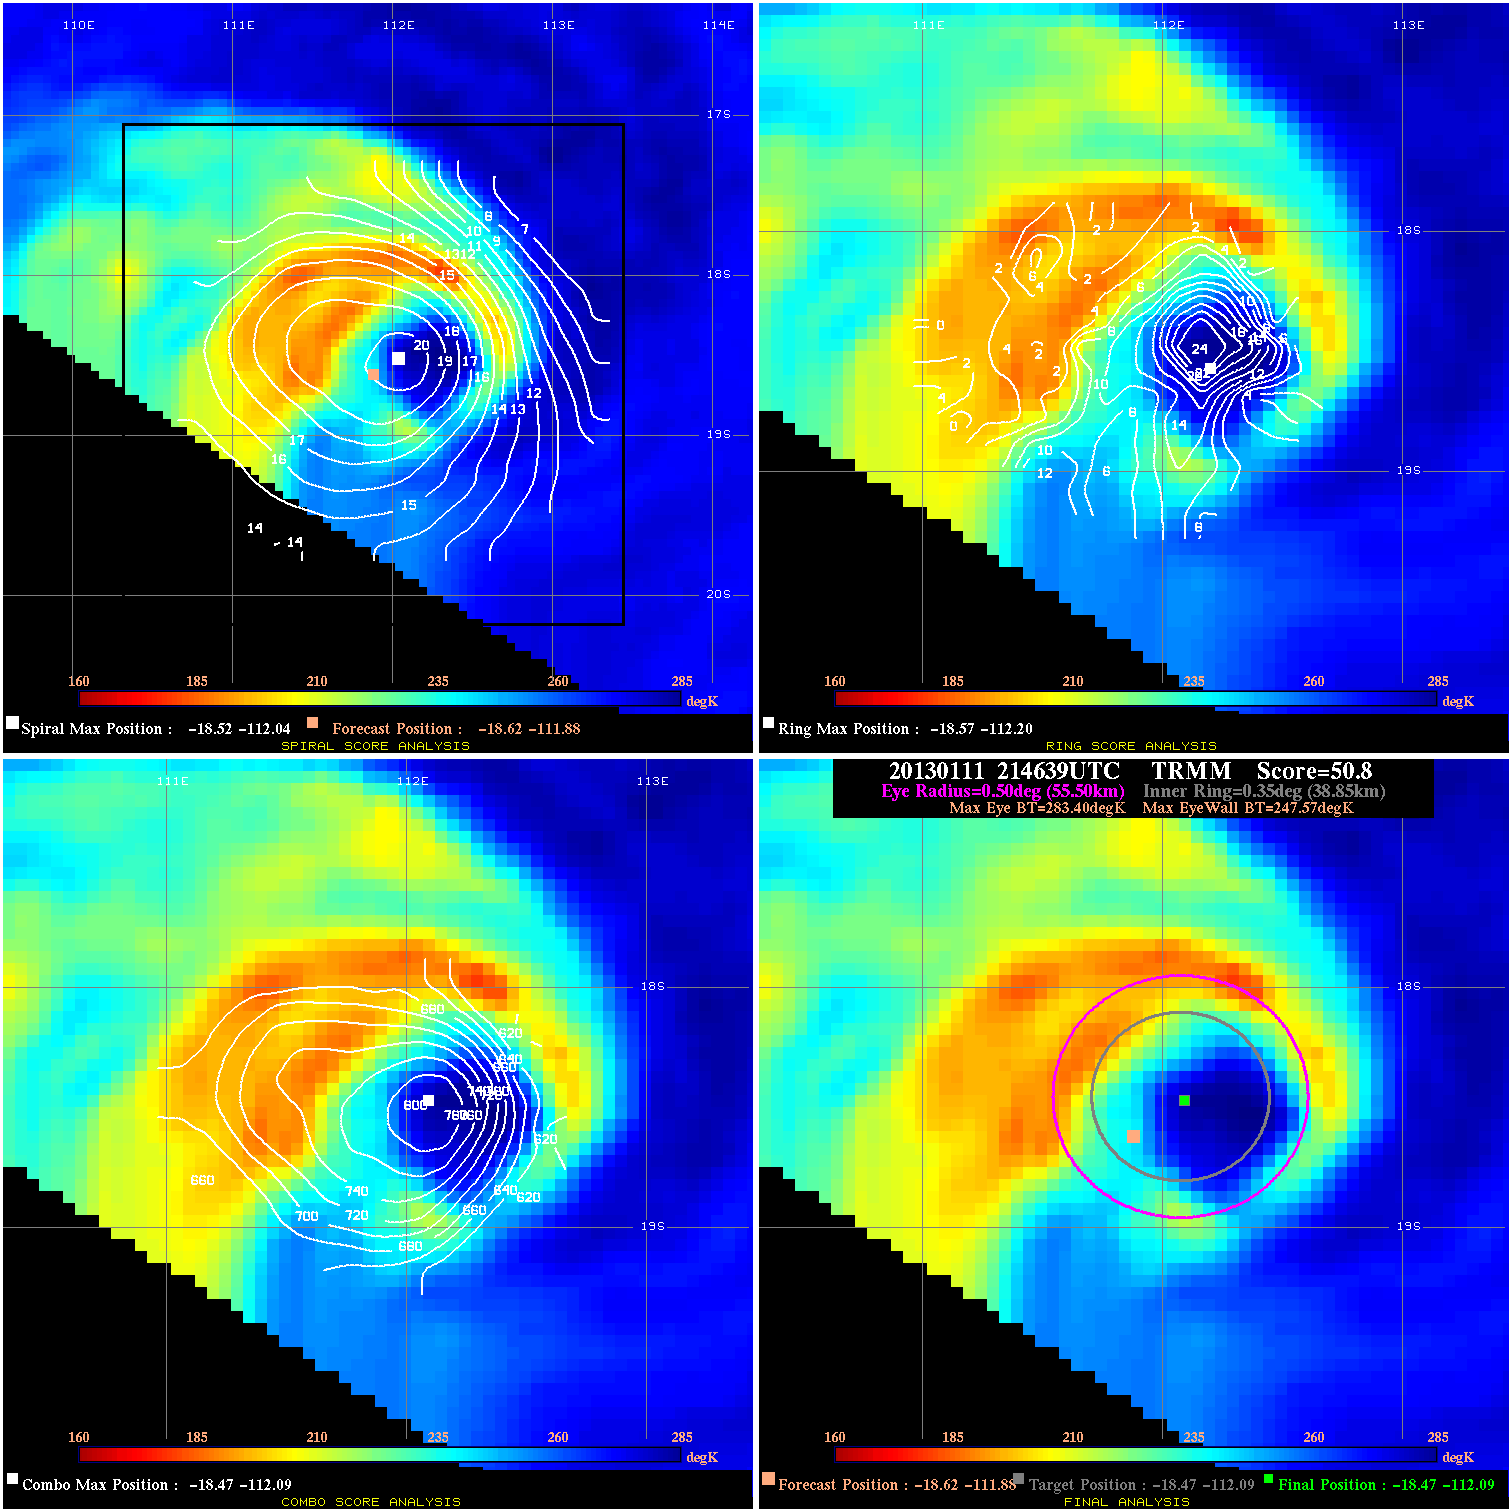
20130111 214639 50.8 >65 kts 100.0% 111.10 35.83 115.0 TRMM -18.6 -111.9 -18.5 -112.1 -18.5 -112.1 Analysis Plot
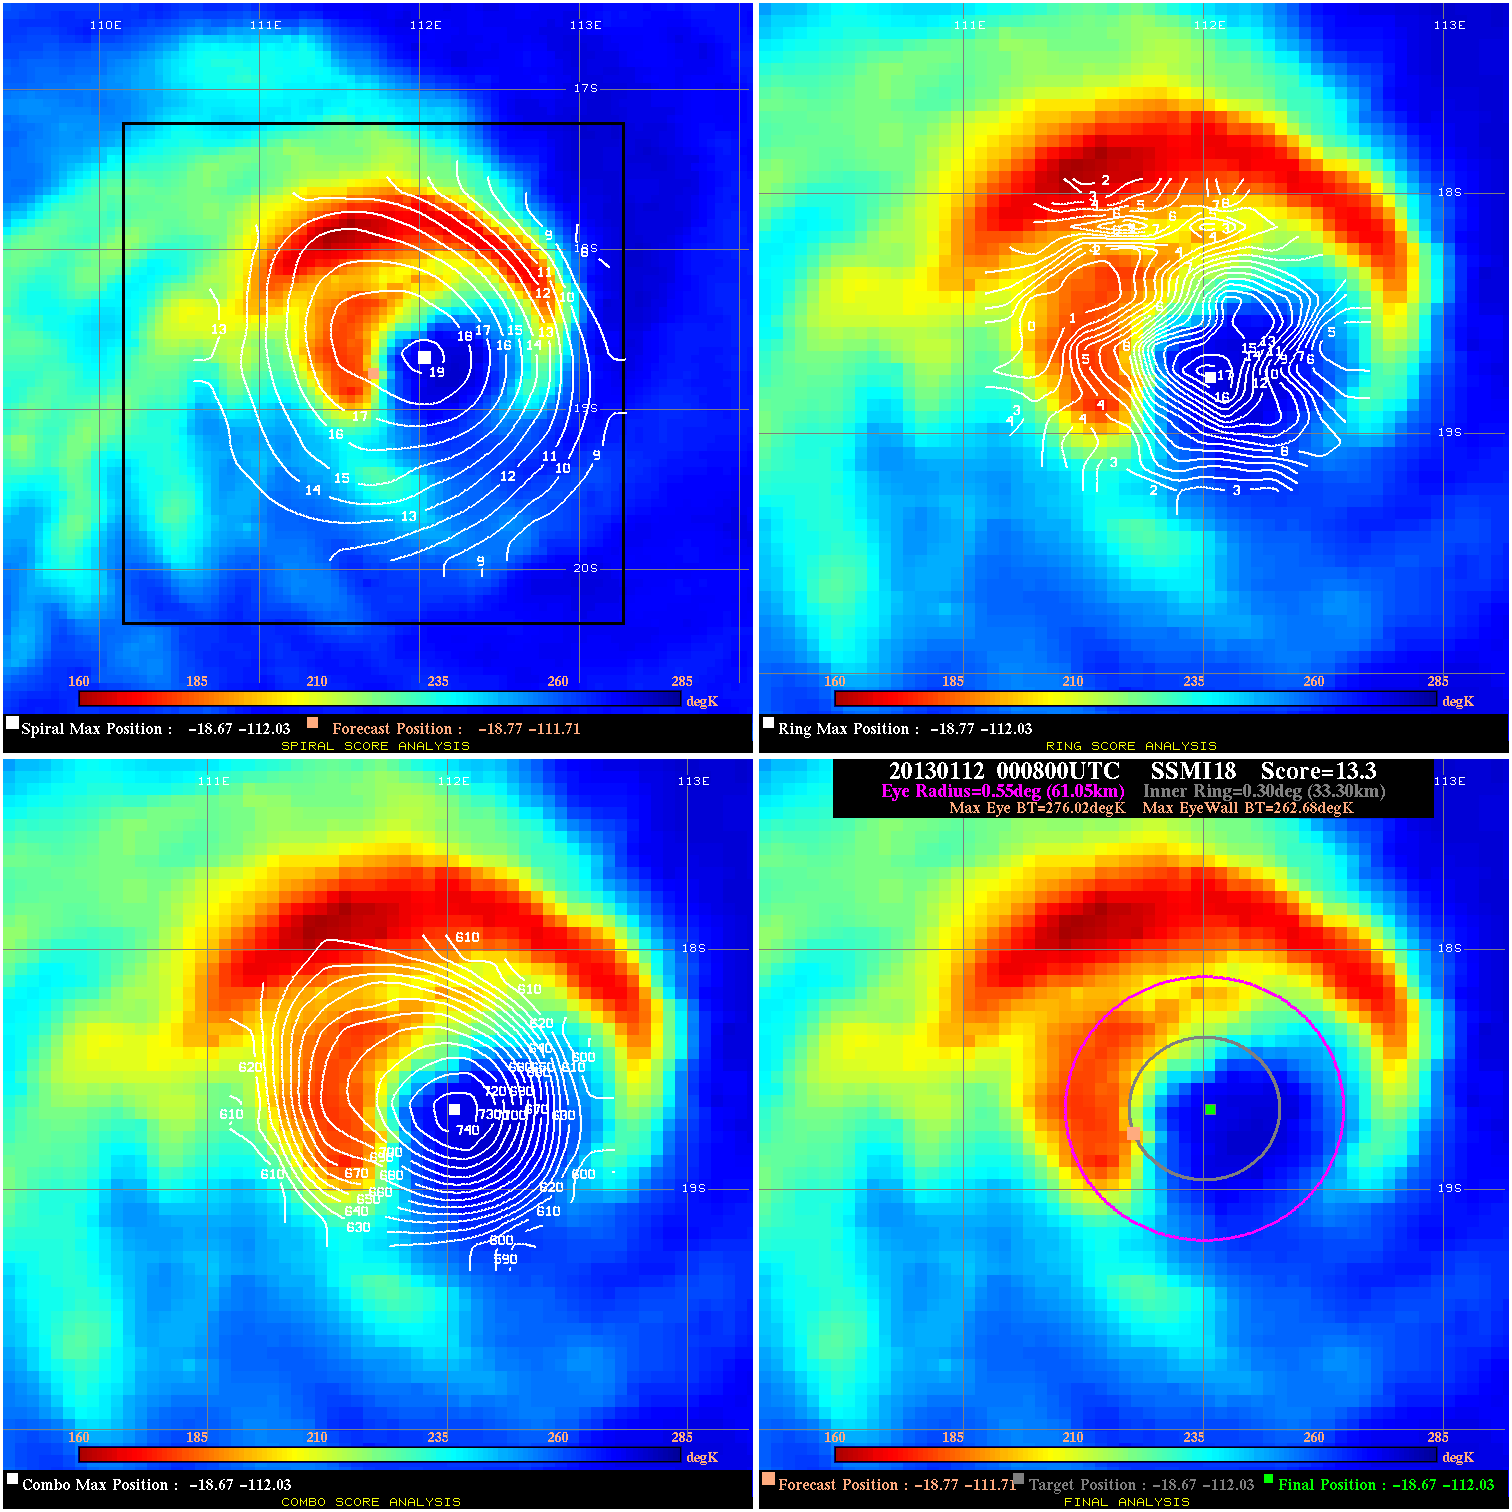
20130112 000800 13.3 N/A 54.8% 122.21 13.34 115.0 SSMI18 -18.8 -111.7 -18.7 -112.0 -18.7 -112.0 Analysis Plot
20130112 055734 16.2 N/A 100.0% 22.22 1.24 115.0 TRMM -19.1 -111.5 -19.2 -111.4 -19.2 -111.4 Analysis Plot
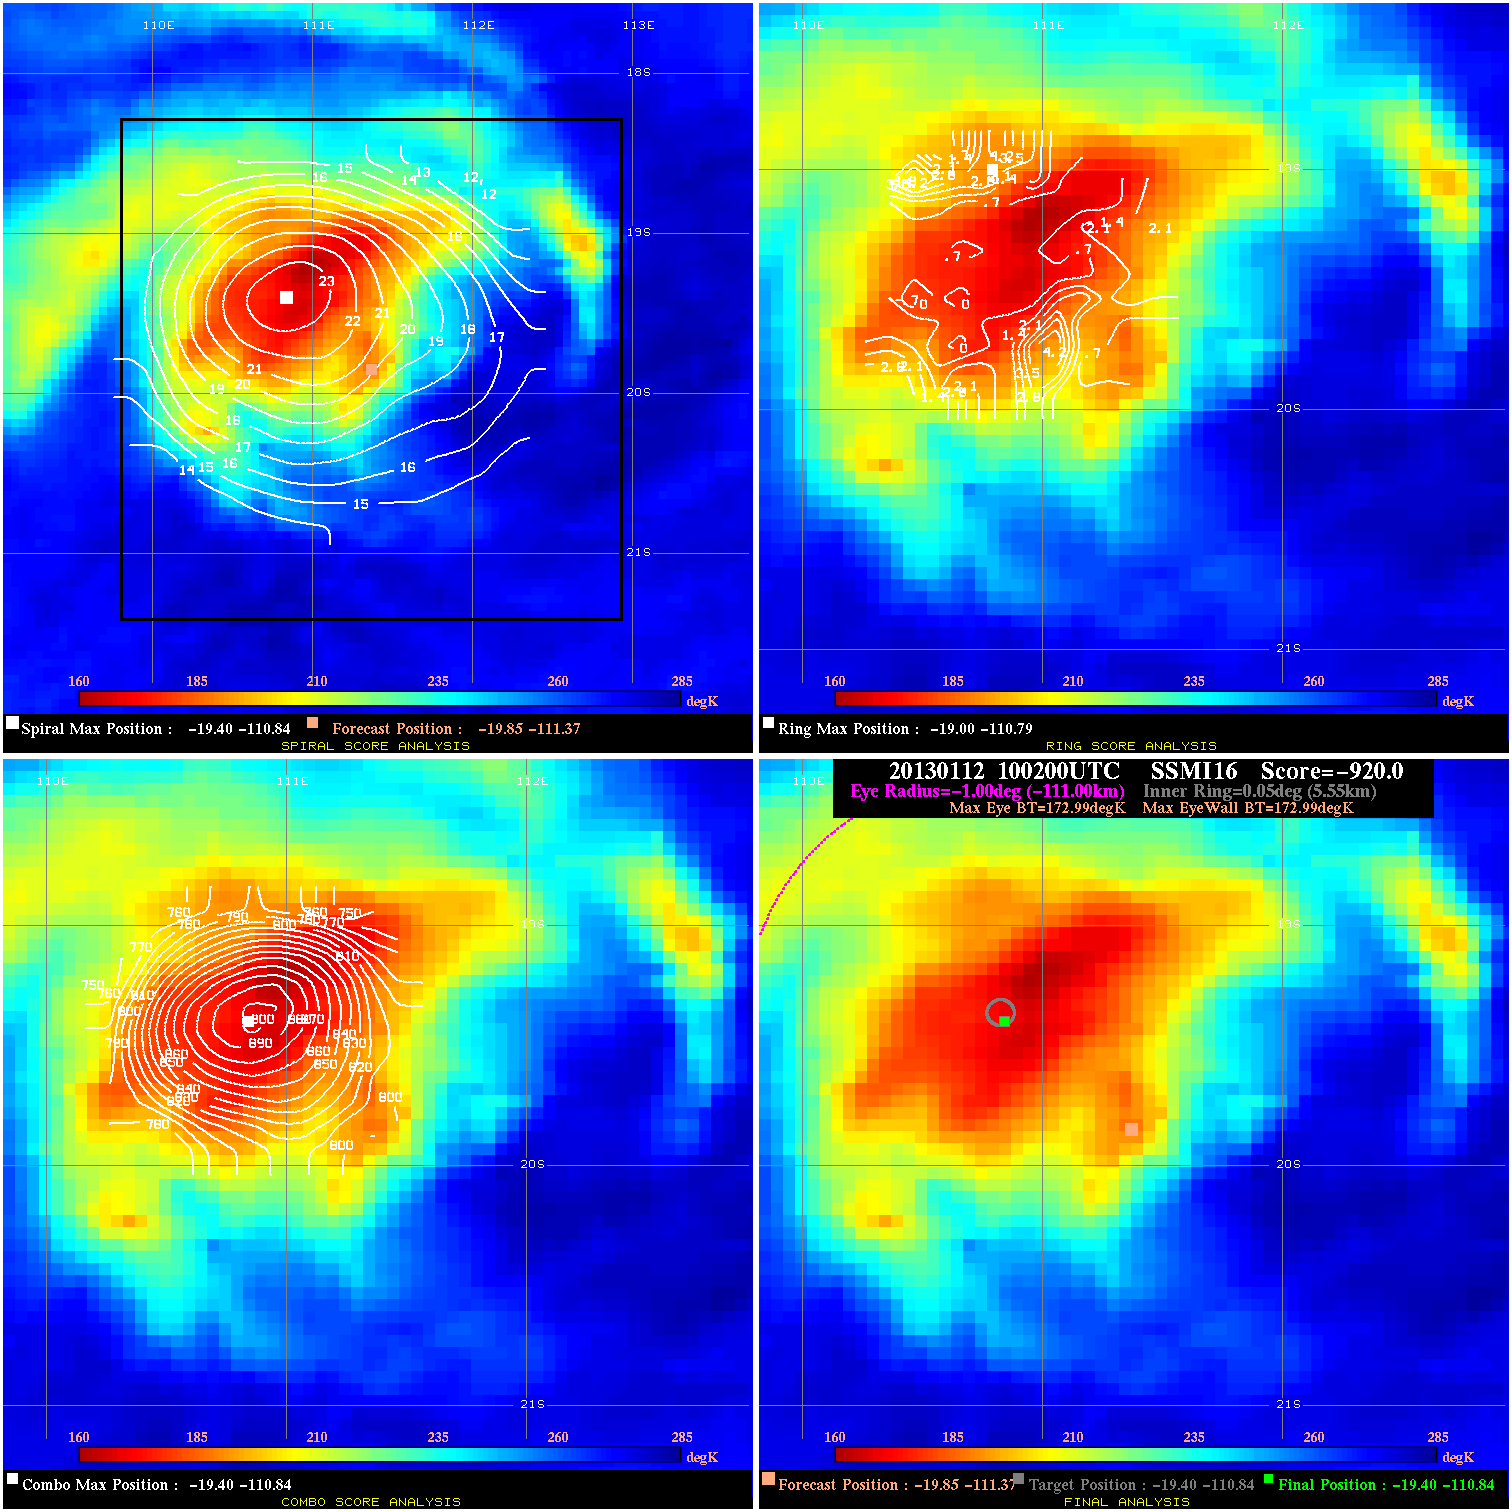
20130112 100200 N/A N/A N/A N/A N/A 110.0 SSMI16 -19.9 -111.4 -19.4 -110.8 -19.4 -110.8 Analysis Plot
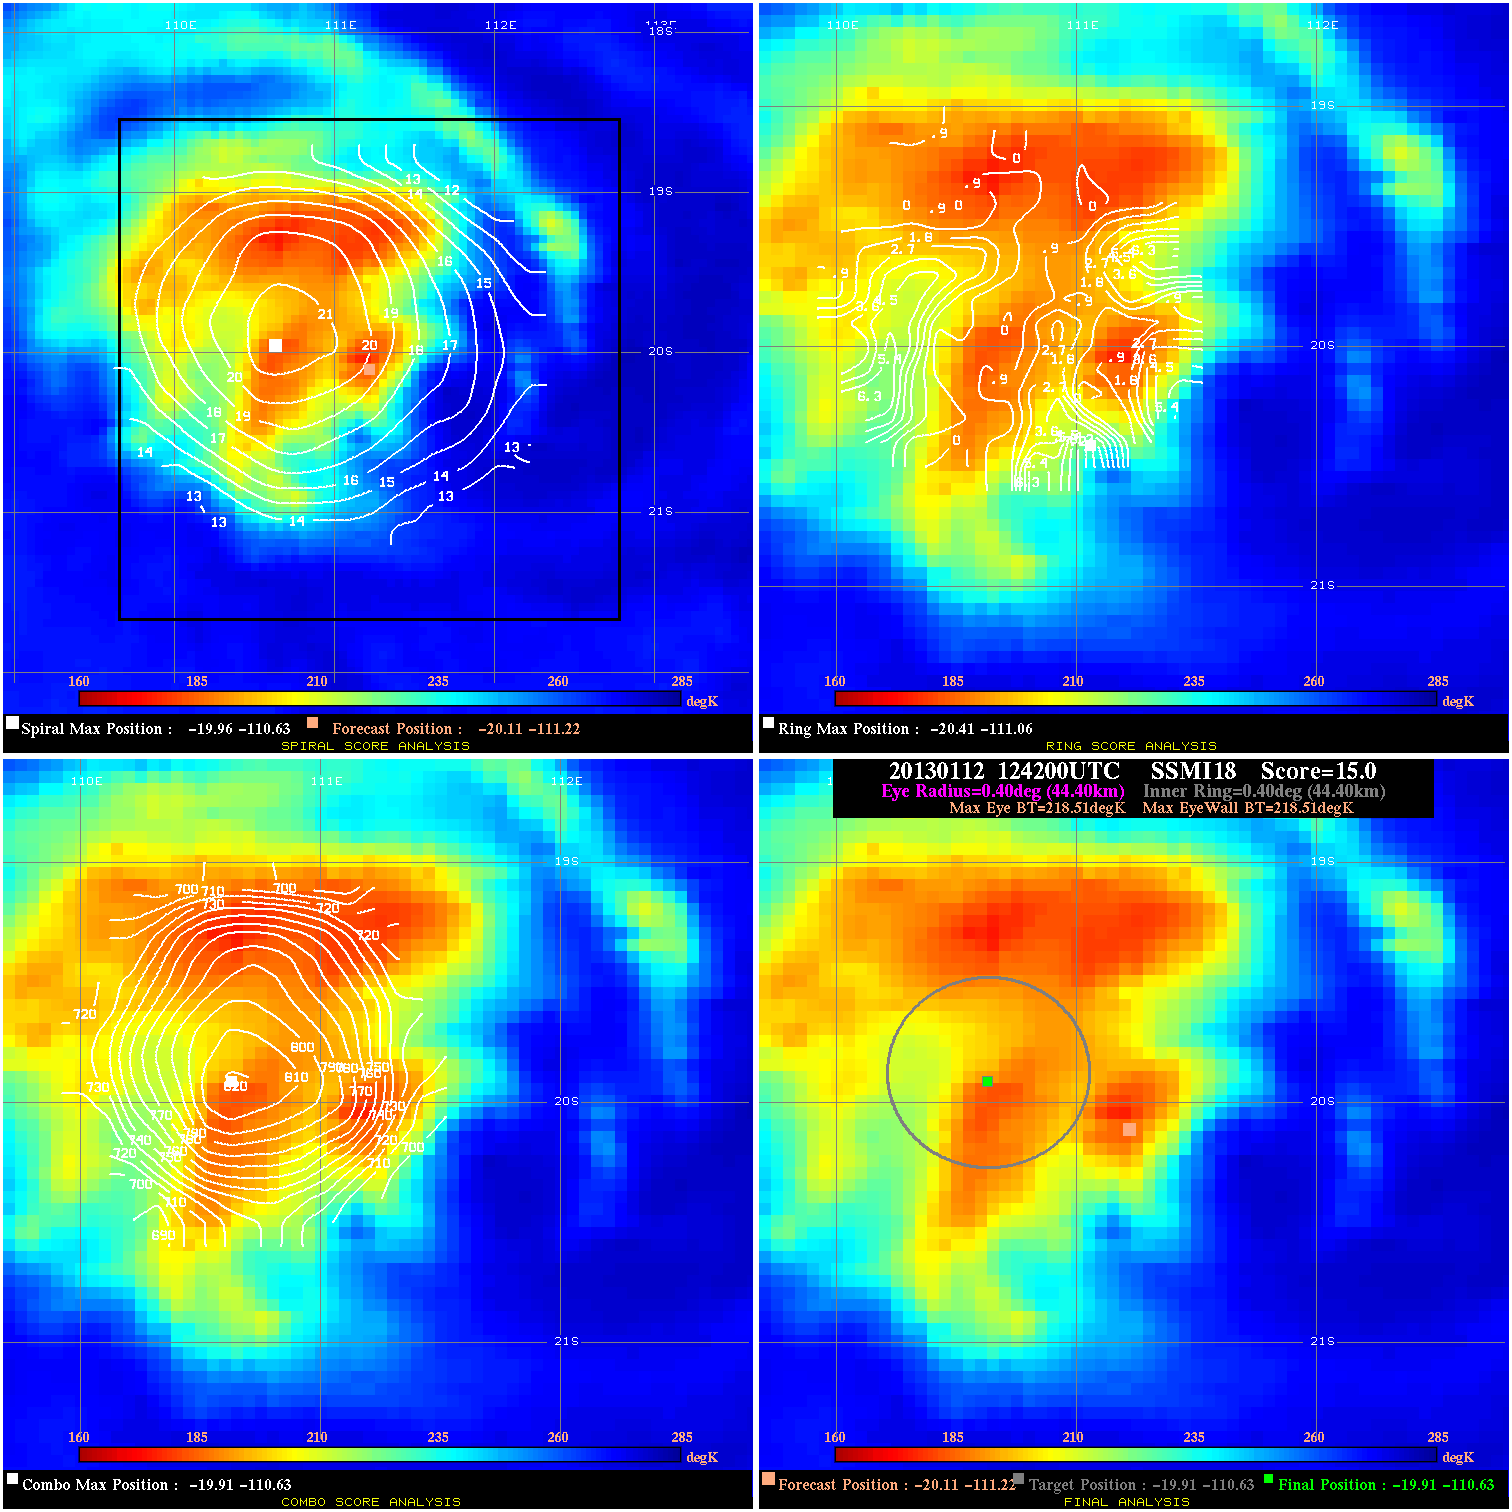
20130112 124200 N/A N/A N/A N/A N/A 110.0 SSMI18 -20.1 -111.2 -19.9 -110.6 -19.9 -110.6 Analysis Plot
20130112 222842 4.7 N/A 15.1% 166.65 4.74 90.0 TRMM -21.1 -111.4 -20.9 -111.0 -20.9 -111.0 Analysis Plot
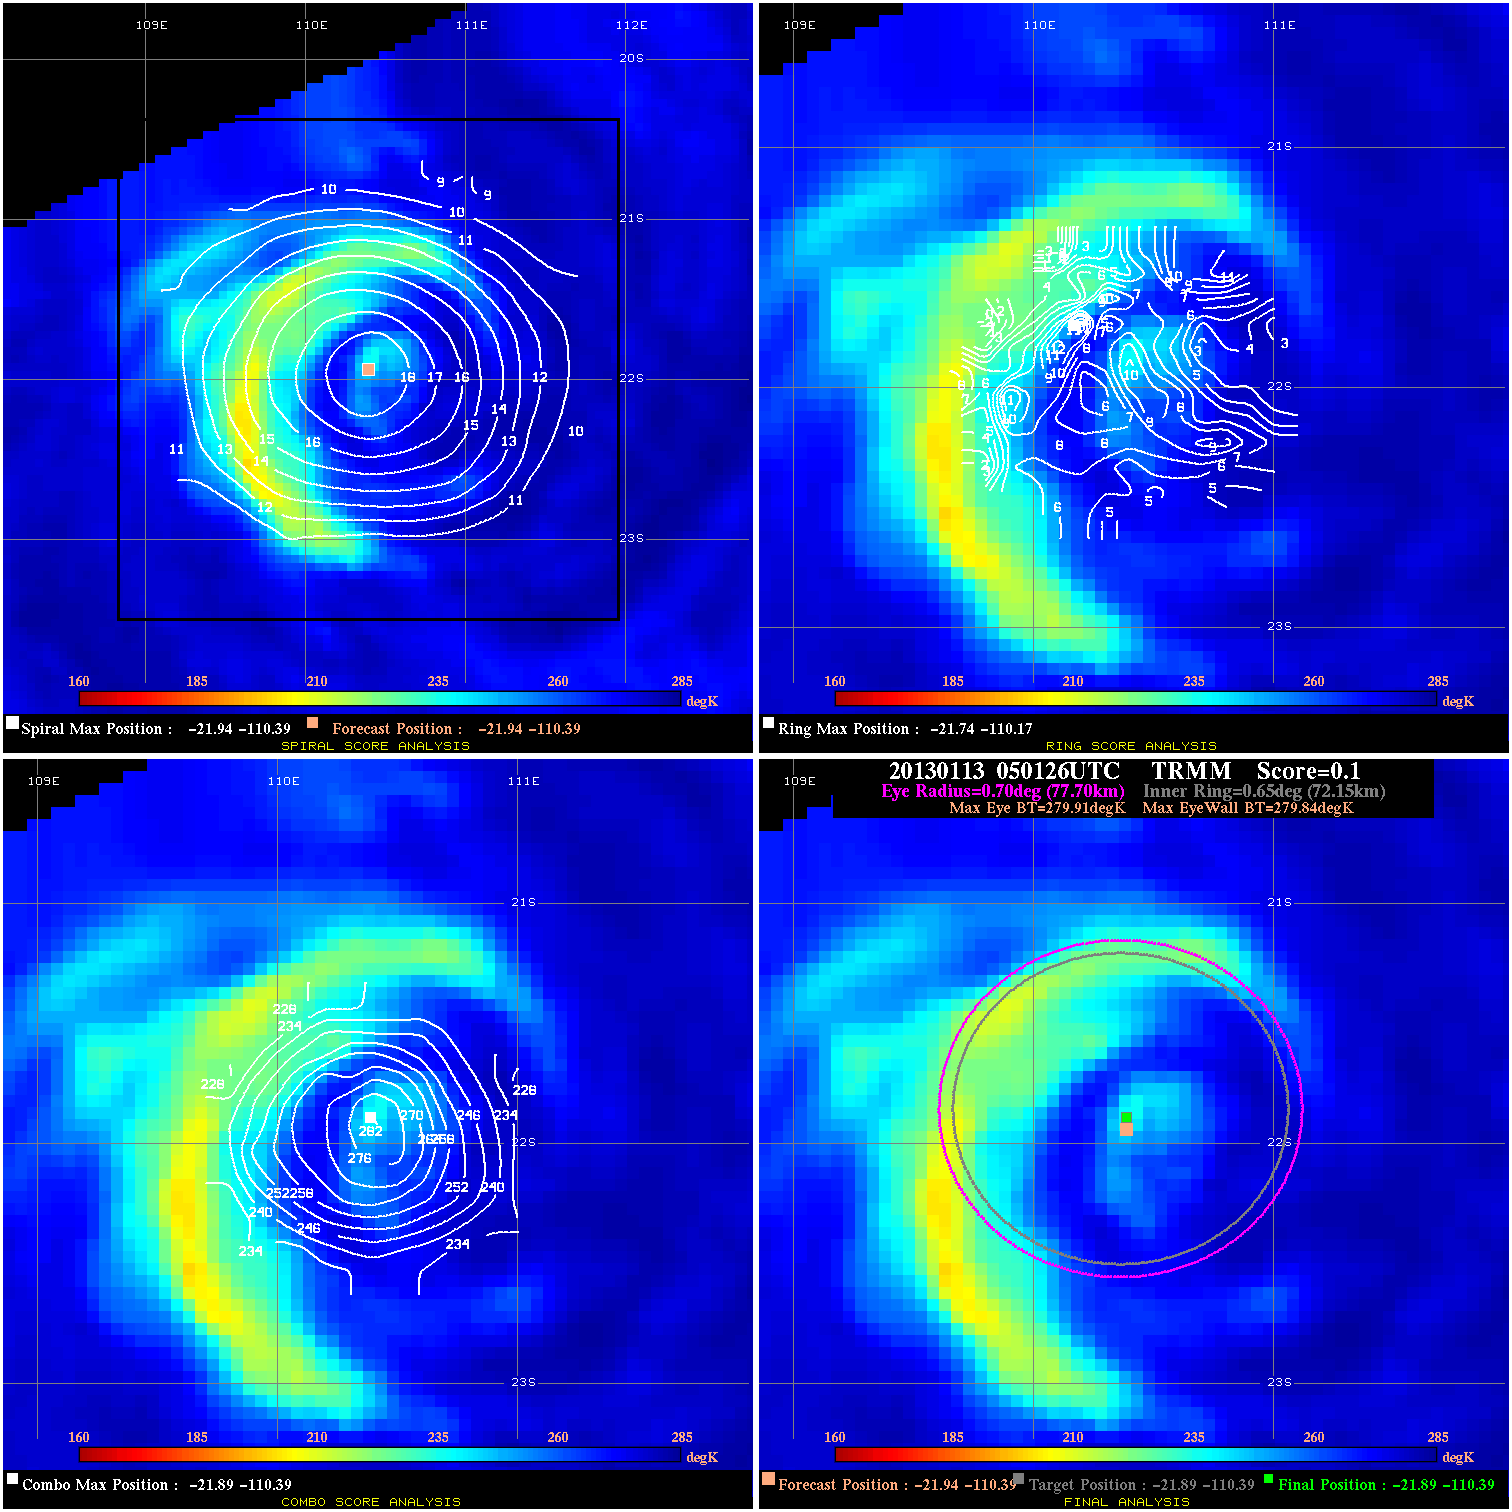
20130113 050126 0.1 N/A 39.7% 155.54 .07 80.0 TRMM -21.9 -110.4 -21.9 -110.4 -21.9 -110.4 Analysis Plot
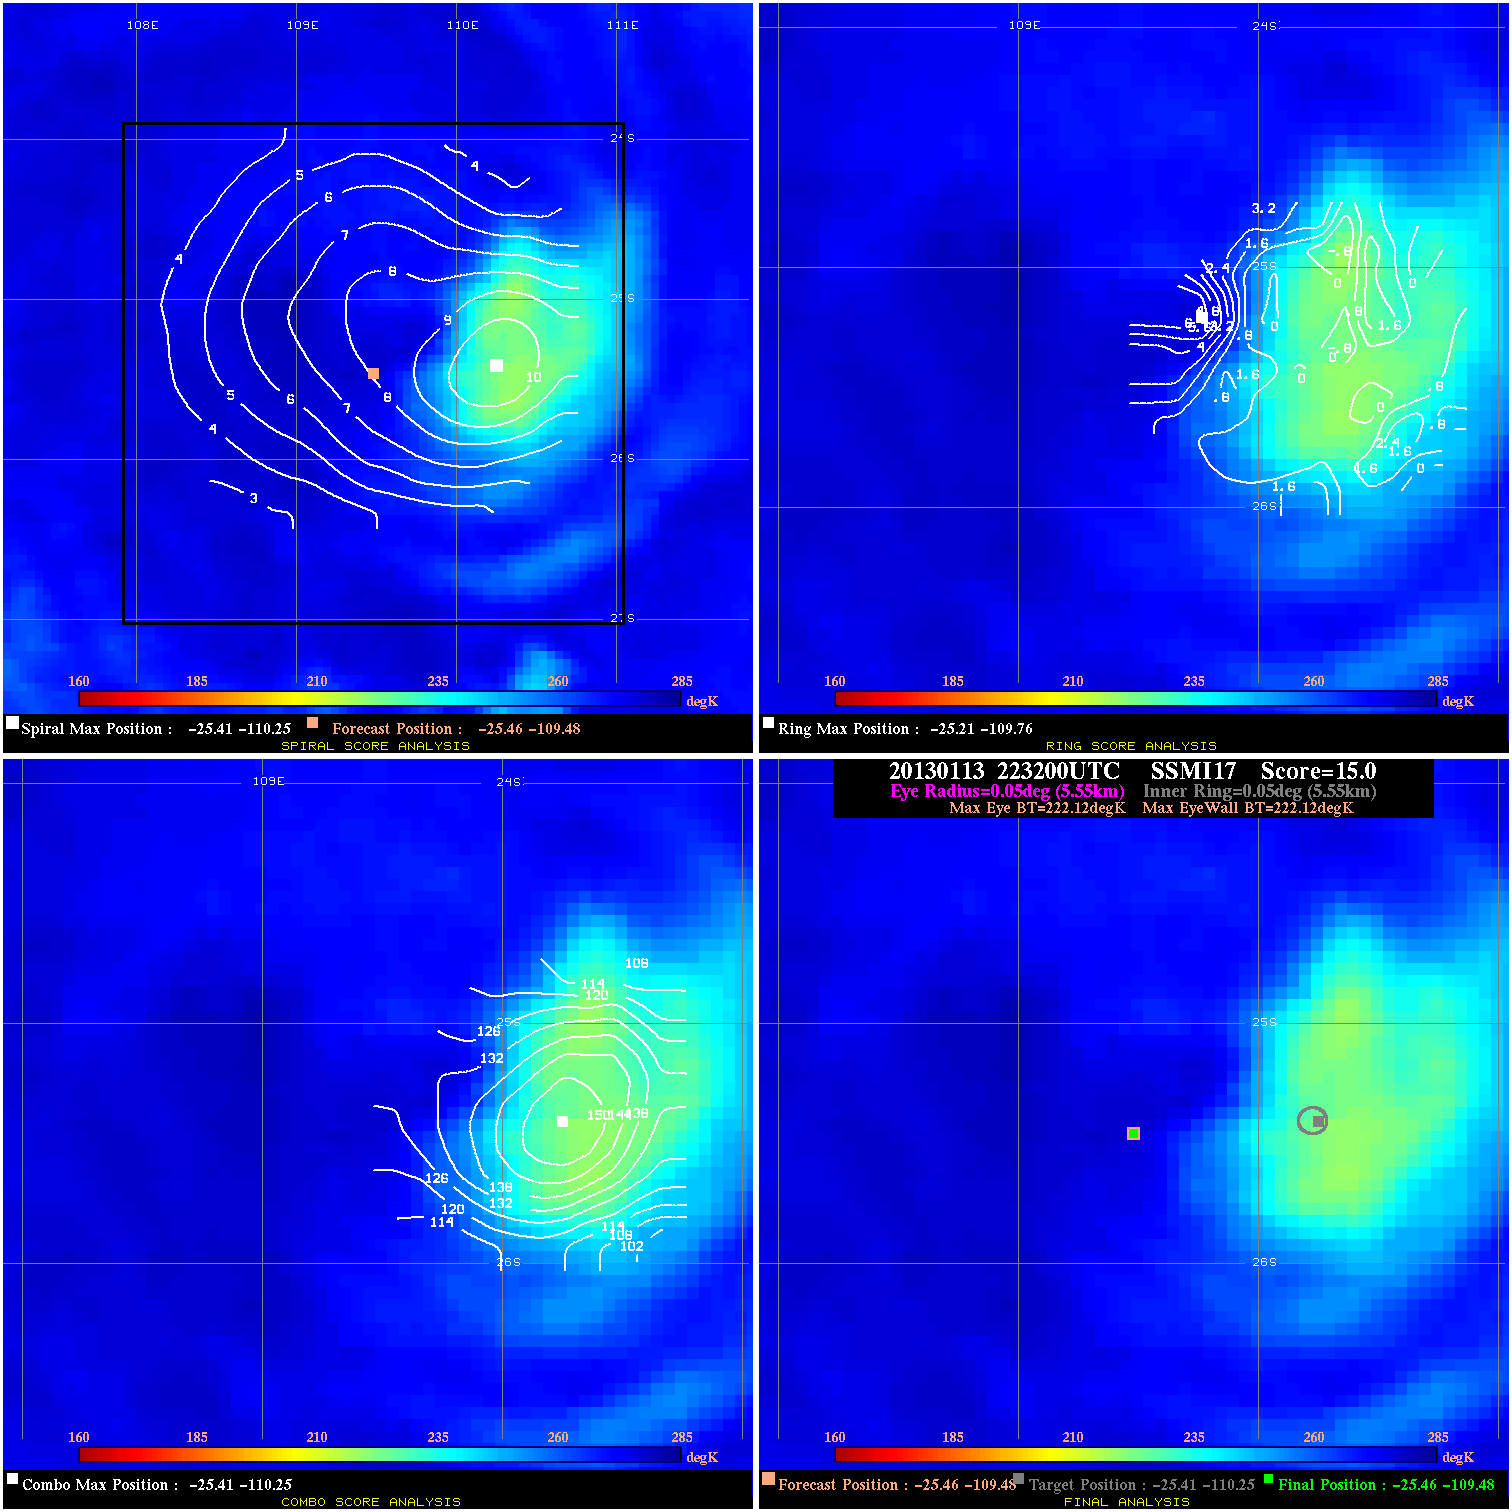
20130113 223200 N/A N/A N/A N/A N/A 75.0 SSMI17 -25.5 -109.5 -25.5 -109.5 -25.4 -110.3 Analysis Plot
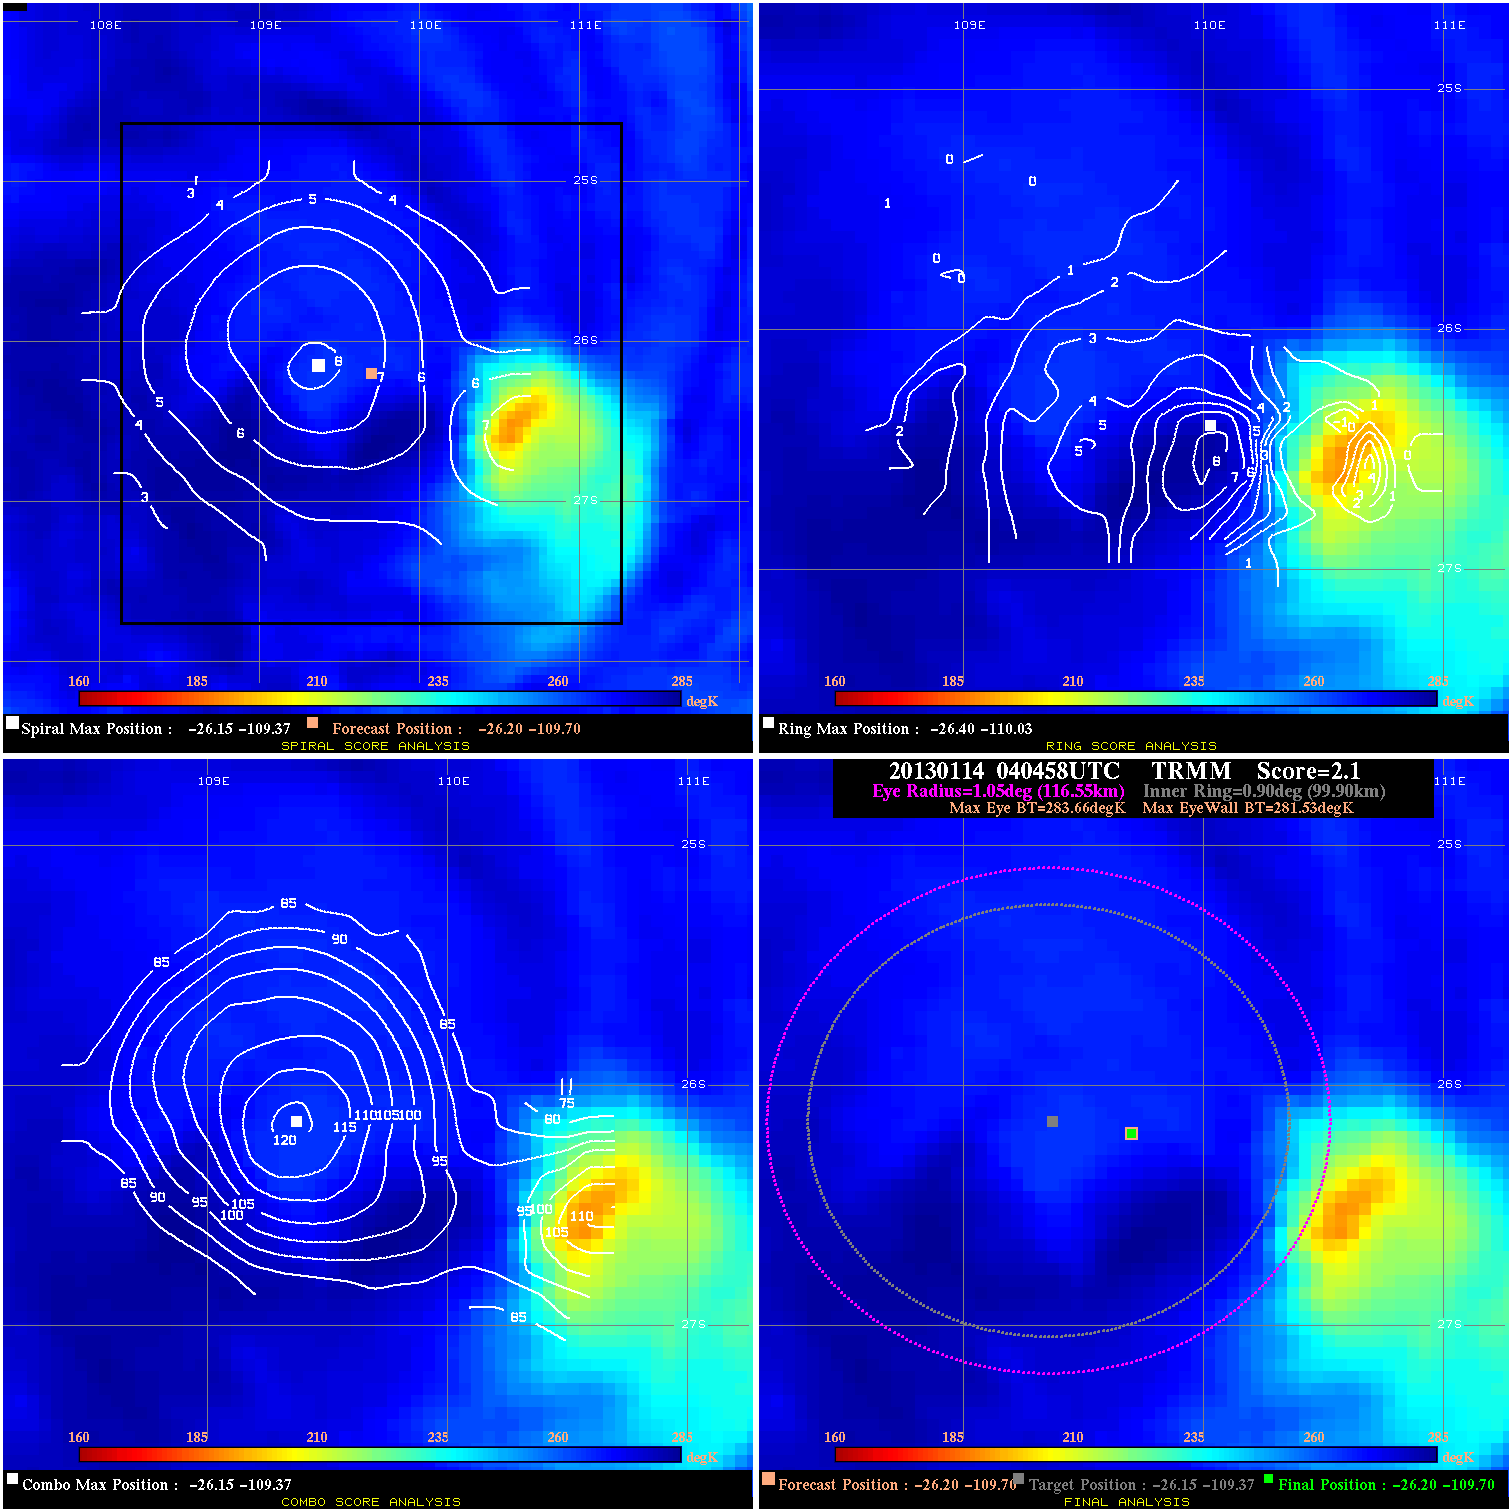
20130114 040458 2.1 N/A 11.0% 233.31 2.13 55.0 TRMM -26.2 -109.7 -26.2 -109.7 -26.1 -109.4 Analysis Plot
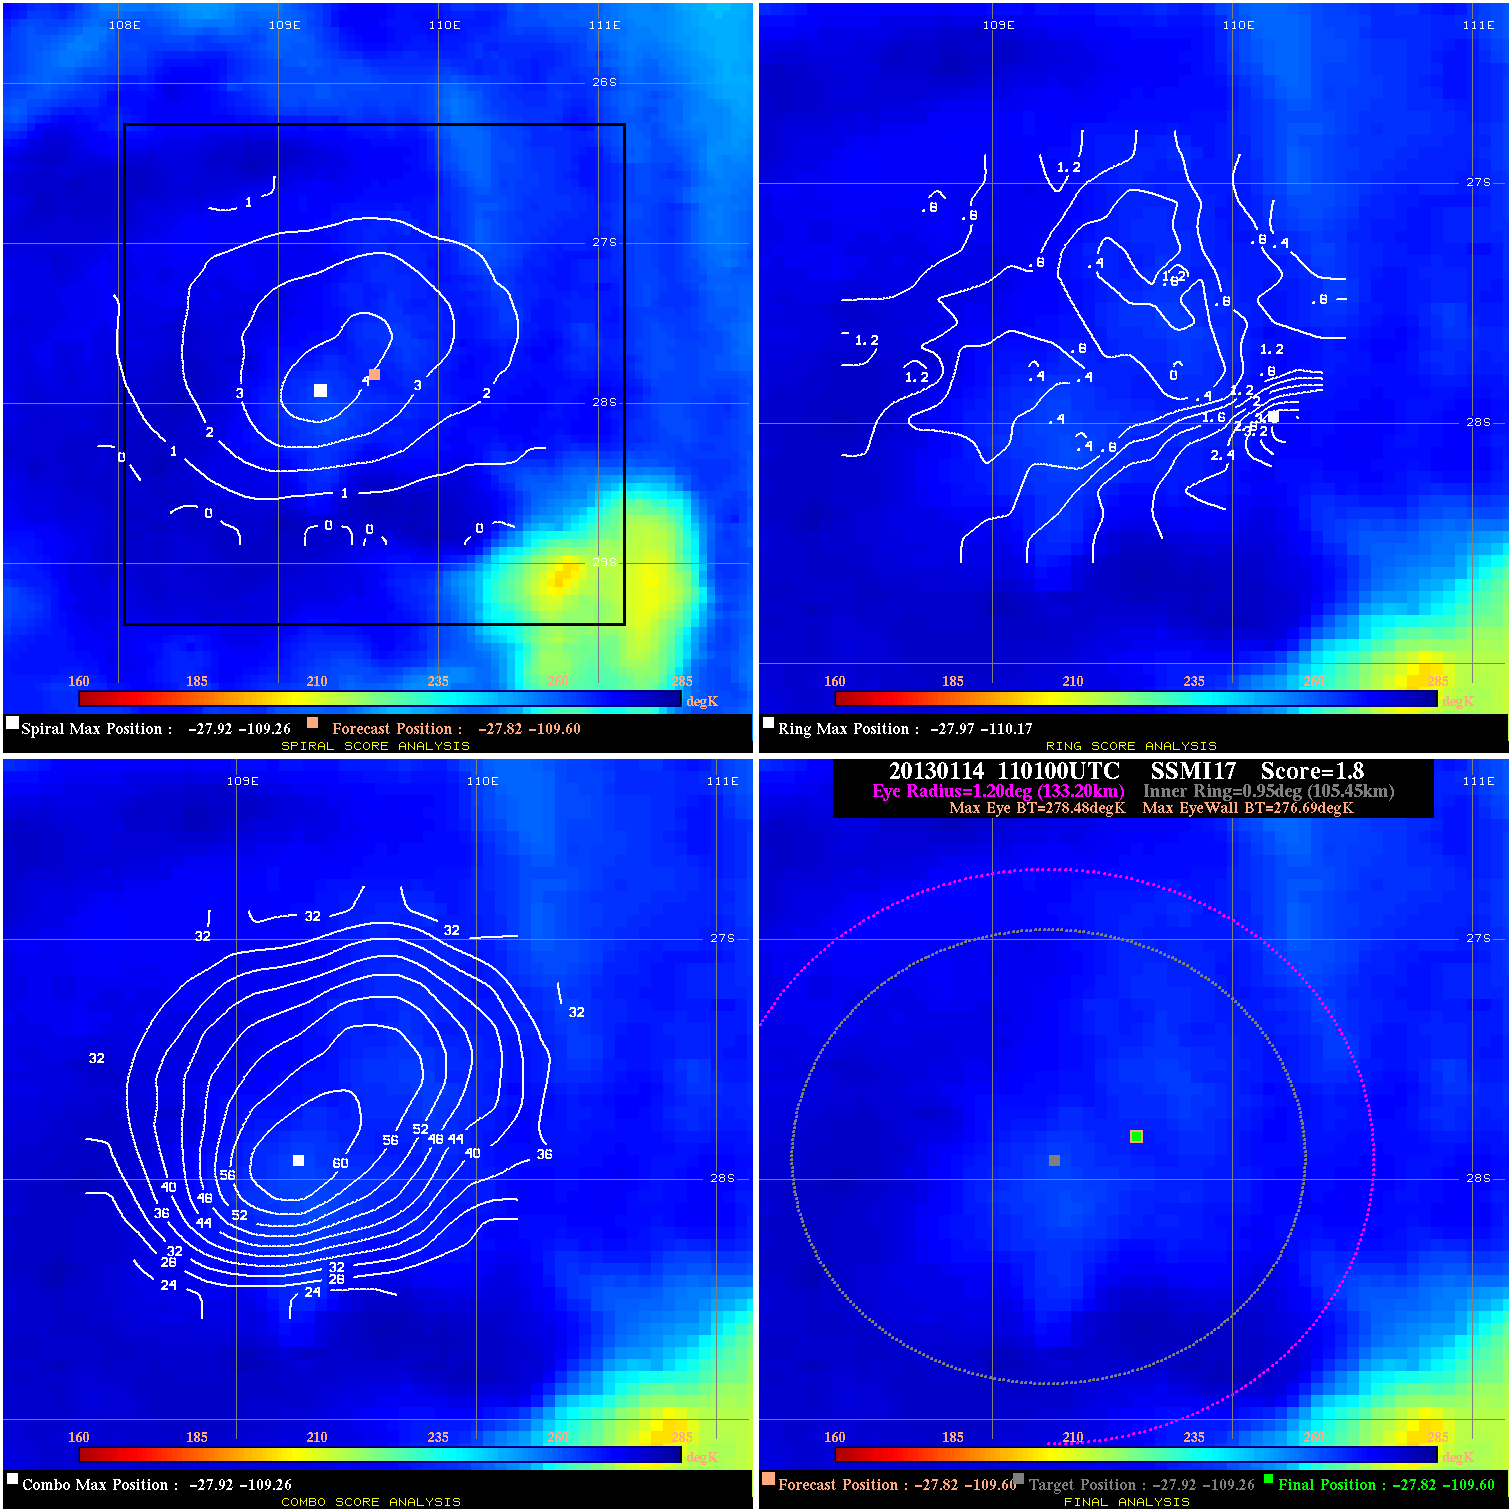
20130114 110100 1.8 N/A N/A 266.64 1.79 55.0 SSMI17 -27.8 -109.6 -27.8 -109.6 -27.9 -109.3 Analysis Plot
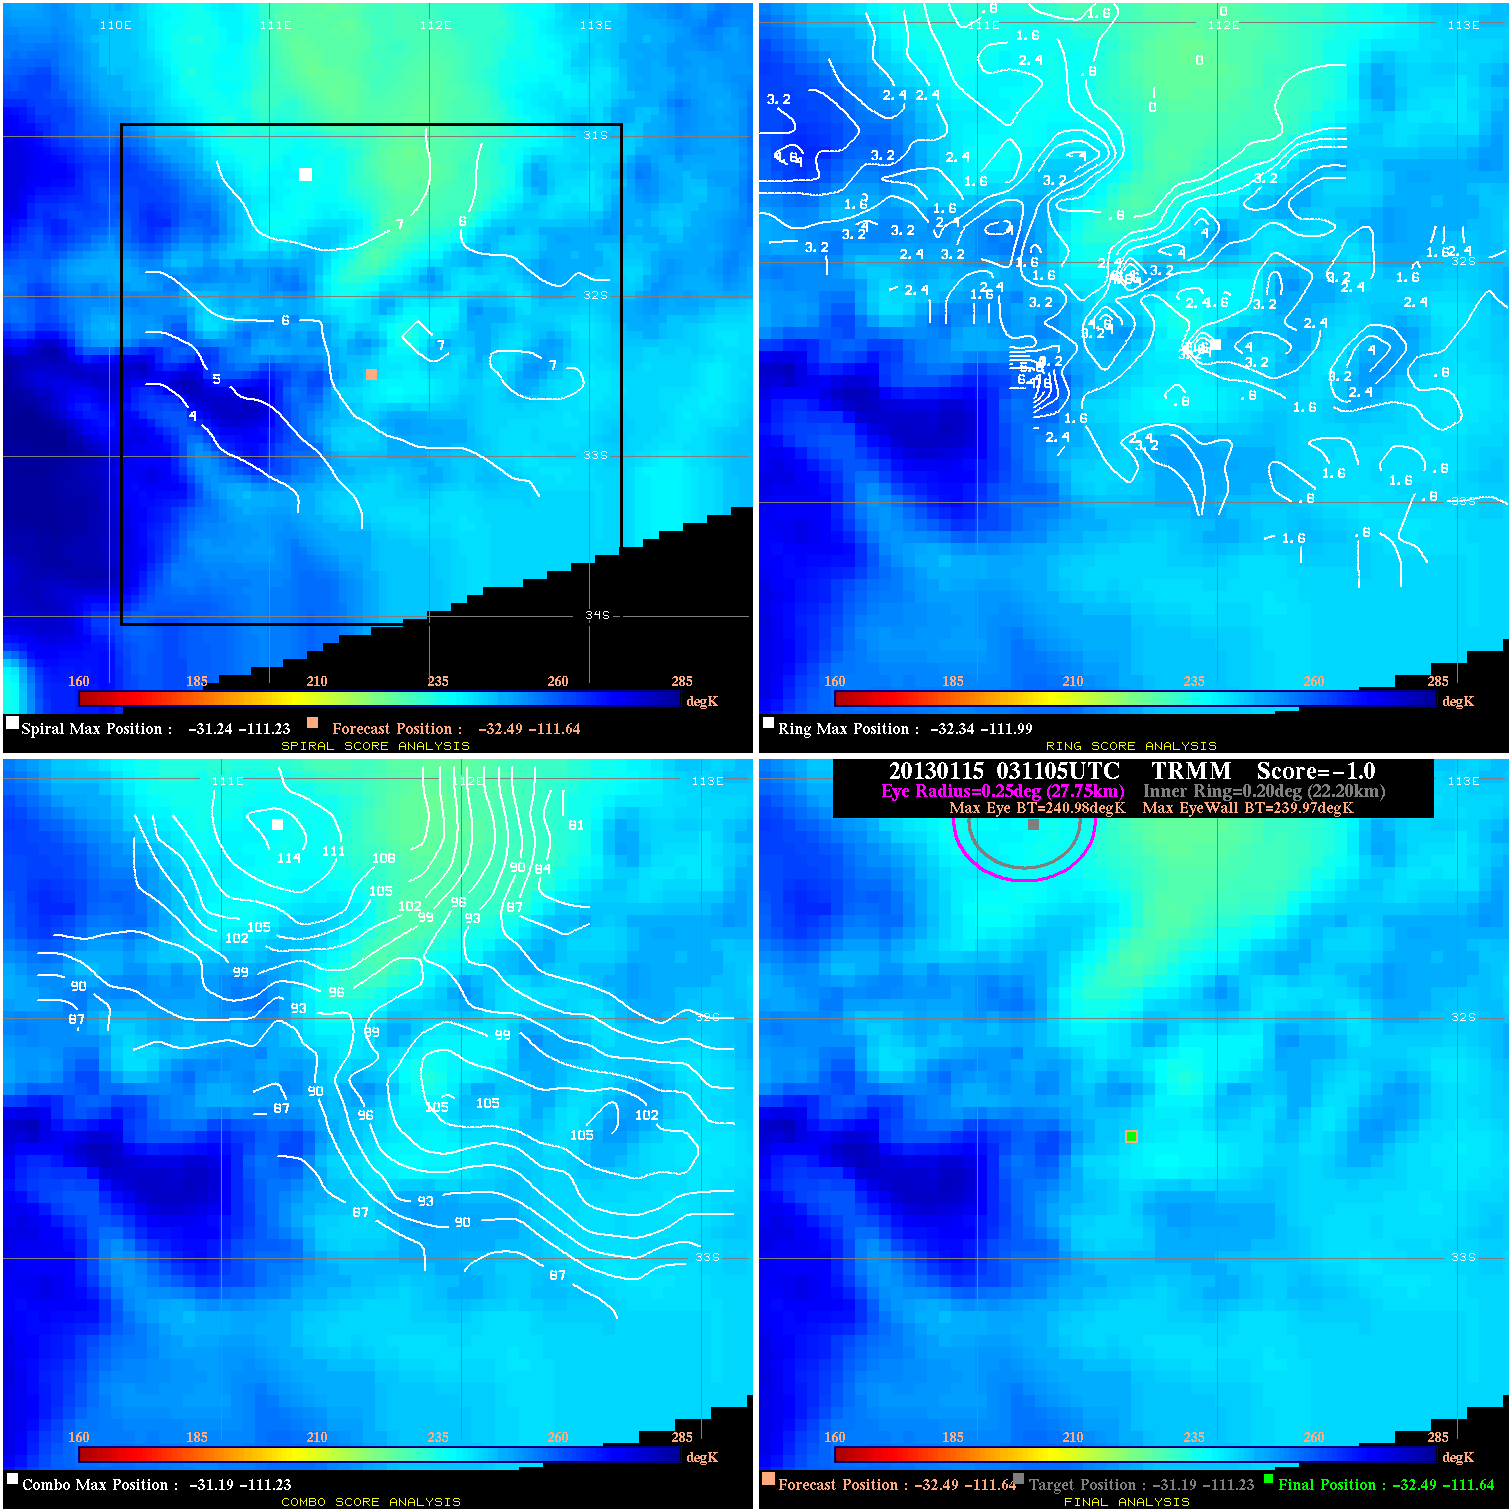
20130115 031105 -1.0 N/A 19.2% 55.55 1.01 35.0 TRMM -32.5 -111.6 -32.5 -111.6 -31.2 -111.2 Analysis Plot
|
|
Legend: - Date/Time are determined from PMW imagery at Forecast (initial guess) Lat/Lon position. - Positive/Negative Latitude = North/South Hemisphere; Longitude = Western/Eastern Hemisphere. - "Ring Diam" value indicates the estimated surface eyewall diameter in km (the MI eyewall edge diameter minus 10 km). - "Ring Pct" is the percentage of the "ring" (eyewall inner boundary) that is 1) colder than the "hot spot" (warmest eye pixel) in the eye by 20K, or 2) the percentage that is a) colder than 232K and b) colder than the "hot spot" by 10K, whichever is greater. - Values are red if Ring % <= 65, yellow/brown if Ring % <= 85 and green if Ring % > 85. - "Tb diff" is the difference between the "hot spot" (warmest eye pixel) and the warmest pixel on the eyewall. - Intensity score are listed as negative, and not used, when the JTWC or NHC estimated Vmax is <50 kts in order to rule out weak but highly symmetric TCs. - Error messages in intensity scores: -920 is used when the hottest pixel in the eye is <200K, to prevent false positives; -909 is a failure to process (bad input data). |