Tropical Storm 17S
|
Passive Microwave (PMW) Intensity Information Advanced Dvorak Technique (ADT) Version 8.1.4 (experimental) |
Overpass Inten Ring Ring Wind Forecast Final Target
Date Time Score Meaning Pct Diam BTdiff Est Sat Lat Lon Lat Lon Lat Lon
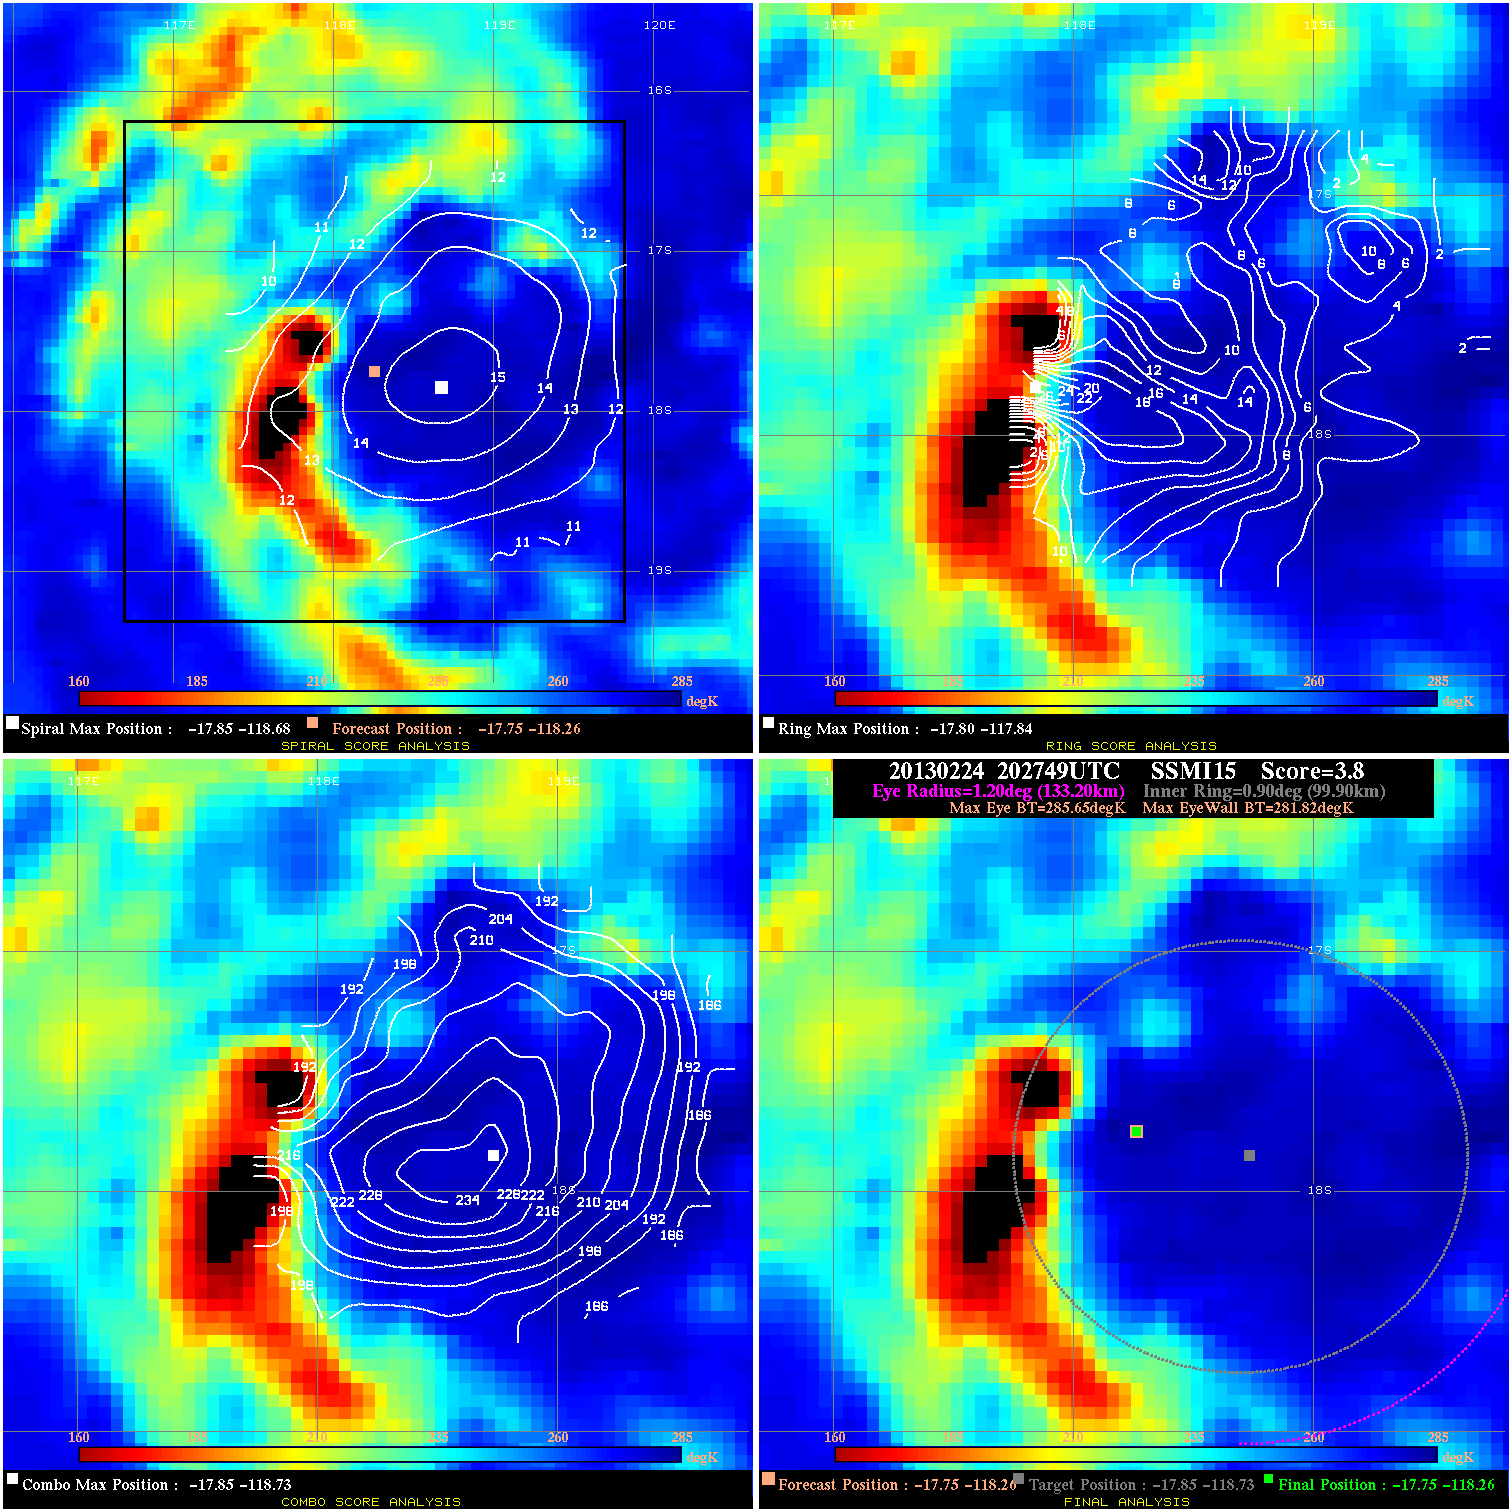
20130224 202749 3.8 N/A 31.5% 266.64 3.83 60.0 SSMI15 -17.8 -118.3 -17.8 -118.3 -17.9 -118.7 Analysis Plot
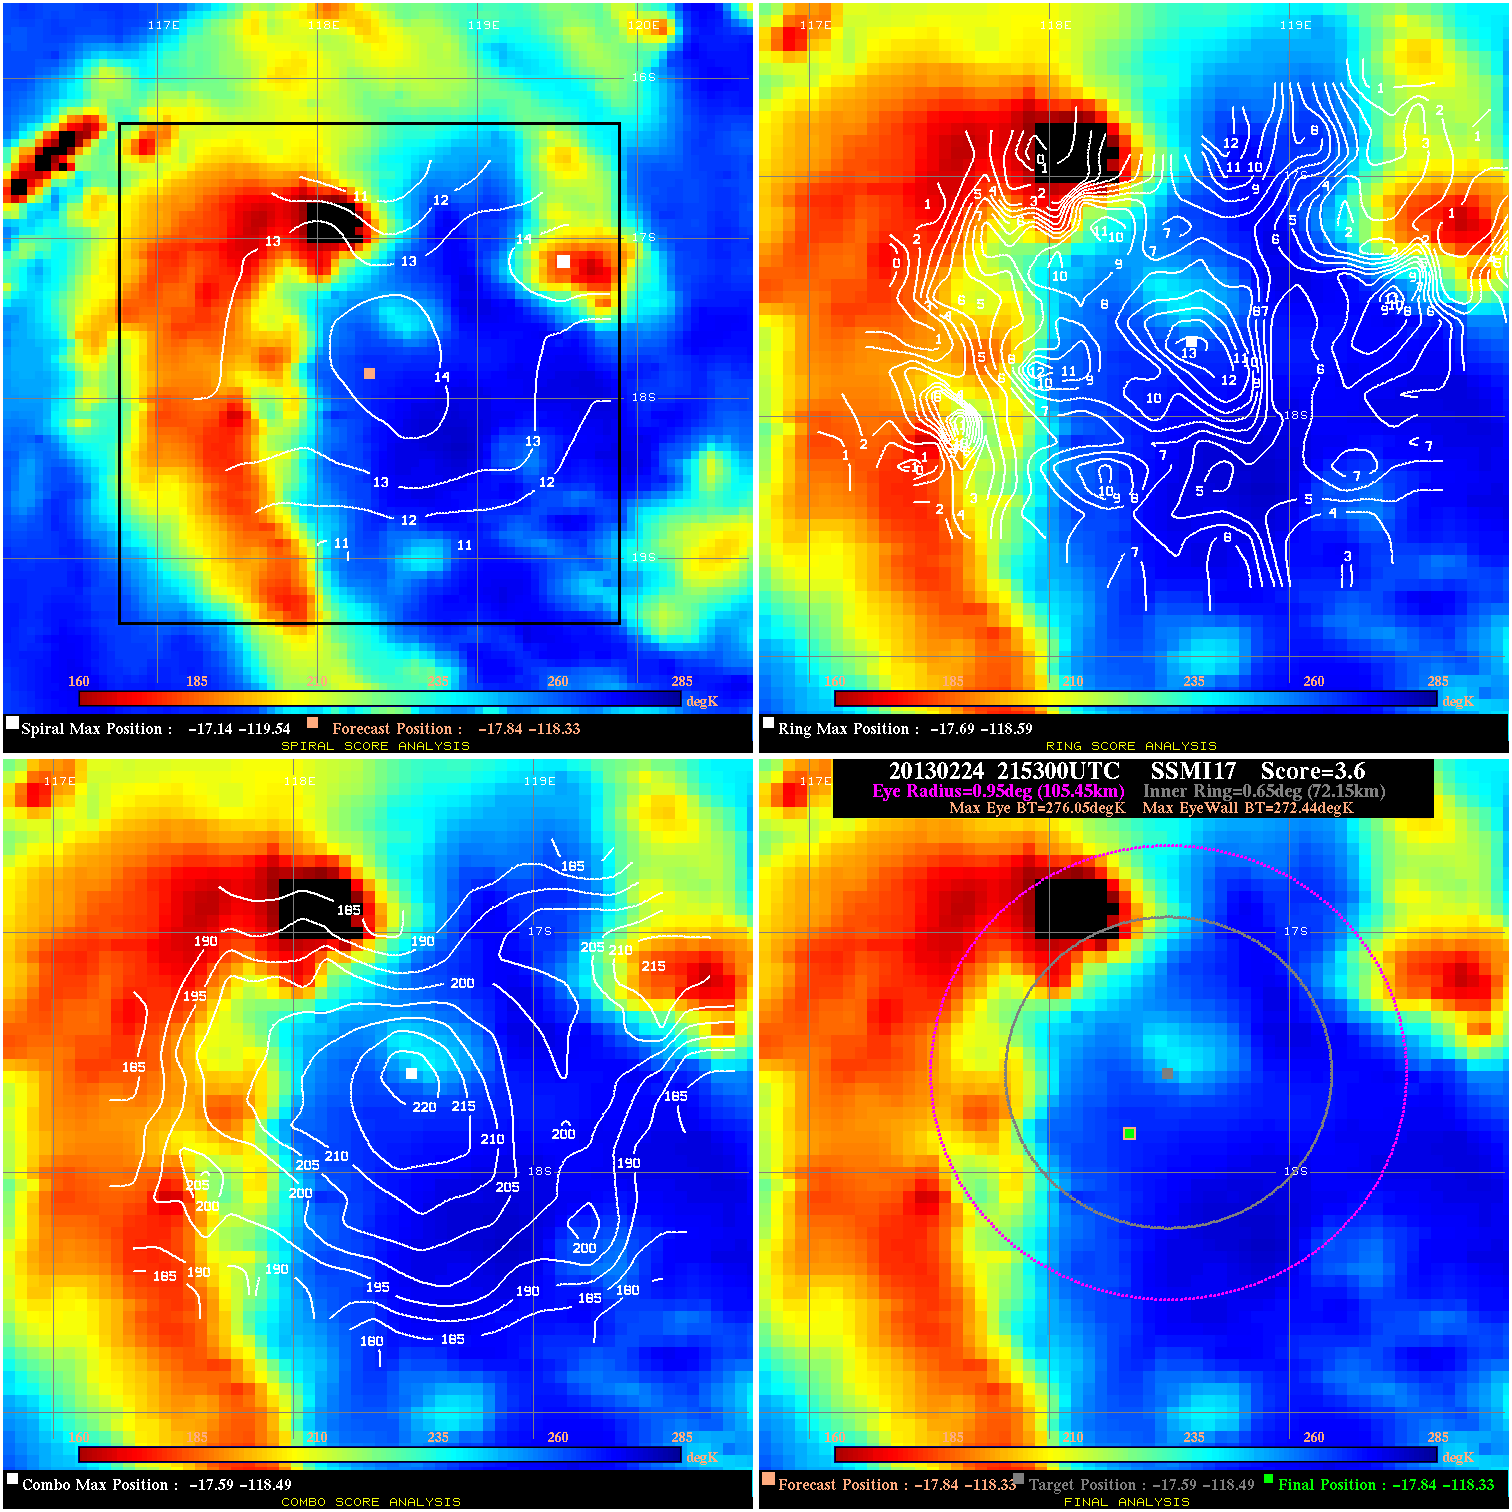
20130224 215300 3.6 N/A 43.8% 211.09 3.61 60.0 SSMI17 -17.8 -118.3 -17.8 -118.3 -17.6 -118.5 Analysis Plot
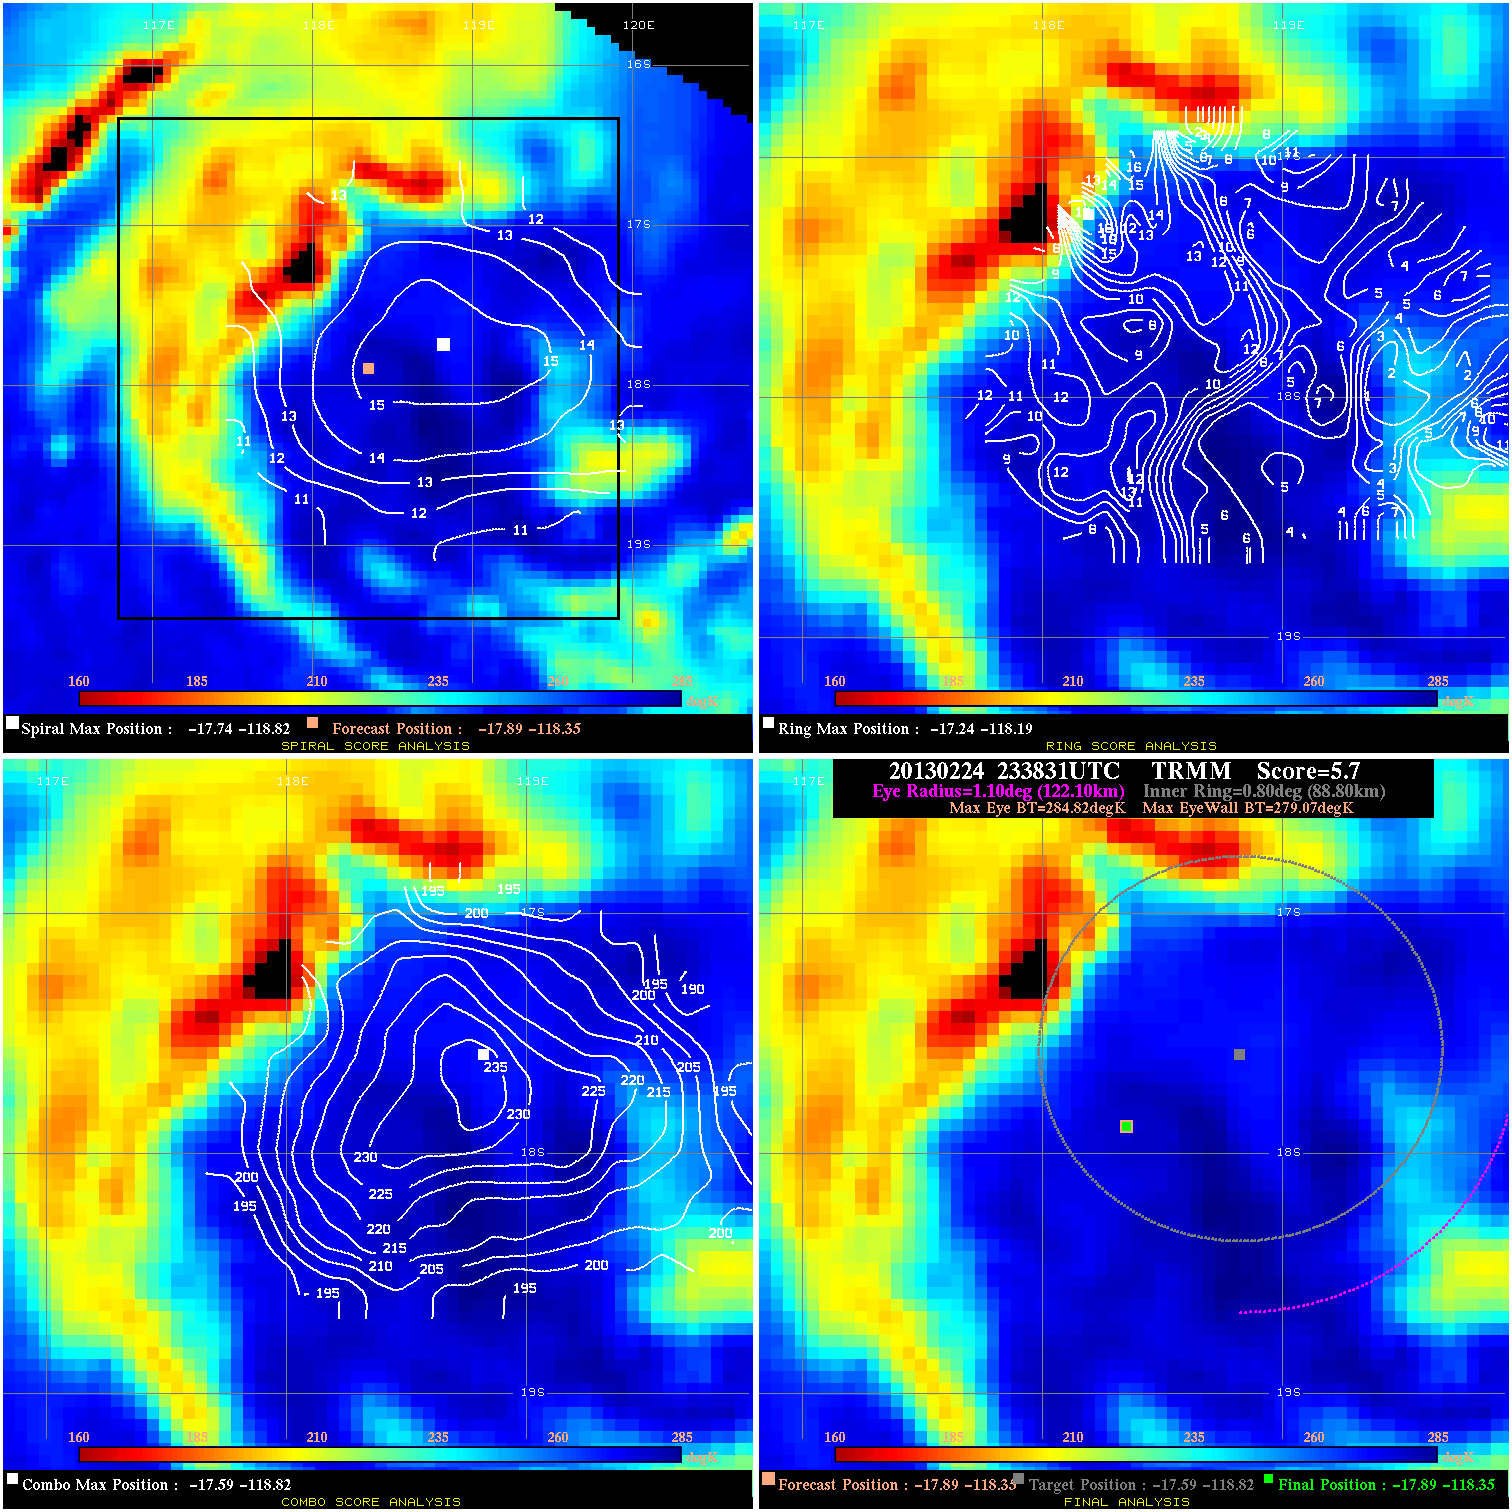
20130224 233831 5.7 N/A 30.1% 244.42 5.75 60.0 TRMM -17.9 -118.3 -17.9 -118.3 -17.6 -118.8 Analysis Plot
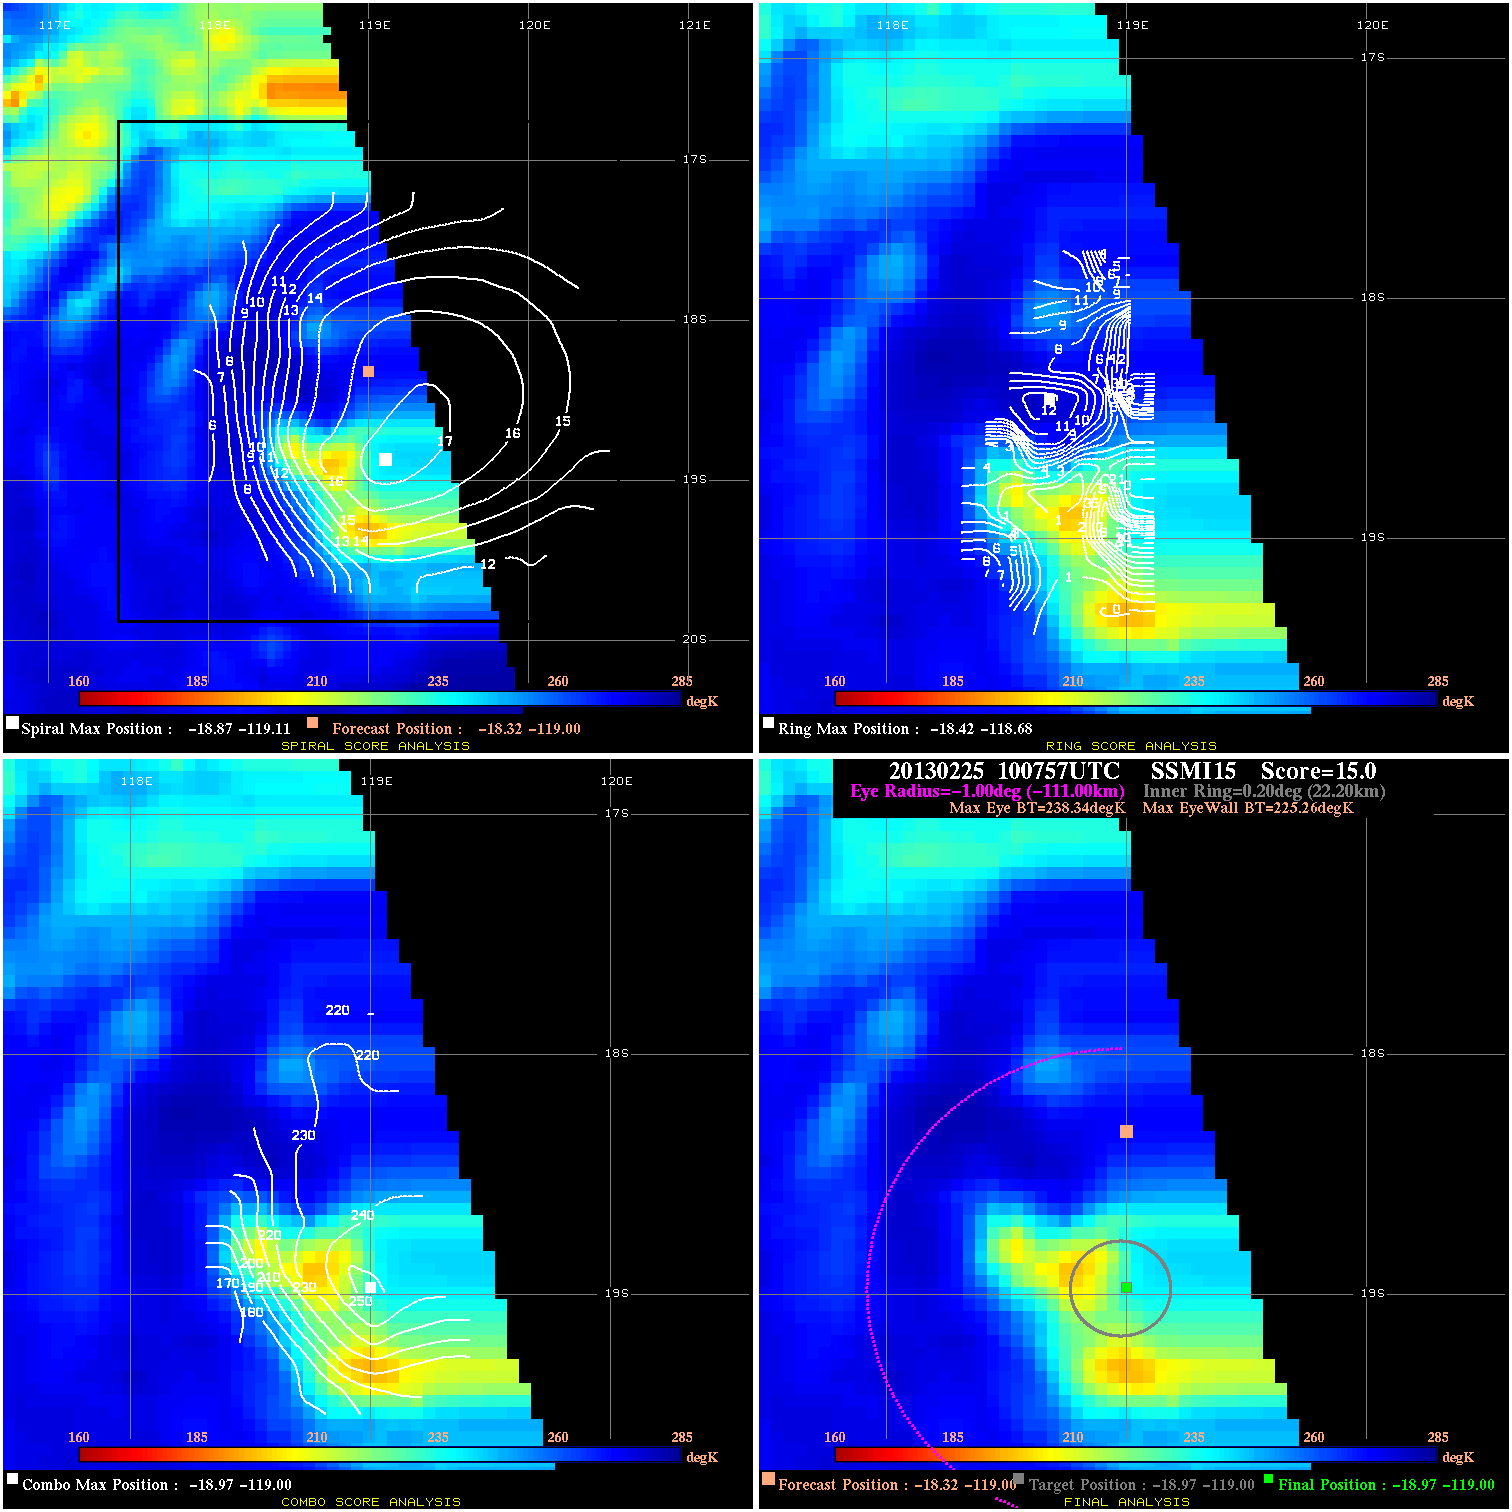
20130225 100757 15.0 N/A N/A N/A 13.08 65.0 SSMI15 -18.3 -119.0 -19.0 -119.0 -19.0 -119.0 Analysis Plot
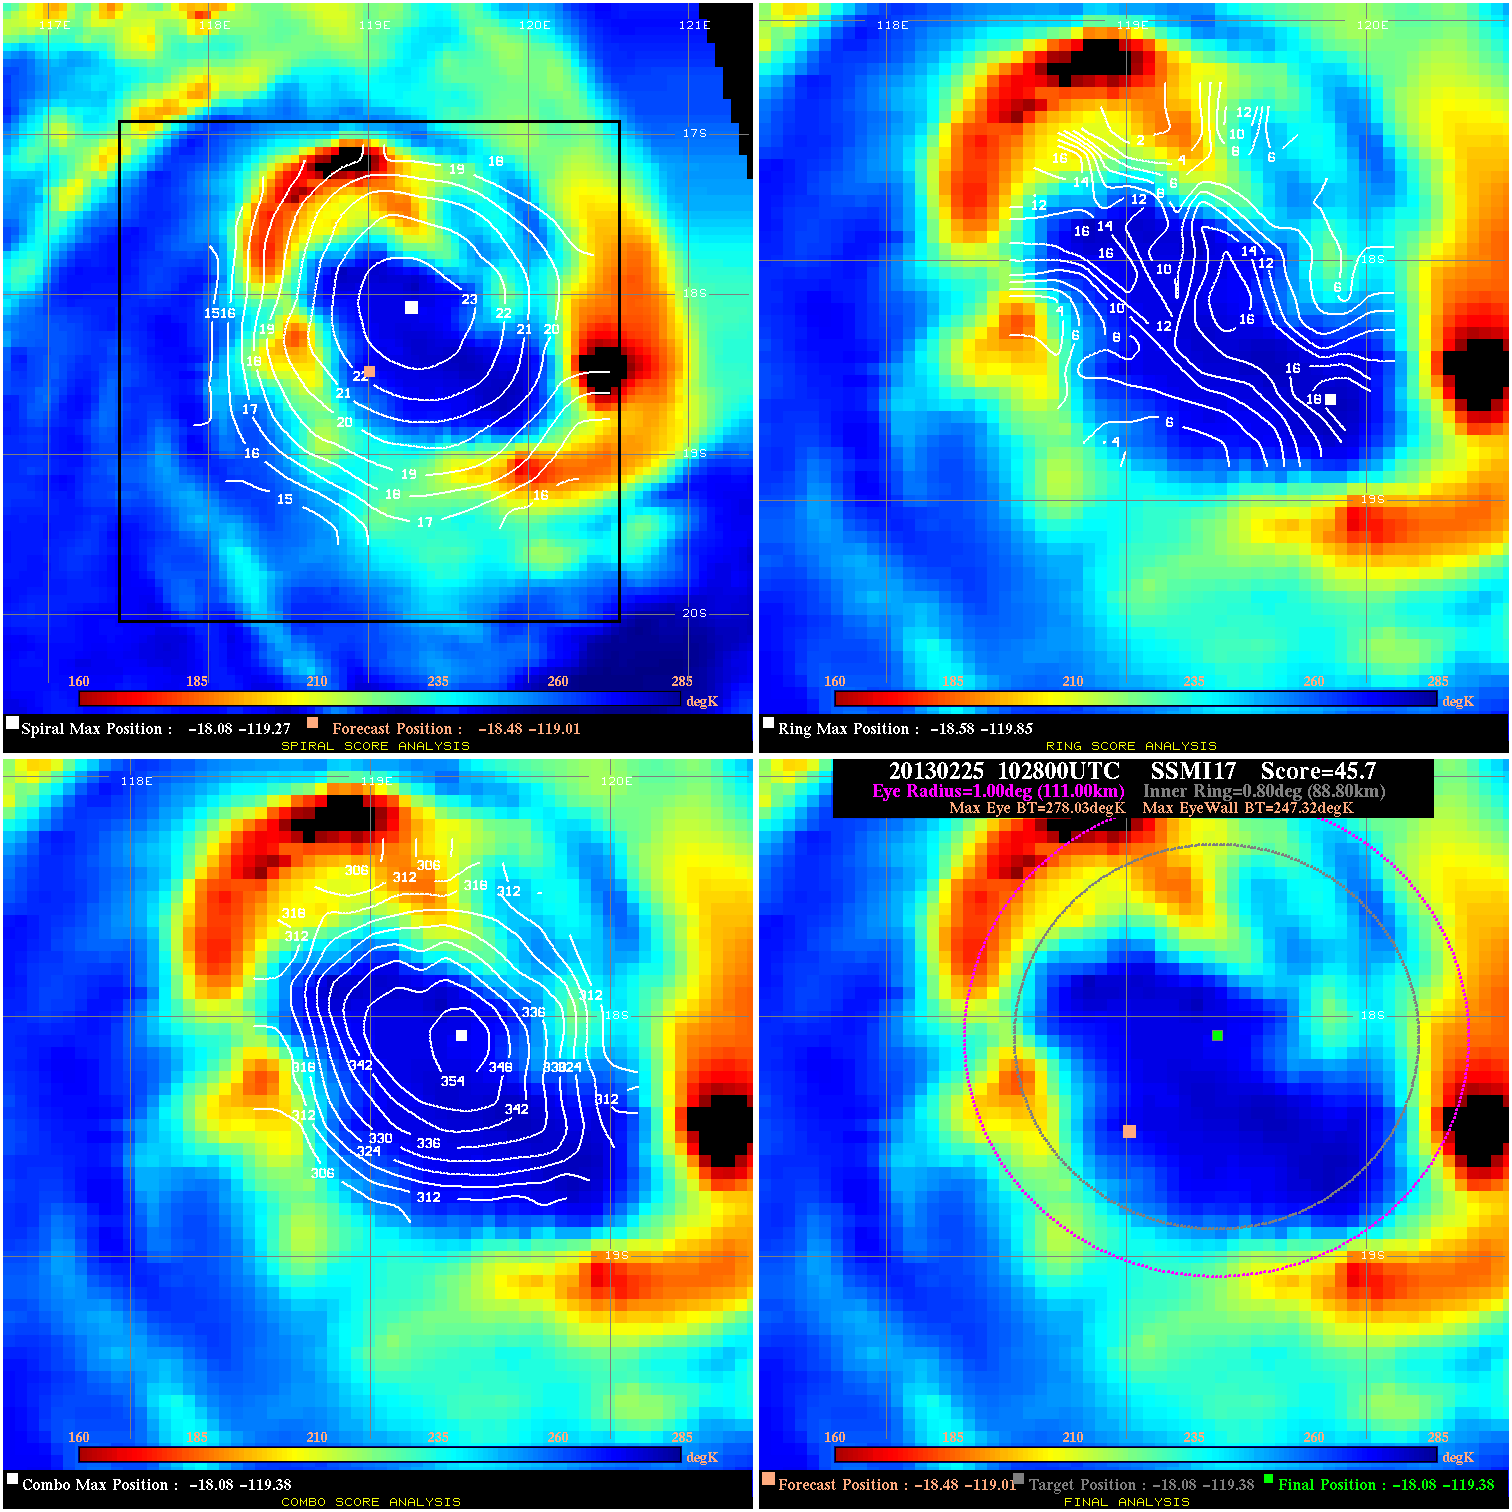
20130225 102800 45.7 >65 kts 100.0% 222.20 30.71 65.0 SSMI17 -18.5 -119.0 -18.1 -119.4 -18.1 -119.4 Analysis Plot
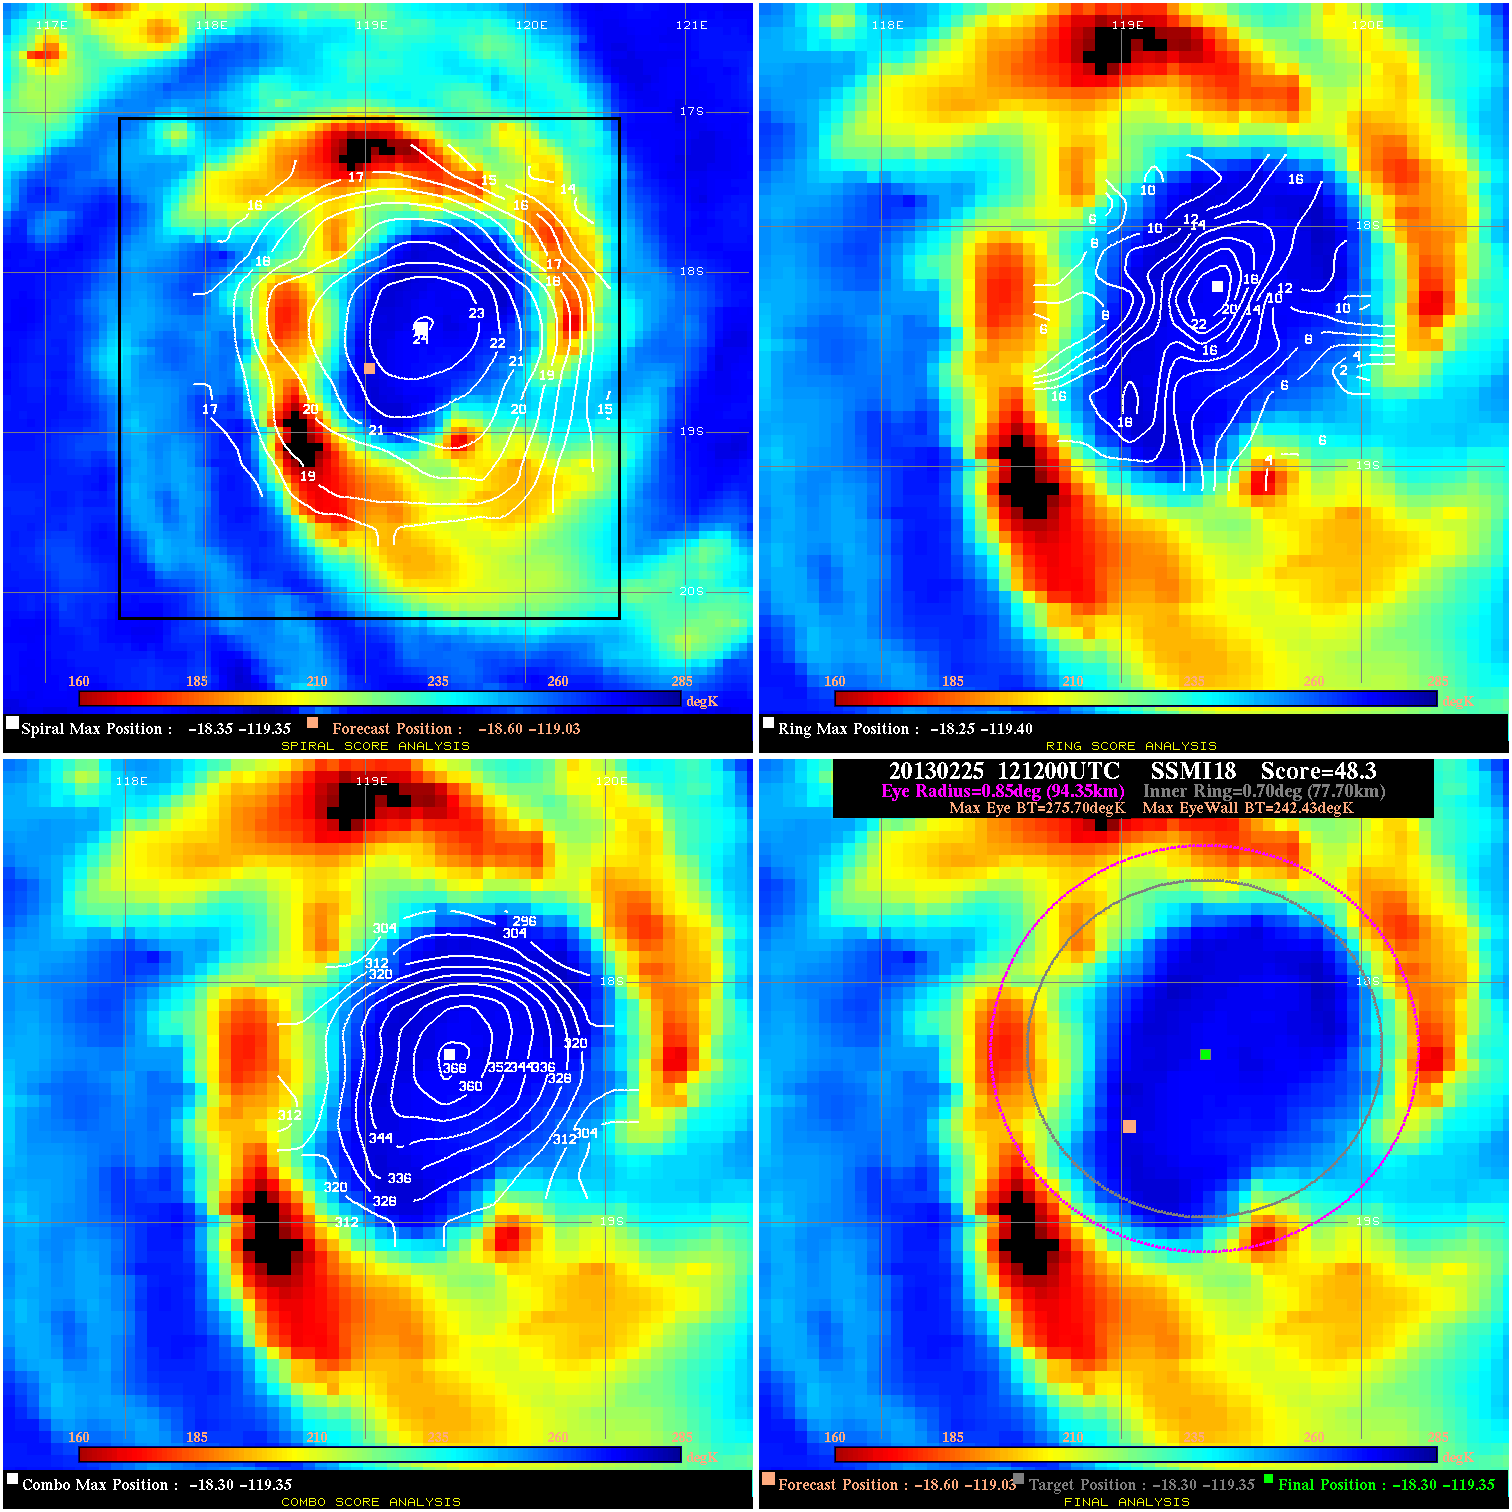
20130225 121200 48.3 >65 kts 100.0% 188.87 33.27 65.0 SSMI18 -18.6 -119.0 -18.3 -119.3 -18.3 -119.3 Analysis Plot
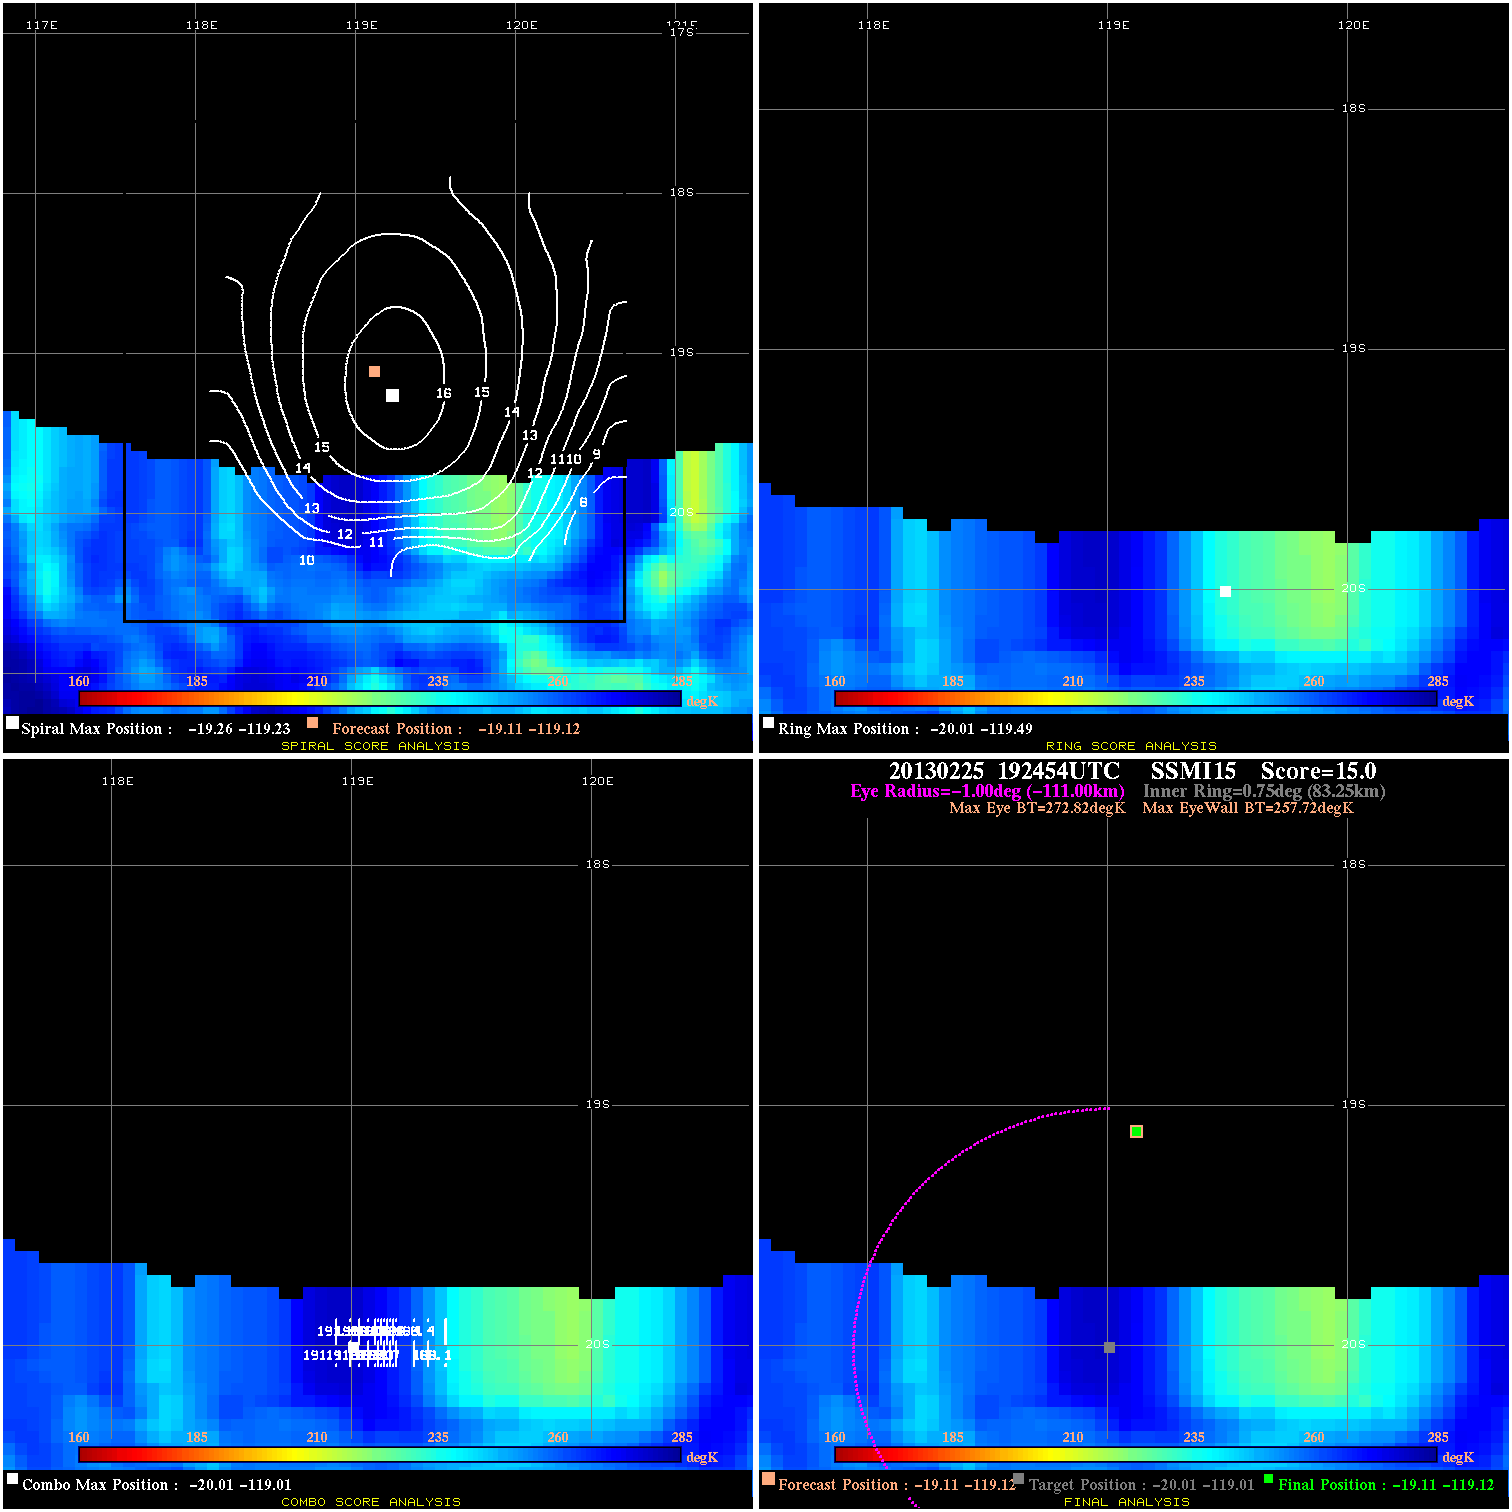
20130225 192454 15.0 N/A N/A N/A 15.10 65.0 SSMI15 -19.1 -119.1 -19.1 -119.1 -20.0 -119.0 Analysis Plot
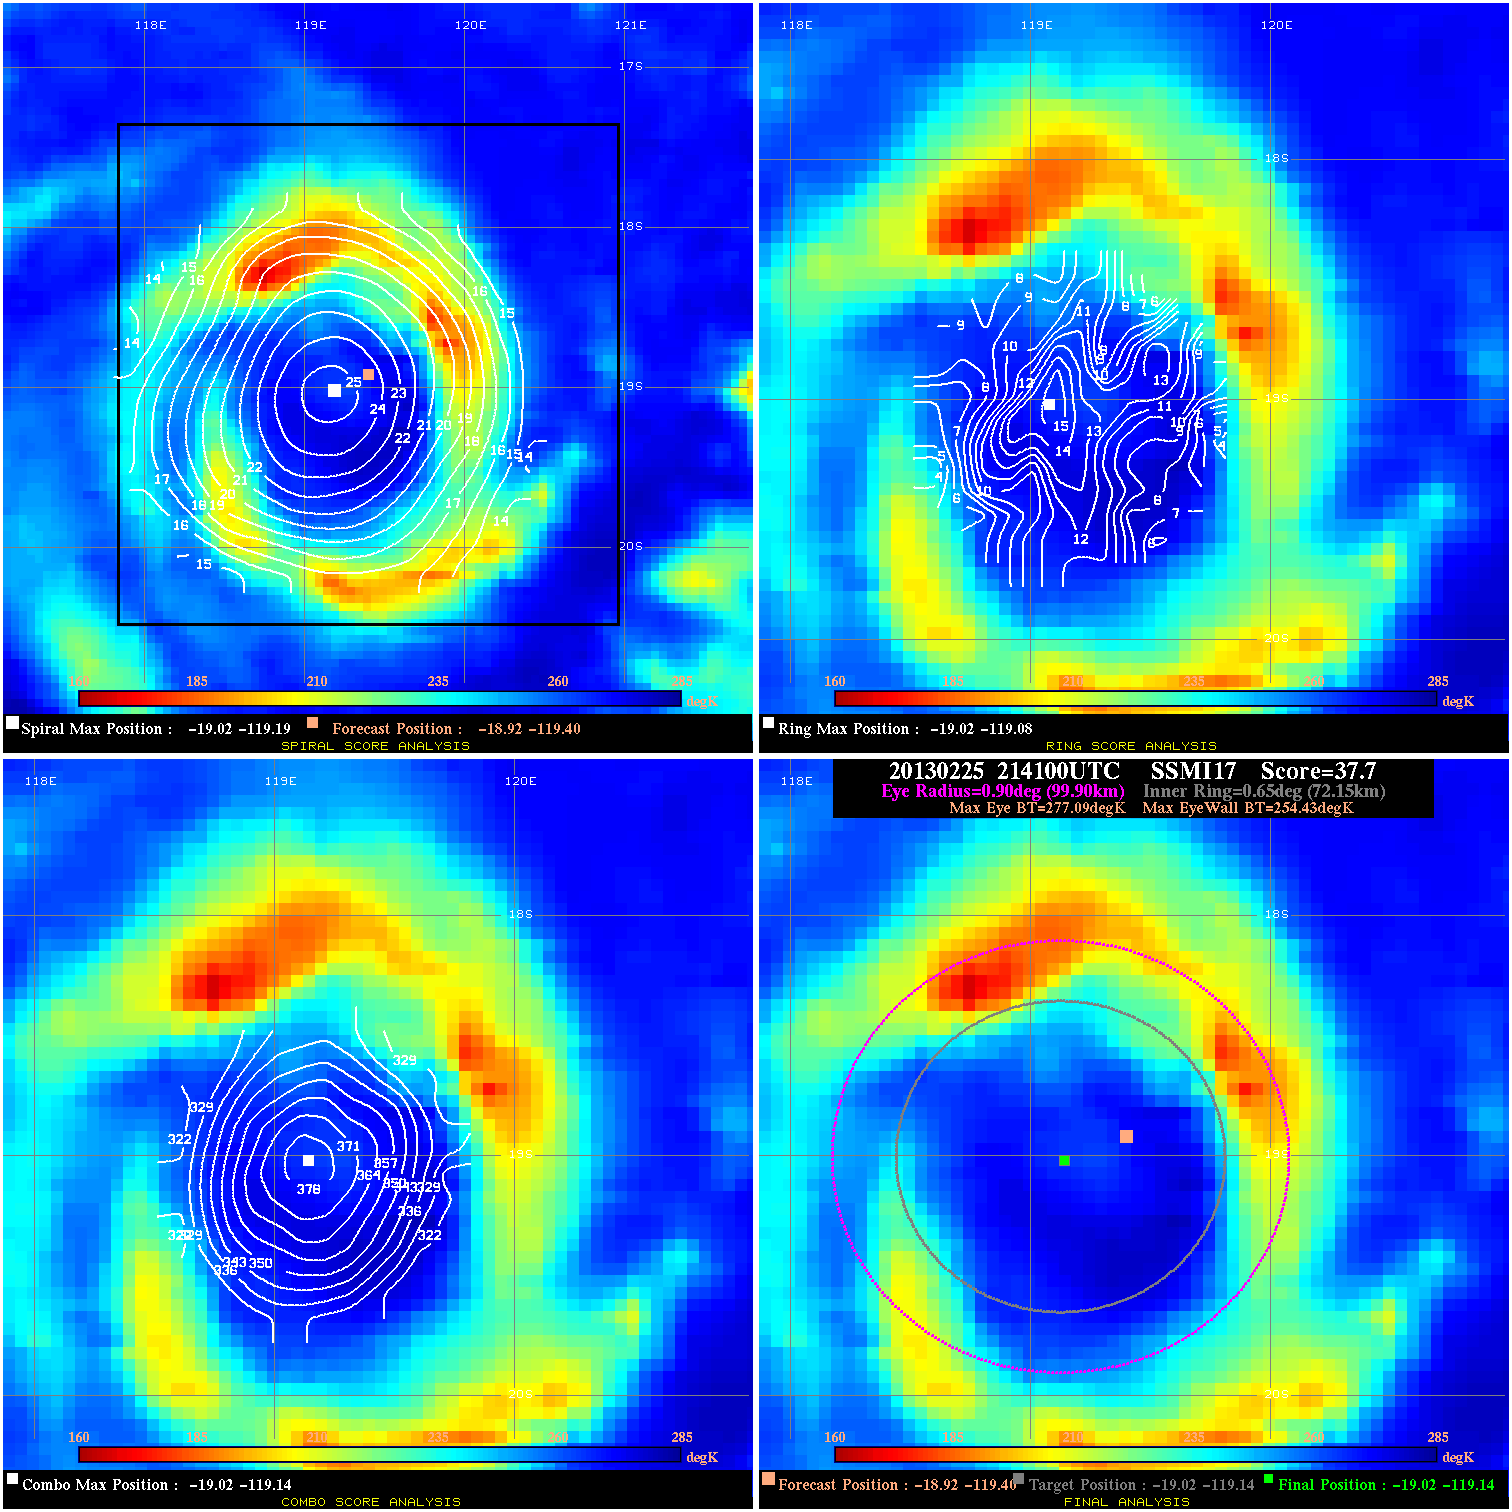
20130225 214100 37.7 >65 kts 100.0% 199.98 22.66 75.0 SSMI17 -18.9 -119.4 -19.0 -119.1 -19.0 -119.1 Analysis Plot
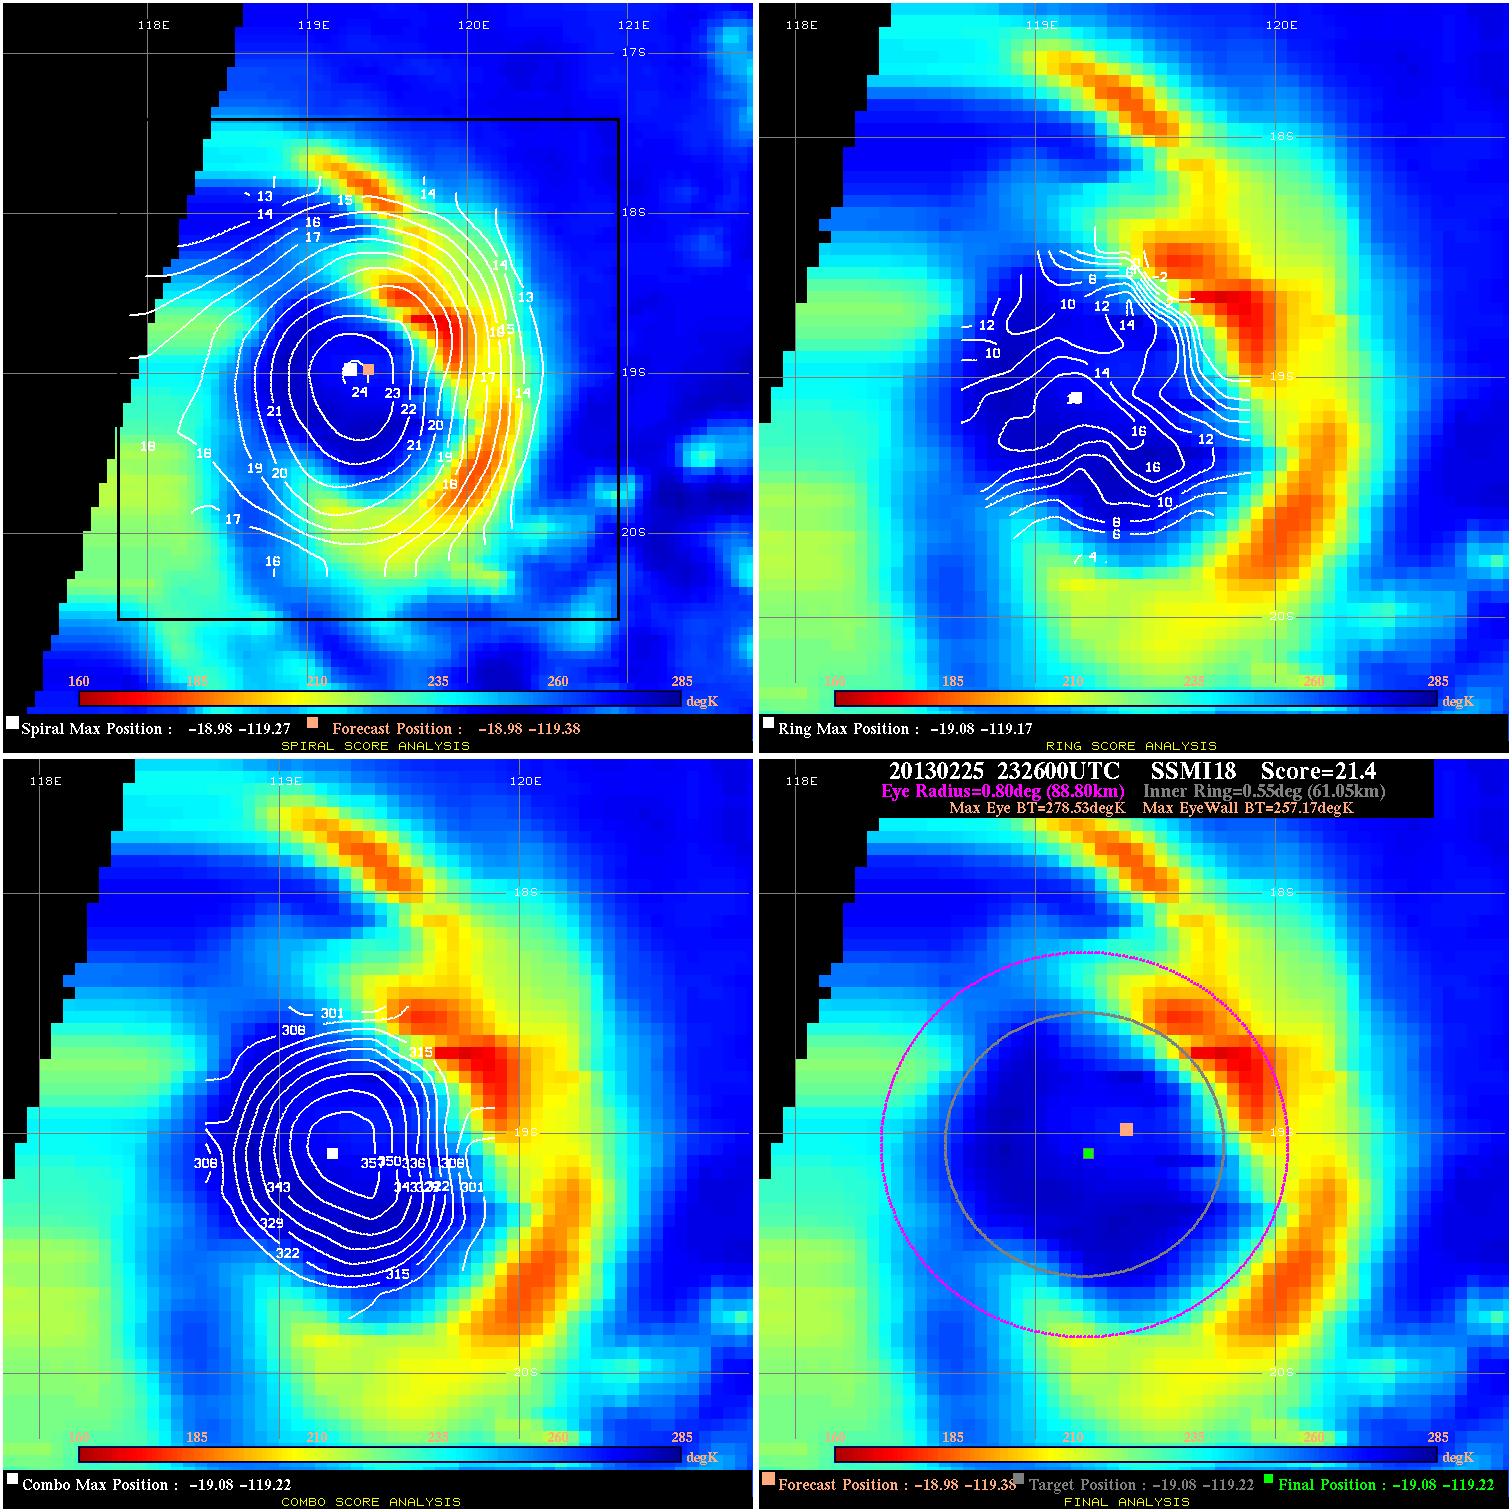
20130225 232600 21.4 >65 kts 61.6% 177.76 21.36 75.0 SSMI18 -19.0 -119.4 -19.1 -119.2 -19.1 -119.2 Analysis Plot
20130226 065408 22.4 >65 kts 58.9% 133.32 22.44 65.0 TRMM -19.4 -119.2 -19.3 -119.2 -19.3 -119.2 Analysis Plot
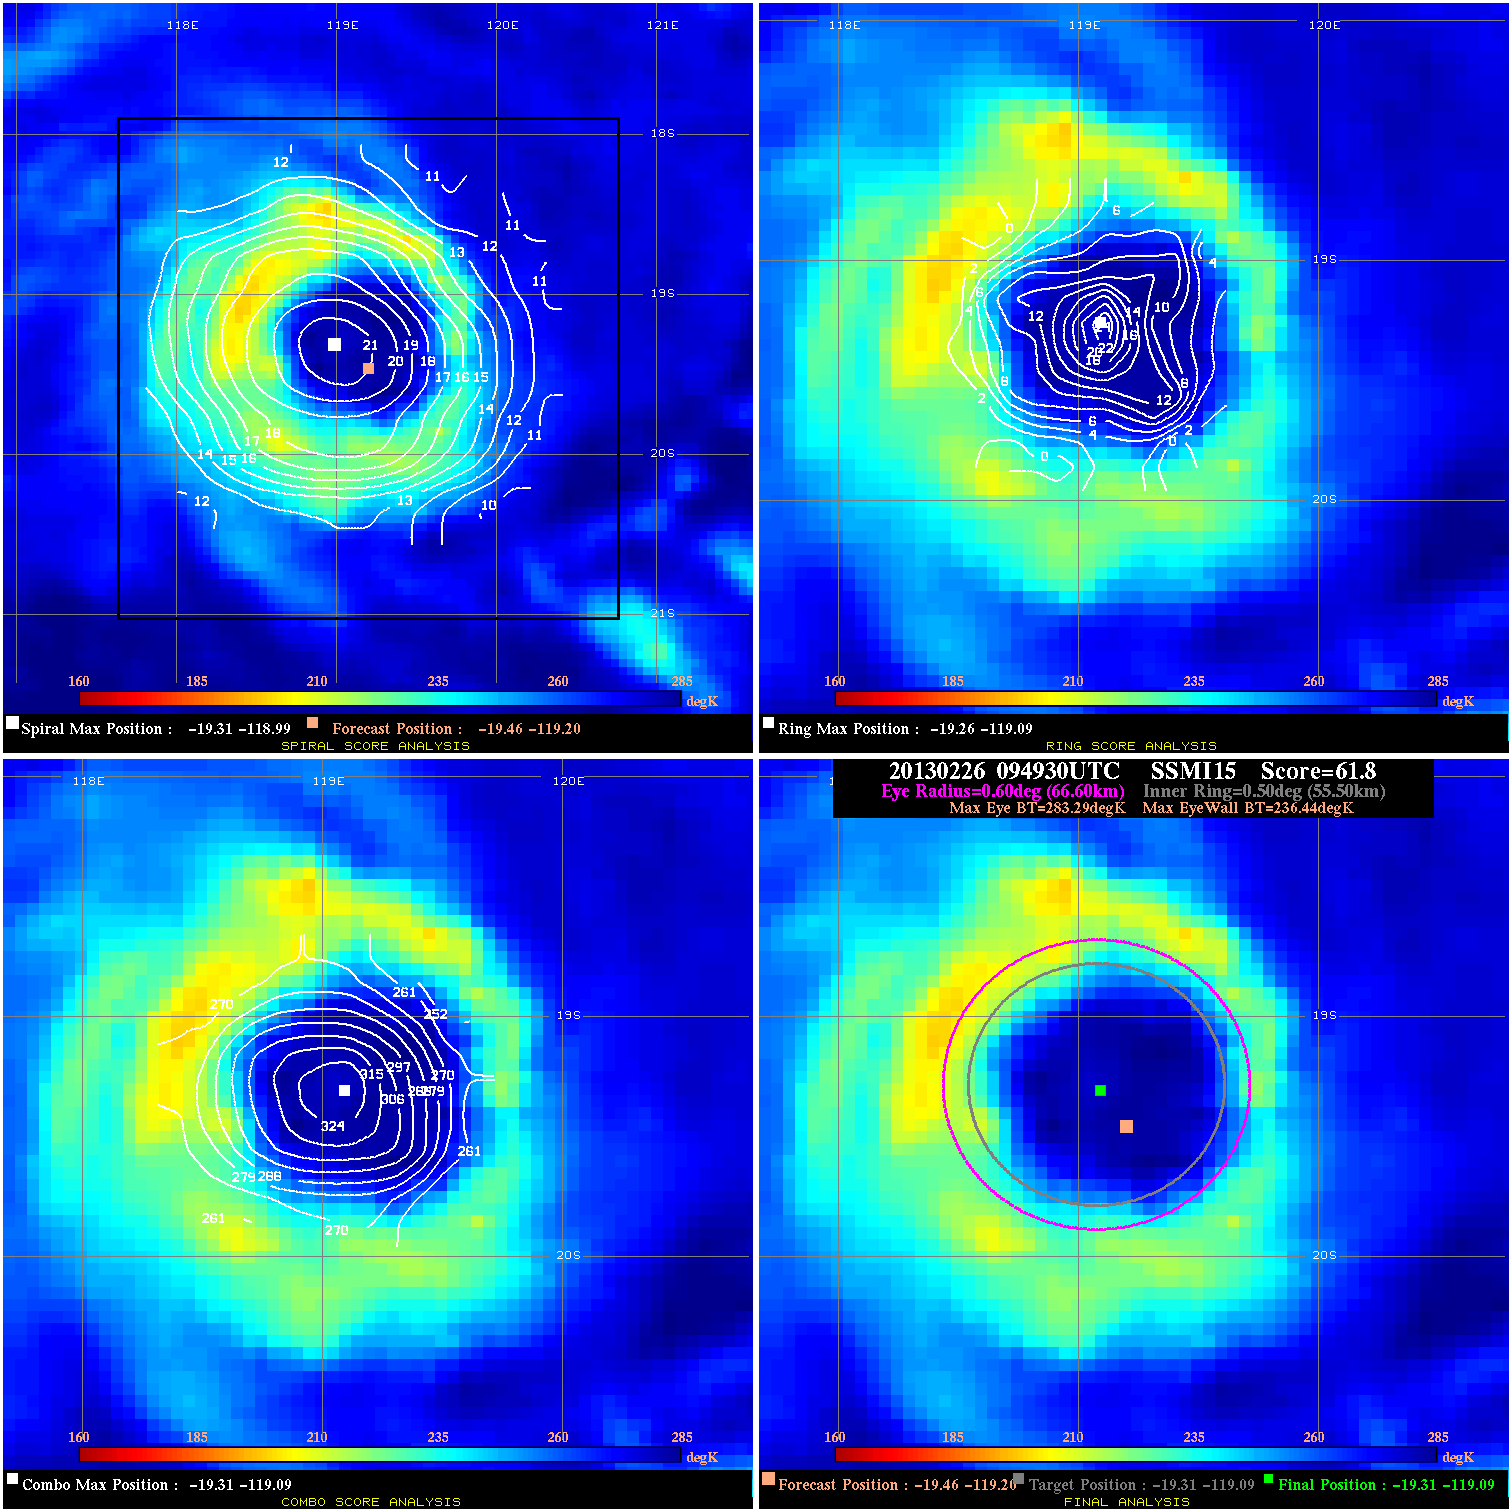
20130226 094930 61.8 >85 kts 100.0% 133.32 46.85 65.0 SSMI15 -19.5 -119.2 -19.3 -119.1 -19.3 -119.1 Analysis Plot
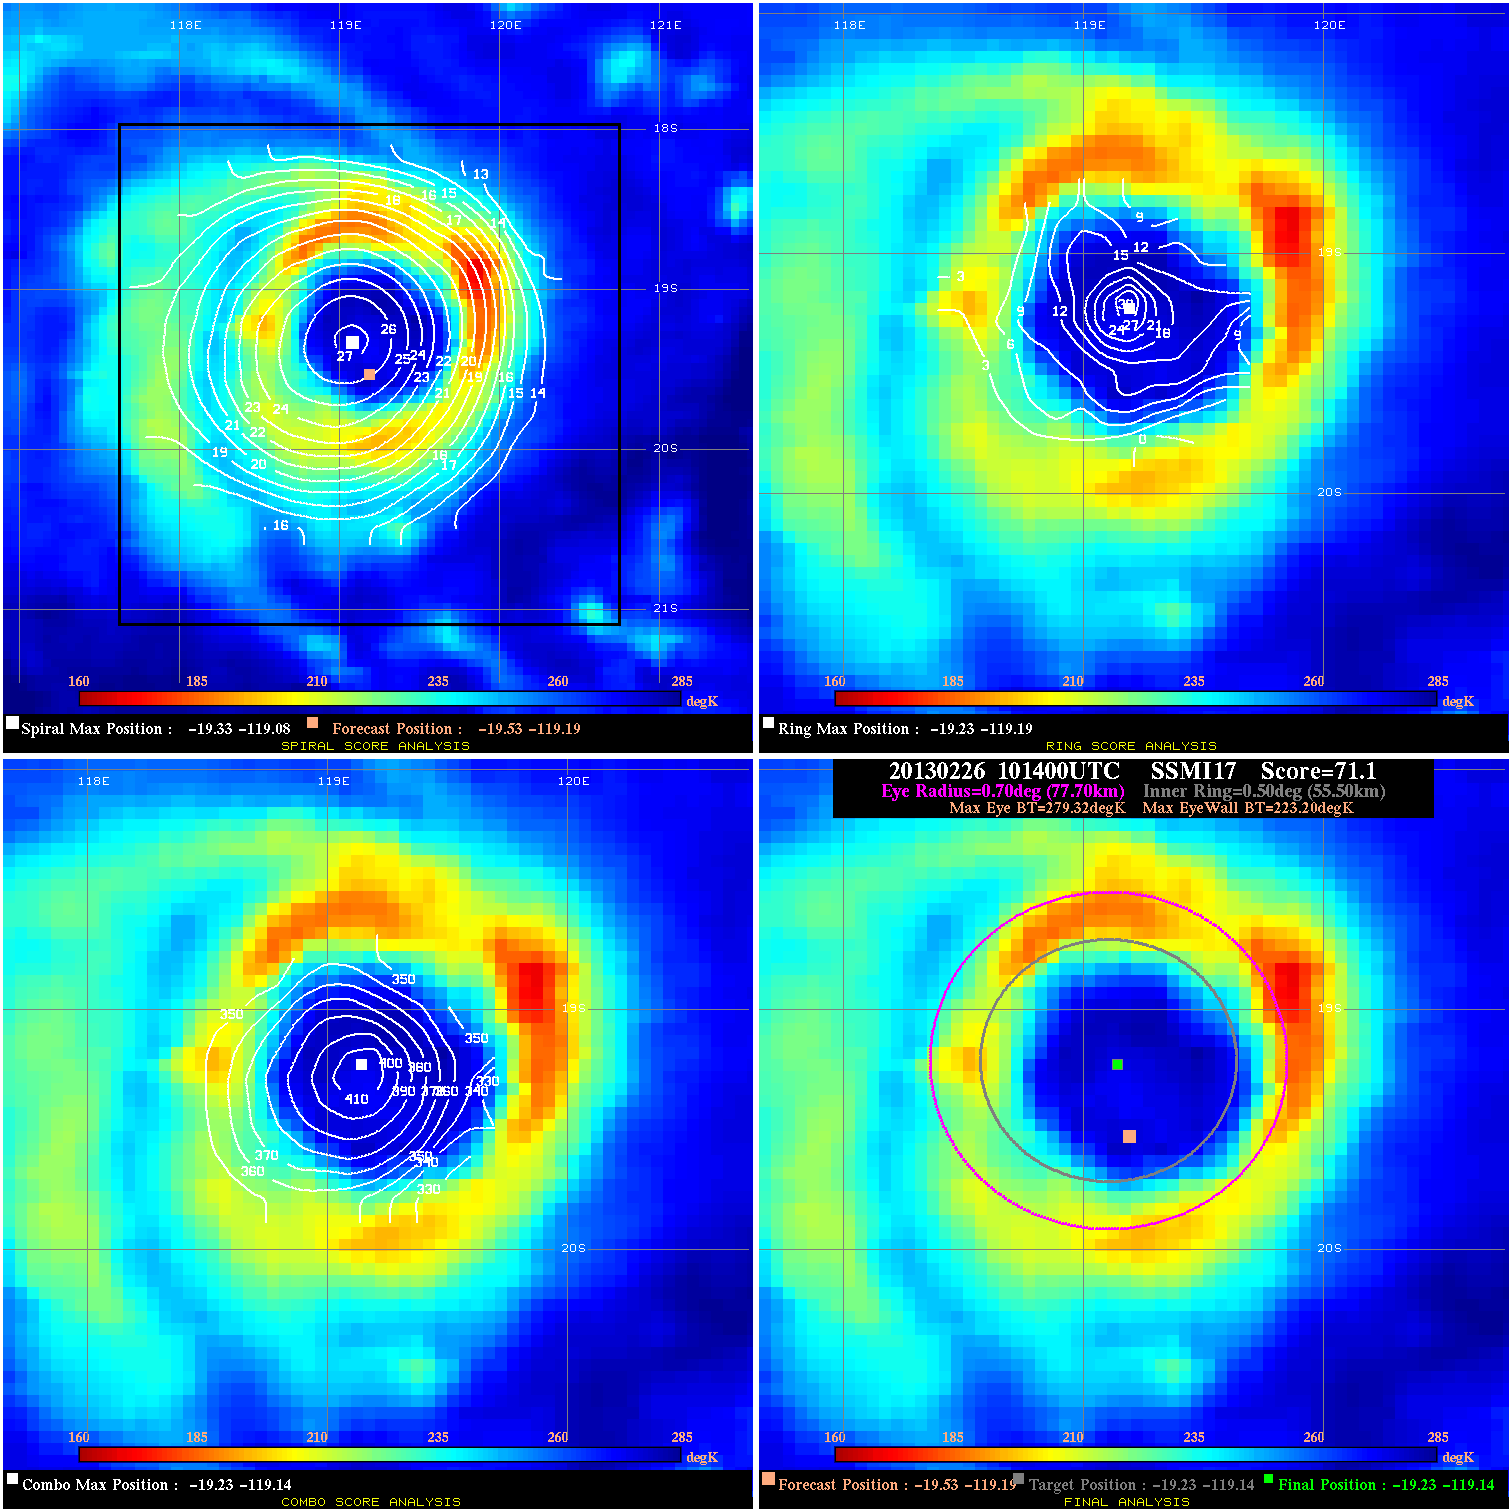
20130226 101400 71.1 >85 kts 100.0% 155.54 56.12 65.0 SSMI17 -19.5 -119.2 -19.2 -119.1 -19.2 -119.1 Analysis Plot
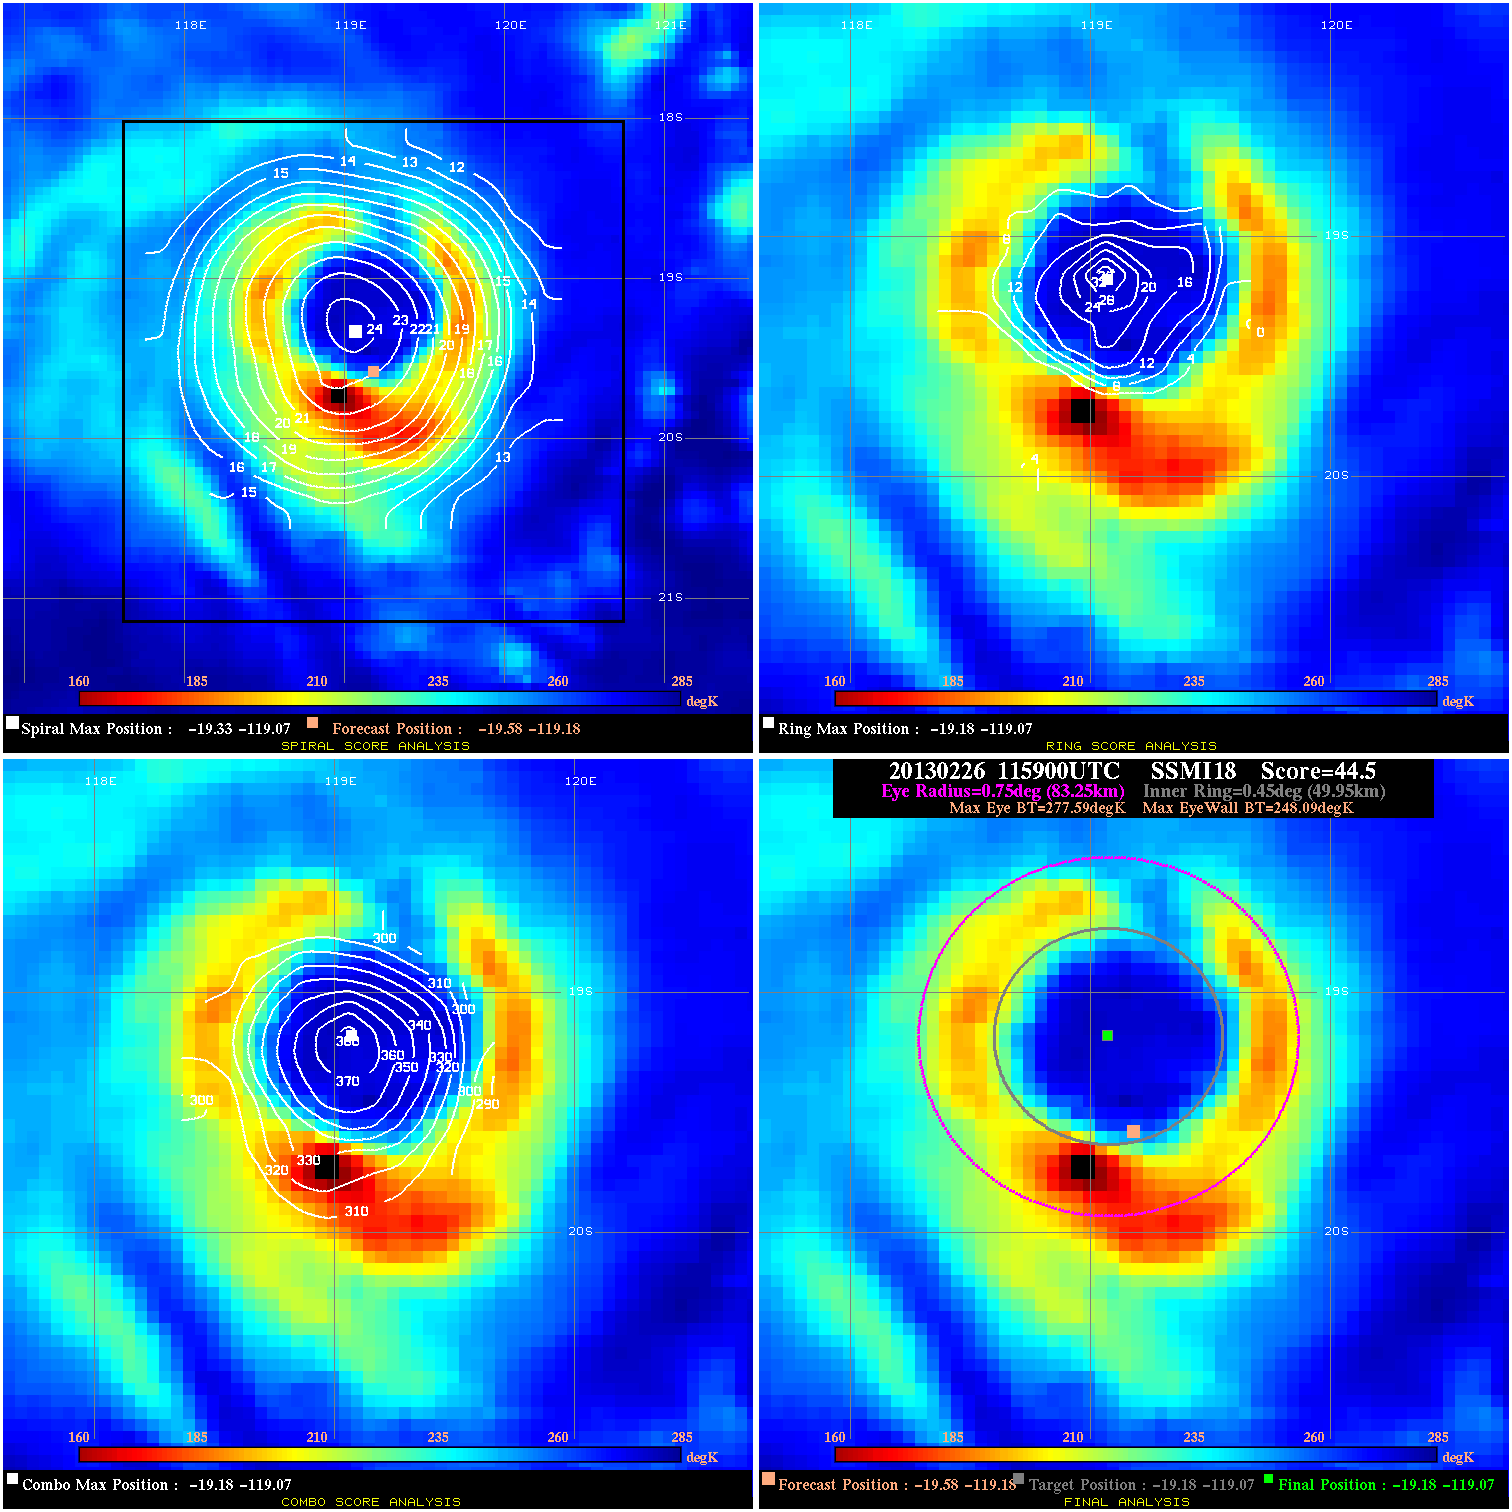
20130226 115900 44.5 >65 kts 100.0% 166.65 29.50 65.0 SSMI18 -19.6 -119.2 -19.2 -119.1 -19.2 -119.1 Analysis Plot
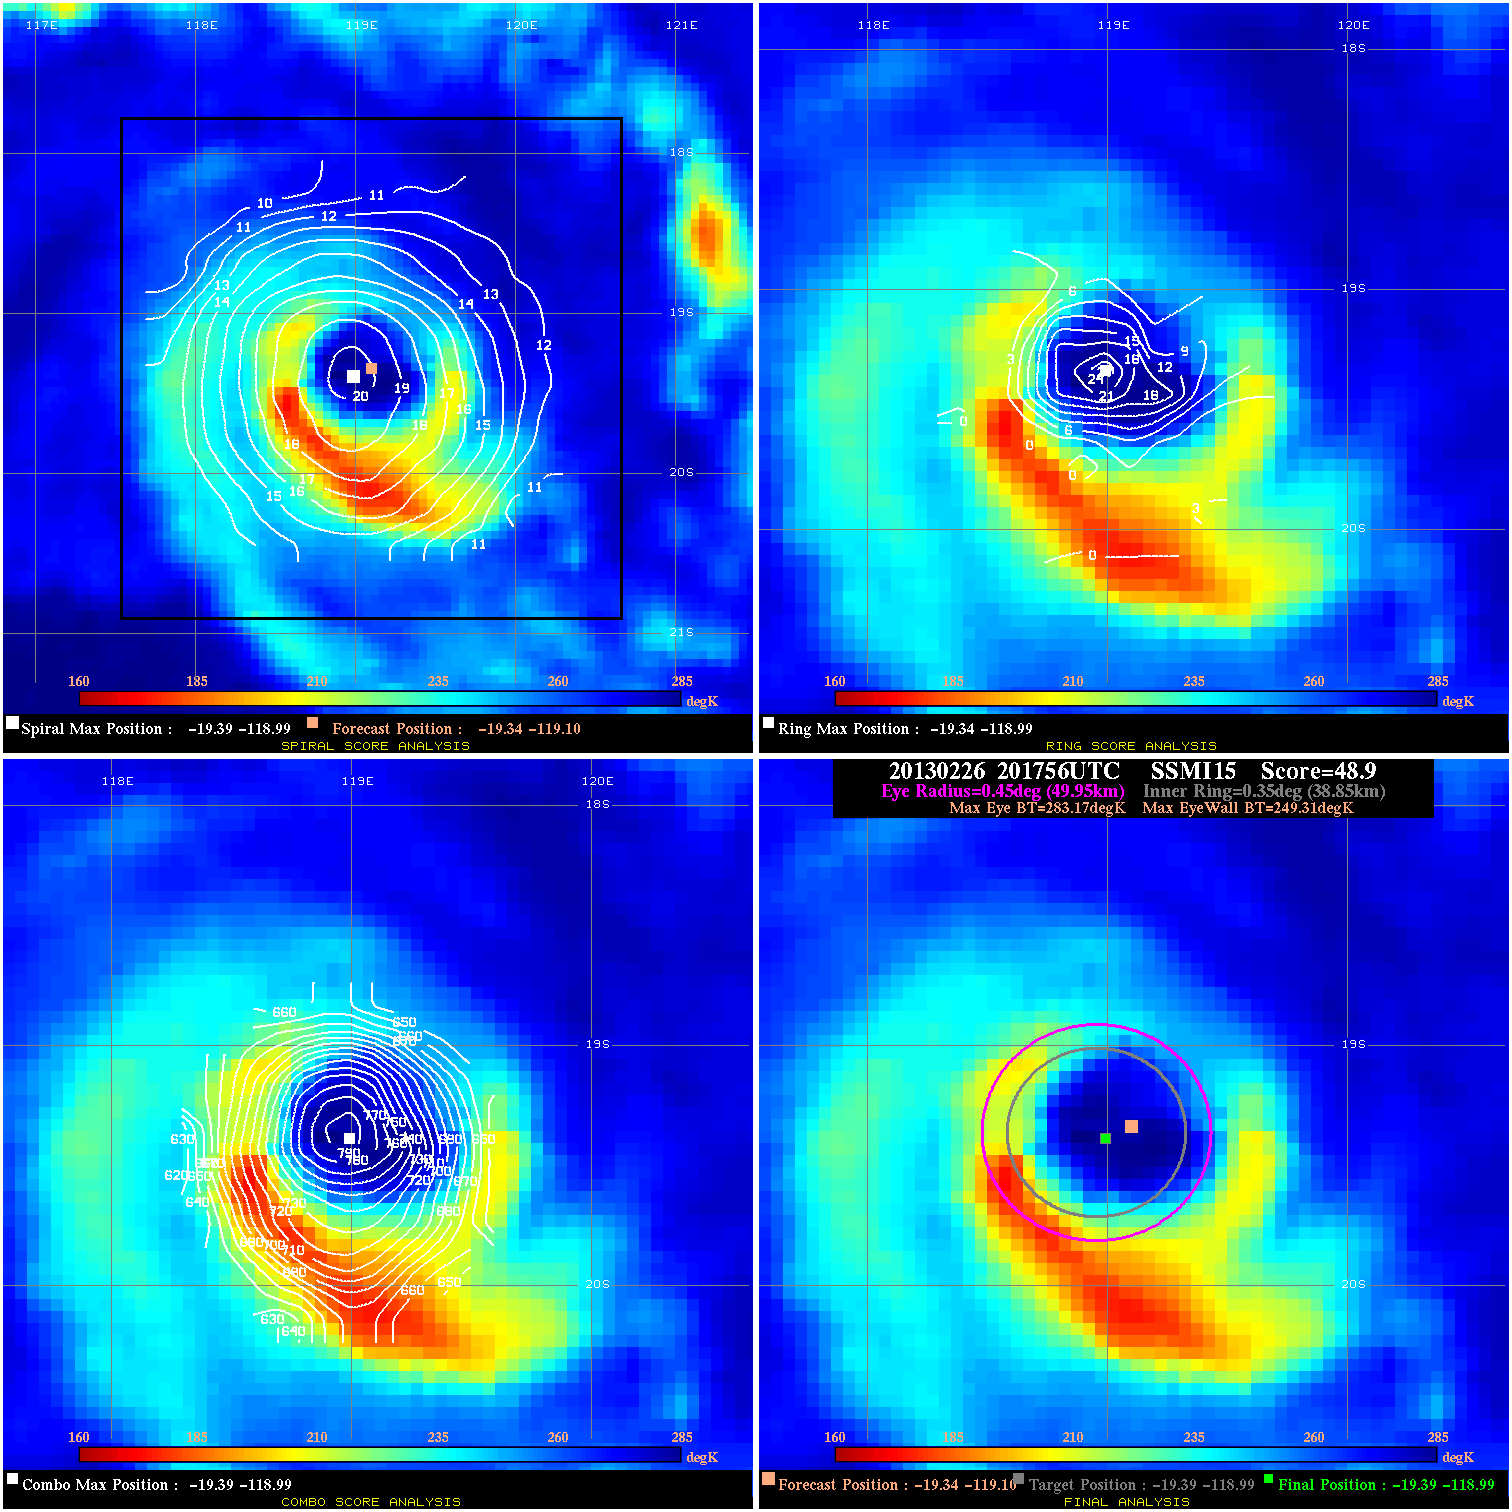
20130226 201756 48.9 >65 kts 100.0% 99.99 33.86 95.0 SSMI15 -19.3 -119.1 -19.4 -119.0 -19.4 -119.0 Analysis Plot
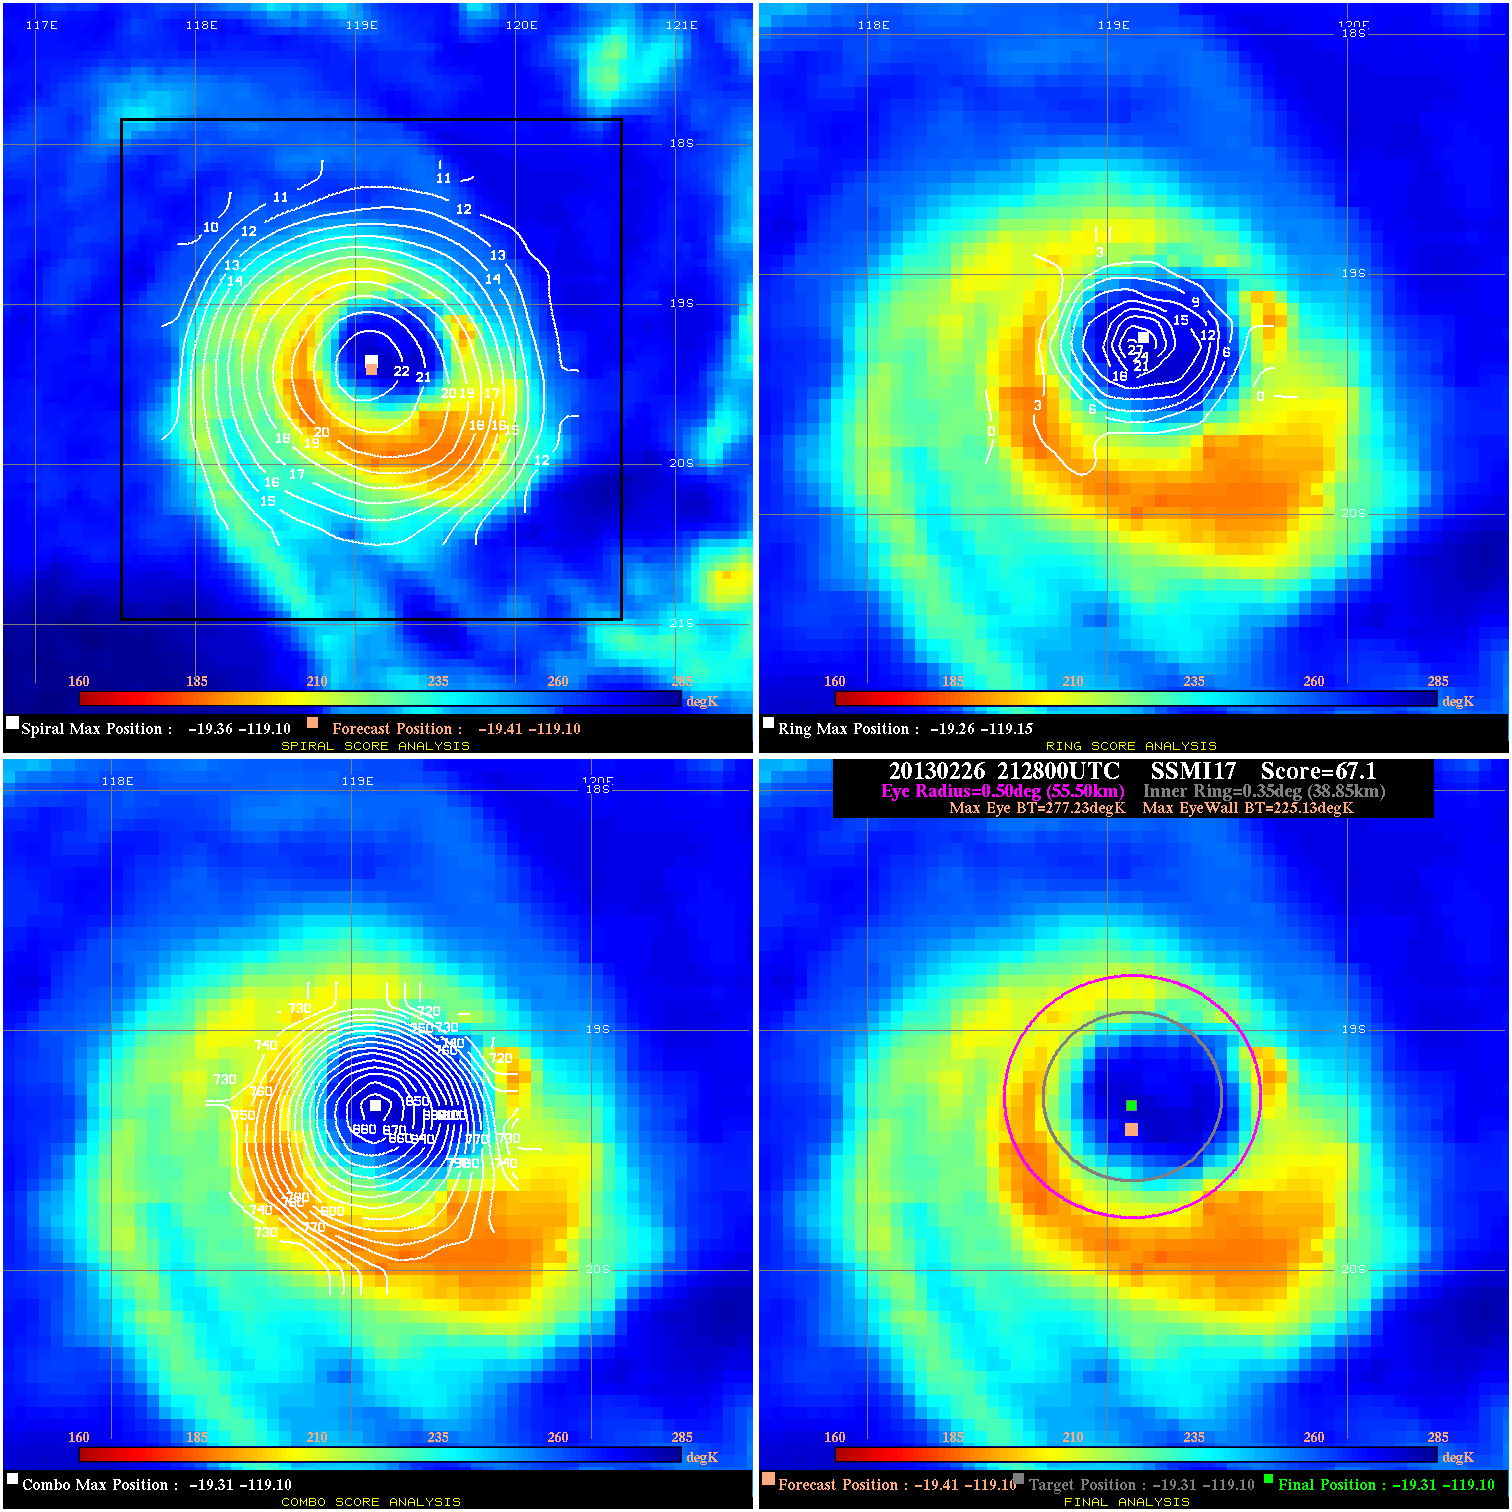
20130226 212800 67.1 >85 kts 100.0% 111.10 52.10 95.0 SSMI17 -19.4 -119.1 -19.3 -119.1 -19.3 -119.1 Analysis Plot
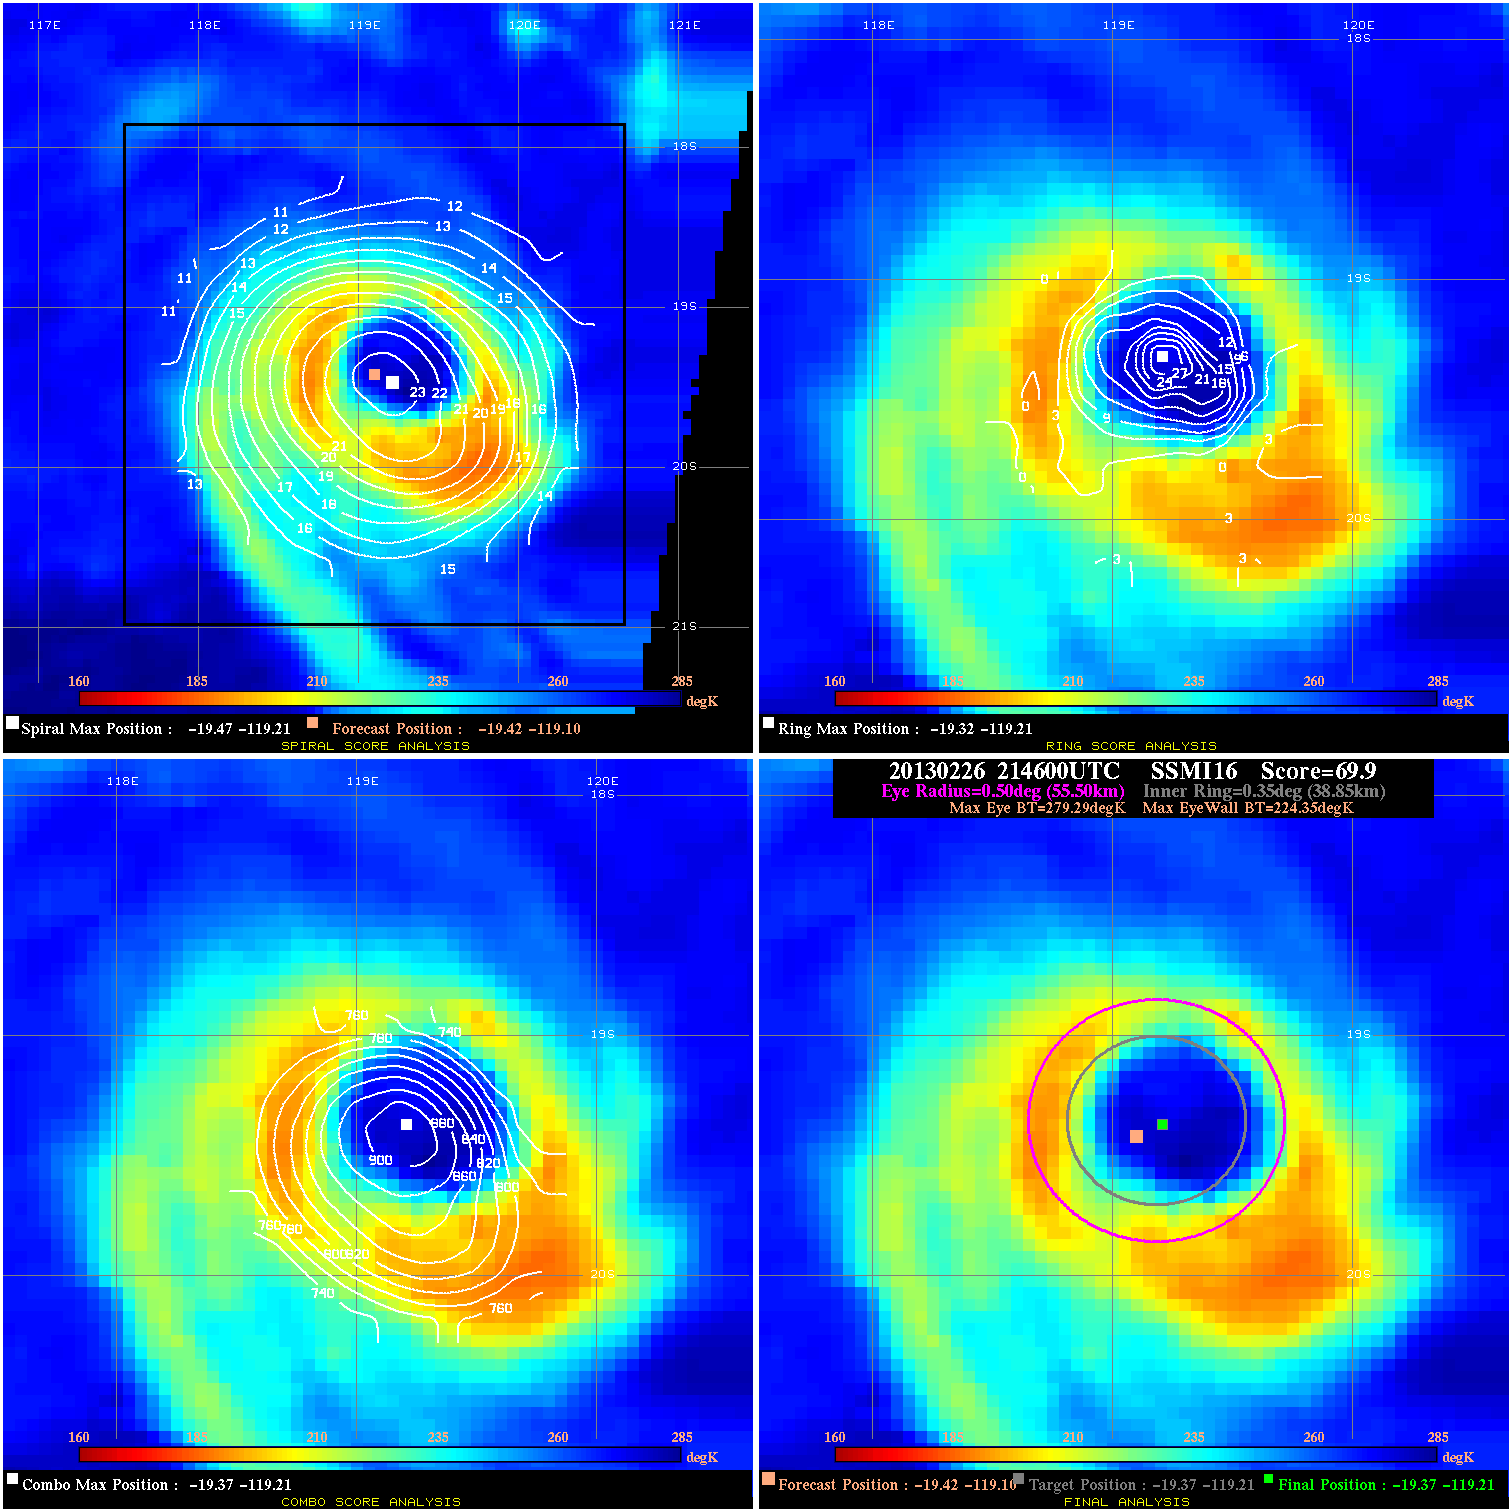
20130226 214600 69.9 >85 kts 100.0% 111.10 54.94 95.0 SSMI16 -19.4 -119.1 -19.4 -119.2 -19.4 -119.2 Analysis Plot
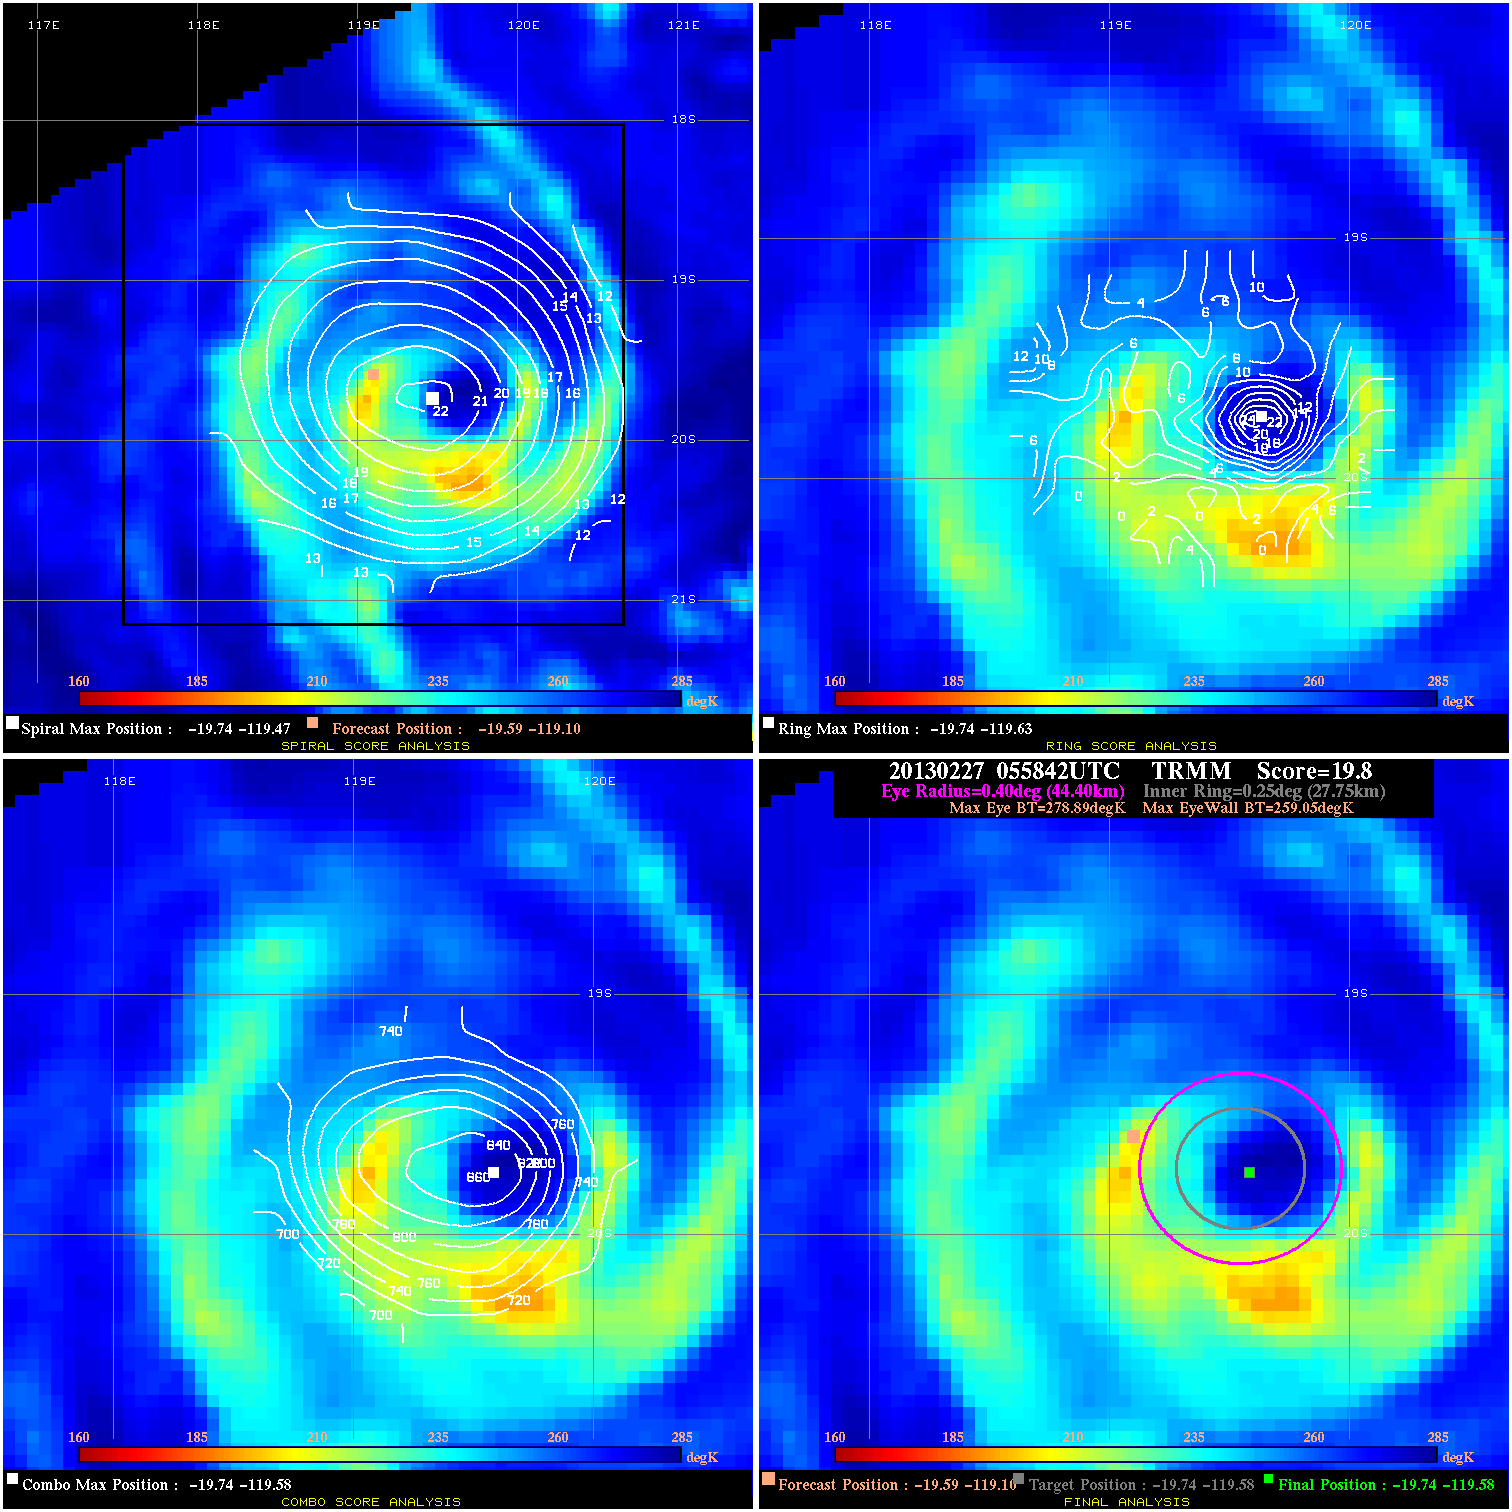
20130227 055842 19.8 N/A 63.0% 88.88 19.84 95.0 TRMM -19.6 -119.1 -19.7 -119.6 -19.7 -119.6 Analysis Plot
20130227 090827 10.2 N/A 42.5% 111.10 10.16 80.0 SSMI15 -19.8 -119.5 -19.9 -119.6 -19.9 -119.6 Analysis Plot
20130227 100100 5.5 N/A 32.9% 111.10 5.45 80.0 SSMI17 -20.1 -119.5 -20.1 -119.7 -20.1 -119.7 Analysis Plot
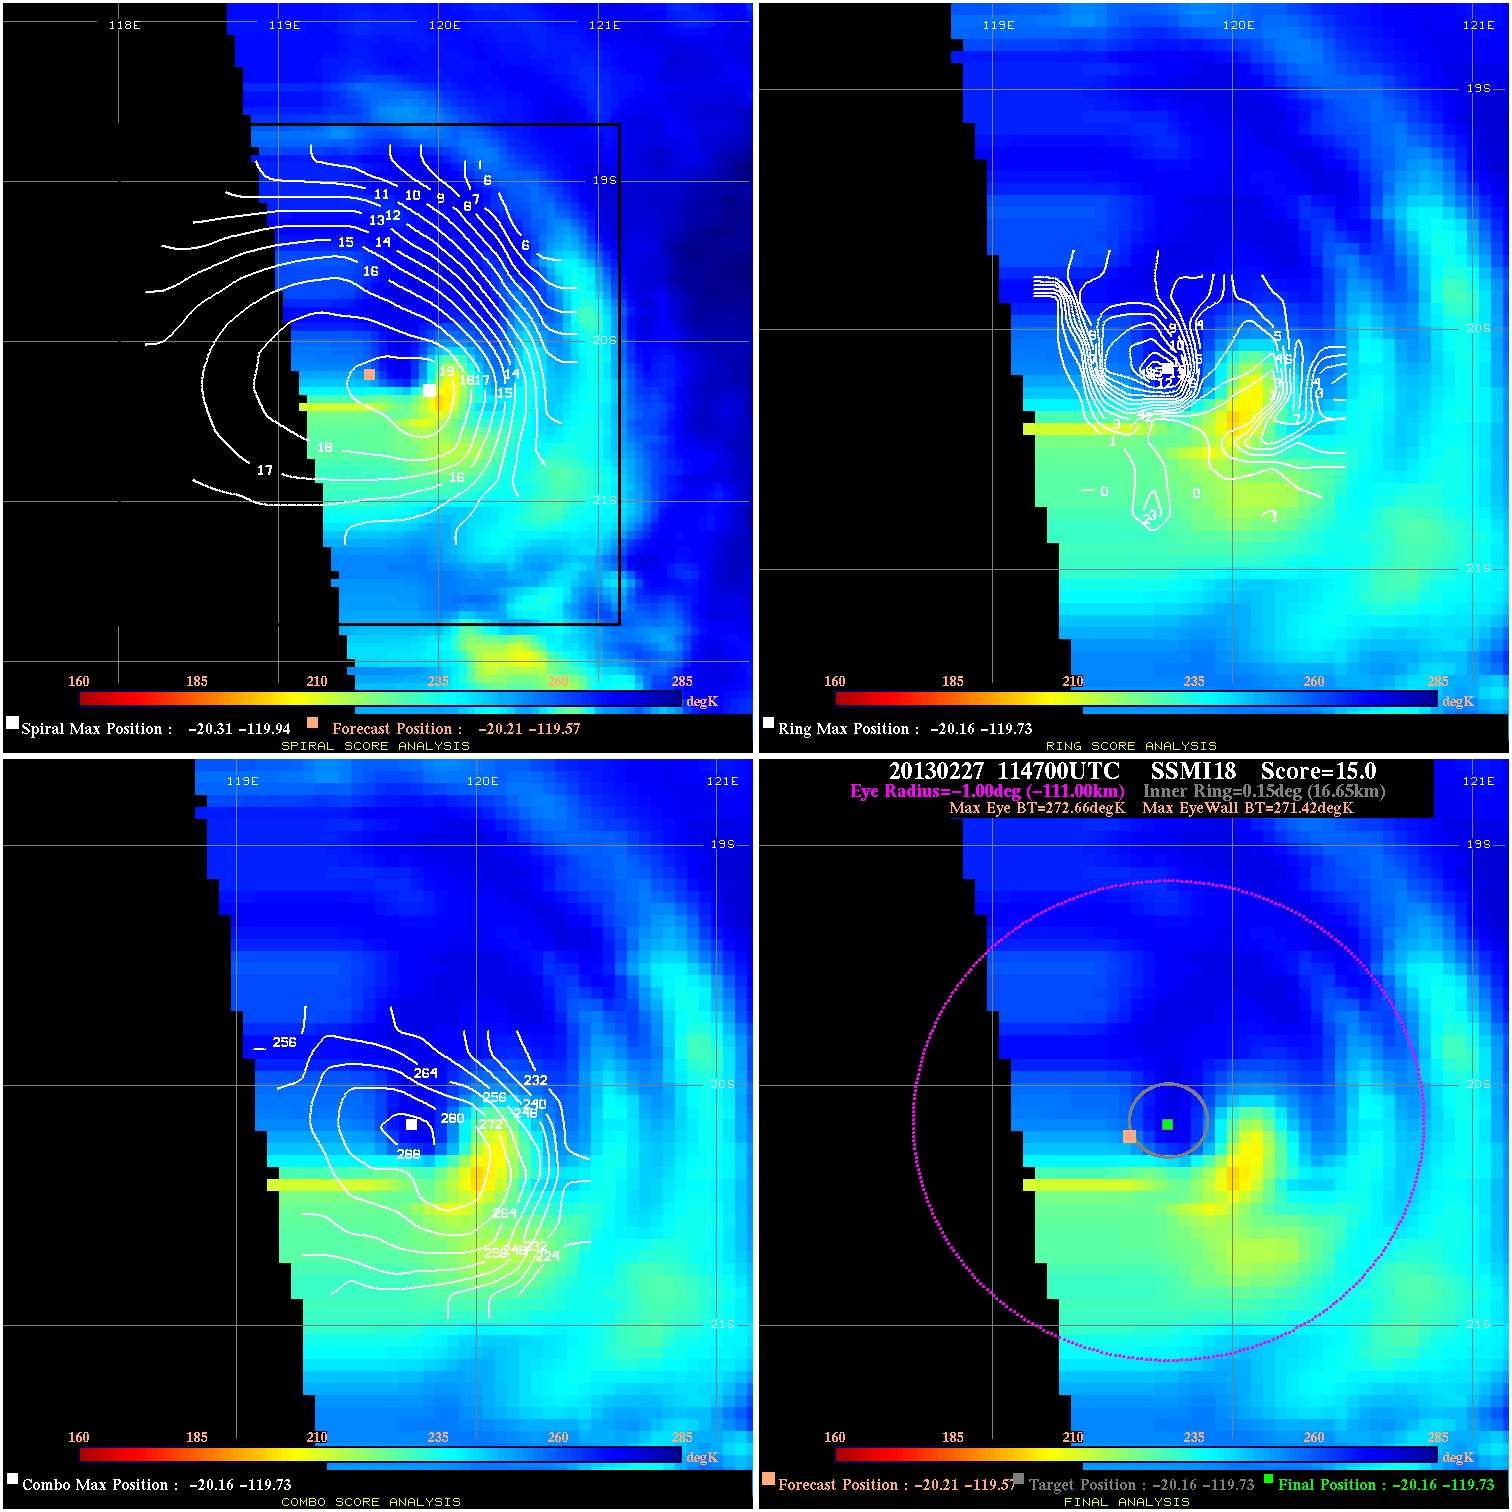
20130227 114700 15.0 N/A N/A N/A 1.24 80.0 SSMI18 -20.2 -119.6 -20.2 -119.7 -20.2 -119.7 Analysis Plot
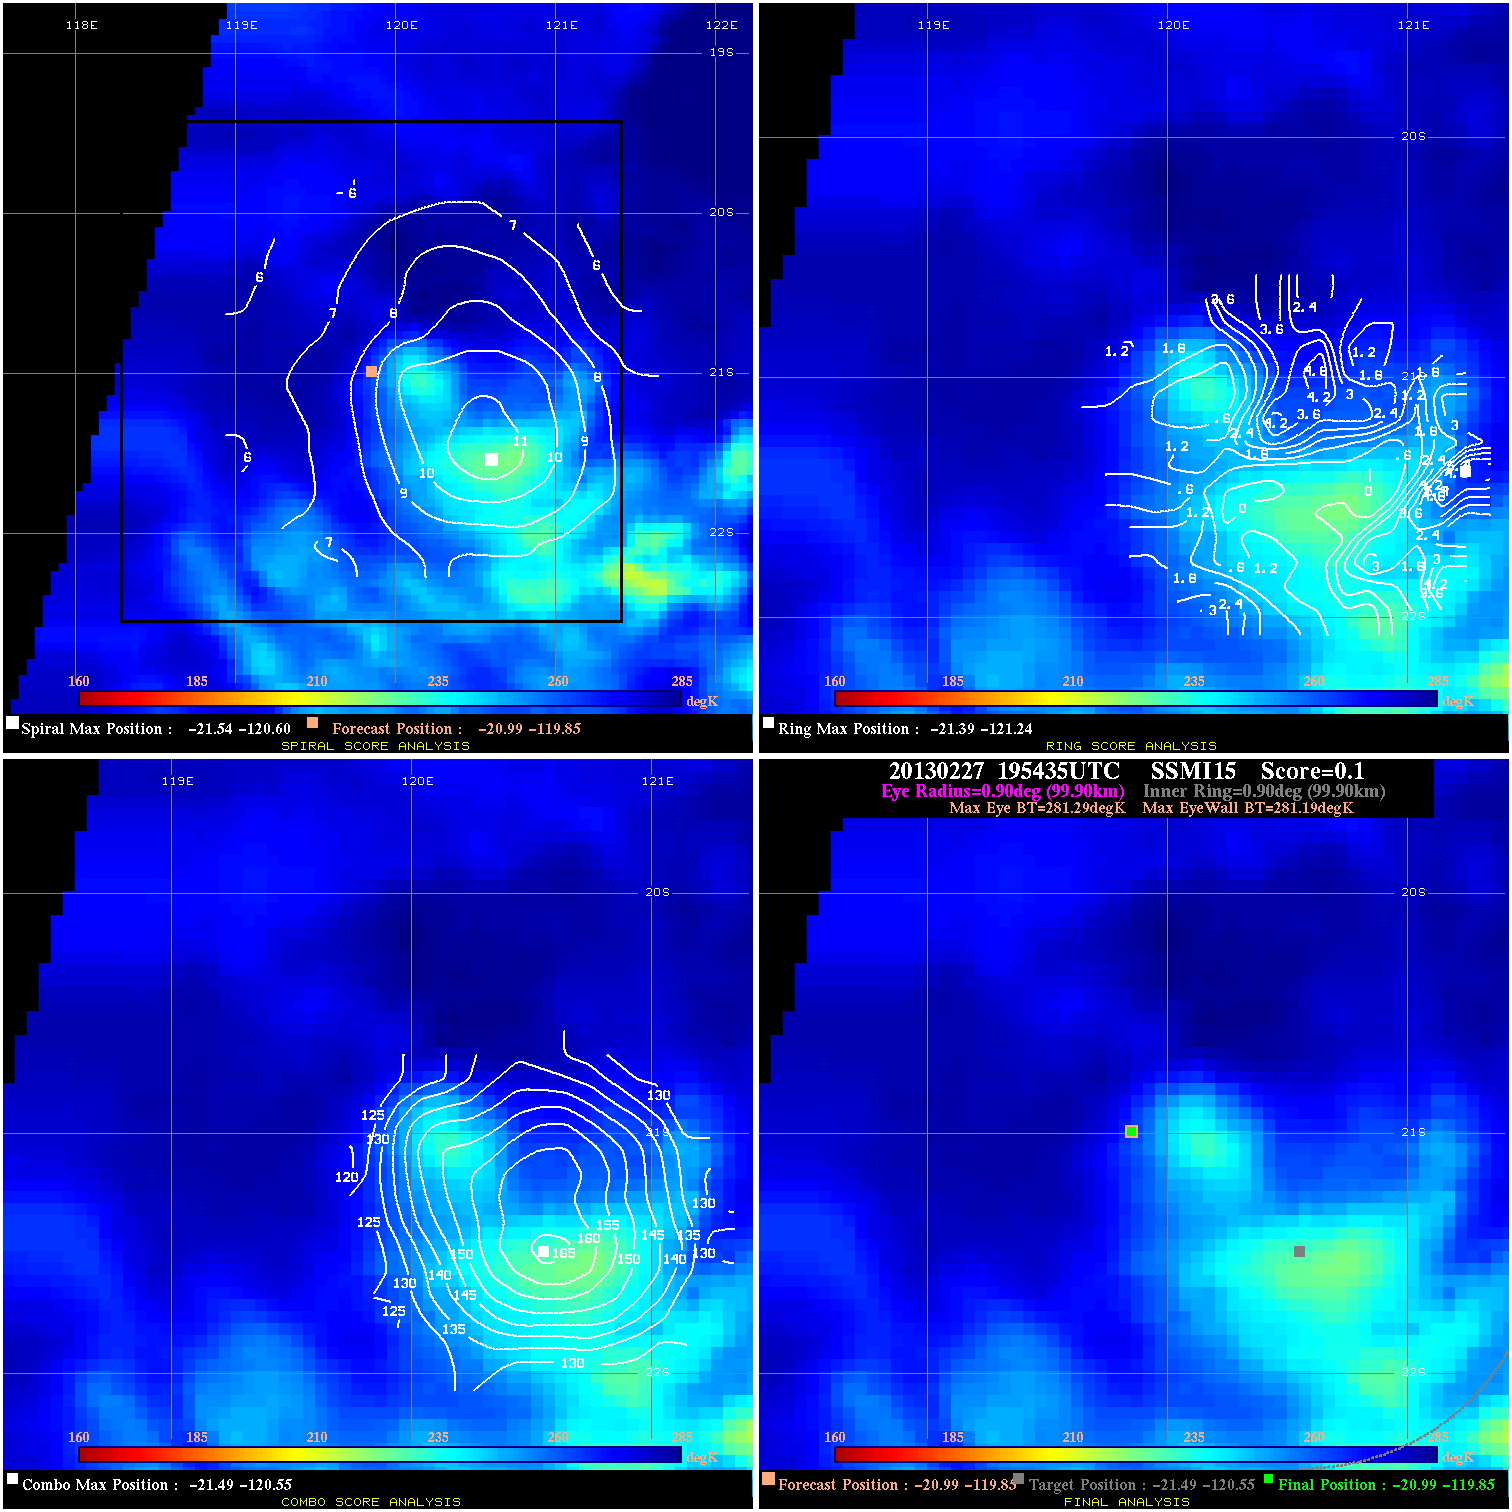
20130227 195435 0.1 N/A 4.1% 199.98 .10 75.0 SSMI15 -21.0 -119.8 -21.0 -119.8 -21.5 -120.5 Analysis Plot
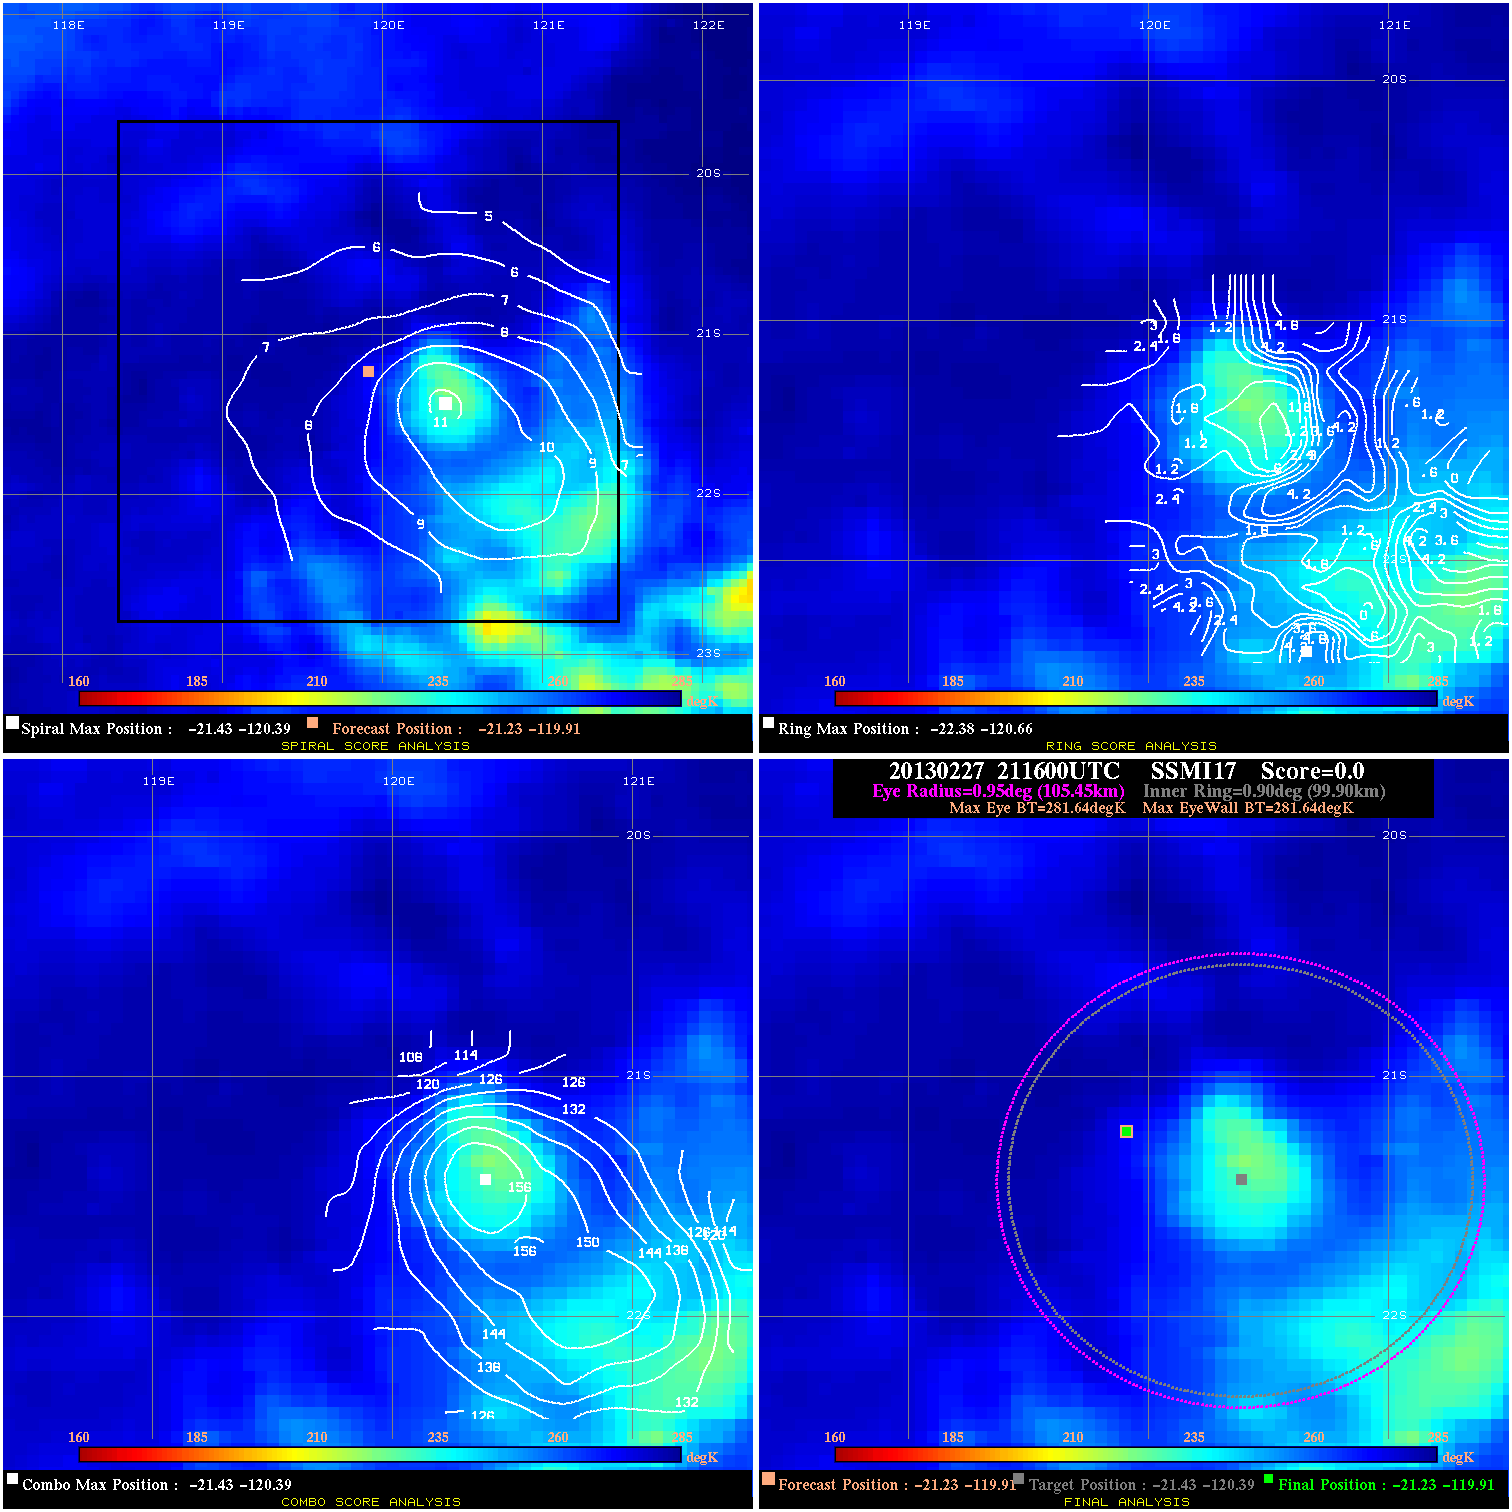
20130227 211600 N/A N/A N/A N/A N/A 75.0 SSMI17 -21.2 -119.9 -21.2 -119.9 -21.4 -120.4 Analysis Plot
20130227 213200 0.3 N/A 2.7% 199.98 .31 75.0 SSMI16 -21.3 -119.9 -21.3 -119.9 -21.6 -120.5 Analysis Plot
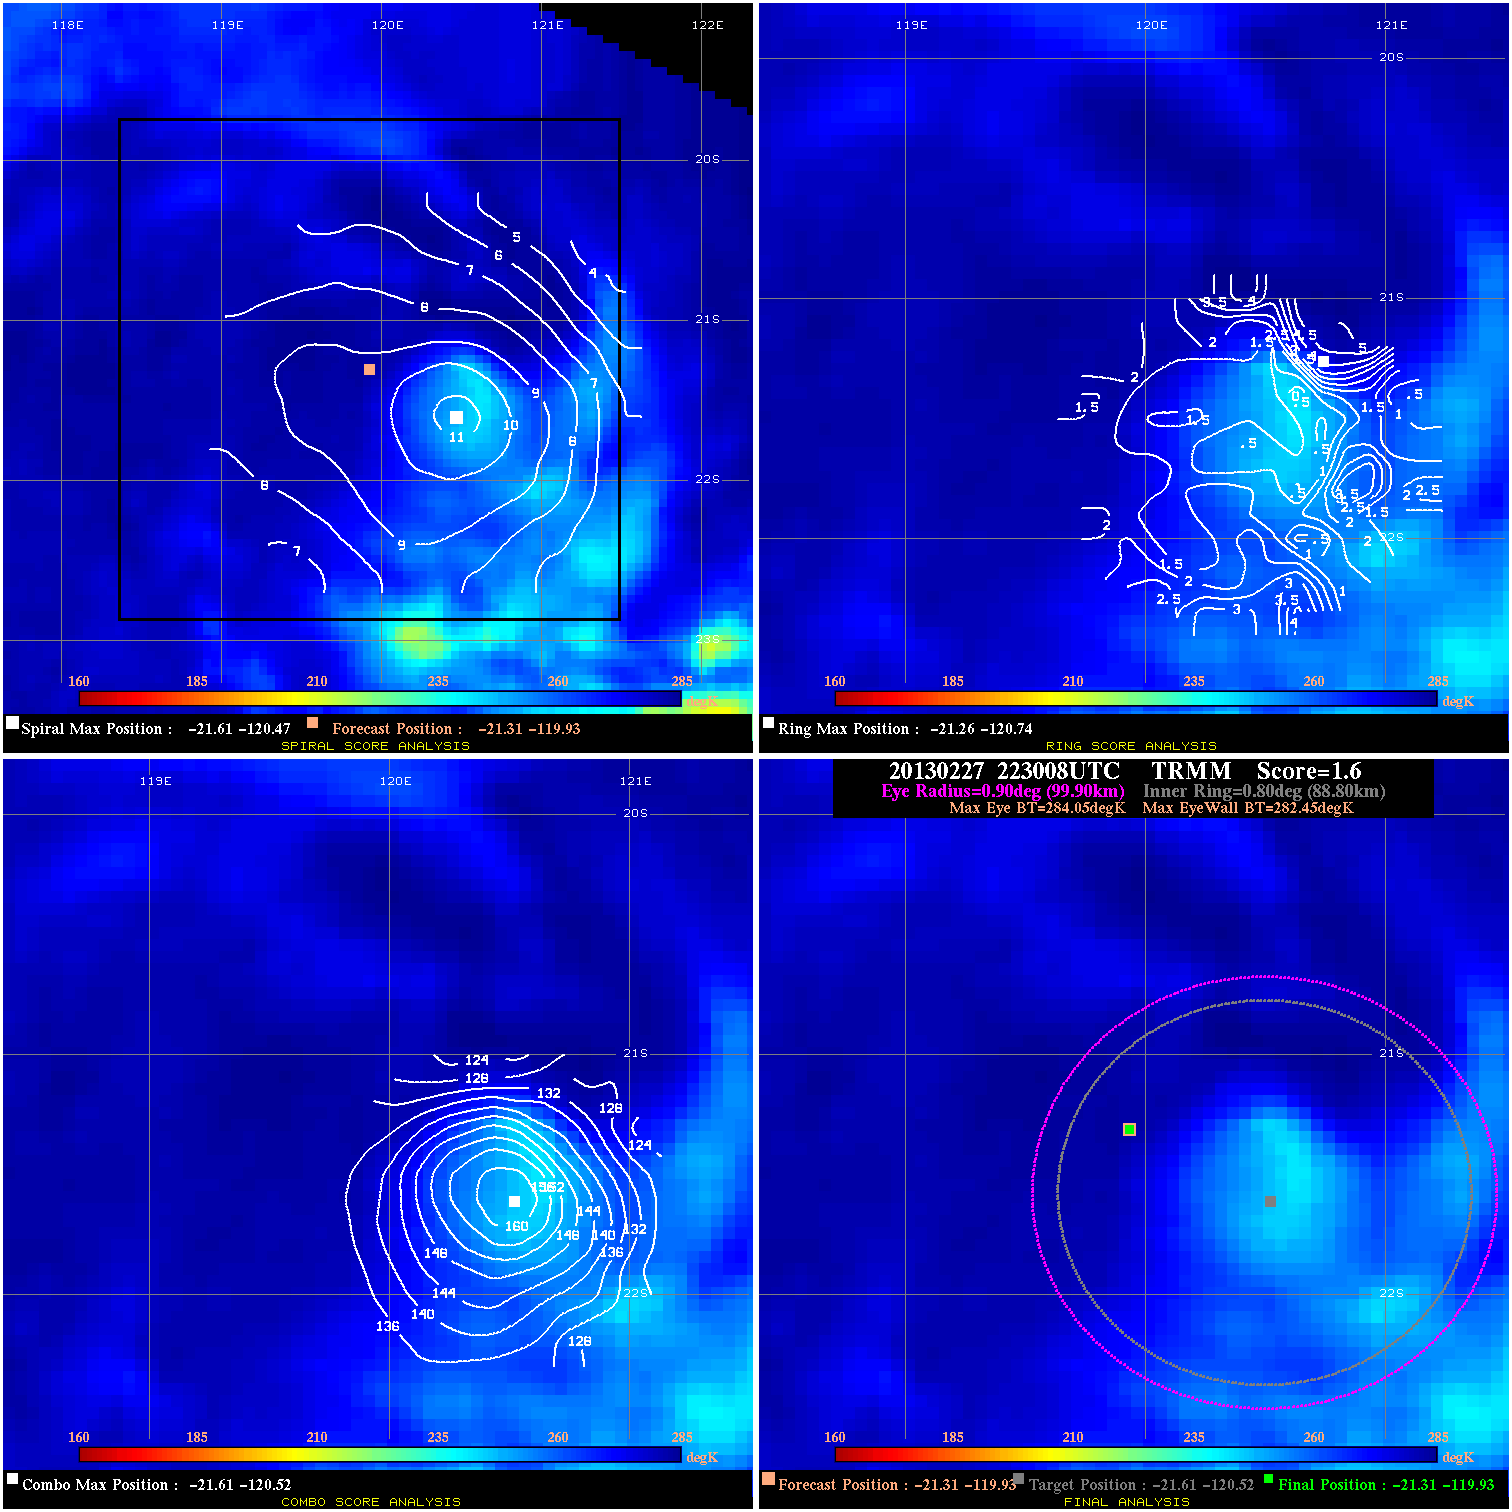
20130227 223008 1.6 N/A N/A 199.98 1.60 75.0 TRMM -21.3 -119.9 -21.3 -119.9 -21.6 -120.5 Analysis Plot
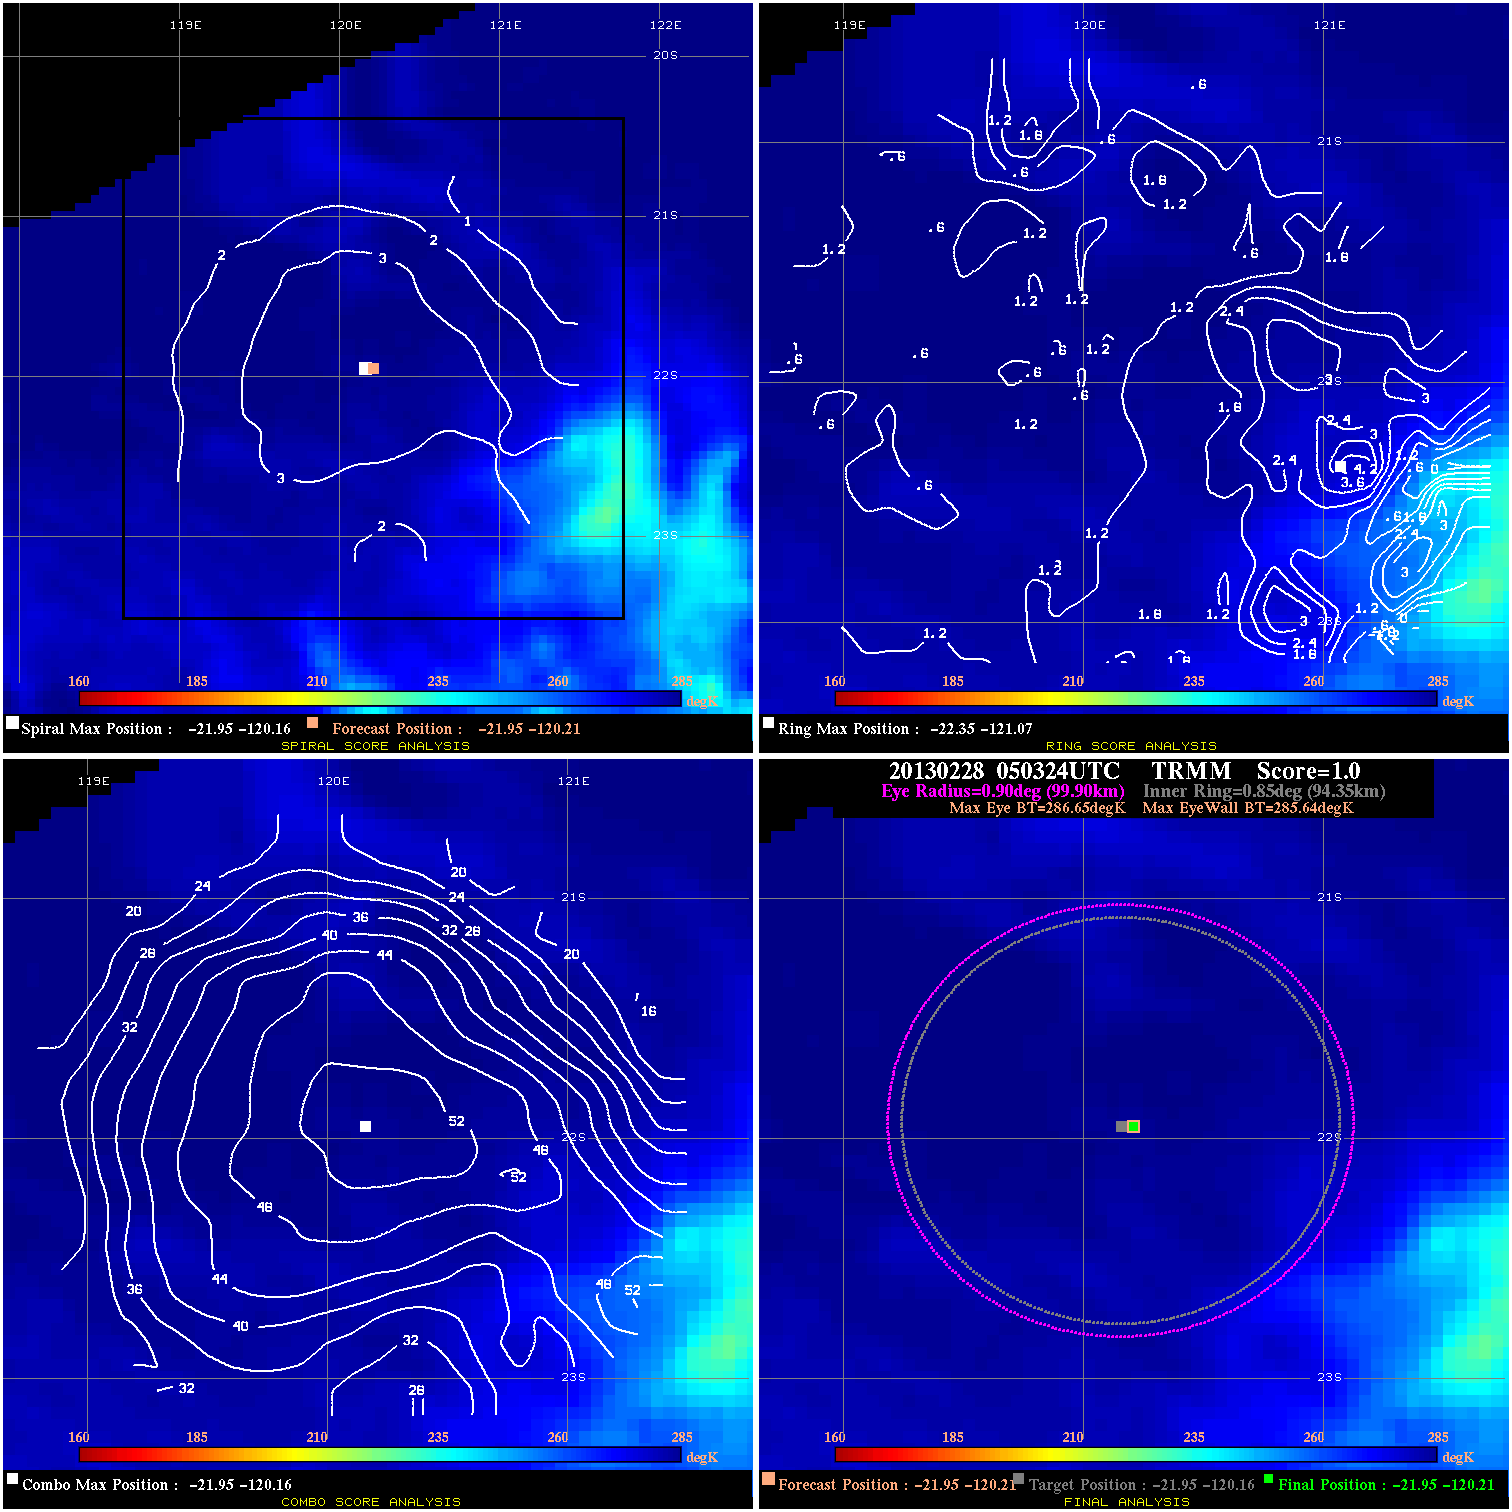
20130228 050324 1.0 N/A N/A 199.98 1.01 75.0 TRMM -21.9 -120.2 -21.9 -120.2 -21.9 -120.2 Analysis Plot
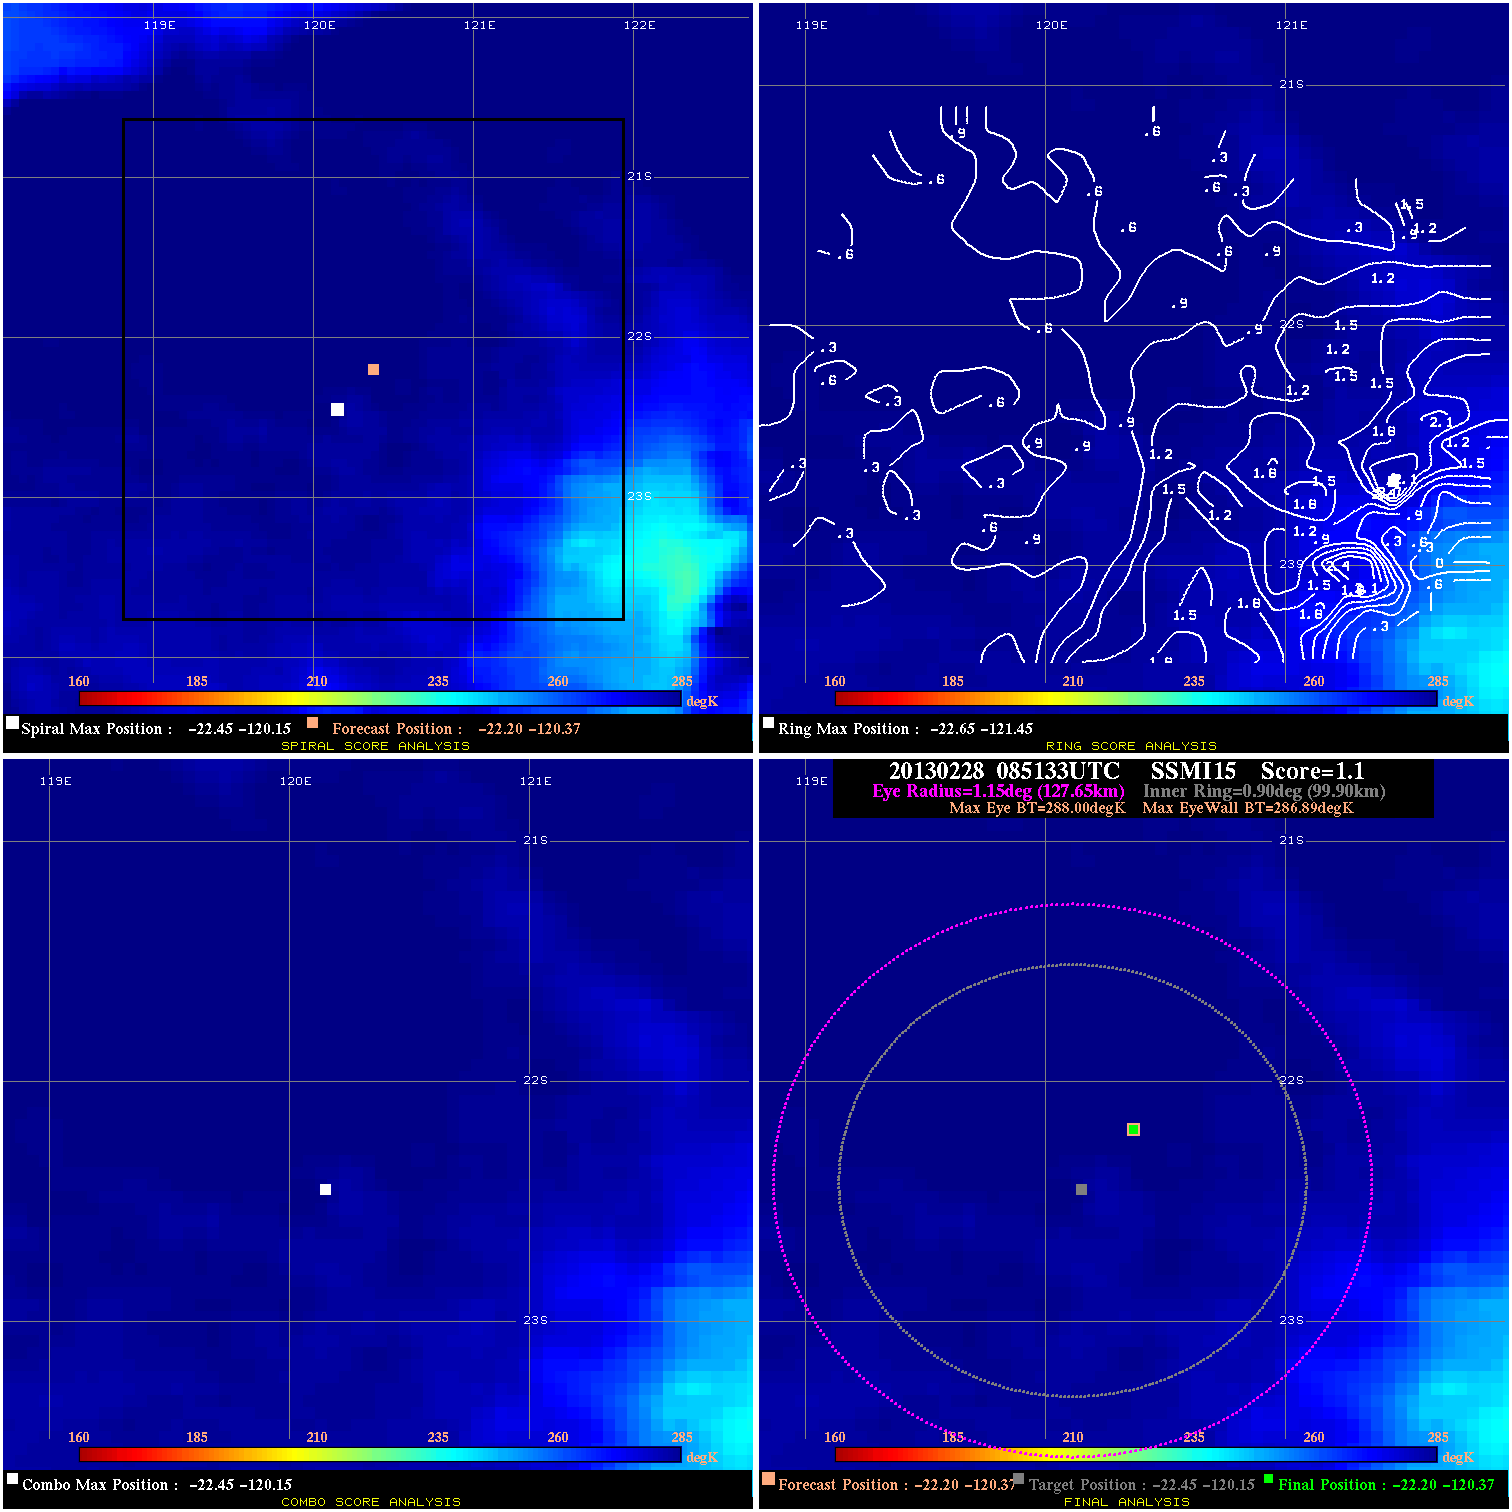
20130228 085133 1.1 N/A N/A 255.53 1.11 75.0 SSMI15 -22.2 -120.4 -22.2 -120.4 -22.4 -120.2 Analysis Plot
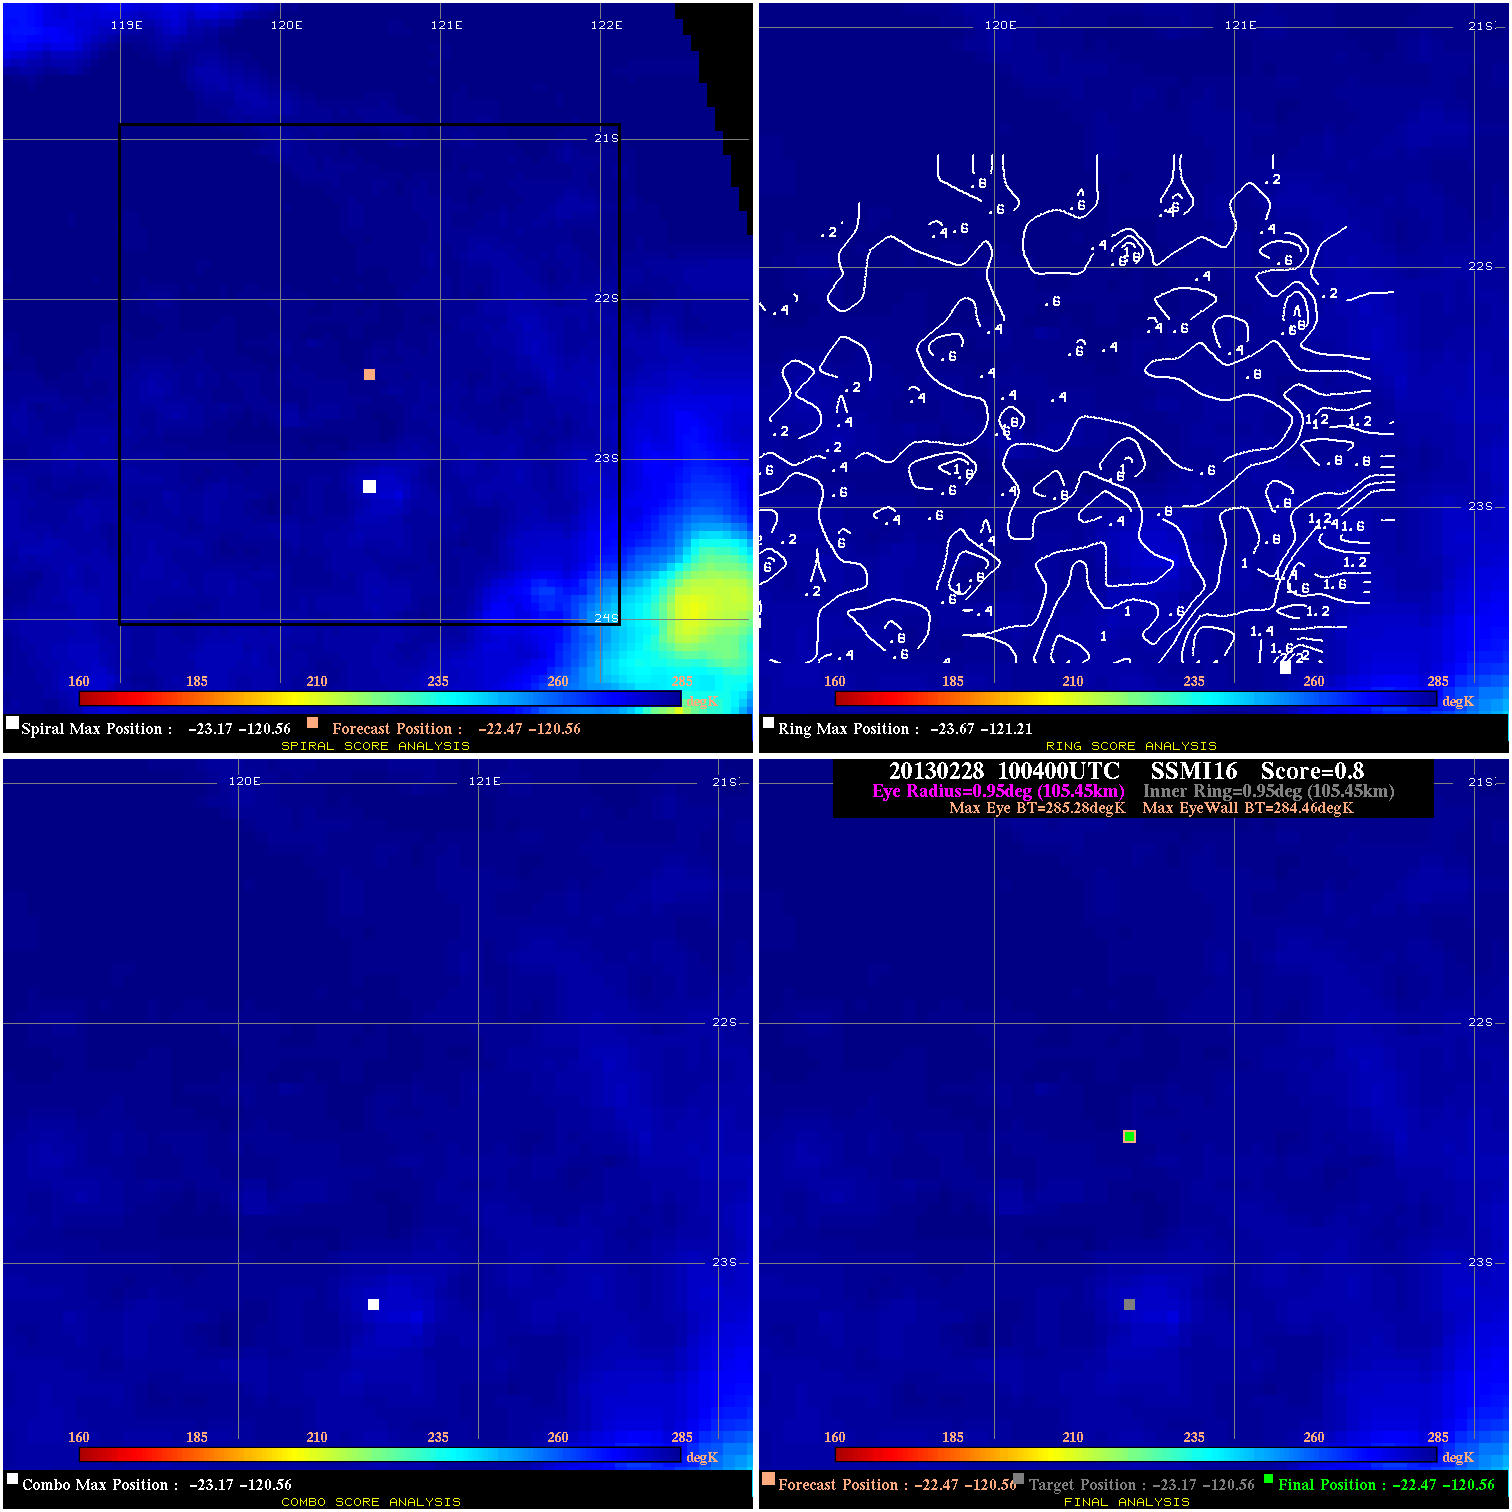
20130228 100400 0.8 N/A N/A 211.09 .82 75.0 SSMI16 -22.5 -120.6 -22.5 -120.6 -23.2 -120.6 Analysis Plot
|
|
Legend: - Date/Time are determined from PMW imagery at Forecast (initial guess) Lat/Lon position. - Positive/Negative Latitude = North/South Hemisphere; Longitude = Western/Eastern Hemisphere. - "Ring Diam" value indicates the estimated surface eyewall diameter in km (the MI eyewall edge diameter minus 10 km). - "Ring Pct" is the percentage of the "ring" (eyewall inner boundary) that is 1) colder than the "hot spot" (warmest eye pixel) in the eye by 20K, or 2) the percentage that is a) colder than 232K and b) colder than the "hot spot" by 10K, whichever is greater. - Values are red if Ring % <= 65, yellow/brown if Ring % <= 85 and green if Ring % > 85. - "Tb diff" is the difference between the "hot spot" (warmest eye pixel) and the warmest pixel on the eyewall. - Intensity score are listed as negative, and not used, when the JTWC or NHC estimated Vmax is <50 kts in order to rule out weak but highly symmetric TCs. - Error messages in intensity scores: -920 is used when the hottest pixel in the eye is <200K, to prevent false positives; -909 is a failure to process (bad input data). |