Tropical Storm 15E
|
Passive Microwave (PMW) Intensity Information Advanced Dvorak Technique (ADT) Version 8.2.1 |
Overpass Inten Ring Ring Wind Forecast Final Target
Date Time Score Meaning Pct Diam BTdiff Est Sat Lat Lon Lat Lon Lat Lon
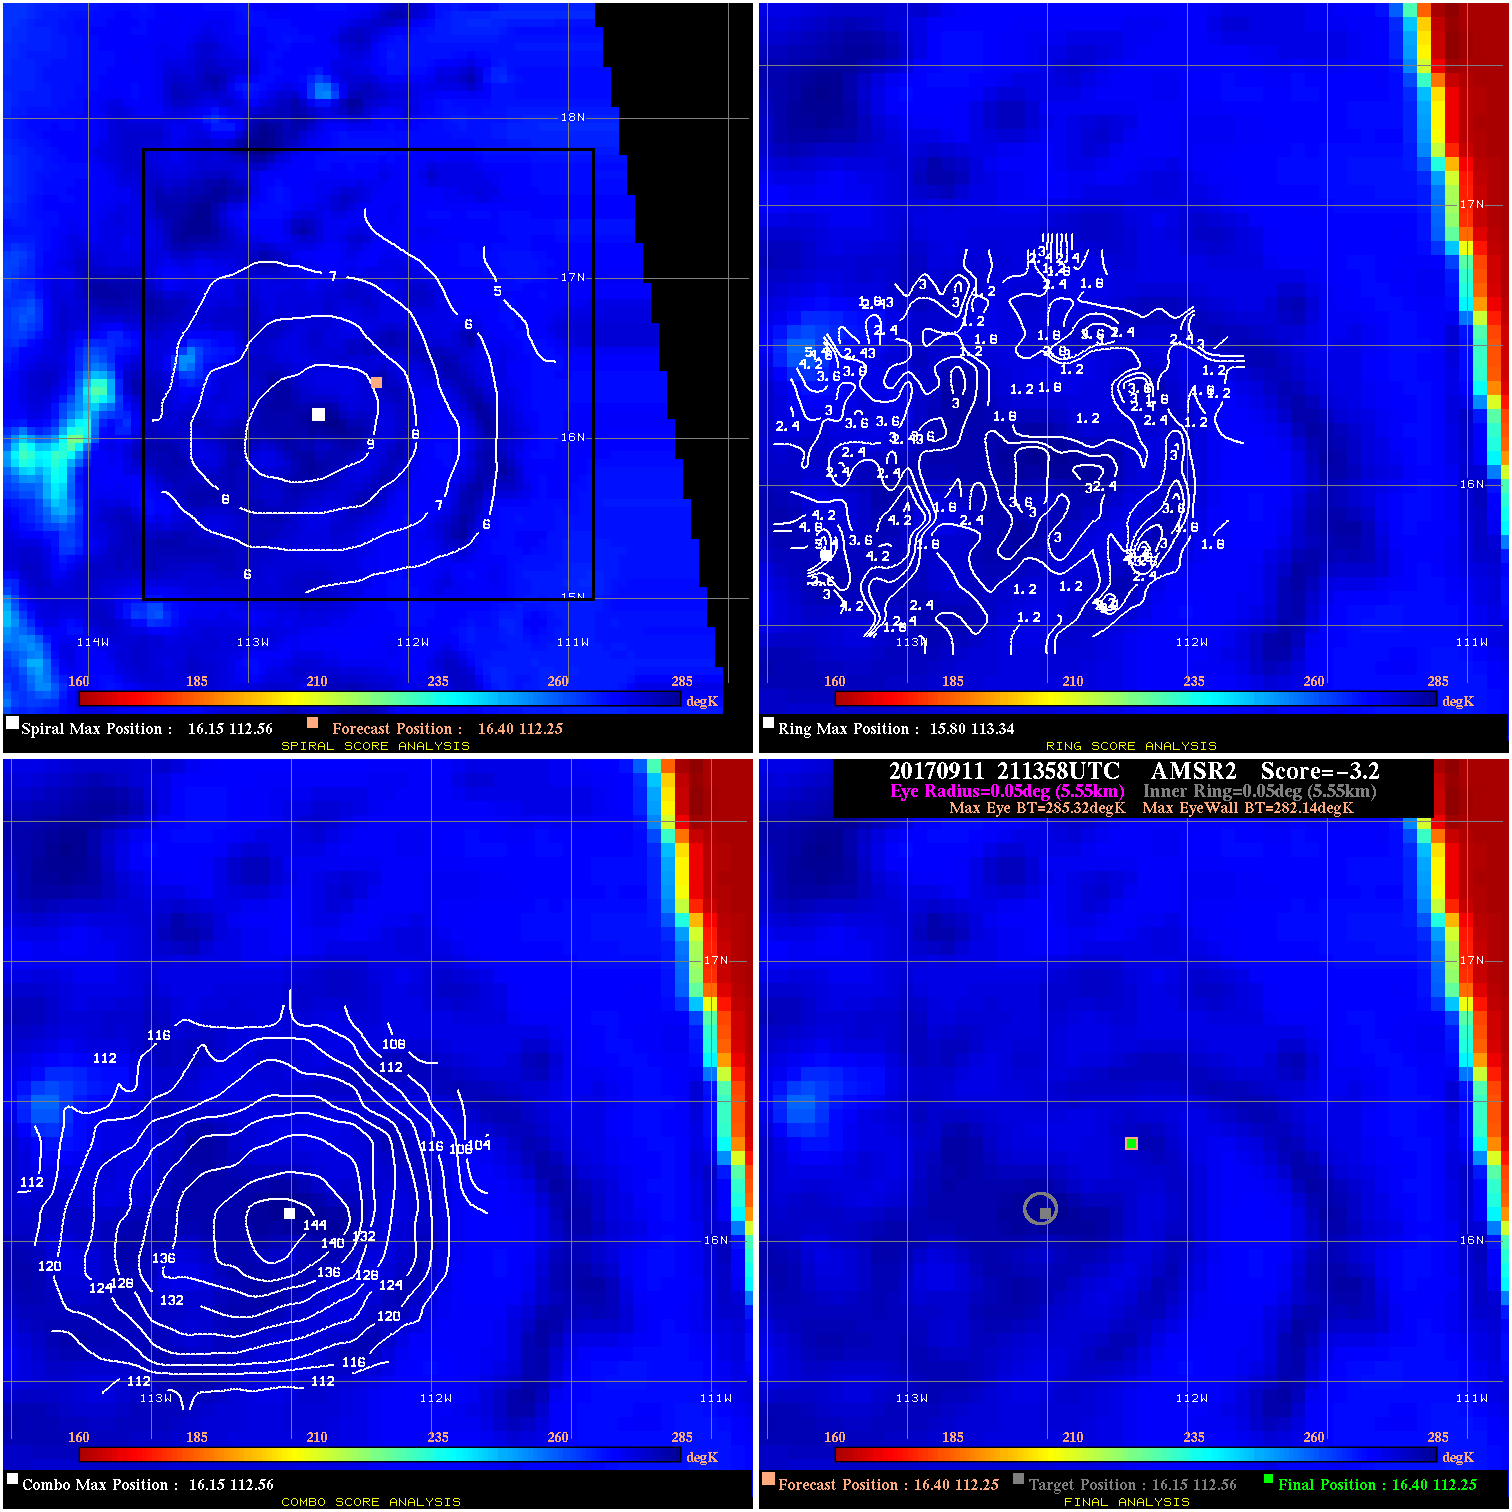
20170911 211358 -3.2 N/A N/A 11.11 3.18 25.0 AMSR2 16.4 112.3 16.4 112.3 16.1 112.6 Analysis Plot
20170912 015500 -2.0 N/A 26.0% 55.55 2.04 25.0 SSMI17 16.3 113.2 16.3 113.2 16.4 114.0 Analysis Plot
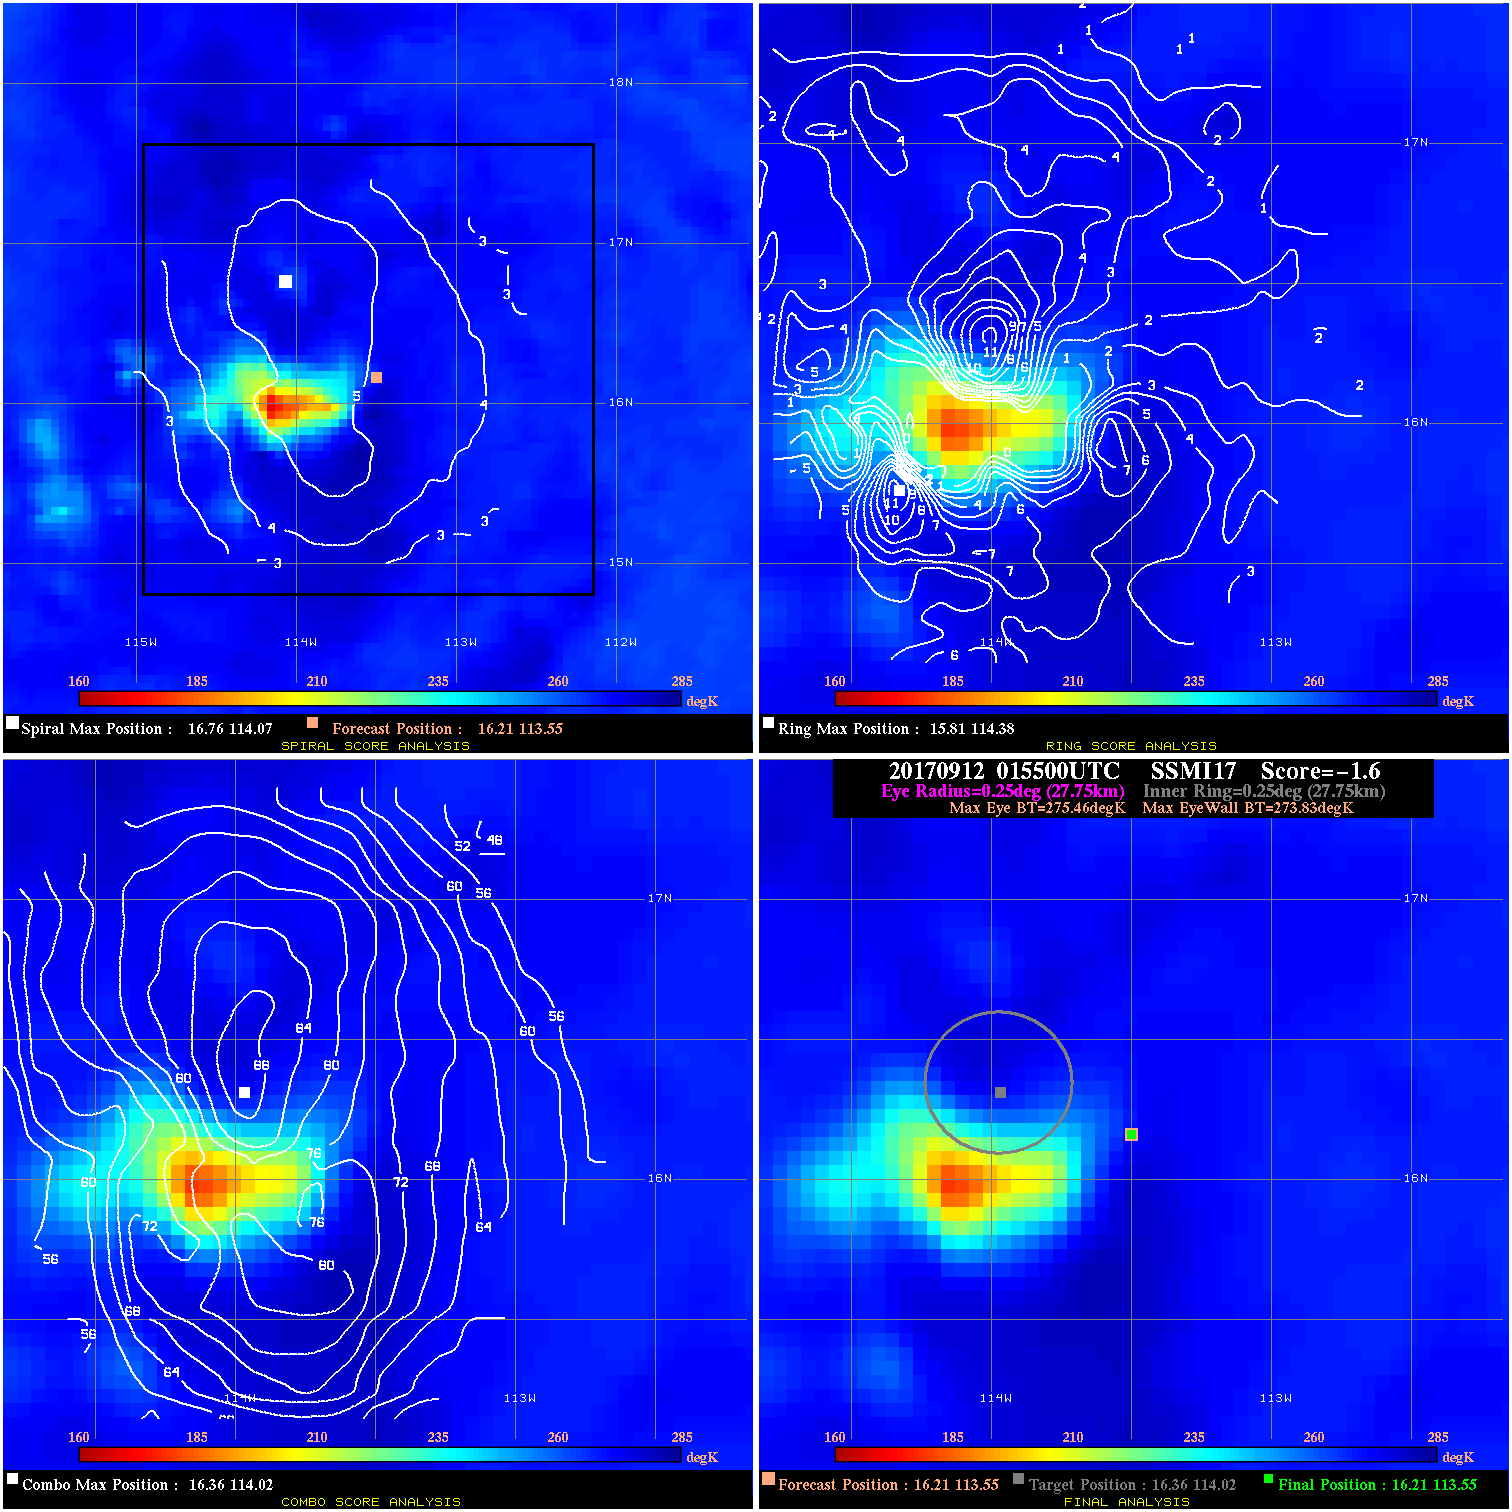
20170912 015500 -1.6 N/A 26.0% 55.55 1.63 25.0 SSMI17 16.2 113.6 16.2 113.6 16.4 114.0 Analysis Plot
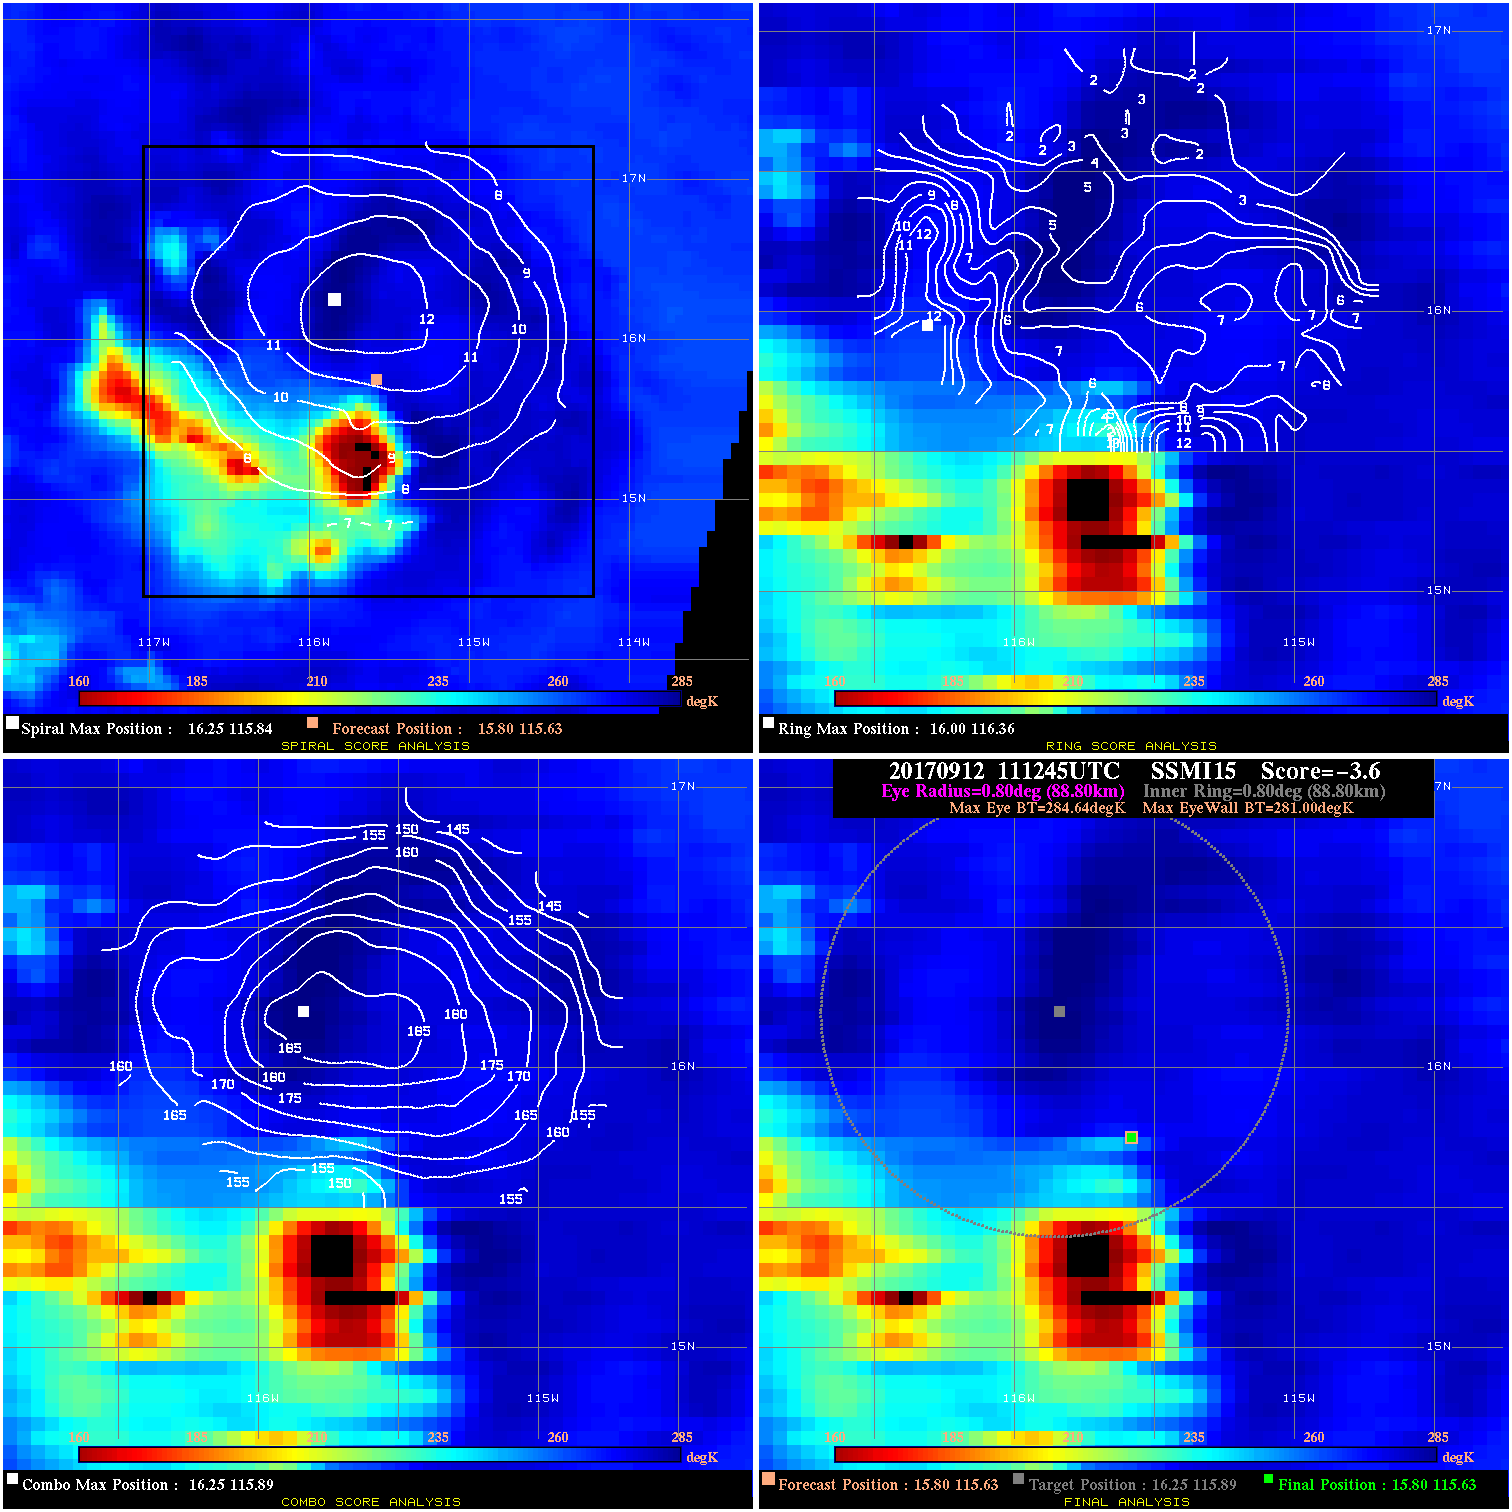
20170912 111245 -3.6 N/A 11.0% 177.76 3.64 25.0 SSMI15 15.8 115.6 15.8 115.6 16.3 115.9 Analysis Plot
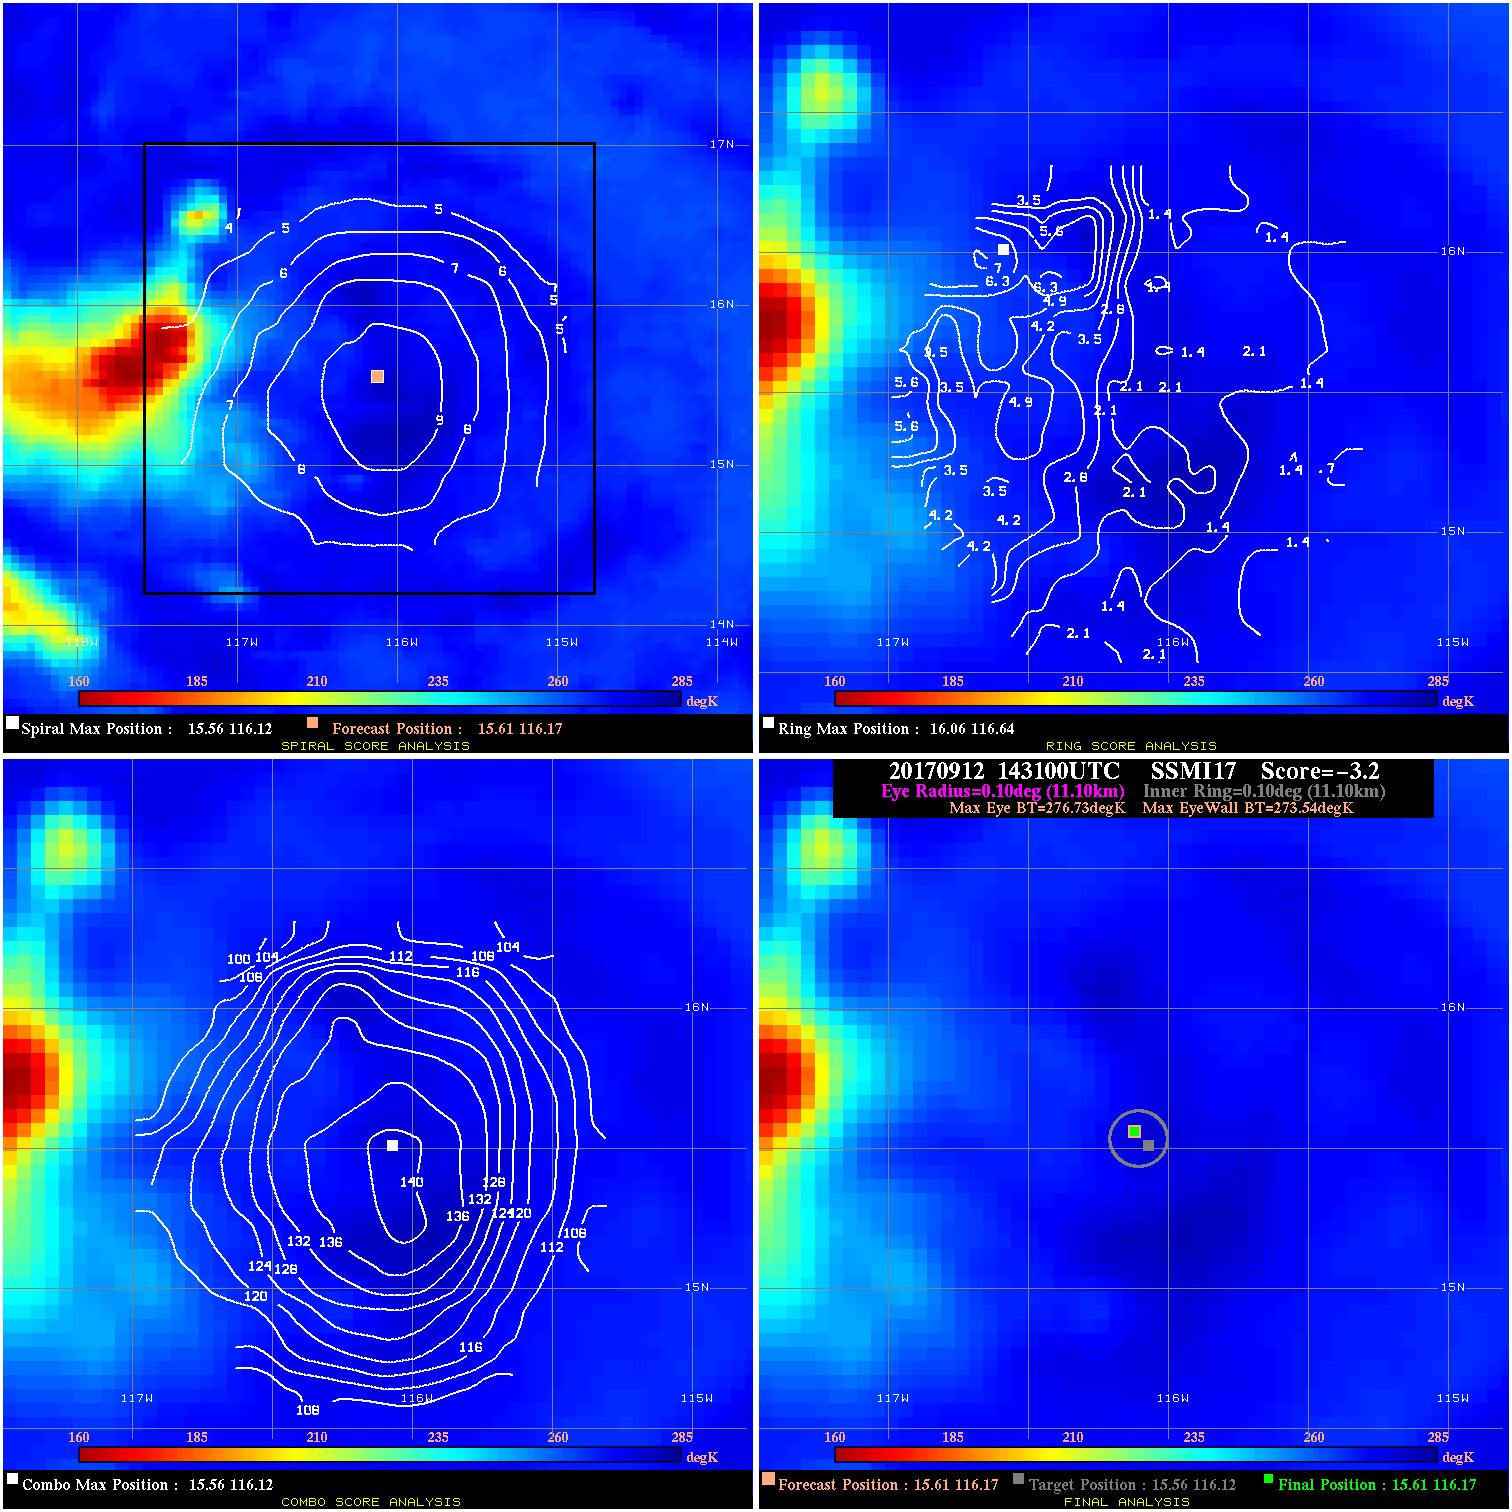
20170912 143100 -3.2 N/A N/A 22.22 3.19 30.0 SSMI17 15.6 116.2 15.6 116.2 15.6 116.1 Analysis Plot
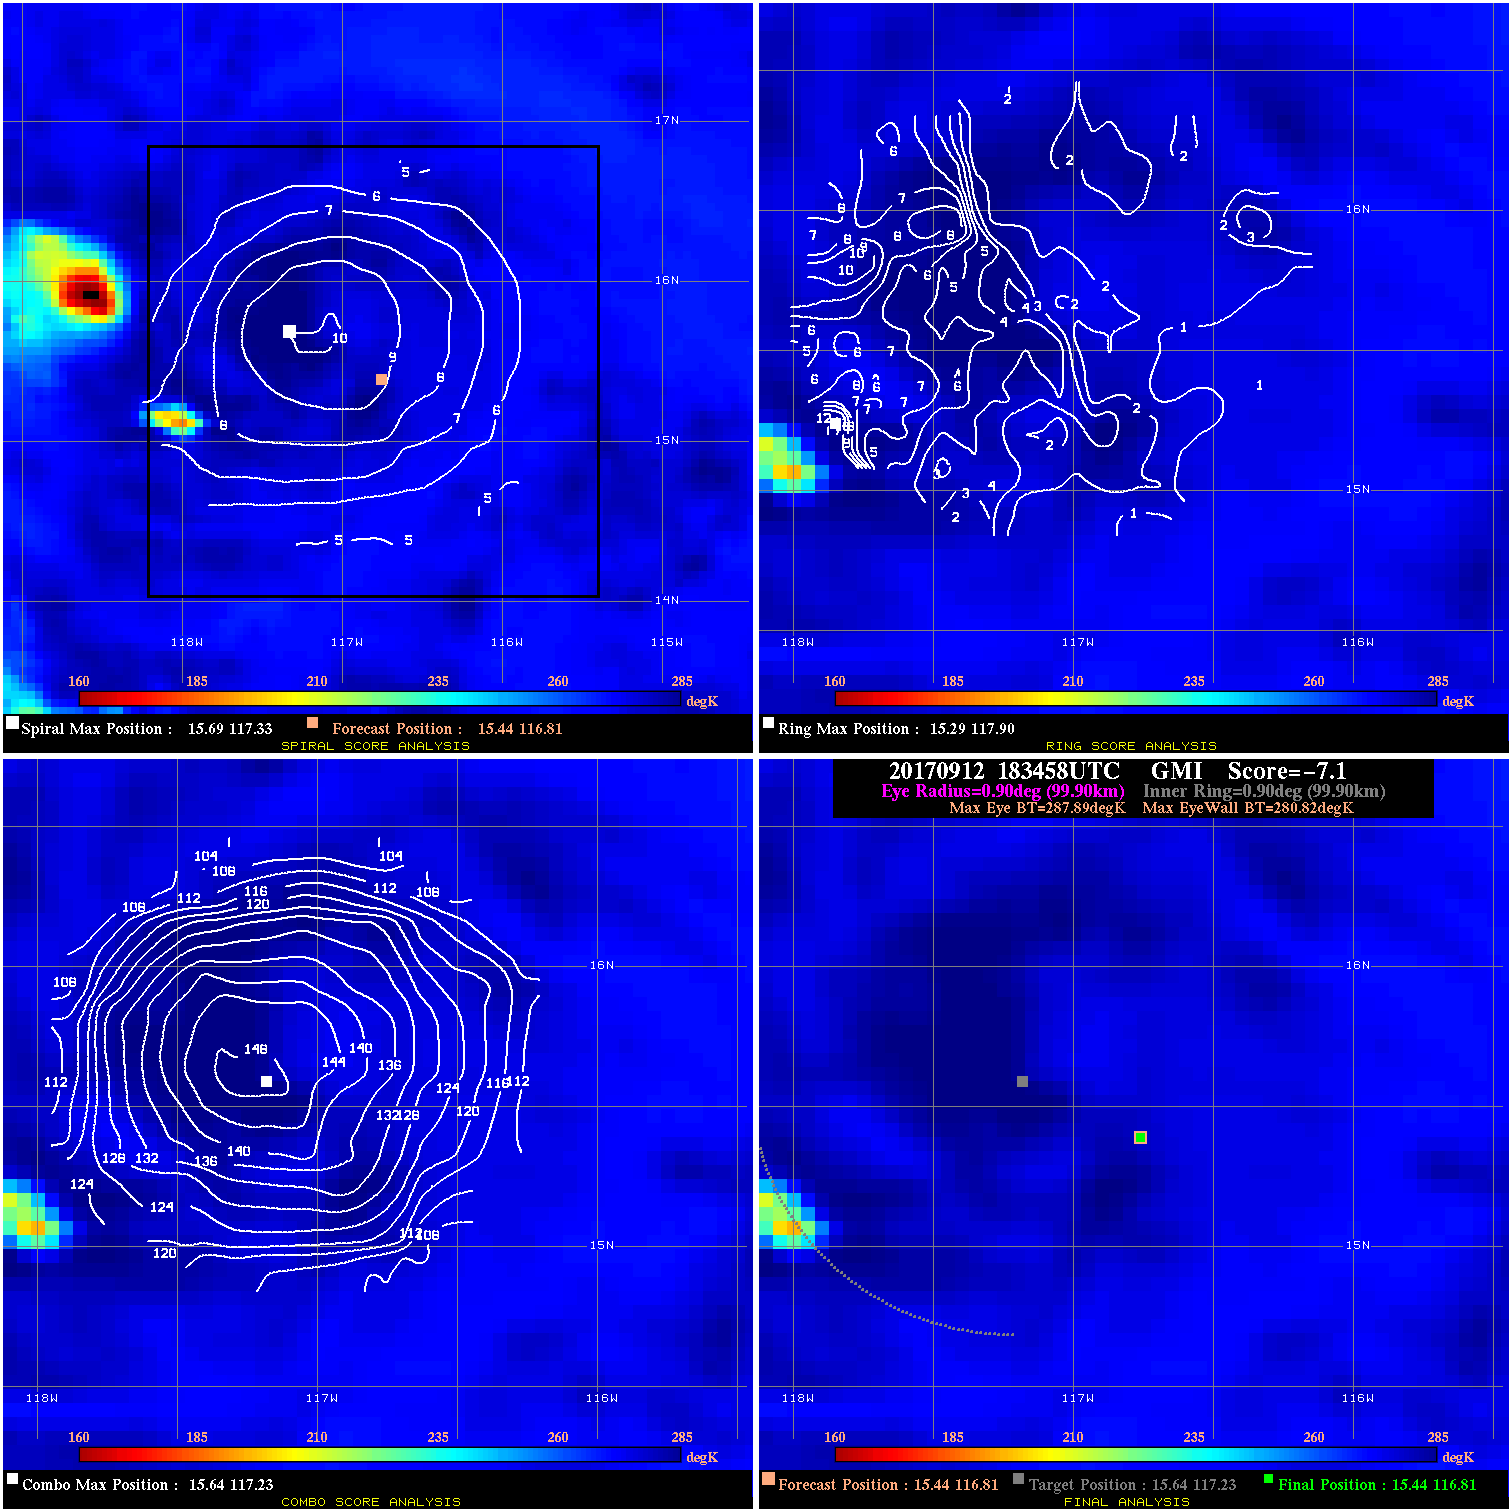
20170912 183458 -7.1 N/A 4.1% 199.98 7.07 30.0 GMI 15.4 116.8 15.4 116.8 15.6 117.2 Analysis Plot
20170913 023000 -3.1 N/A 8.2% 144.43 3.05 30.0 SSMI18 15.4 118.4 15.4 118.4 14.9 118.5 Analysis Plot
20170913 023000 -930.0 N/A N/A N/A 0.00 30.0 SSMI18 15.4 118.6 15.4 118.6 15.8 118.8 Analysis Plot
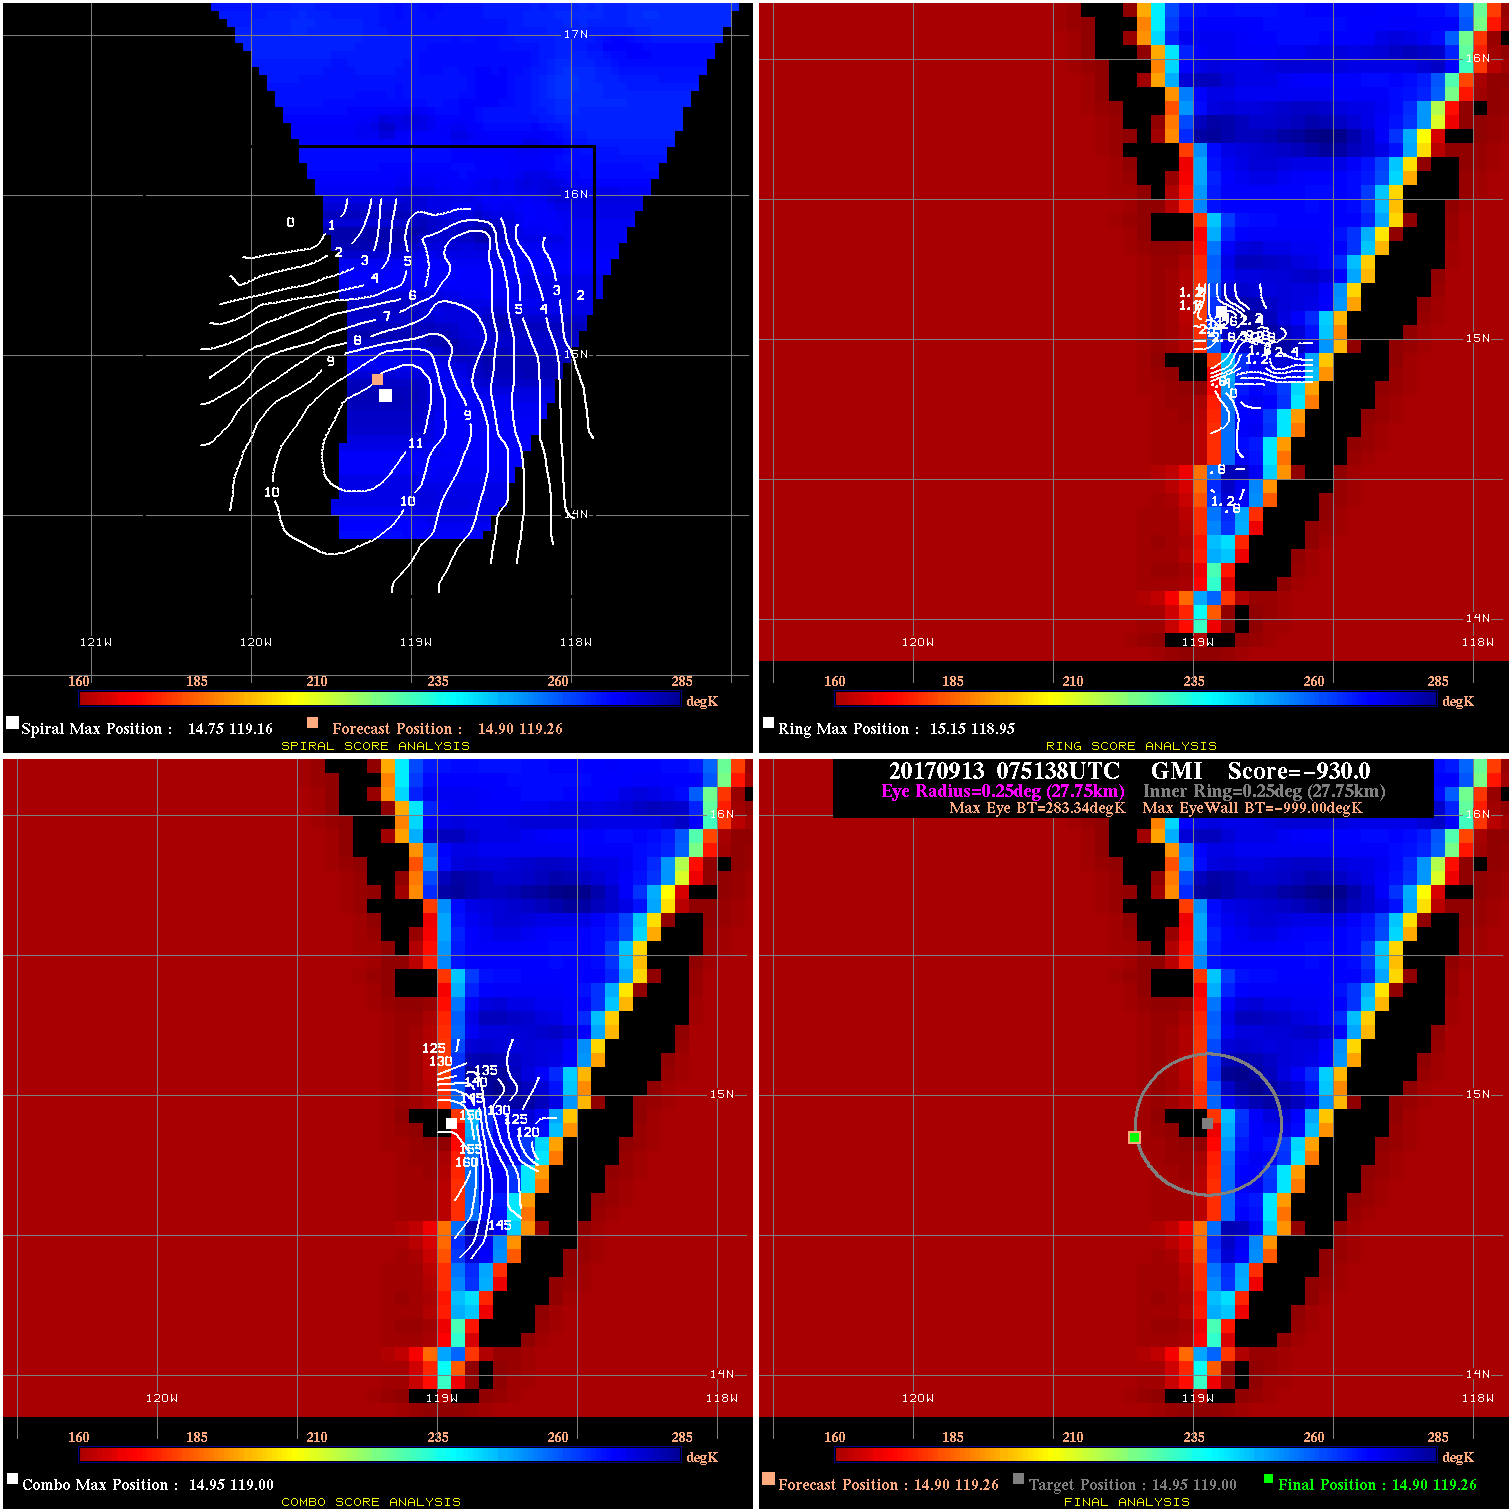
20170913 075138 -930.0 N/A N/A N/A 0.00 30.0 GMI 14.9 119.3 14.9 119.3 14.9 119.0 Analysis Plot
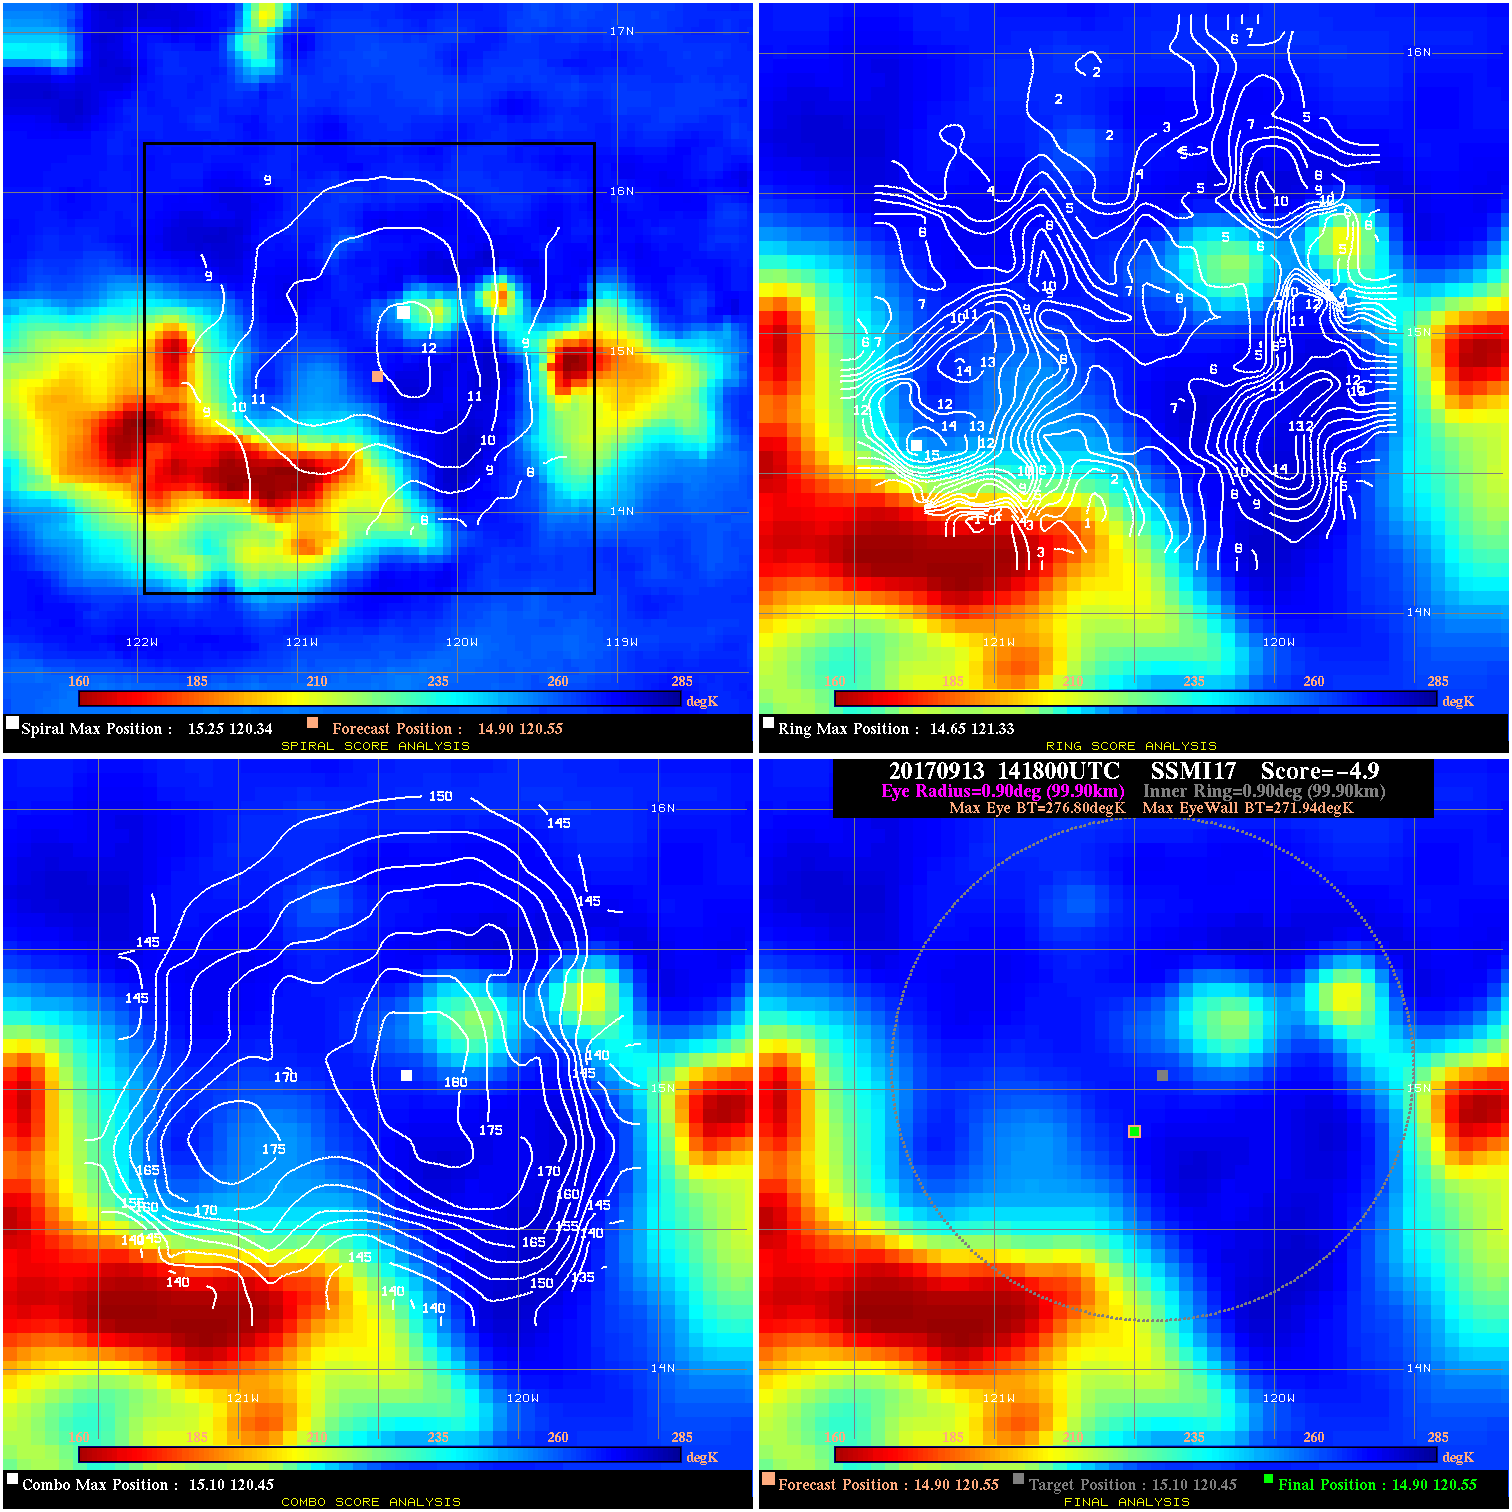
20170913 141800 -4.9 N/A 27.4% 199.98 4.86 30.0 SSMI17 14.9 120.6 14.9 120.6 15.1 120.4 Analysis Plot
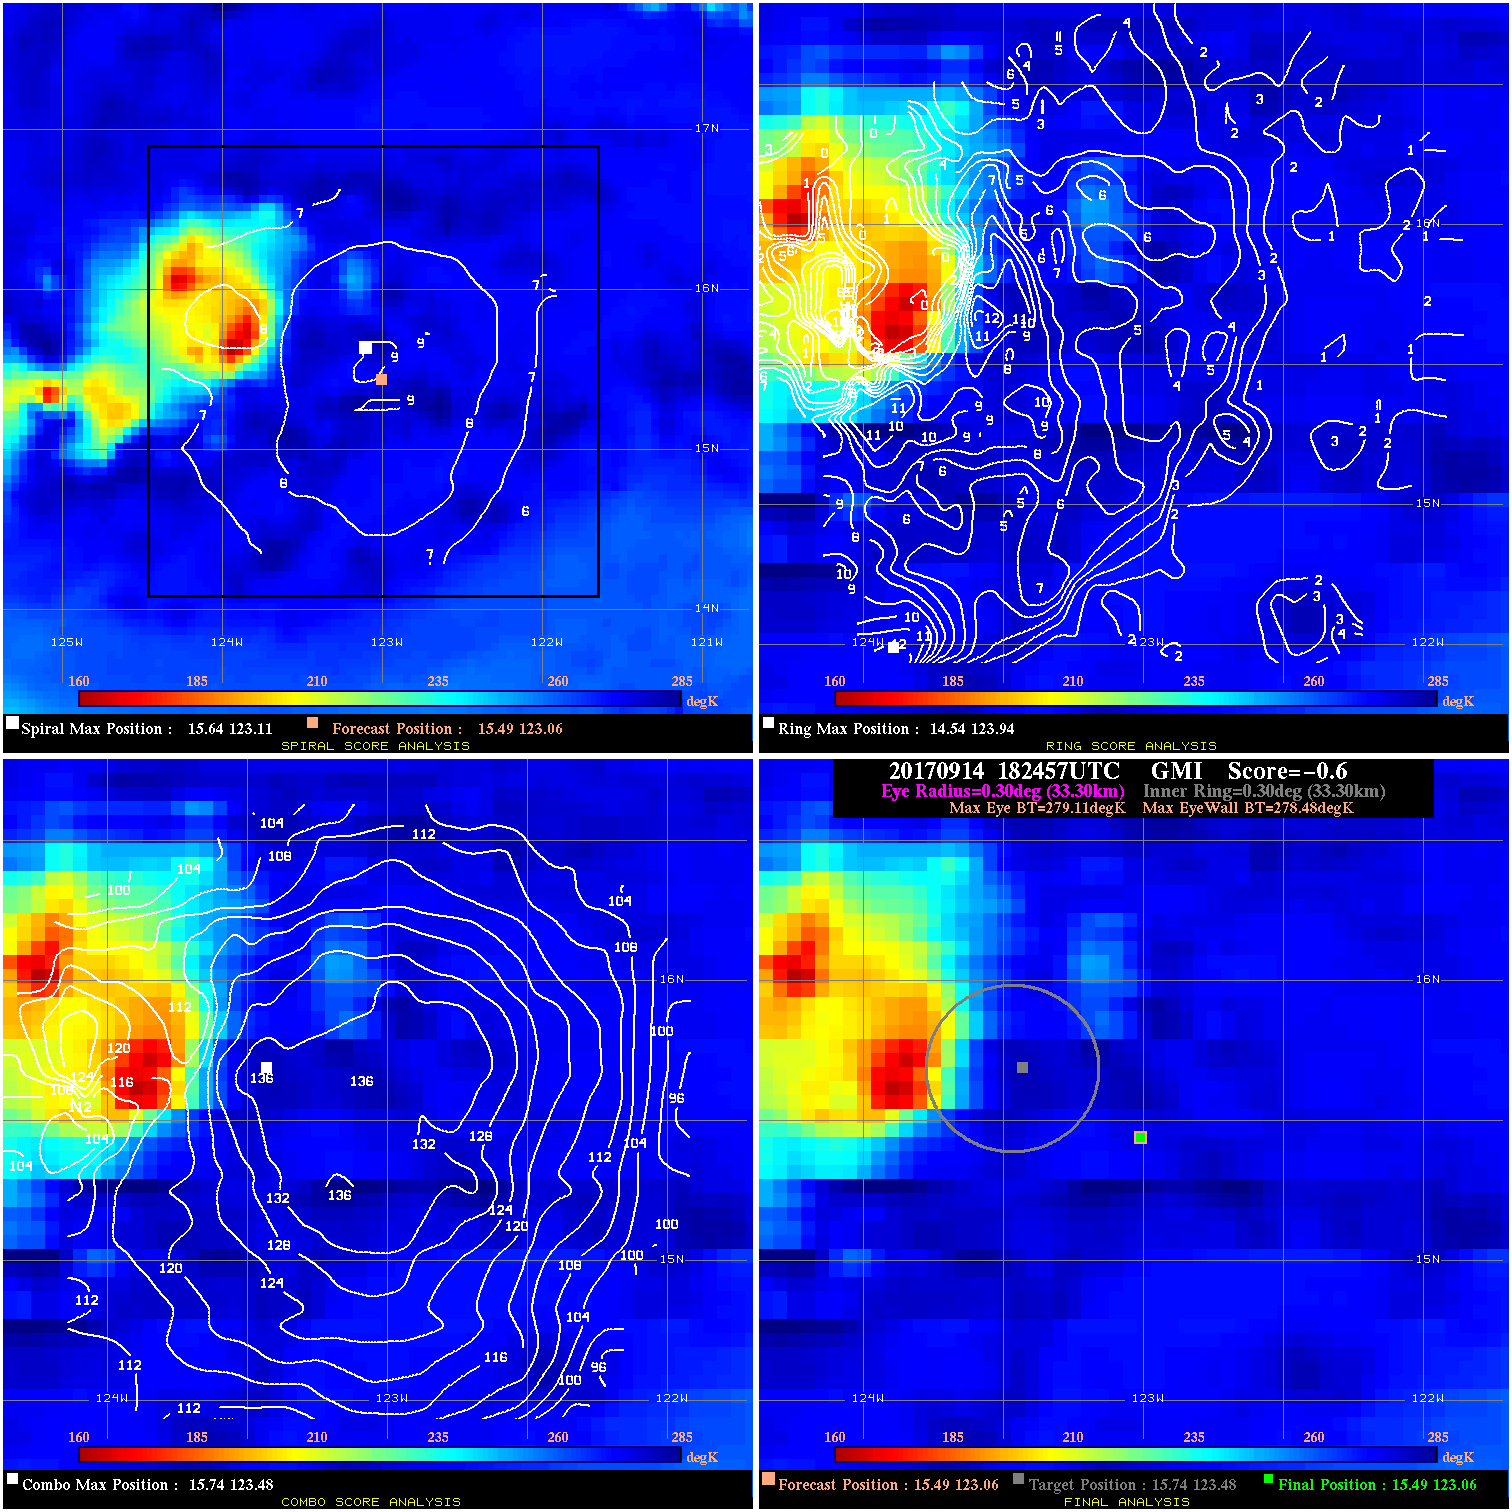
20170914 182457 -0.6 N/A 20.5% 66.66 .63 30.0 GMI 15.5 123.1 15.5 123.1 15.7 123.5 Analysis Plot
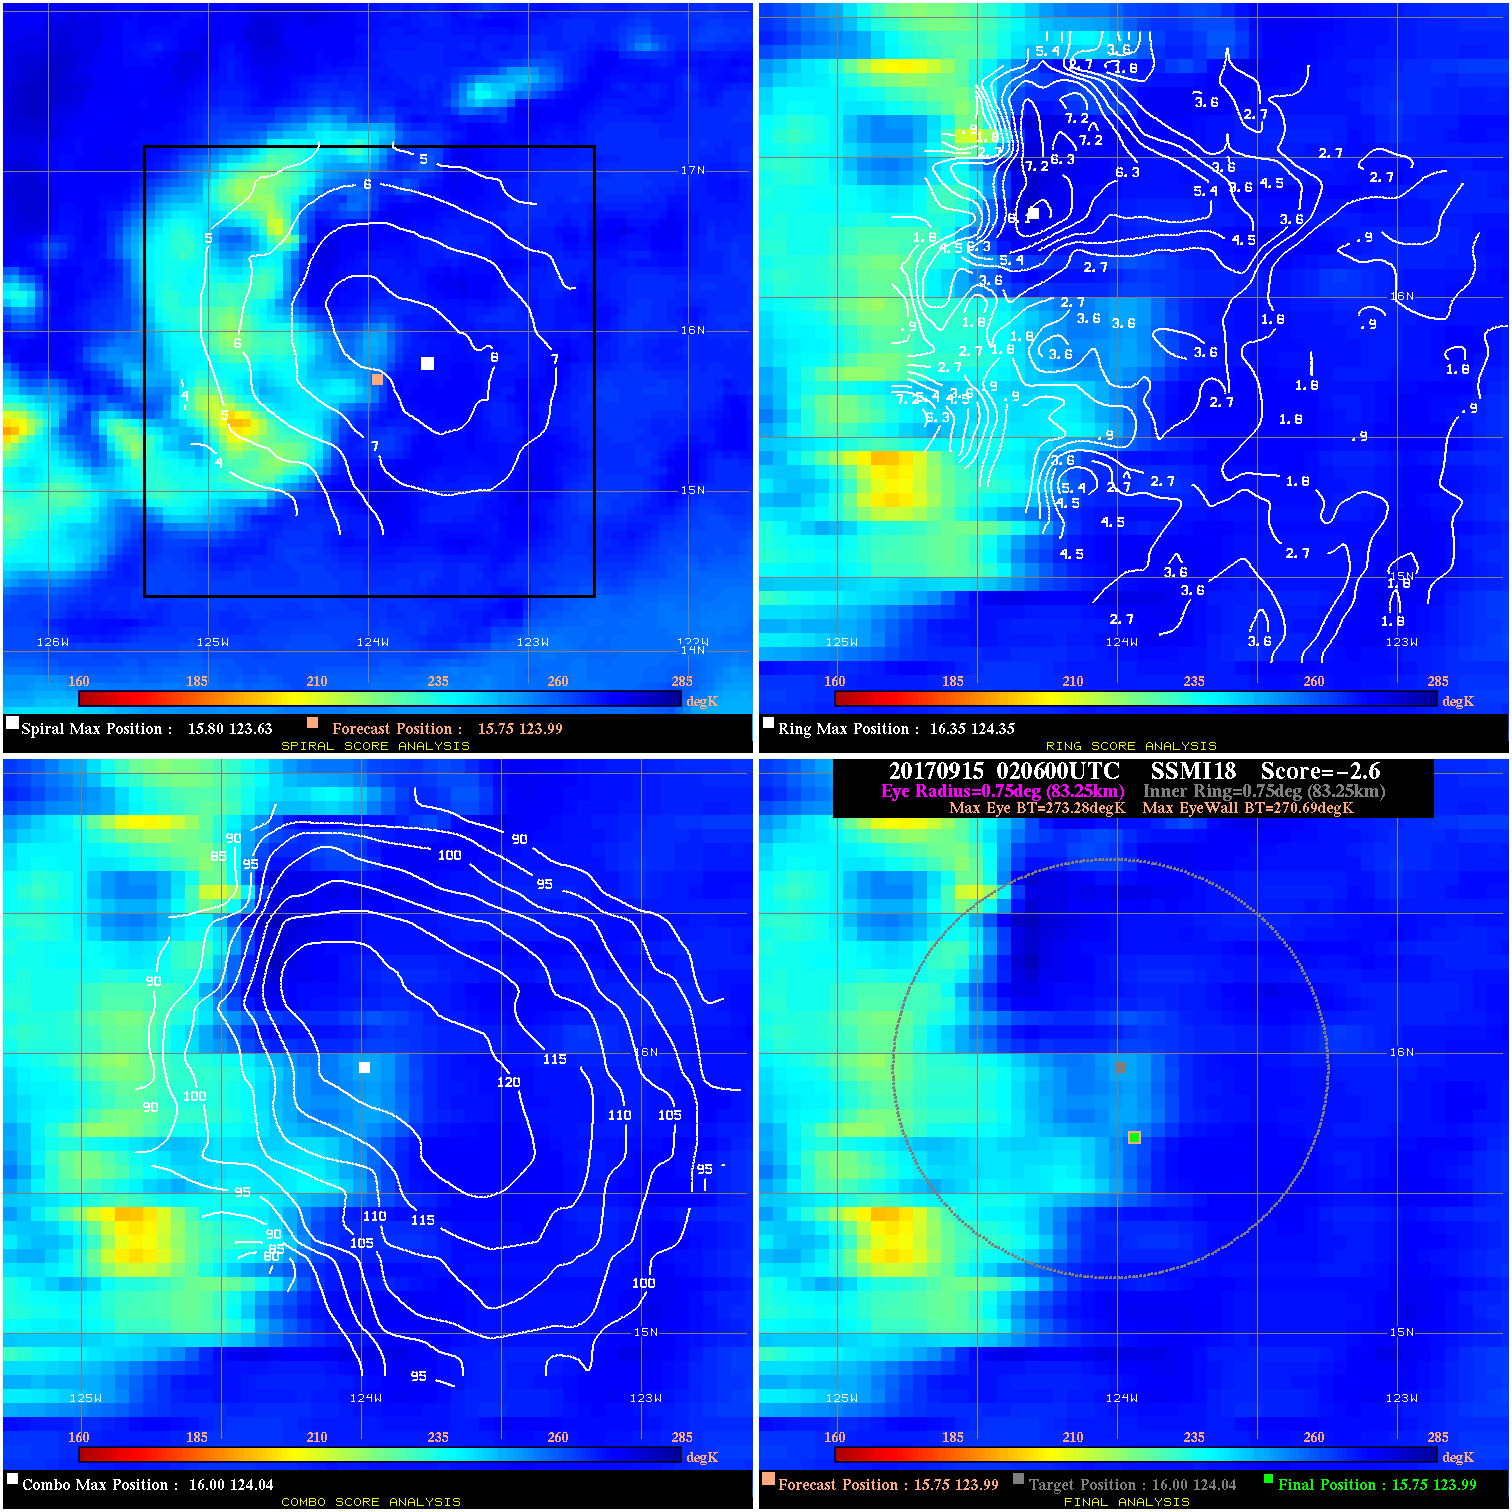
20170915 020600 -2.6 N/A 12.3% 166.65 2.59 30.0 SSMI18 15.8 124.0 15.8 124.0 16.0 124.0 Analysis Plot
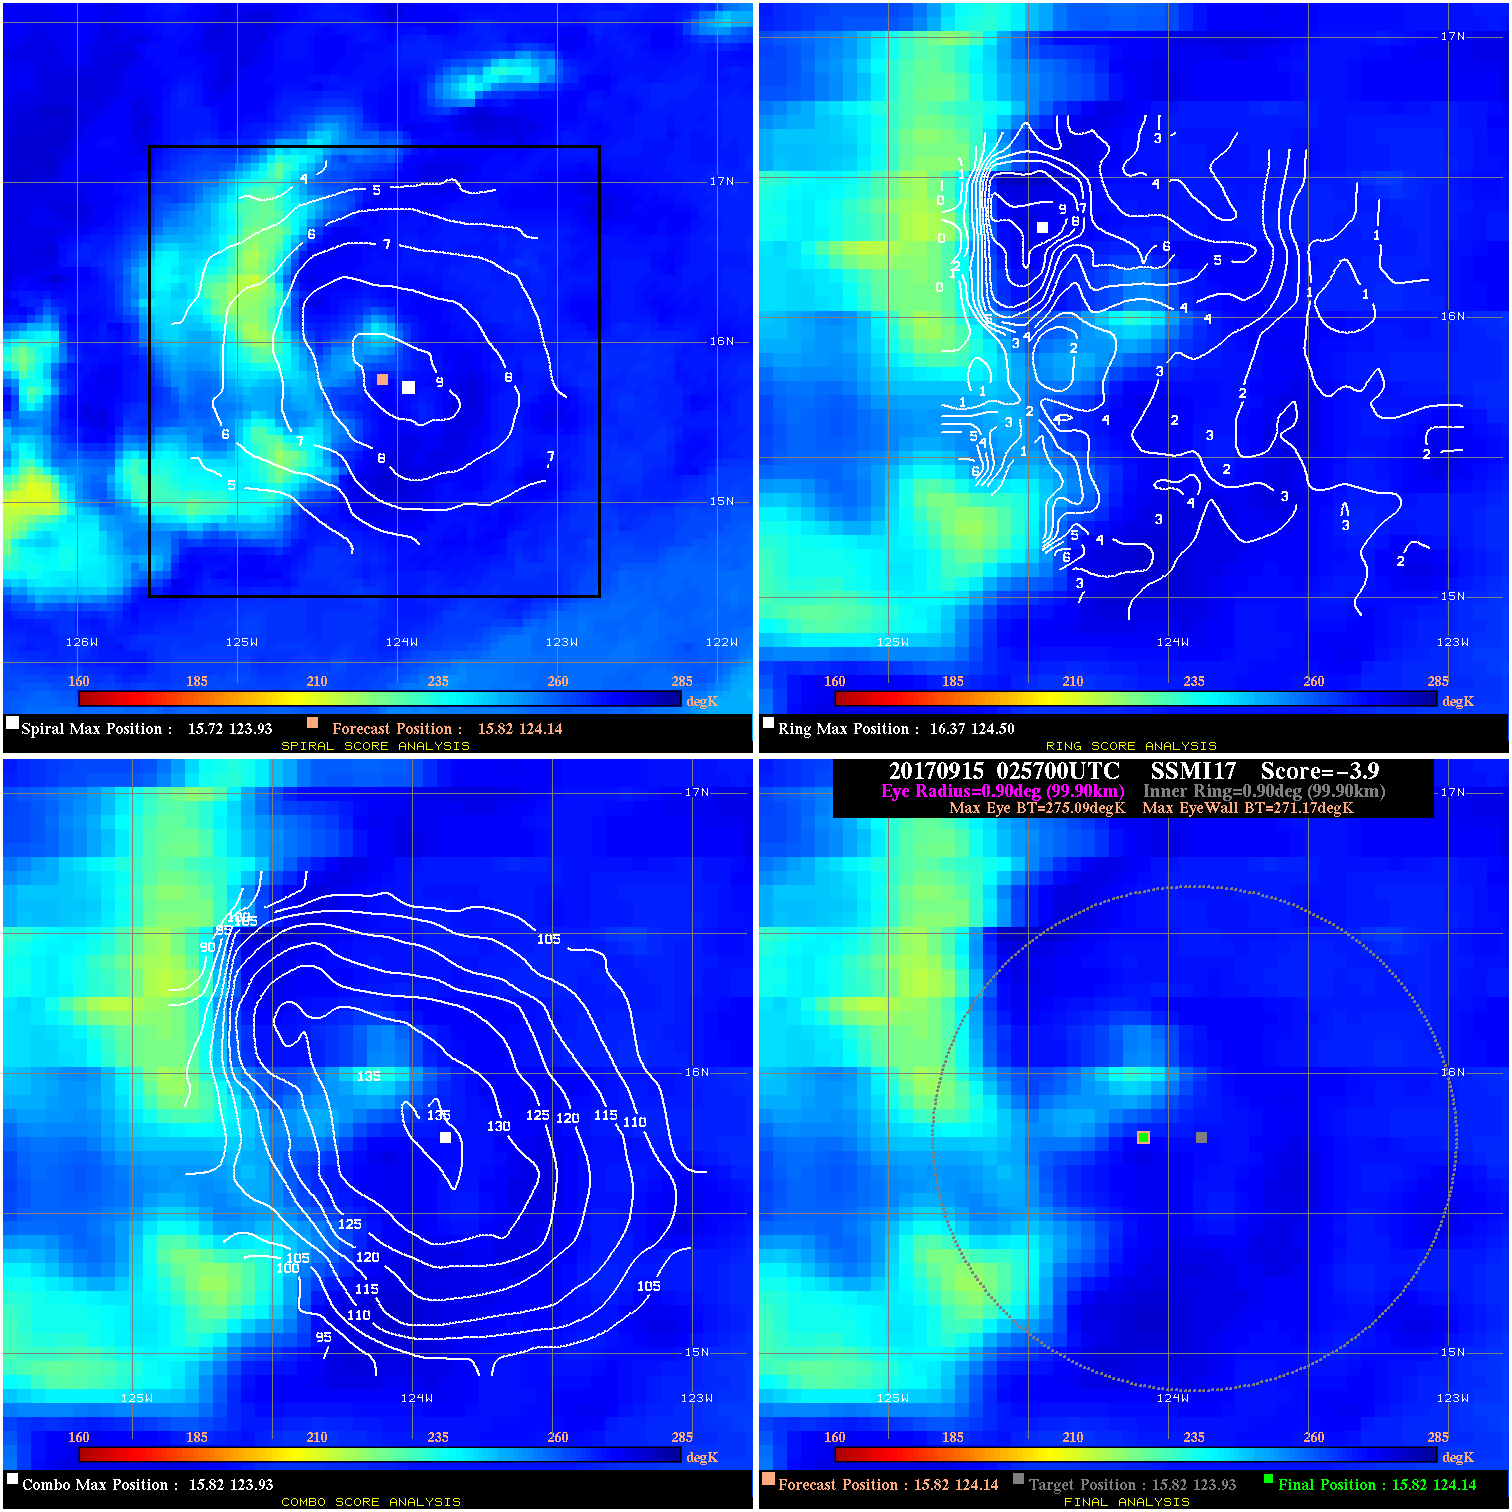
20170915 025700 -4.0 N/A 8.2% 199.98 3.97 30.0 SSMI17 15.8 124.0 15.8 124.0 15.8 123.9 Analysis Plot
20170915 025700 -3.9 N/A 8.2% 199.98 3.92 30.0 SSMI17 15.8 124.1 15.8 124.1 15.8 123.9 Analysis Plot
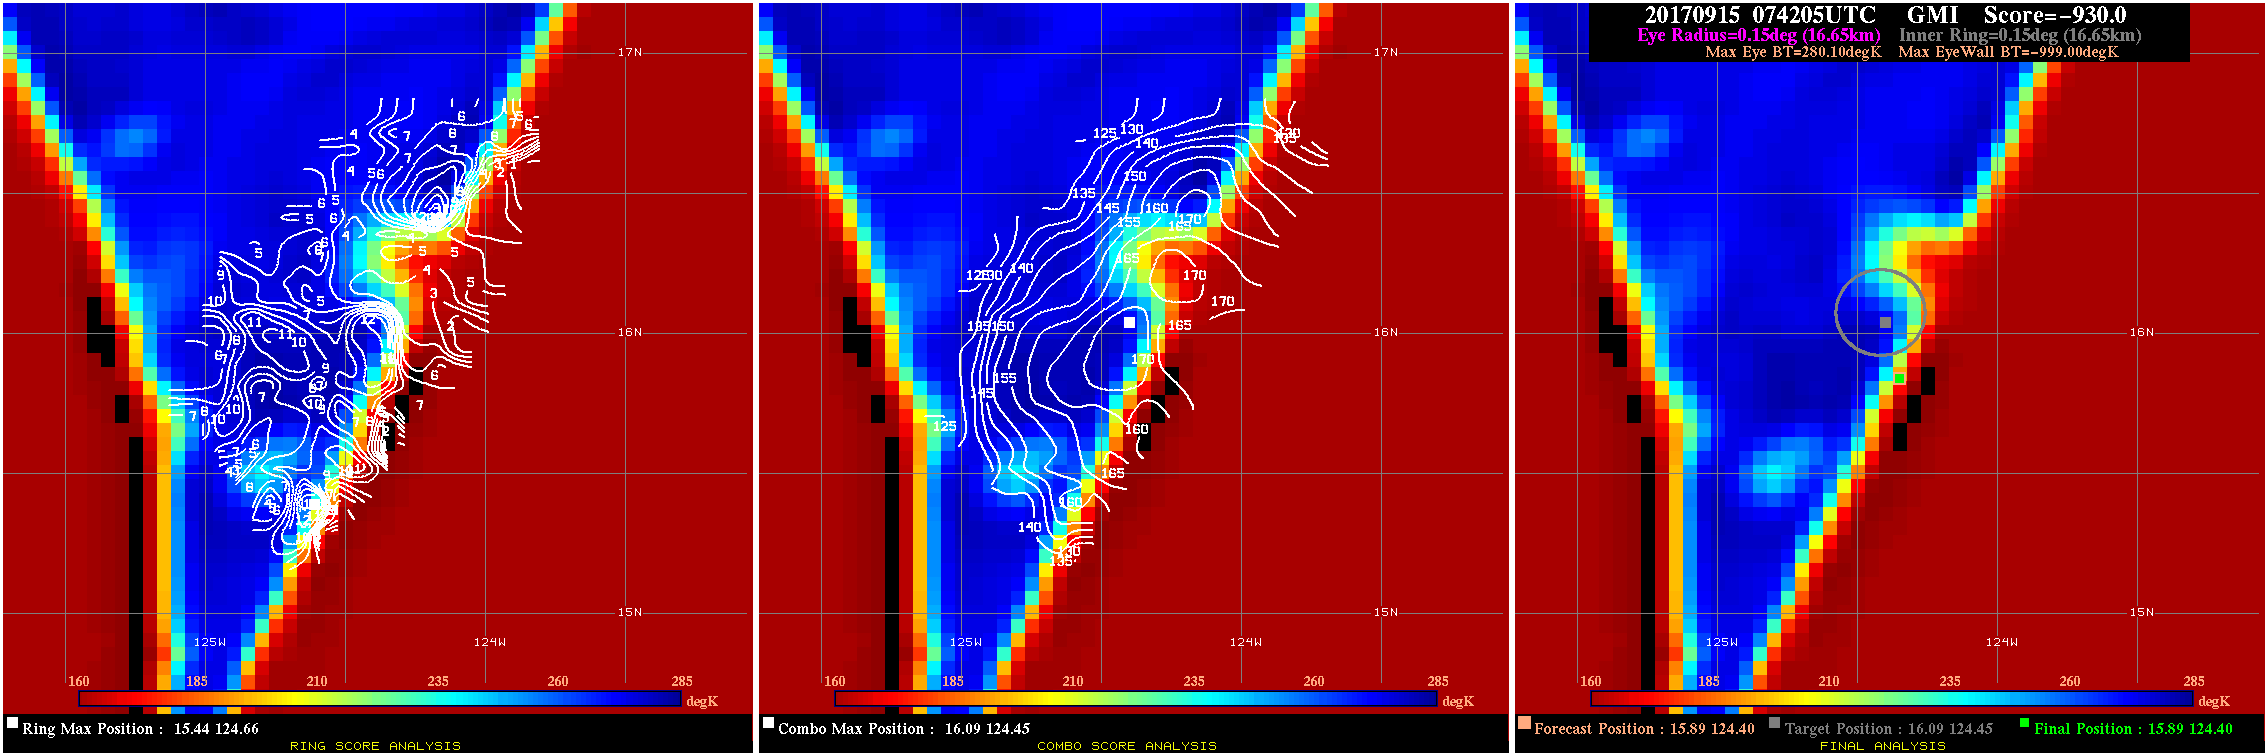
20170915 074205 -930.0 N/A N/A N/A 0.00 30.0 GMI 15.9 124.4 15.9 124.4 16.1 124.4 Analysis Plot
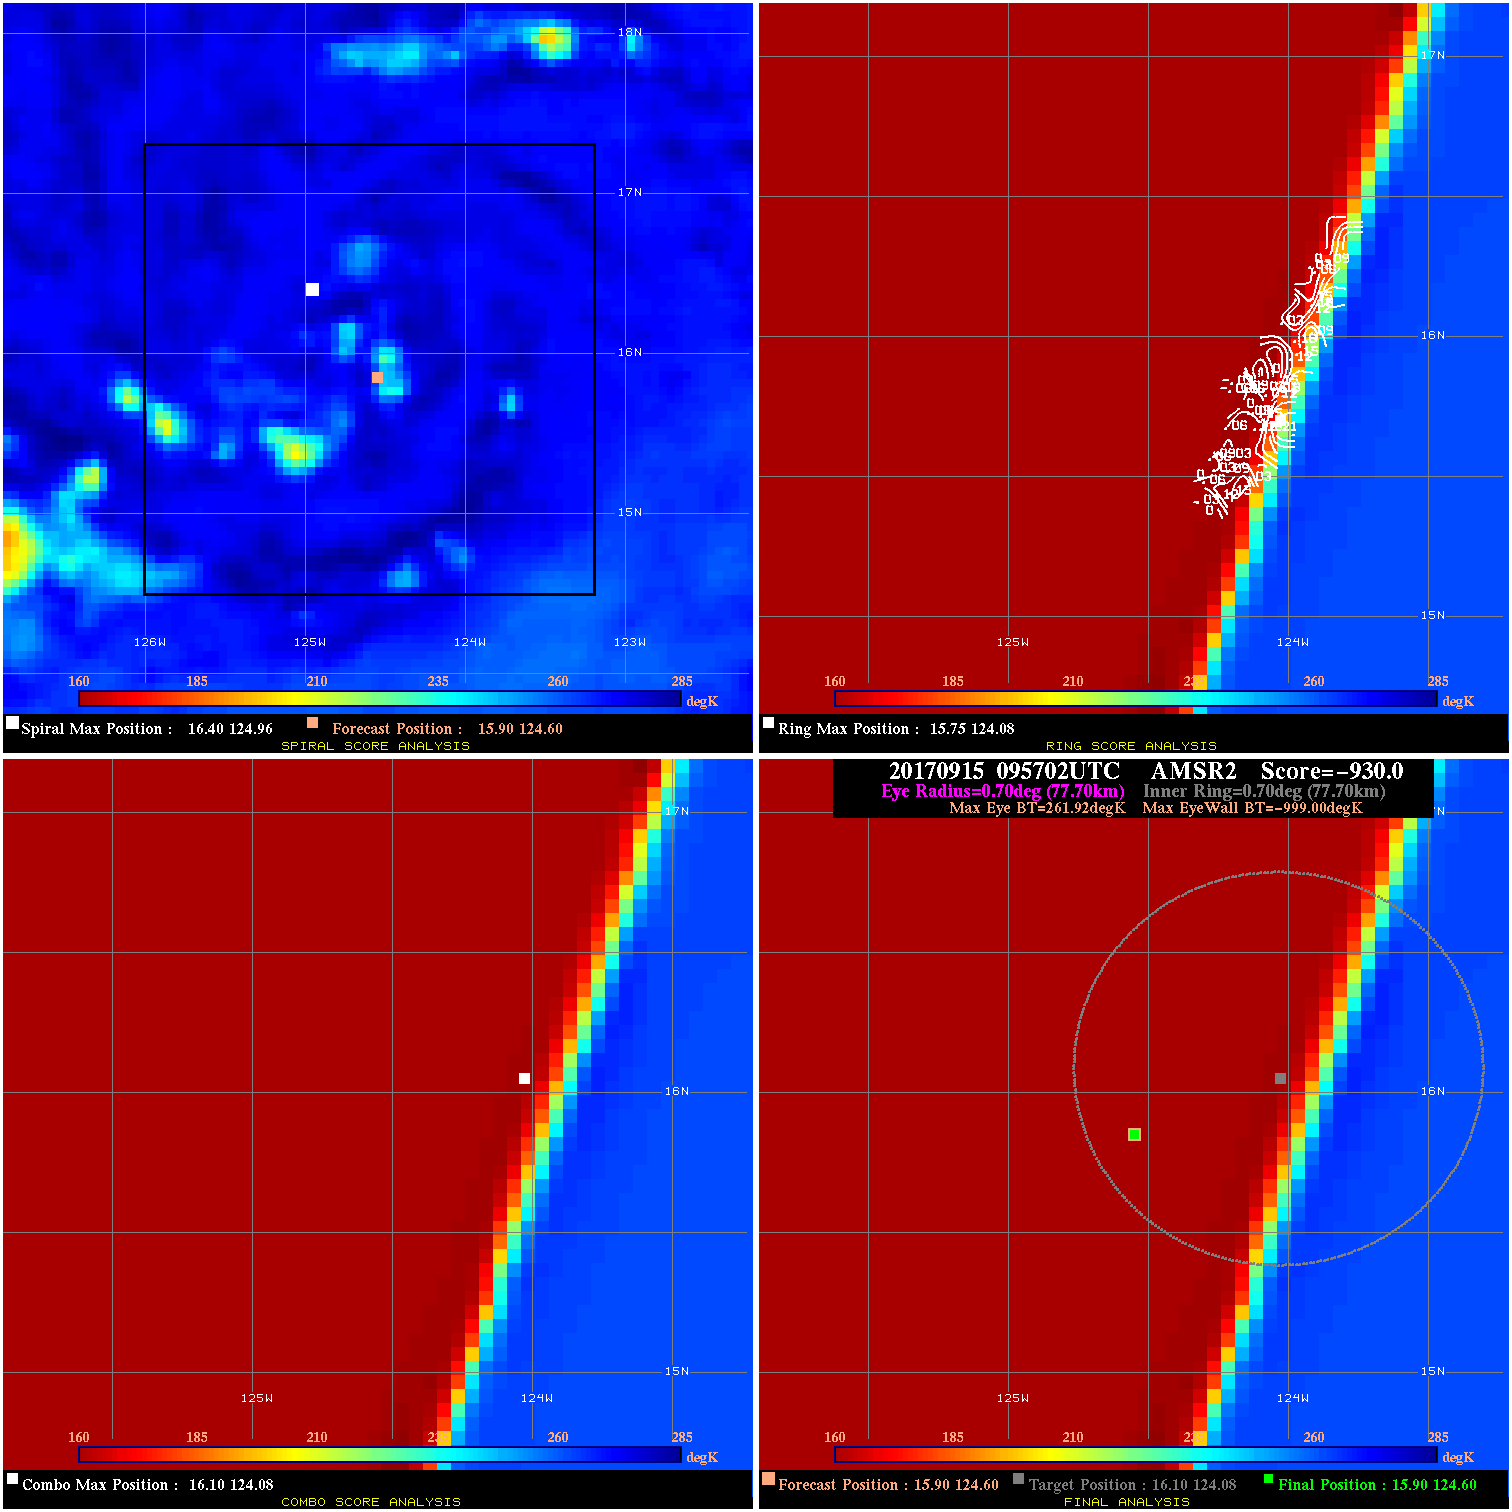
20170915 095702 -930.0 N/A N/A N/A 0.00 30.0 AMSR2 15.9 124.6 15.9 124.6 16.1 124.1 Analysis Plot
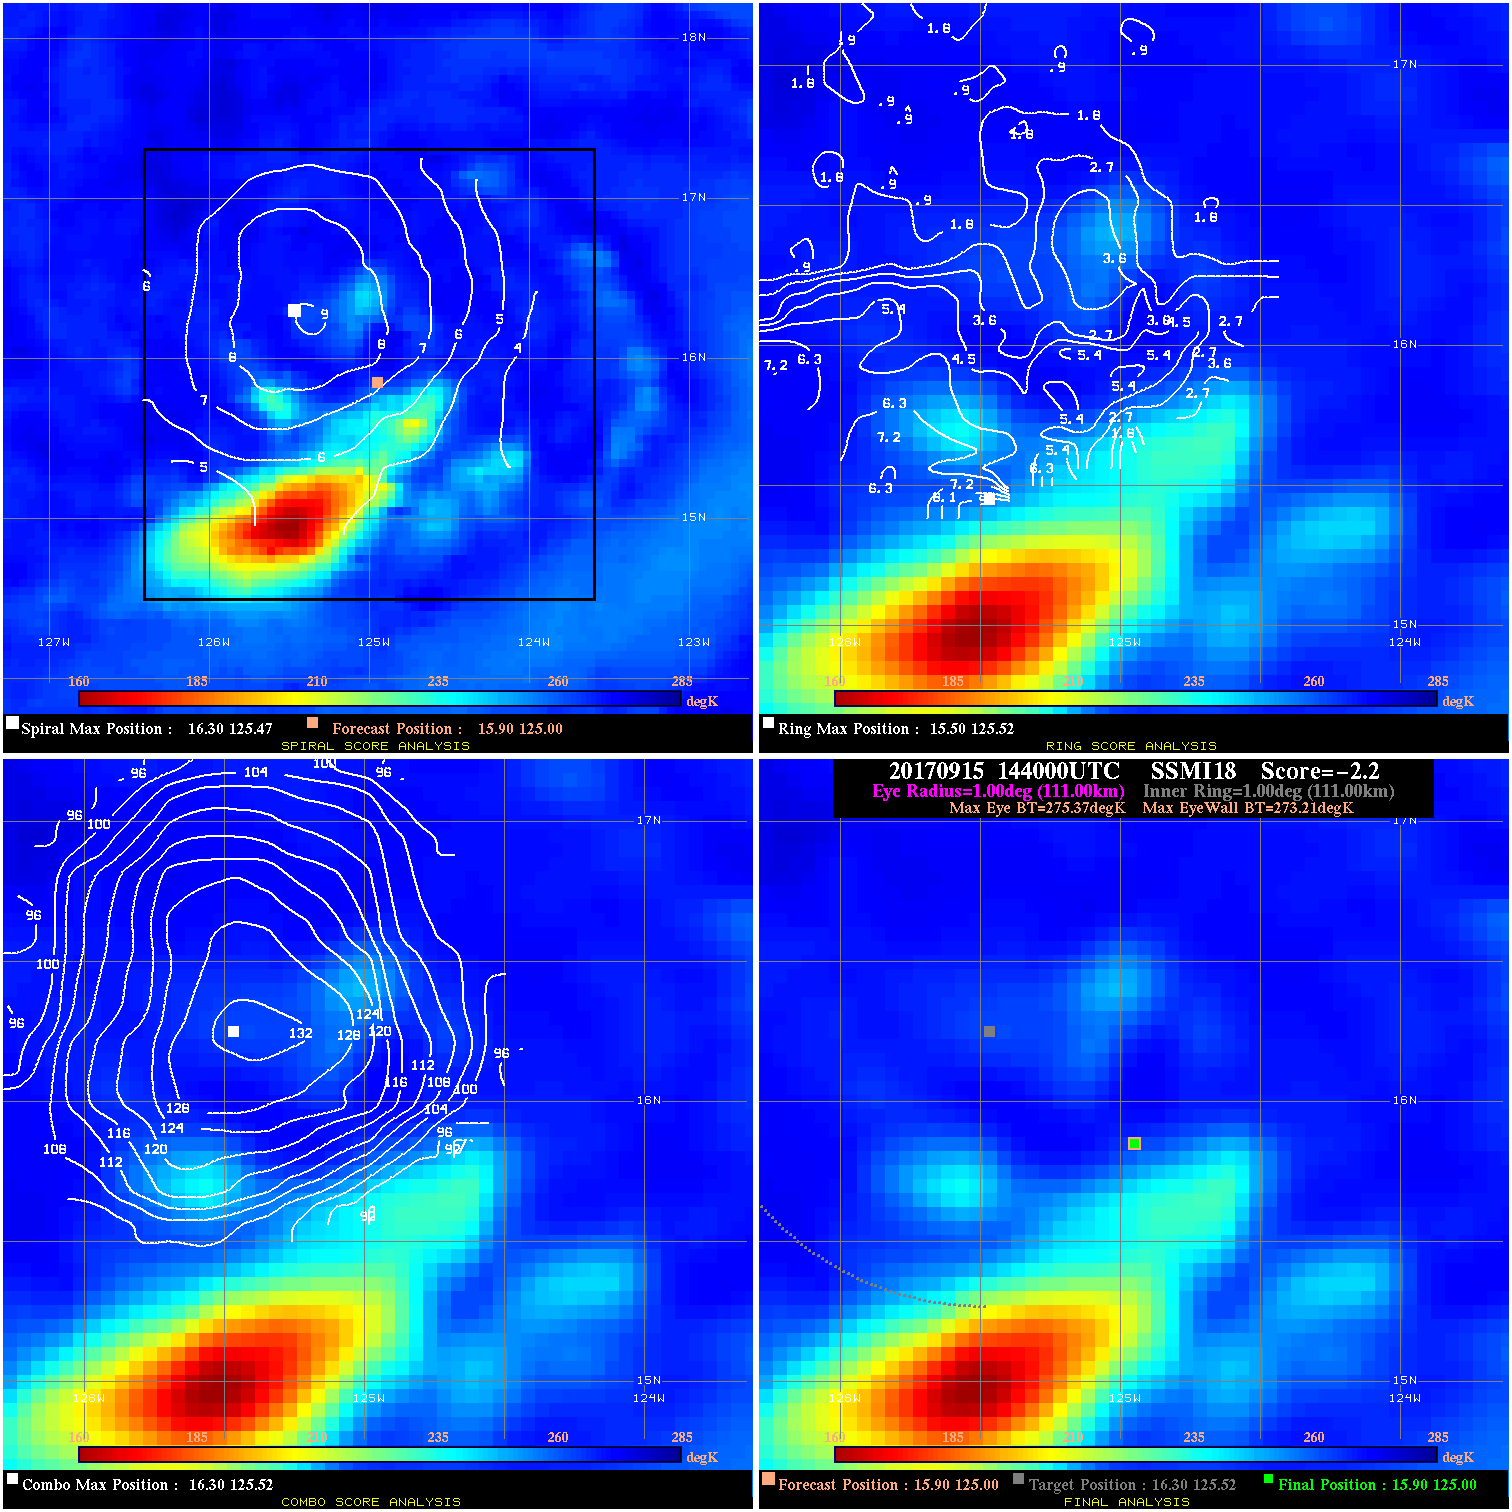
20170915 144000 -2.2 N/A 13.7% 222.20 2.16 30.0 SSMI18 15.9 125.0 15.9 125.0 16.3 125.5 Analysis Plot
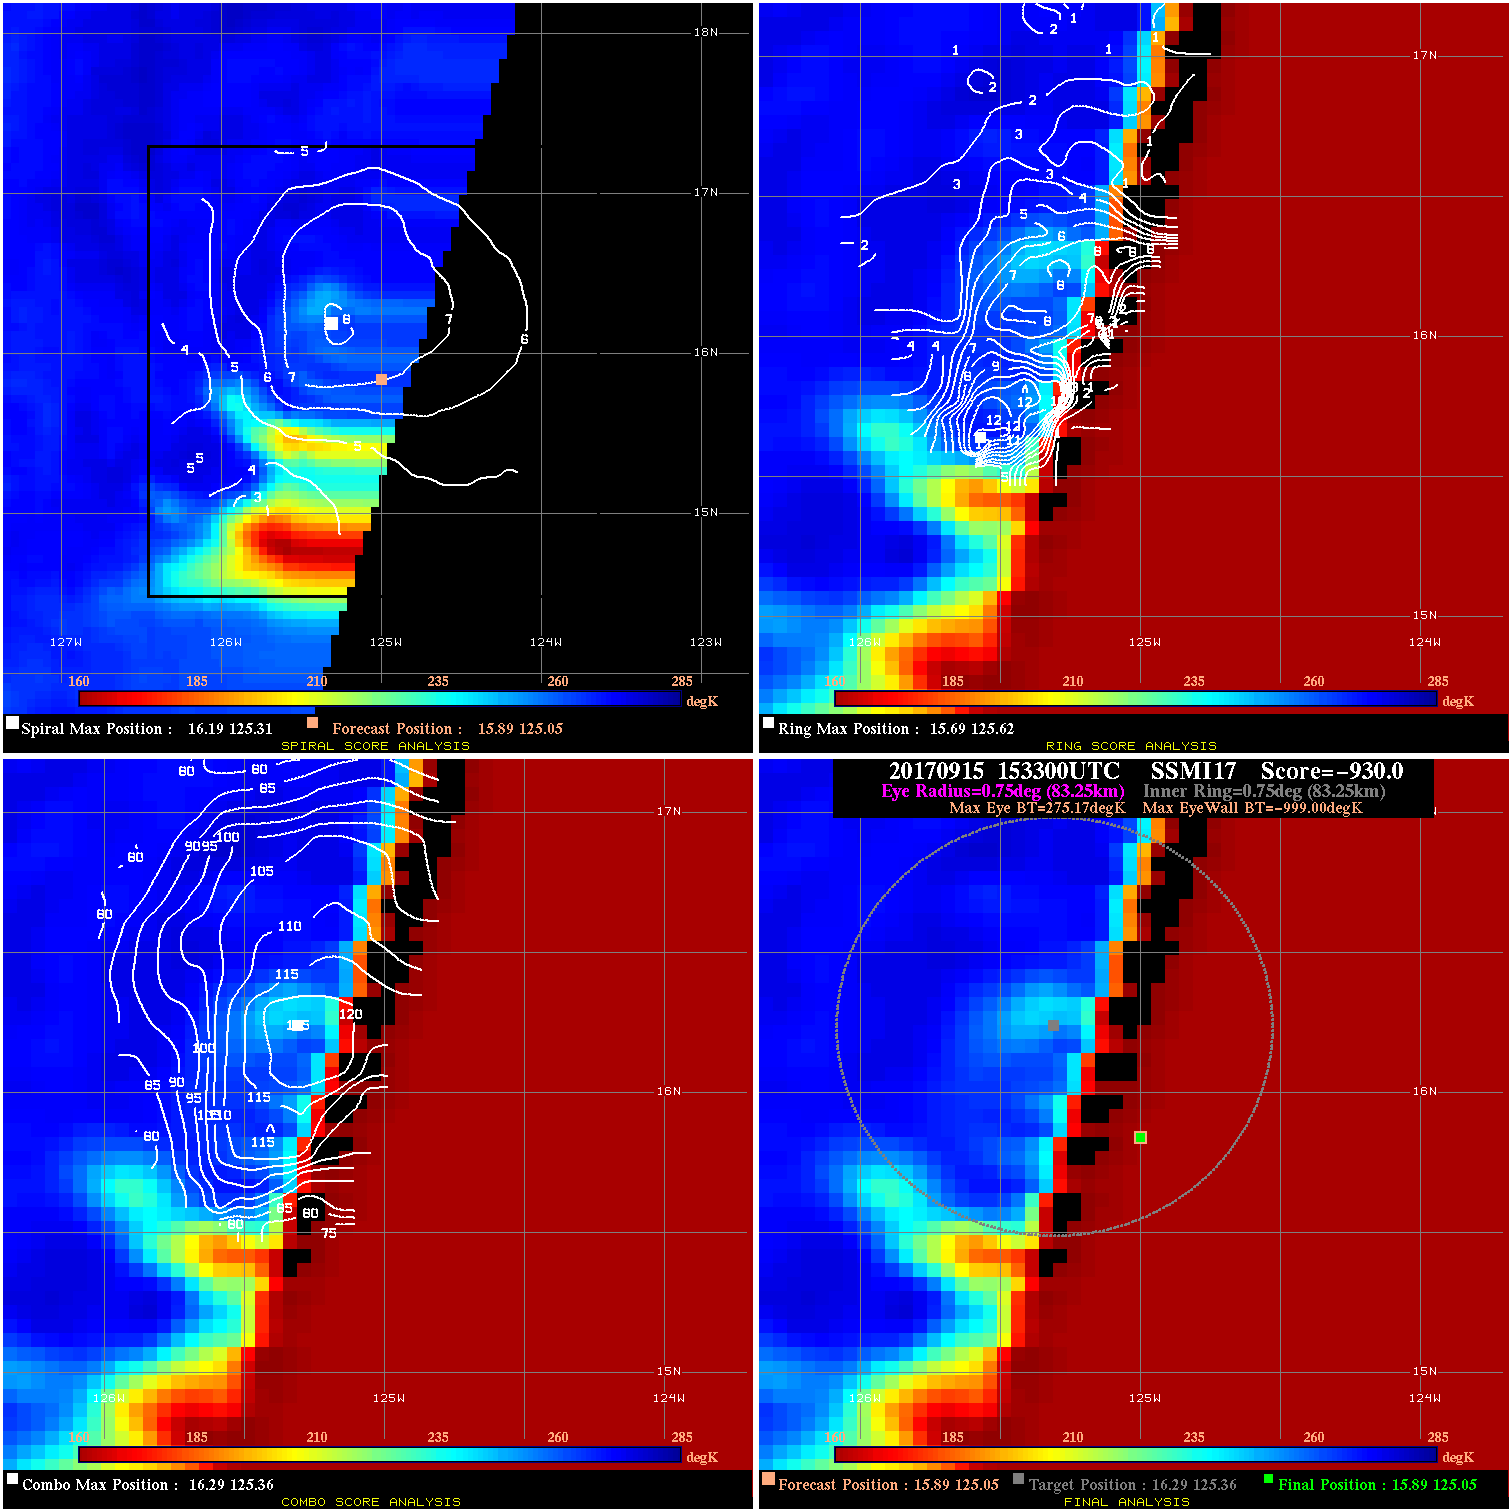
20170915 153300 -930.0 N/A N/A N/A 0.00 30.0 SSMI17 15.9 125.1 15.9 125.1 16.3 125.4 Analysis Plot
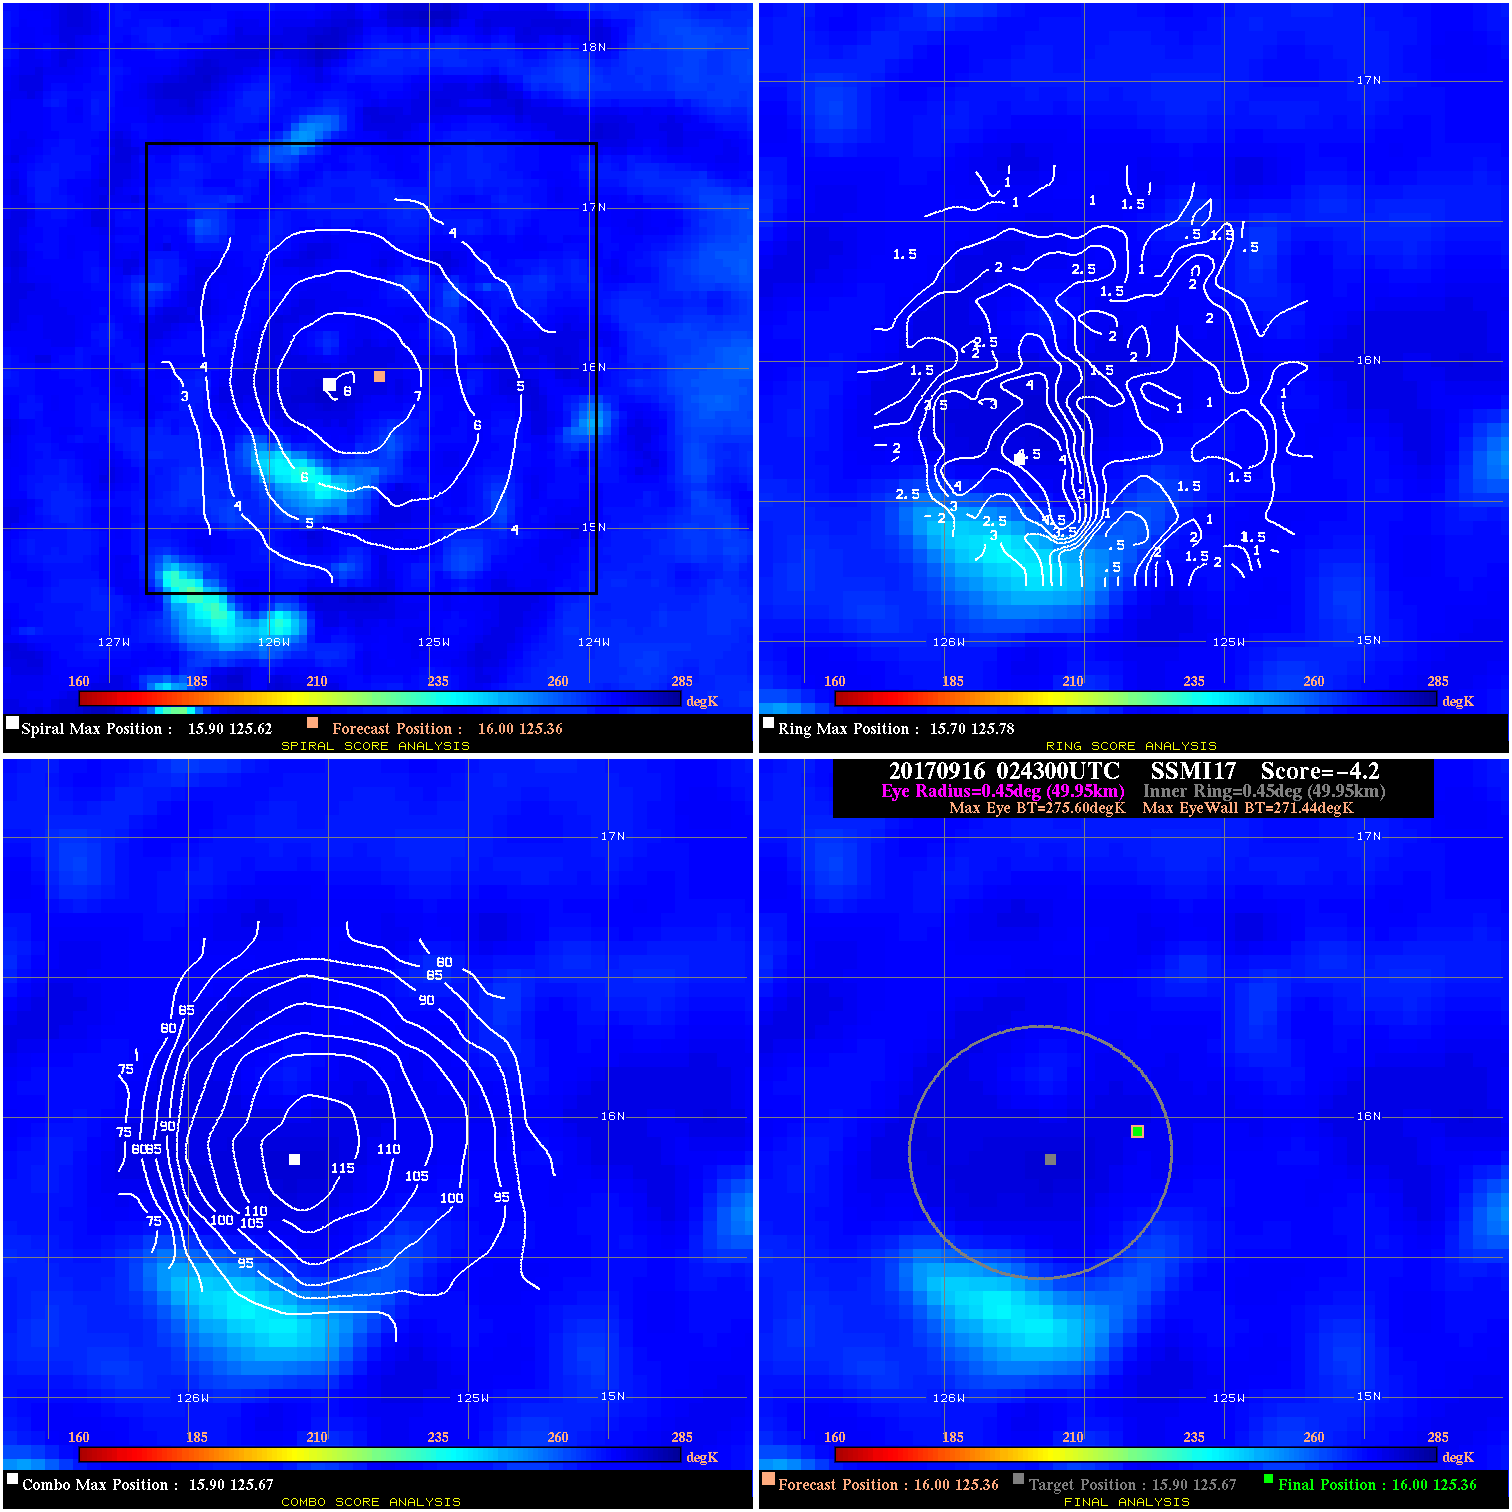
20170916 024300 -4.2 N/A N/A 99.99 4.16 30.0 SSMI17 16.0 125.4 16.0 125.4 15.9 125.7 Analysis Plot
20170916 024400 -4.5 N/A N/A 99.99 4.48 30.0 SSMI17 16.0 125.4 16.0 125.4 15.9 125.7 Analysis Plot
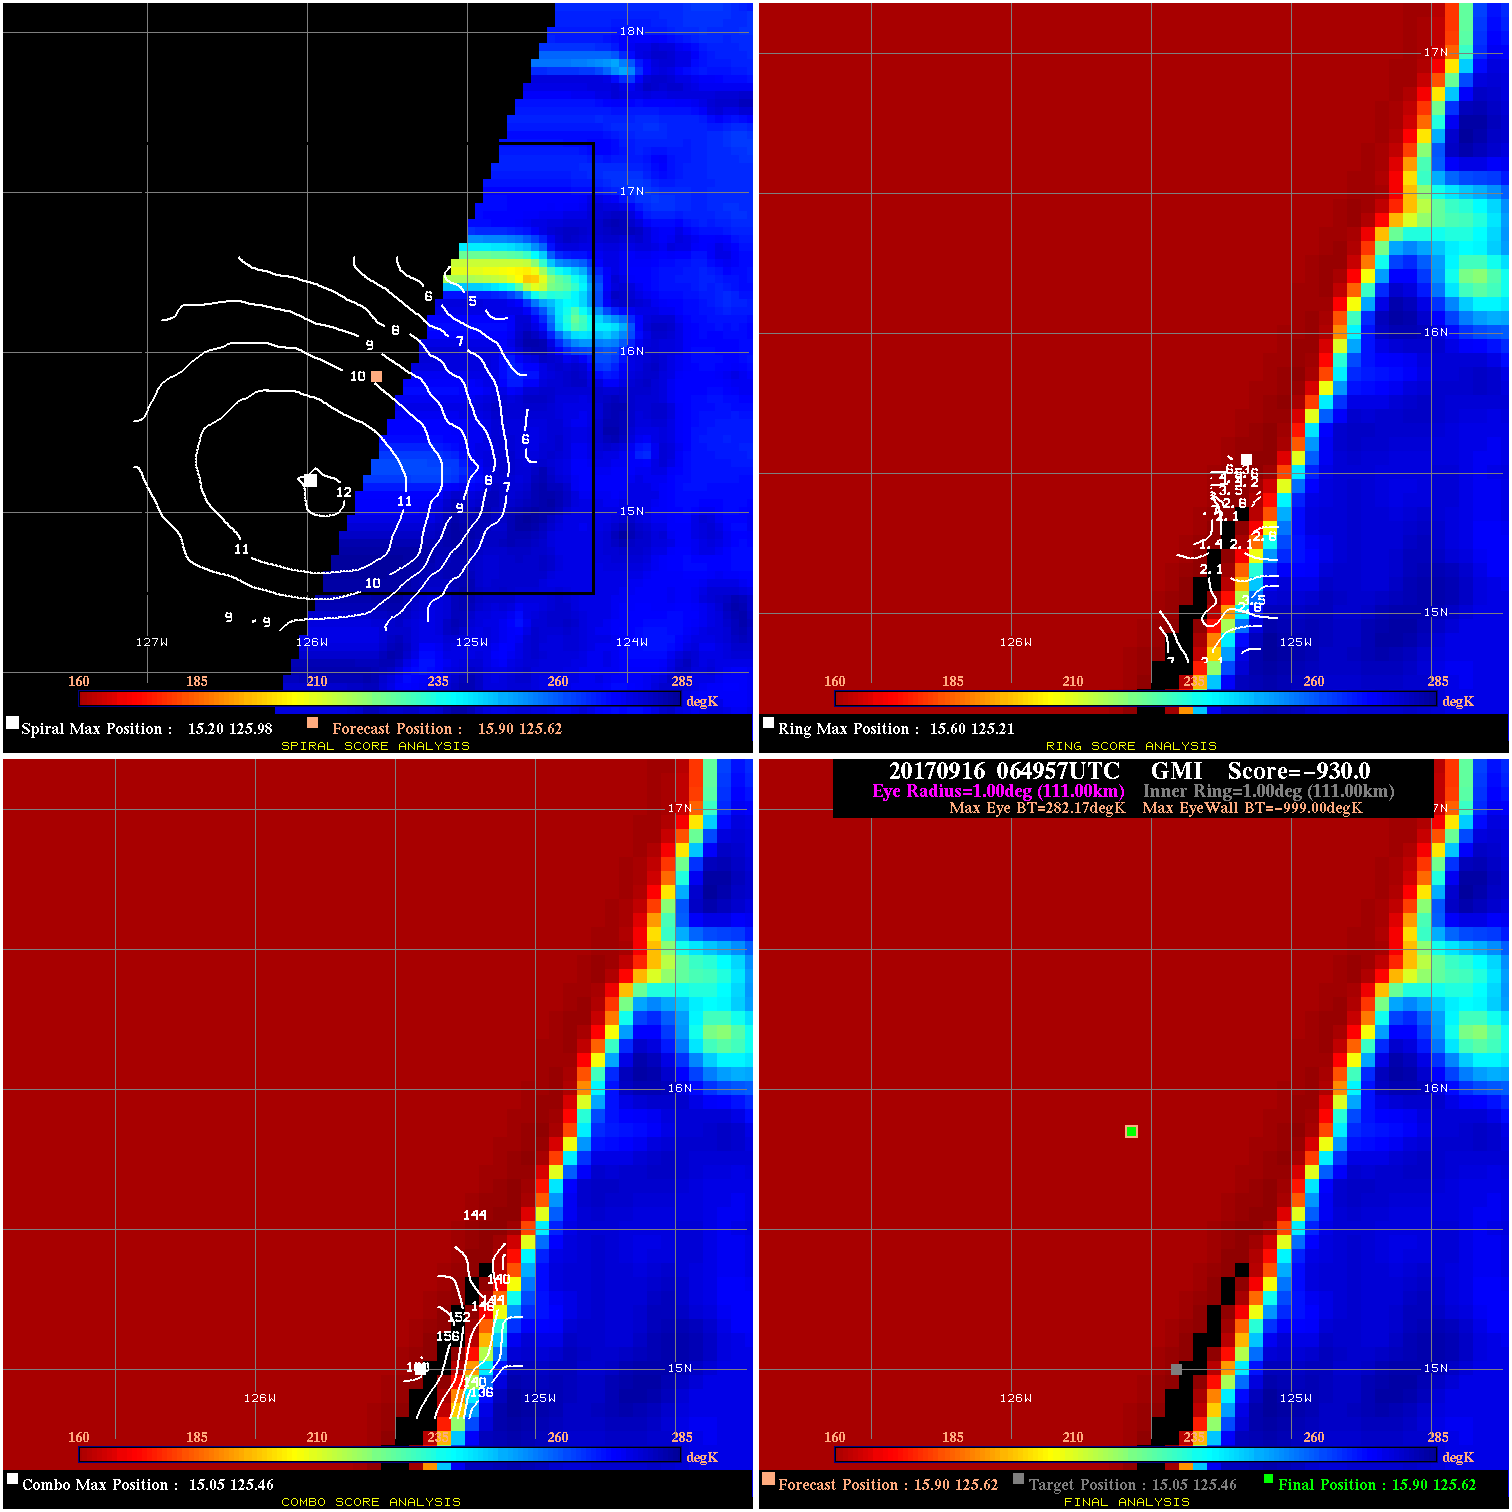
20170916 064957 -930.0 N/A N/A N/A 0.00 30.0 GMI 15.9 125.6 15.9 125.6 15.1 125.5 Analysis Plot
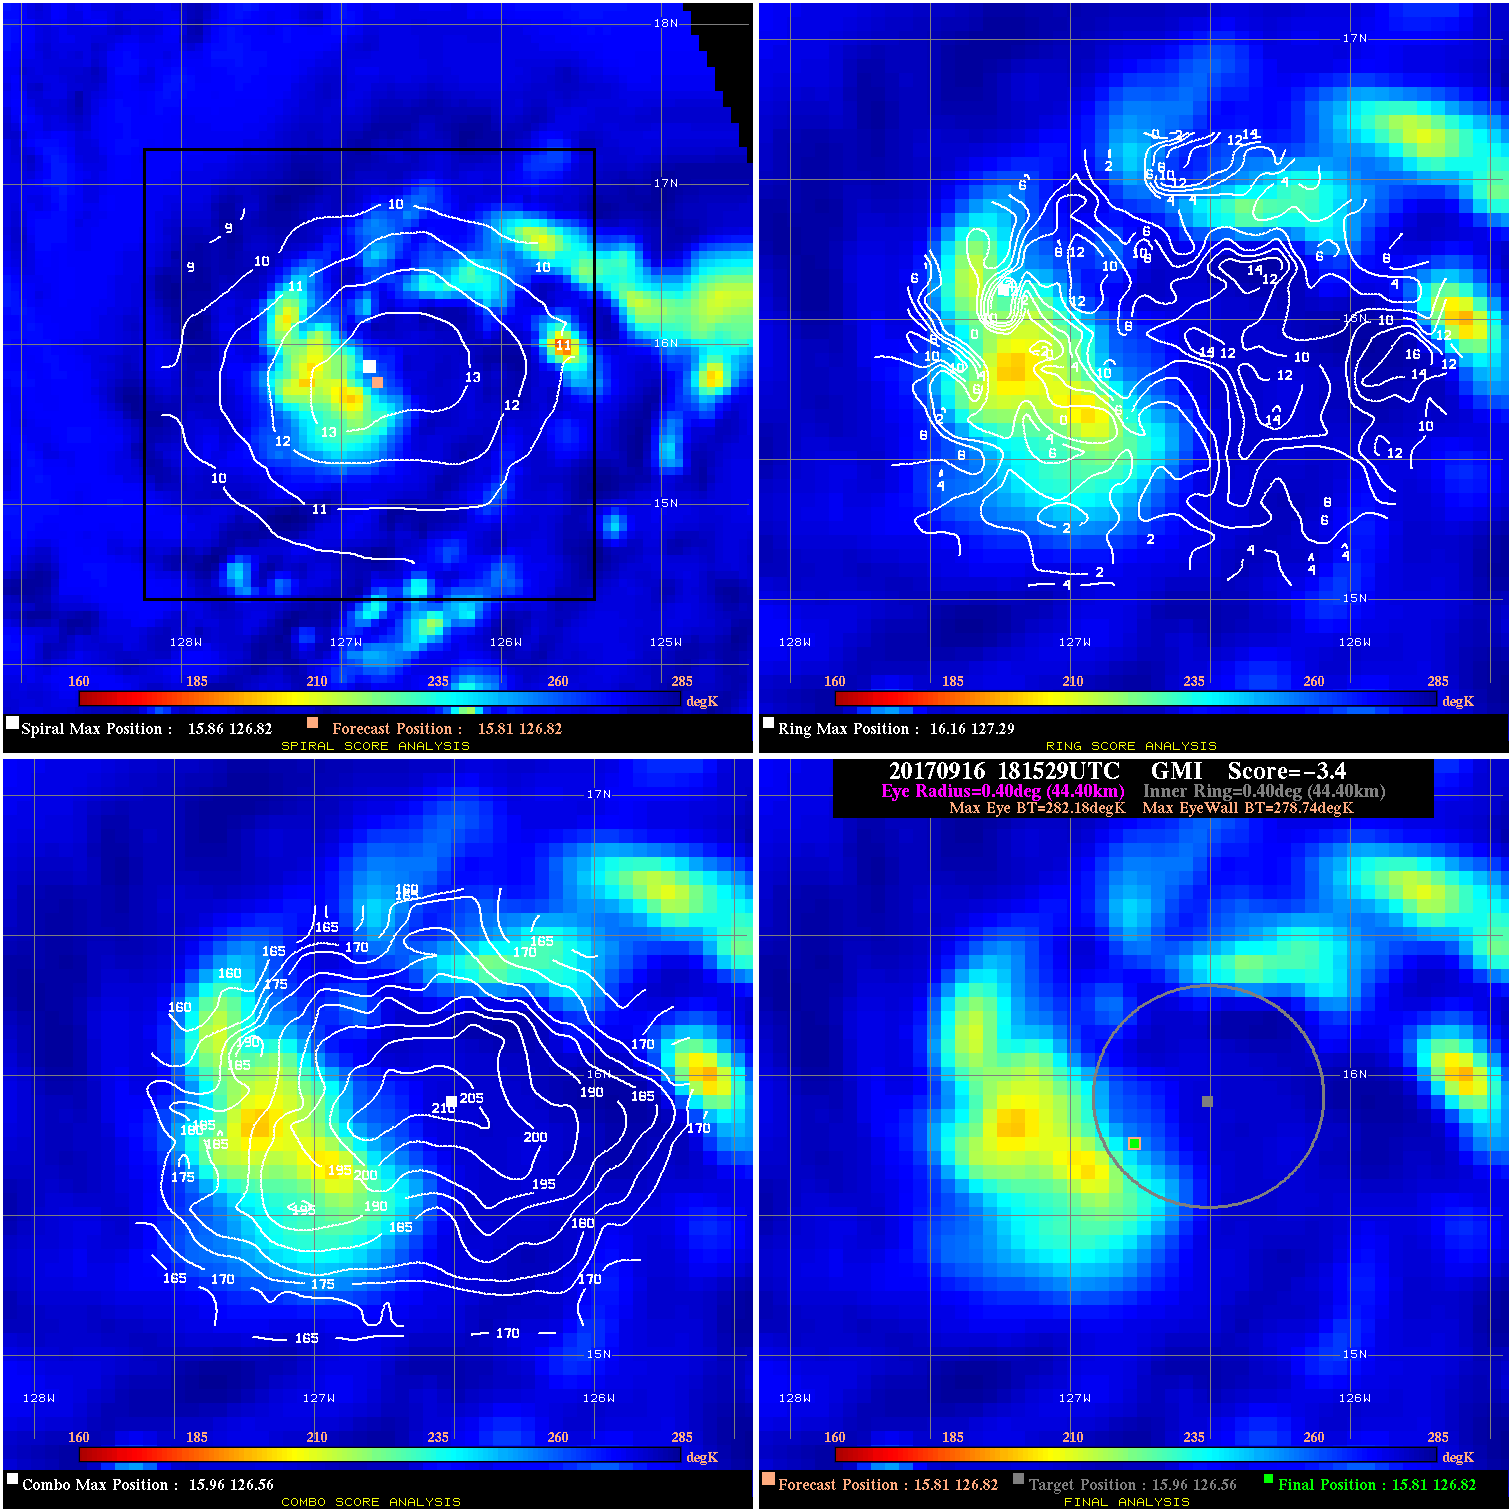
20170916 181529 -3.4 N/A 16.4% 88.88 3.44 30.0 GMI 15.8 126.8 15.8 126.8 16.0 126.6 Analysis Plot
20170917 094536 -39.1 N/A 100.0% 22.22 24.05 45.0 AMSR2 16.1 127.4 16.0 127.3 16.0 127.3 Analysis Plot
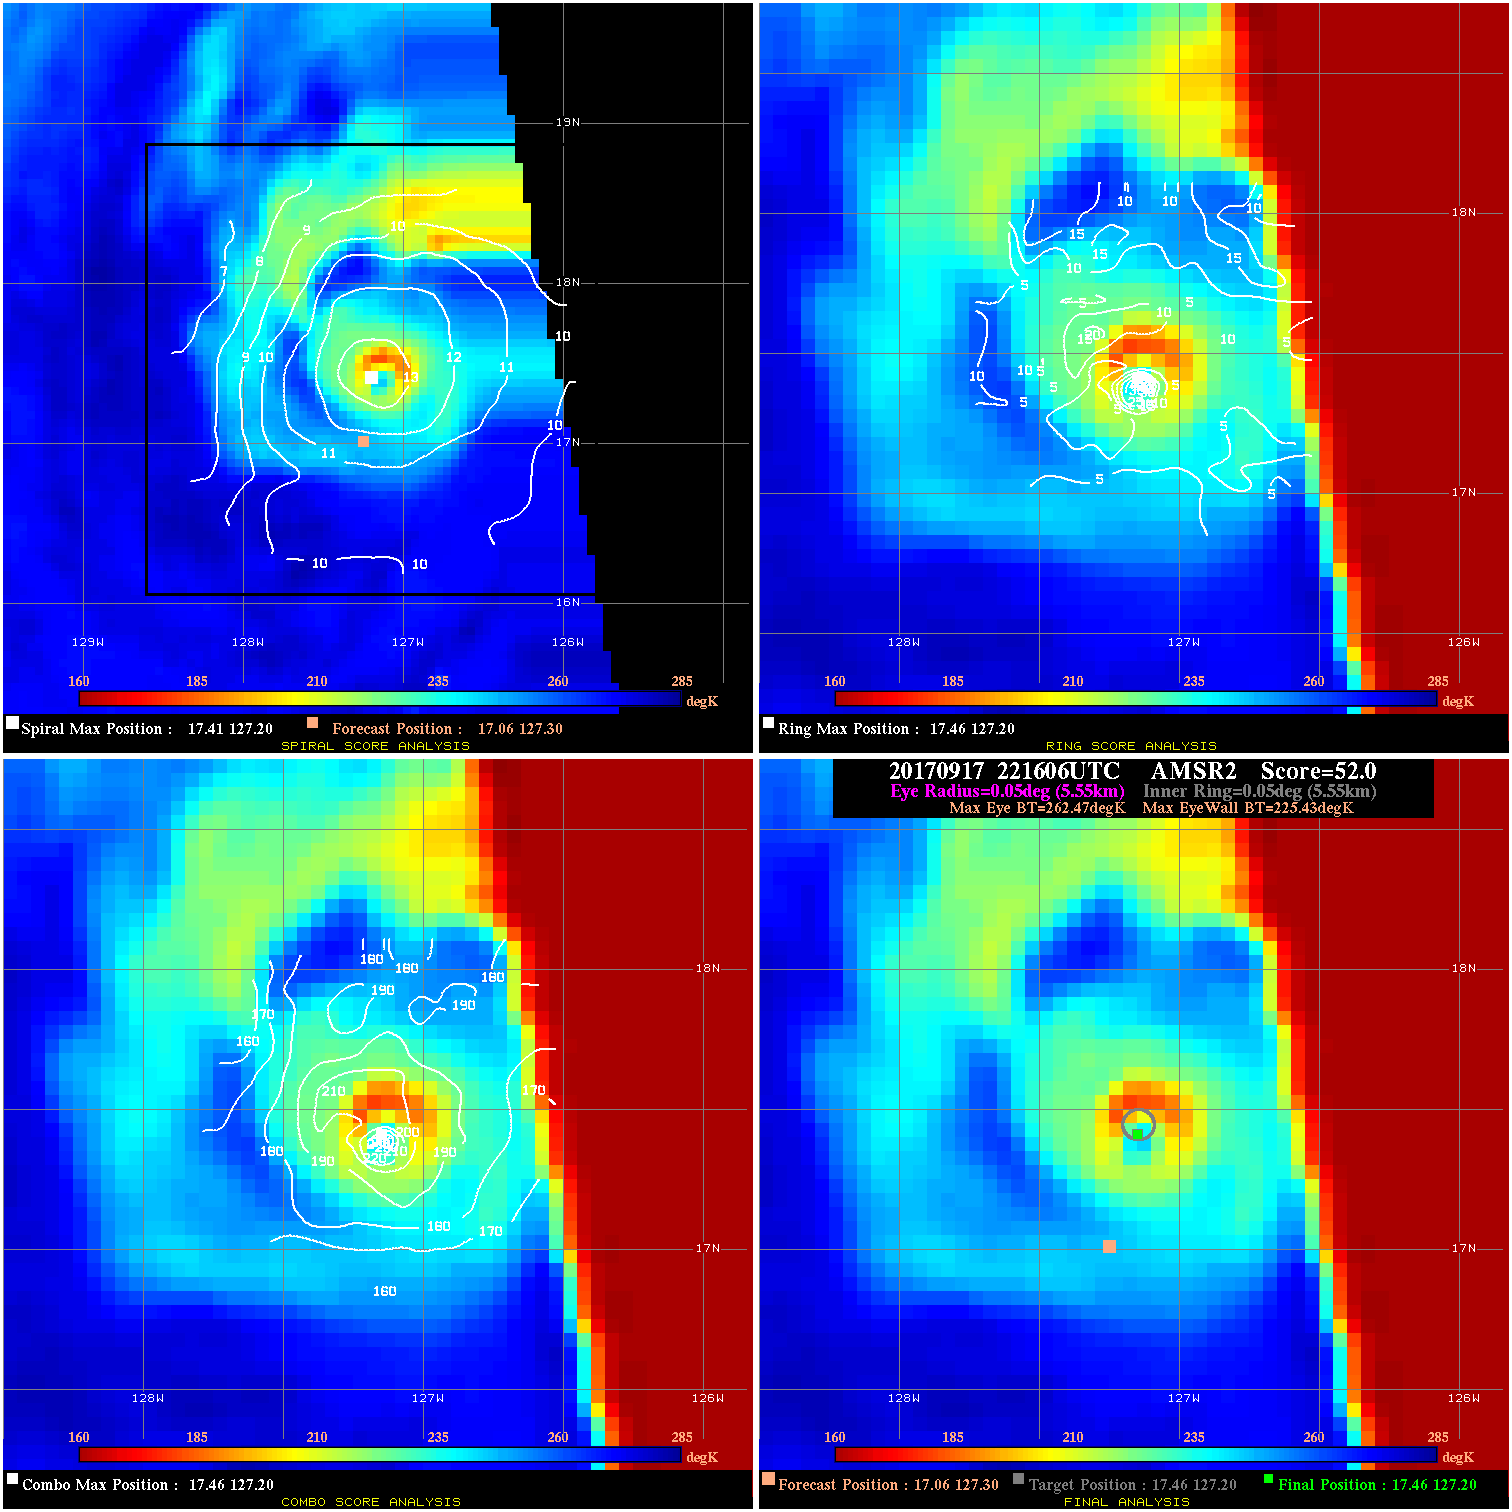
20170917 221606 52.0 >65 kts 100.0% 11.11 37.04 70.0 AMSR2 17.1 127.3 17.5 127.2 17.5 127.2 Analysis Plot
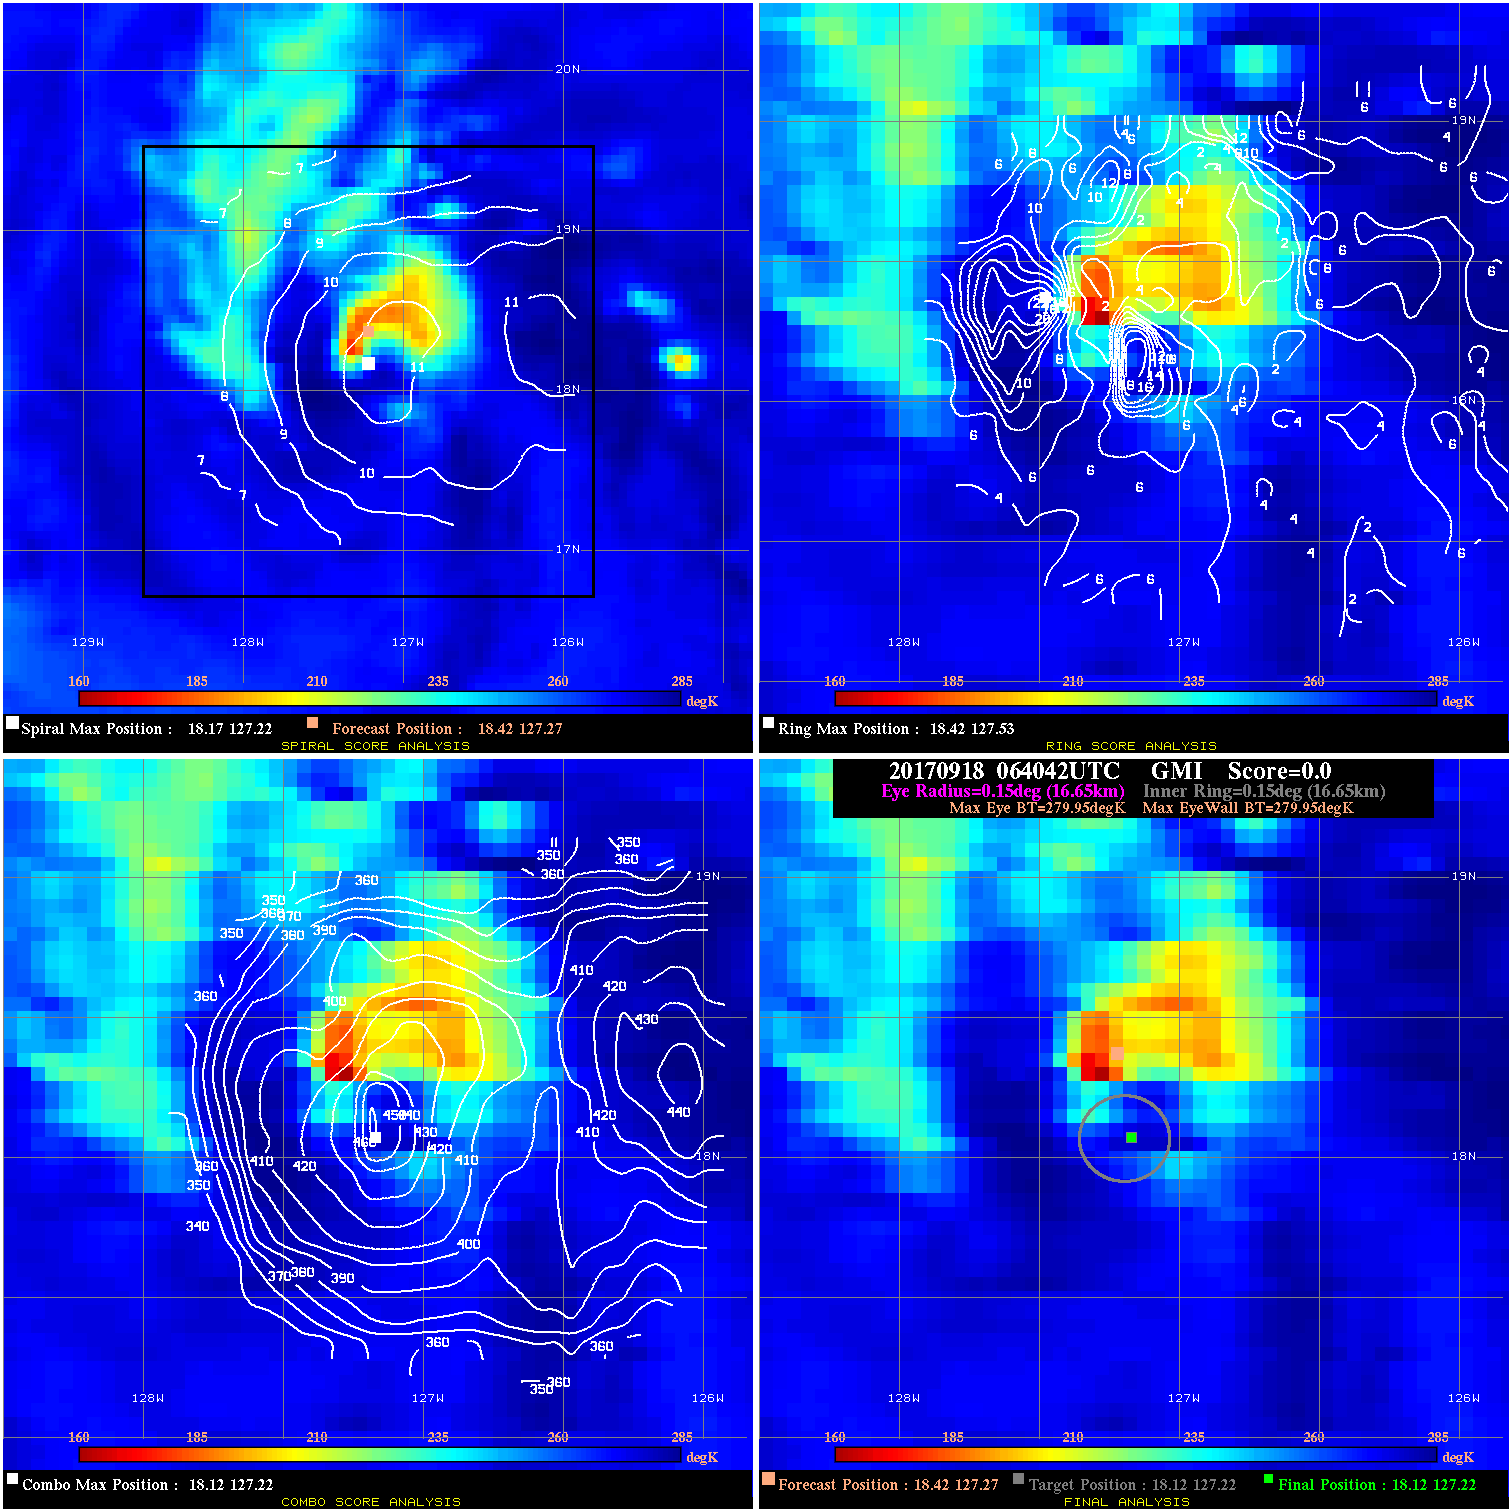
20170918 064042 -0.0 N/A N/A N/A 0.00 100.0 GMI 18.4 127.3 18.1 127.2 18.1 127.2 Analysis Plot
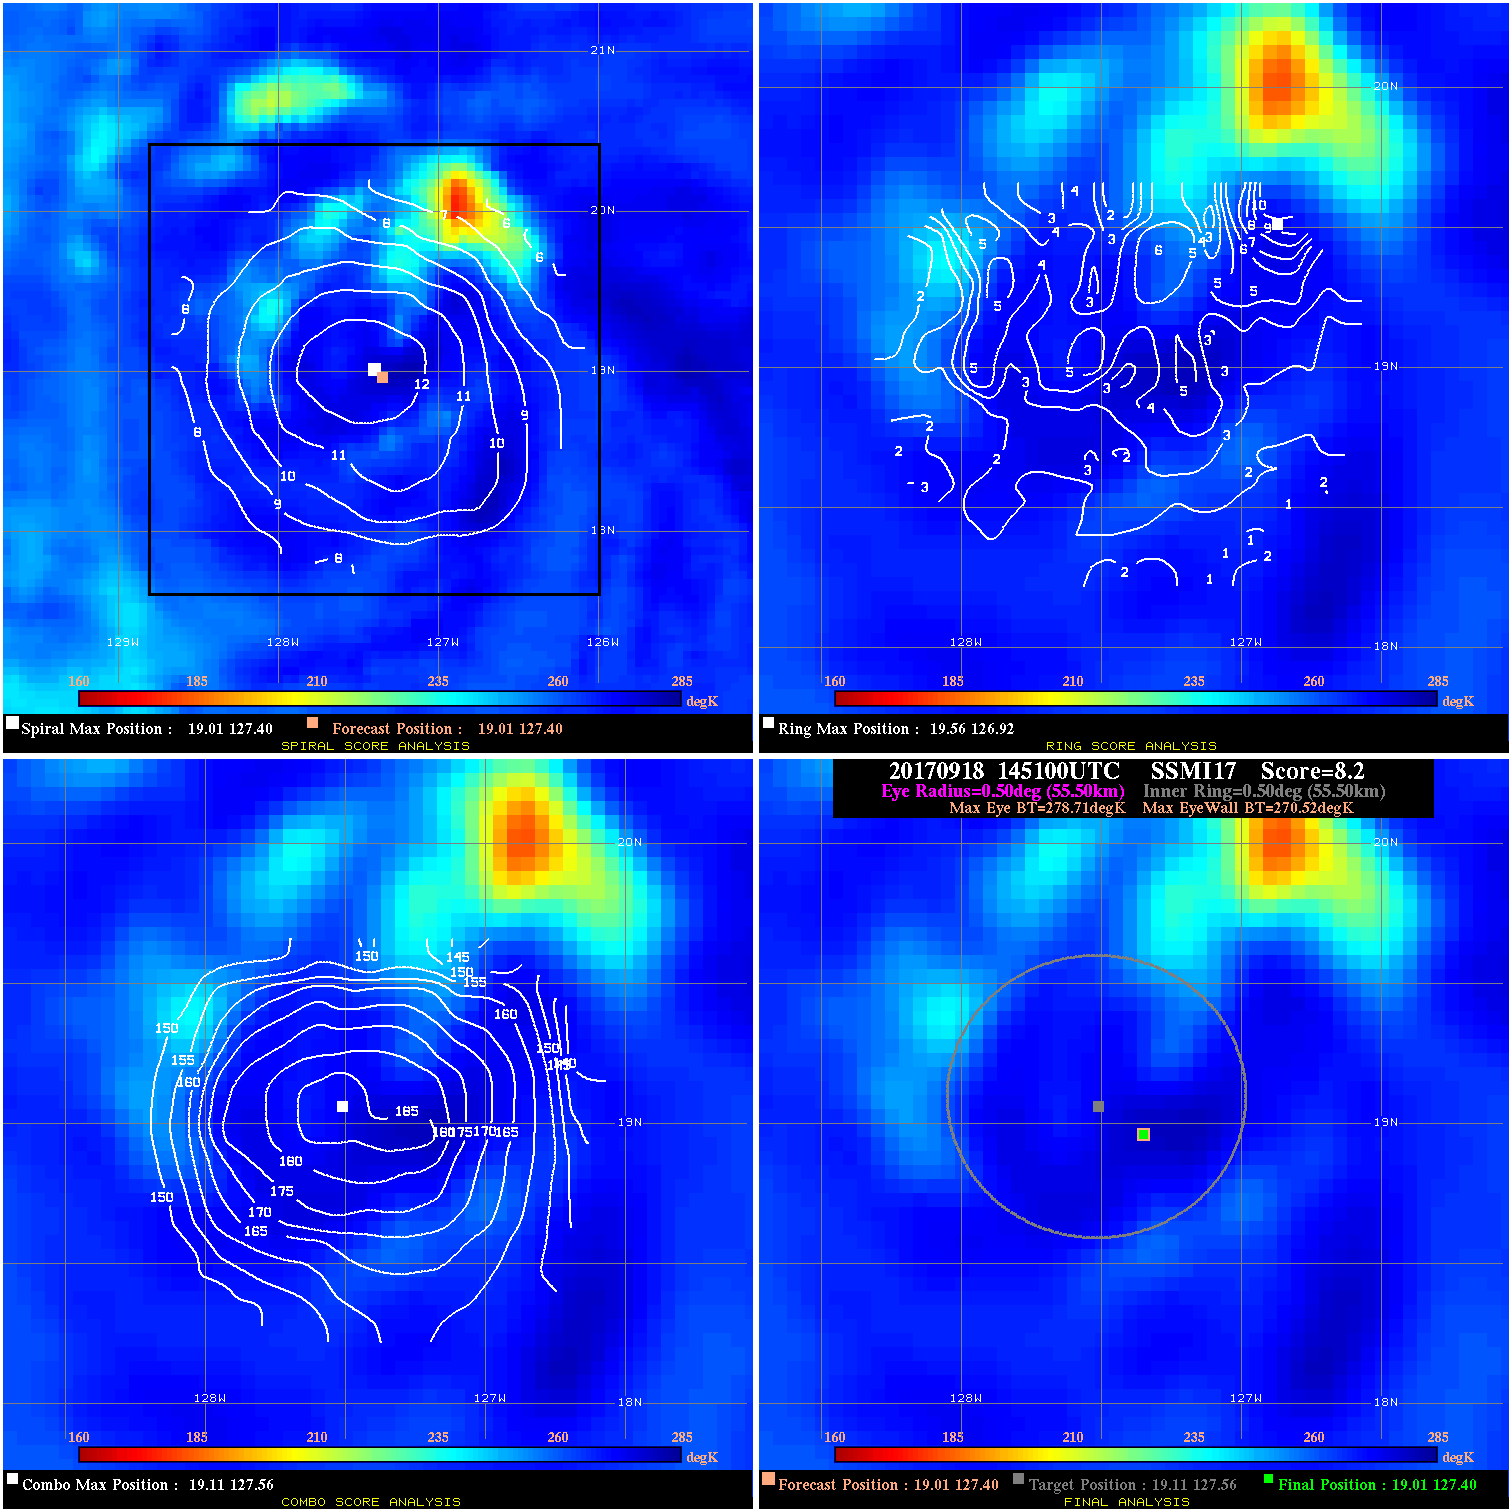
20170918 145100 8.2 N/A 1.4% 111.10 8.19 60.0 SSMI17 19.0 127.4 19.0 127.4 19.1 127.6 Analysis Plot
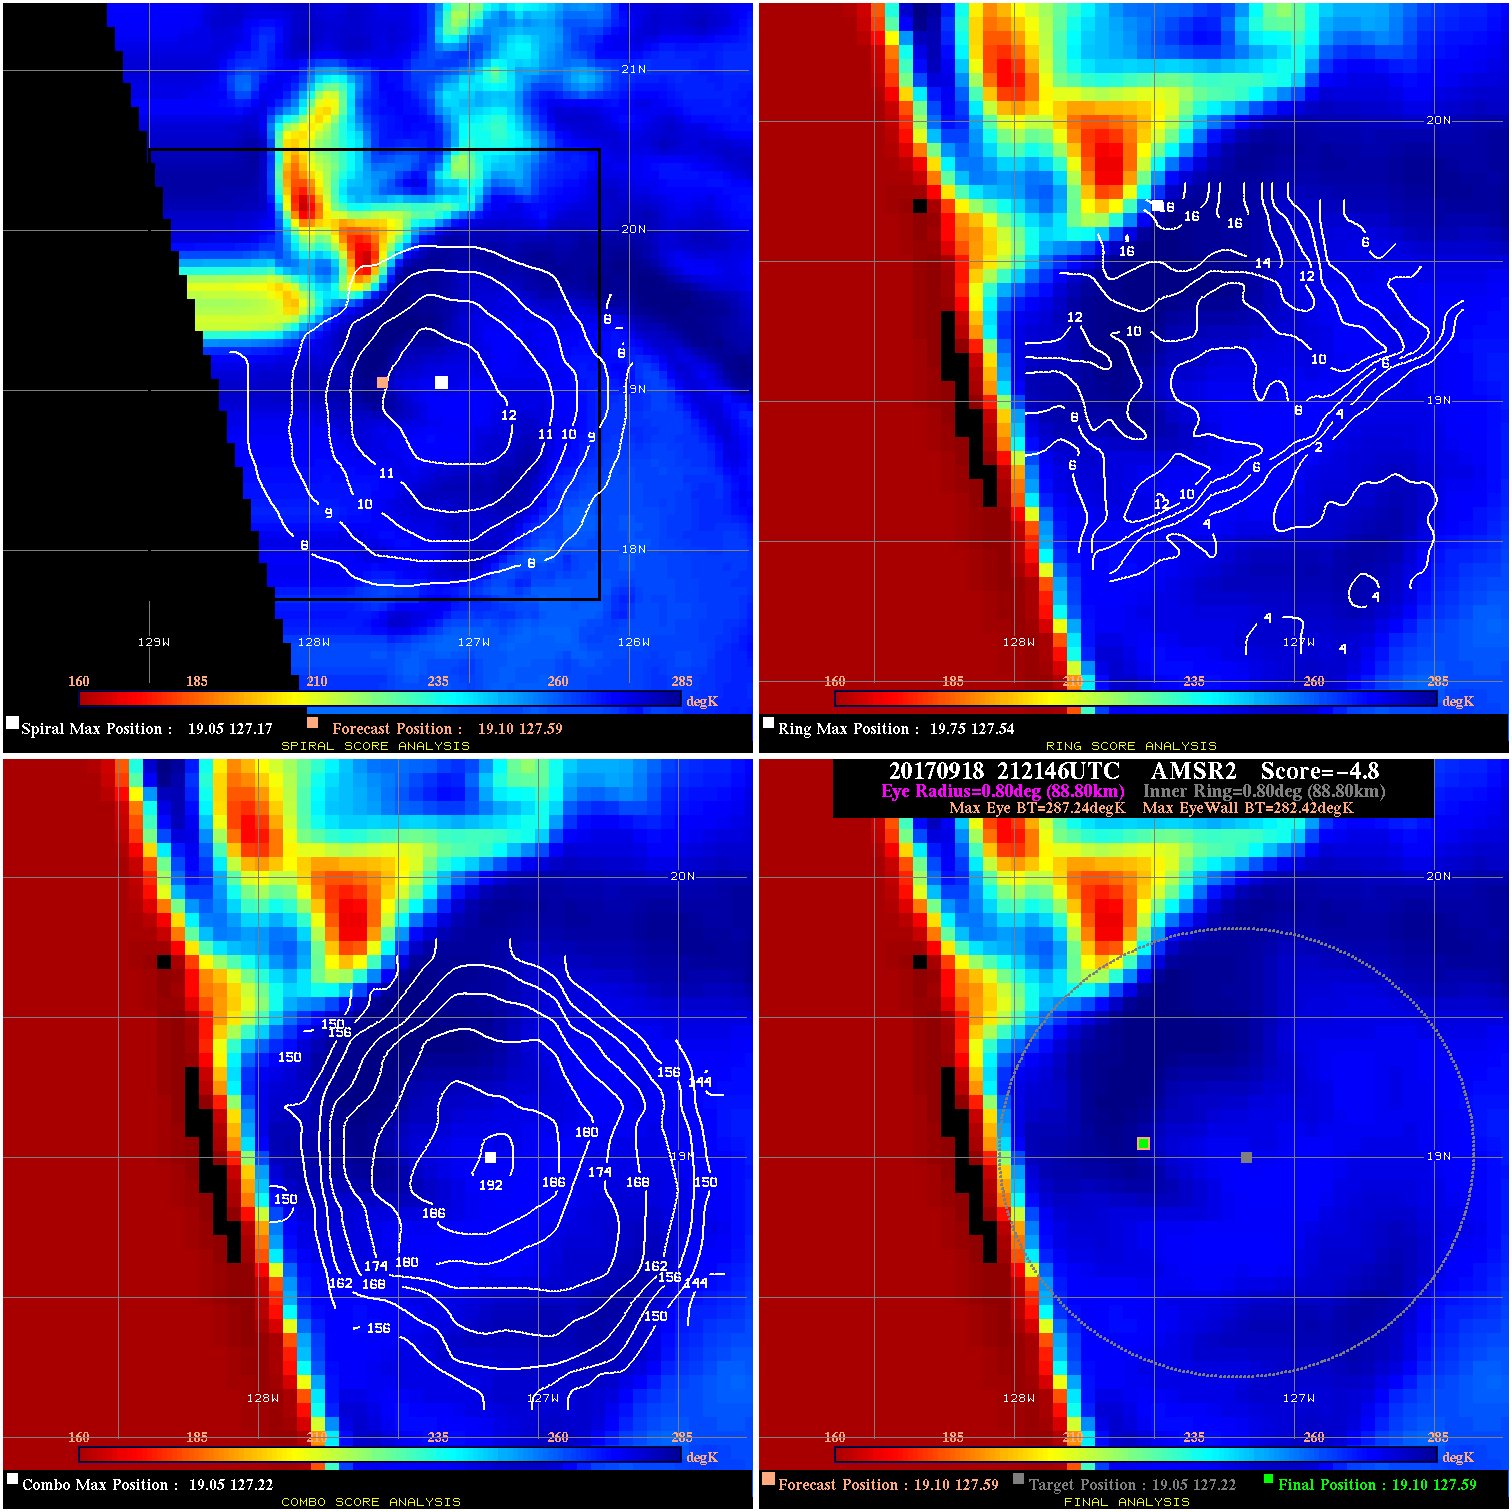
20170918 212146 -4.8 N/A 4.1% 177.76 4.82 45.0 AMSR2 19.1 127.6 19.1 127.6 19.0 127.2 Analysis Plot
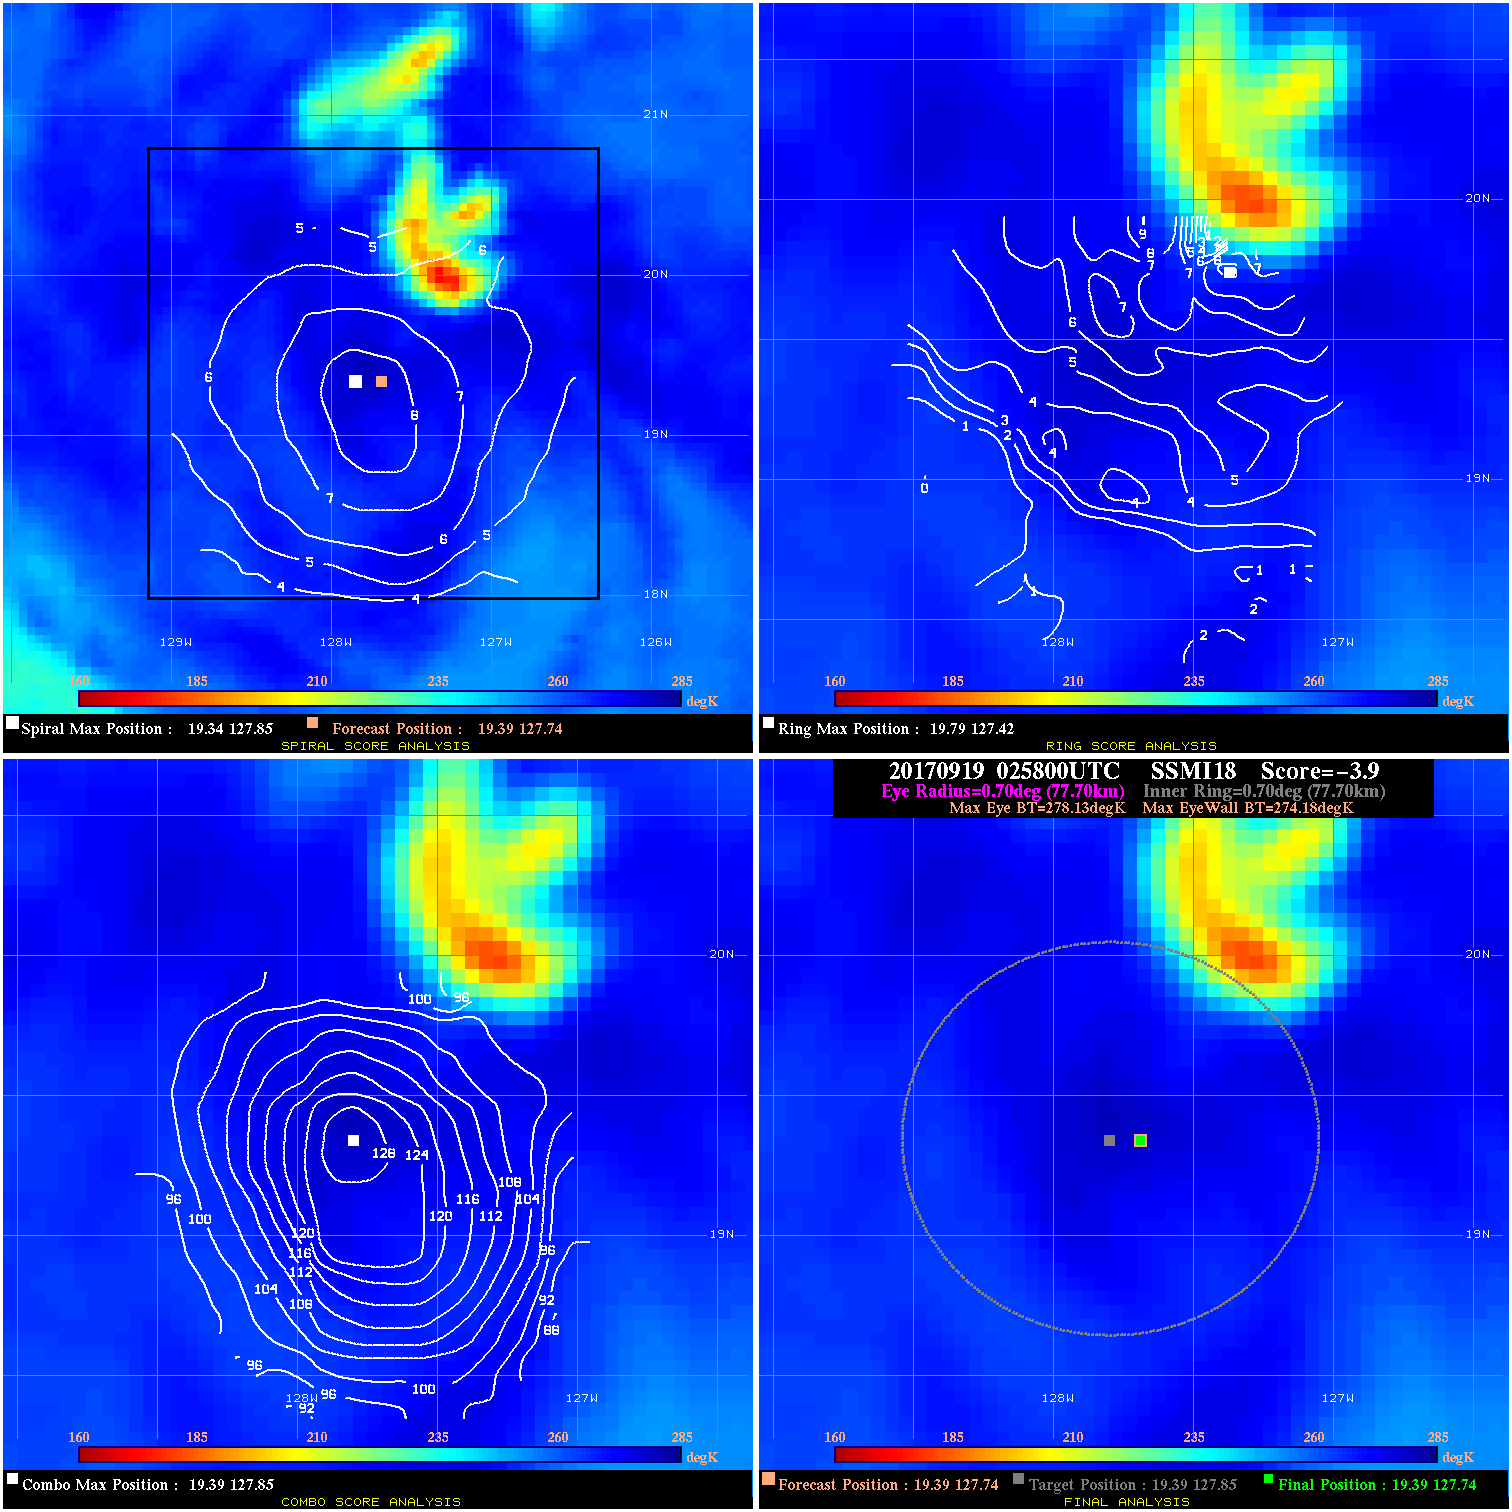
20170919 025800 -5.0 N/A N/A 111.10 5.05 35.0 SSMI18 19.4 127.7 19.4 127.7 19.4 127.9 Analysis Plot
20170919 025800 -3.9 N/A 9.6% 155.54 3.95 35.0 SSMI18 19.4 127.7 19.4 127.7 19.4 127.8 Analysis Plot
|
|
Legend: - Date/Time are determined from PMW imagery at Forecast (initial guess) Lat/Lon position. - Positive/Negative Latitude = North/South Hemisphere; Longitude = Western/Eastern Hemisphere. - "Ring Diam" value indicates the estimated surface eyewall diameter in km (the MI eyewall edge diameter minus 10 km). - "Ring Pct" is the percentage of the "ring" (eyewall inner boundary) that is 1) colder than the "hot spot" (warmest eye pixel) in the eye by 20K, or 2) the percentage that is a) colder than 232K and b) colder than the "hot spot" by 10K, whichever is greater. - Values are red if Ring % <= 65, yellow/brown if Ring % <= 85 and green if Ring % > 85. - "Tb diff" is the difference between the "hot spot" (warmest eye pixel) and the warmest pixel on the eyewall. - Intensity score are listed as negative, and not used, when the JTWC or NHC estimated Vmax is <55 kts in order to rule out weak but highly symmetric TCs. - Error messages in intensity scores: -920 is used when the hottest pixel in the eye is <200K, to prevent false positives; -930 means <85% of eyewall has observations/data. |