Hurricane 17L
|
Passive Microwave (PMW) Intensity Information Advanced Dvorak Technique (ADT) Version 8.2.1 |
Overpass Inten Ring Ring Wind Forecast Final Target
Date Time Score Meaning Pct Diam BTdiff Est Sat Lat Lon Lat Lon Lat Lon
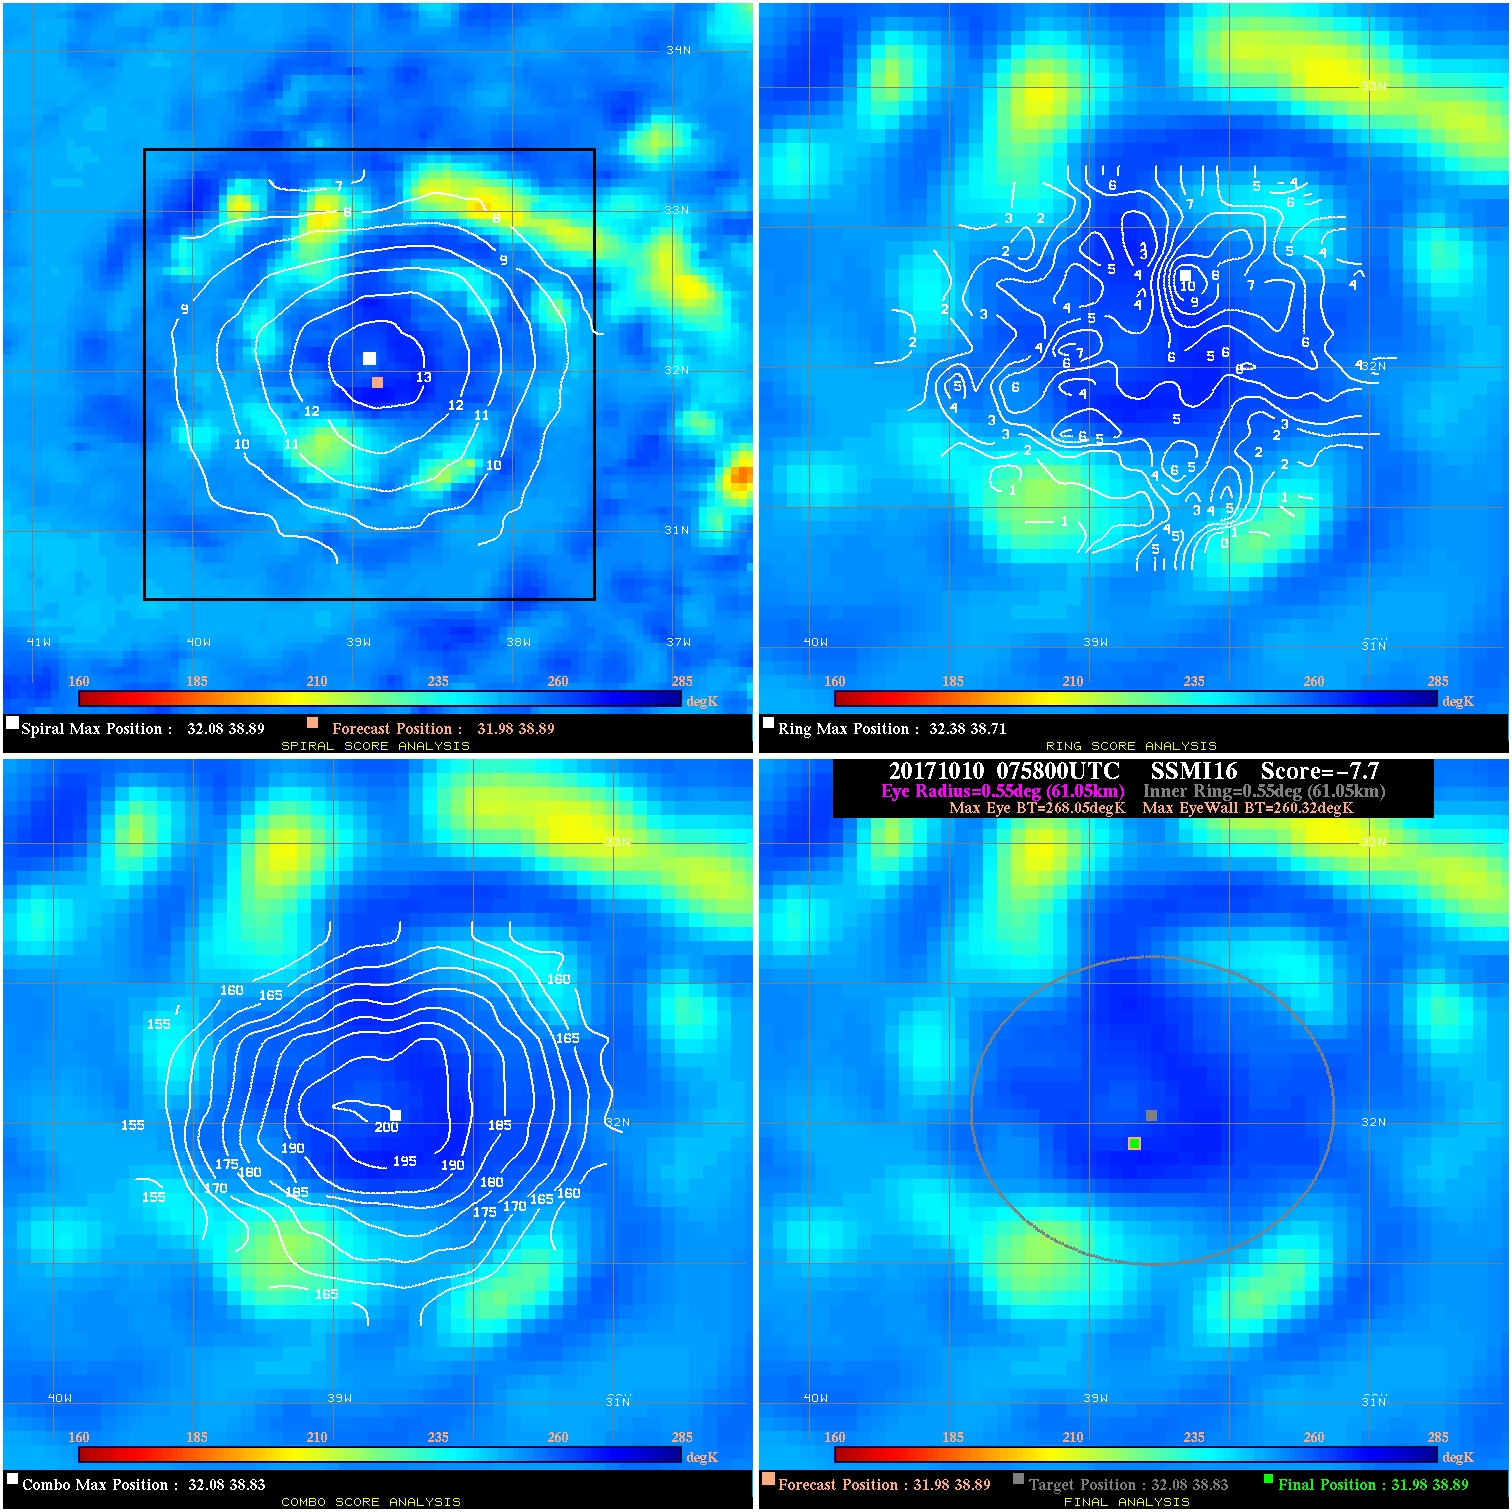
20171010 075800 -7.7 N/A 8.2% 122.21 7.73 45.0 SSMI16 32.0 38.9 32.0 38.9 32.1 38.8 Analysis Plot
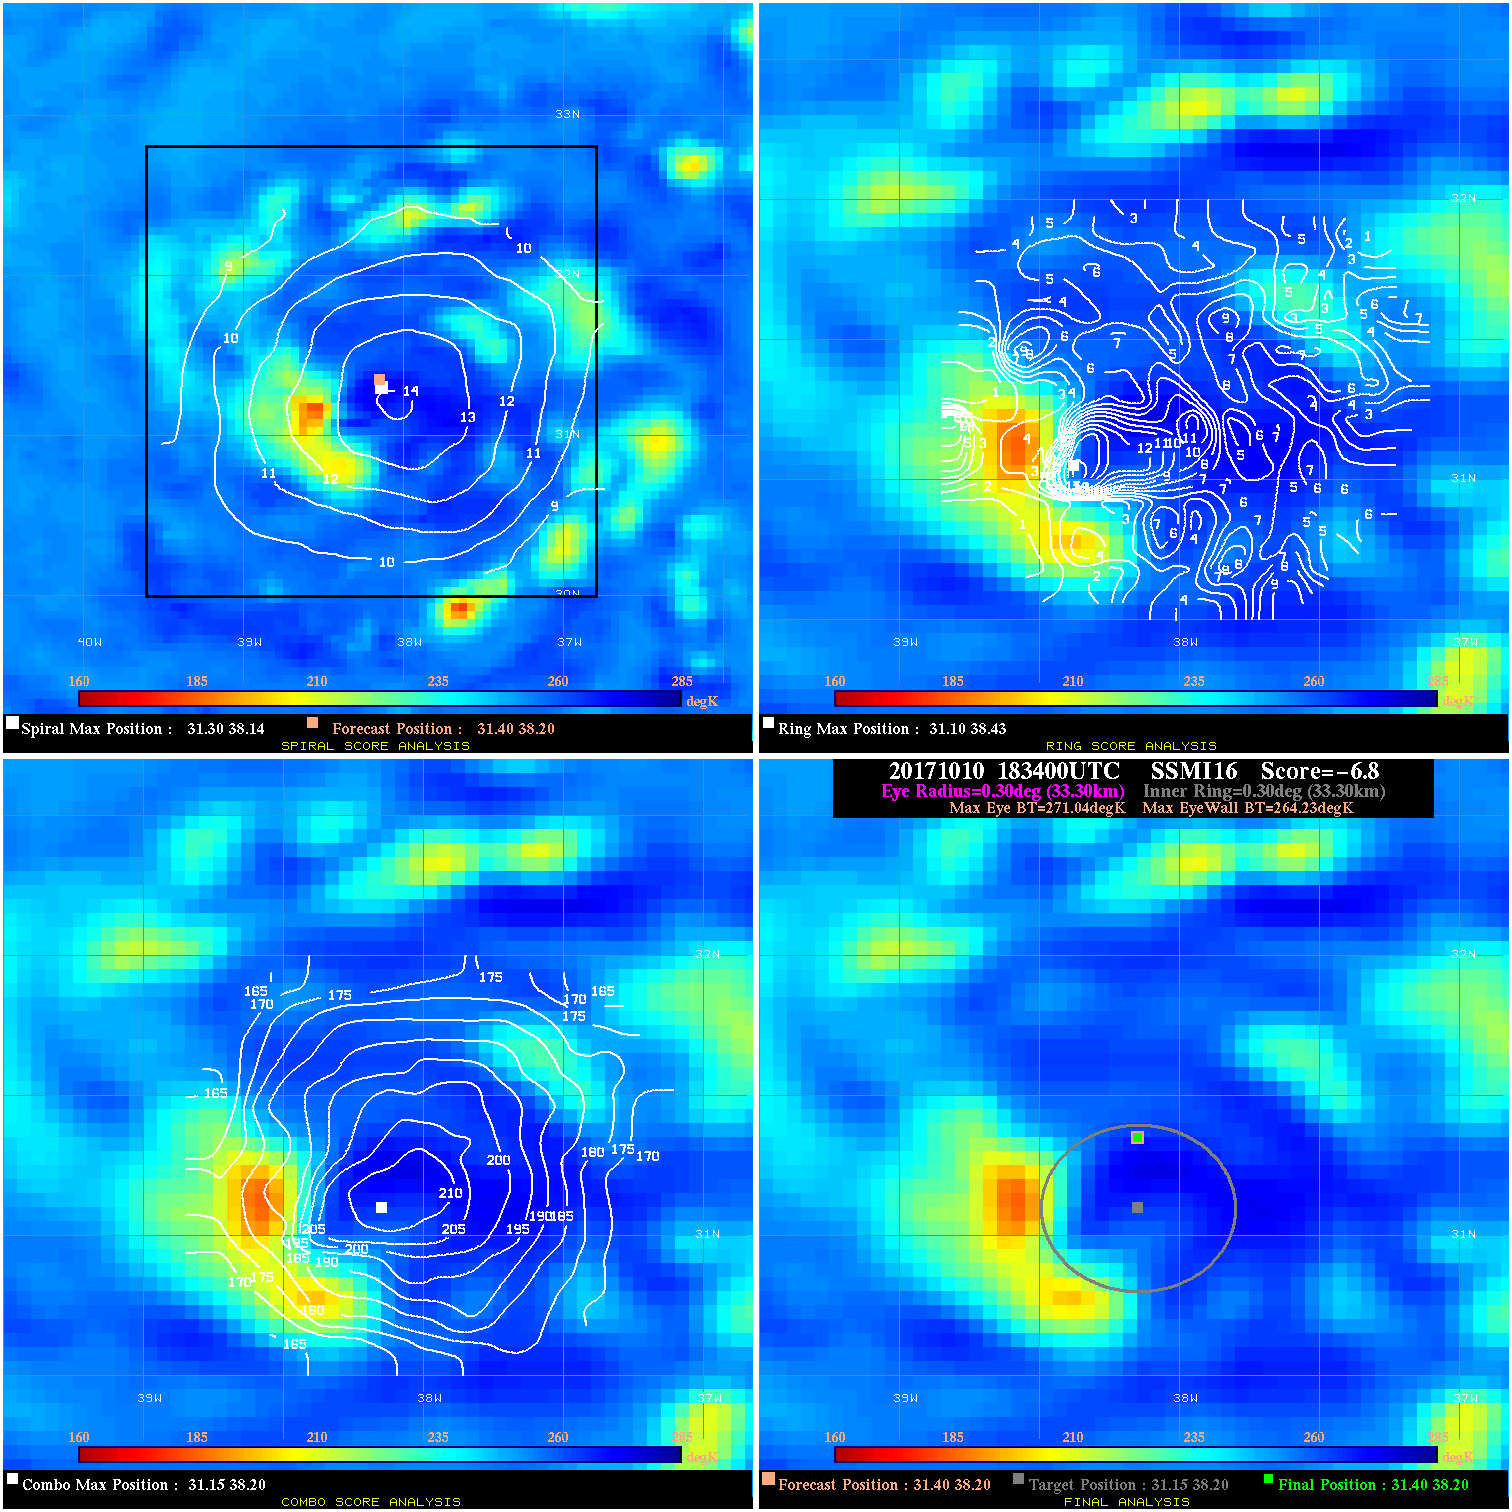
20171010 183400 -6.8 N/A 17.8% 66.66 6.81 45.0 SSMI16 31.4 38.2 31.4 38.2 31.1 38.2 Analysis Plot
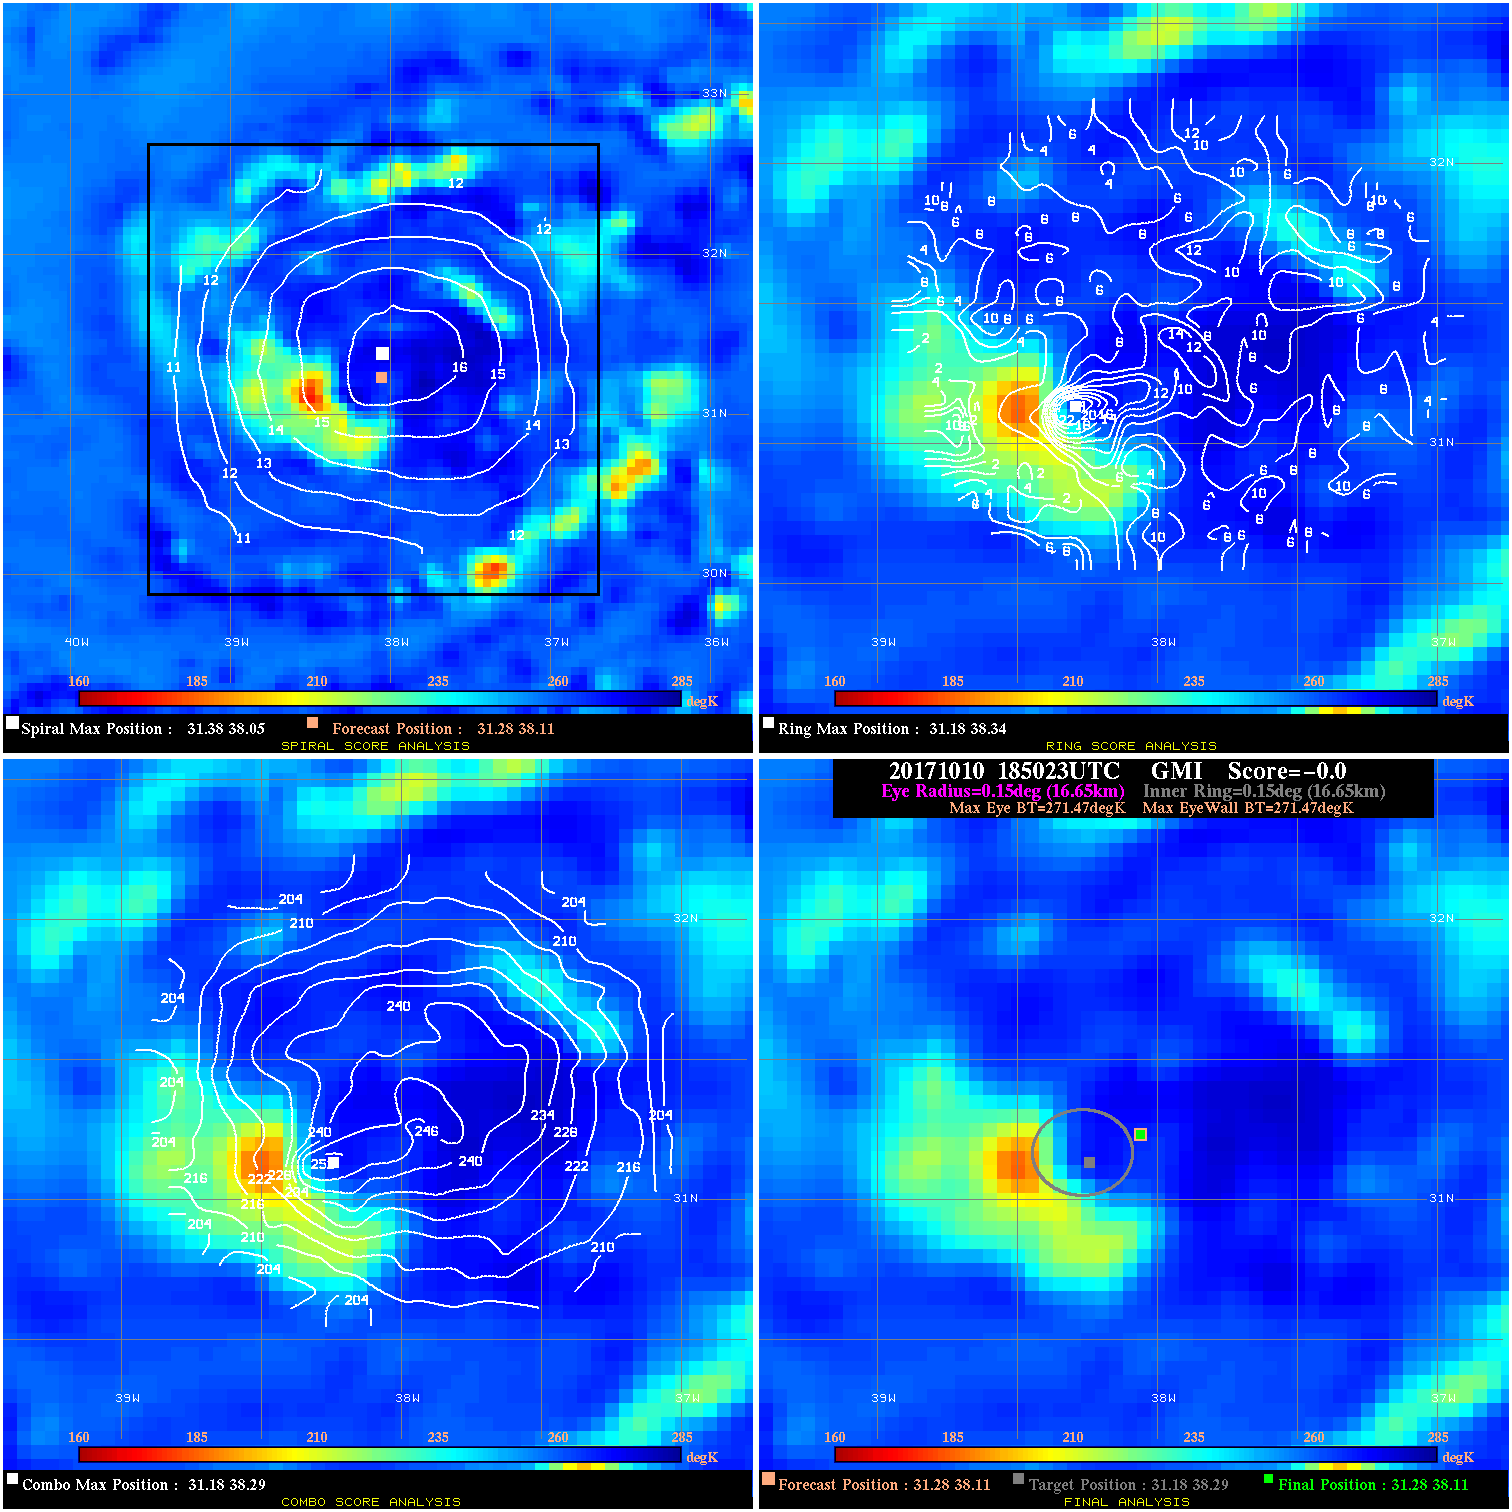
20171010 185023 -0.0 N/A N/A N/A 0.00 45.0 GMI 31.3 38.1 31.3 38.1 31.2 38.3 Analysis Plot
20171011 043435 -6.0 N/A 19.2% 22.22 6.01 45.0 GMI 30.6 37.5 30.6 37.5 30.4 37.4 Analysis Plot
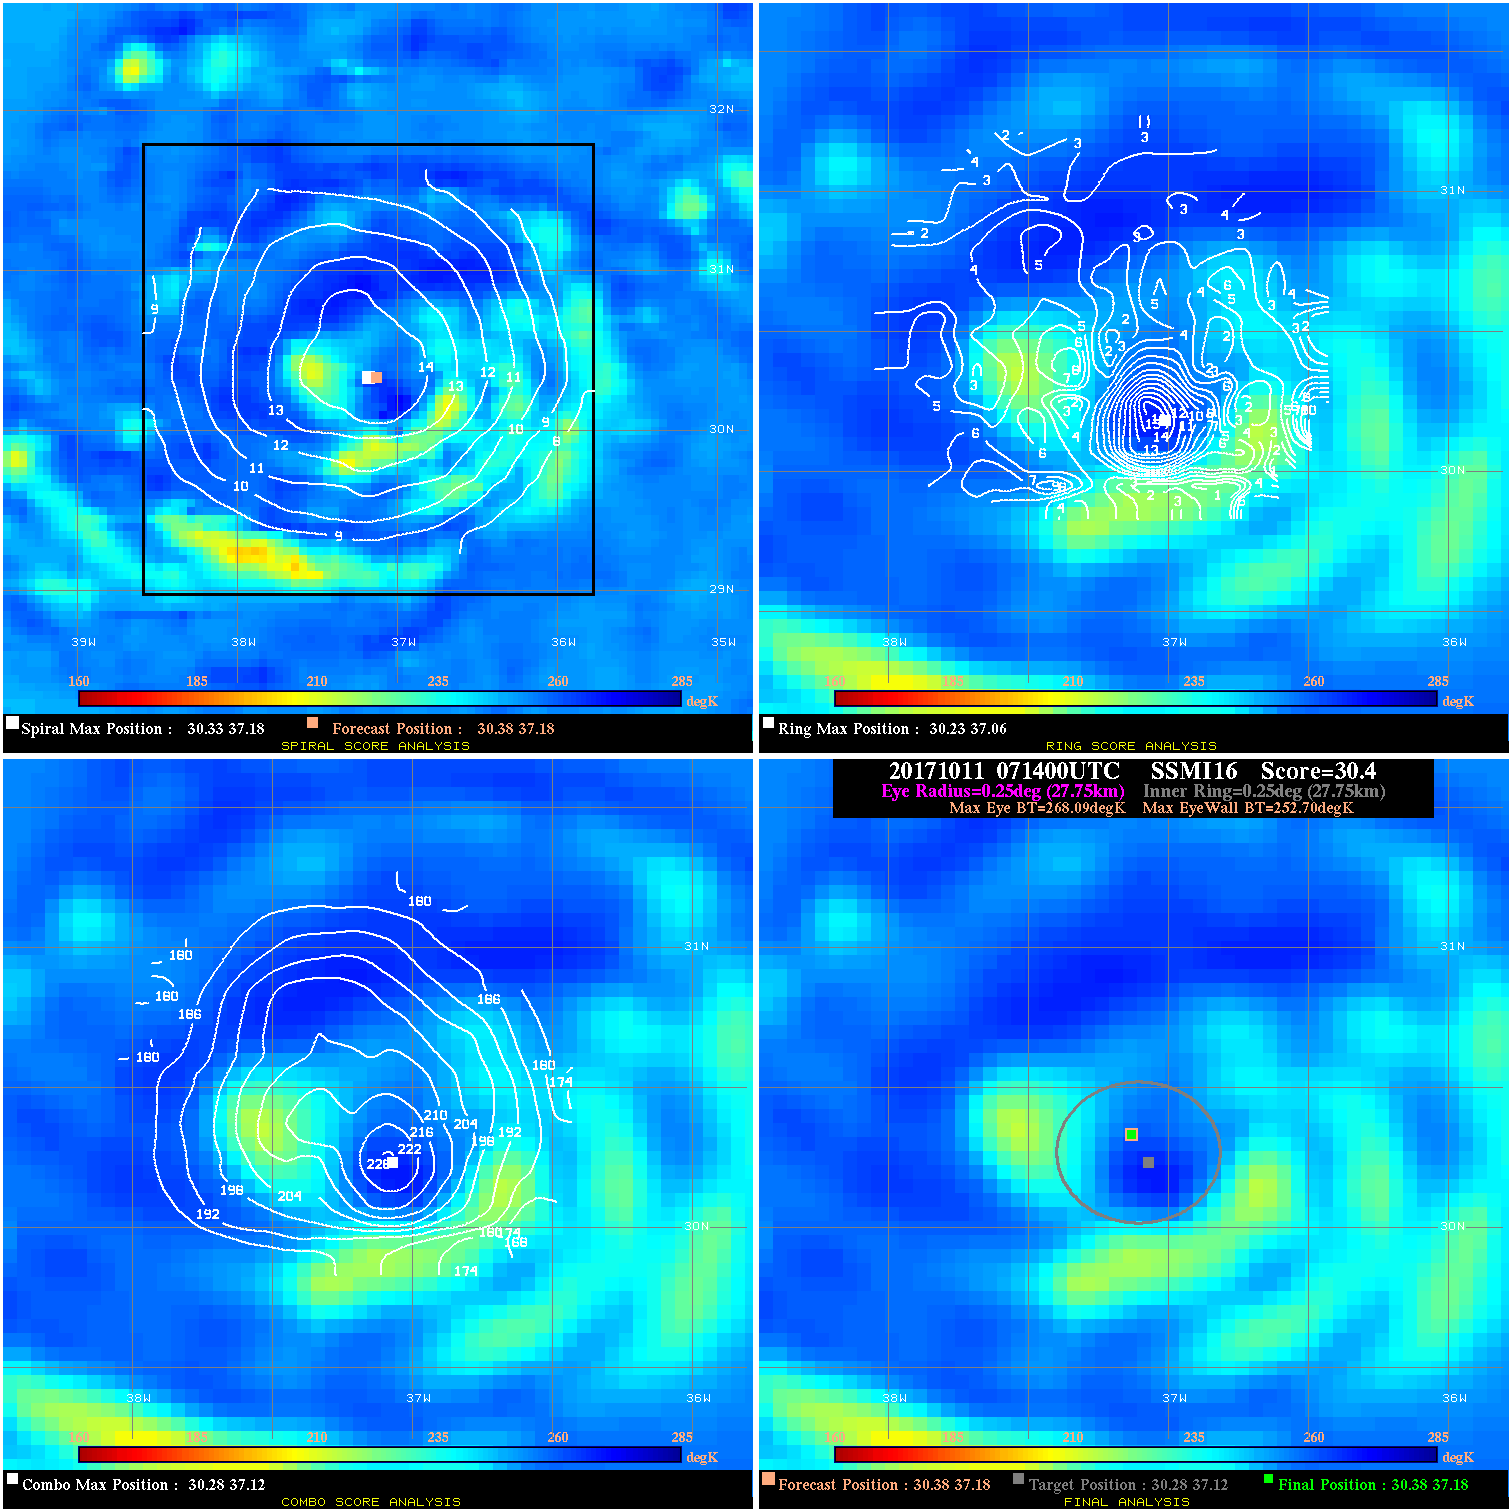
20171011 071400 30.4 >65 kts 86.3% 55.55 15.39 55.0 SSMI16 30.4 37.2 30.4 37.2 30.3 37.1 Analysis Plot
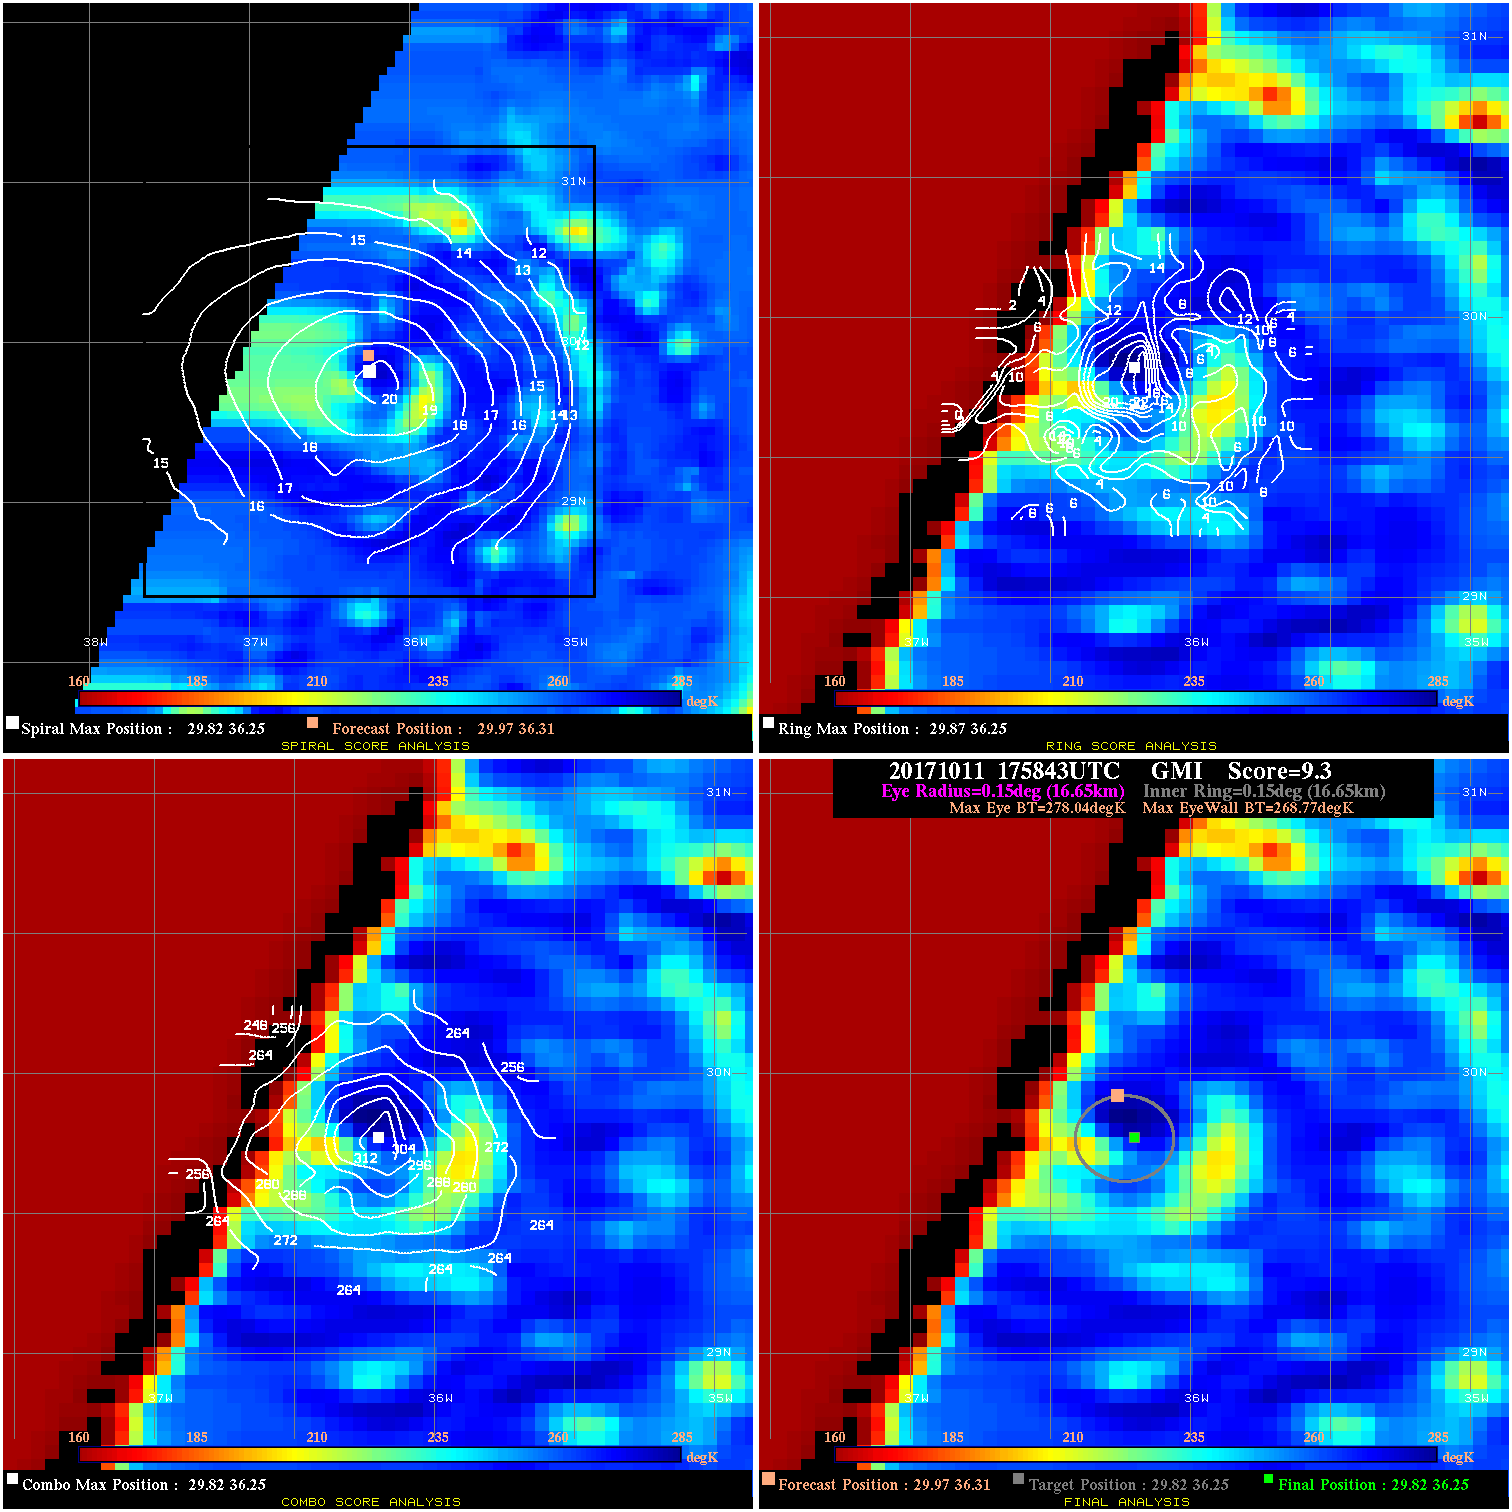
20171011 175843 9.3 N/A 20.5% 33.33 9.27 55.0 GMI 30.0 36.3 29.8 36.3 29.8 36.3 Analysis Plot
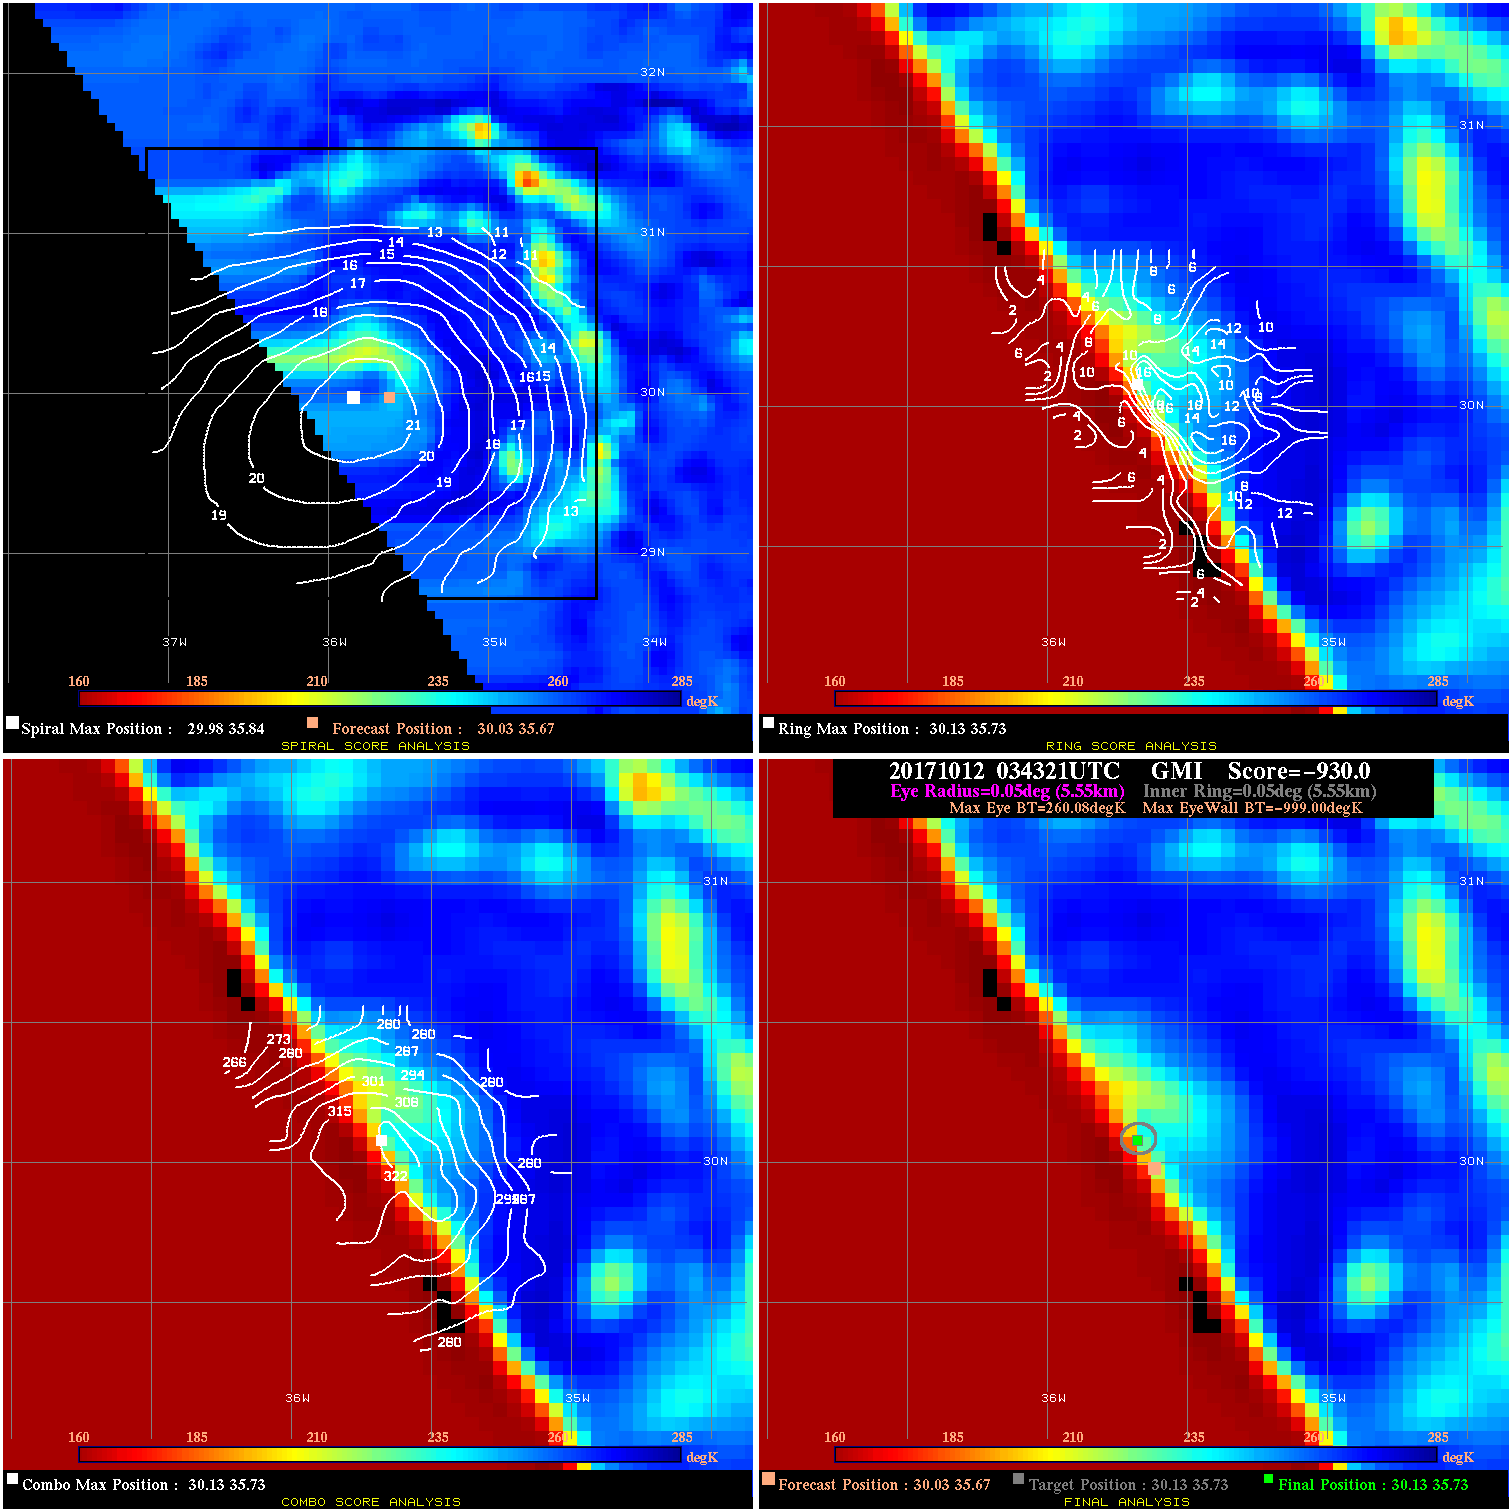
20171012 034321 -930.0 N/A N/A N/A 0.00 70.0 GMI 30.0 35.7 30.1 35.7 30.1 35.7 Analysis Plot
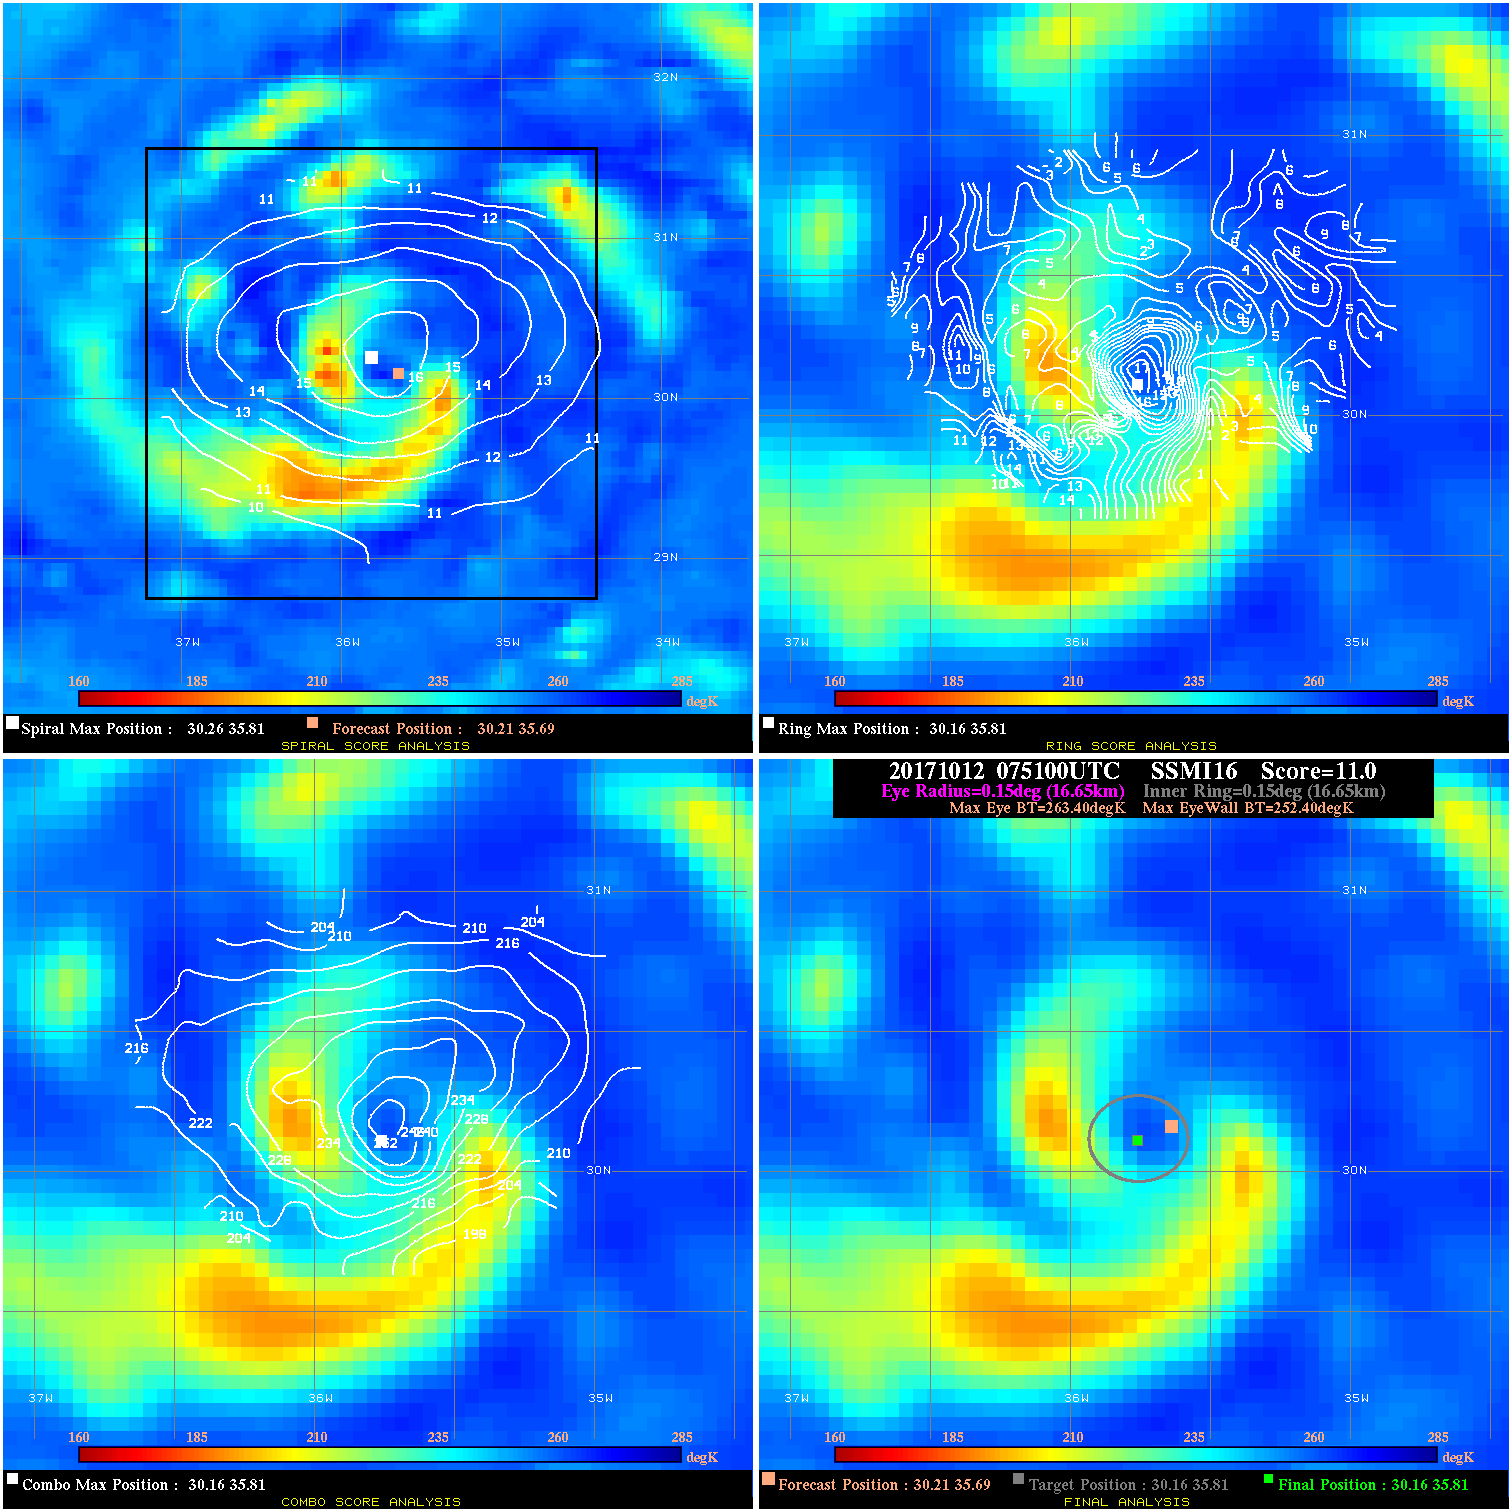
20171012 075100 11.0 N/A 74.0% 33.33 11.00 75.0 SSMI16 30.2 35.7 30.2 35.8 30.2 35.8 Analysis Plot
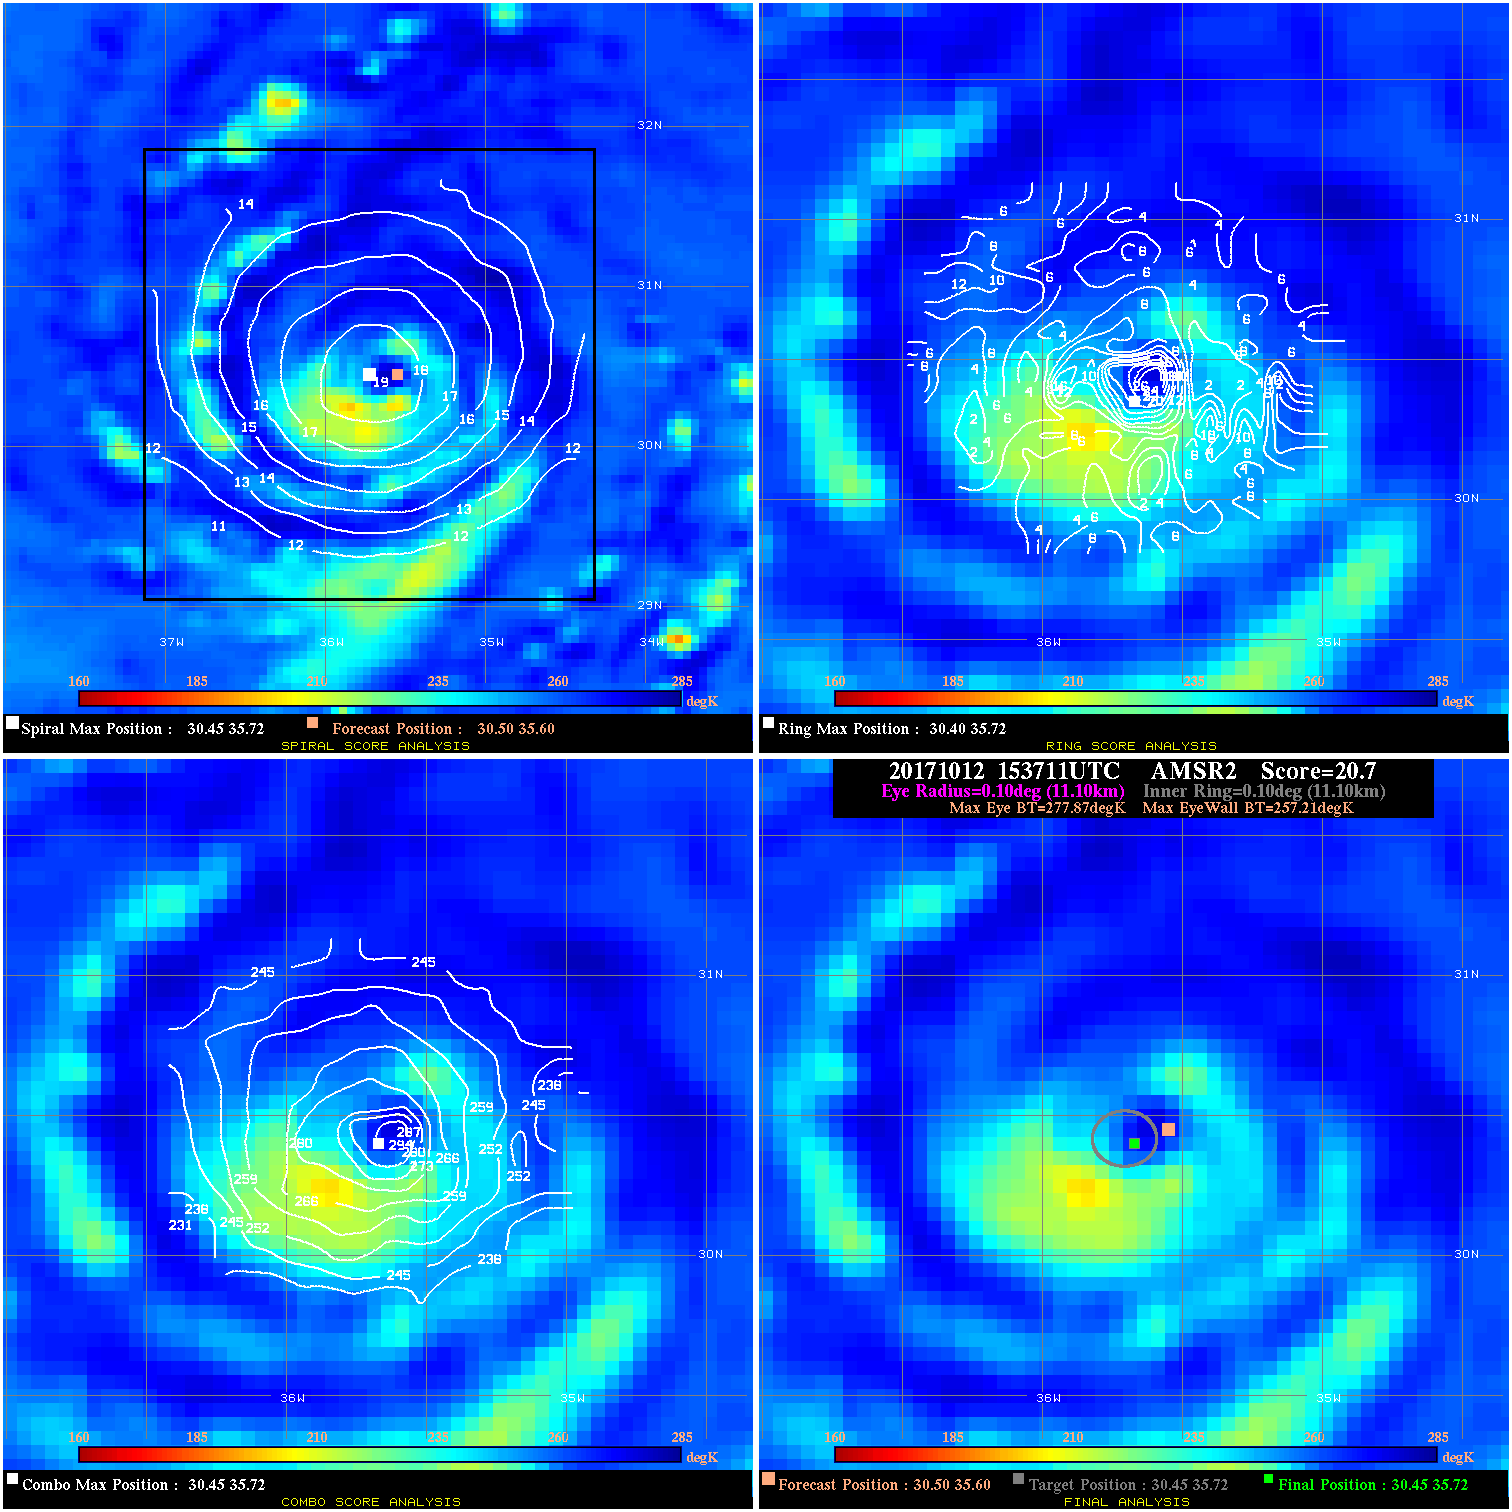
20171012 153711 20.7 >65 kts 45.2% 22.22 20.66 75.0 AMSR2 30.5 35.6 30.5 35.7 30.5 35.7 Analysis Plot
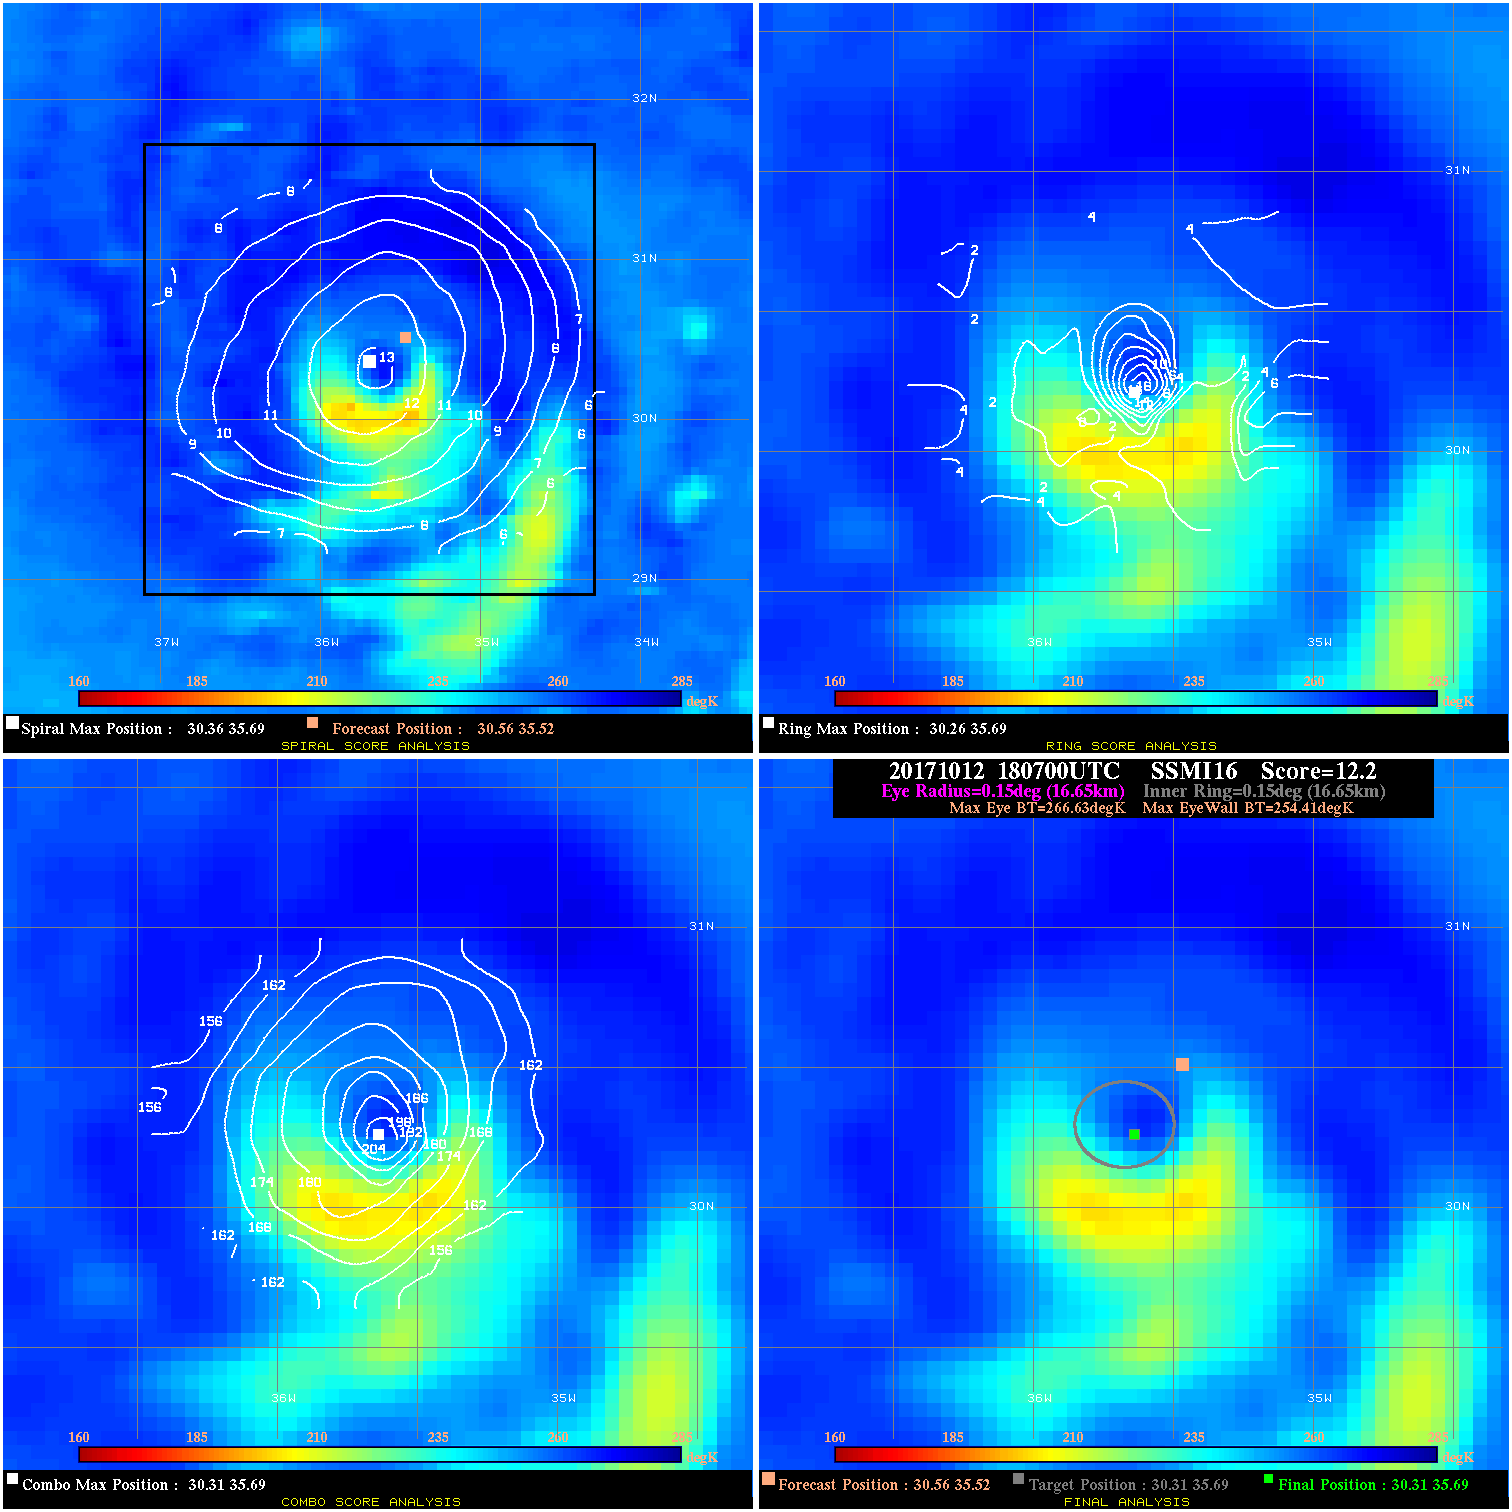
20171012 180700 12.2 N/A 69.9% 33.33 12.22 75.0 SSMI16 30.6 35.5 30.3 35.7 30.3 35.7 Analysis Plot
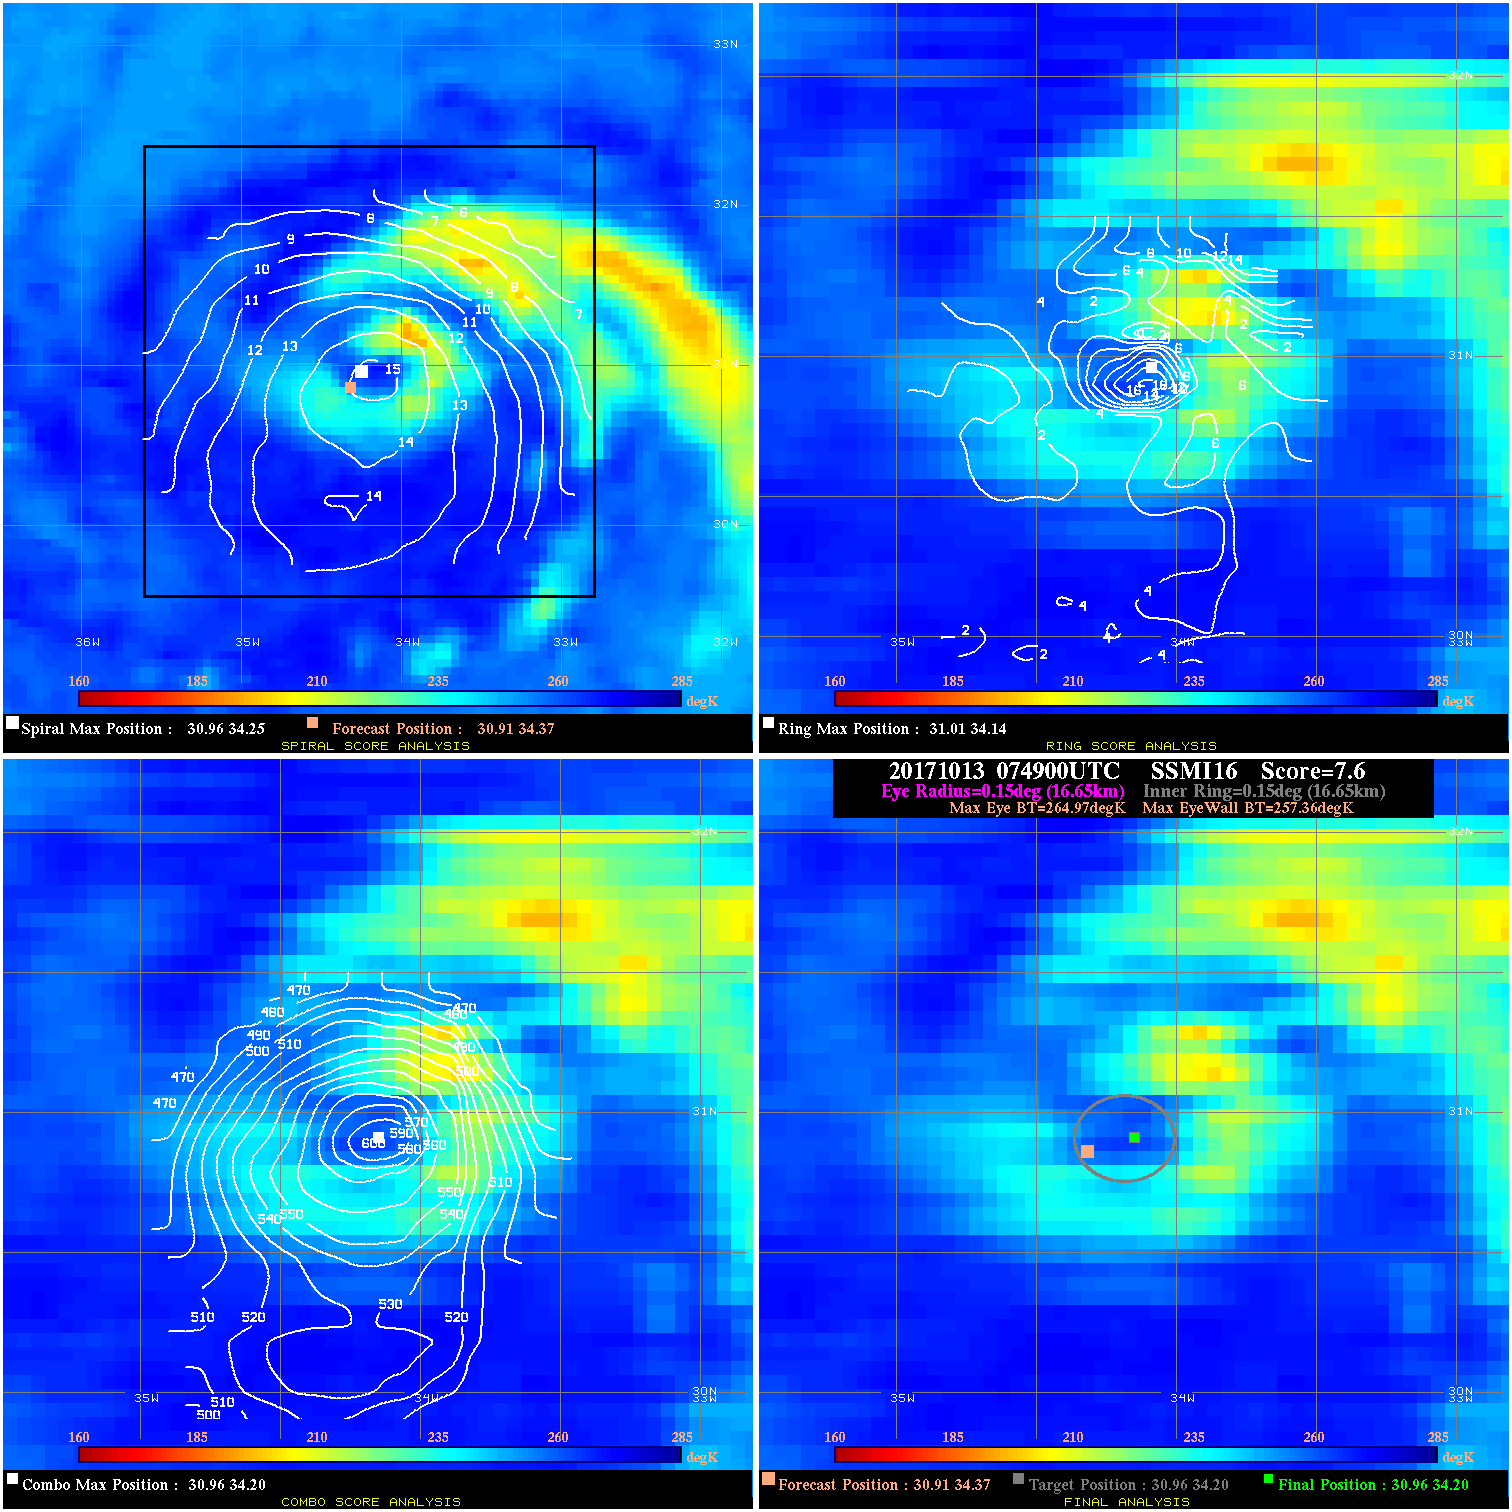
20171013 074900 7.6 N/A 12.3% 33.33 7.61 90.0 SSMI16 30.9 34.4 31.0 34.2 31.0 34.2 Analysis Plot
20171013 175100 11.5 N/A 49.3% 33.33 11.48 90.0 SSMI16 31.9 32.7 31.8 32.5 31.8 32.5 Analysis Plot
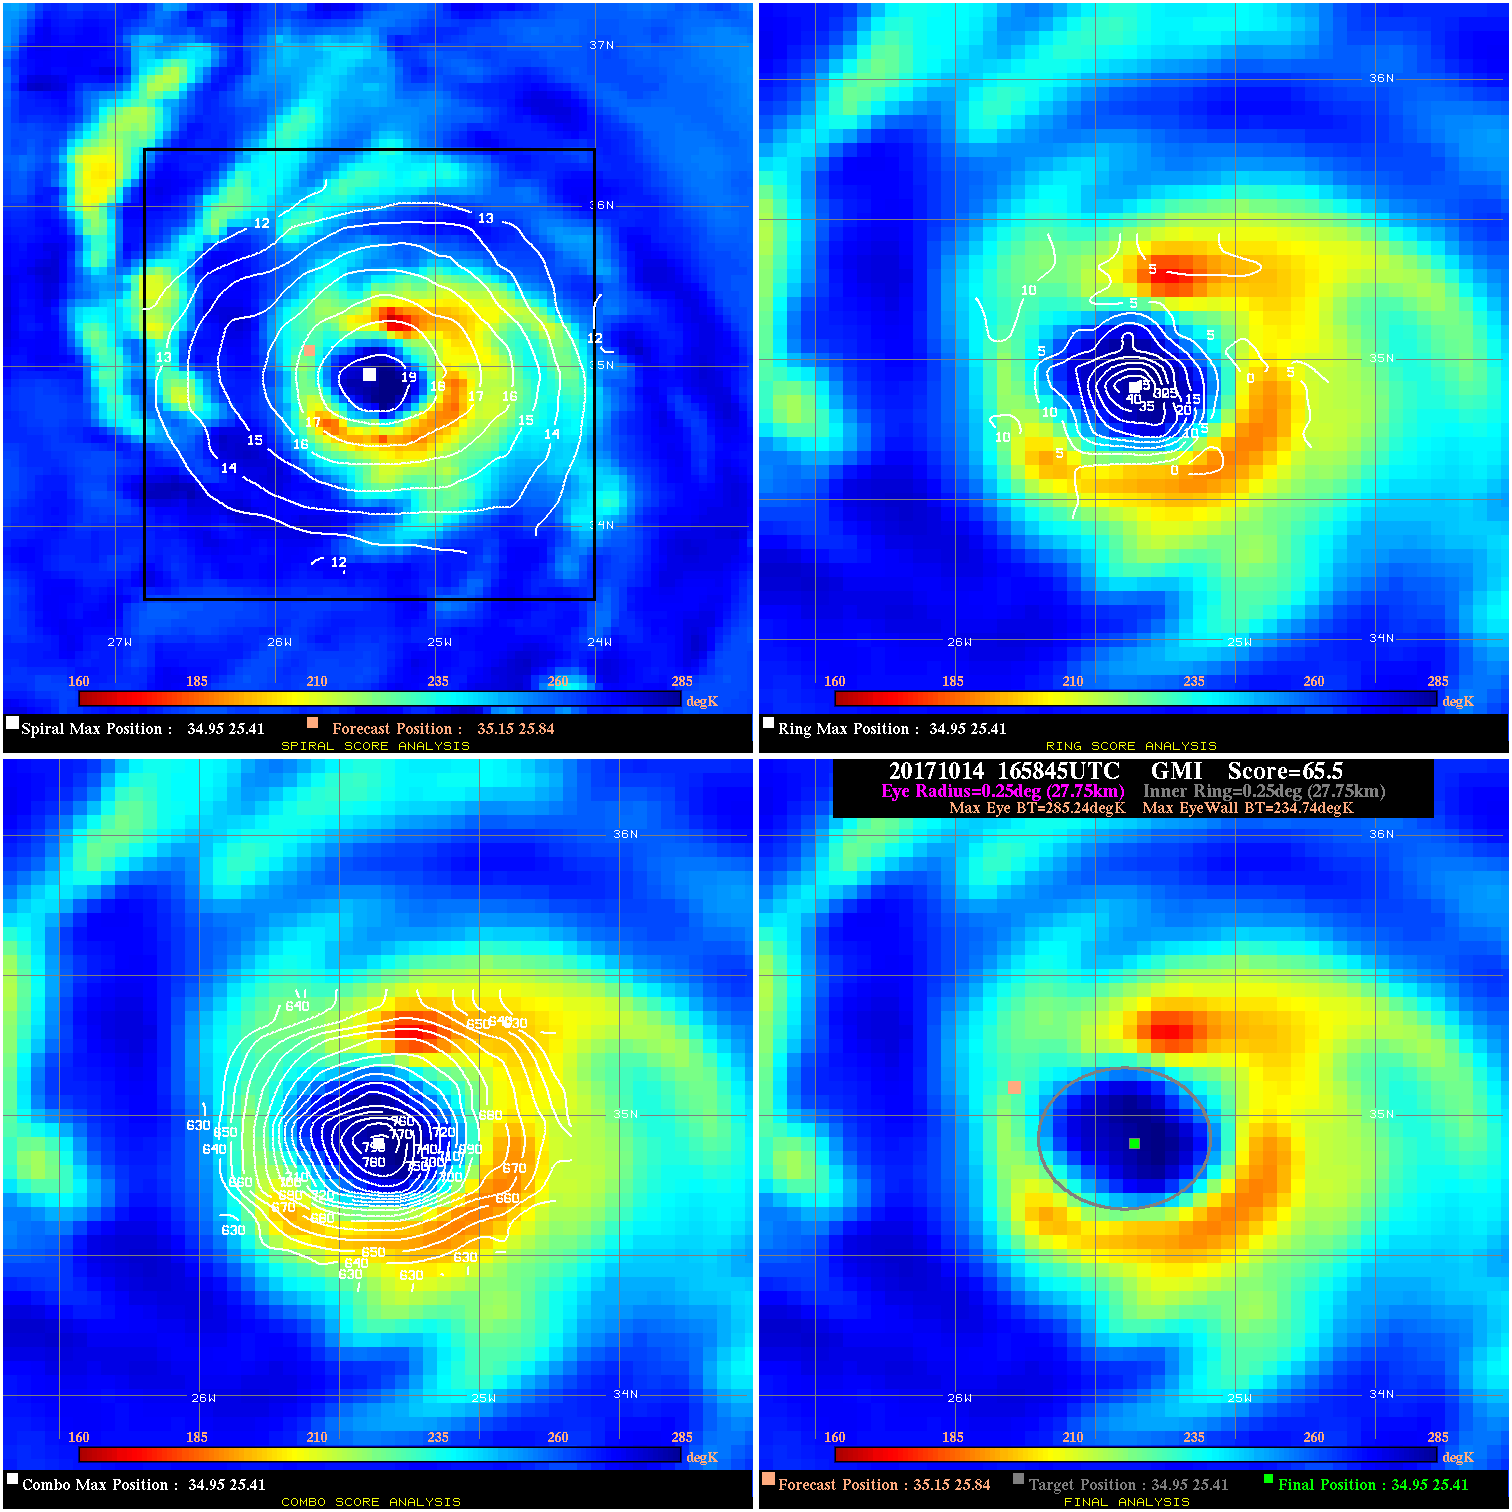
20171014 165845 65.5 >85 kts 100.0% 55.55 50.50 100.0 GMI 35.2 25.8 35.0 25.4 35.0 25.4 Analysis Plot
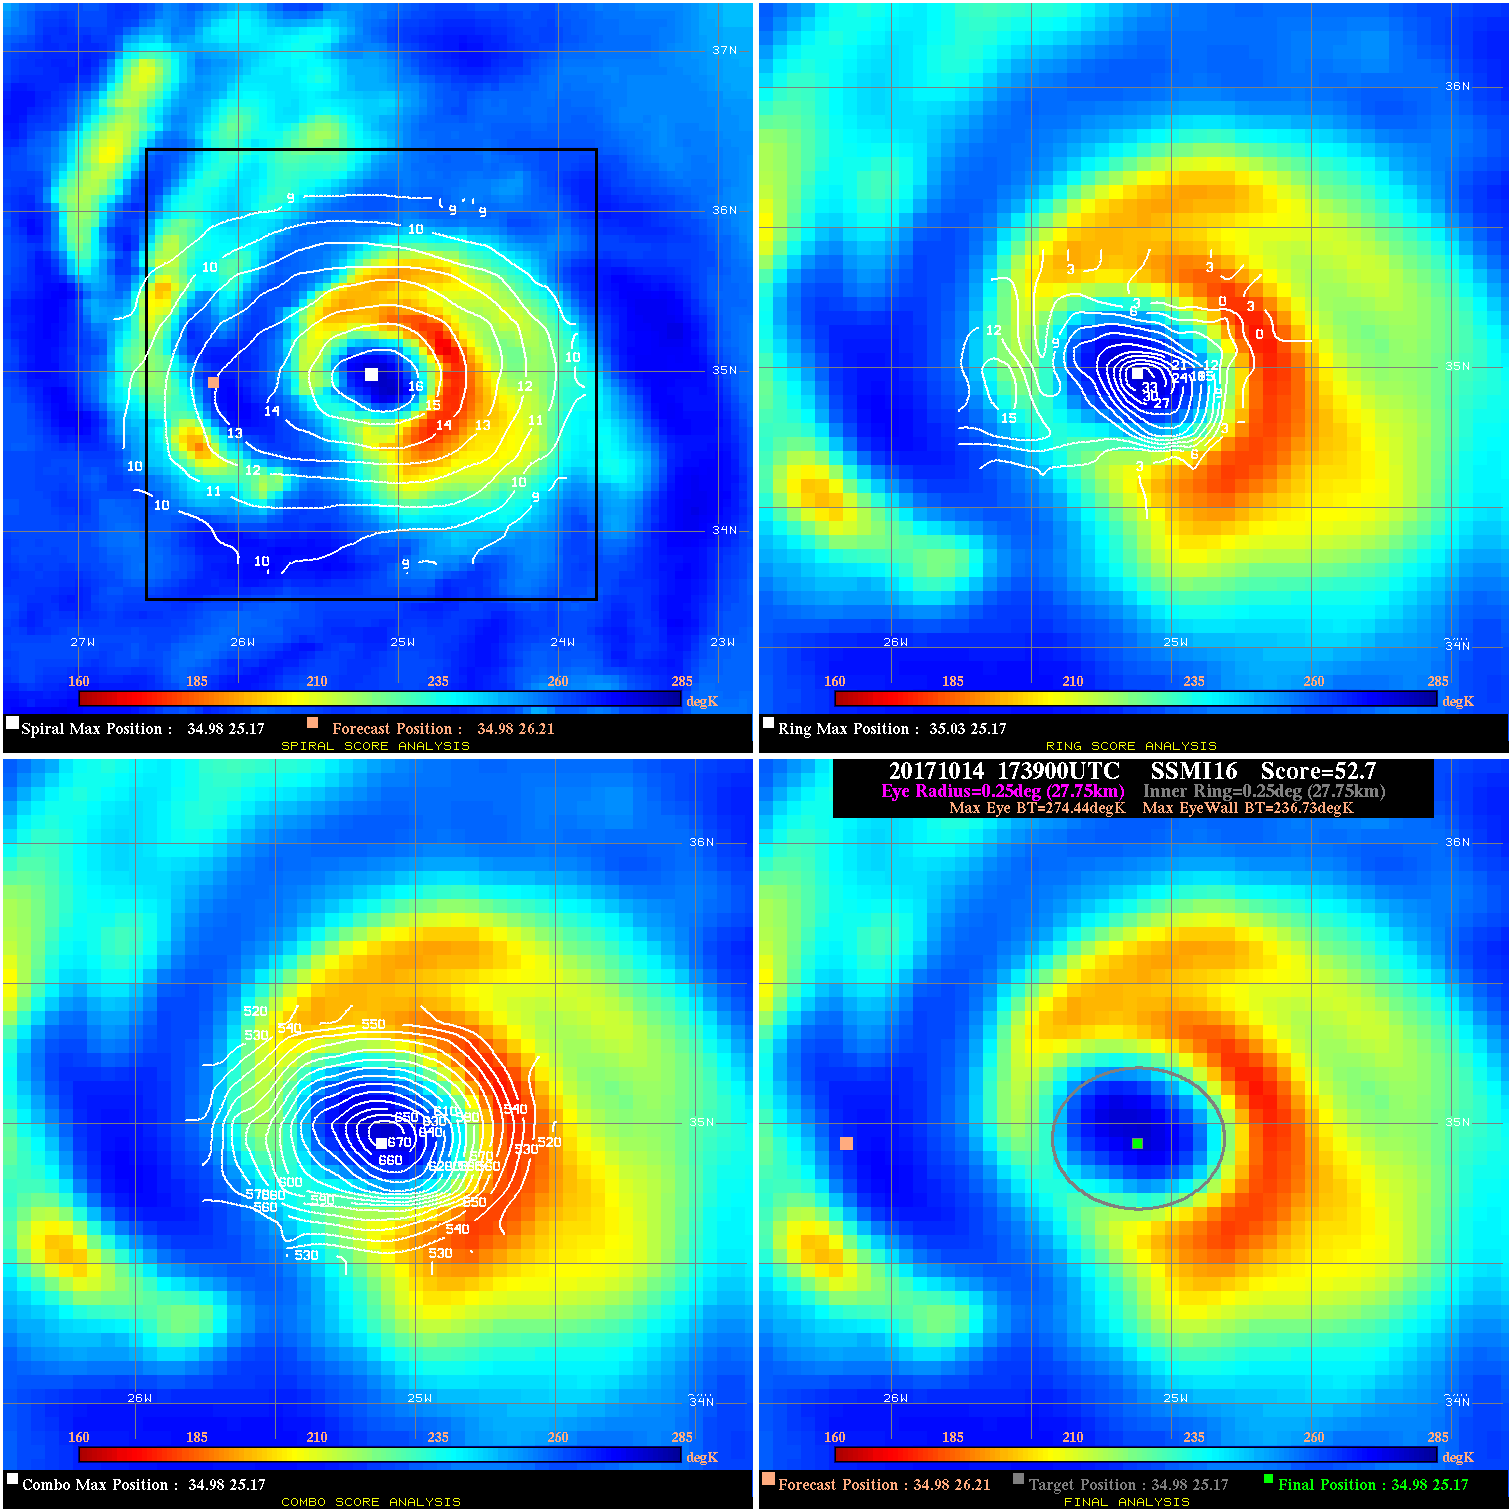
20171014 173900 52.7 >65 kts 100.0% 55.55 37.71 100.0 SSMI16 35.0 26.2 35.0 25.2 35.0 25.2 Analysis Plot
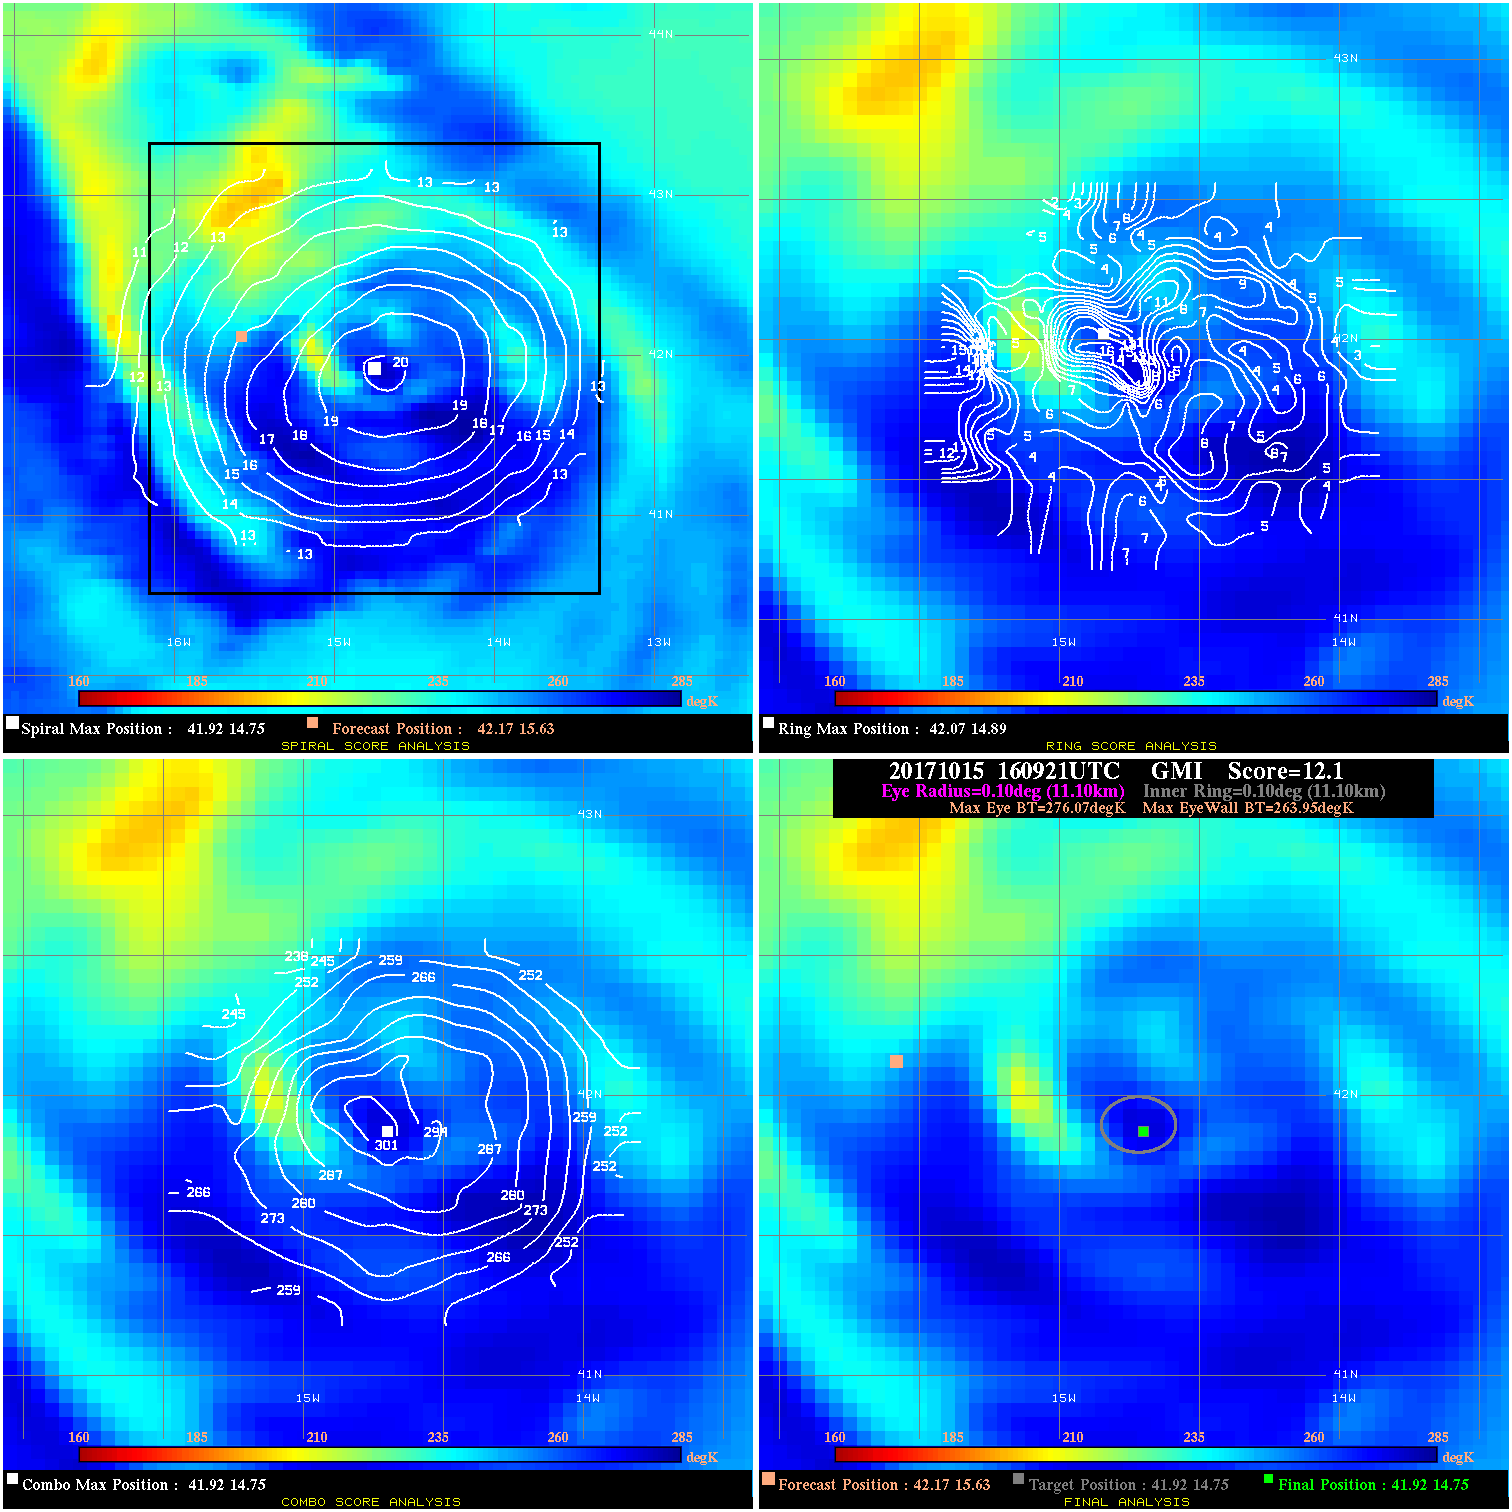
20171015 160921 12.1 N/A N/A 22.22 12.12 80.0 GMI 42.2 15.6 41.9 14.8 41.9 14.8 Analysis Plot
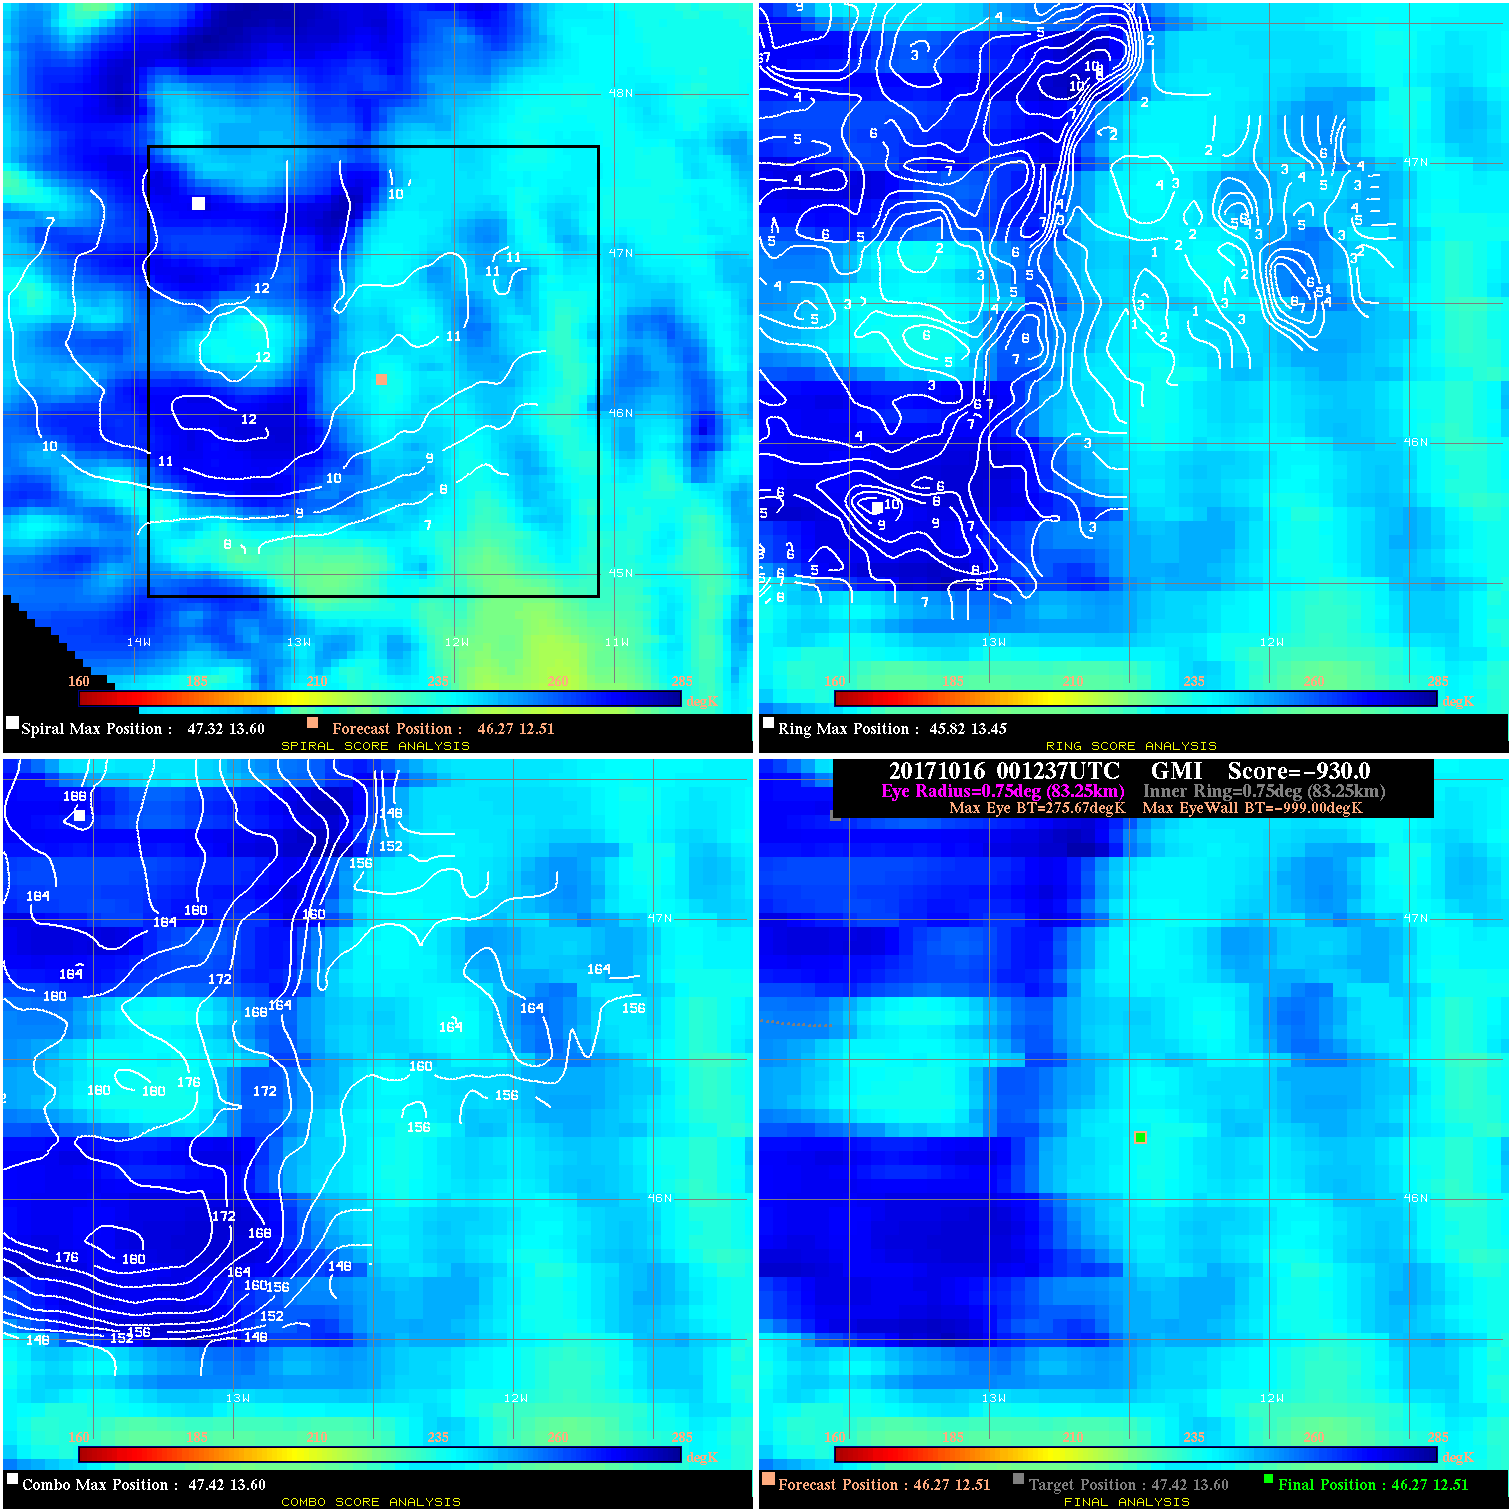
20171016 001237 -930.0 N/A N/A N/A 0.00 75.0 GMI 46.3 12.5 46.3 12.5 47.4 13.6 Analysis Plot
|
|
Legend: - Date/Time are determined from PMW imagery at Forecast (initial guess) Lat/Lon position. - Positive/Negative Latitude = North/South Hemisphere; Longitude = Western/Eastern Hemisphere. - "Ring Diam" value indicates the estimated surface eyewall diameter in km (the MI eyewall edge diameter minus 10 km). - "Ring Pct" is the percentage of the "ring" (eyewall inner boundary) that is 1) colder than the "hot spot" (warmest eye pixel) in the eye by 20K, or 2) the percentage that is a) colder than 232K and b) colder than the "hot spot" by 10K, whichever is greater. - Values are red if Ring % <= 65, yellow/brown if Ring % <= 85 and green if Ring % > 85. - "Tb diff" is the difference between the "hot spot" (warmest eye pixel) and the warmest pixel on the eyewall. - Intensity score are listed as negative, and not used, when the JTWC or NHC estimated Vmax is <55 kts in order to rule out weak but highly symmetric TCs. - Error messages in intensity scores: -920 is used when the hottest pixel in the eye is <200K, to prevent false positives; -930 means <85% of eyewall has observations/data. |