Tropical Storm 08P
|
Passive Microwave (PMW) Intensity Information Advanced Dvorak Technique (ADT) Version 8.2.1 |
Overpass Inten Ring Ring Wind Forecast Final Target
Date Time Score Meaning Pct Diam BTdiff Est Sat Lat Lon Lat Lon Lat Lon
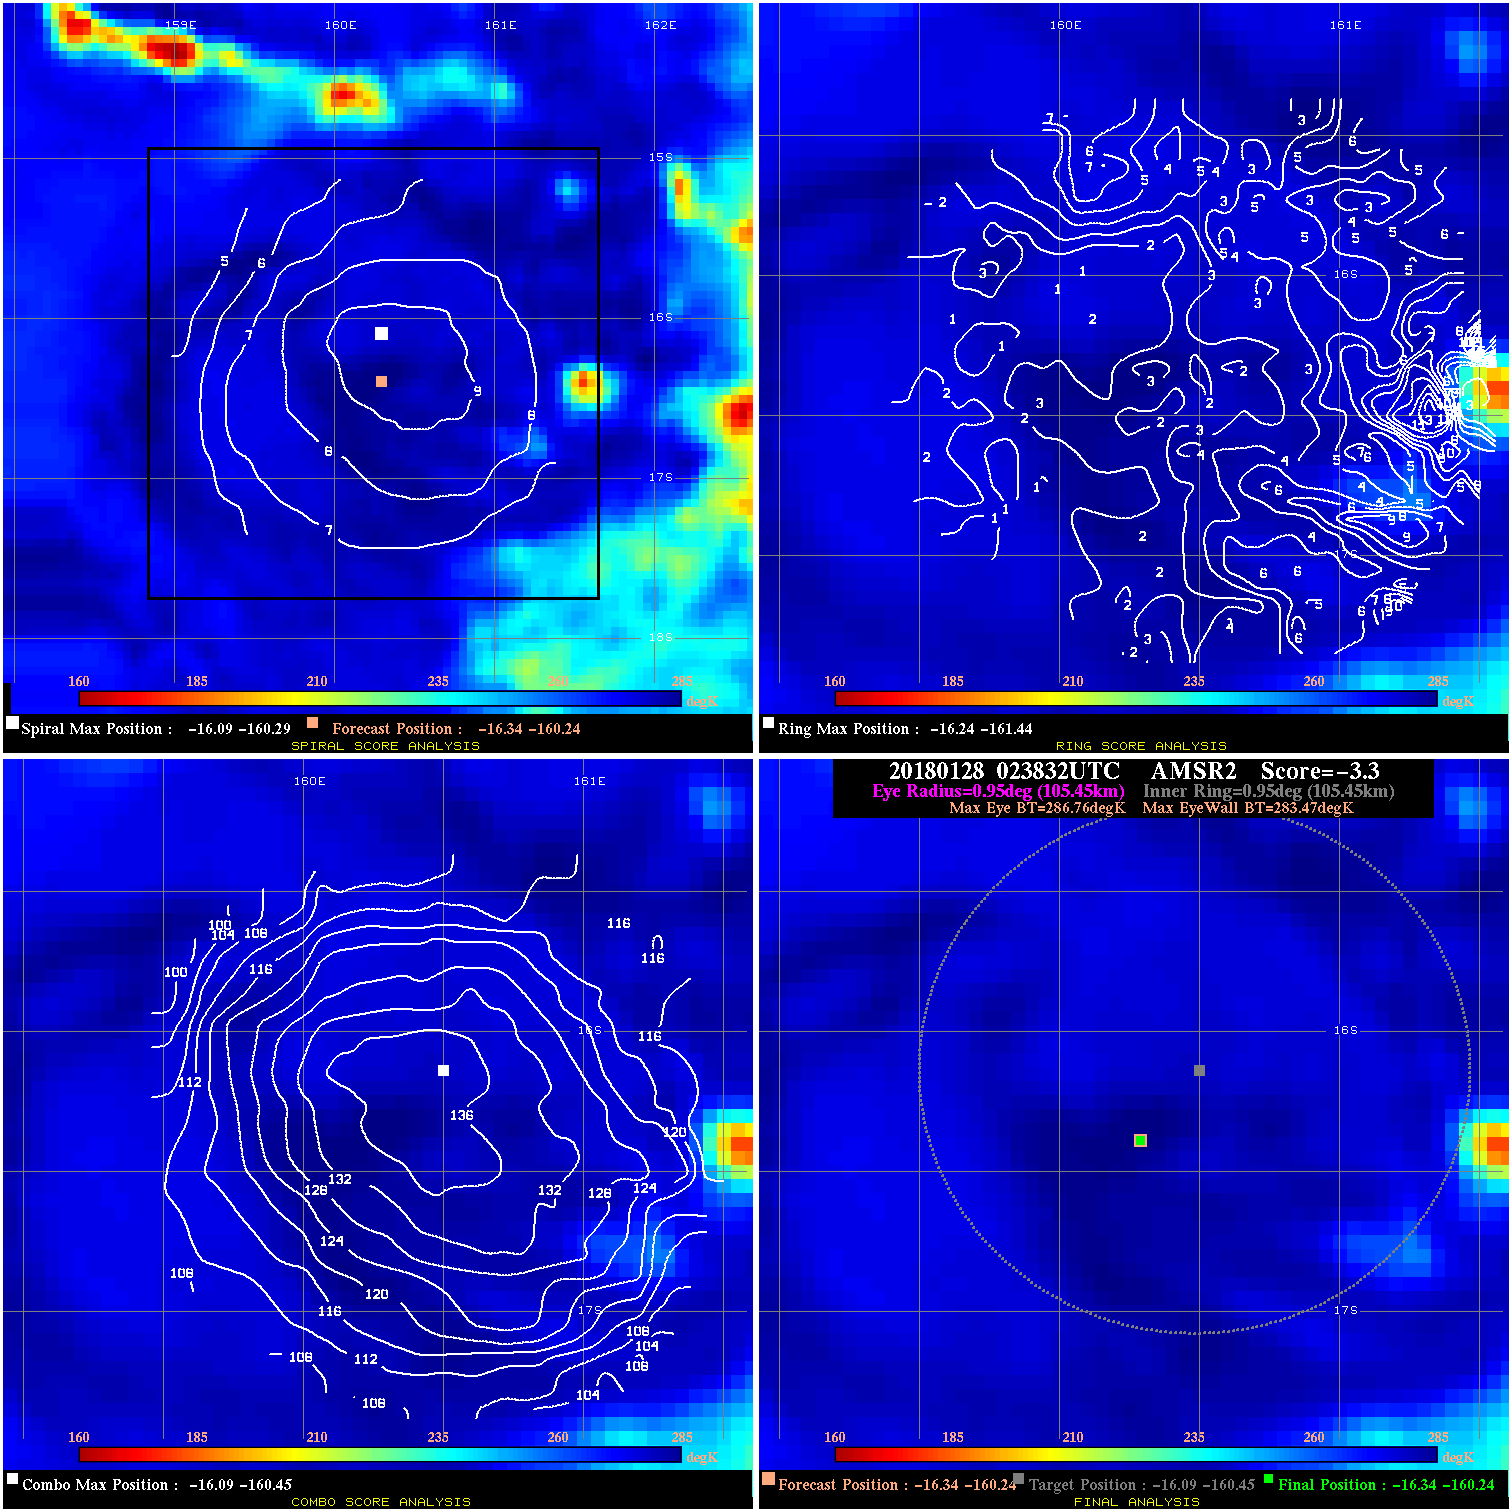
20180128 023832 -3.3 N/A 2.7% 211.09 3.29 35.0 AMSR2 -16.3 -160.2 -16.3 -160.2 -16.1 -160.4 Analysis Plot
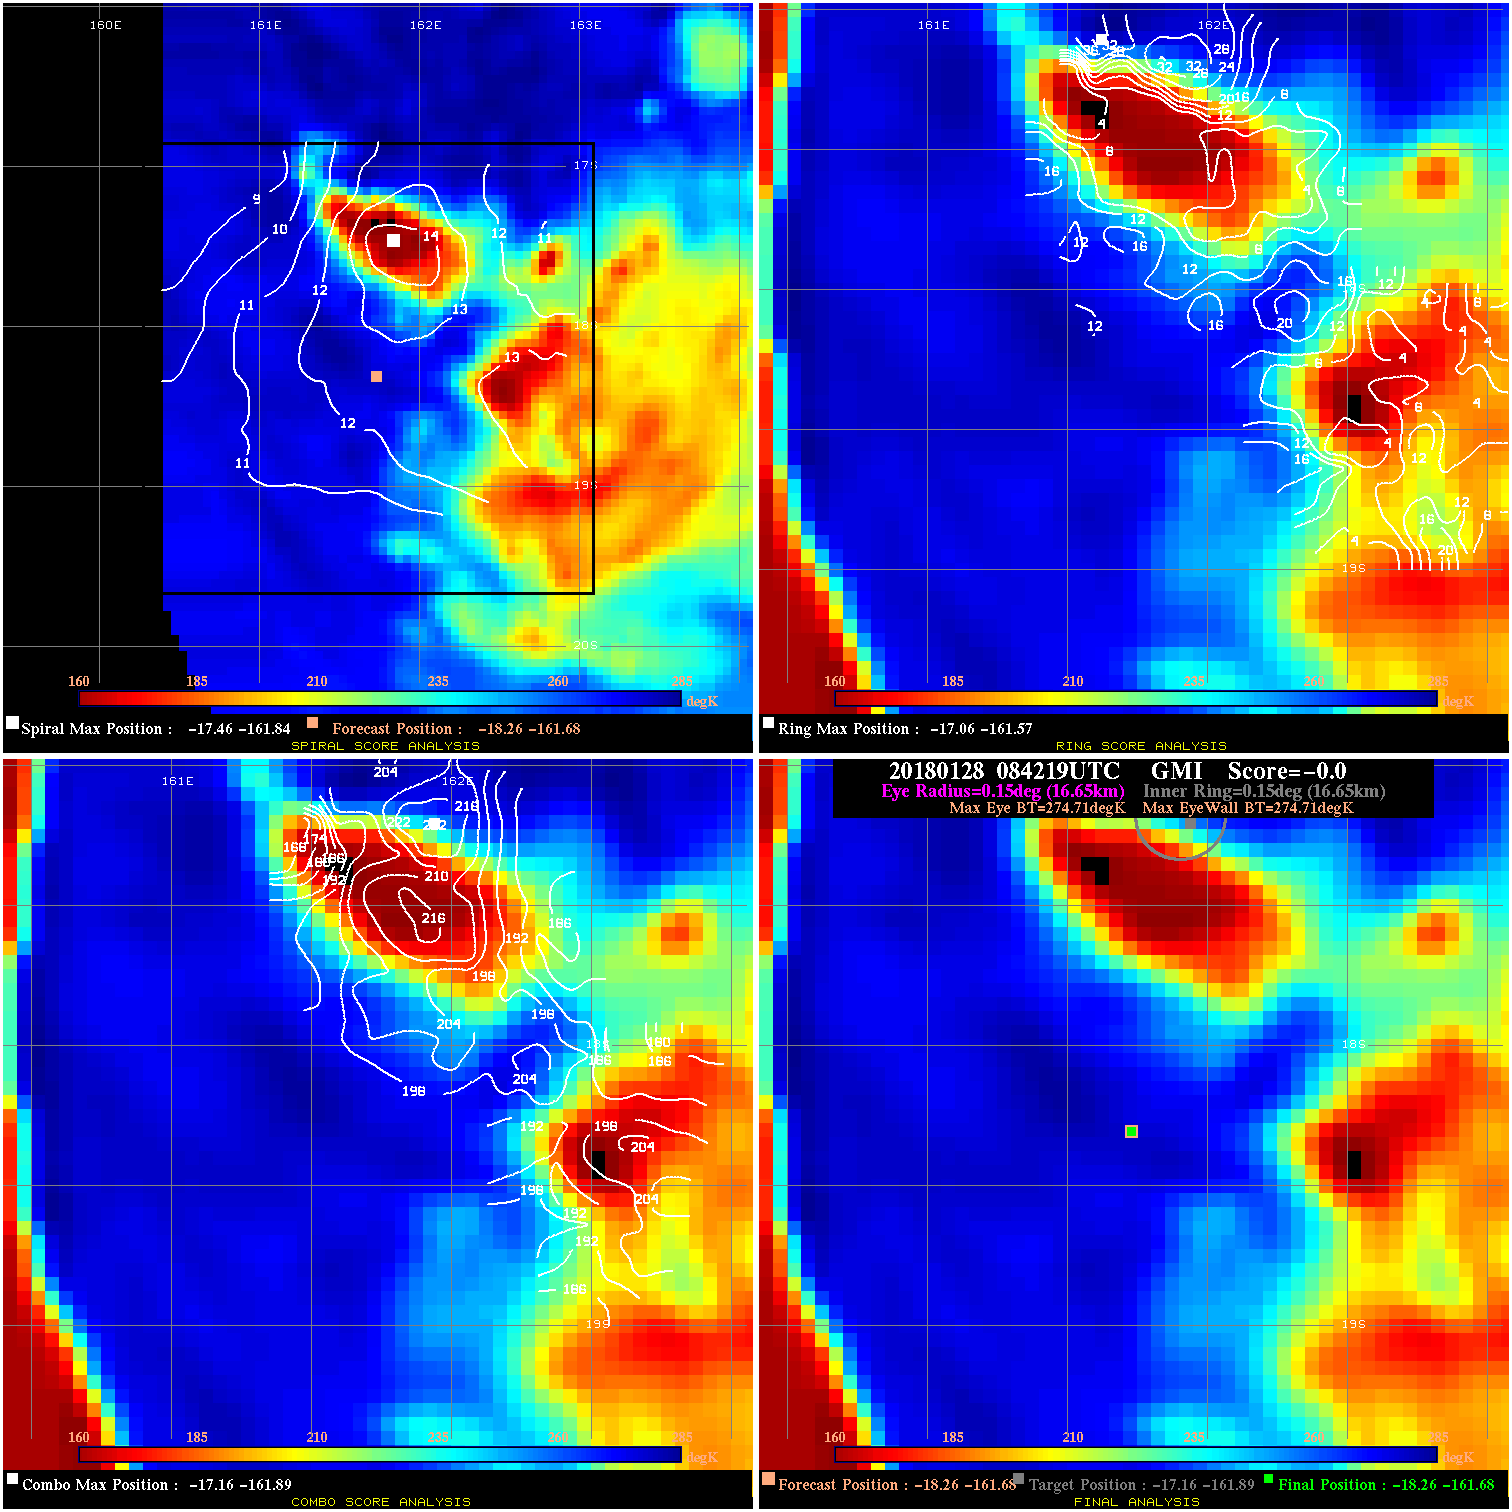
20180128 084219 -0.0 N/A N/A N/A 0.00 35.0 GMI -18.3 -161.7 -18.3 -161.7 -17.2 -161.9 Analysis Plot
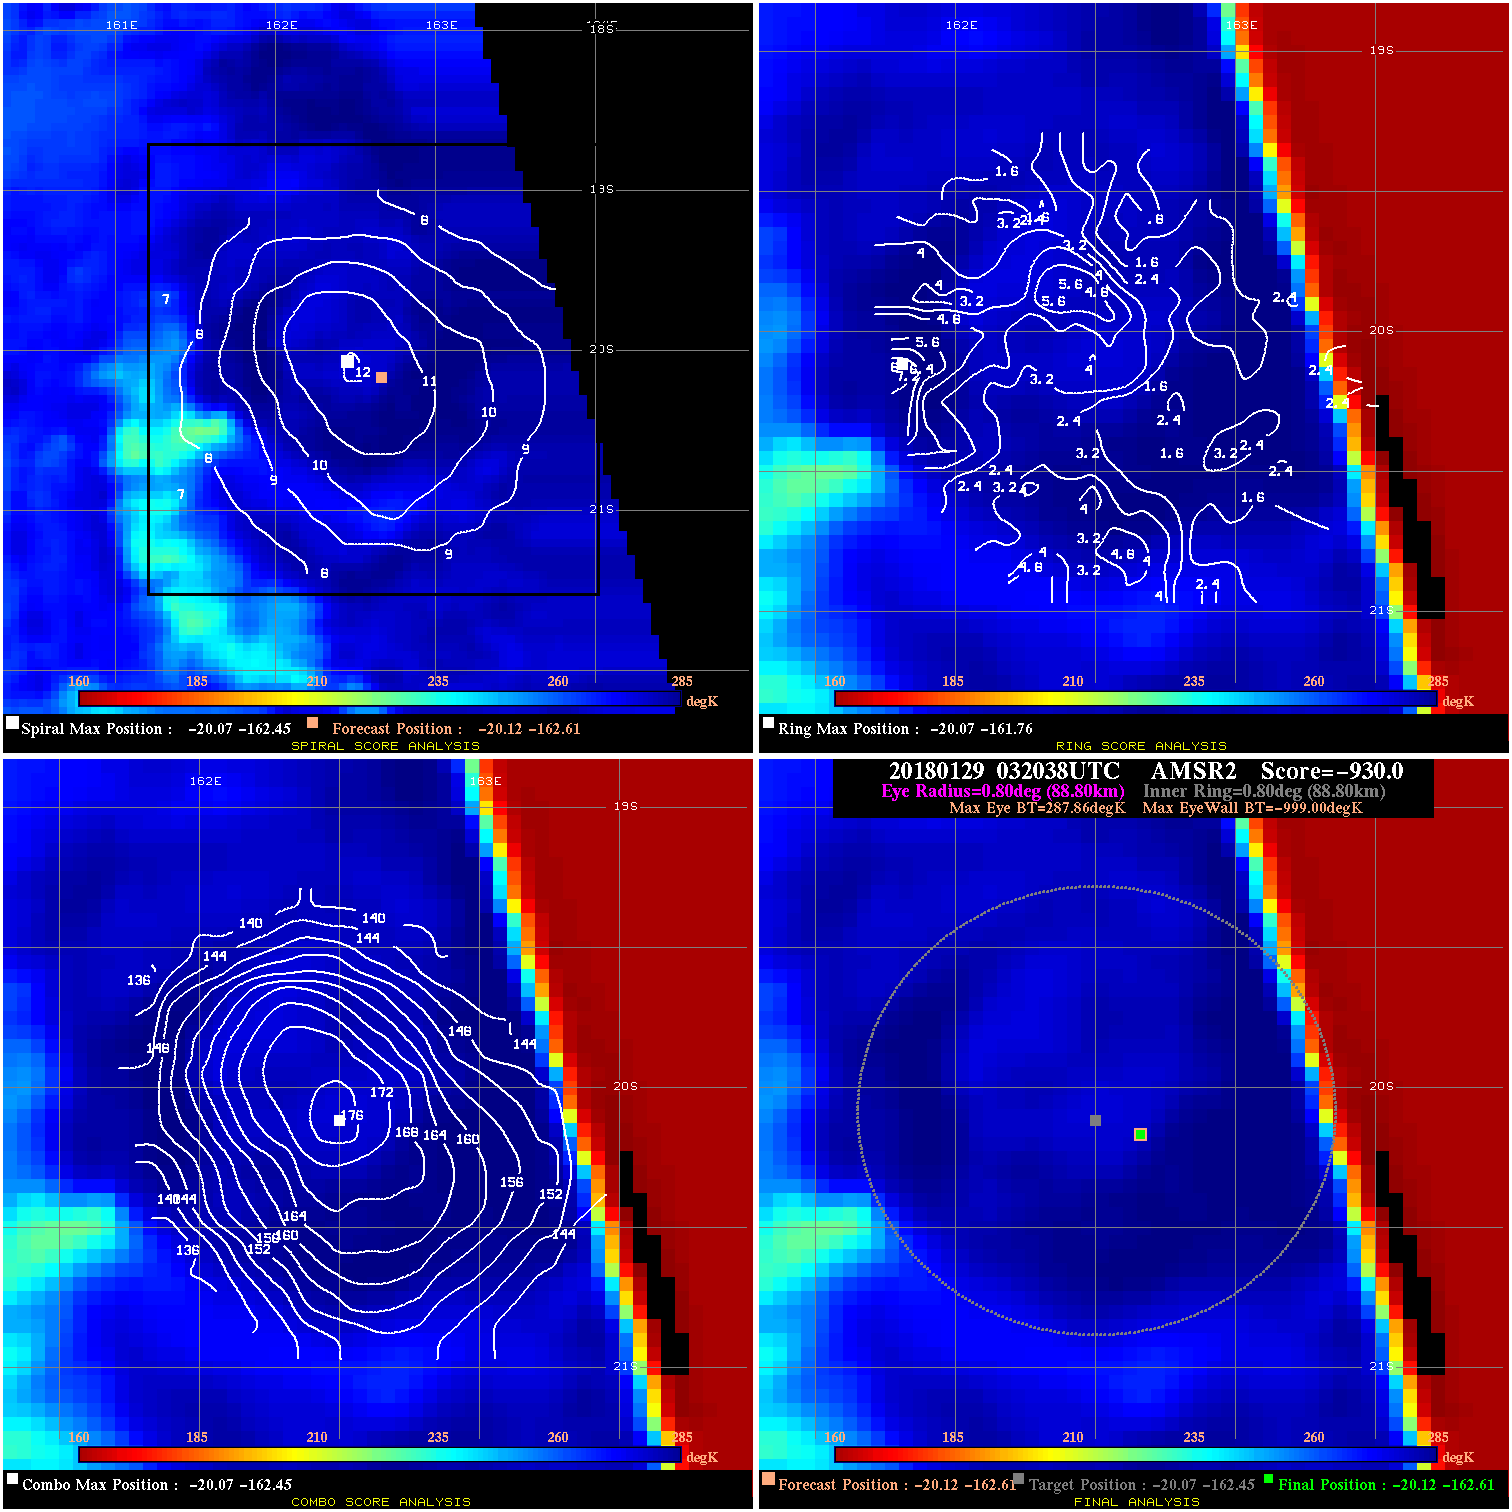
20180129 032038 -930.0 N/A N/A N/A 0.00 50.0 AMSR2 -20.1 -162.6 -20.1 -162.6 -20.1 -162.4 Analysis Plot
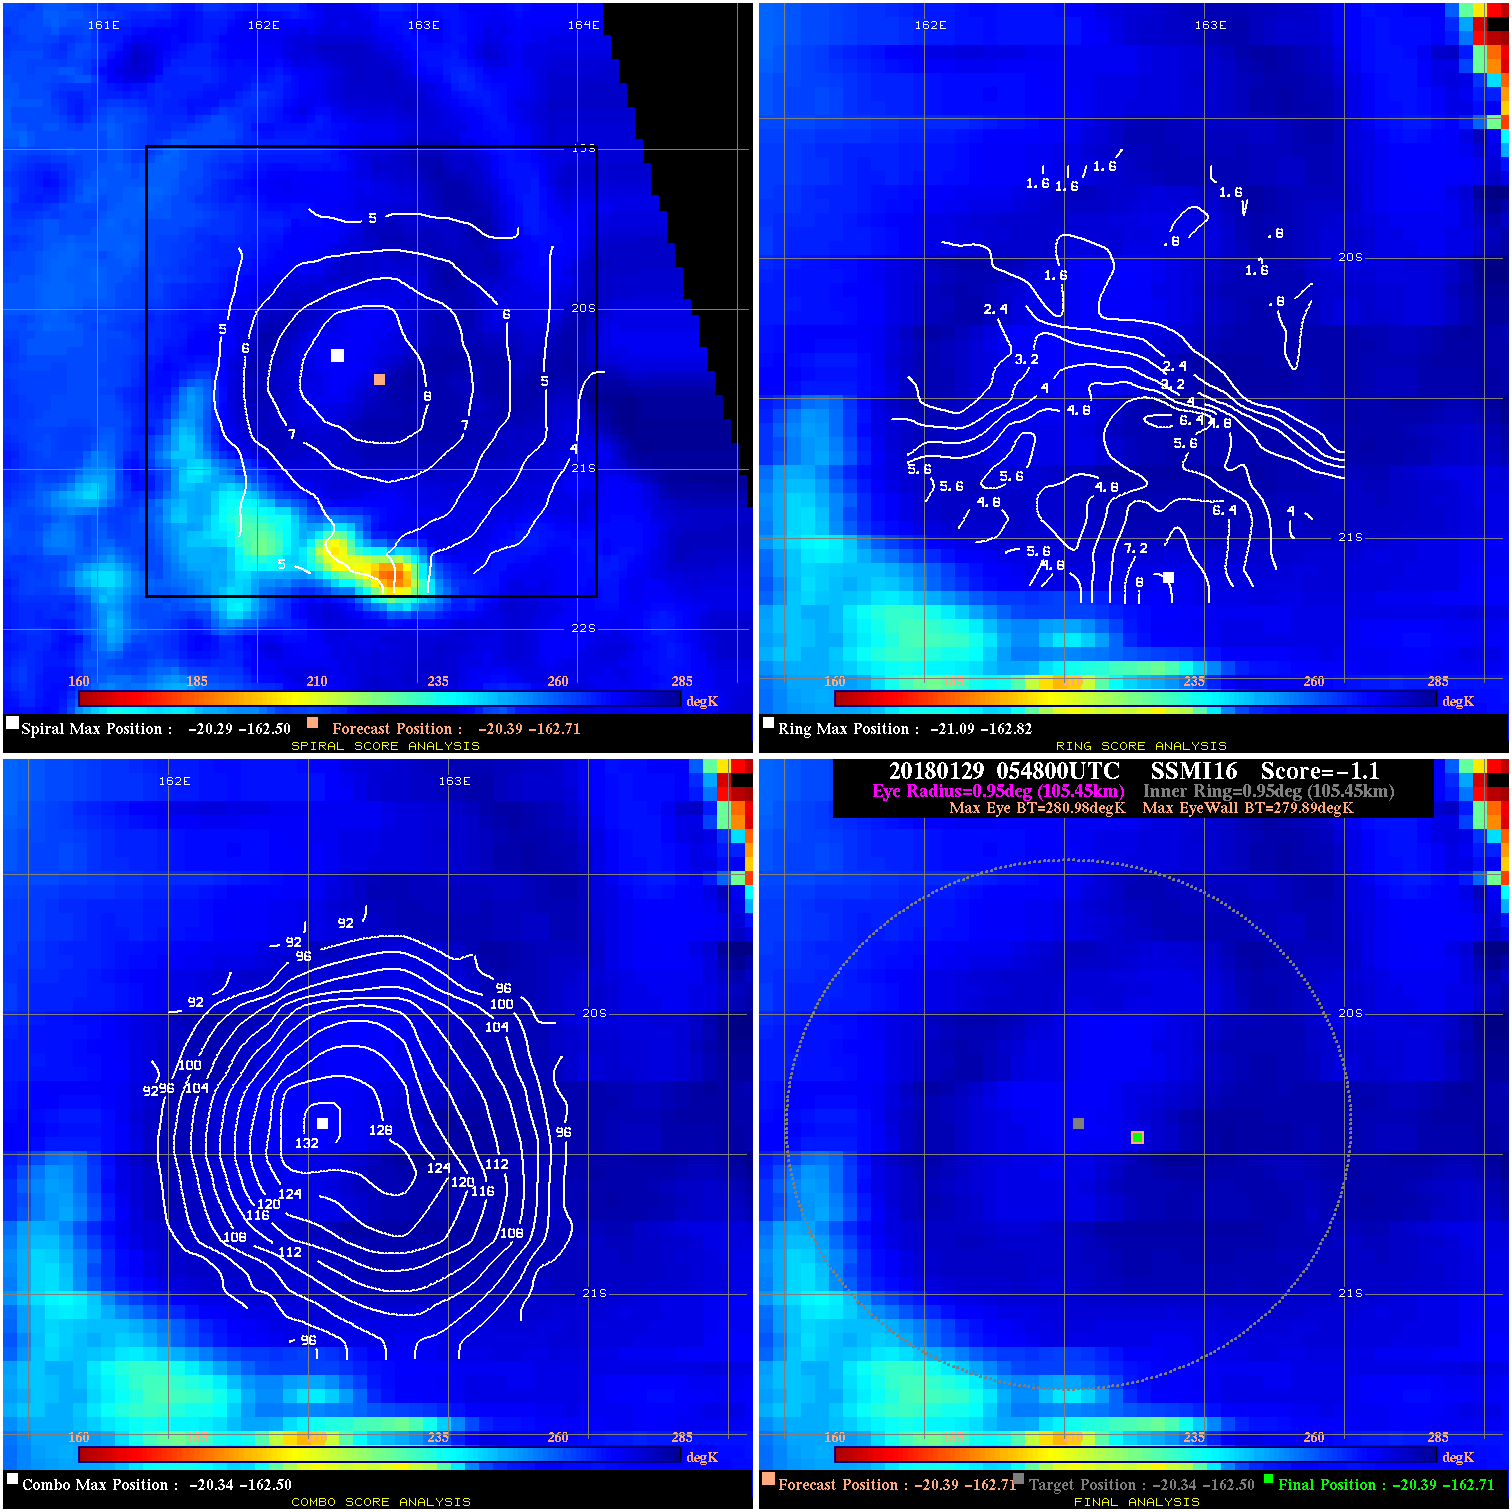
20180129 054800 -1.1 N/A N/A 211.09 1.09 50.0 SSMI16 -20.4 -162.7 -20.4 -162.7 -20.3 -162.5 Analysis Plot
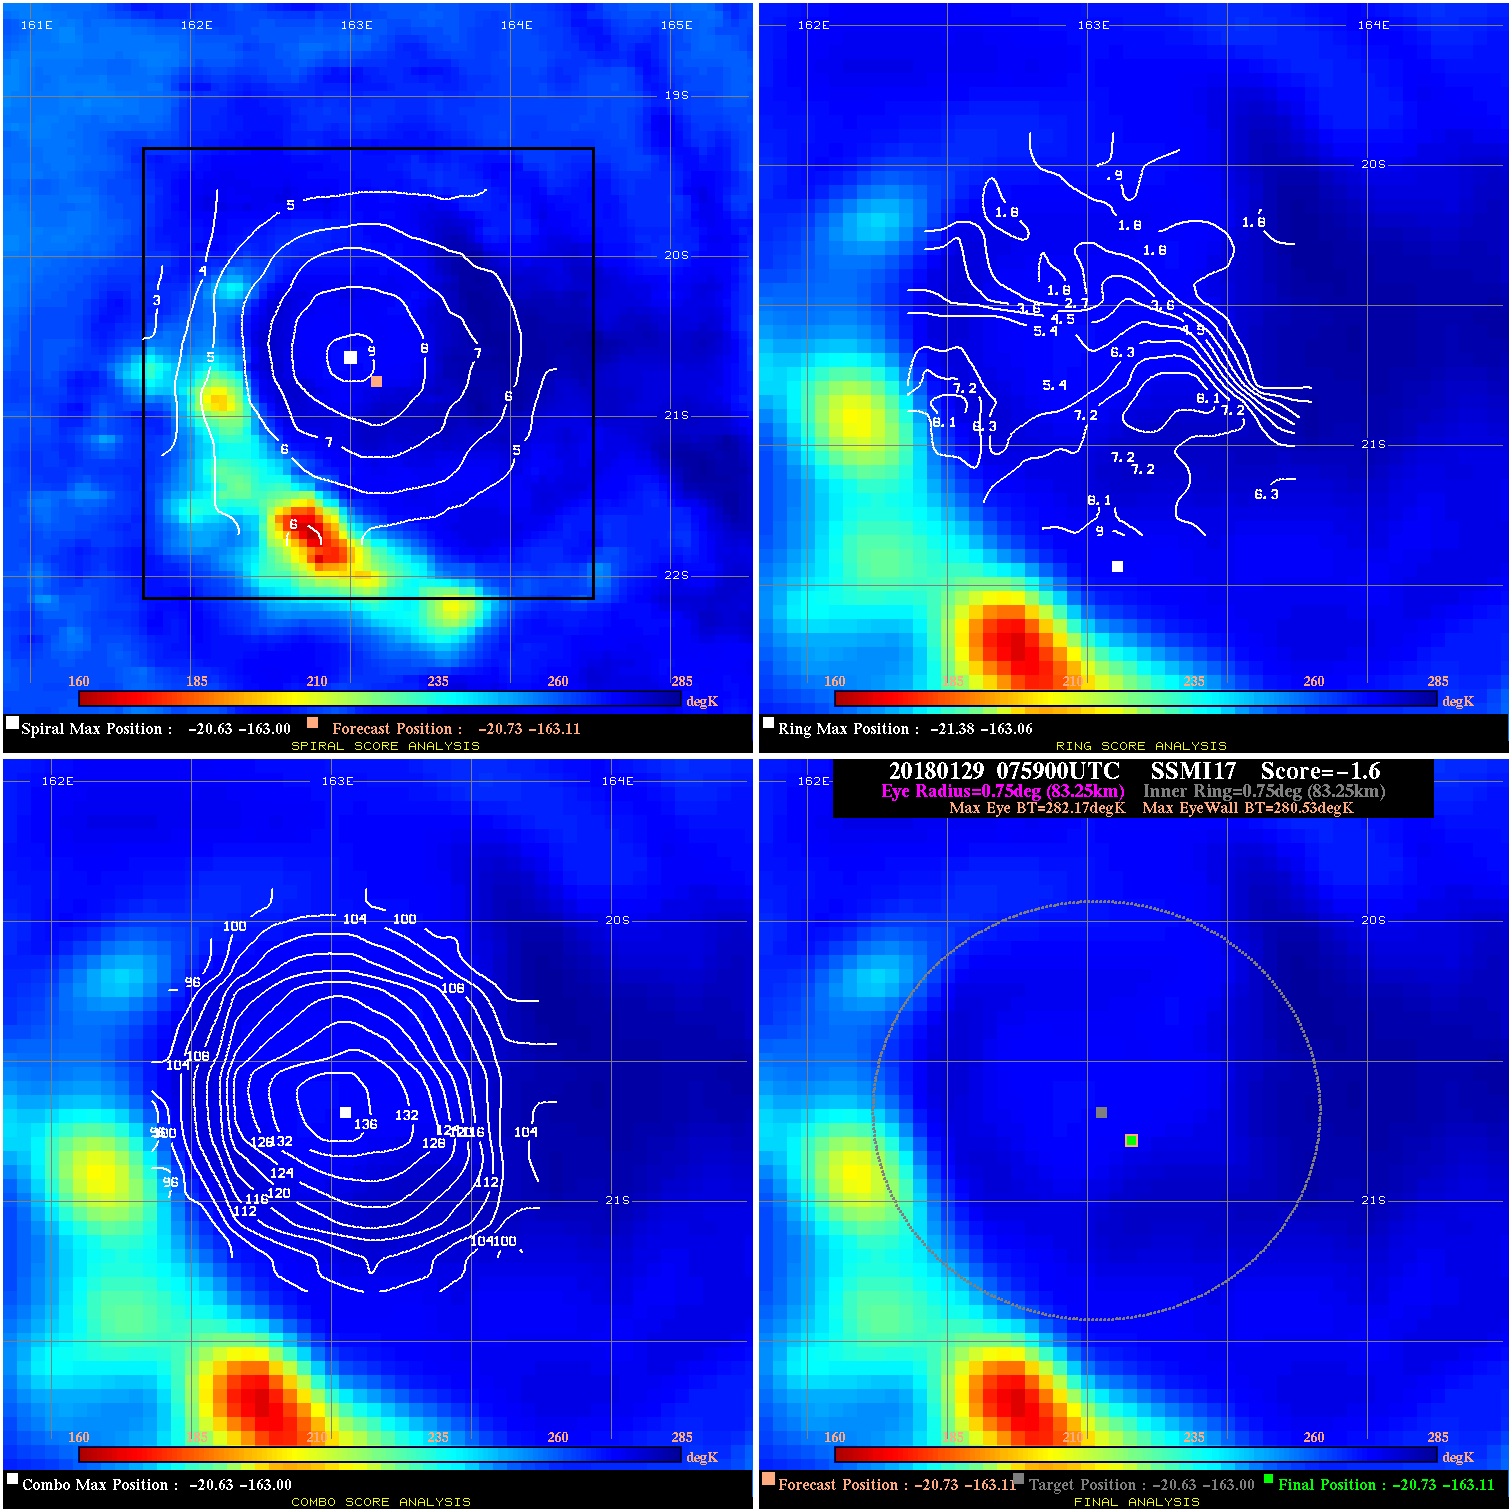
20180129 075900 -1.6 N/A 15.1% 166.65 1.64 45.0 SSMI17 -20.7 -163.1 -20.7 -163.1 -20.6 -163.0 Analysis Plot
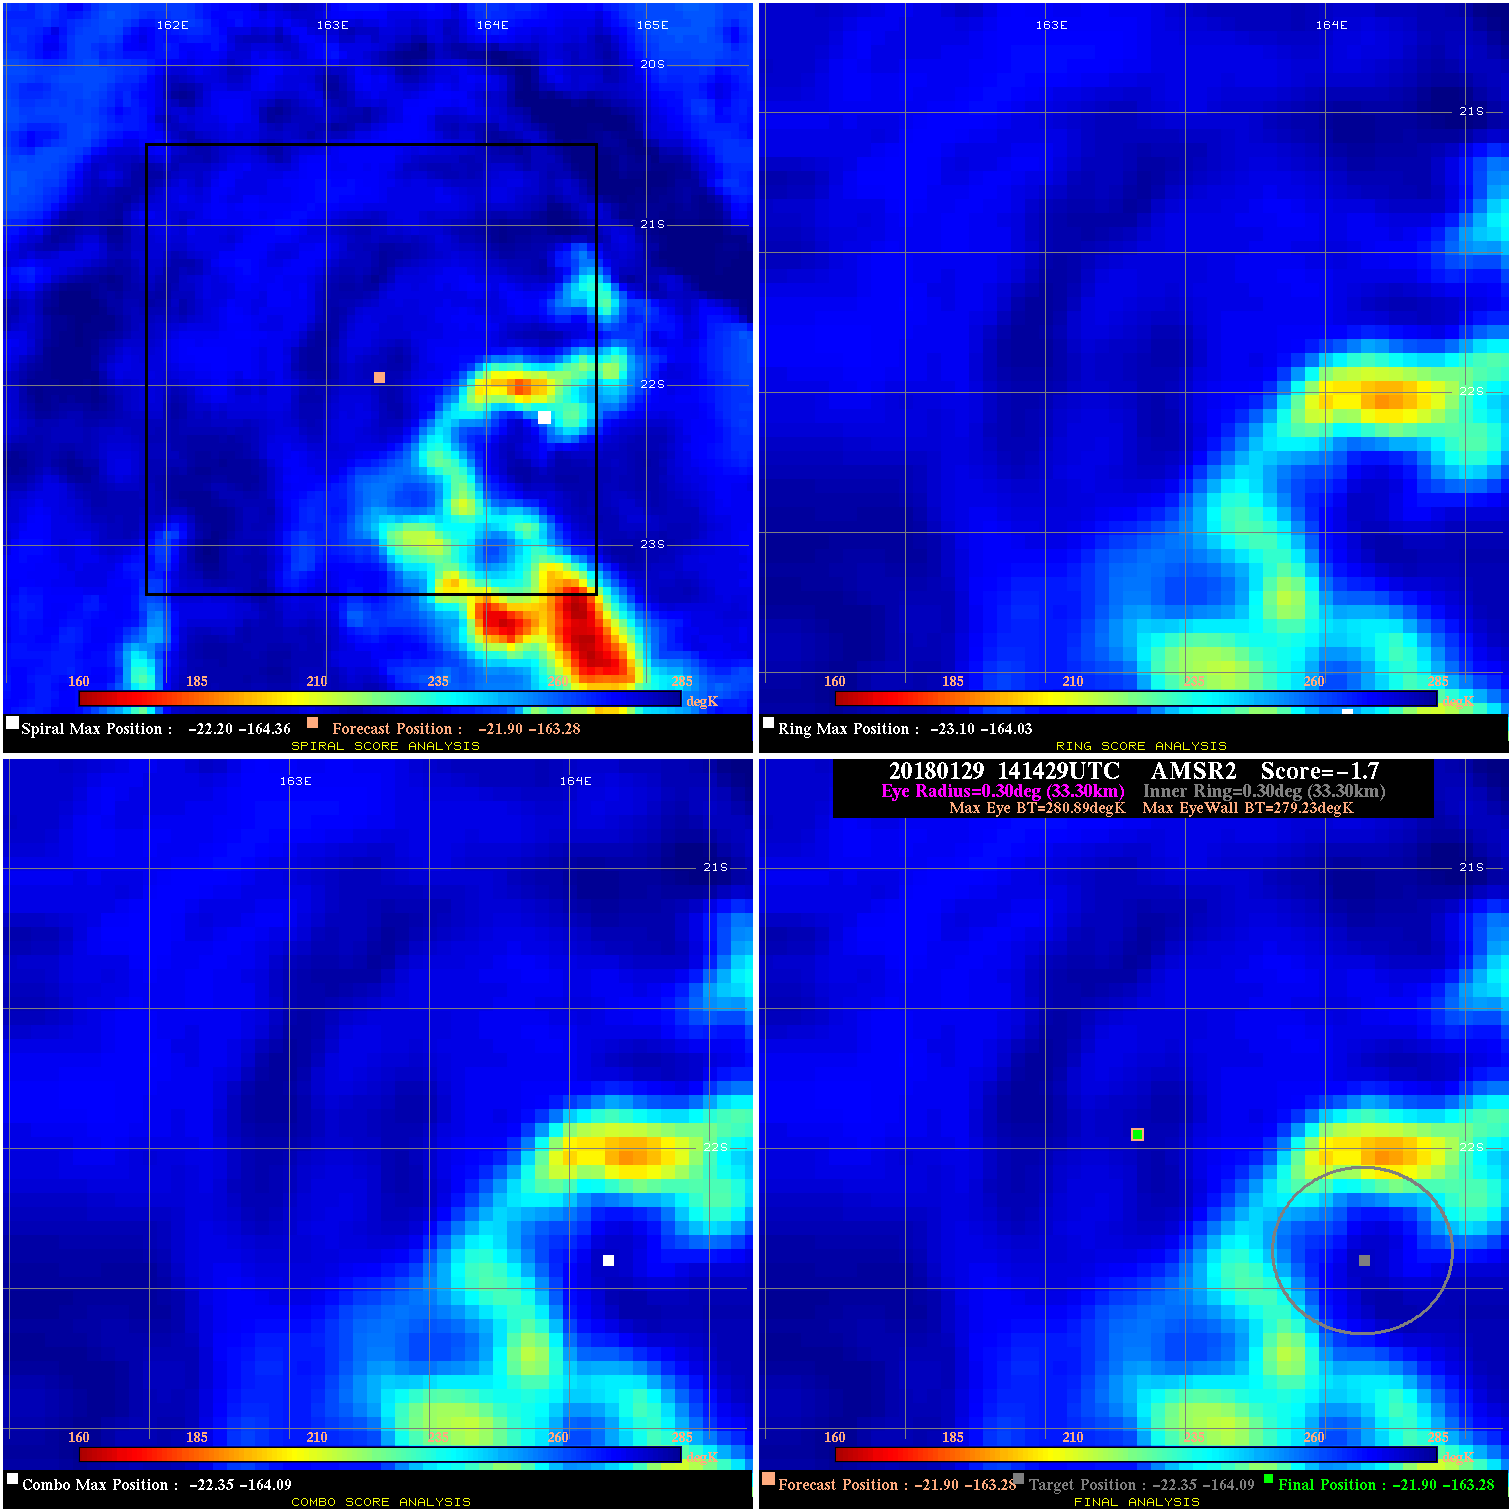
20180129 141429 -1.7 N/A 37.0% 66.66 1.66 40.0 AMSR2 -21.9 -163.3 -21.9 -163.3 -22.4 -164.1 Analysis Plot
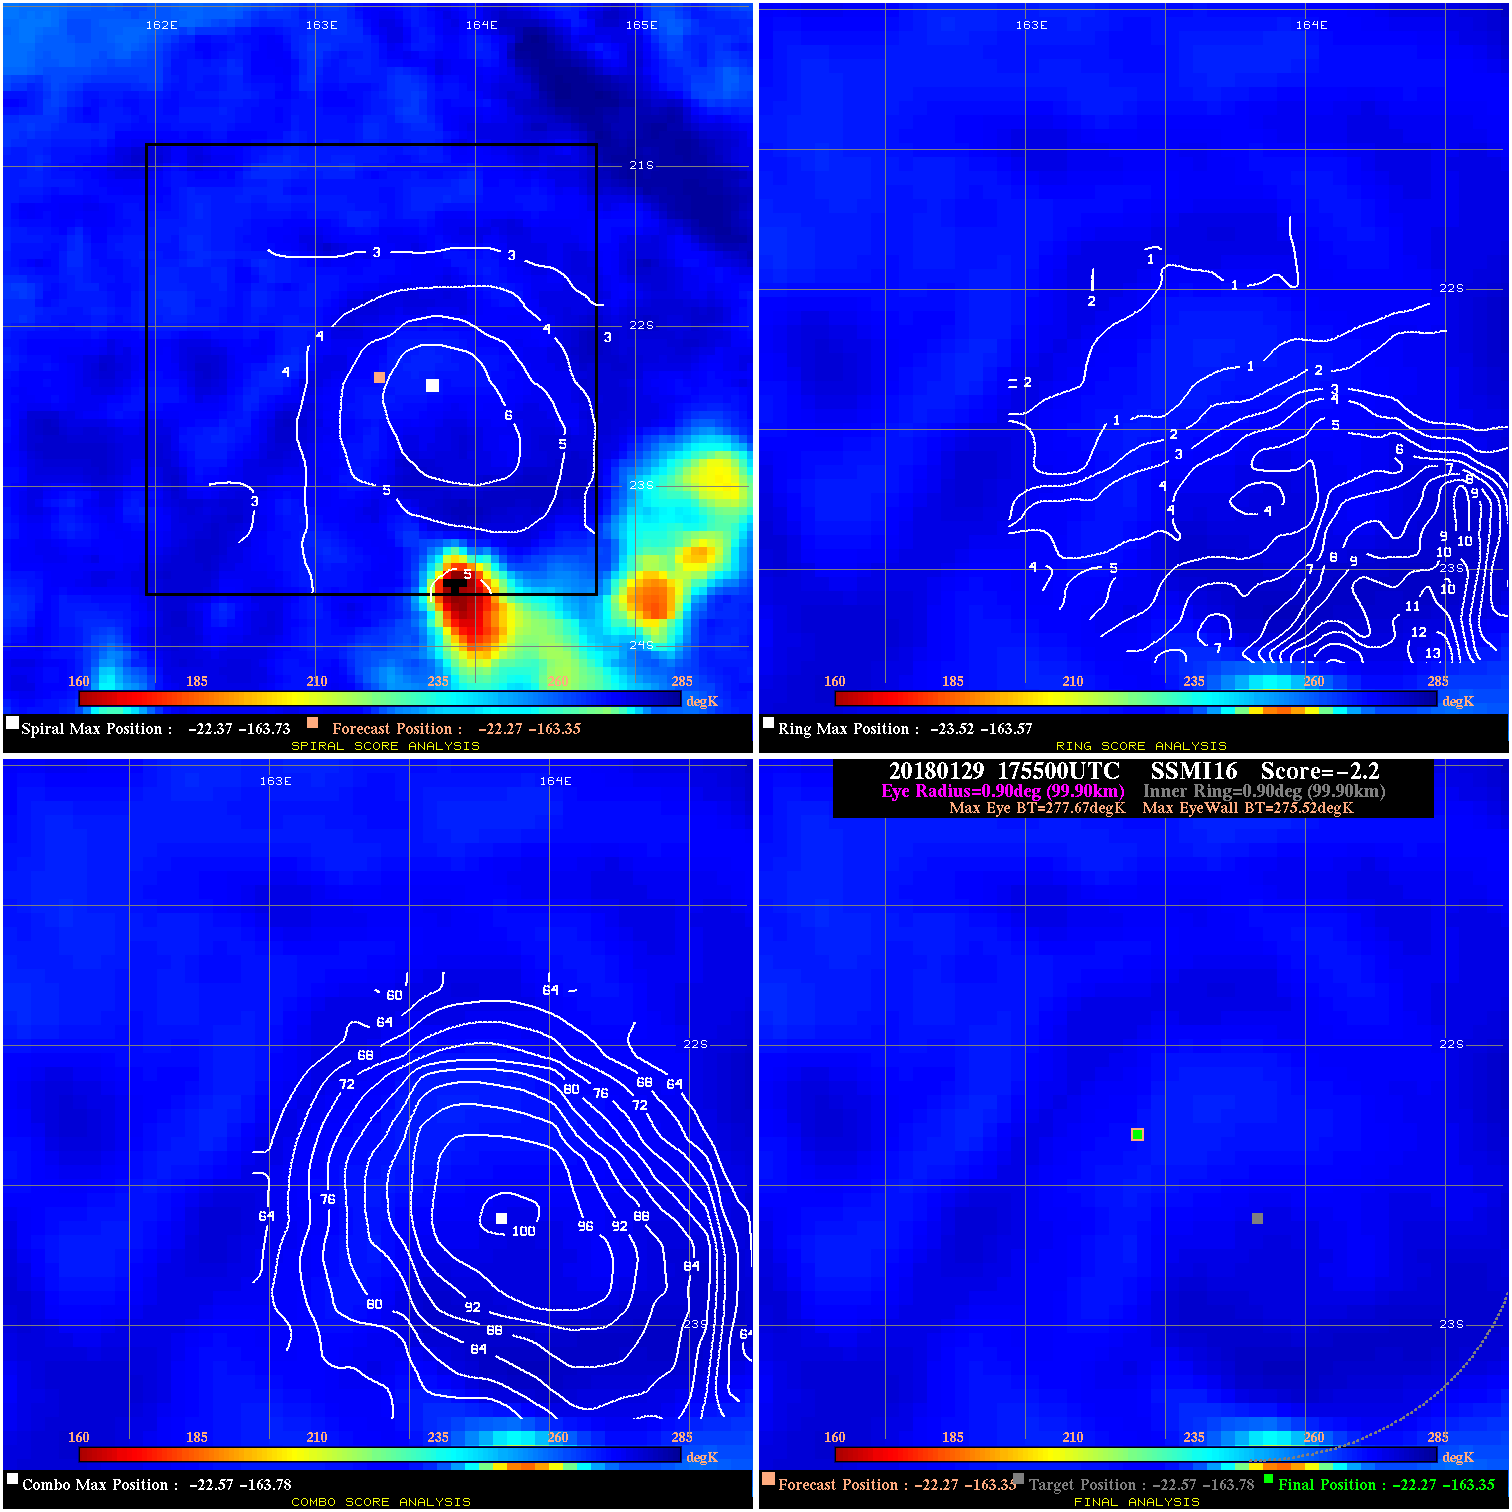
20180129 175500 -2.2 N/A 8.2% 199.98 2.15 40.0 SSMI16 -22.3 -163.4 -22.3 -163.4 -22.6 -163.8 Analysis Plot
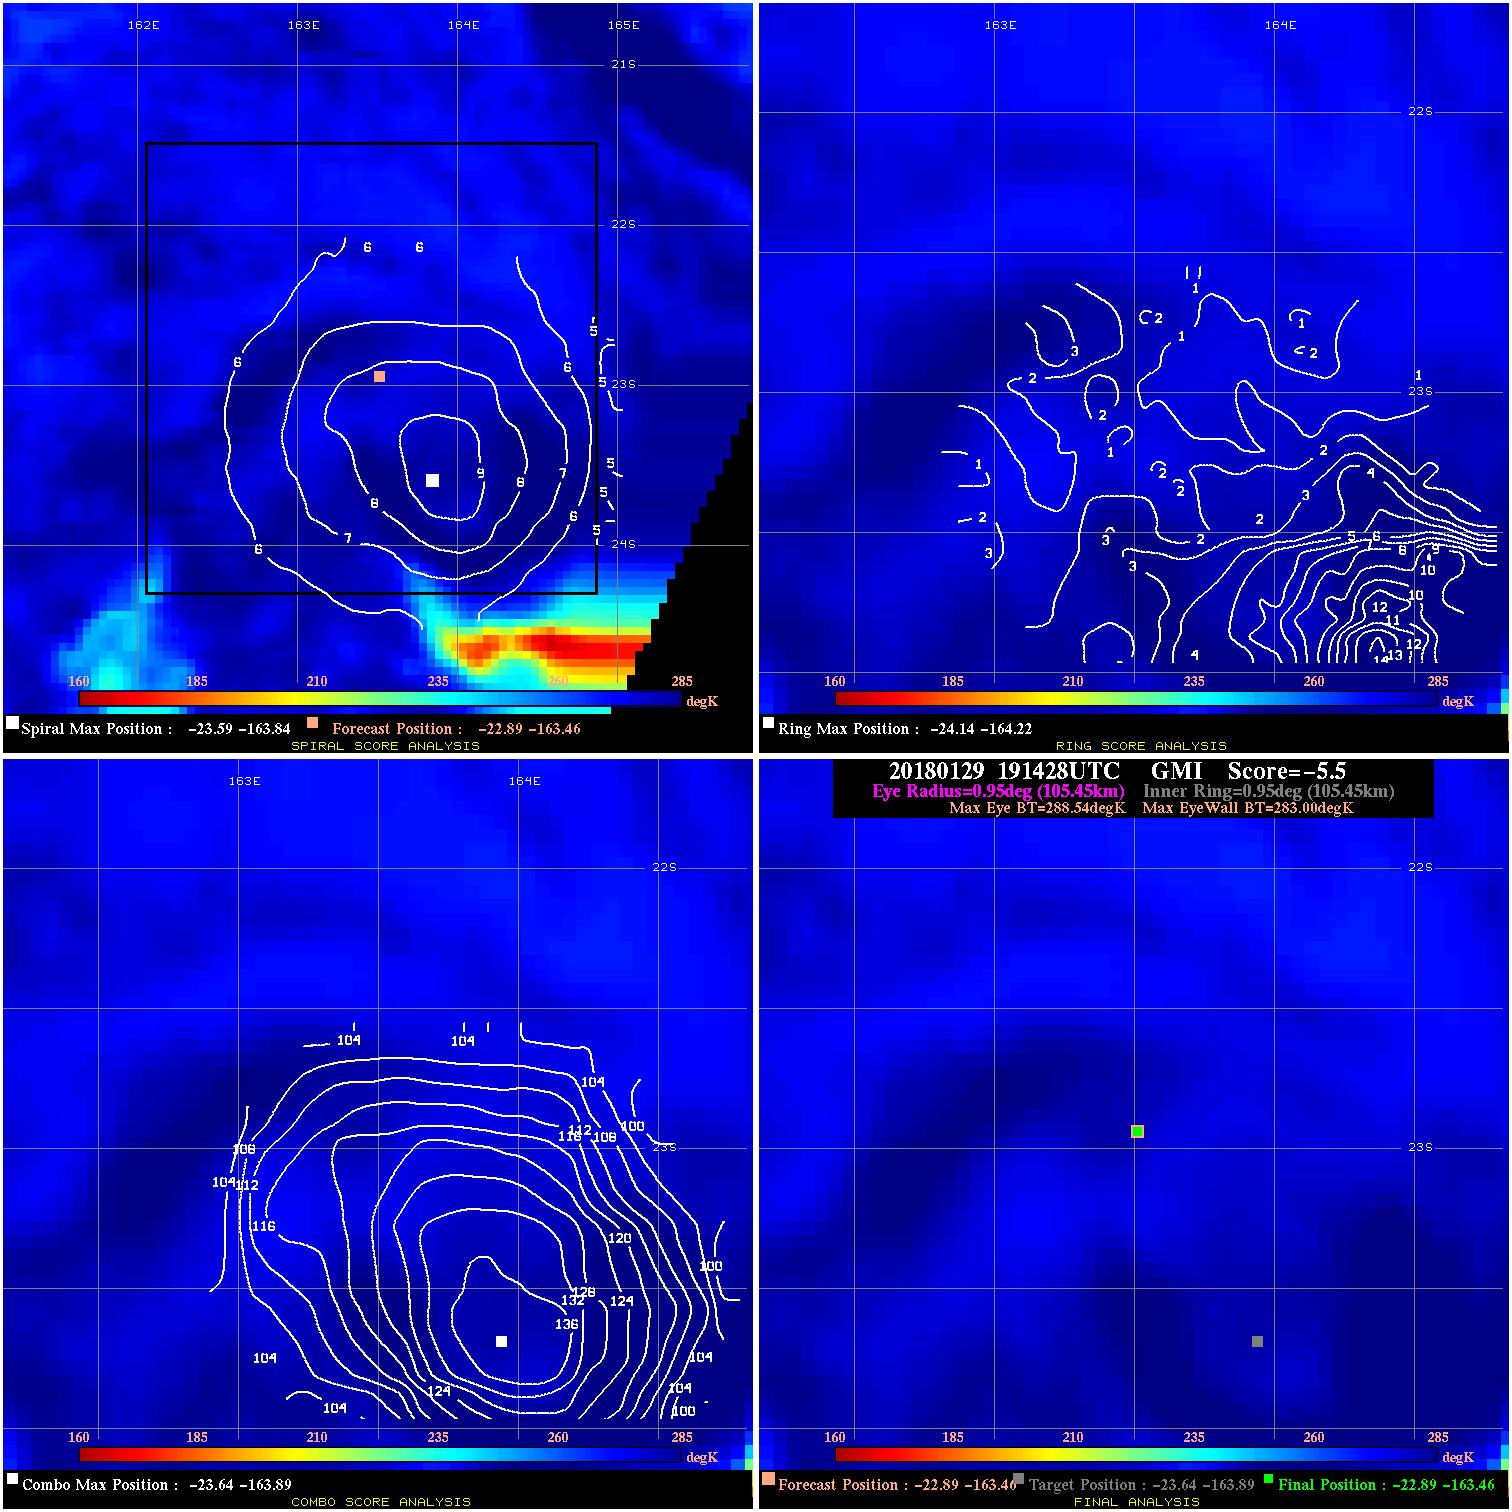
20180129 191428 -5.5 N/A 11.1% 211.09 5.54 40.0 GMI -22.9 -163.5 -22.9 -163.5 -23.6 -163.9 Analysis Plot
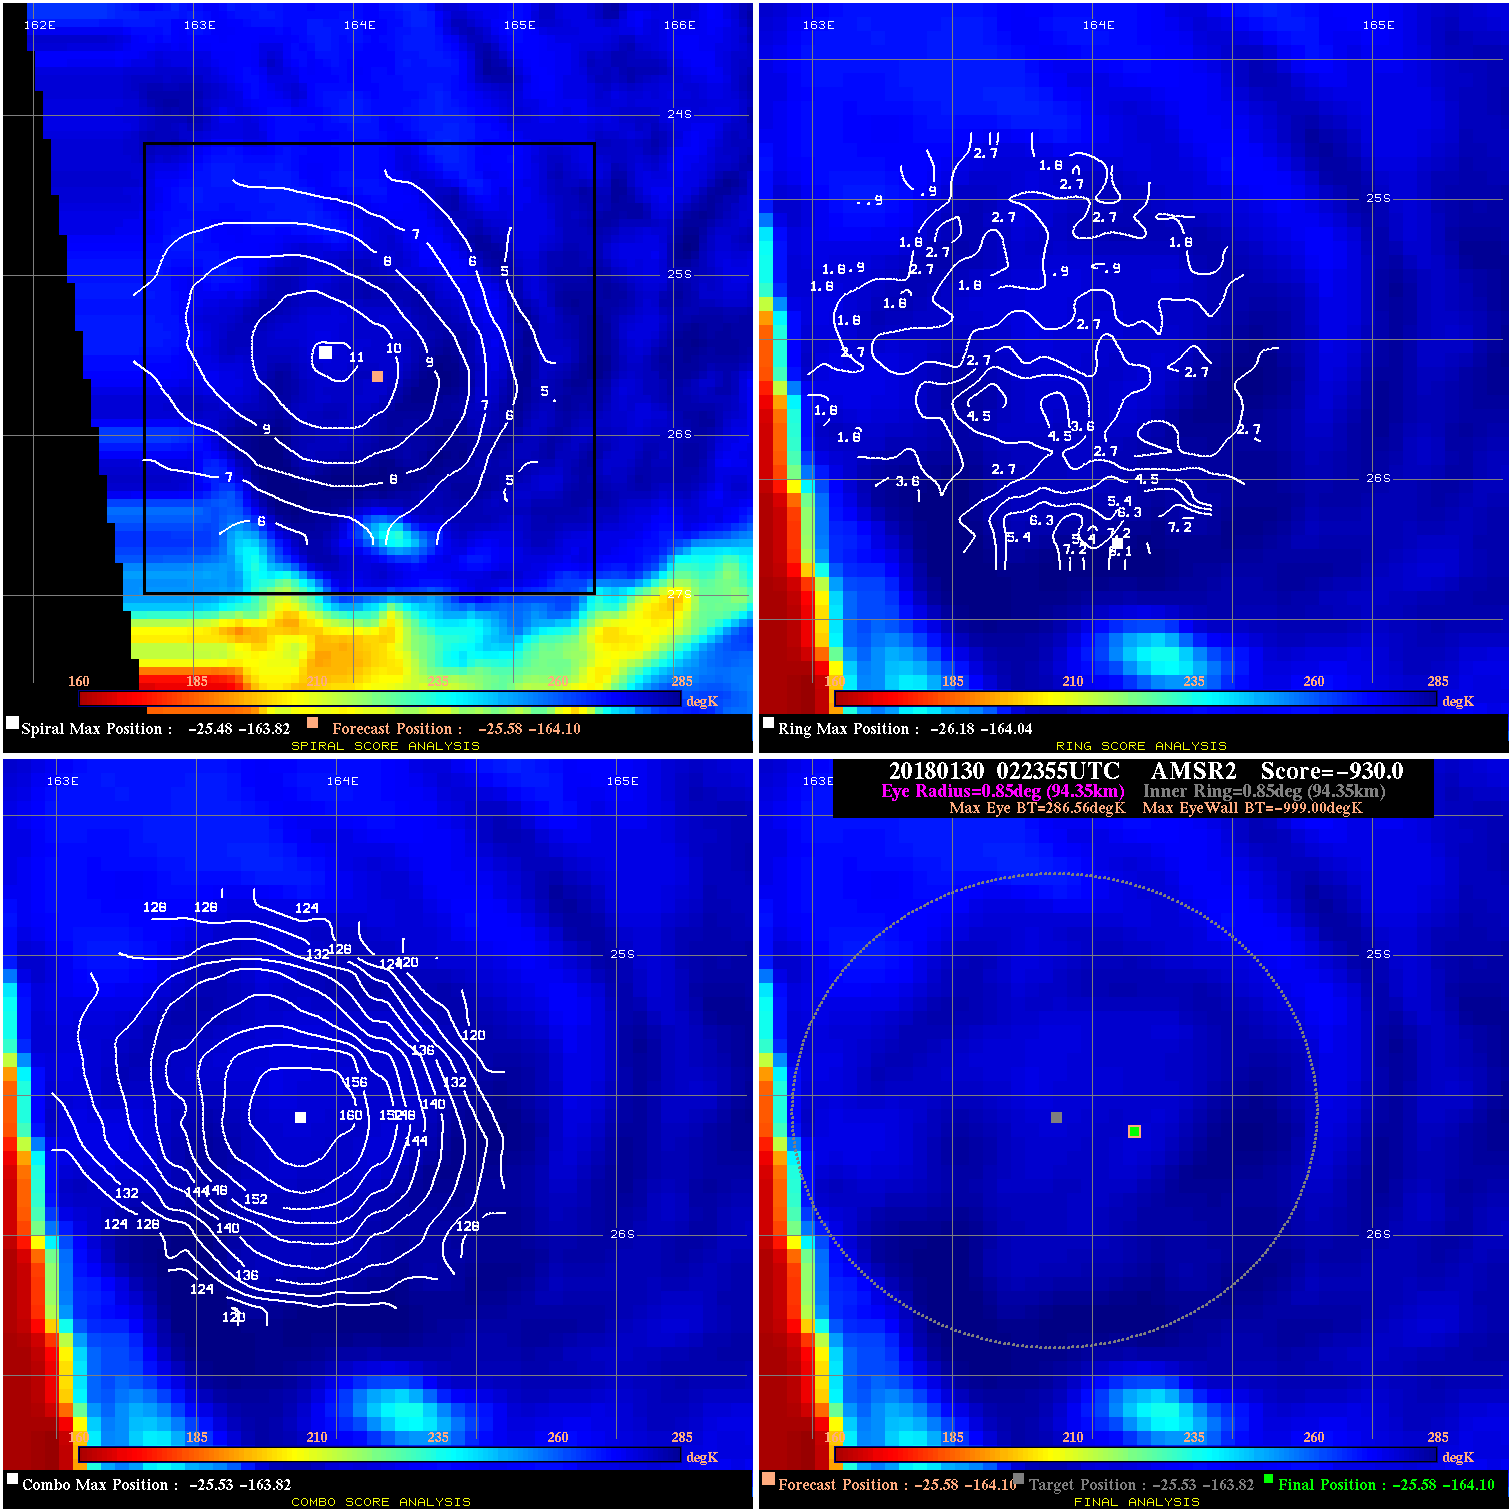
20180130 022355 -930.0 N/A N/A N/A 0.00 35.0 AMSR2 -25.6 -164.1 -25.6 -164.1 -25.5 -163.8 Analysis Plot
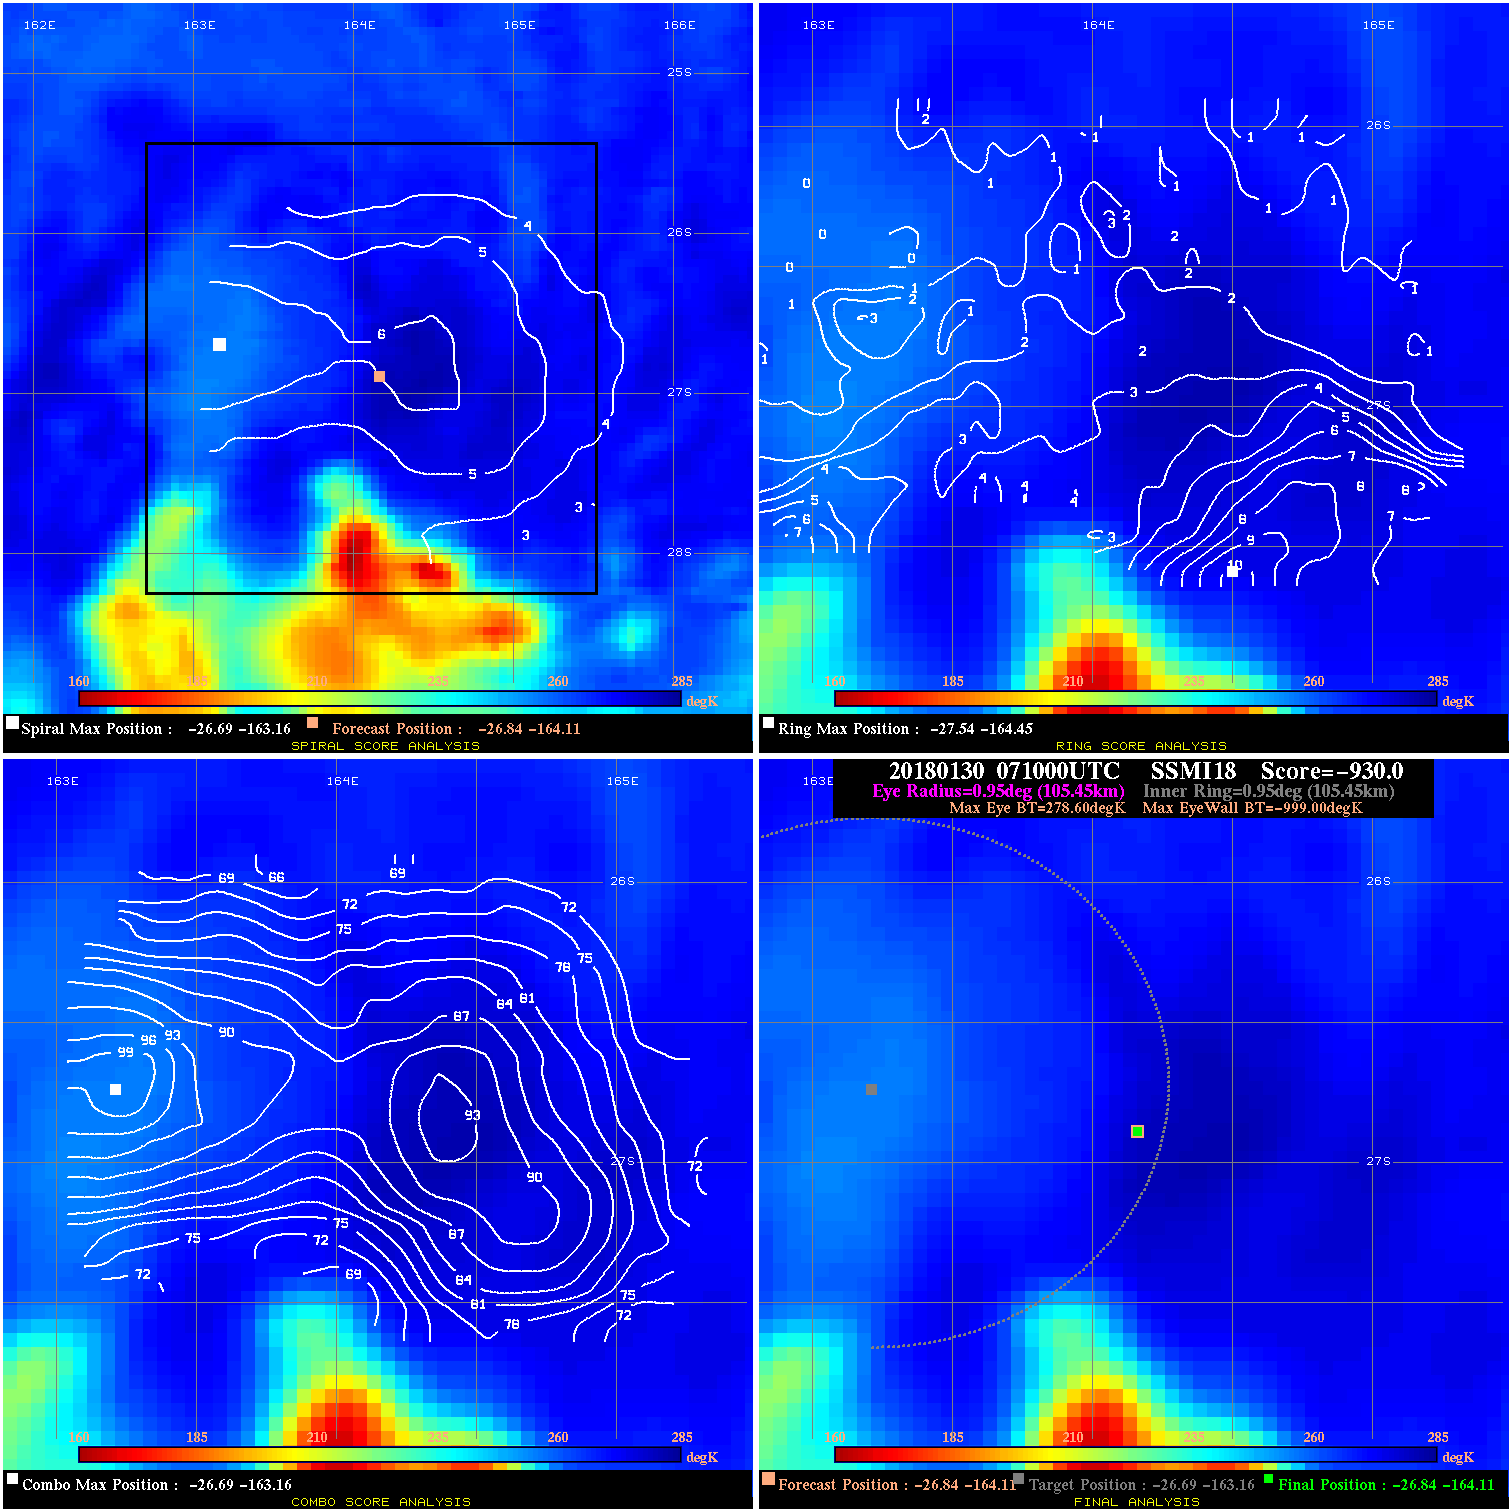
20180130 071000 -930.0 N/A N/A N/A 0.00 35.0 SSMI18 -26.8 -164.1 -26.8 -164.1 -26.7 -163.2 Analysis Plot
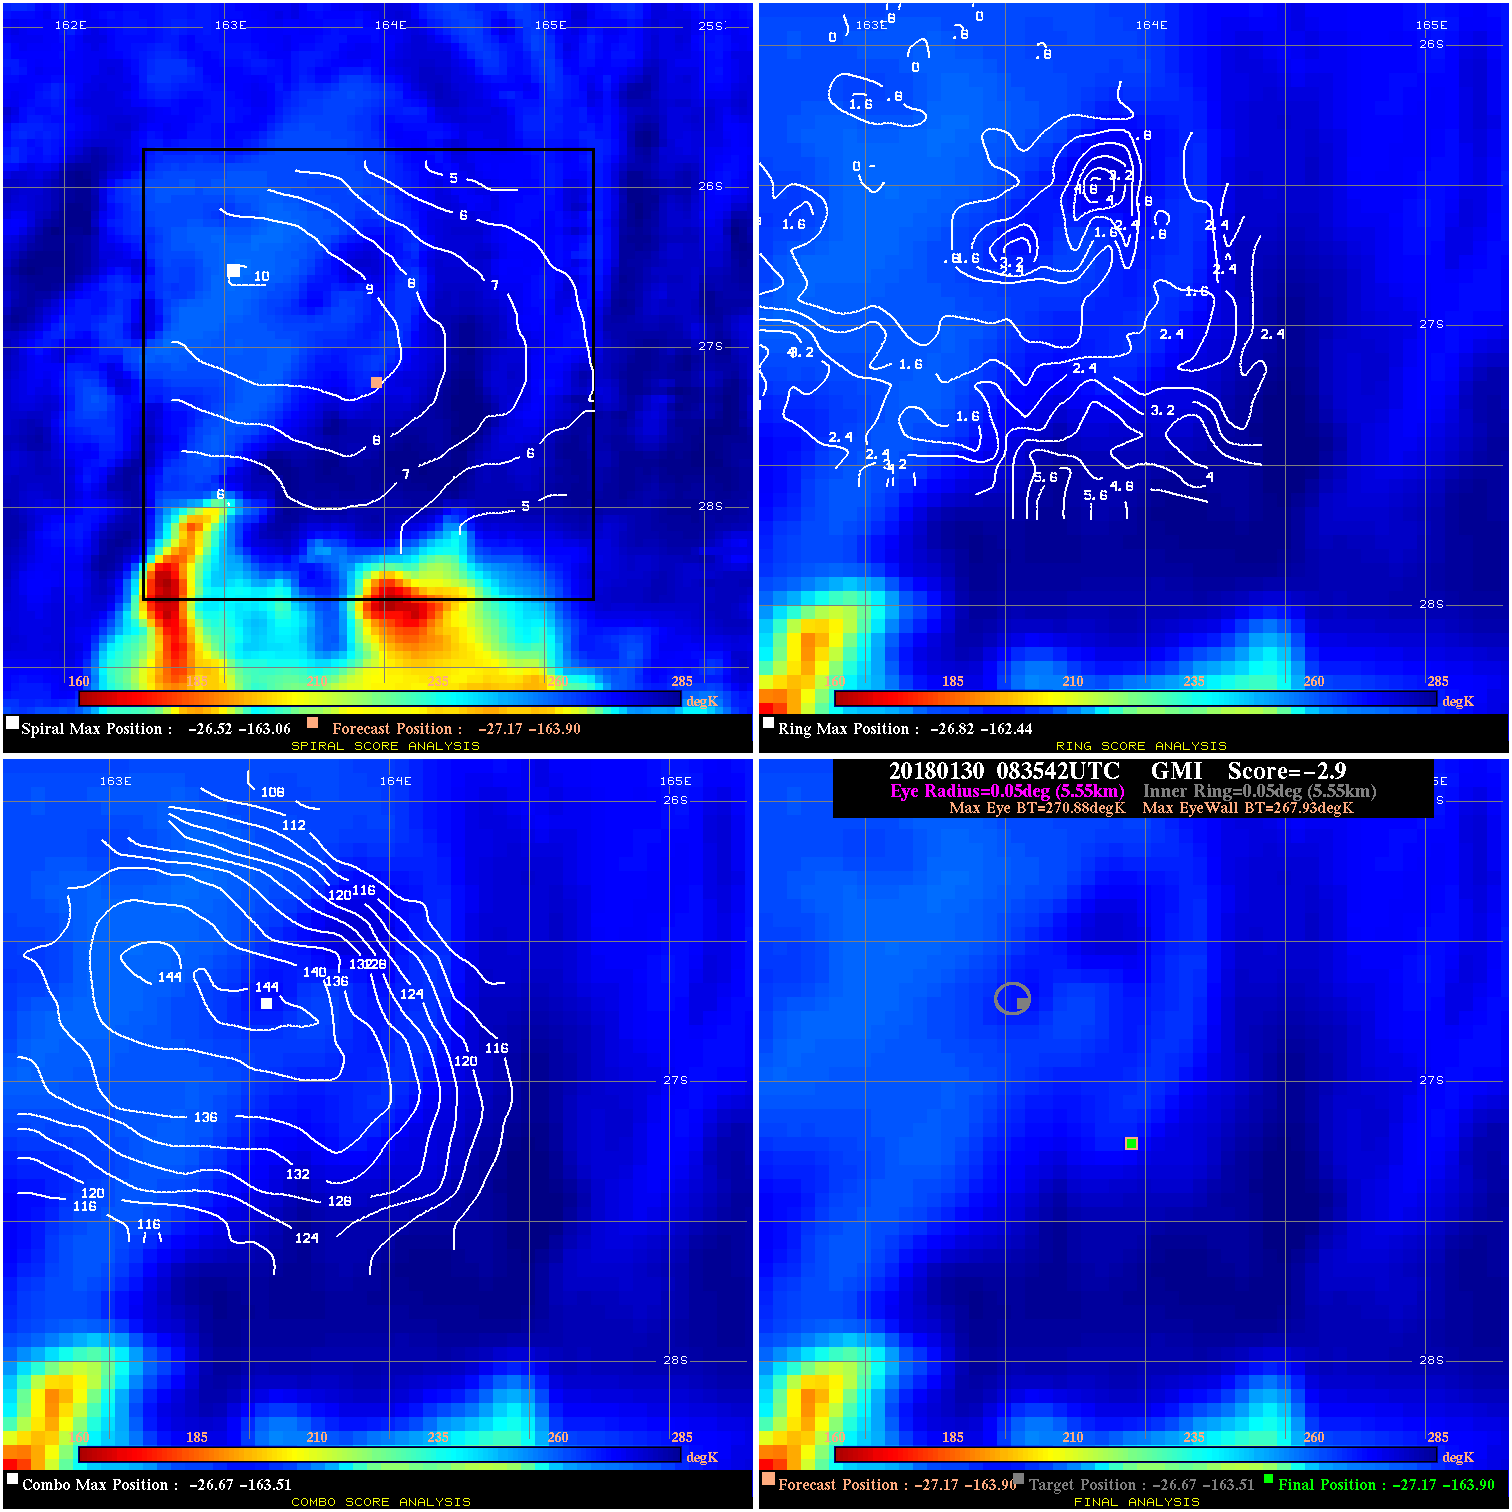
20180130 083542 -2.9 N/A N/A 11.11 2.95 35.0 GMI -27.2 -163.9 -27.2 -163.9 -26.7 -163.5 Analysis Plot
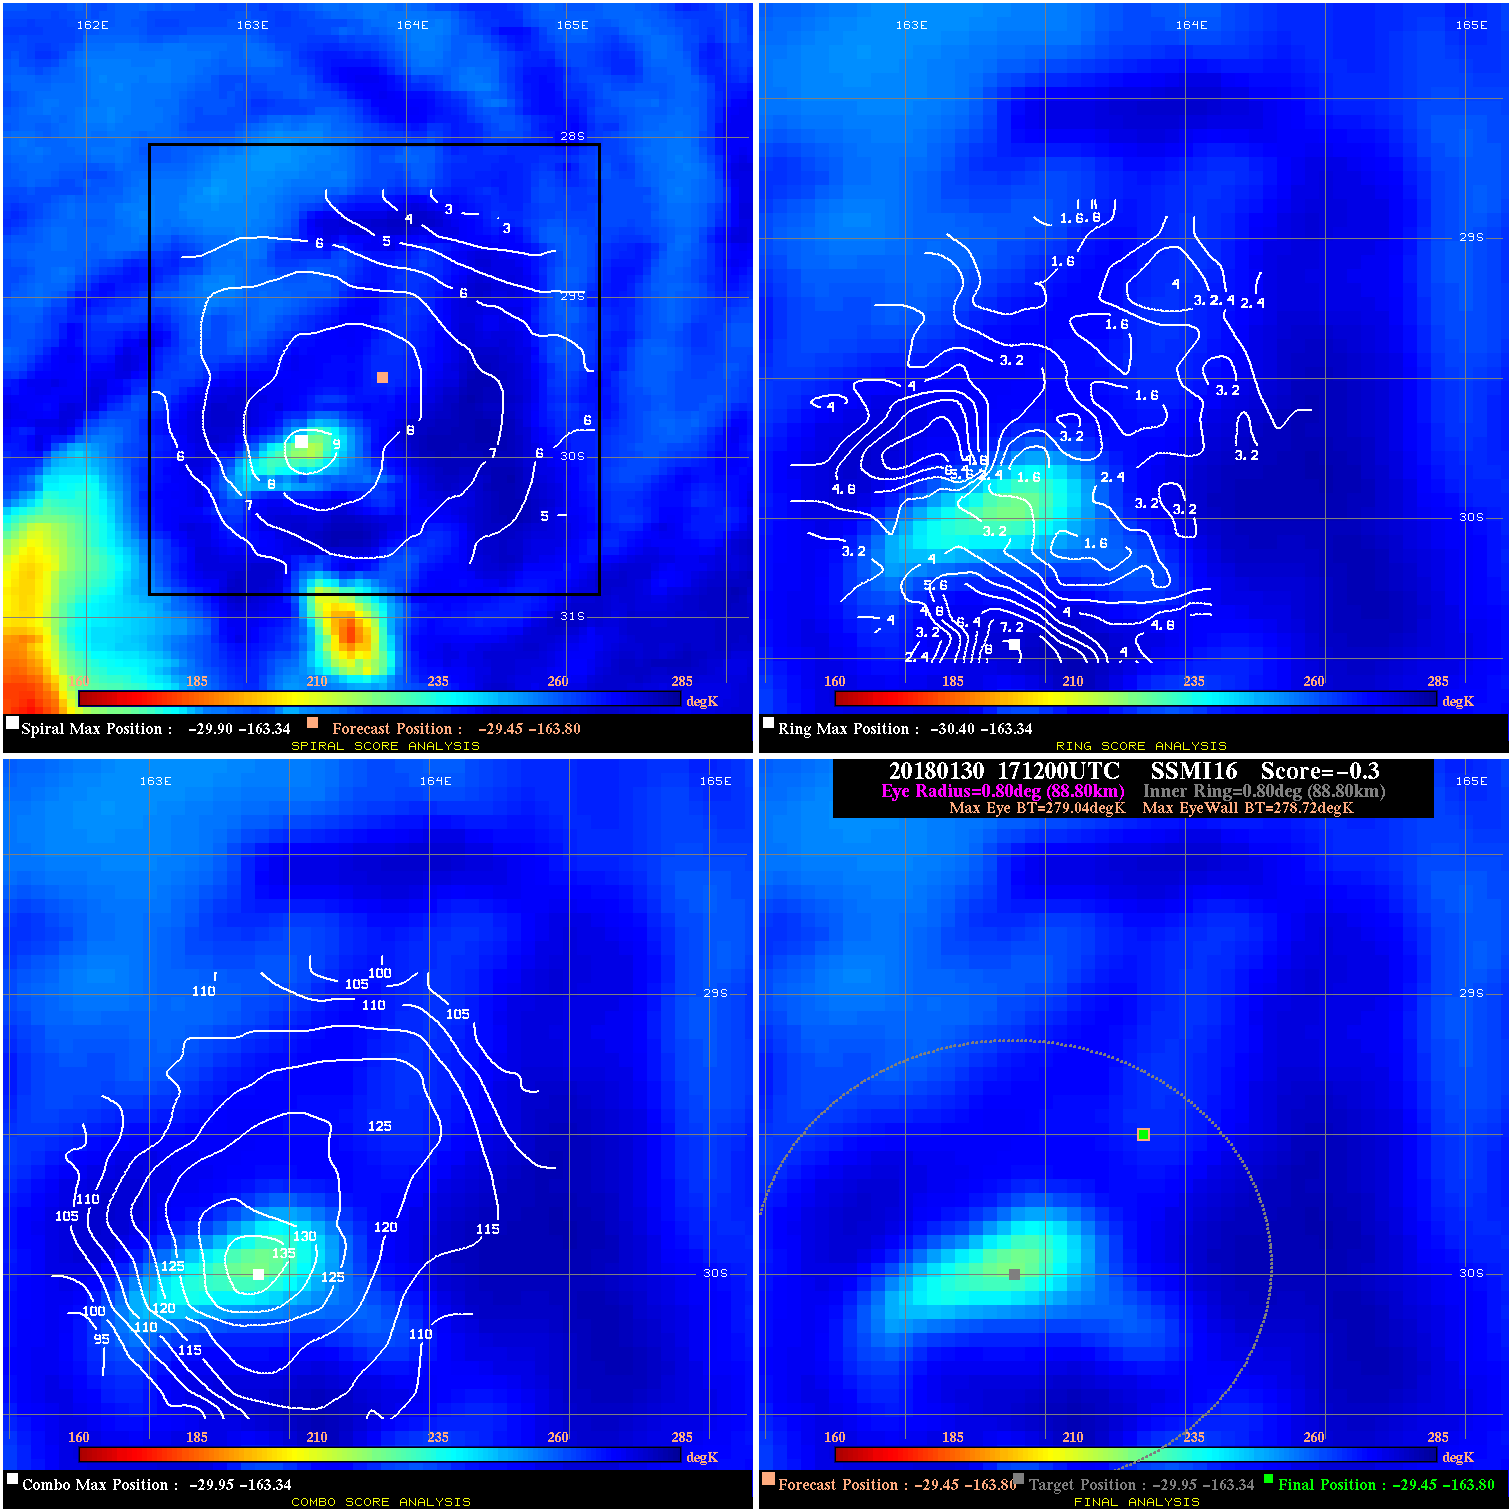
20180130 171200 -0.3 N/A 4.1% 177.76 .32 35.0 SSMI16 -29.5 -163.8 -29.5 -163.8 -30.0 -163.3 Analysis Plot
20180130 182050 -3.6 N/A 11.0% 199.98 3.57 35.0 GMI -30.2 -163.8 -30.2 -163.8 -30.6 -163.2 Analysis Plot
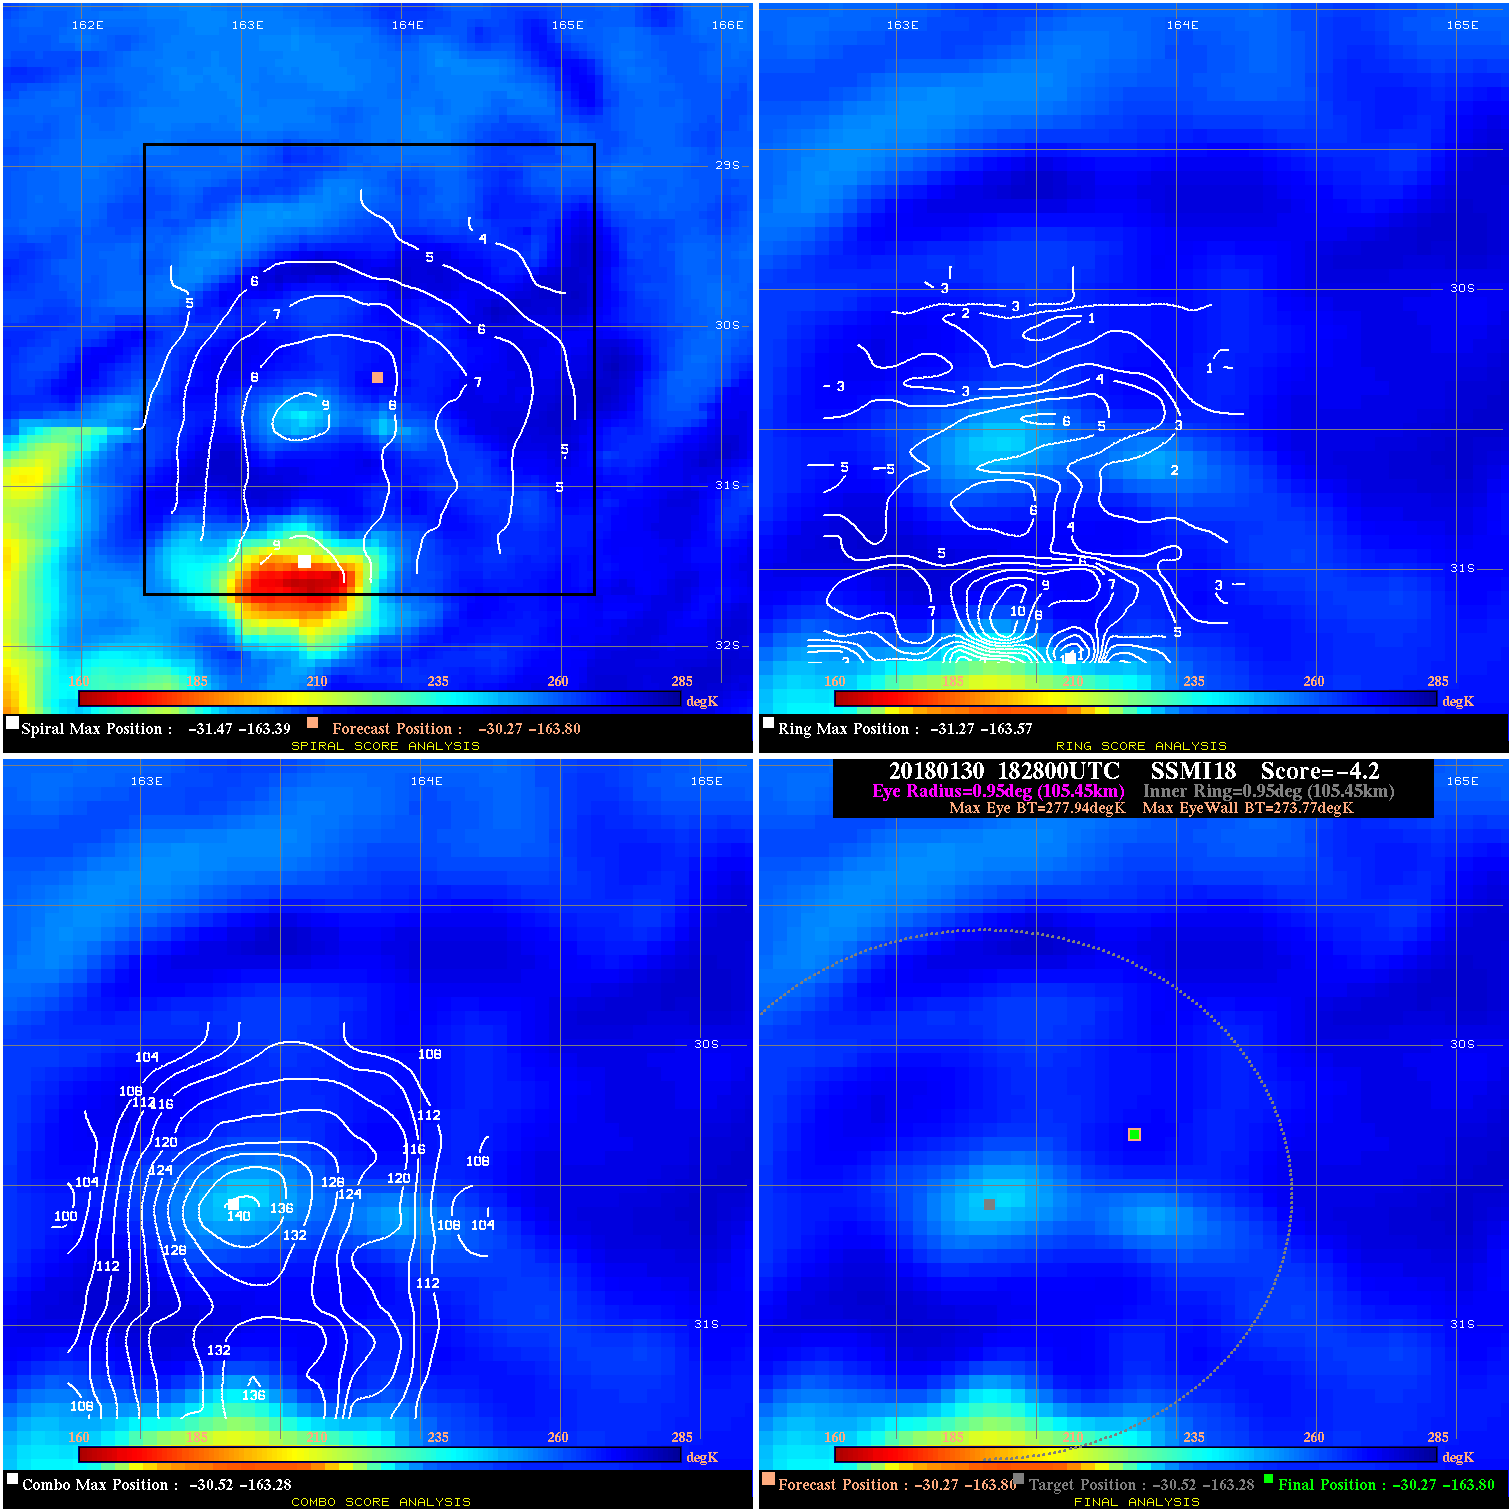
20180130 182800 -4.2 N/A 13.7% 211.09 4.17 35.0 SSMI18 -30.3 -163.8 -30.3 -163.8 -30.5 -163.3 Analysis Plot
|
|
Legend: - Date/Time are determined from PMW imagery at Forecast (initial guess) Lat/Lon position. - Positive/Negative Latitude = North/South Hemisphere; Longitude = Western/Eastern Hemisphere. - "Ring Diam" value indicates the estimated surface eyewall diameter in km (the MI eyewall edge diameter minus 10 km). - "Ring Pct" is the percentage of the "ring" (eyewall inner boundary) that is 1) colder than the "hot spot" (warmest eye pixel) in the eye by 20K, or 2) the percentage that is a) colder than 232K and b) colder than the "hot spot" by 10K, whichever is greater. - Values are red if Ring % <= 65, yellow/brown if Ring % <= 85 and green if Ring % > 85. - "Tb diff" is the difference between the "hot spot" (warmest eye pixel) and the warmest pixel on the eyewall. - Intensity score are listed as negative, and not used, when the JTWC or NHC estimated Vmax is <55 kts in order to rule out weak but highly symmetric TCs. - Error messages in intensity scores: -920 is used when the hottest pixel in the eye is <200K, to prevent false positives; -930 means <85% of eyewall has observations/data. |