Tropical Depression 25W
|
Passive Microwave (PMW) Intensity Information Hurricane Intensity Estimation (HIE) Algorithm Version 9.0 |
Overpass Inten Ring Ring Wind Forecast Final Target
Date Time Score Meaning Pct Diam BTdiff Est Sat Lat Lon Lat Lon Lat Lon
20191105 204541 -930.0 N/A N/A N/A 0.00 25.0 SSMI15 13.8 -116.0 13.8 -116.0 13.6 -116.7 Analysis Plot
20191106 085947 -3.3 N/A 19.2% 222.20 3.27 30.0 SSMI16 13.4 -116.3 13.4 -116.3 13.3 -116.7 Analysis Plot
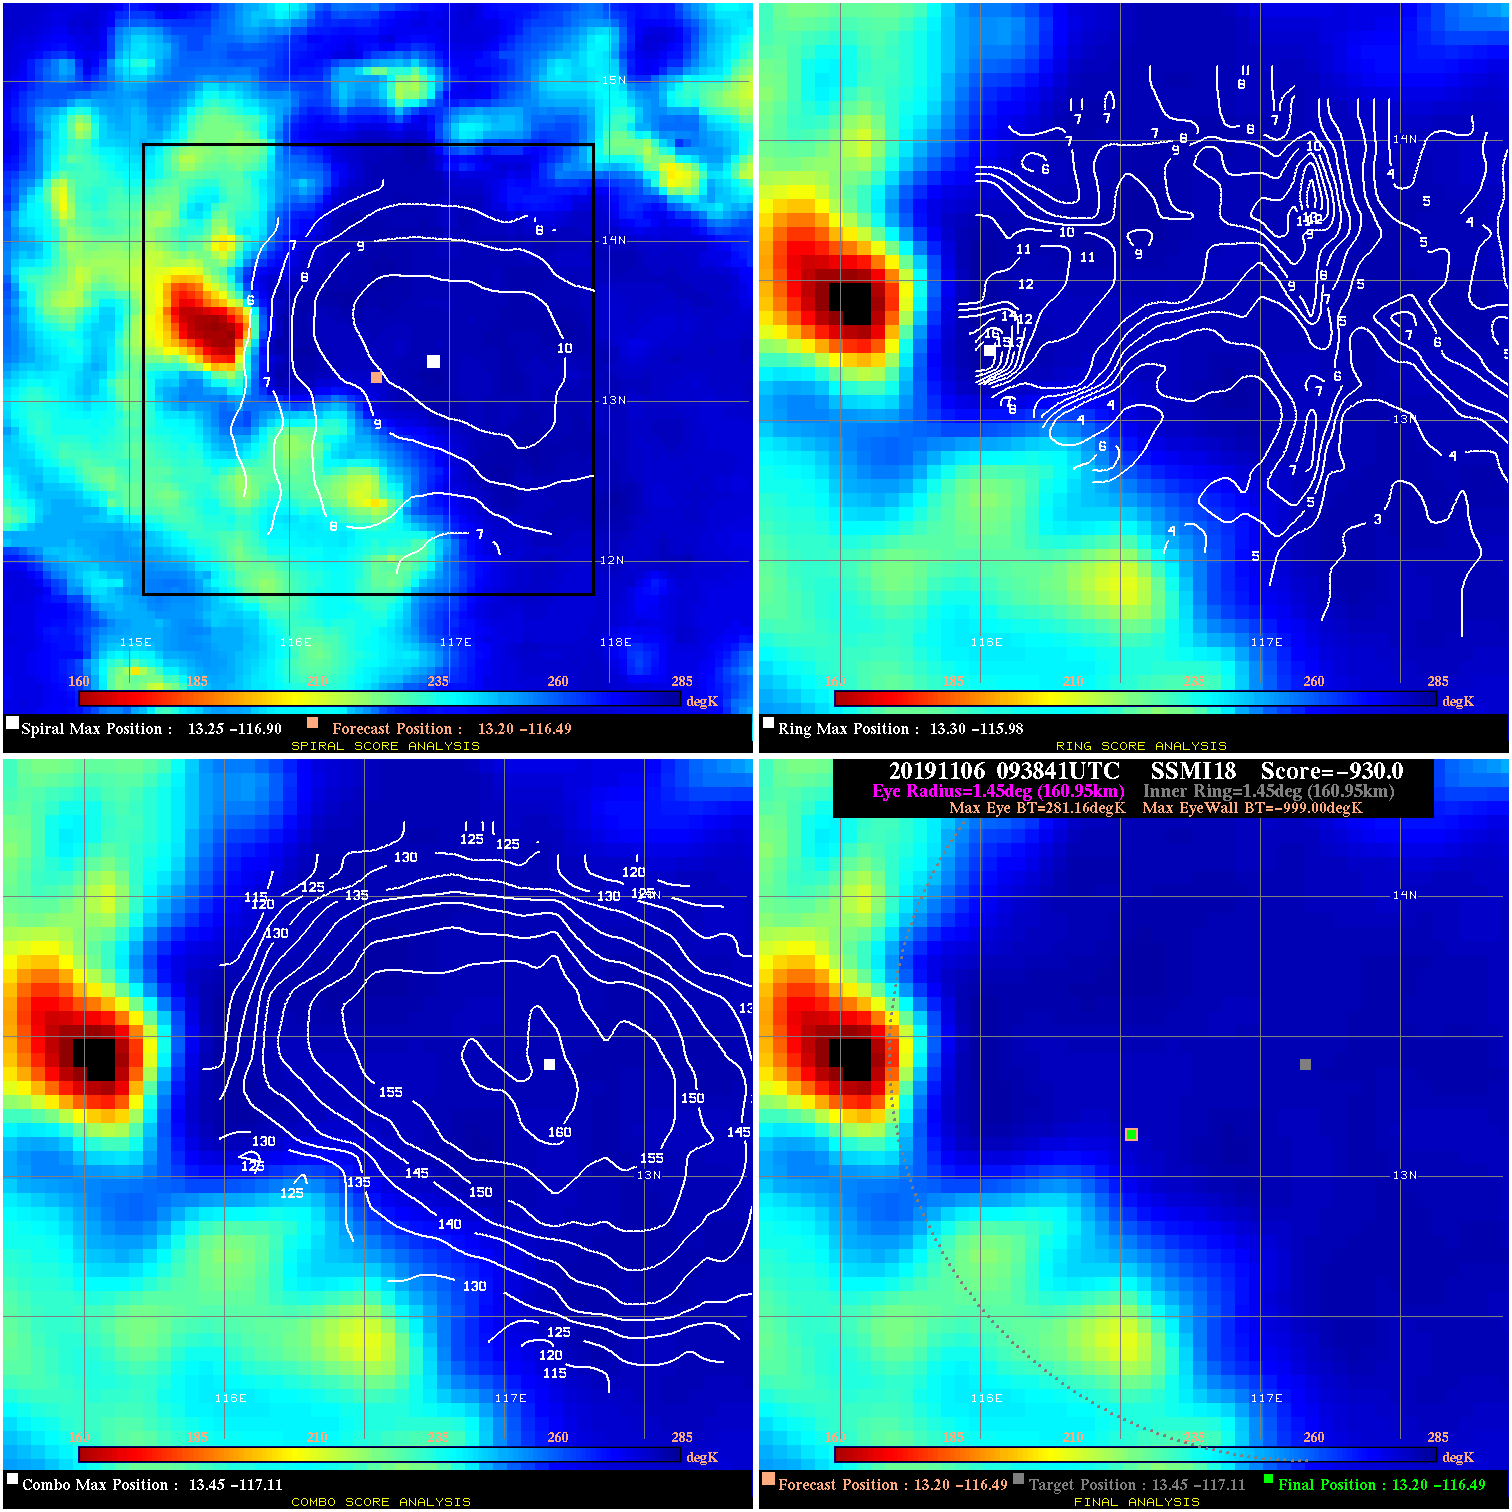
20191106 093841 -930.0 N/A N/A N/A 0.00 35.0 SSMI18 13.2 -116.5 13.2 -116.5 13.4 -117.1 Analysis Plot
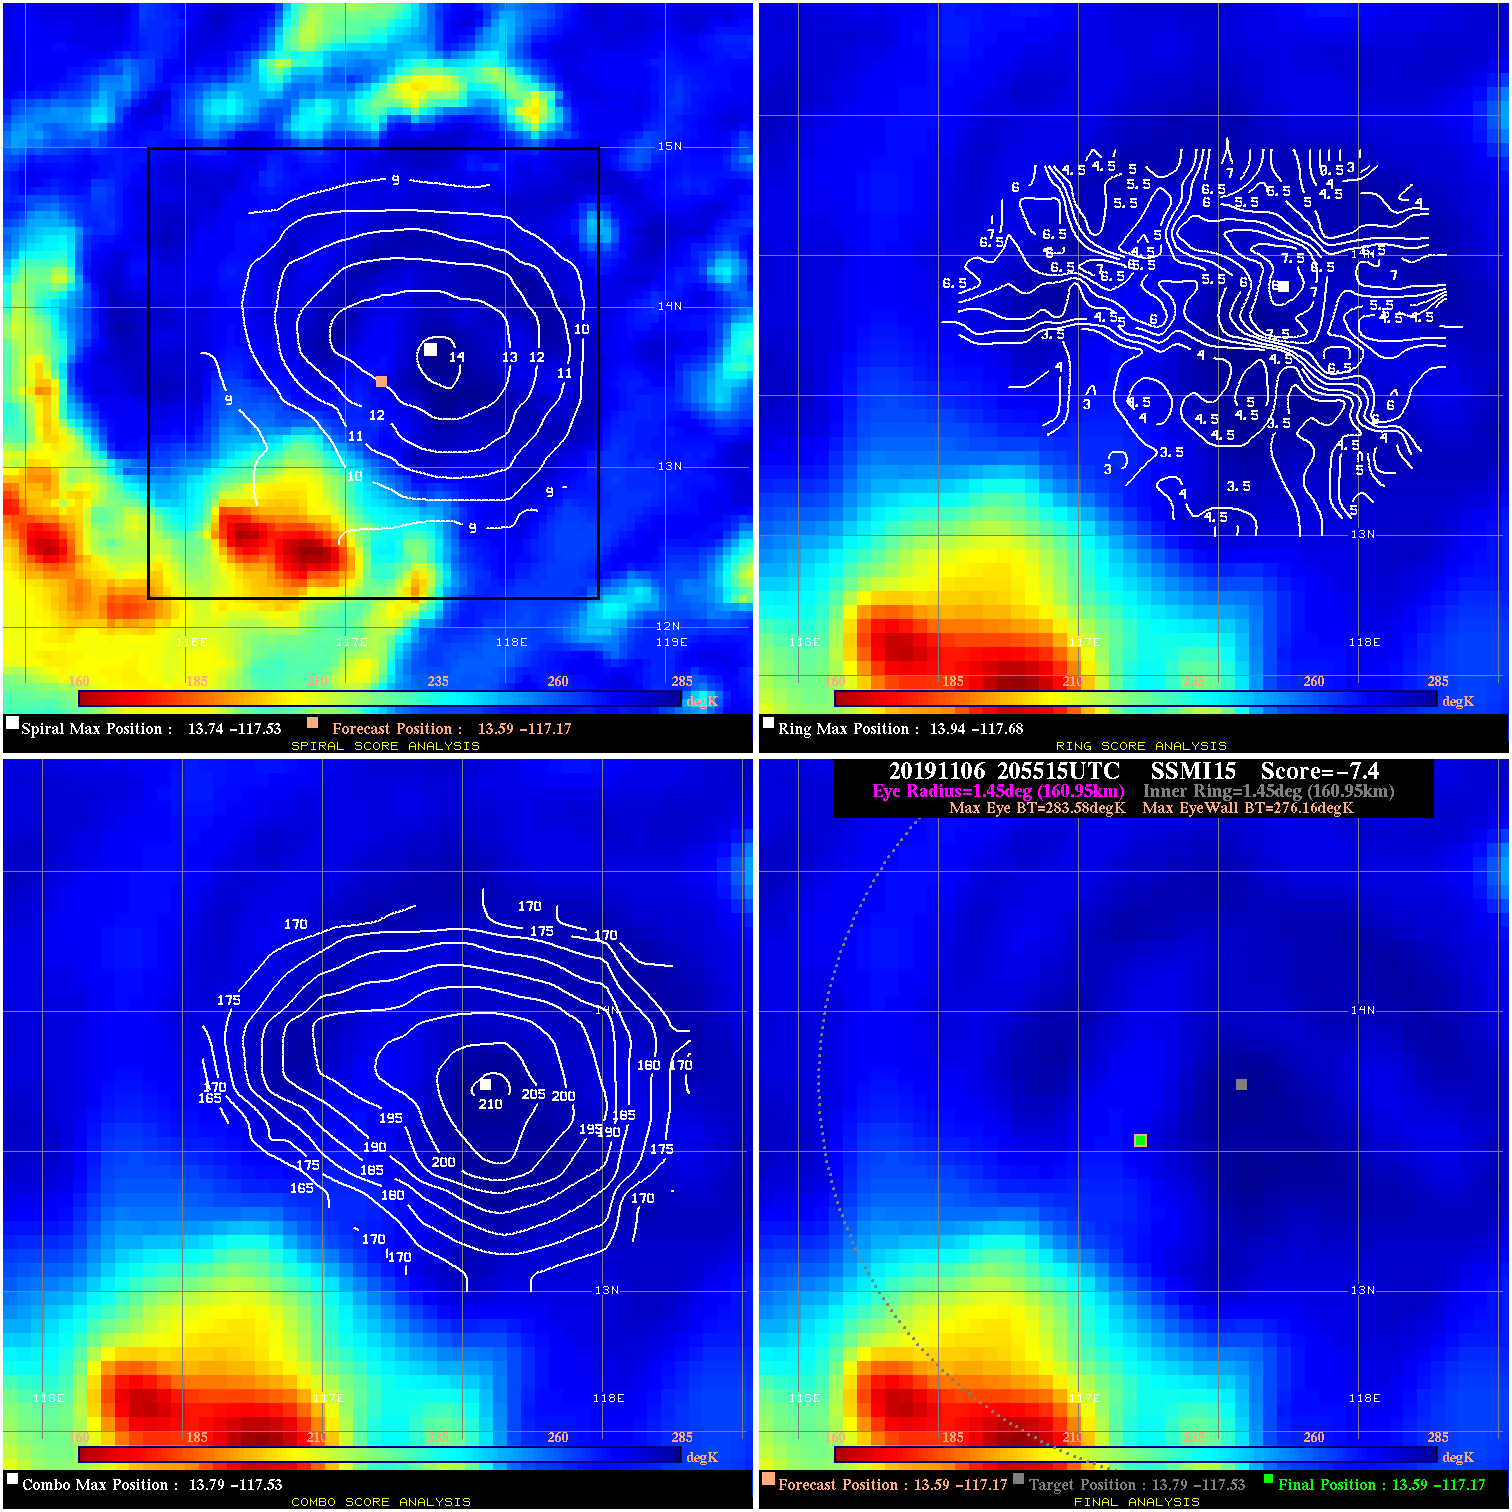
20191106 205515 -7.4 N/A 23.8% 322.19 7.42 40.0 SSMI15 13.6 -117.2 13.6 -117.2 13.8 -117.5 Analysis Plot
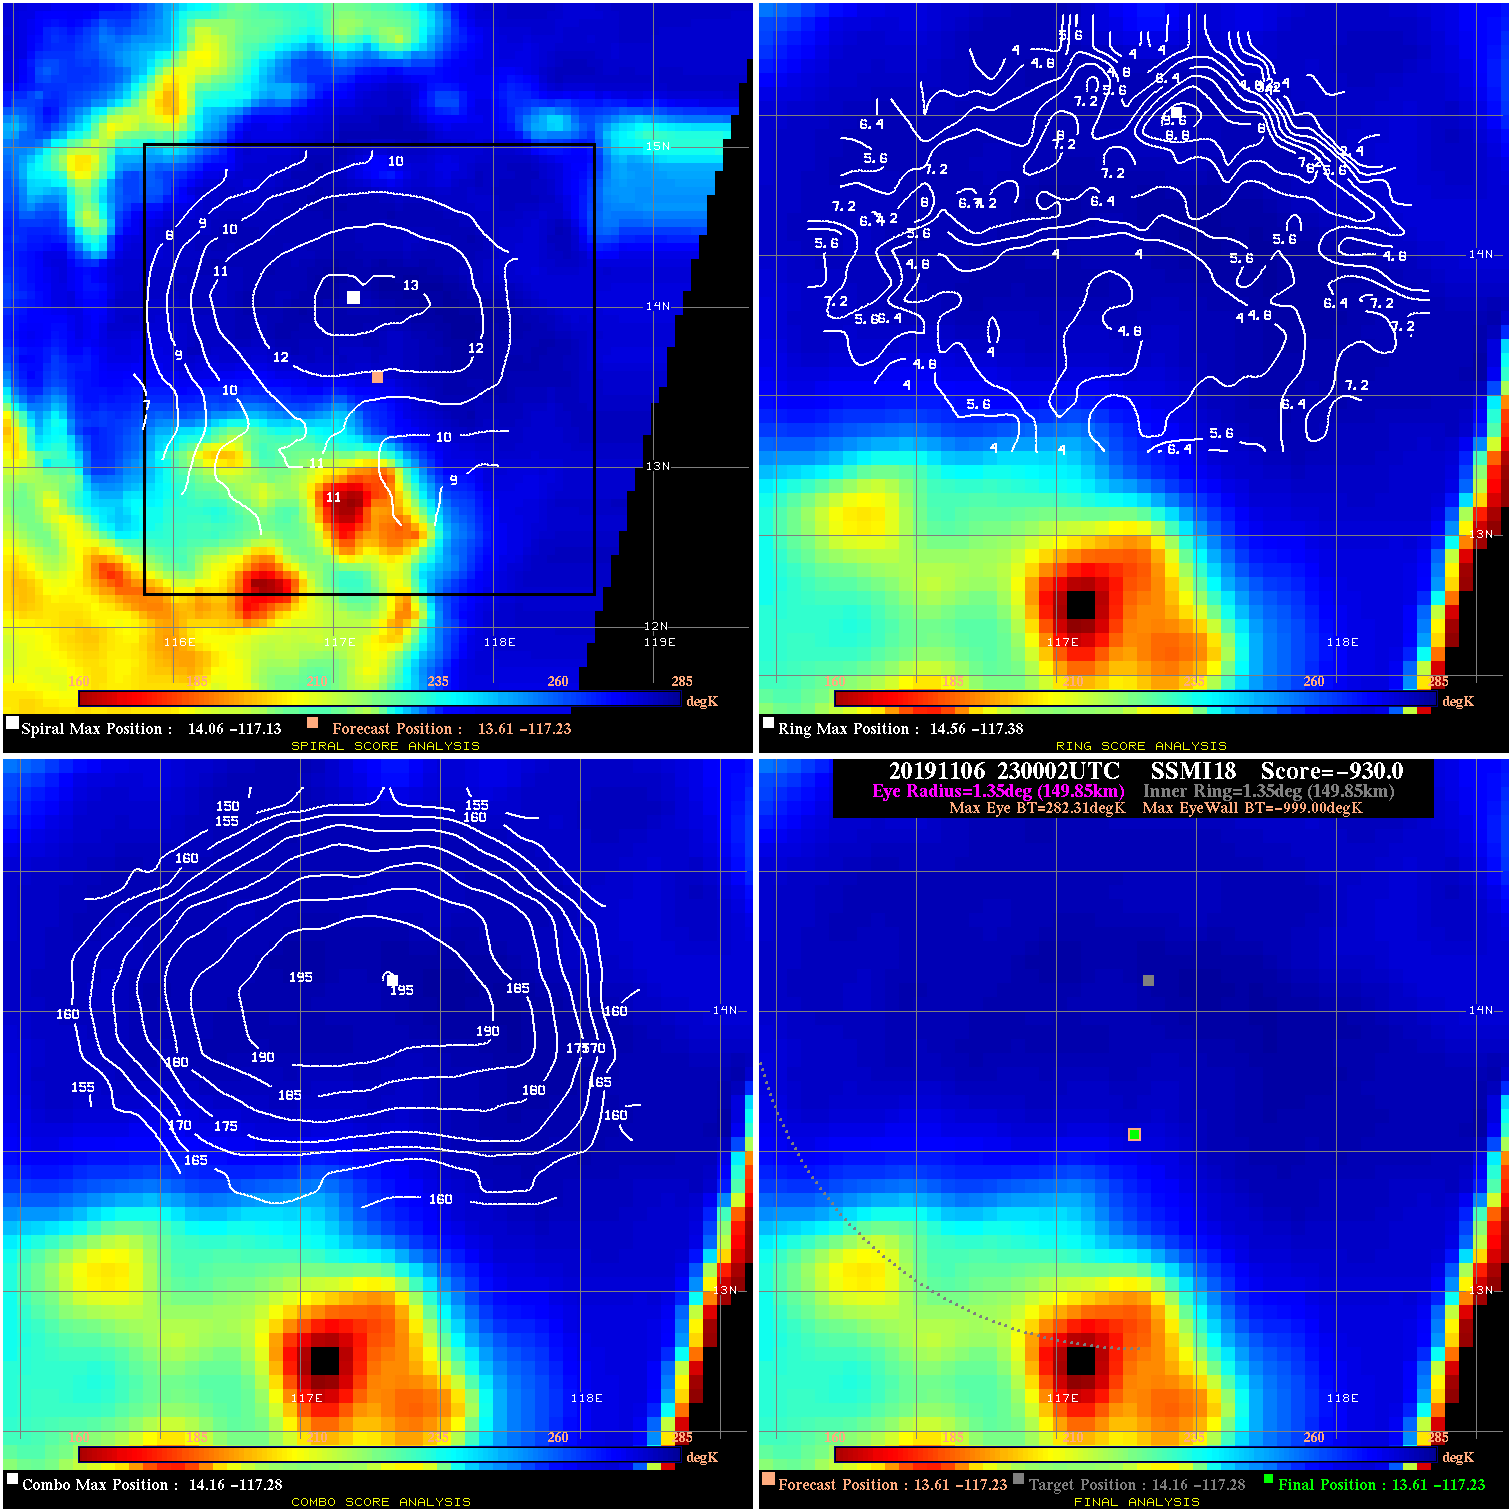
20191106 230002 -930.0 N/A N/A N/A 0.00 40.0 SSMI18 13.6 -117.2 13.6 -117.2 14.2 -117.3 Analysis Plot
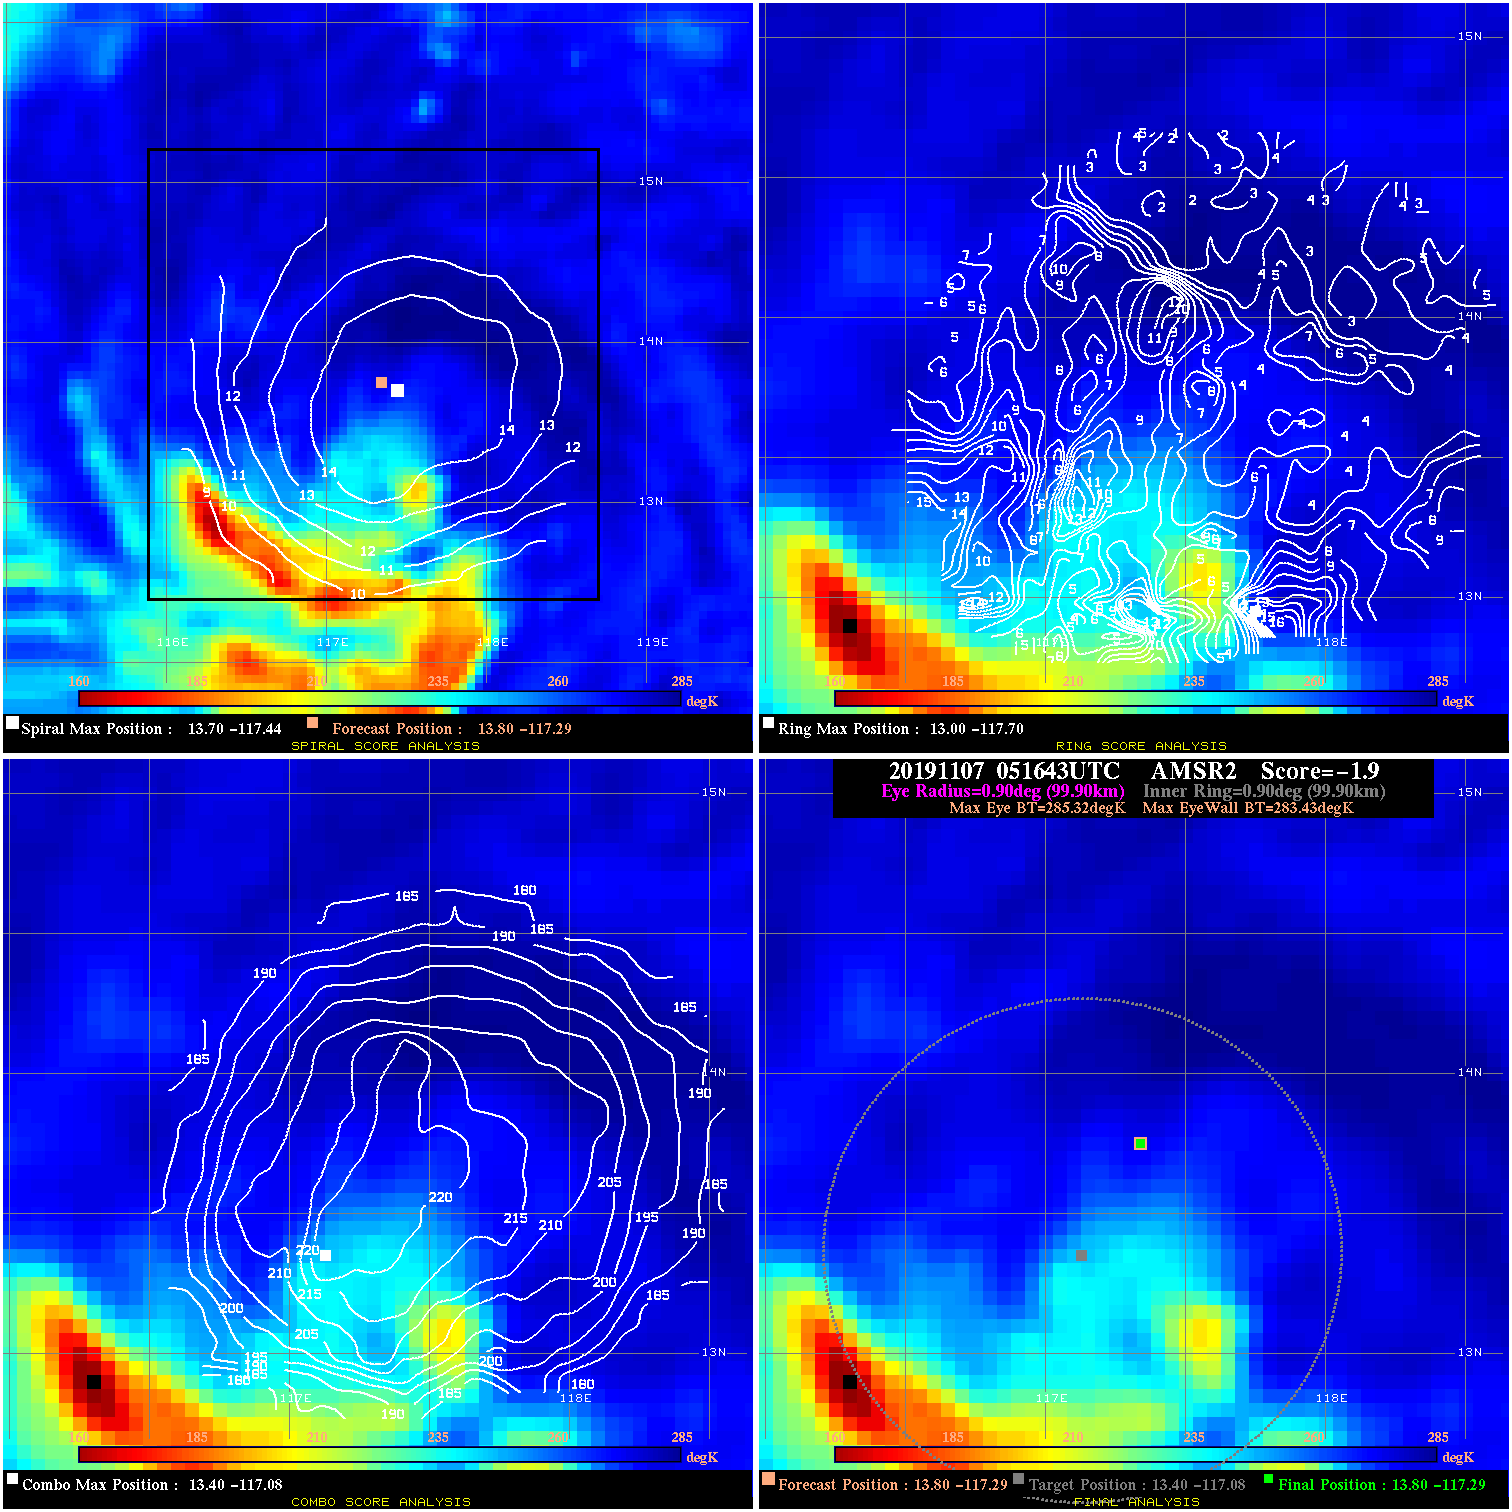
20191107 051643 -1.9 N/A 35.6% 199.98 1.89 45.0 AMSR2 13.8 -117.3 13.8 -117.3 13.4 -117.1 Analysis Plot
20191107 084653 -0.7 N/A 17.8% 211.09 .72 45.0 SSMI16 13.8 -117.3 13.8 -117.3 13.8 -116.9 Analysis Plot
20191107 093615 0.9 N/A 26.0% 33.33 .95 55.0 SSMI18 13.3 -117.2 13.3 -117.2 13.1 -117.4 Analysis Plot
20191107 173055 8.7 N/A 80.8% 99.99 8.67 60.0 AMSR2 13.5 -117.1 13.5 -117.1 12.6 -117.0 Analysis Plot
20191107 203102 15.4 N/A 28.8% 44.44 15.37 60.0 SSMI15 13.5 -117.1 13.5 -117.1 12.6 -117.0 Analysis Plot
20191107 220709 11.7 N/A 28.8% 66.66 11.73 60.0 SSMI18 13.6 -116.9 13.6 -116.9 12.6 -116.9 Analysis Plot
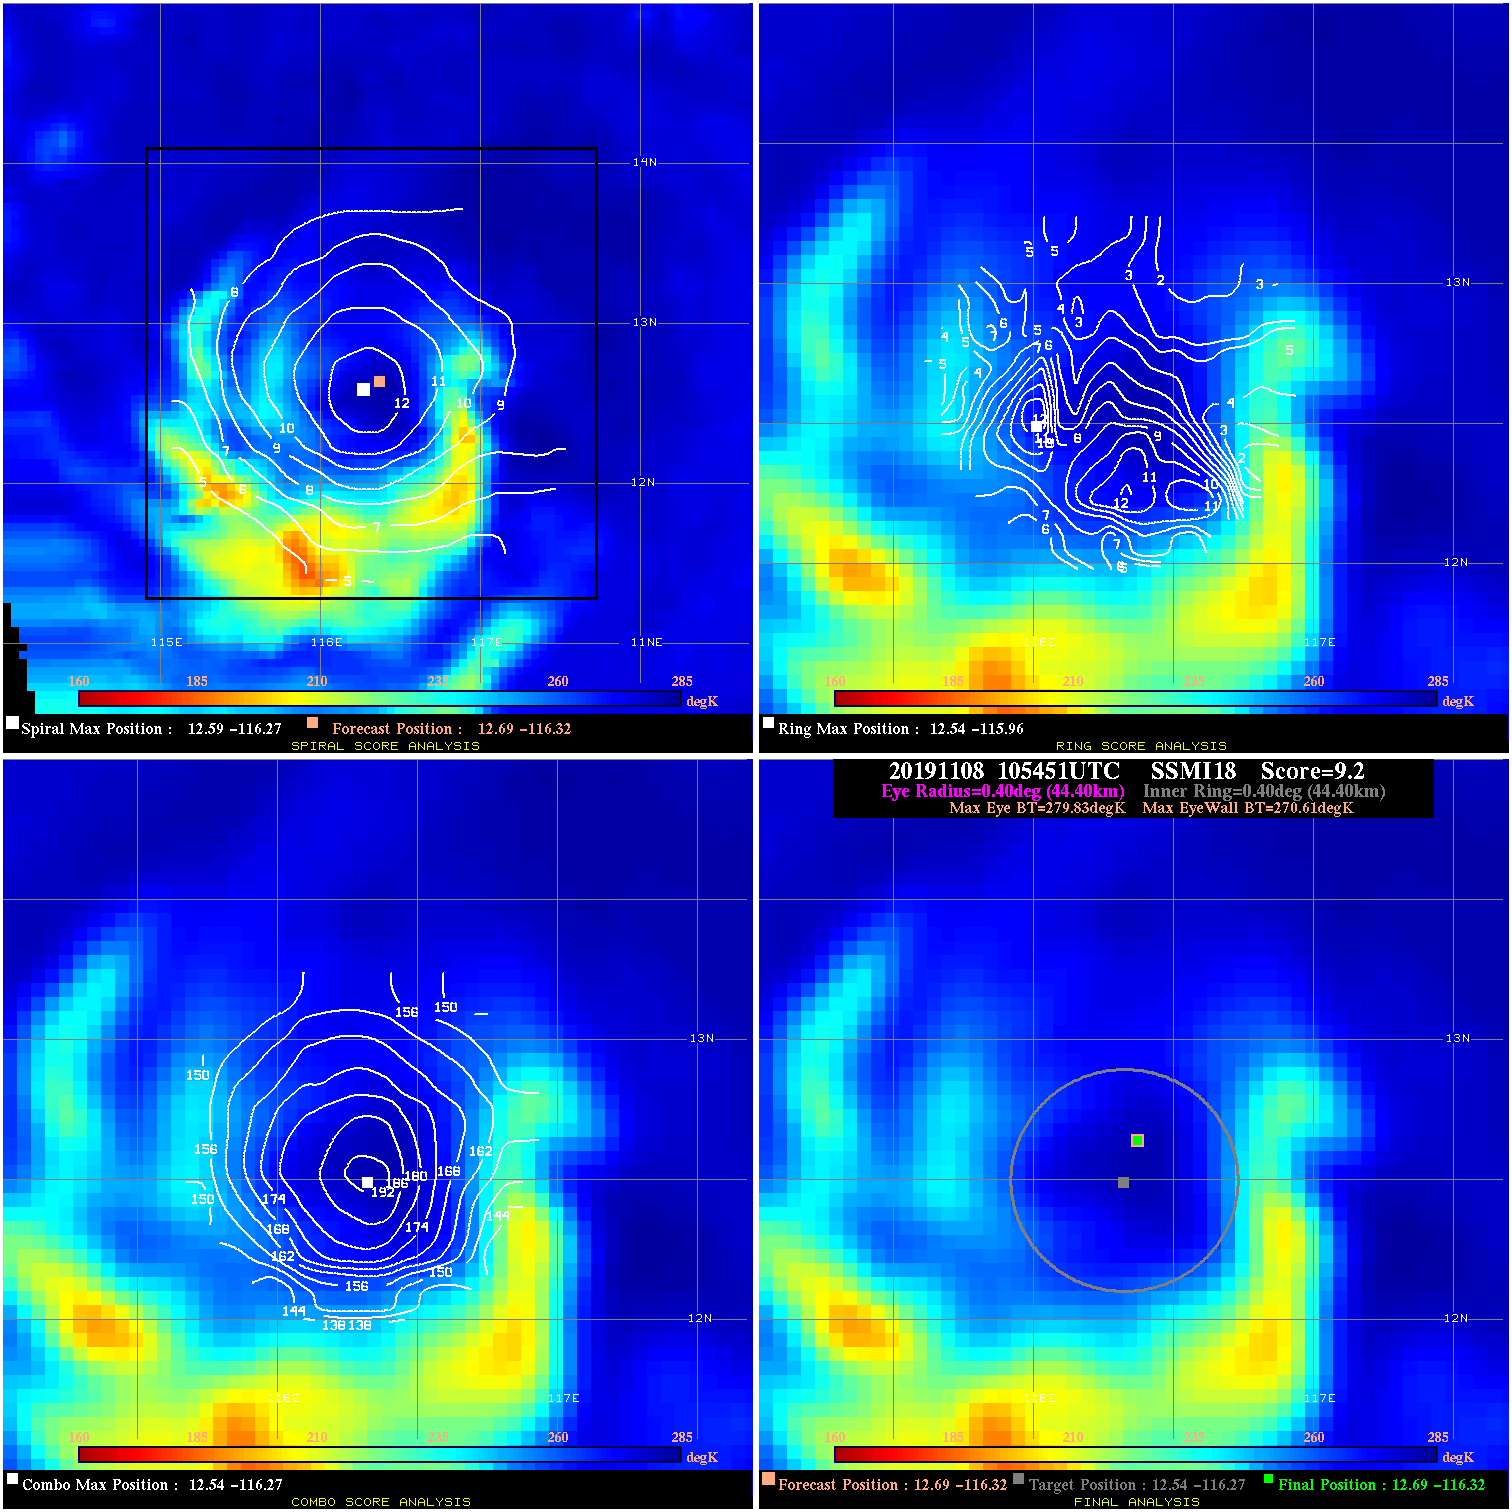
20191108 105451 9.2 N/A 8.2% 88.88 9.22 65.0 SSMI18 12.7 -116.3 12.7 -116.3 12.5 -116.3 Analysis Plot
20191108 195900 -930.0 N/A N/A N/A 0.00 65.0 SSMI15 12.9 -115.1 12.9 -115.1 12.4 -115.5 Analysis Plot
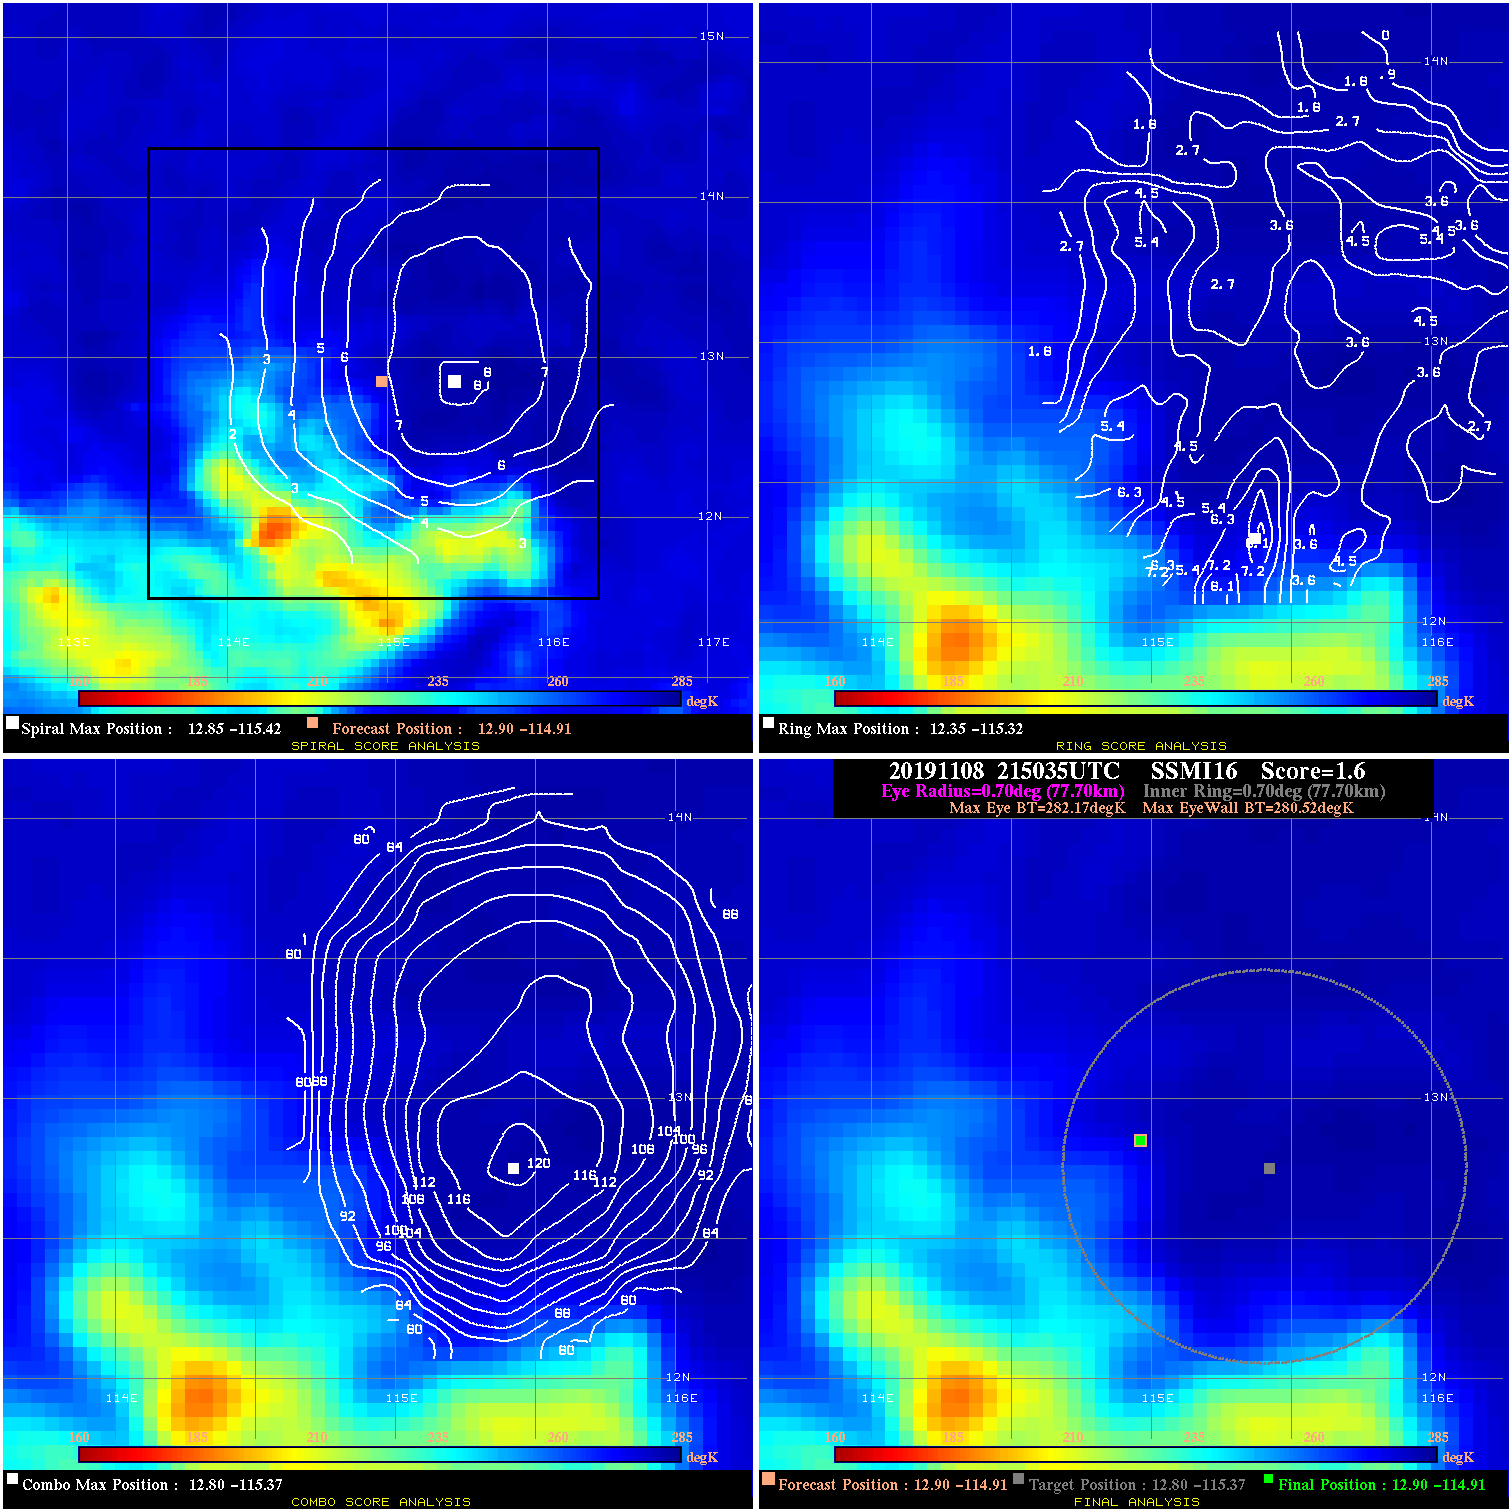
20191108 215035 1.6 N/A 11.0% 155.54 1.65 65.0 SSMI16 12.9 -114.9 12.9 -114.9 12.8 -115.4 Analysis Plot
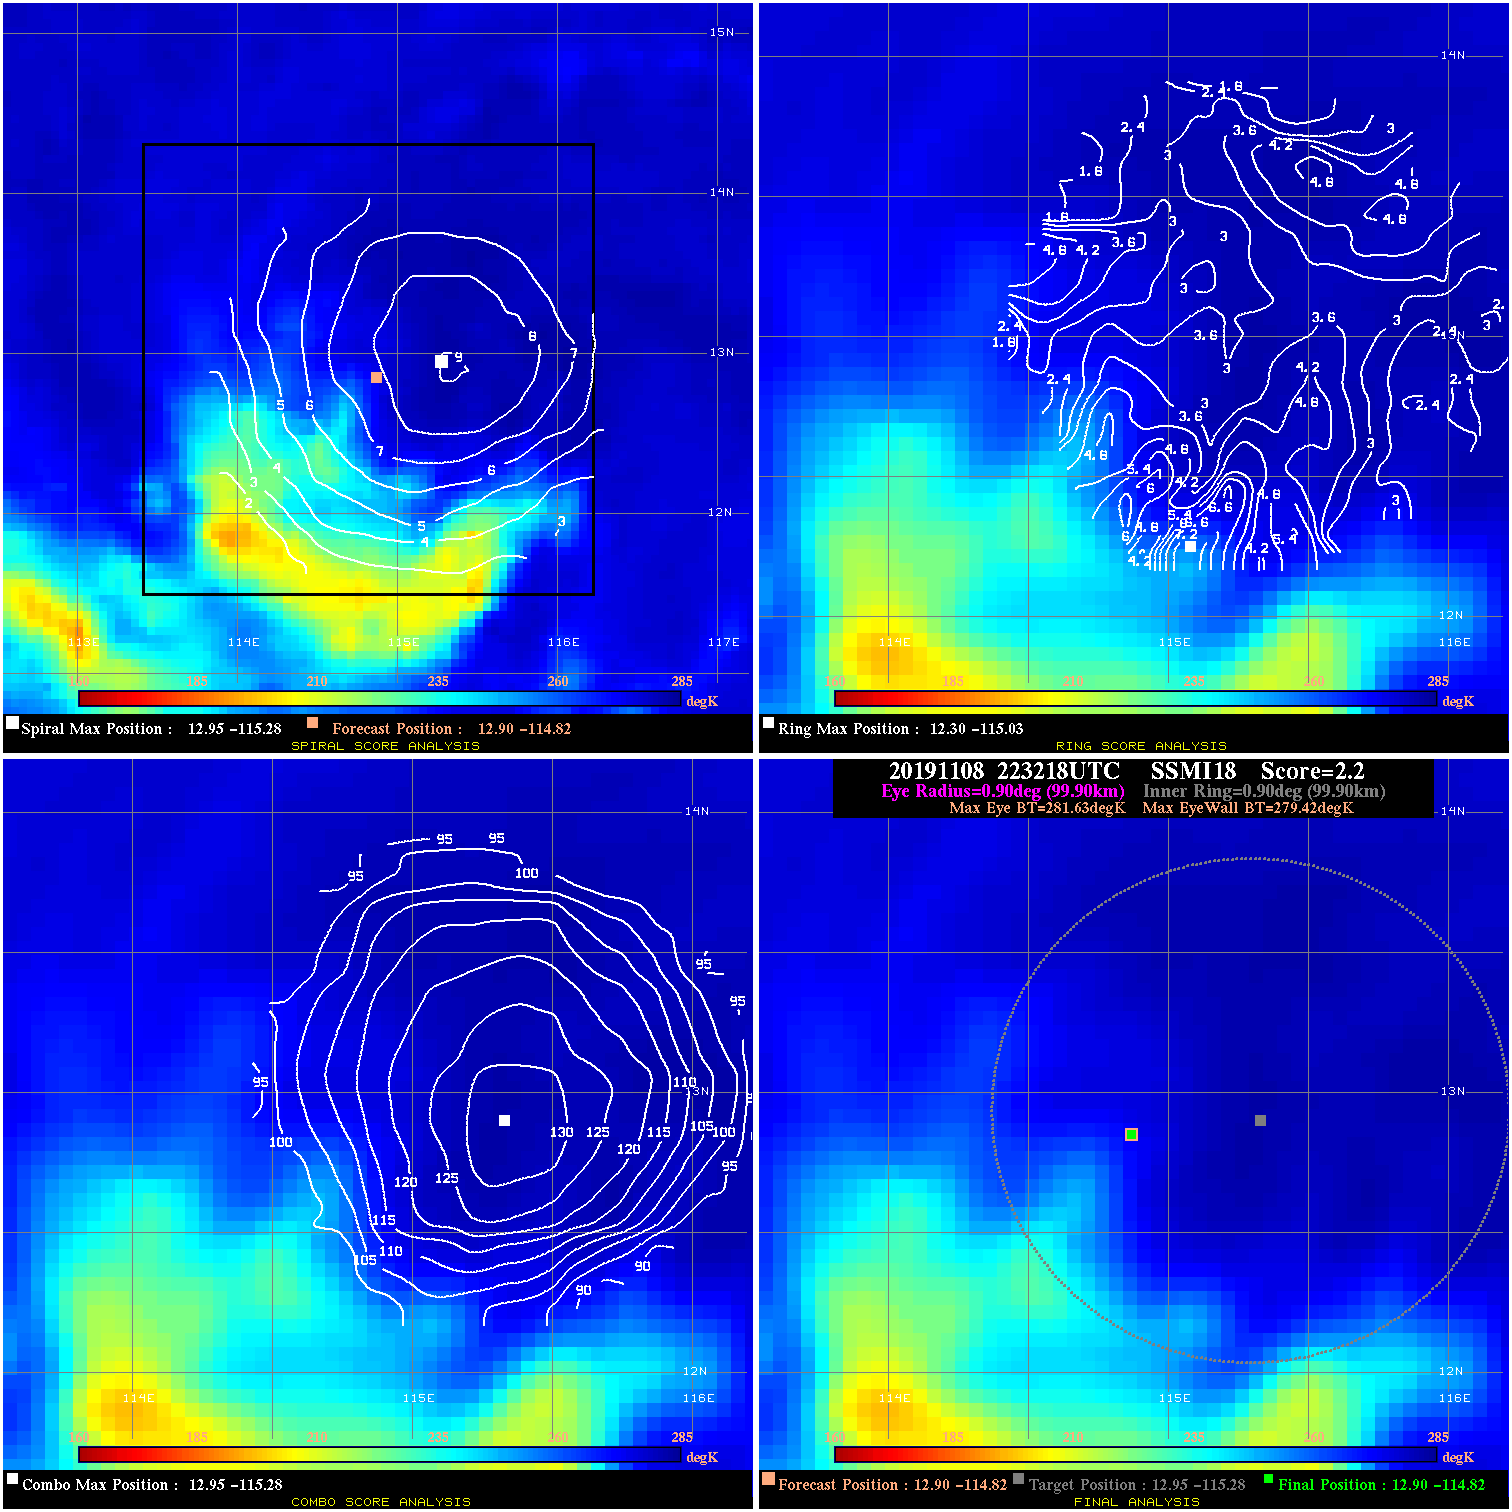
20191108 223218 2.2 N/A 11.0% 199.98 2.21 65.0 SSMI18 12.9 -114.8 12.9 -114.8 12.9 -115.3 Analysis Plot
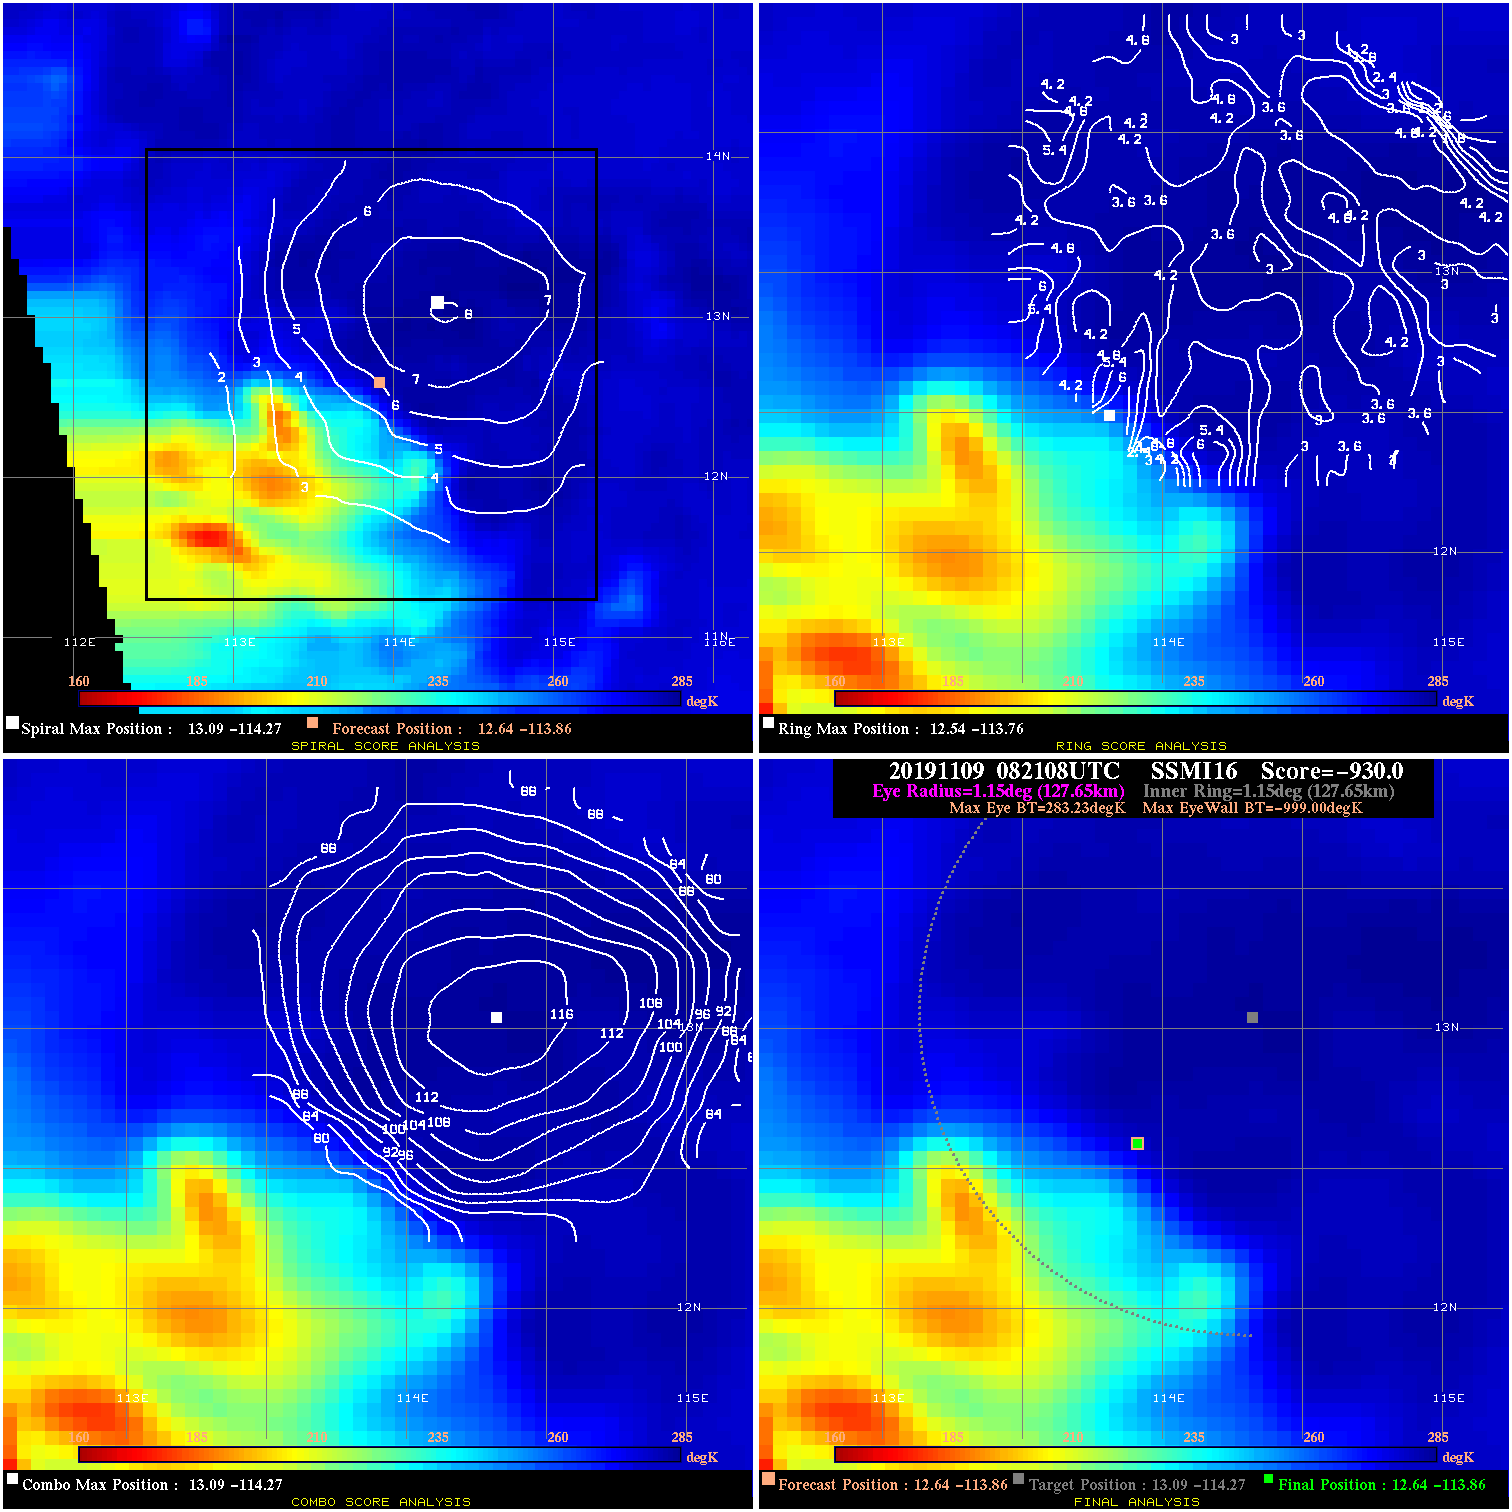
20191109 082108 -930.0 N/A N/A N/A 0.00 55.0 SSMI16 12.6 -113.9 12.6 -113.9 13.1 -114.3 Analysis Plot
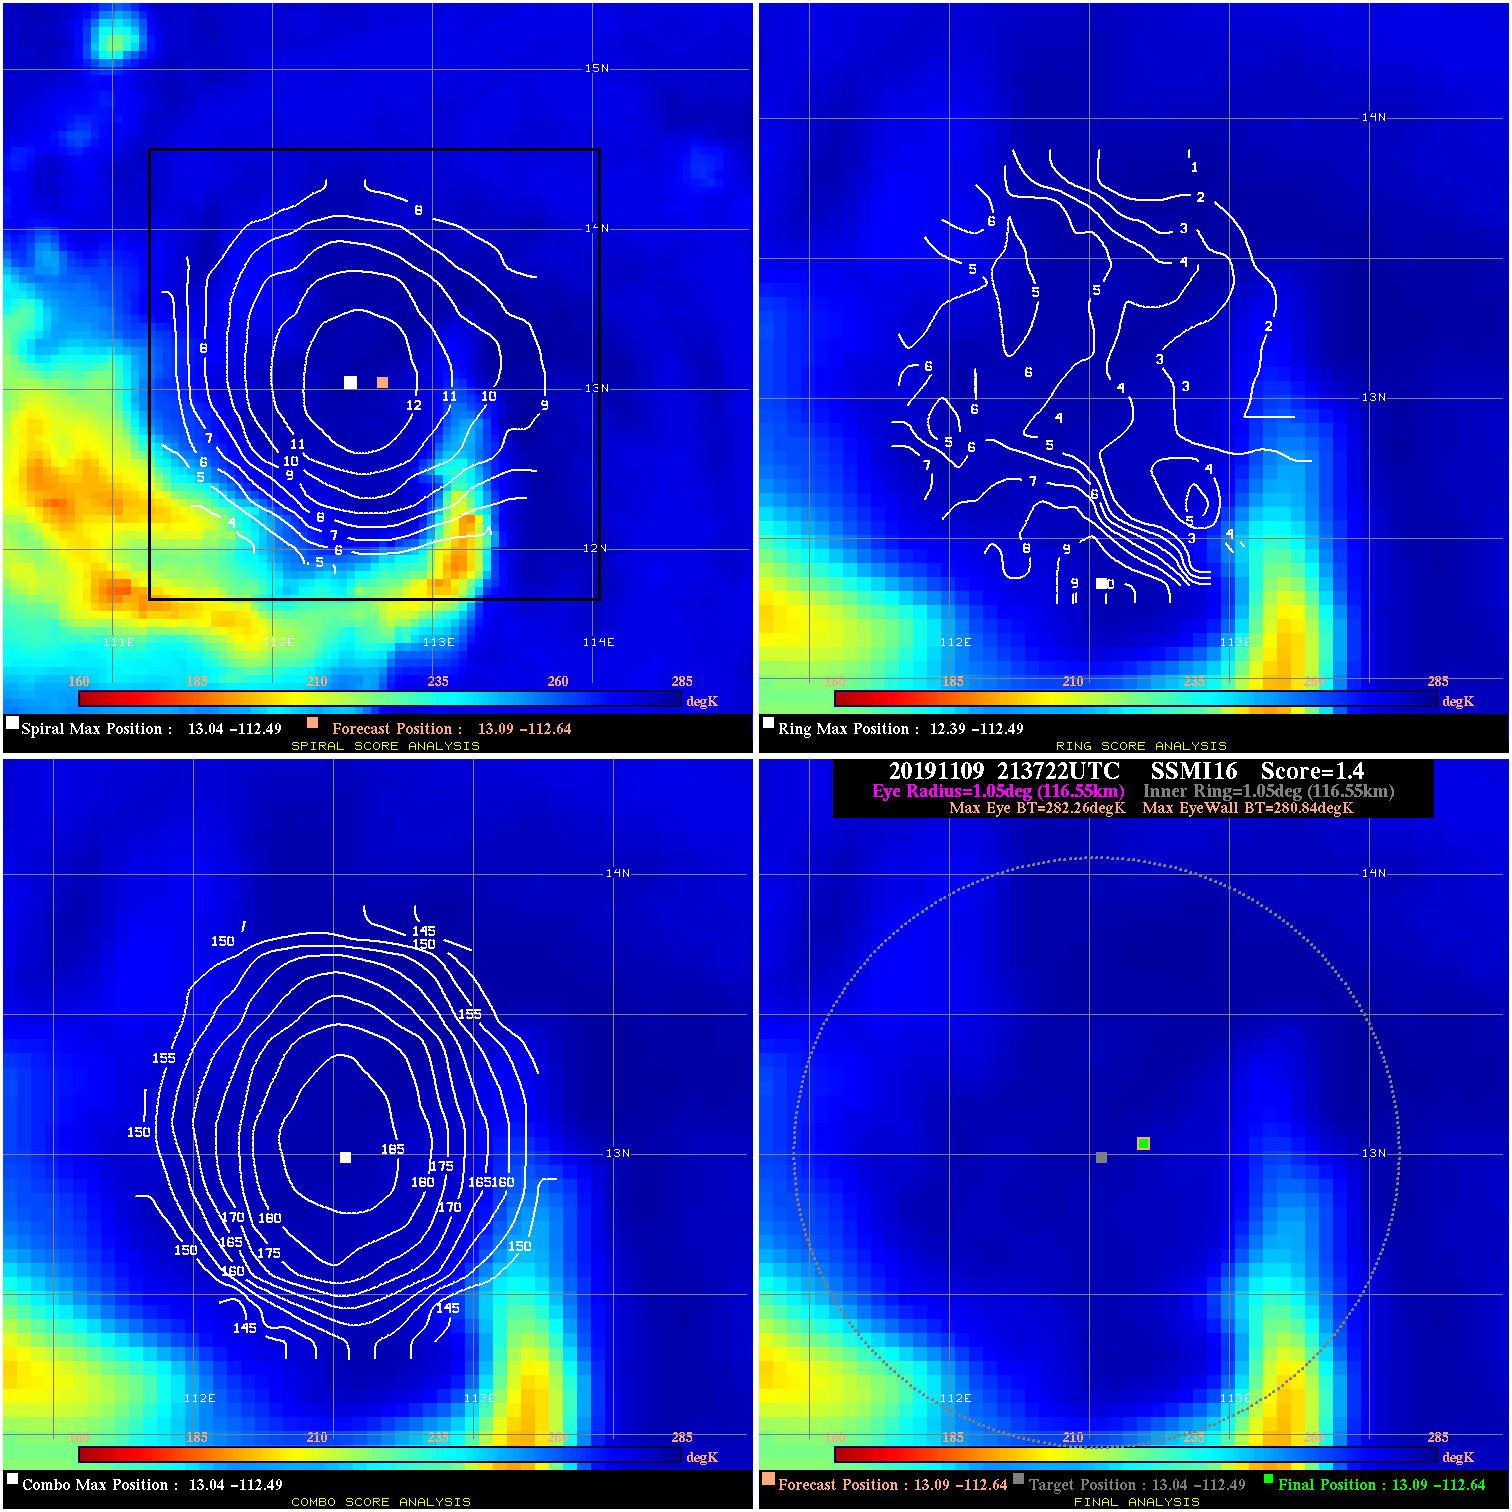
20191109 213722 1.4 N/A 20.5% 233.31 1.42 55.0 SSMI16 13.1 -112.6 13.1 -112.6 13.0 -112.5 Analysis Plot
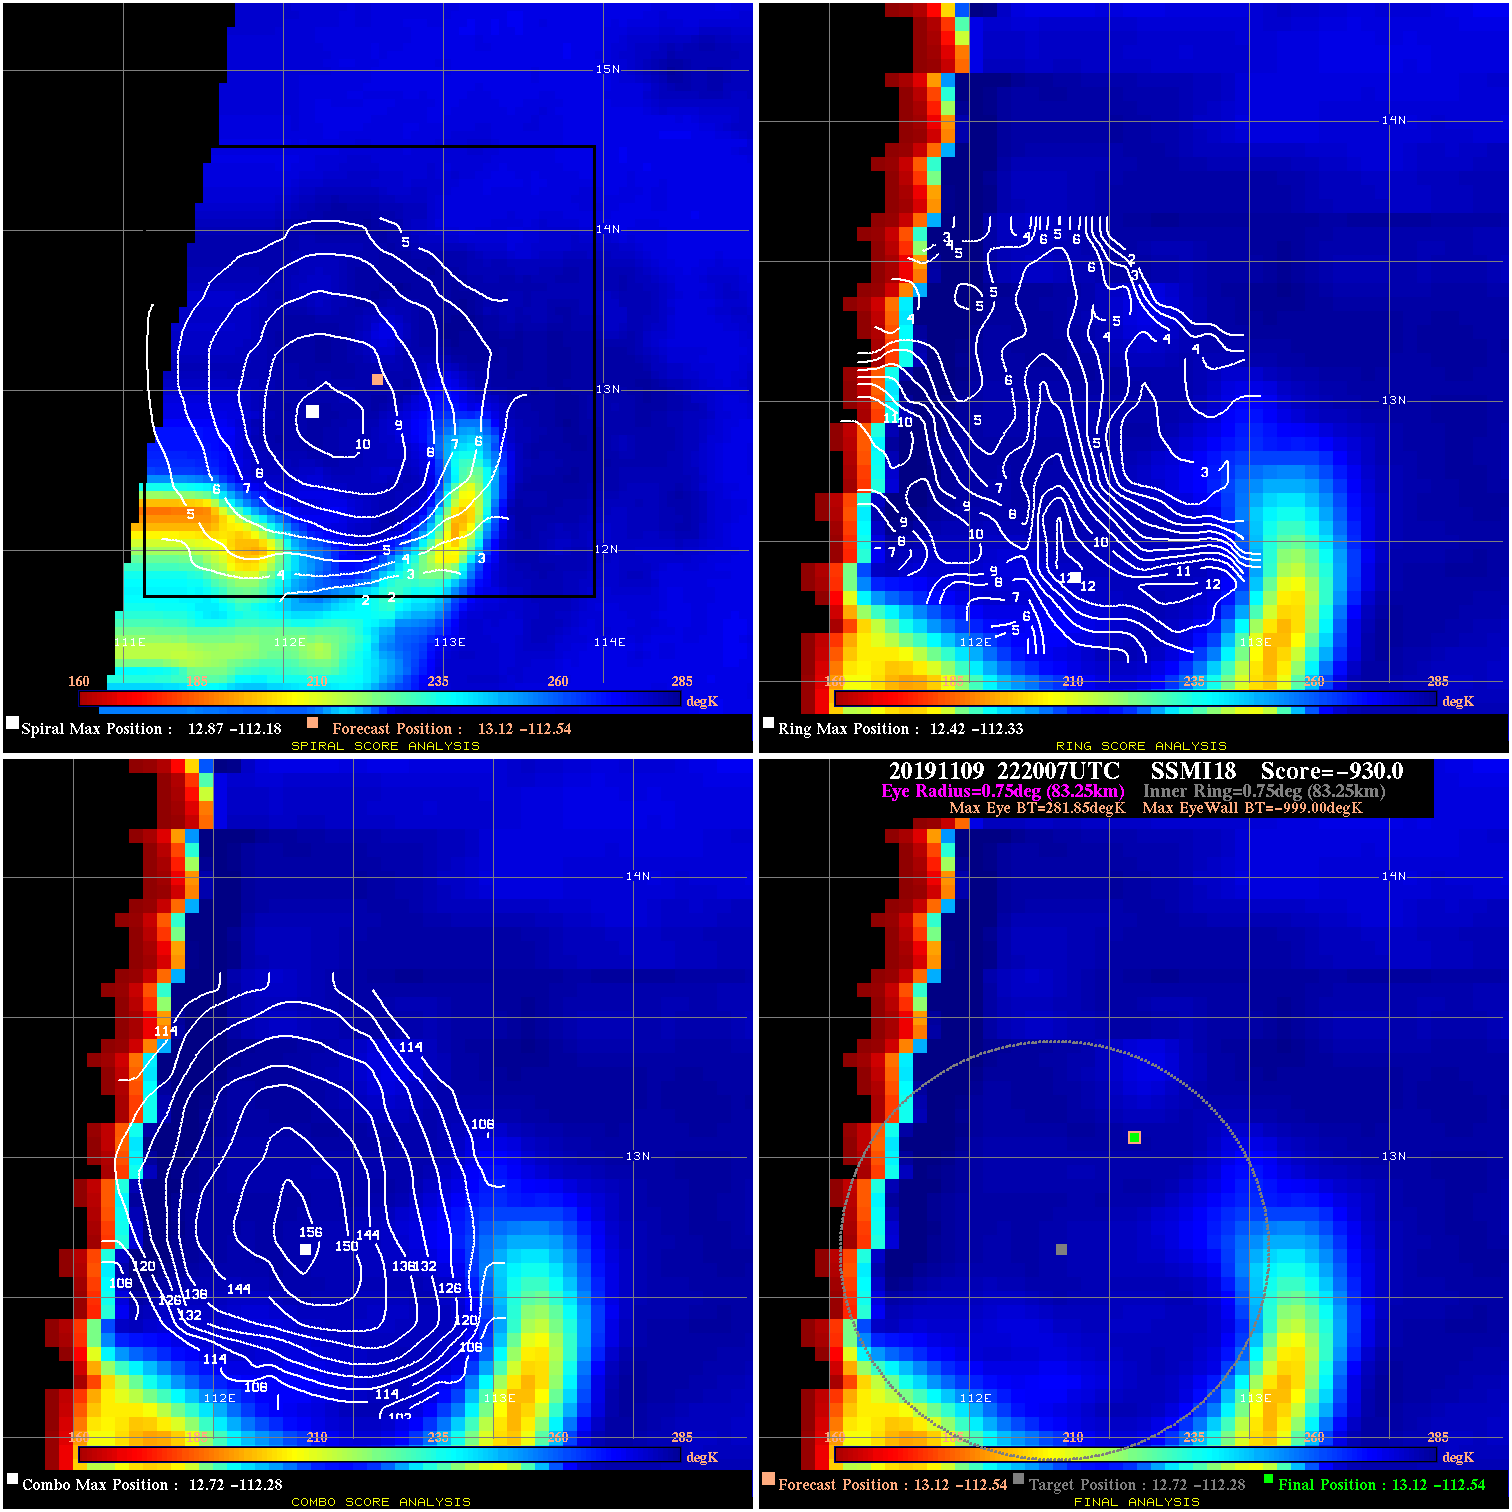
20191109 222007 -930.0 N/A N/A N/A 0.00 55.0 SSMI18 13.1 -112.5 13.1 -112.5 12.7 -112.3 Analysis Plot
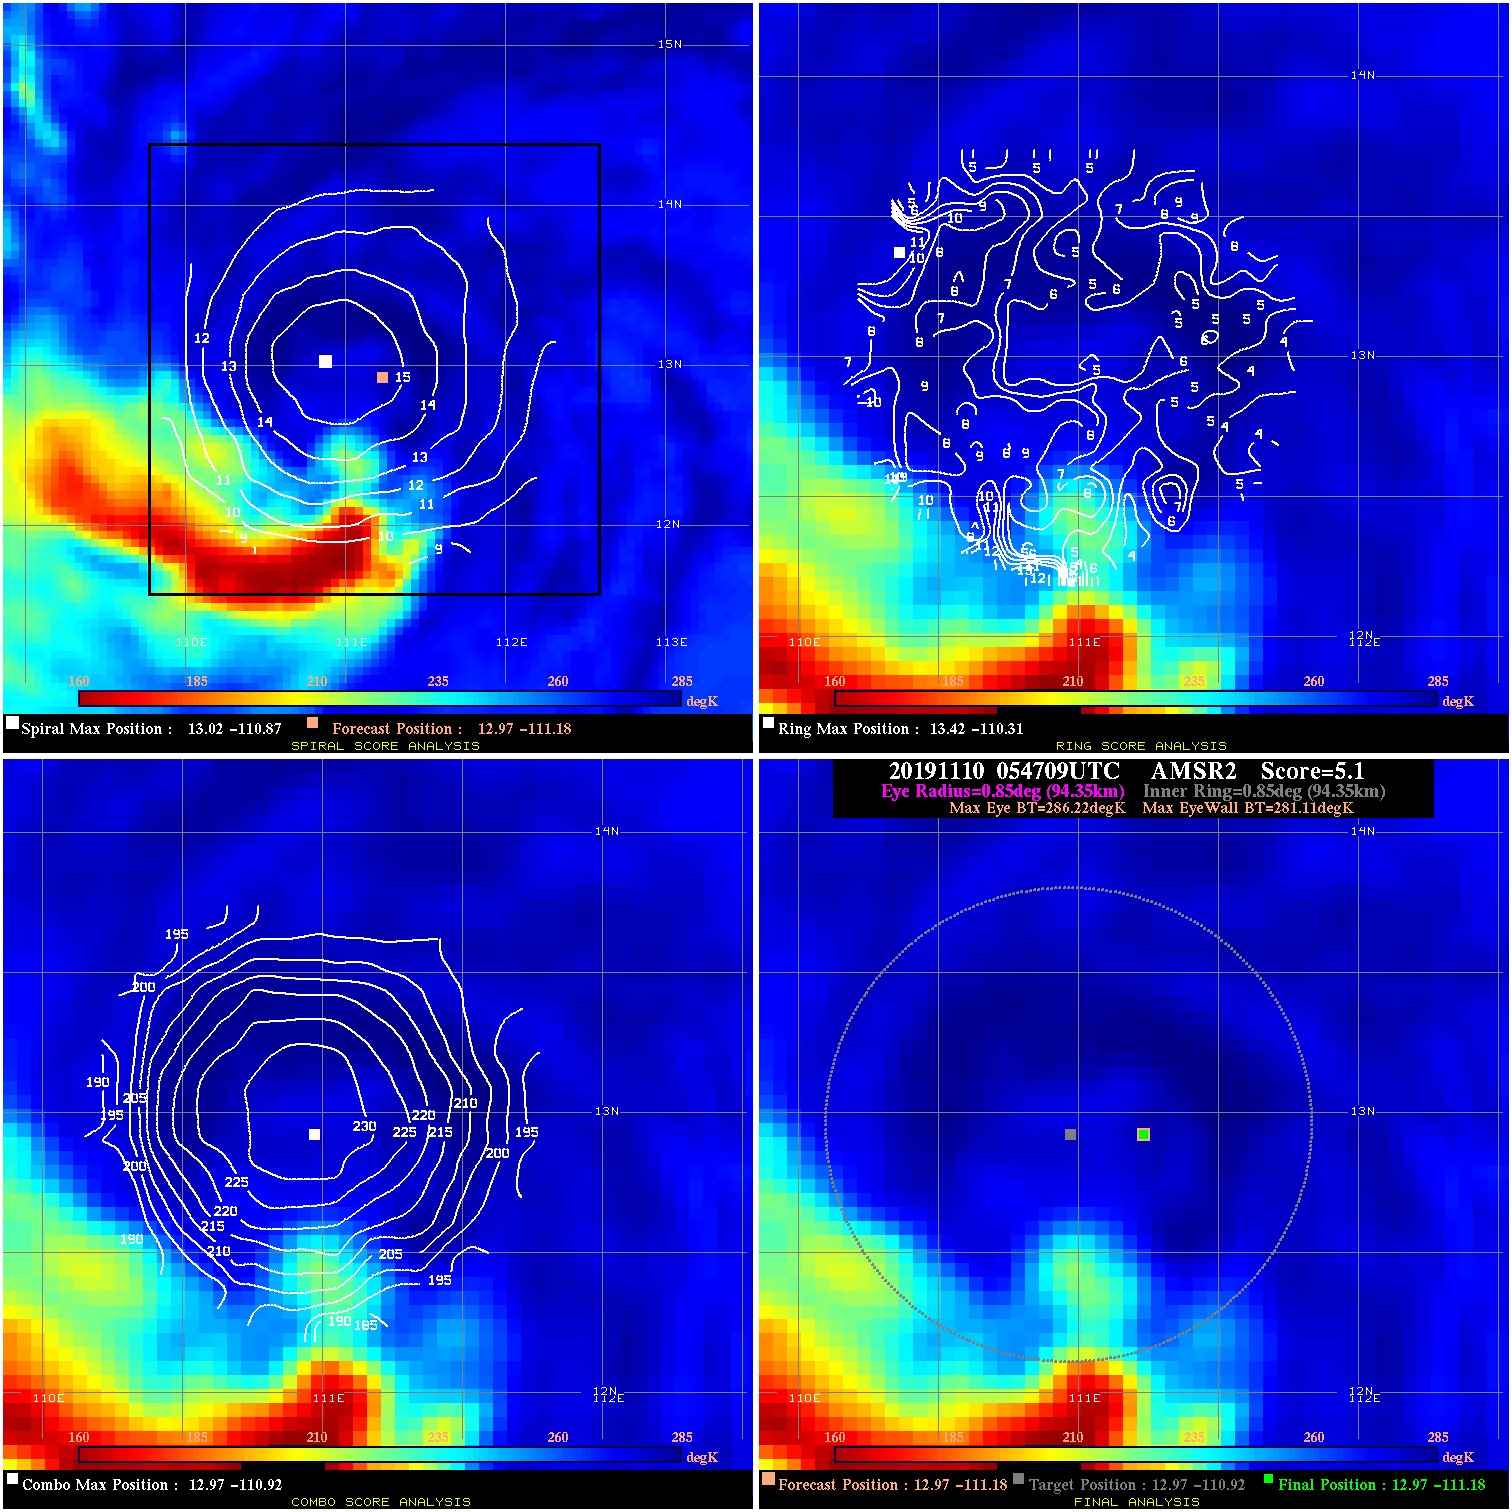
20191110 054709 5.1 N/A 13.7% 188.87 5.11 55.0 AMSR2 13.0 -111.2 13.0 -111.2 13.0 -110.9 Analysis Plot
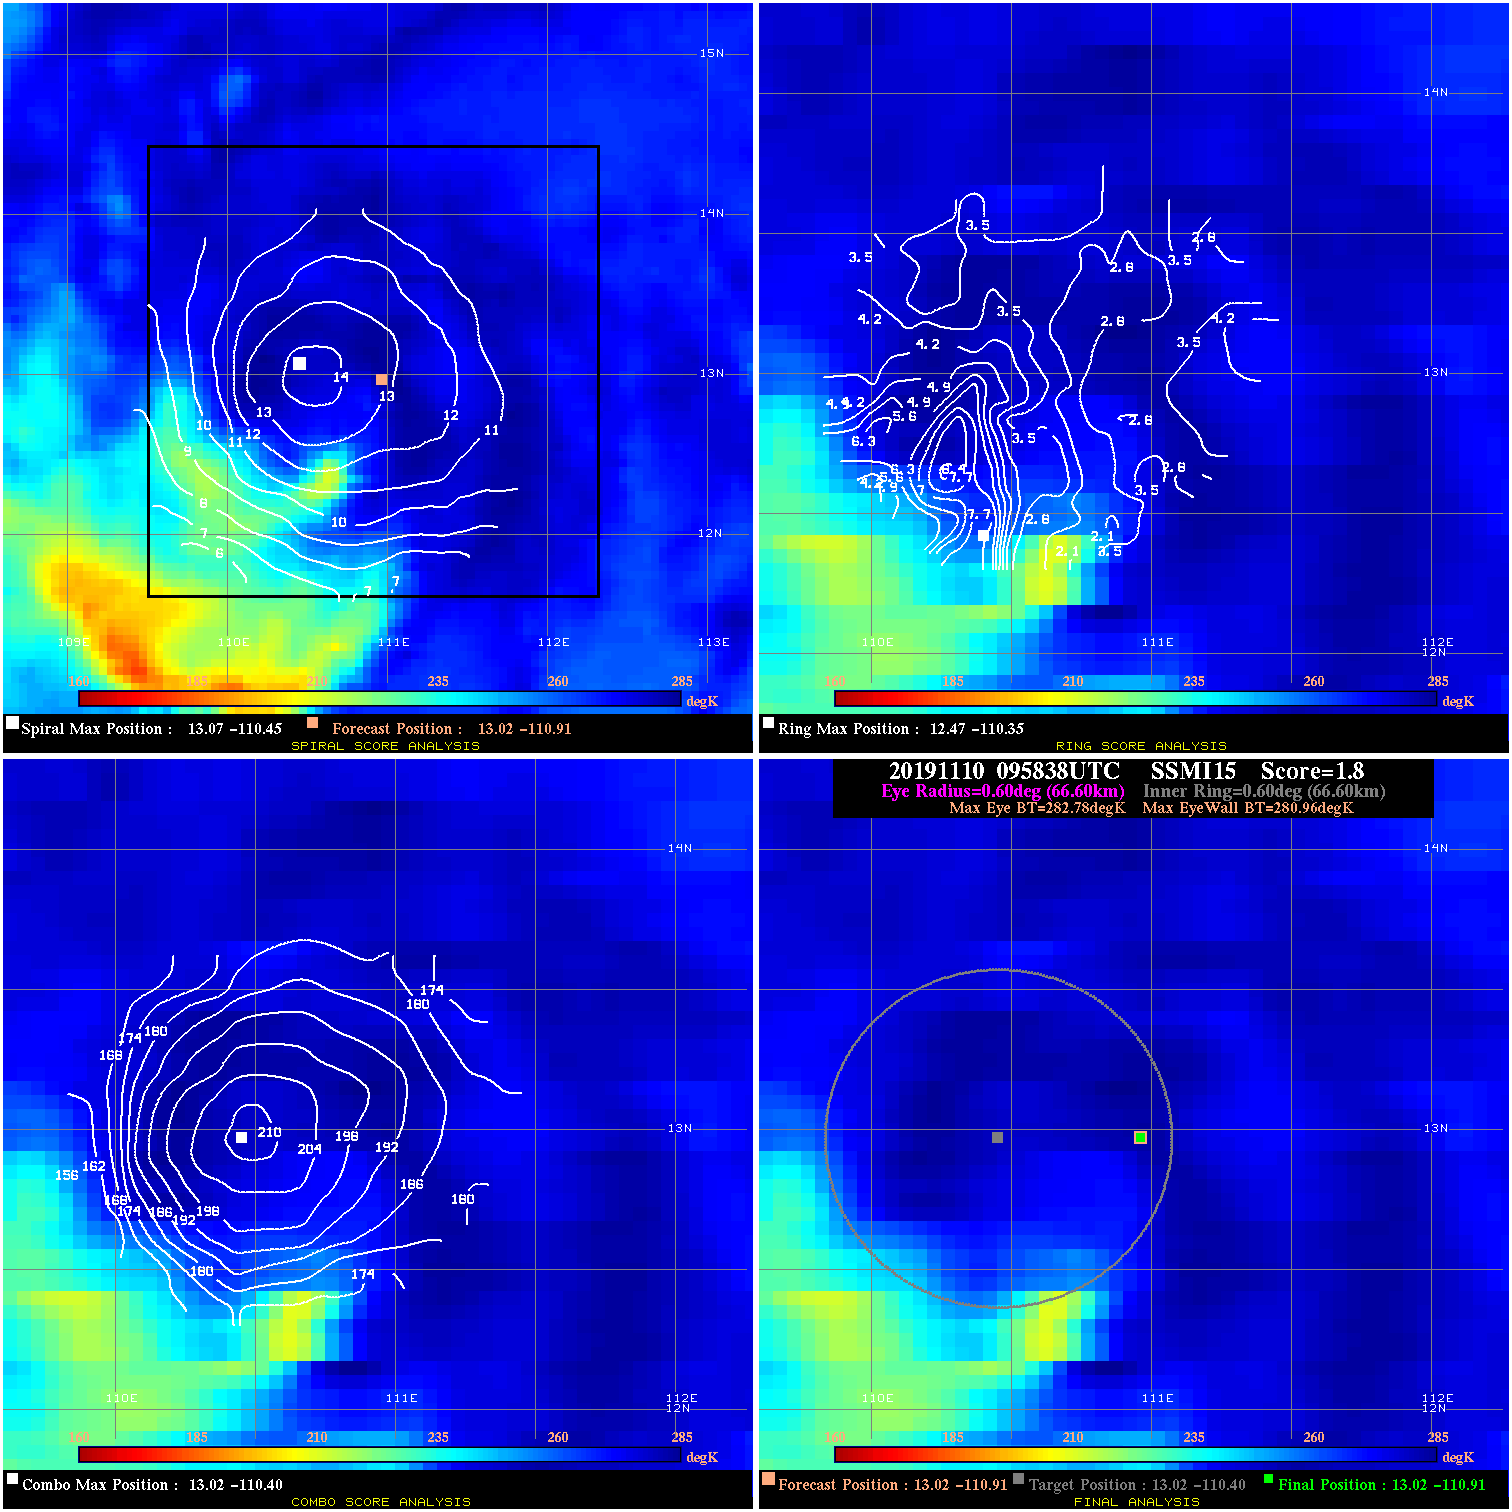
20191110 095838 1.8 N/A 13.7% 133.32 1.82 55.0 SSMI15 13.0 -110.9 13.0 -110.9 13.0 -110.4 Analysis Plot
20191110 102941 -930.0 N/A N/A N/A 0.00 50.0 SSMI18 12.8 -110.4 12.8 -110.4 12.9 -110.6 Analysis Plot
20191110 210630 -4.4 N/A 1.4% 122.21 4.43 45.0 SSMI15 13.0 -108.9 13.0 -108.9 13.3 -108.9 Analysis Plot
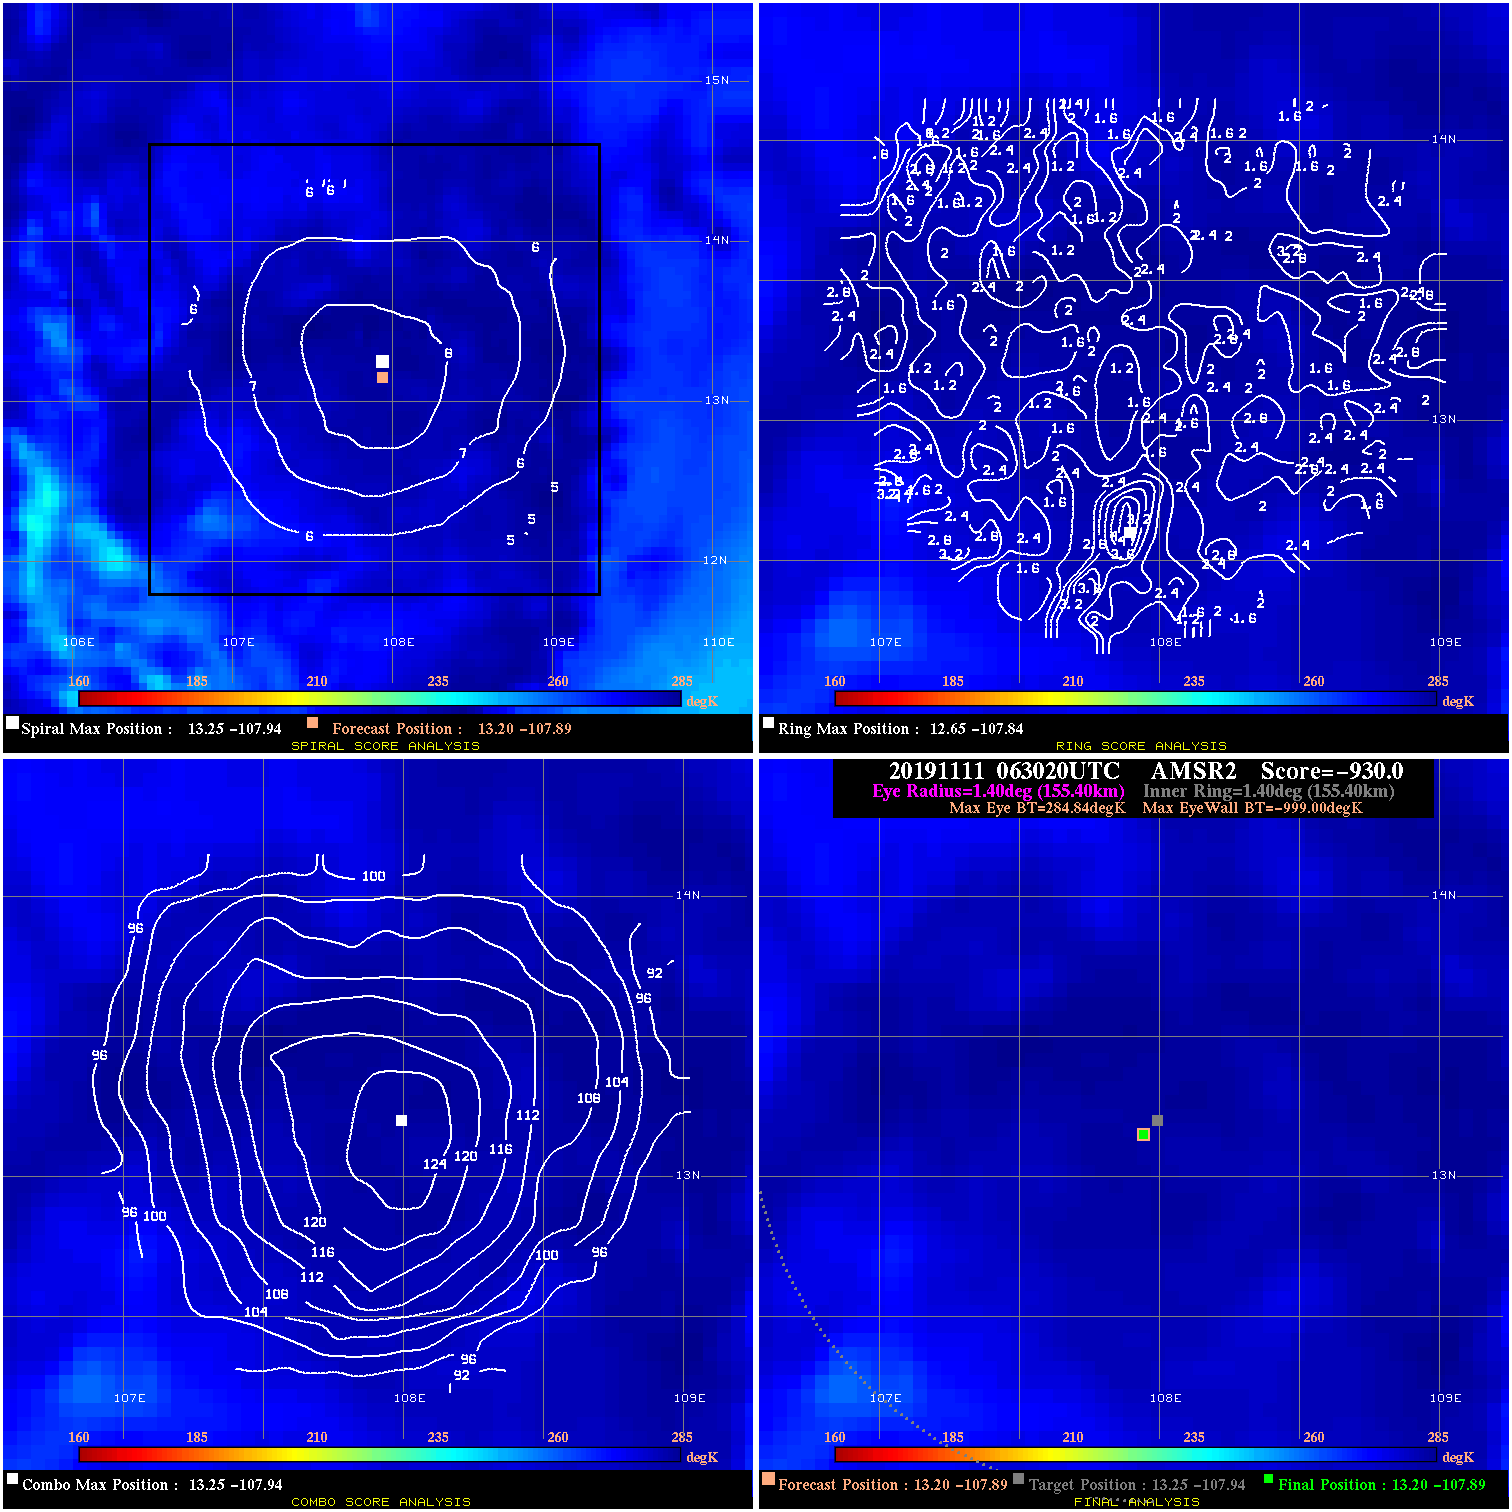
20191111 063020 -930.0 N/A N/A N/A 0.00 45.0 AMSR2 13.2 -107.9 13.2 -107.9 13.3 -107.9 Analysis Plot
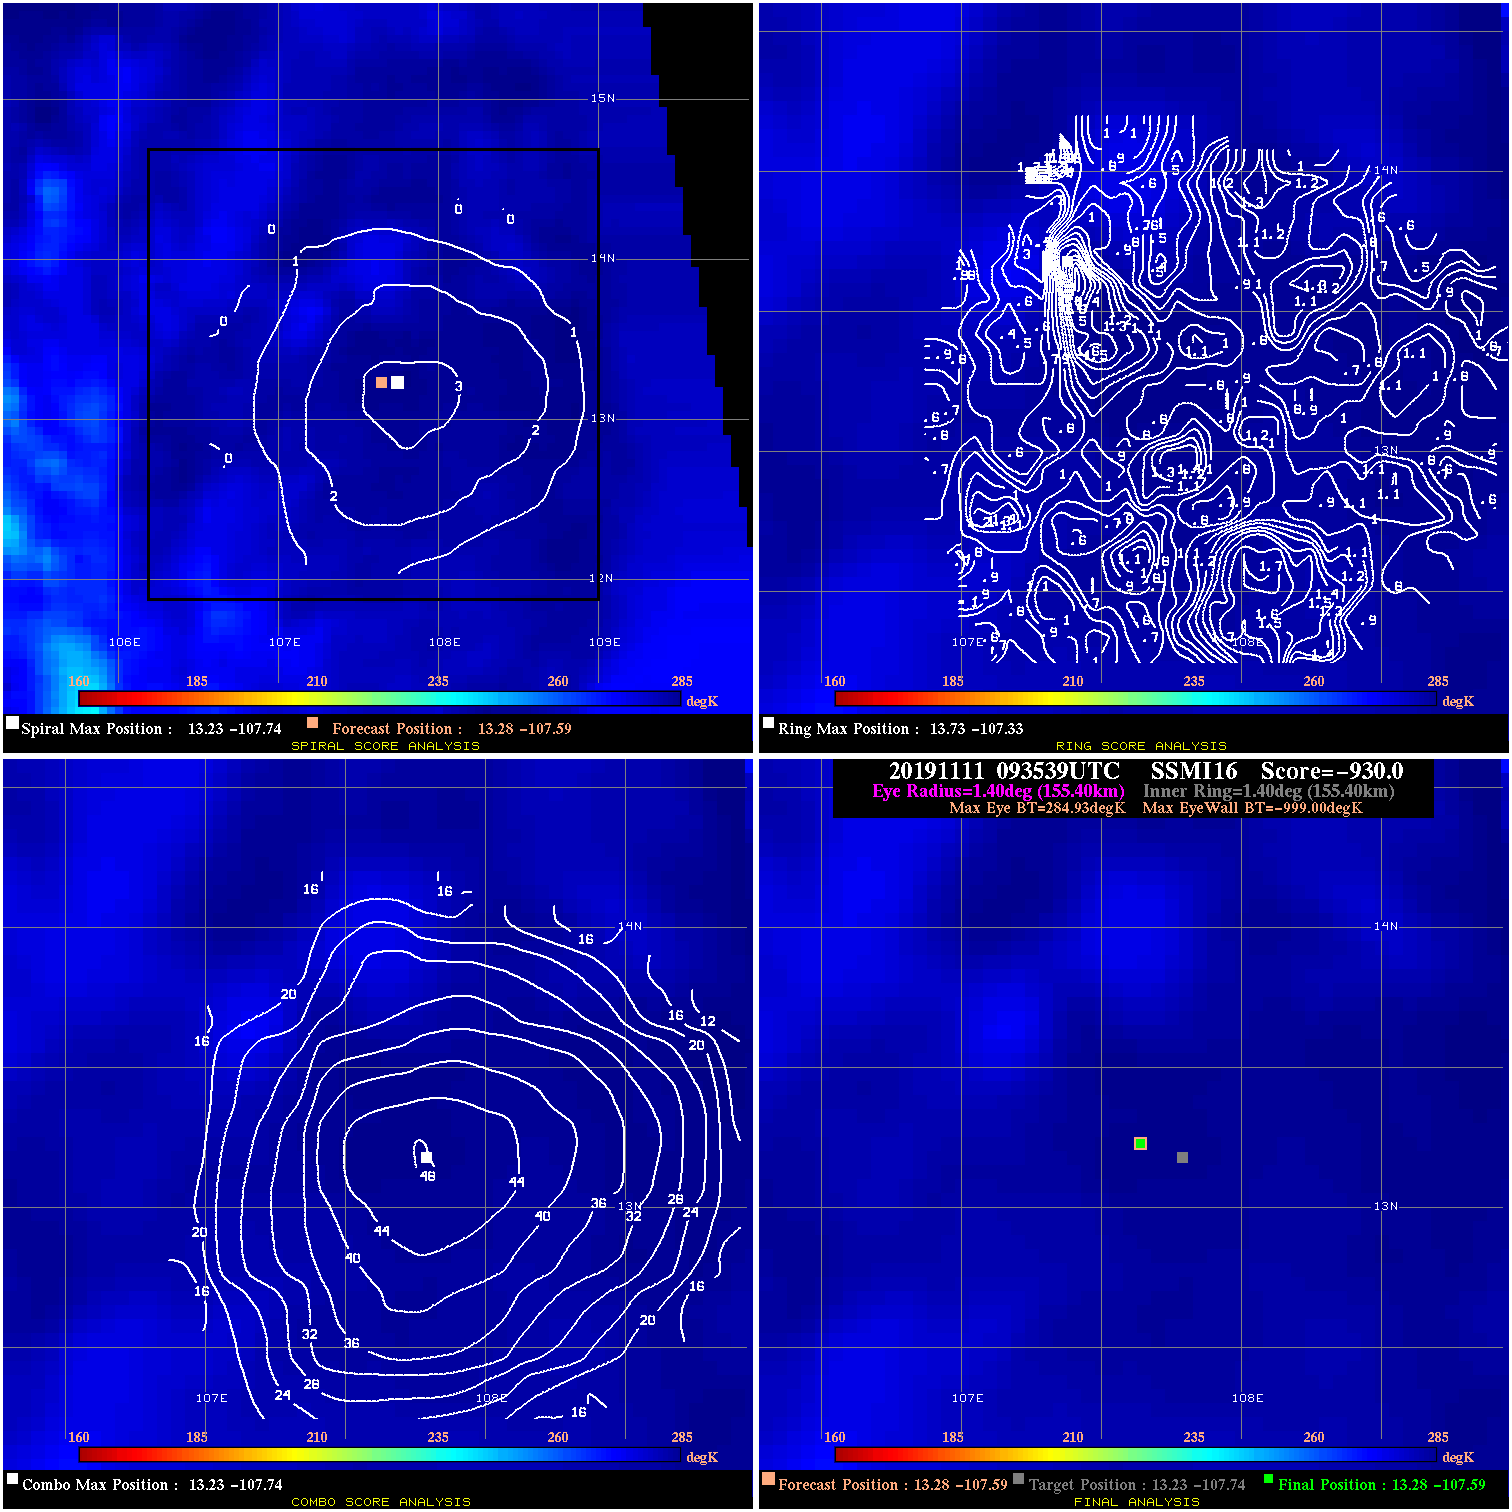
20191111 093539 -930.0 N/A N/A N/A 0.00 45.0 SSMI16 13.3 -107.6 13.3 -107.6 13.2 -107.7 Analysis Plot
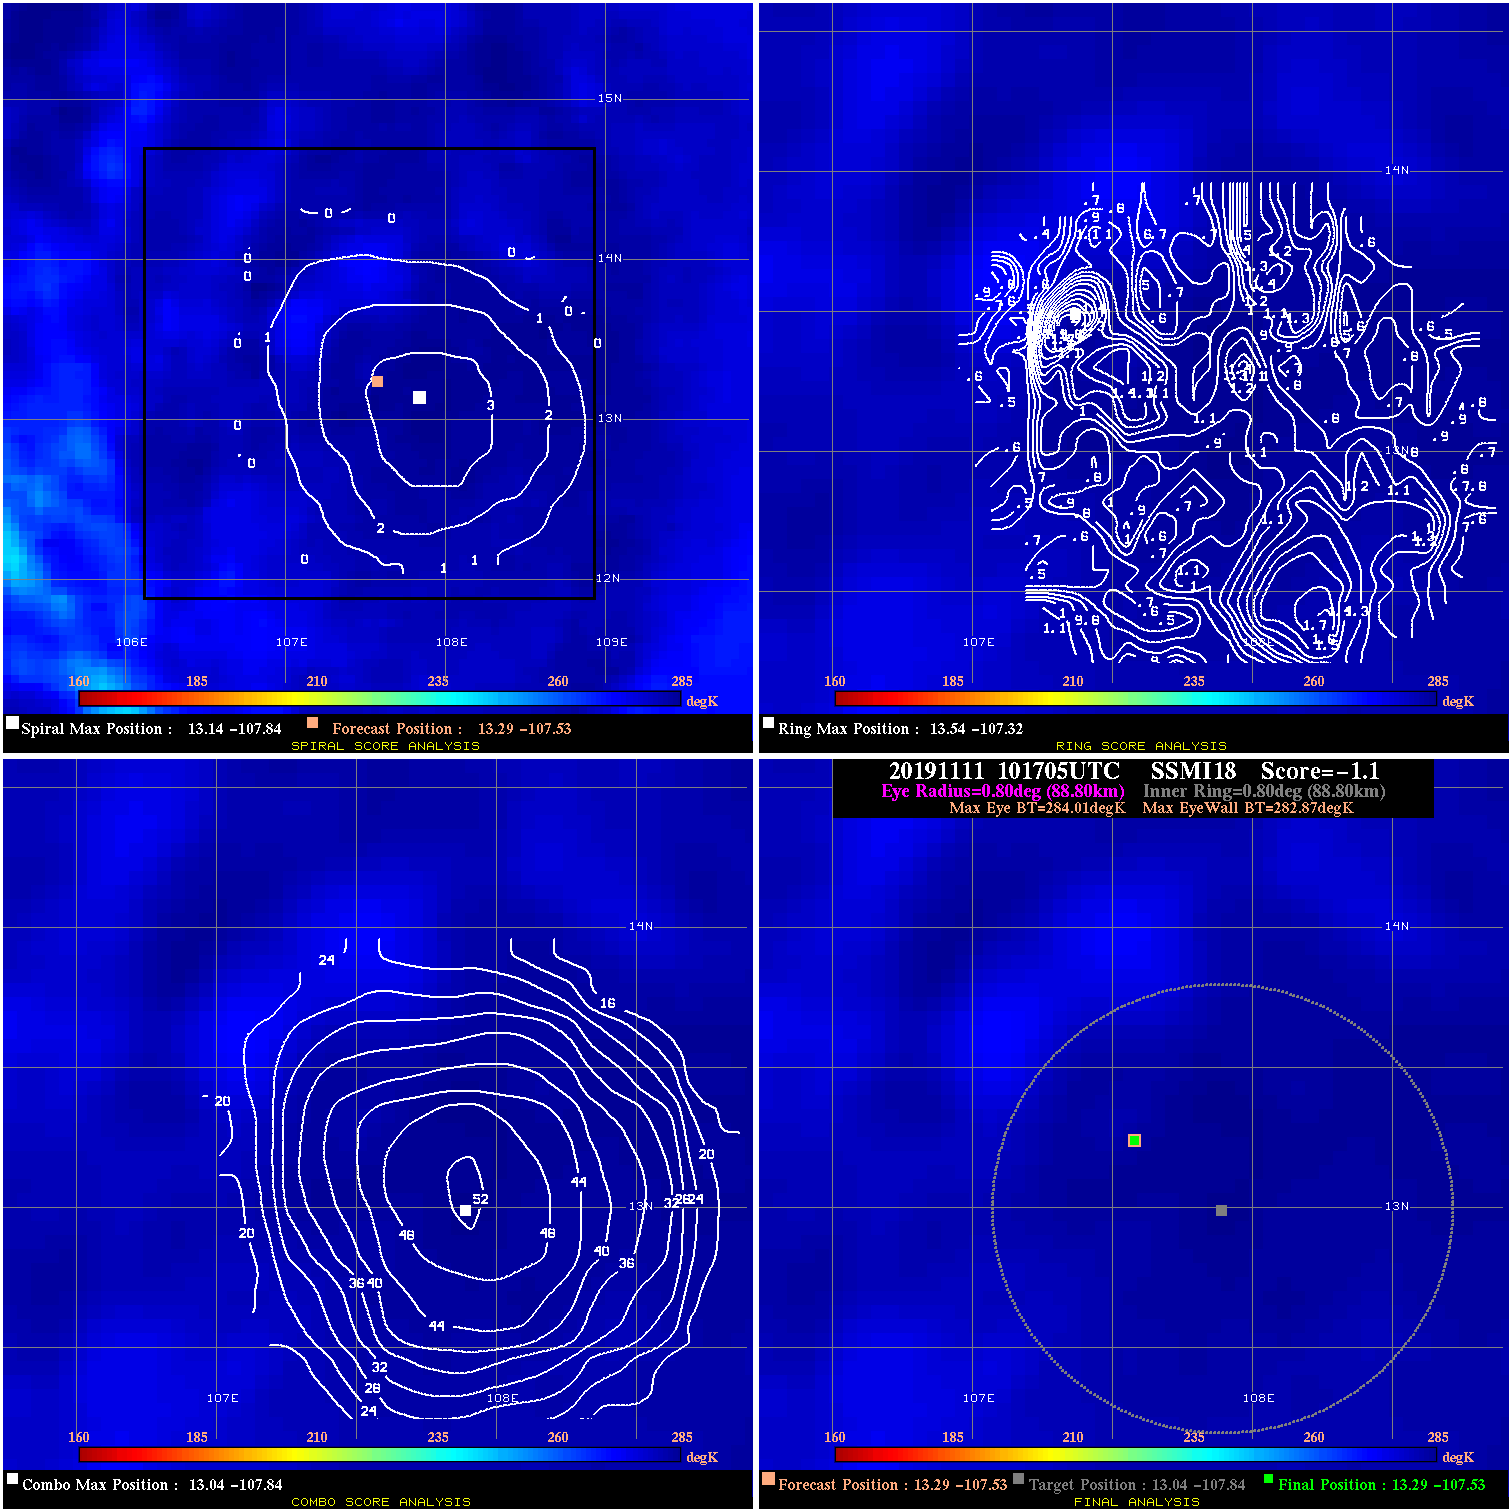
20191111 101705 -1.1 N/A N/A 177.76 1.14 45.0 SSMI18 13.3 -107.5 13.3 -107.5 13.0 -107.8 Analysis Plot
|
|
Legend: - Date/Time are determined from PMW imagery at Forecast (initial guess) Lat/Lon position. - Positive/Negative Latitude = North/South Hemisphere; Longitude = Western/Eastern Hemisphere. - "Ring Diam" value indicates the estimated surface eyewall diameter in km (the MI eyewall edge diameter minus 10 km). - "Ring Pct" is the percentage of the "ring" (eyewall inner boundary) that is 1) colder than the "hot spot" (warmest eye pixel) in the eye by 20K, or 2) the percentage that is a) colder than 232K and b) colder than the "hot spot" by 10K, whichever is greater. - Values are red if Ring % <= 65, yellow/brown if Ring % <= 85 and green if Ring % > 85. - "Tb diff" is the difference between the "hot spot" (warmest eye pixel) and the warmest pixel on the eyewall. - Intensity score are listed as negative, and not used, when the JTWC or NHC estimated Vmax is <55 kts in order to rule out weak but highly symmetric TCs. - Error messages in intensity scores: -920 is used when the hottest pixel in the eye is <200K, to prevent false positives; -930 means <85% of eyewall has observations/data. |