Tropical Storm 10W
|
Passive Microwave (PMW) Intensity Information Hurricane Intensity Estimation (HIE) Algorithm Version 9.0 |
Overpass Inten Ring Ring Wind Forecast Final Target
Date Time Score Meaning Pct Diam BTdiff Est Sat Lat Lon Lat Lon Lat Lon
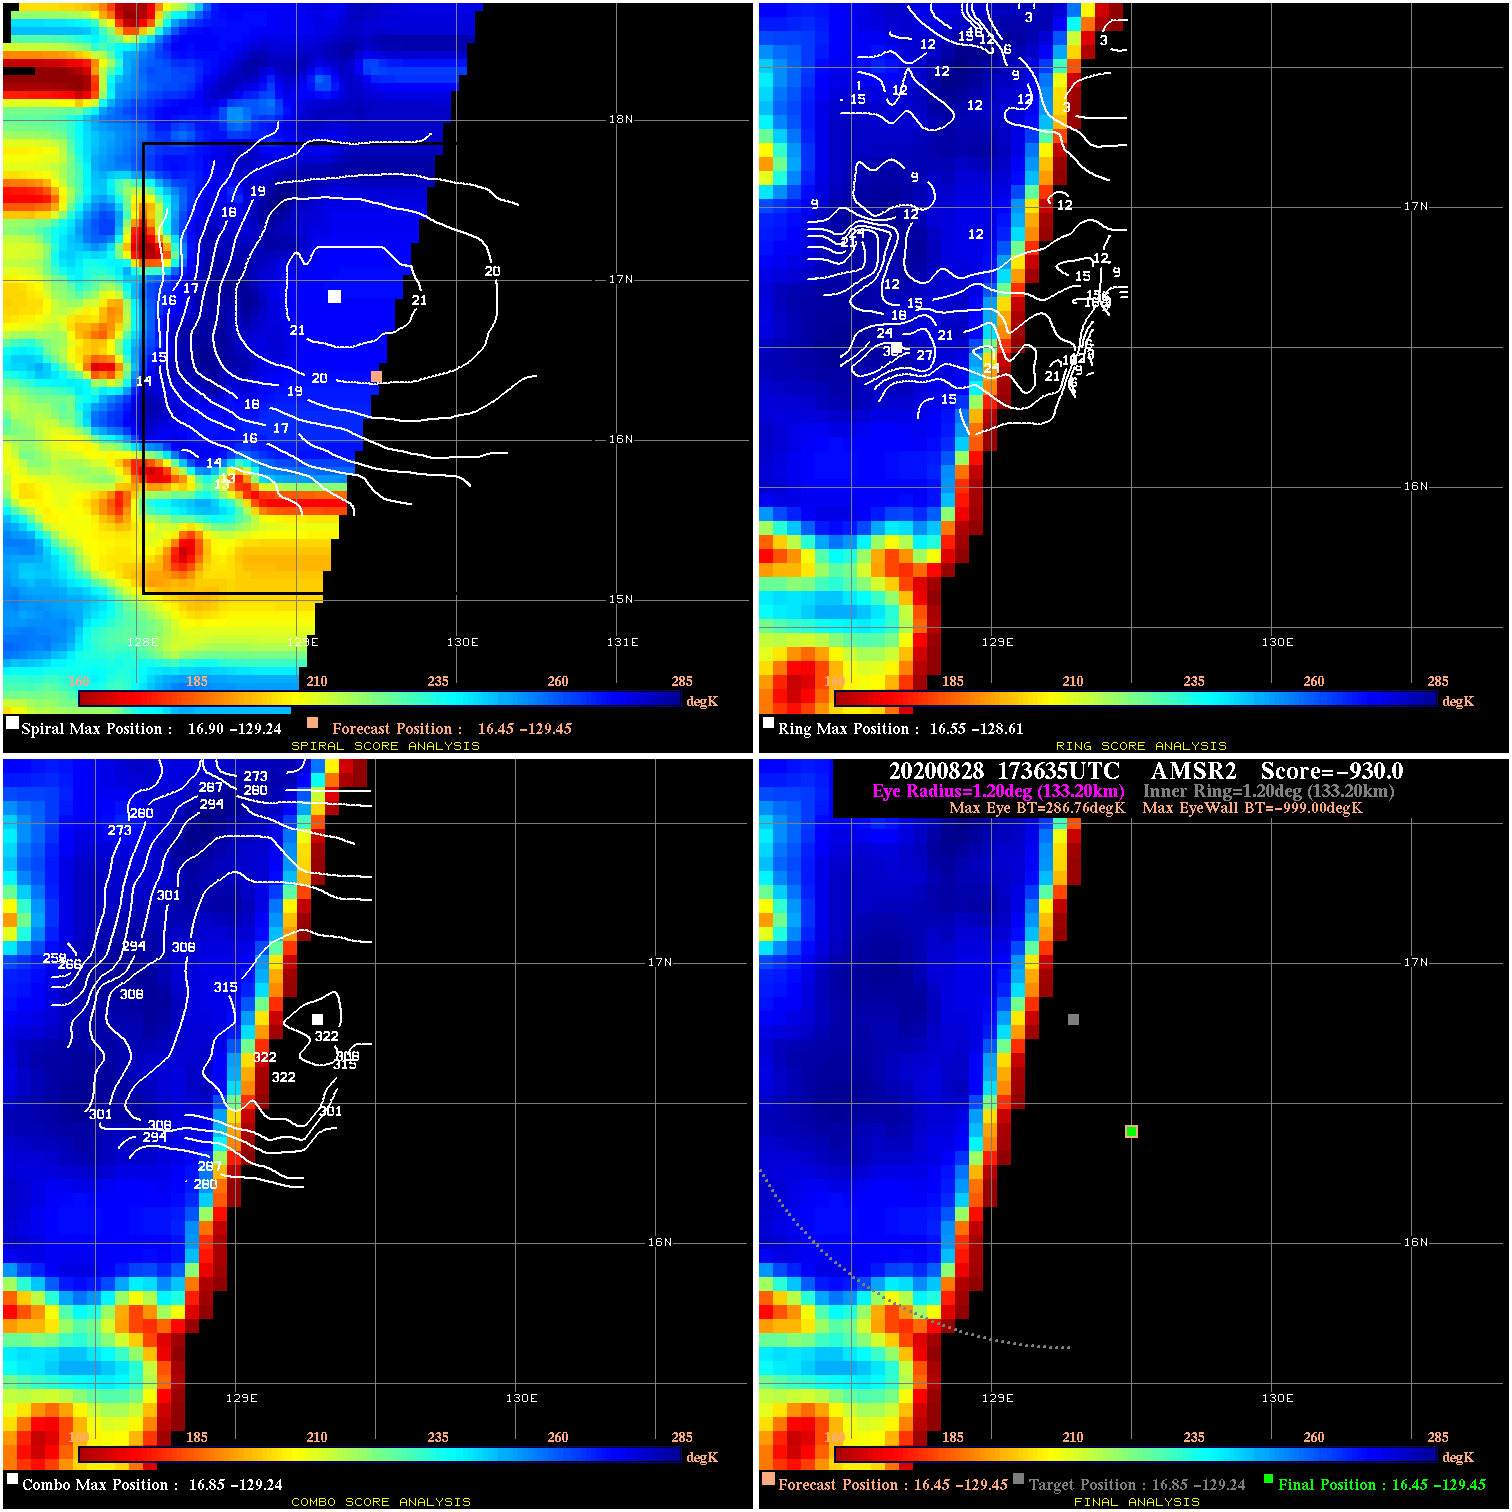
20200828 173635 -930.0 N/A N/A N/A 0.00 35.0 AMSR2 16.5 -129.4 16.5 -129.4 16.9 -129.2 Analysis Plot
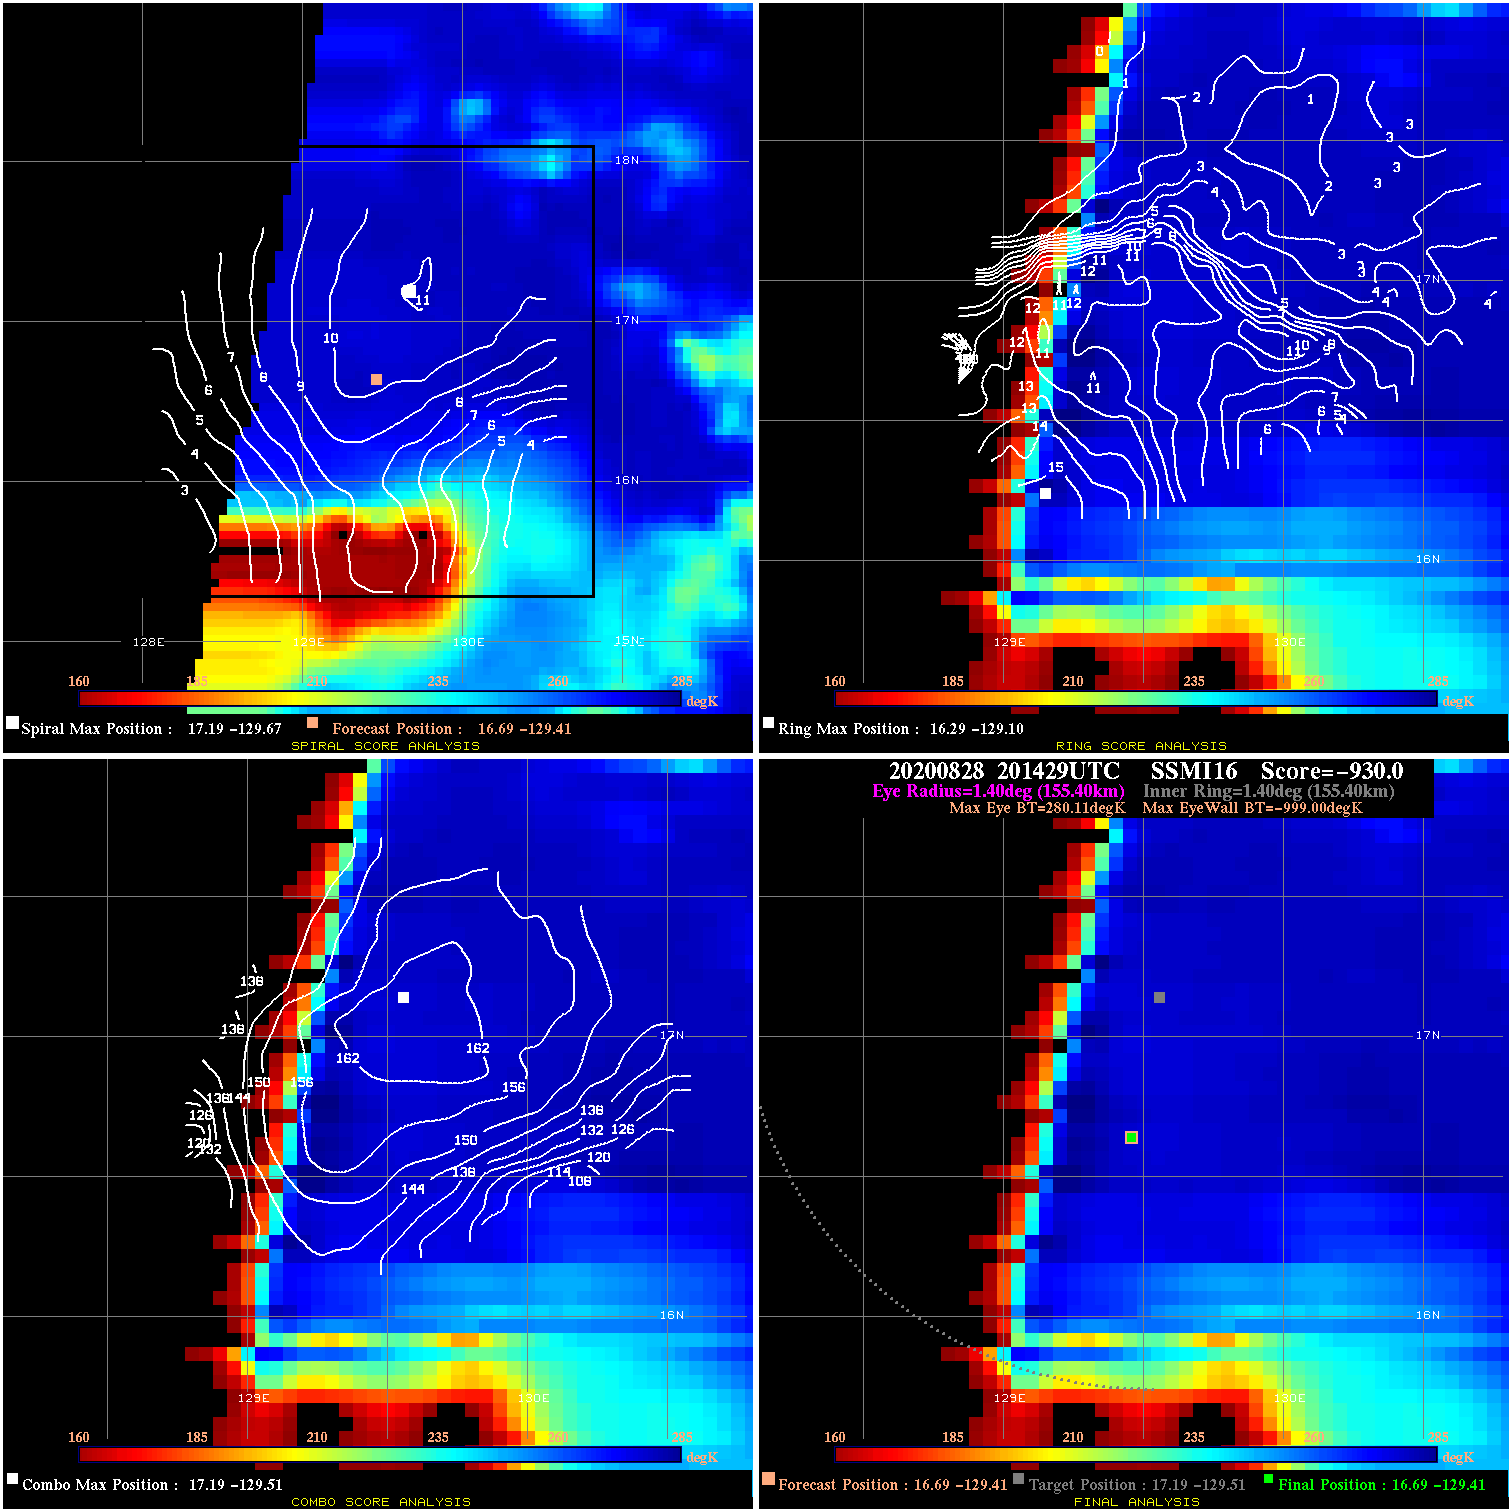
20200828 201429 -930.0 N/A N/A N/A 0.00 45.0 SSMI16 16.7 -129.4 16.7 -129.4 17.2 -129.5 Analysis Plot
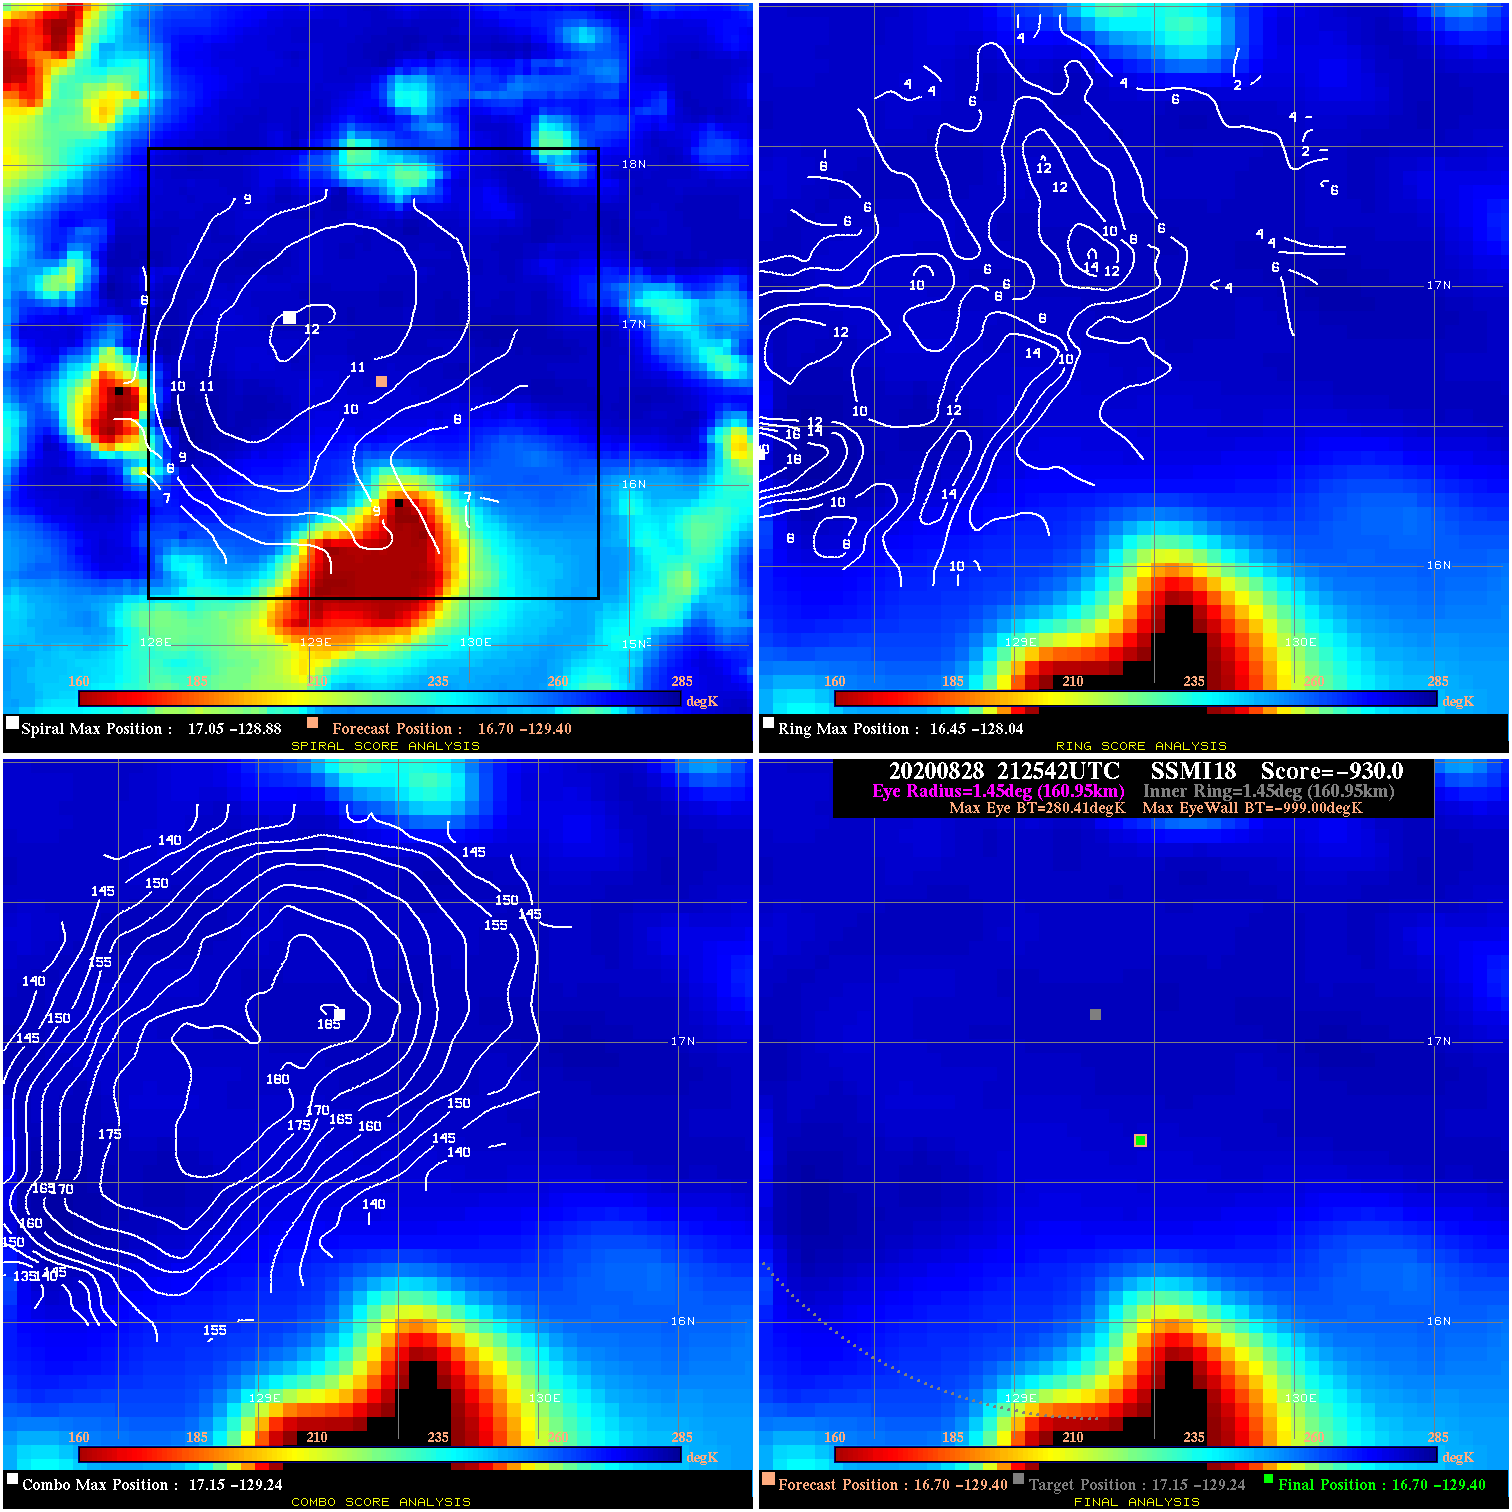
20200828 212542 -930.0 N/A N/A N/A 0.00 45.0 SSMI18 16.7 -129.4 16.7 -129.4 17.1 -129.2 Analysis Plot
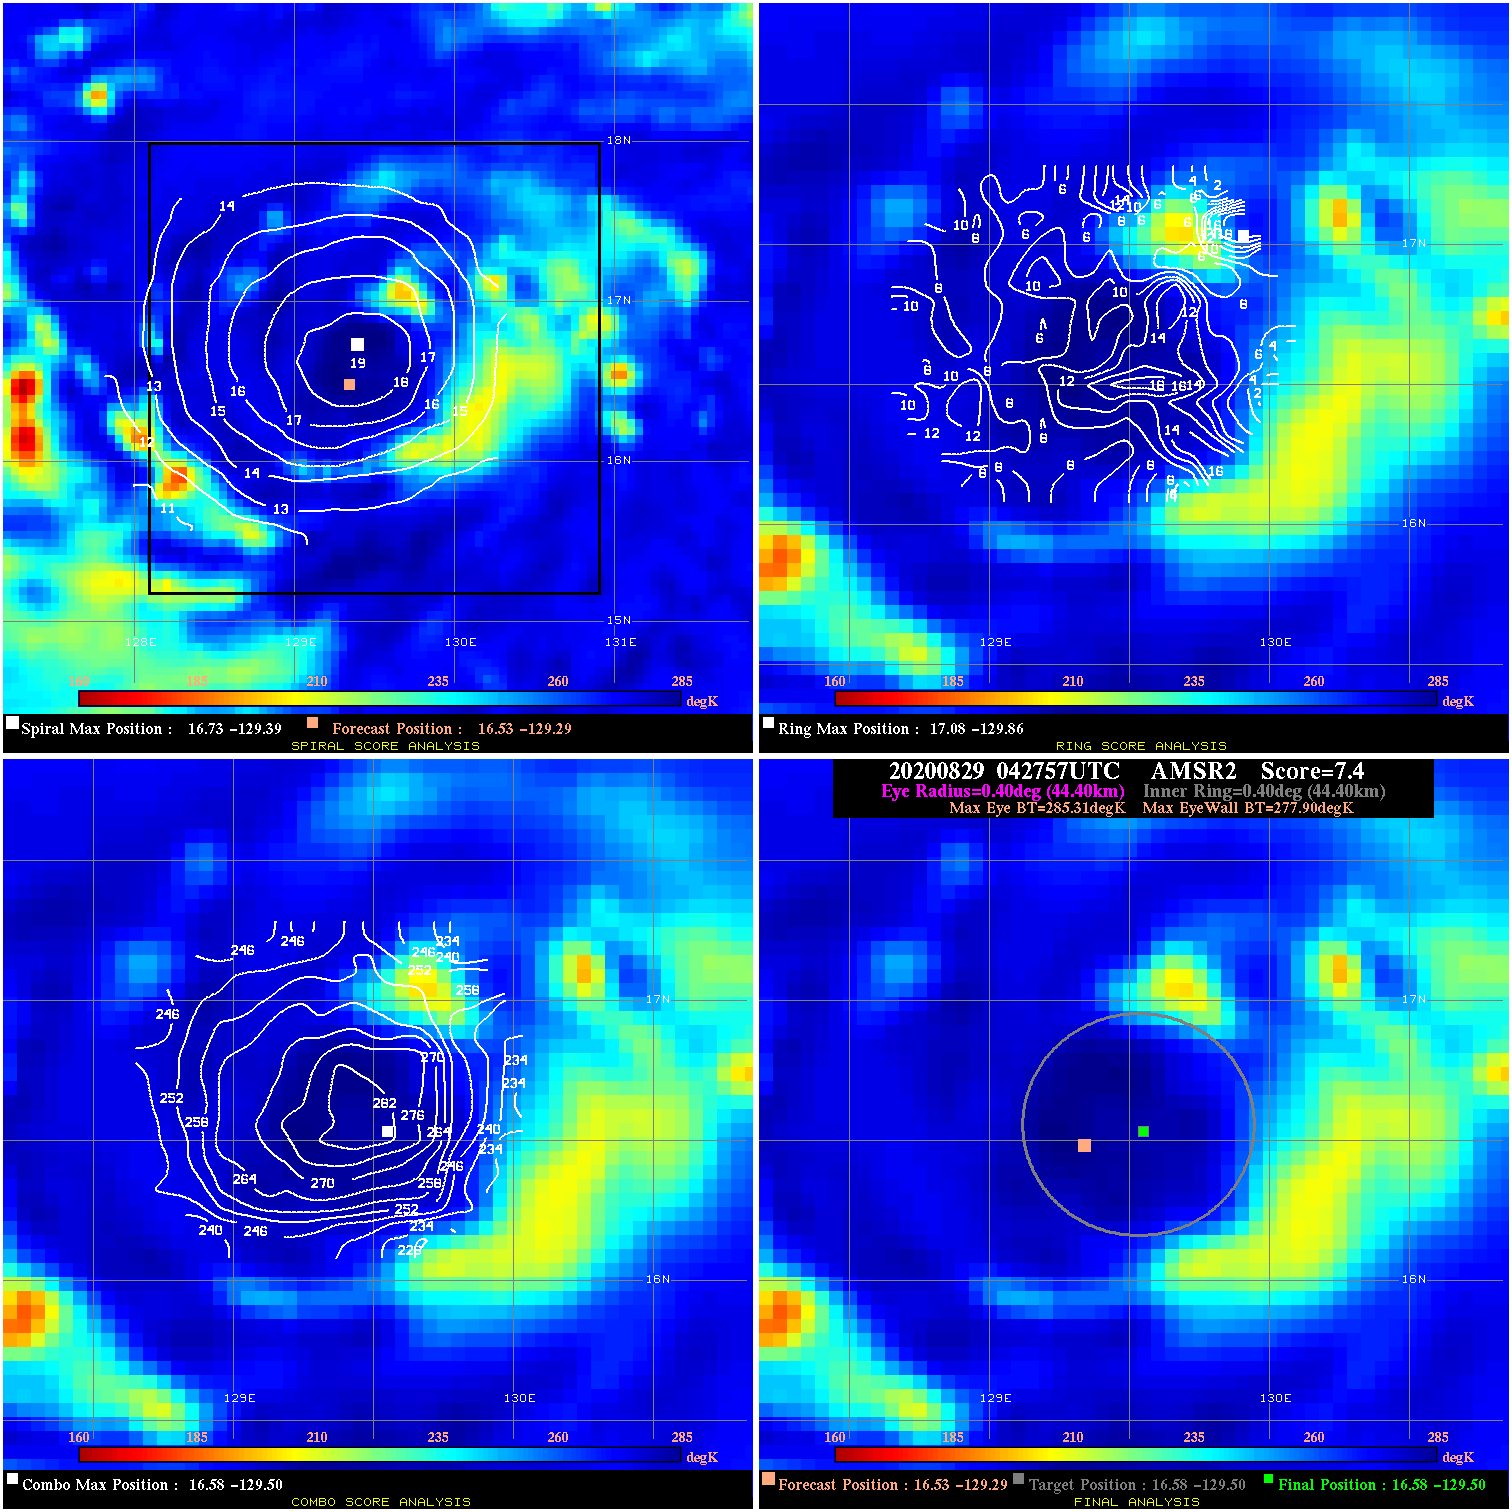
20200829 042757 7.4 N/A 24.7% 88.88 7.41 55.0 AMSR2 16.5 -129.3 16.6 -129.5 16.6 -129.5 Analysis Plot
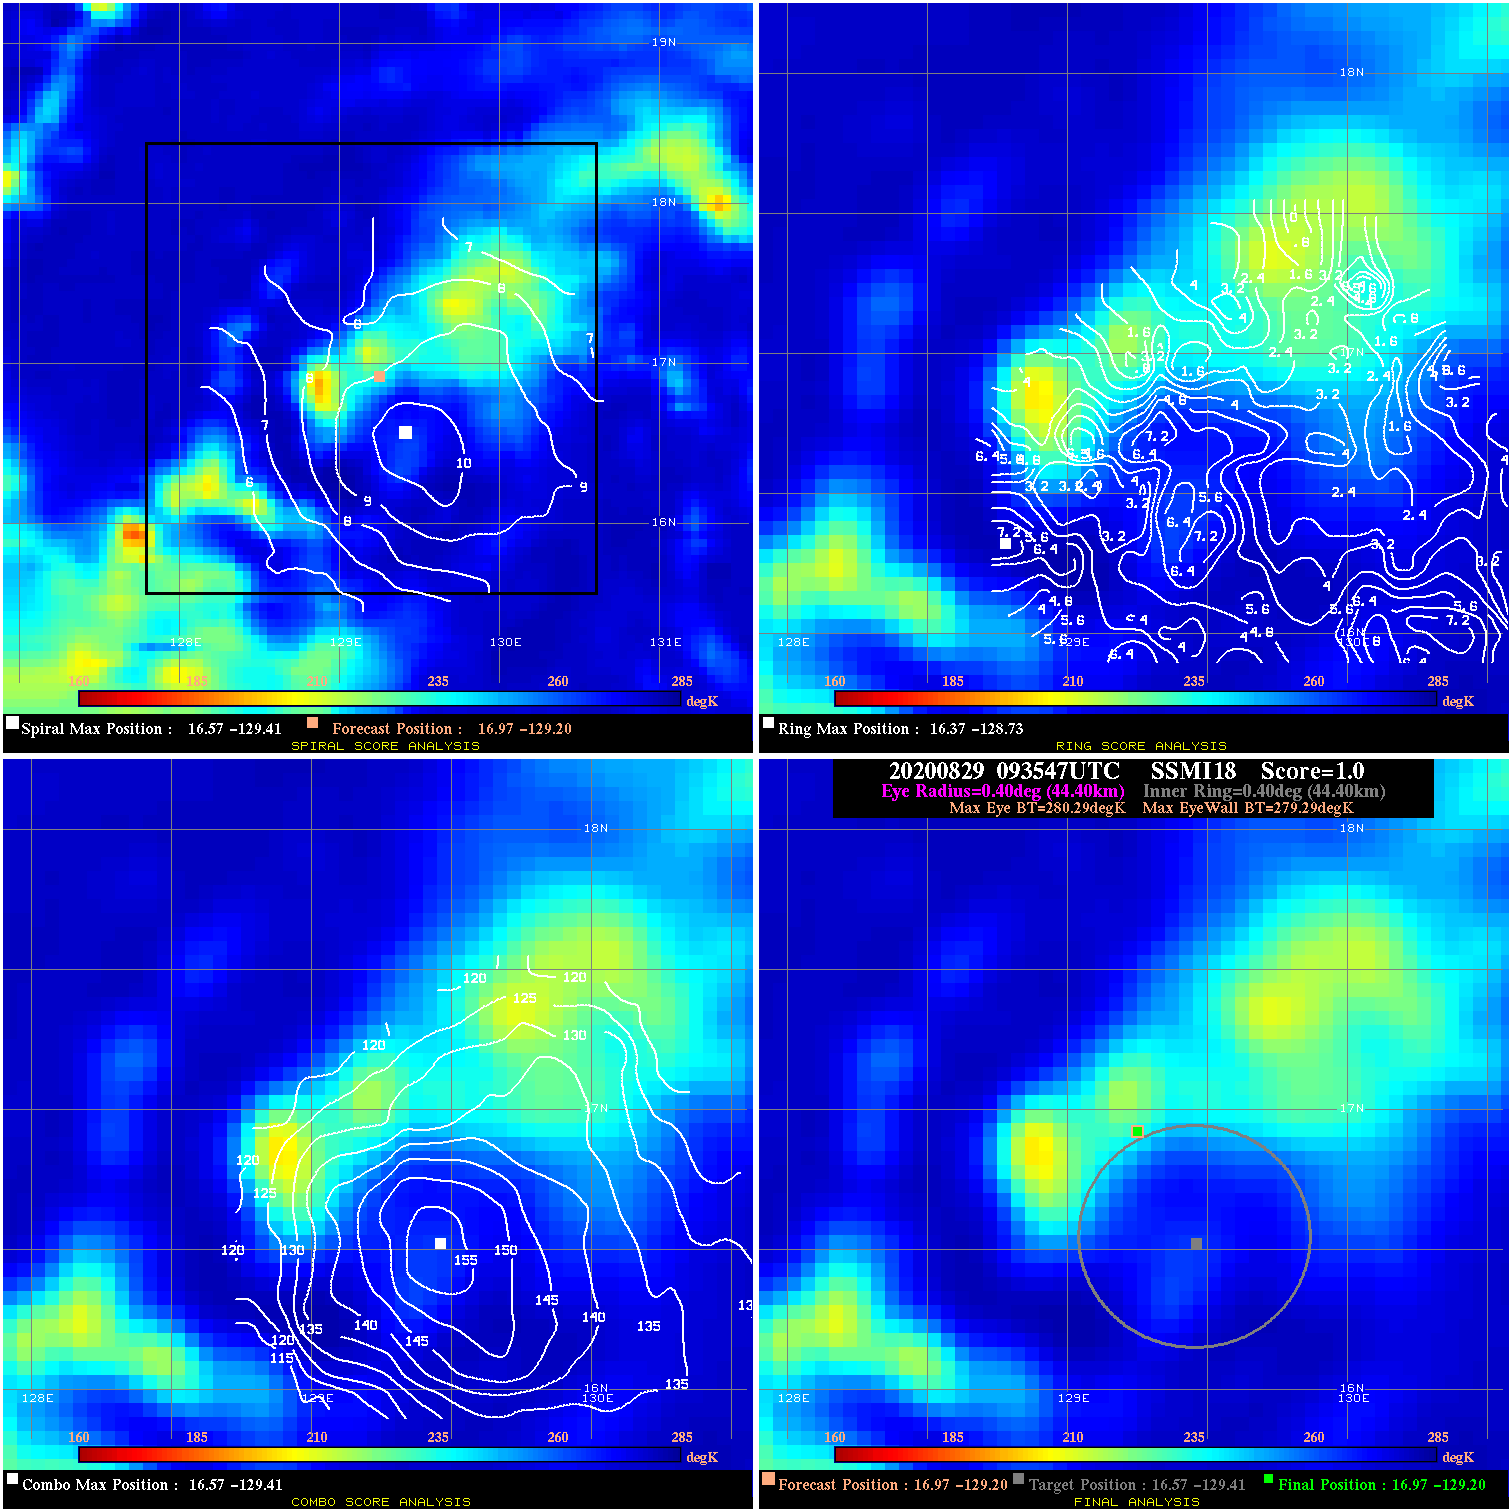
20200829 093547 1.0 N/A 16.4% 88.88 1.00 55.0 SSMI18 17.0 -129.2 17.0 -129.2 16.6 -129.4 Analysis Plot
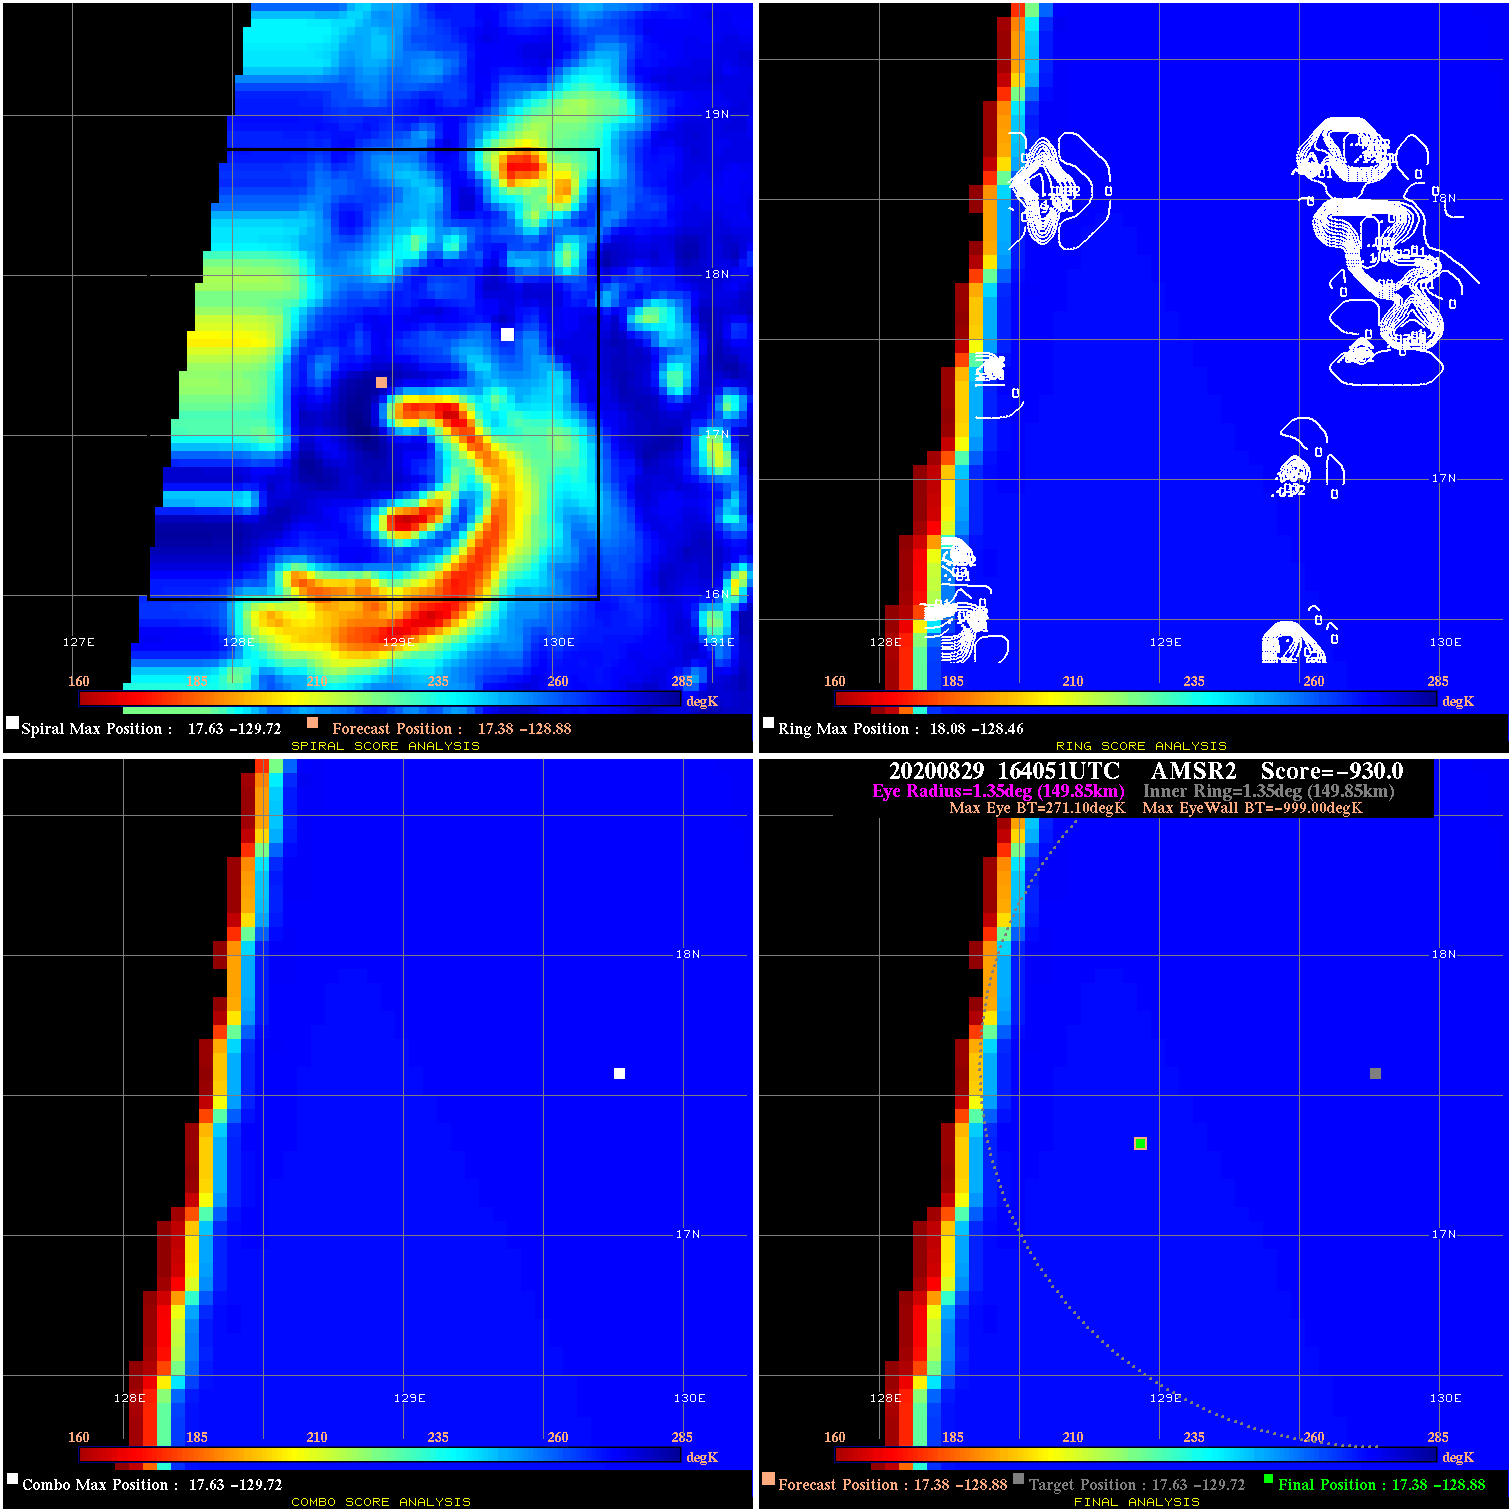
20200829 164051 -930.0 N/A N/A N/A 0.00 55.0 AMSR2 17.4 -128.9 17.4 -128.9 17.6 -129.7 Analysis Plot
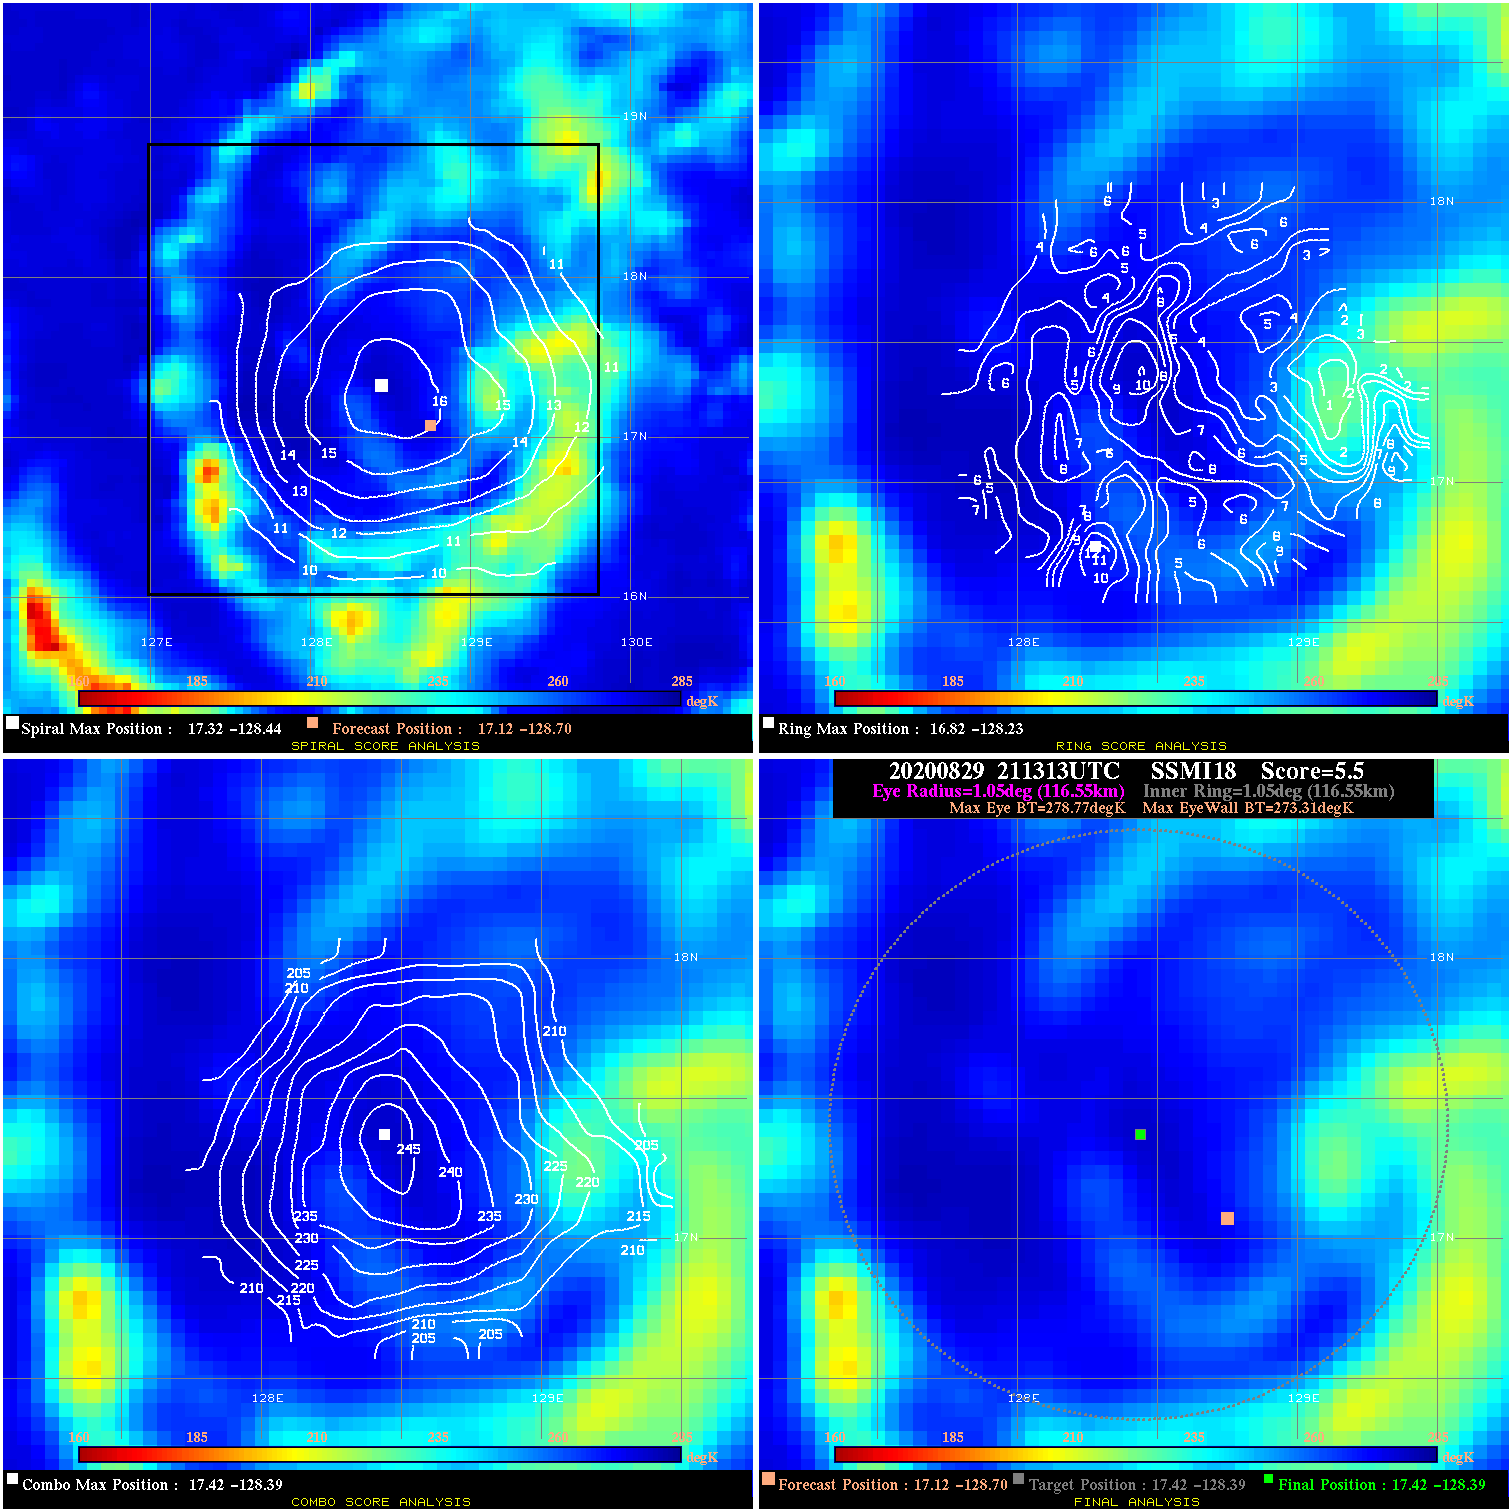
20200829 211313 5.5 N/A 27.4% 233.31 5.46 65.0 SSMI18 17.1 -128.7 17.4 -128.4 17.4 -128.4 Analysis Plot
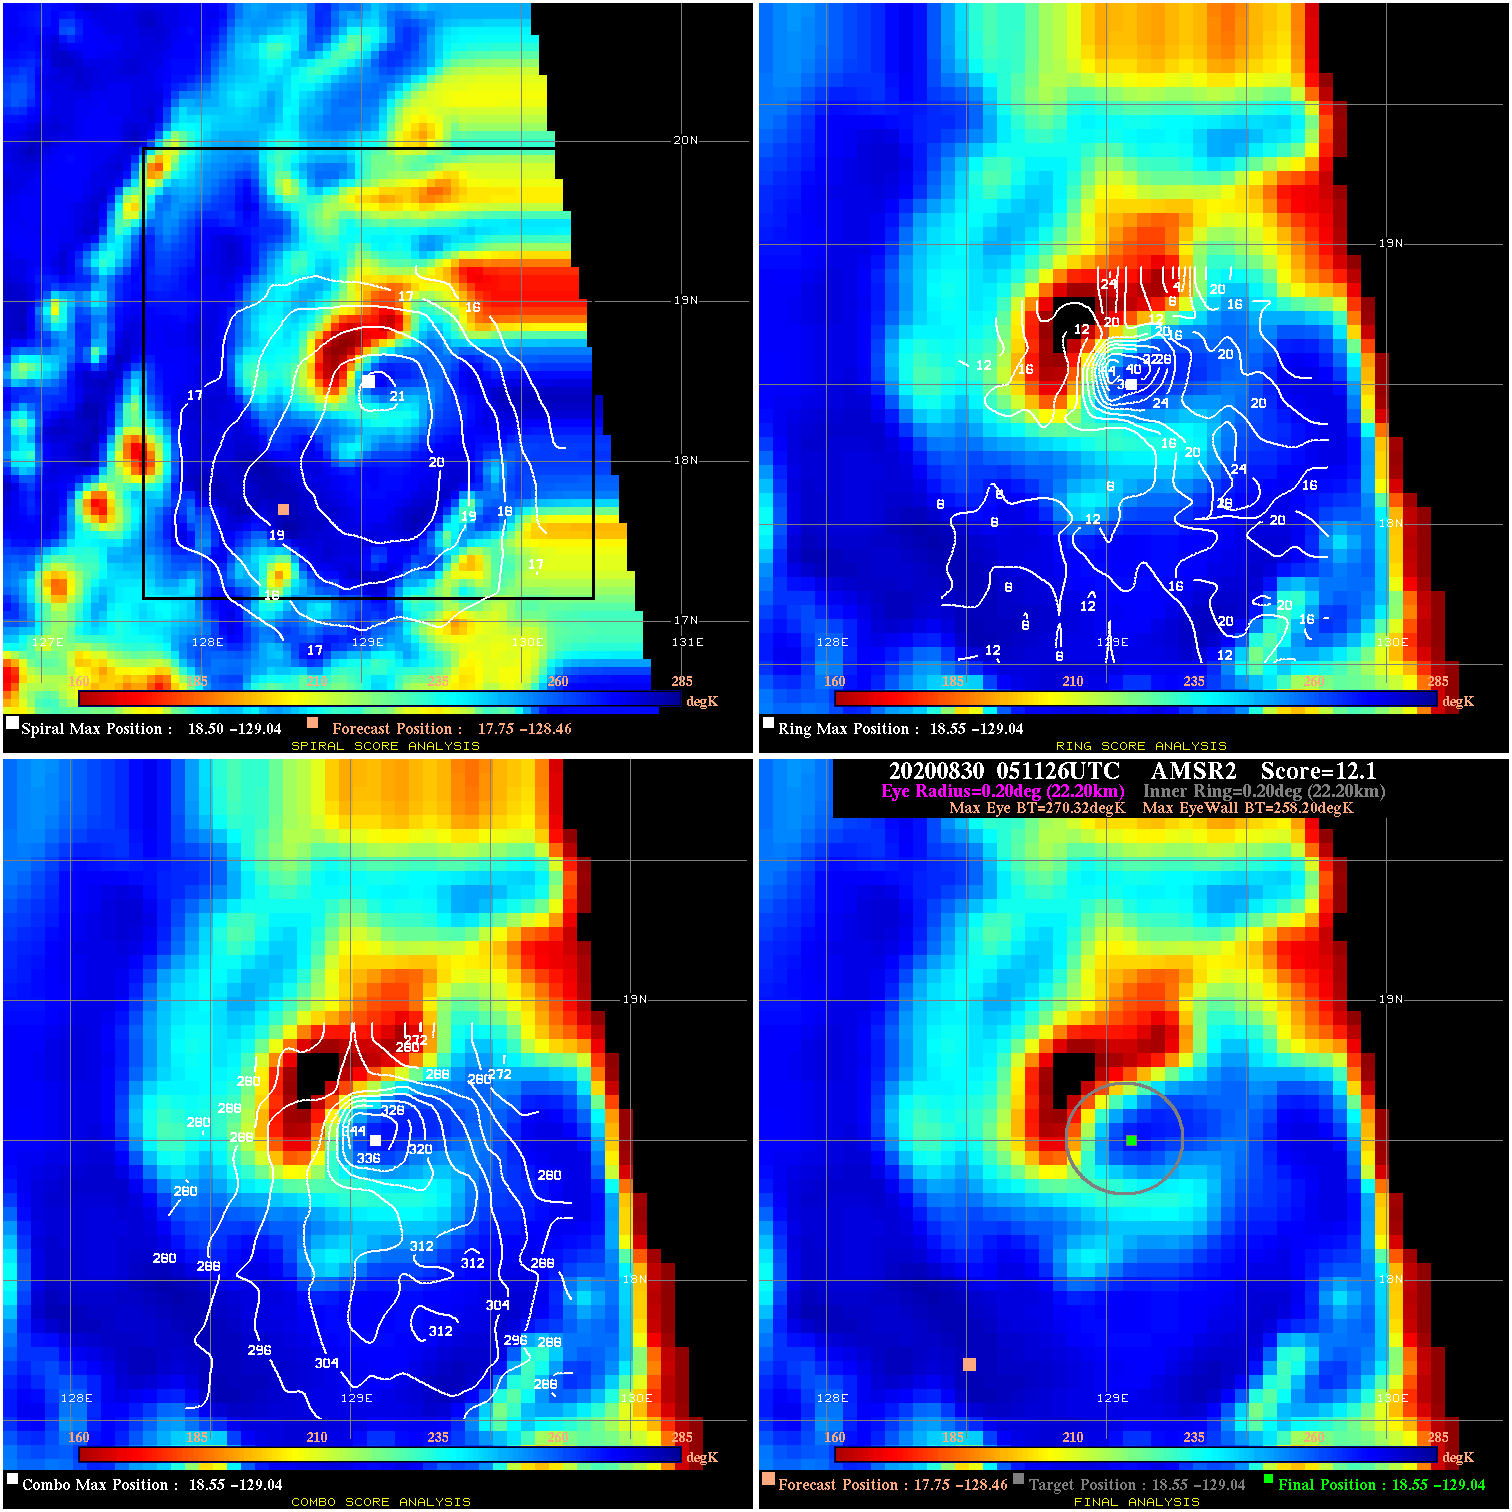
20200830 051126 12.1 N/A 58.9% 44.44 12.12 70.0 AMSR2 17.8 -128.5 18.5 -129.0 18.5 -129.0 Analysis Plot
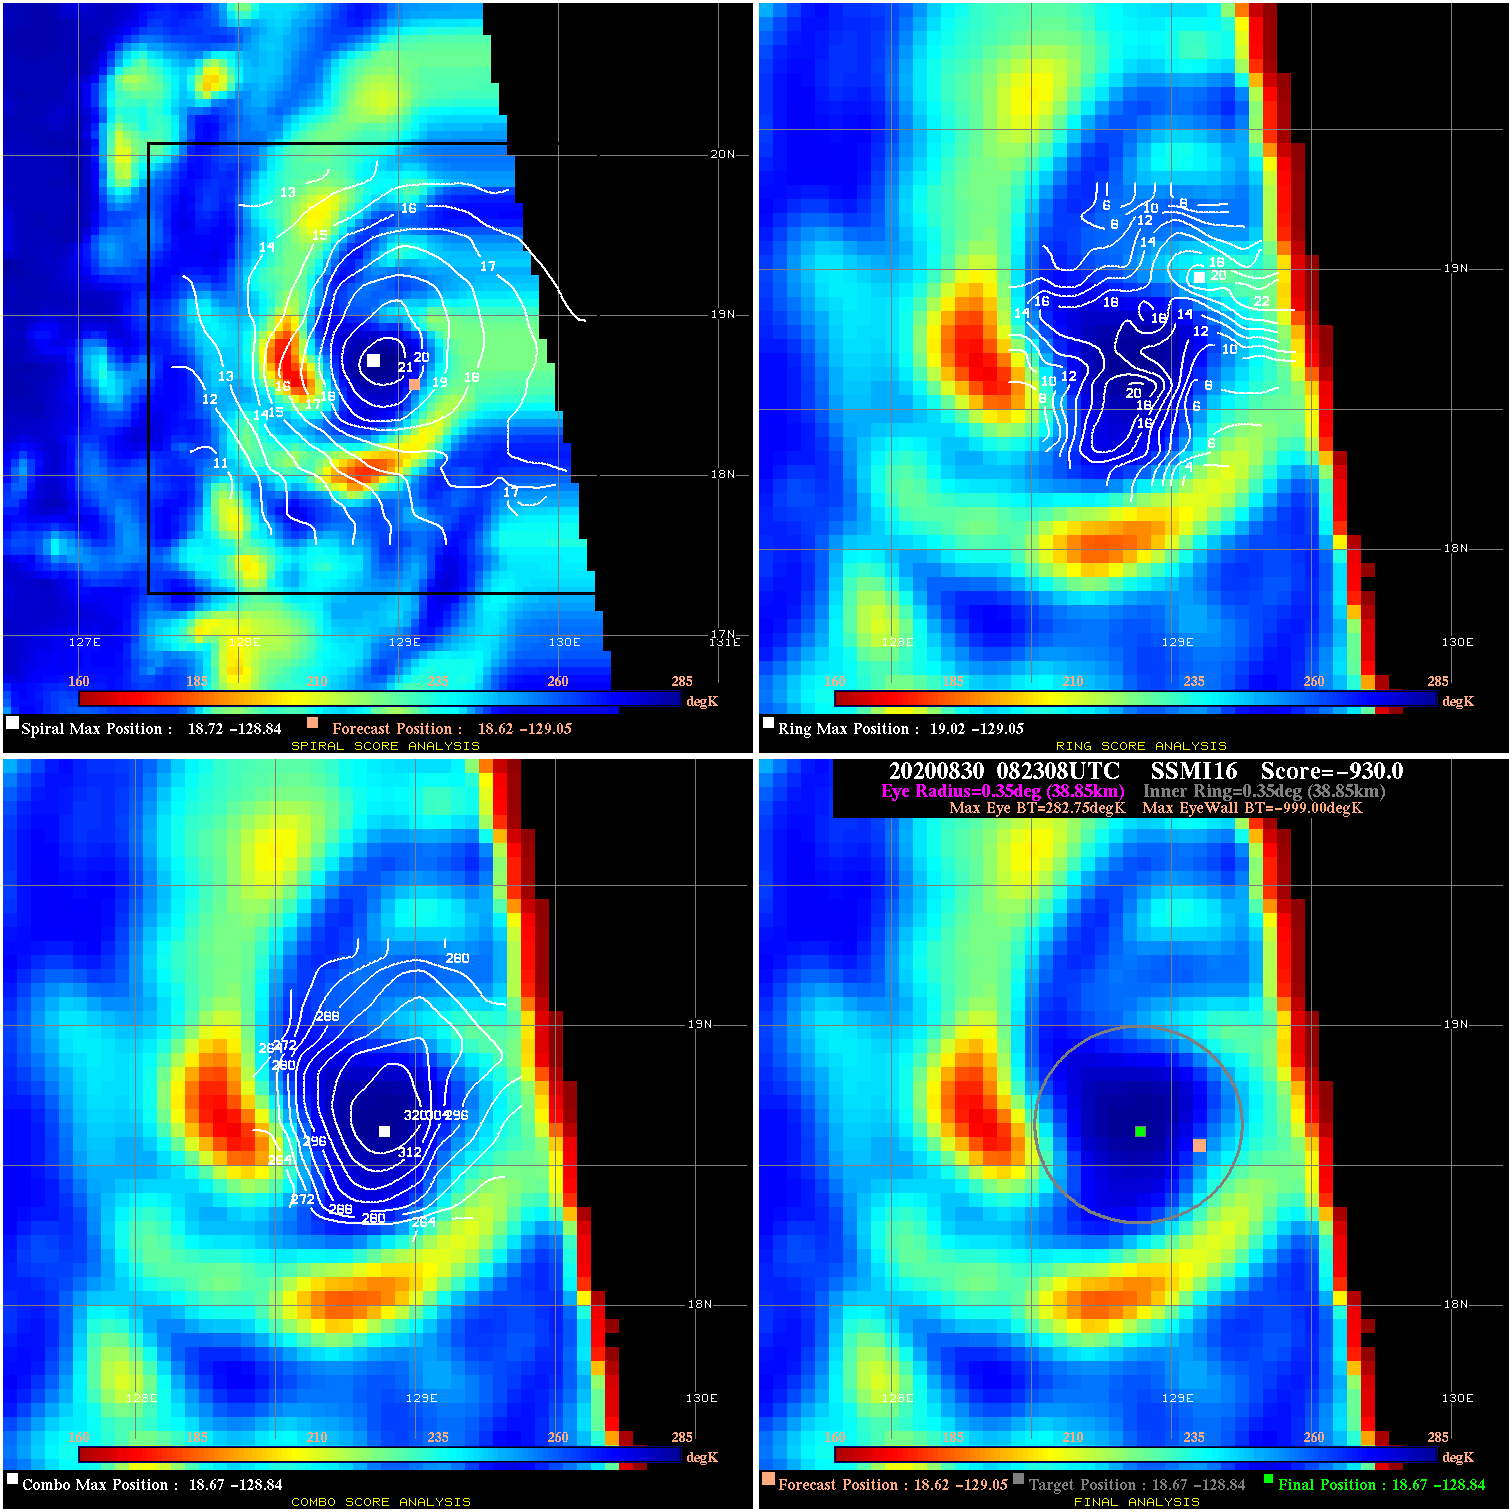
20200830 082308 -930.0 N/A N/A N/A 0.00 75.0 SSMI16 18.6 -129.1 18.7 -128.8 18.7 -128.8 Analysis Plot
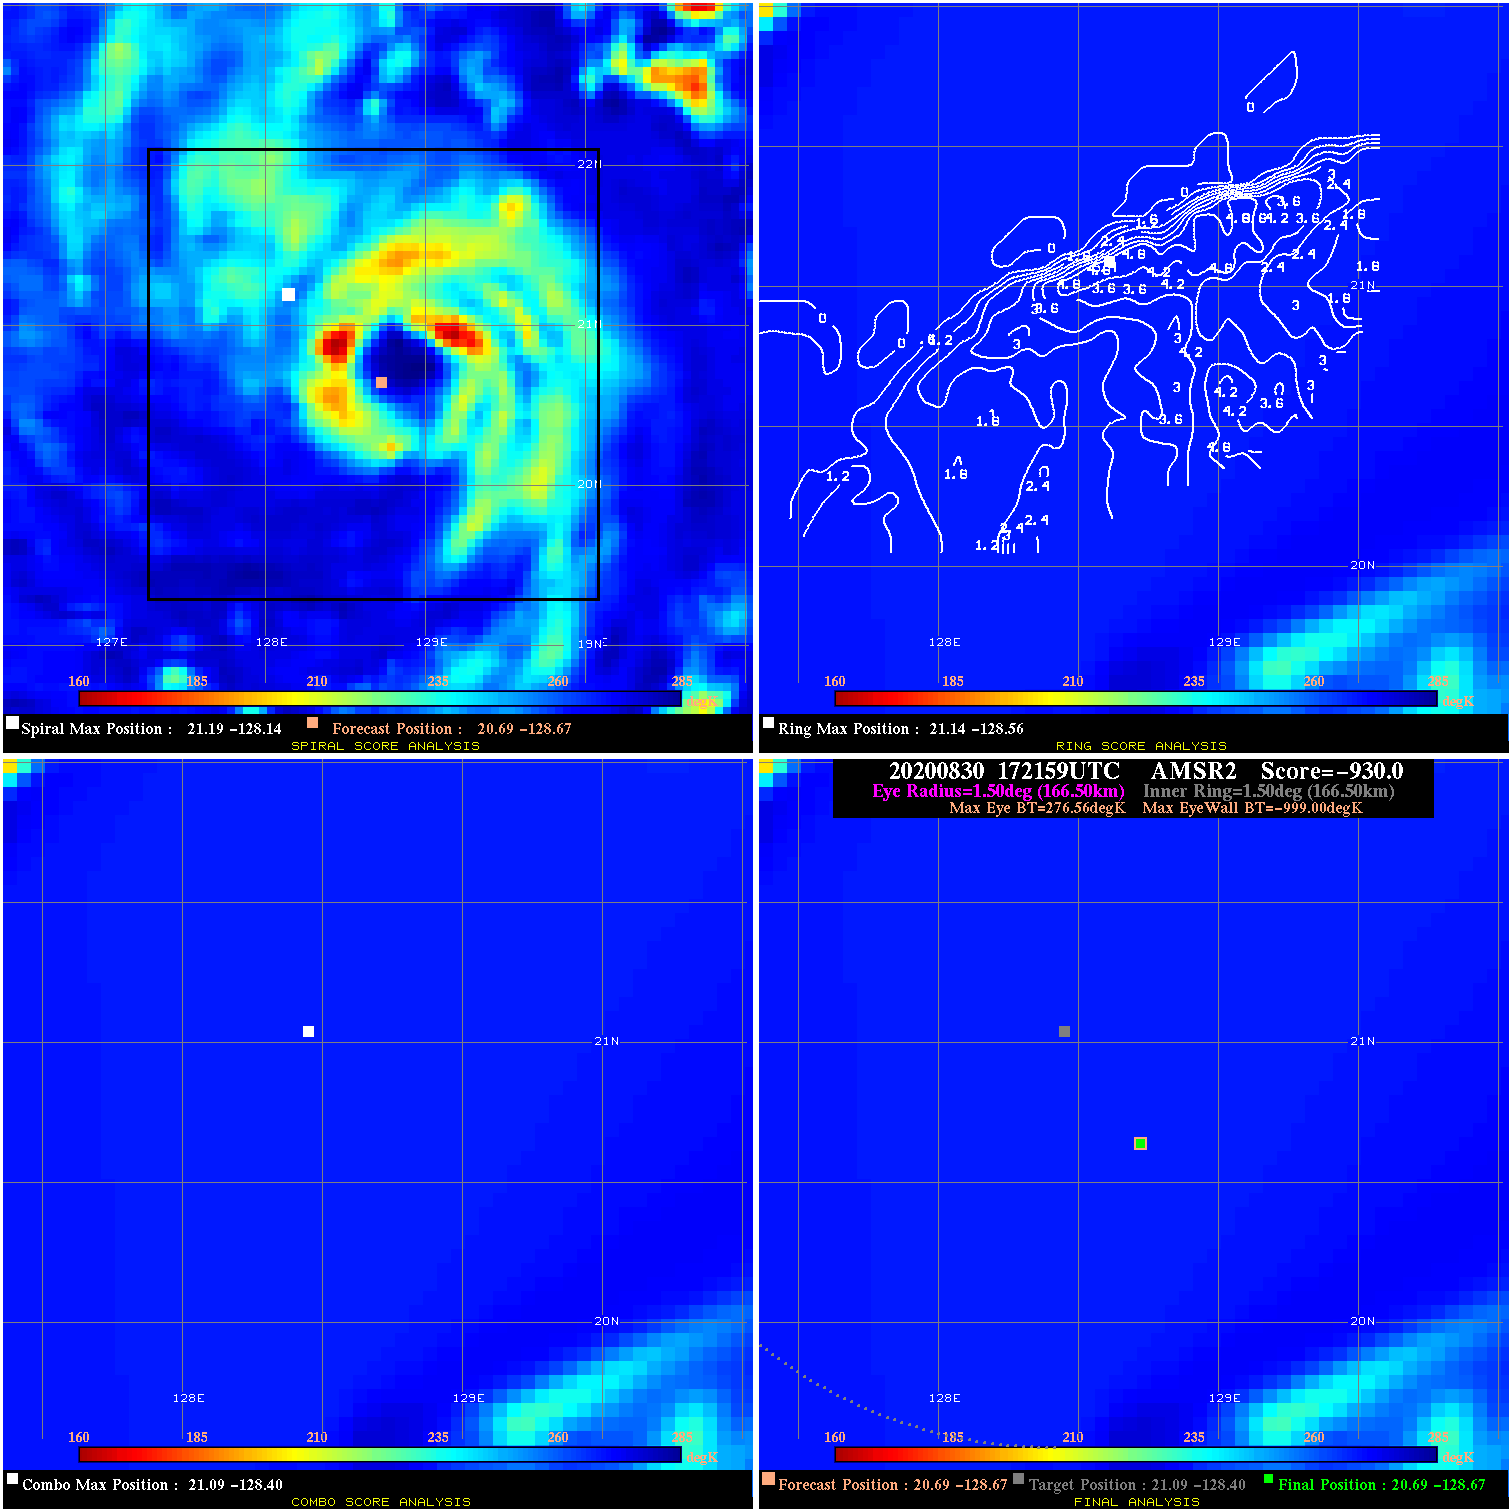
20200830 172159 -930.0 N/A N/A N/A 0.00 85.0 AMSR2 20.7 -128.7 20.7 -128.7 21.1 -128.4 Analysis Plot
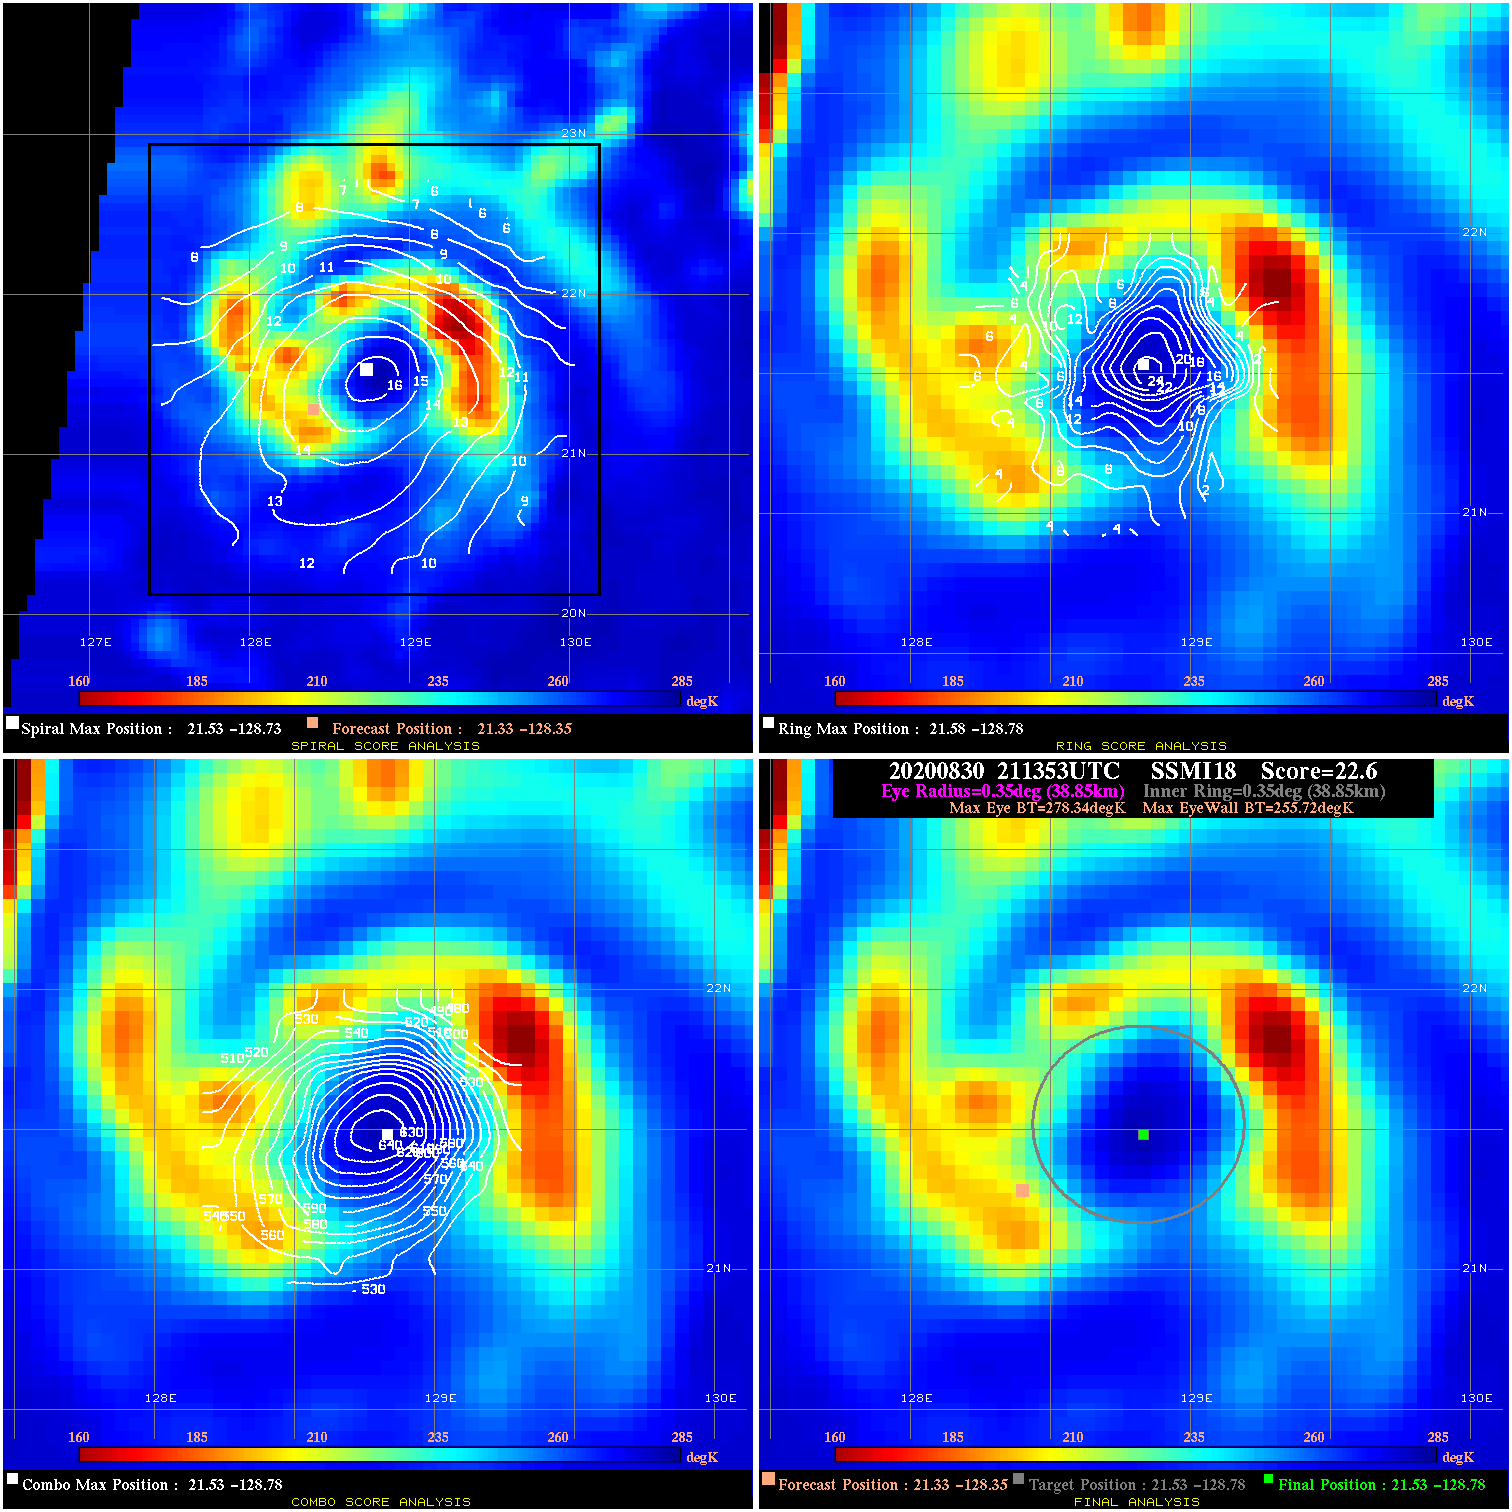
20200830 211353 22.6 >65 kts 38.4% 77.77 22.62 90.0 SSMI18 21.3 -128.4 21.5 -128.8 21.5 -128.8 Analysis Plot
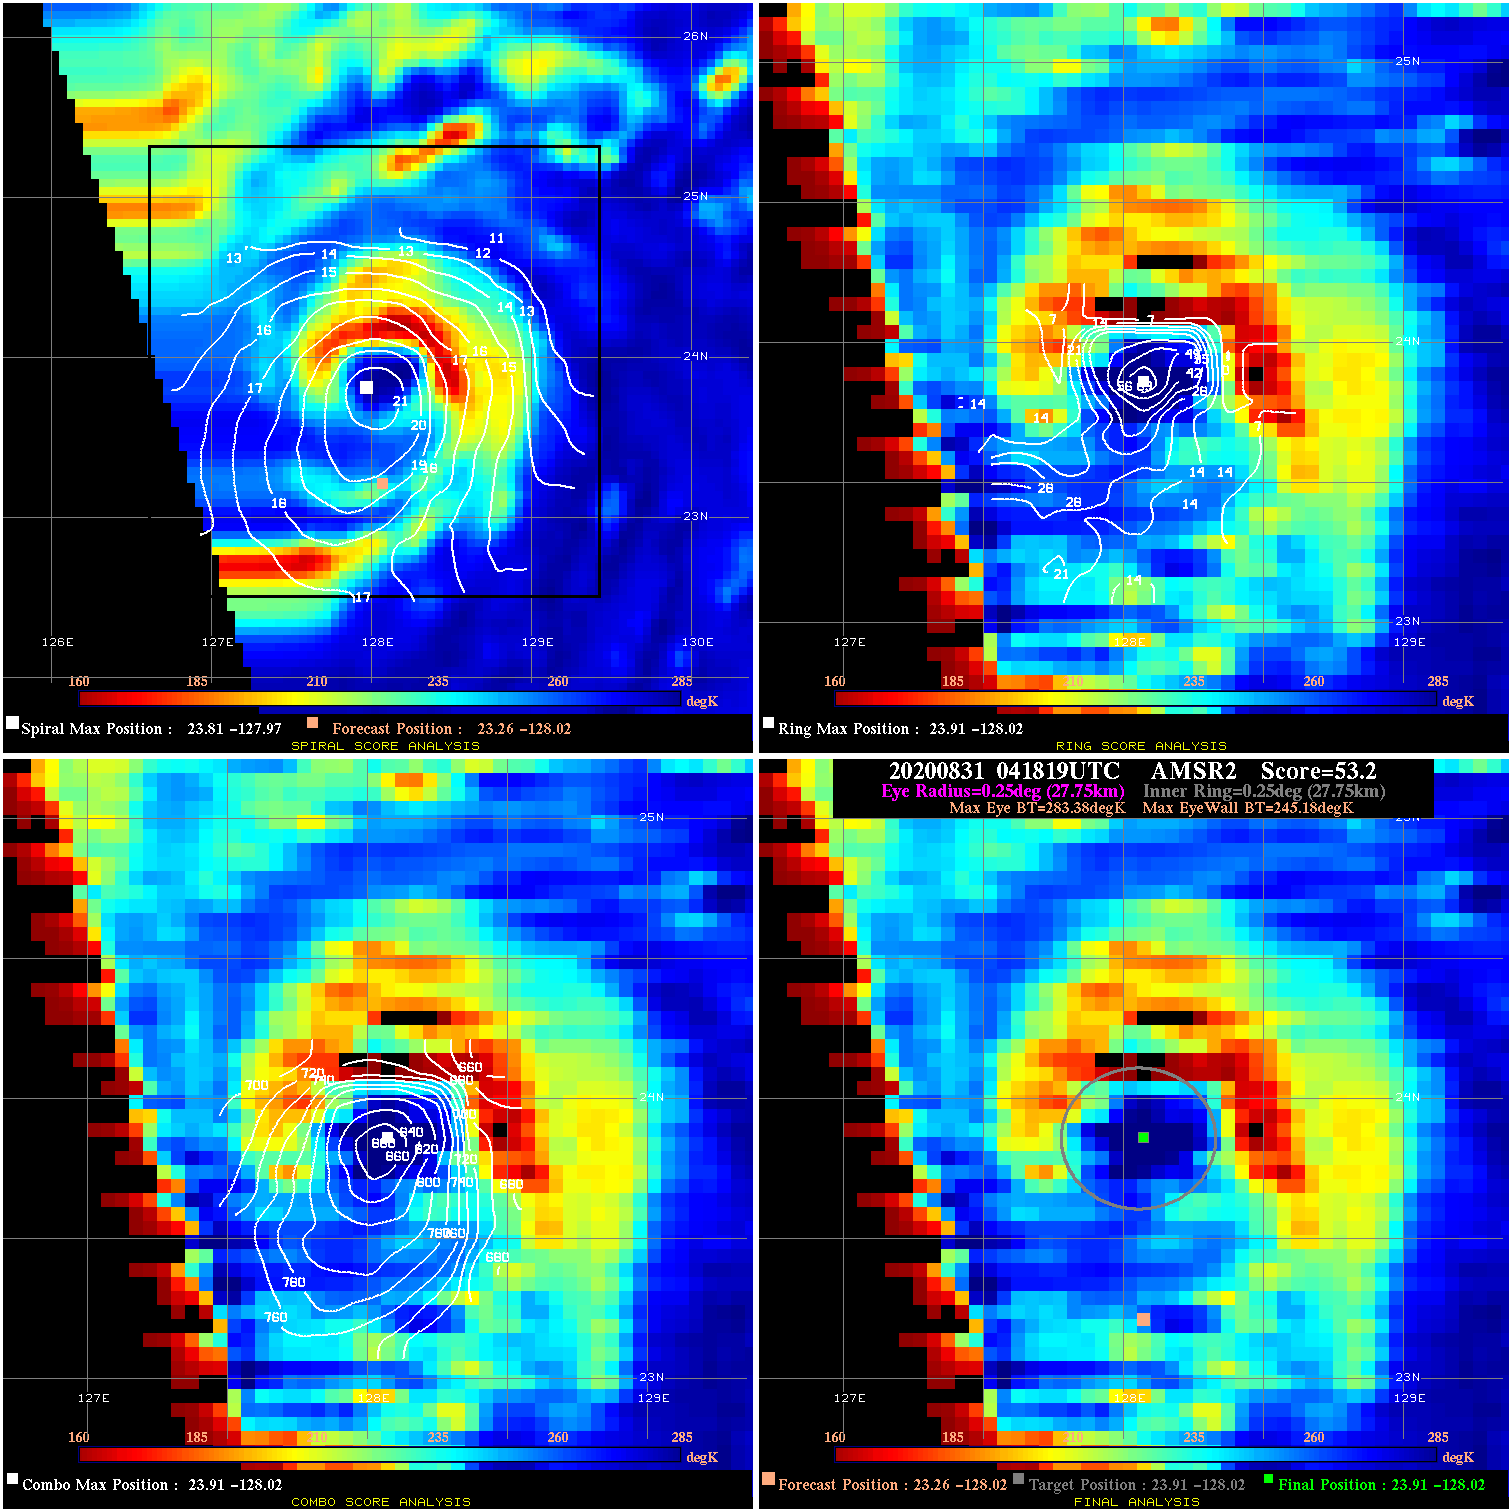
20200831 041819 53.2 >65 kts 100.0% 55.55 38.20 95.0 AMSR2 23.3 -128.0 23.9 -128.0 23.9 -128.0 Analysis Plot
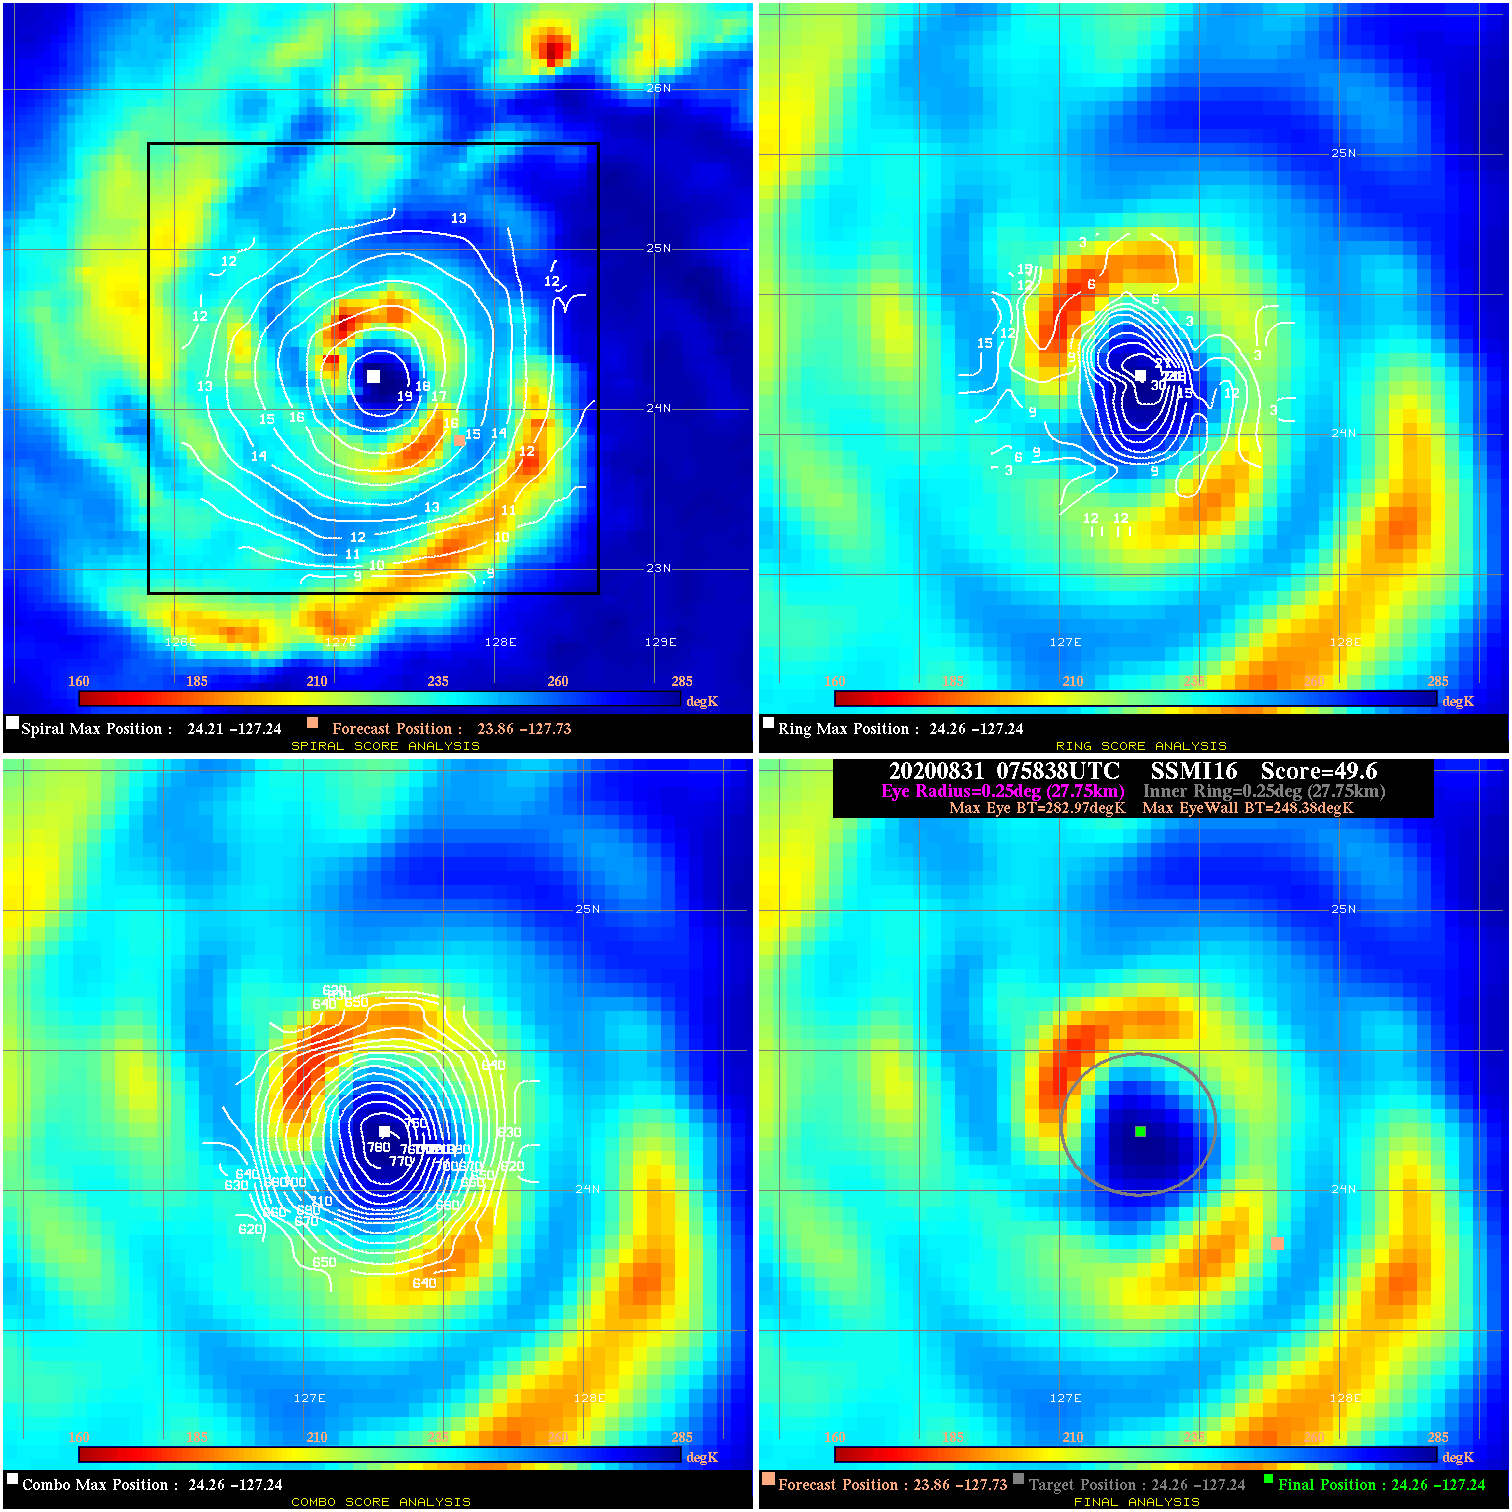
20200831 075838 49.6 >65 kts 100.0% 55.55 34.59 95.0 SSMI16 23.9 -127.7 24.3 -127.2 24.3 -127.2 Analysis Plot
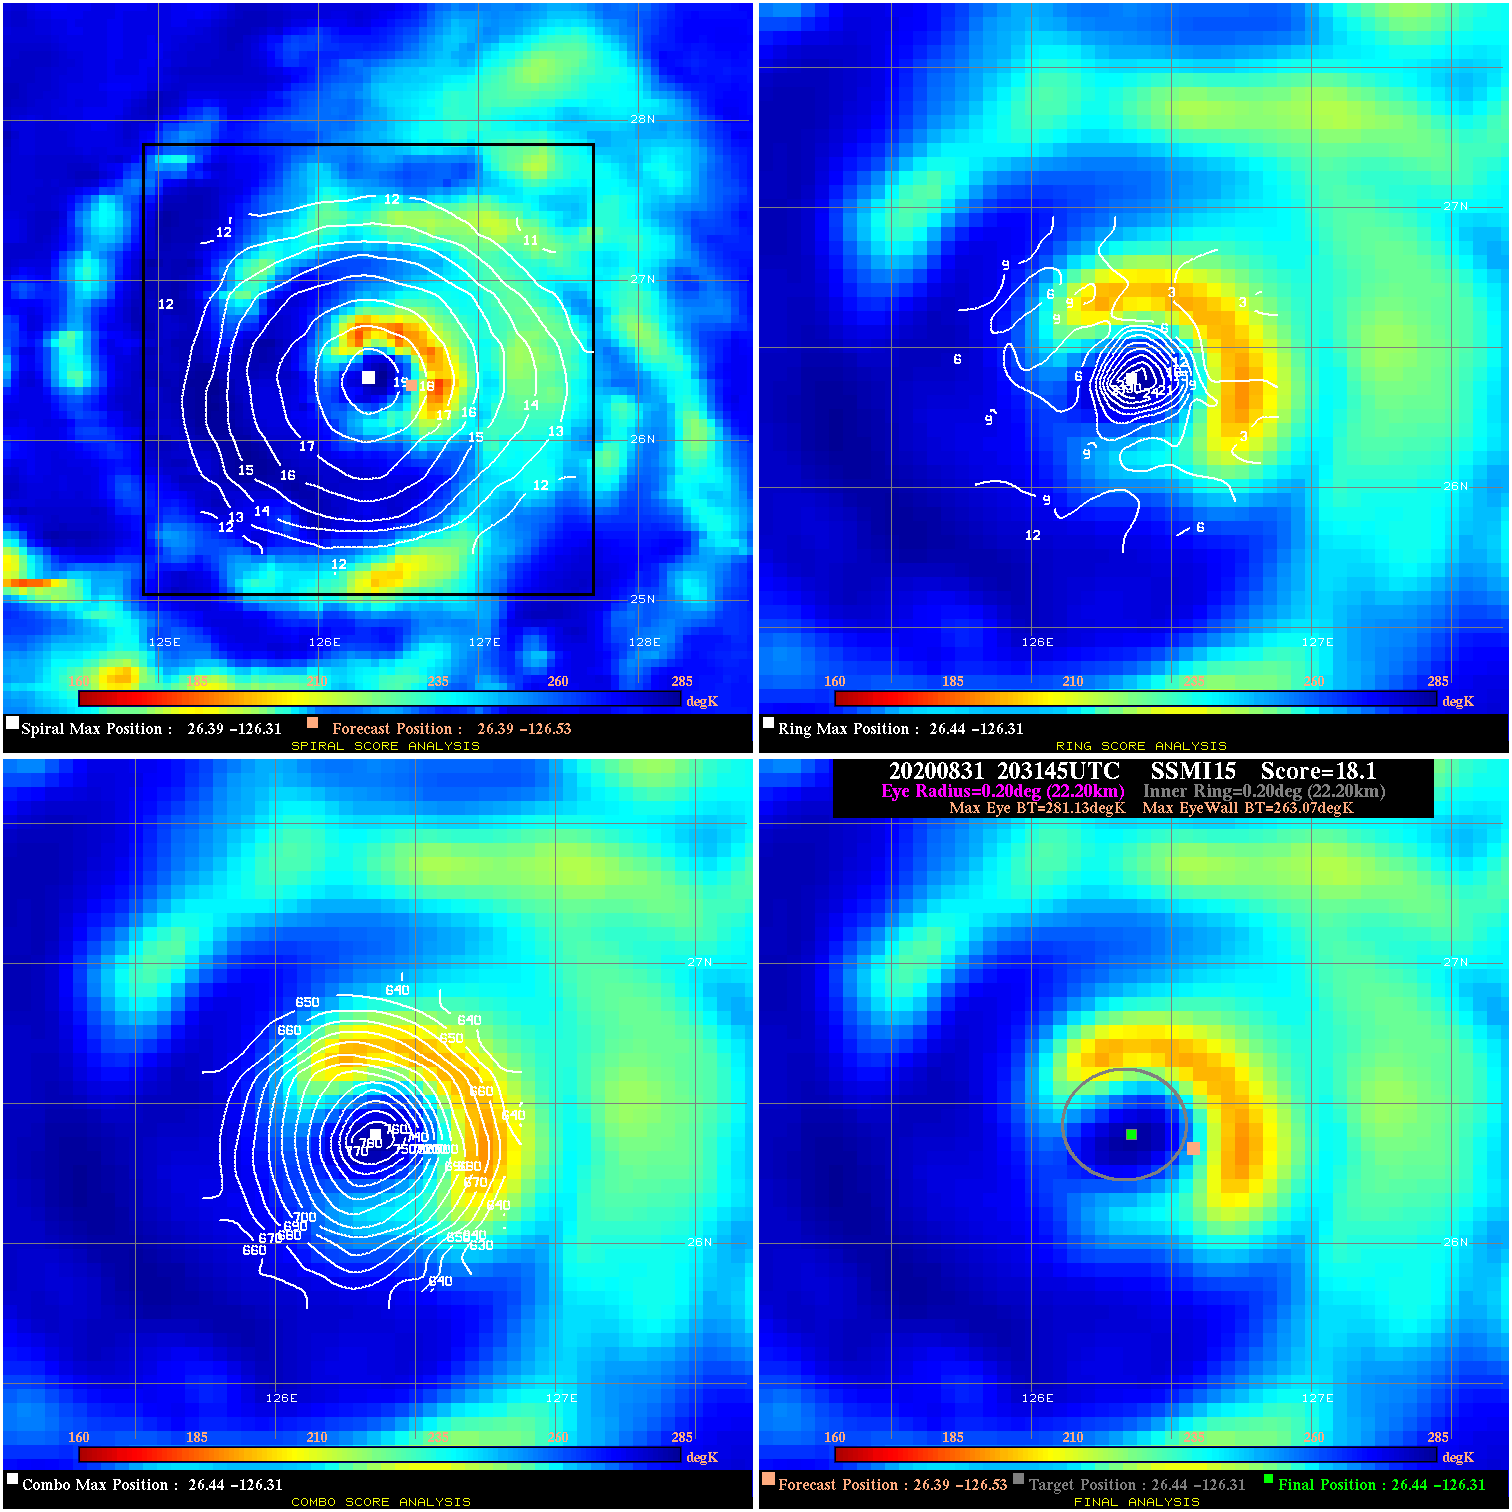
20200831 203145 18.1 N/A 56.2% 44.44 18.06 115.0 SSMI15 26.4 -126.5 26.4 -126.3 26.4 -126.3 Analysis Plot
20200831 211722 12.1 N/A 72.6% 44.44 12.13 115.0 SSMI16 26.4 -126.5 26.5 -126.3 26.5 -126.3 Analysis Plot
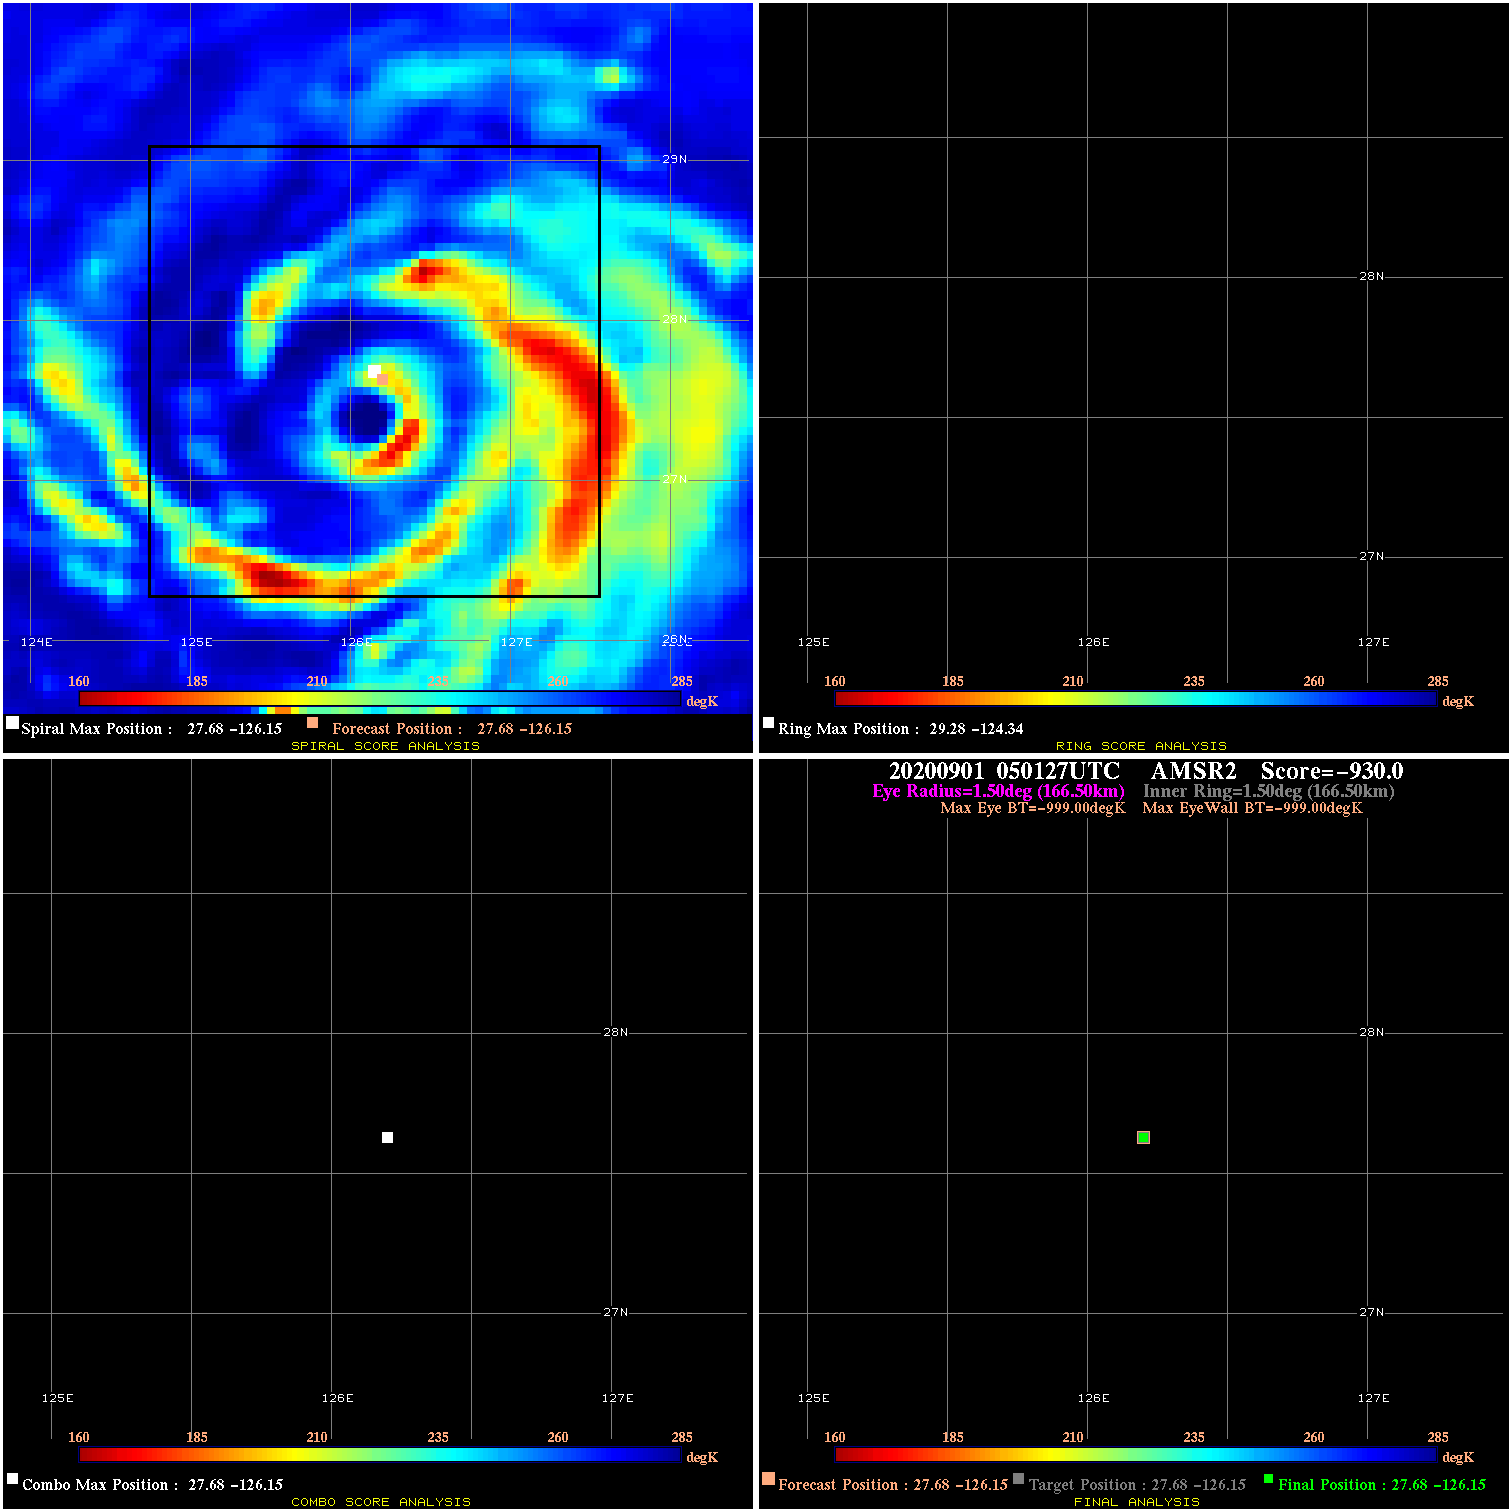
20200901 050127 N/A N/A N/A N/A N/A 115.0 AMSR2 27.7 -126.2 27.7 -126.2 27.7 -126.2 Analysis Plot
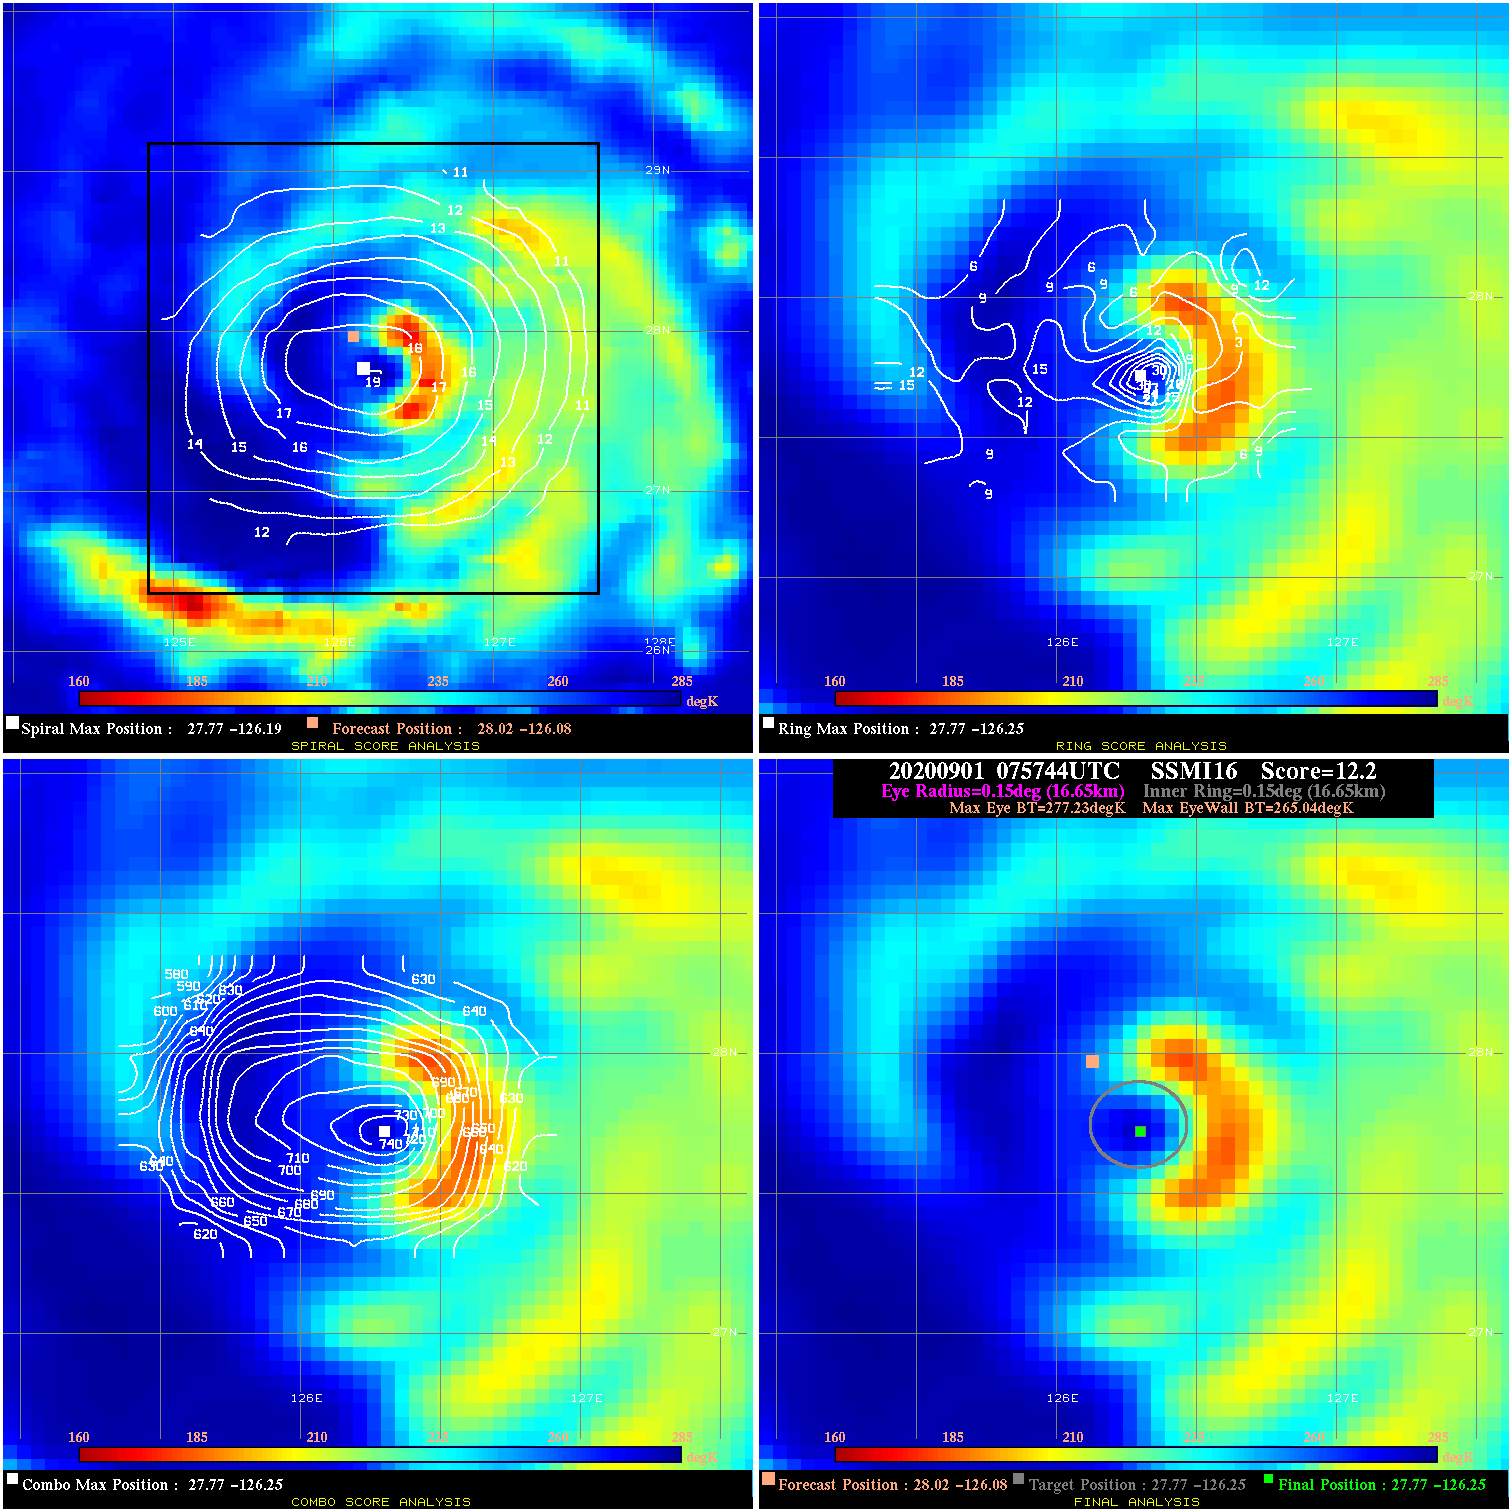
20200901 075744 12.2 N/A 57.5% 33.33 12.19 115.0 SSMI16 28.0 -126.1 27.8 -126.3 27.8 -126.3 Analysis Plot
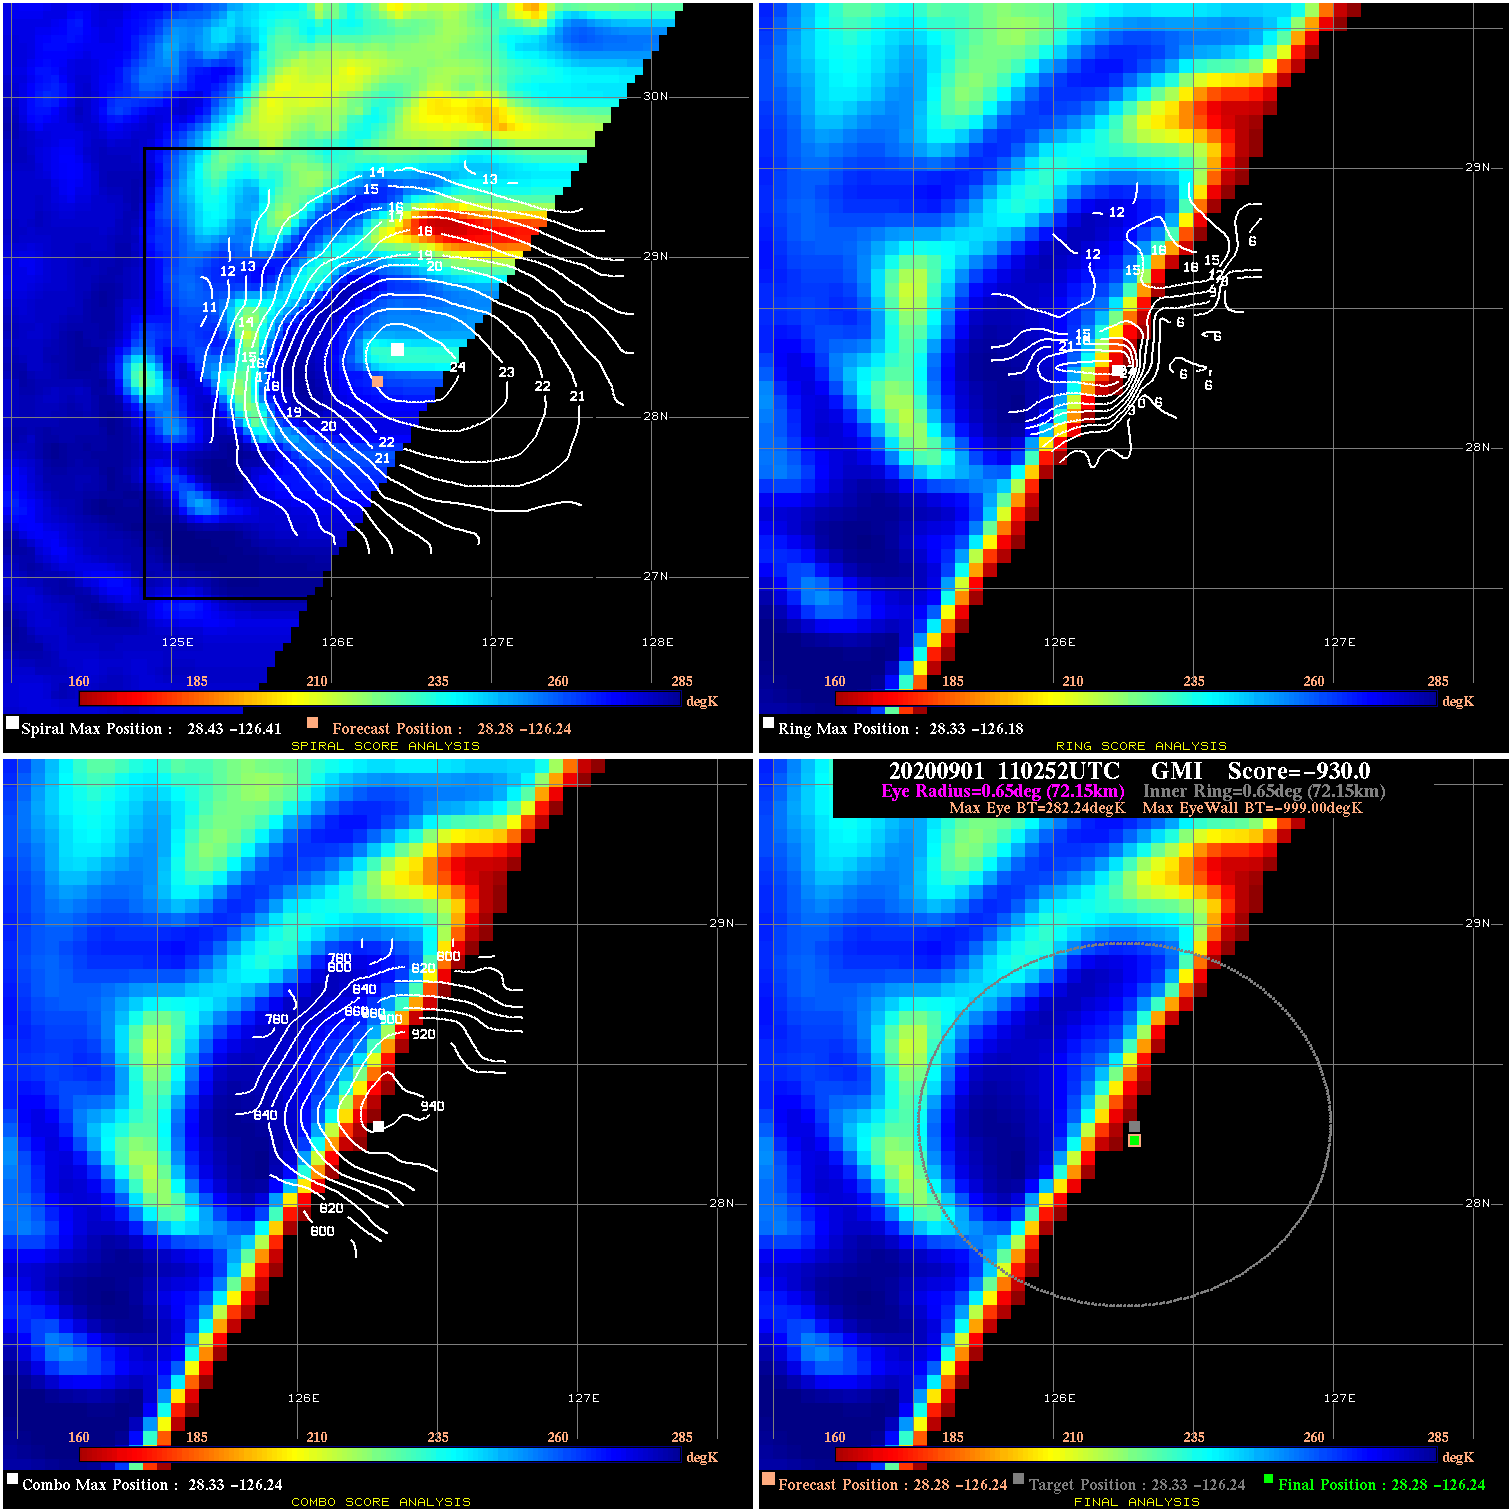
20200901 110252 -930.0 N/A N/A N/A 0.00 125.0 GMI 28.3 -126.2 28.3 -126.2 28.3 -126.2 Analysis Plot
20200901 170743 18.6 N/A 58.9% 199.98 18.57 120.0 AMSR2 29.5 -126.5 29.3 -126.4 29.3 -126.4 Analysis Plot
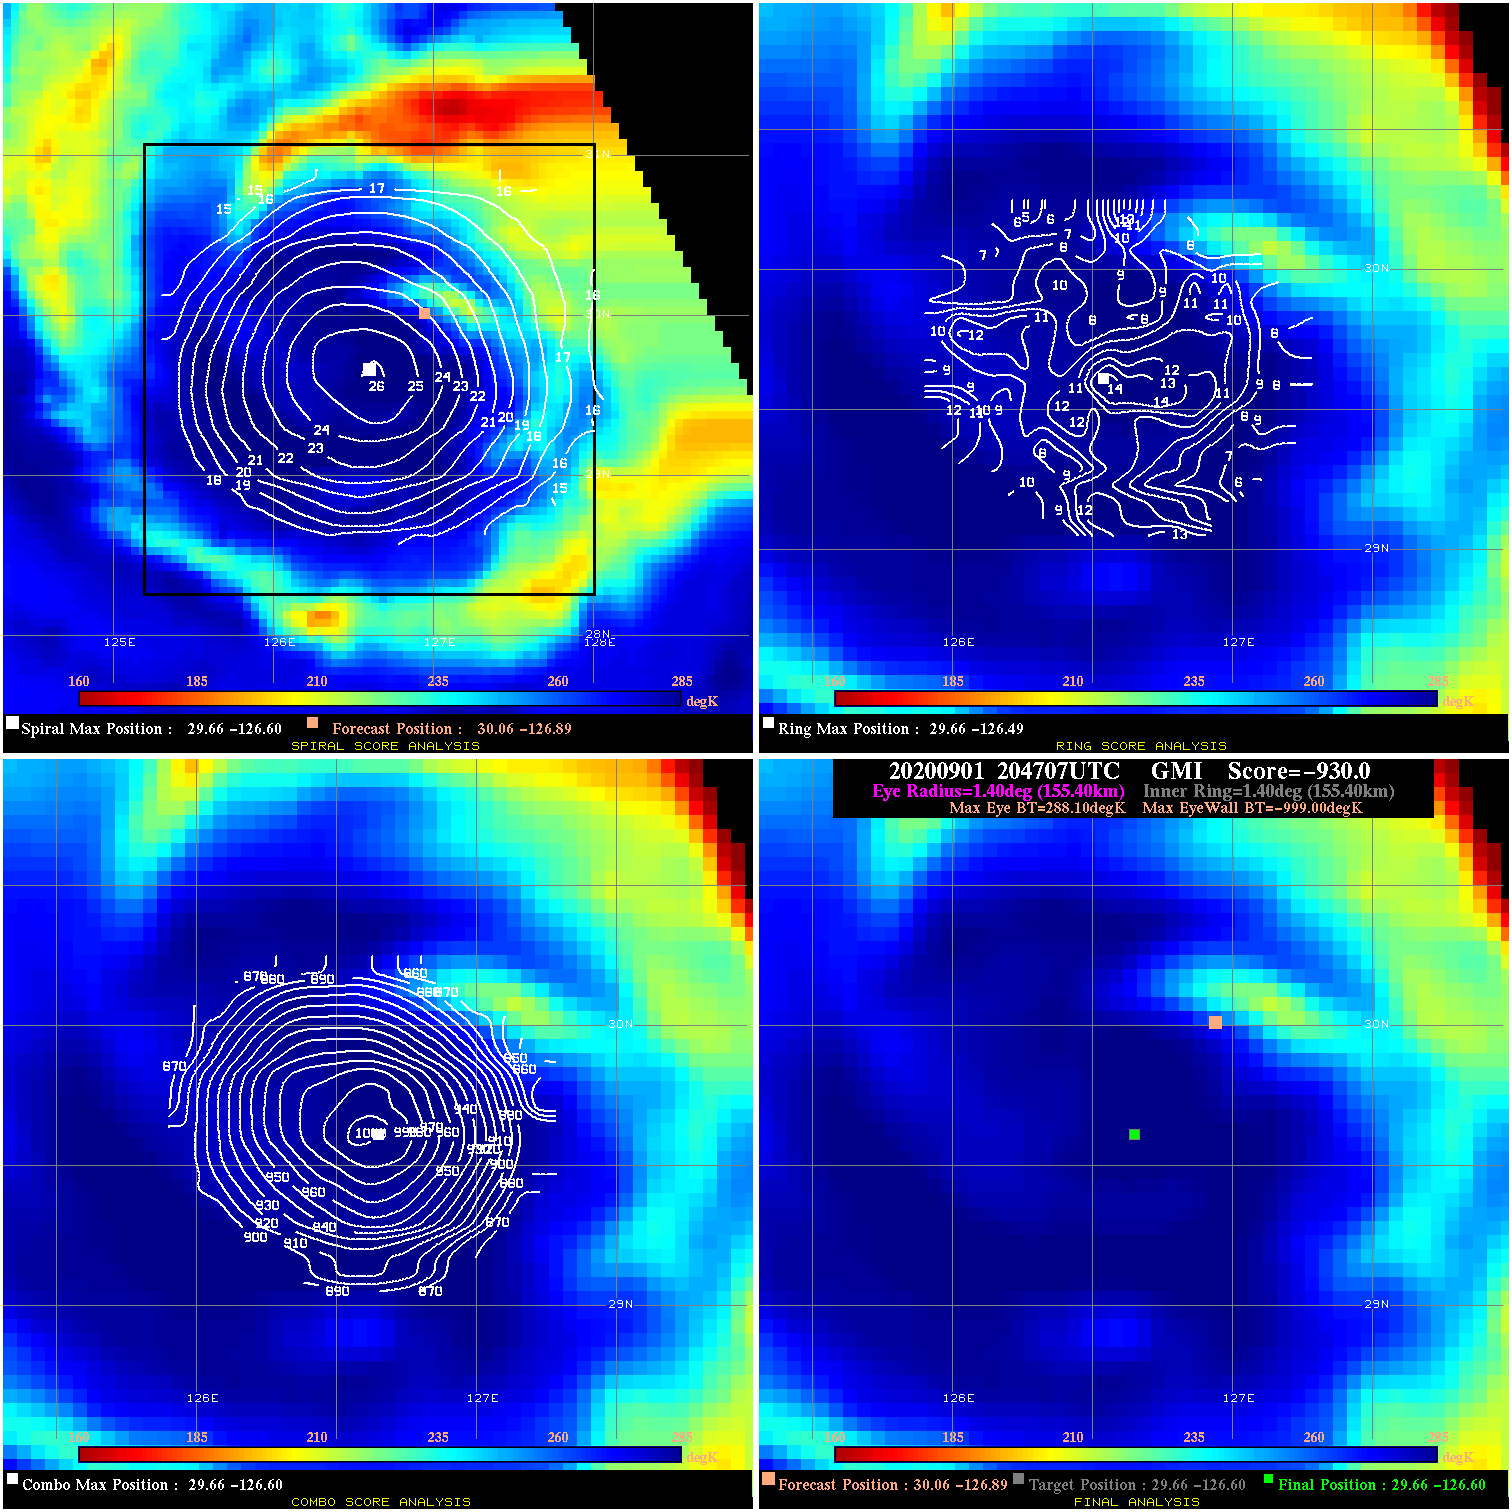
20200901 204707 -930.0 N/A N/A N/A 0.00 115.0 GMI 30.1 -126.9 29.7 -126.6 29.7 -126.6 Analysis Plot
20200901 210412 -930.0 N/A N/A N/A 0.00 115.0 SSMI16 30.0 -126.8 29.6 -126.4 29.6 -126.4 Analysis Plot
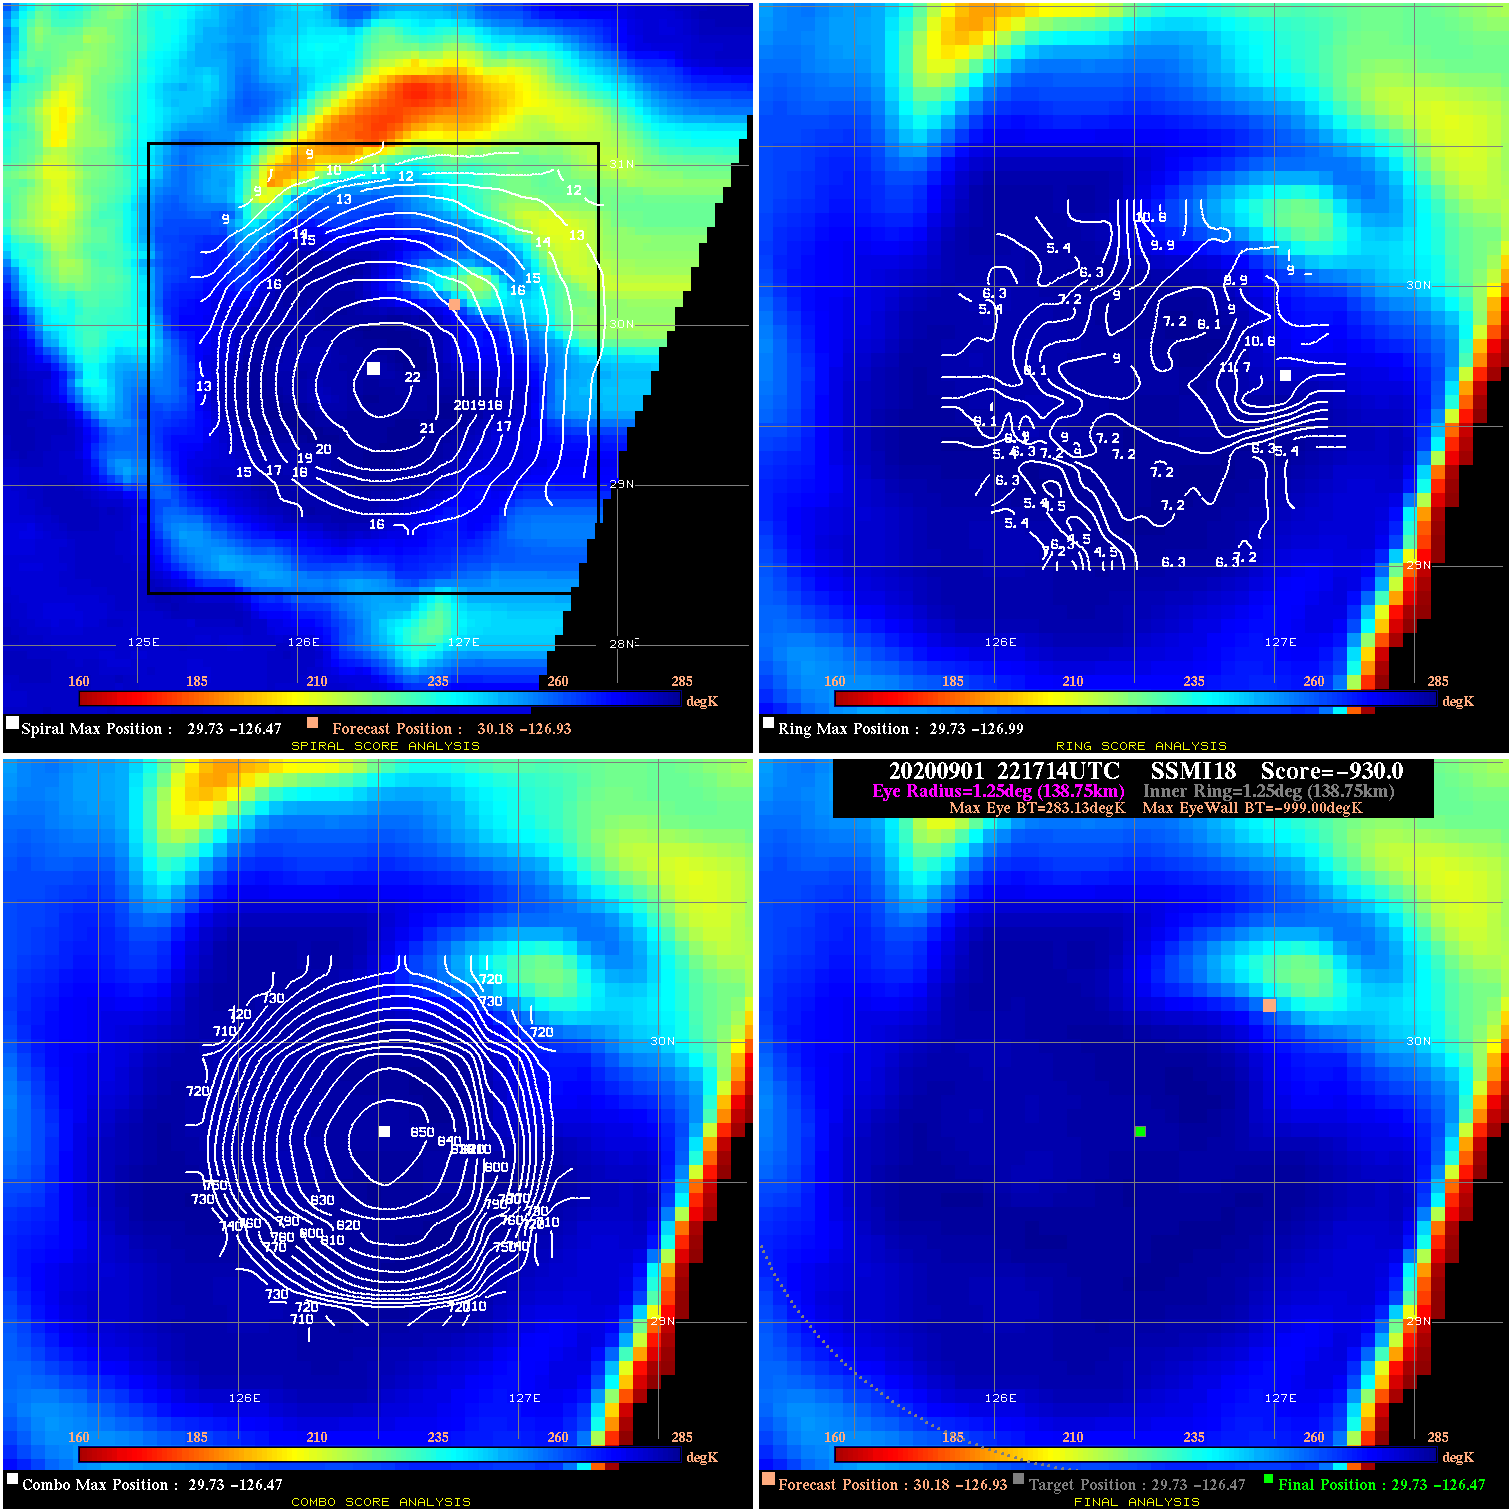
20200901 221714 -930.0 N/A N/A N/A 0.00 115.0 SSMI18 30.2 -126.9 29.7 -126.5 29.7 -126.5 Analysis Plot
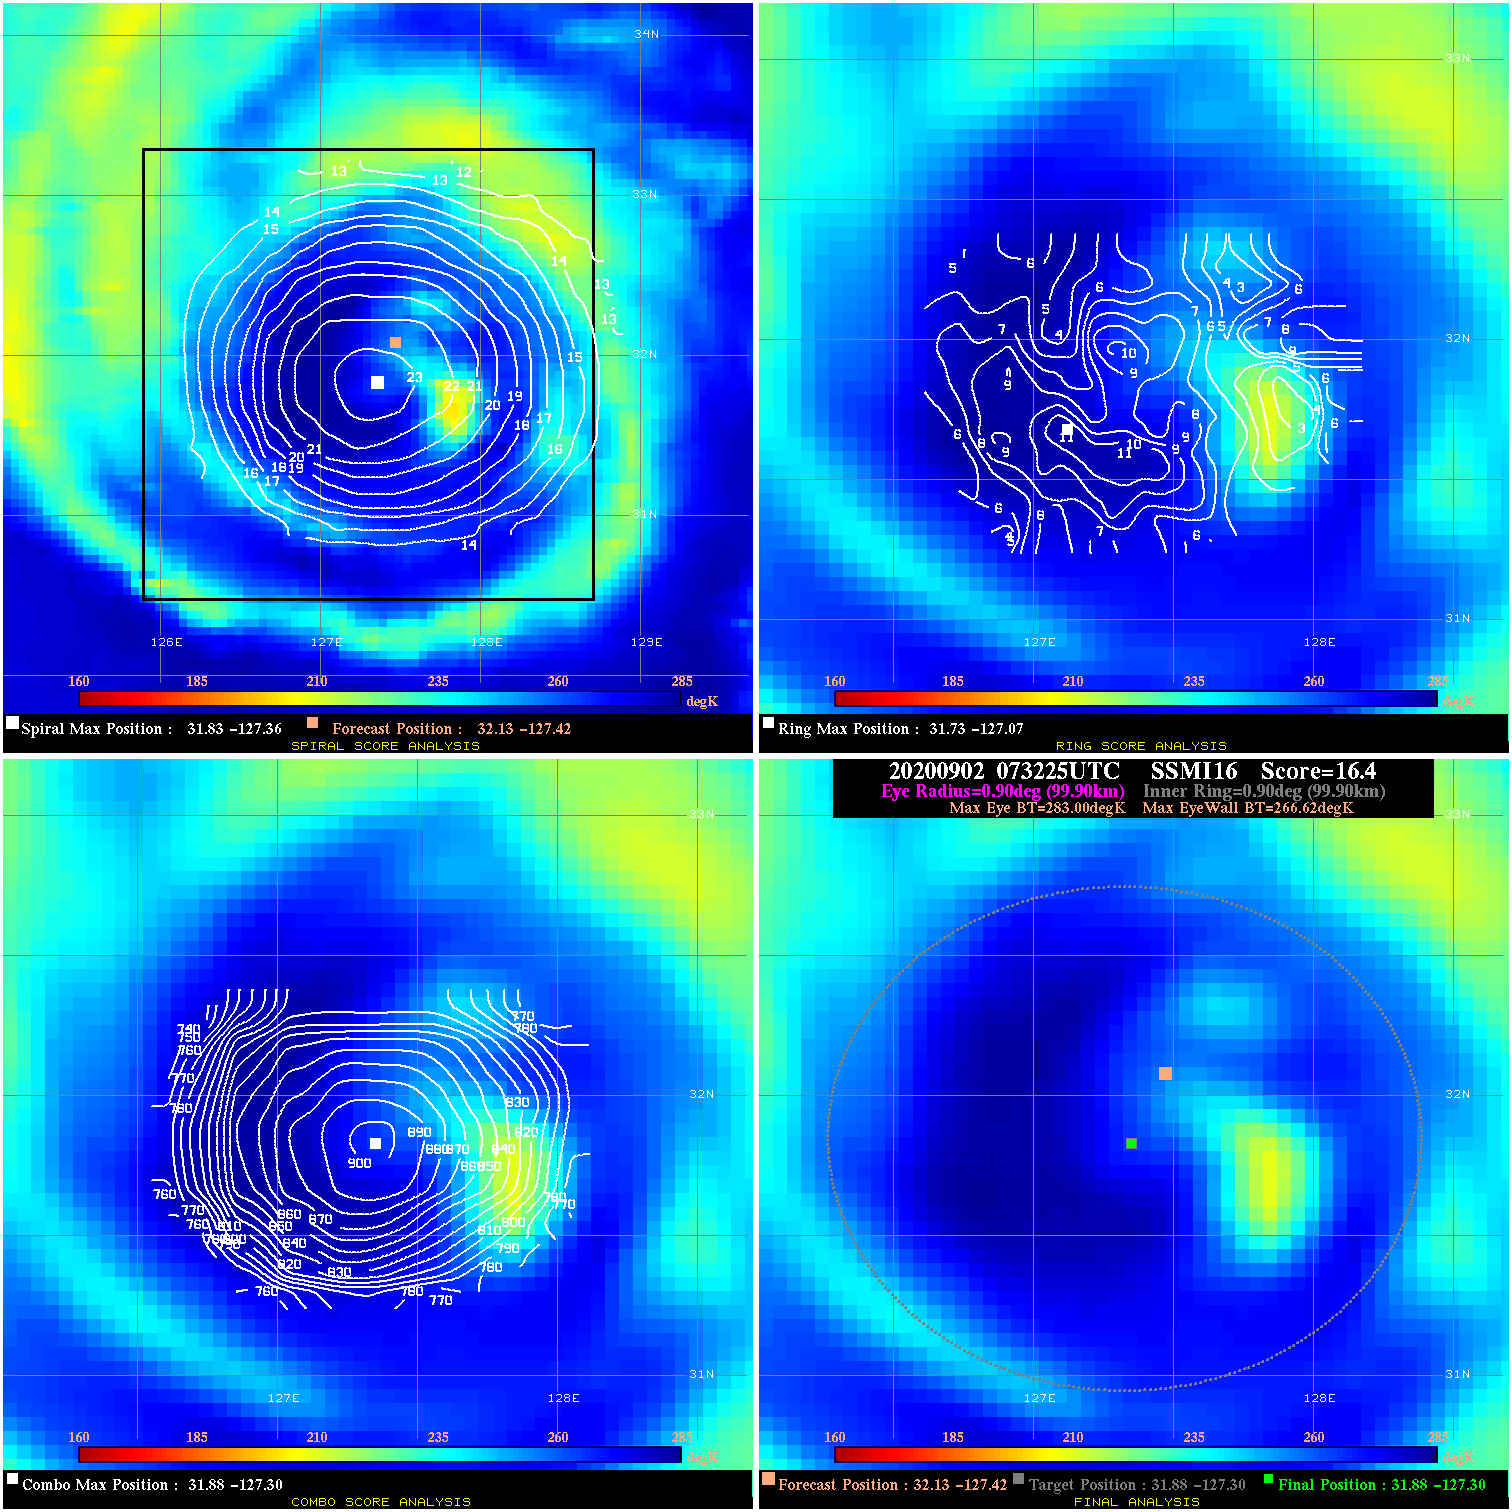
20200902 073225 16.4 N/A 1.4% 199.98 16.38 115.0 SSMI16 32.1 -127.4 31.9 -127.3 31.9 -127.3 Analysis Plot
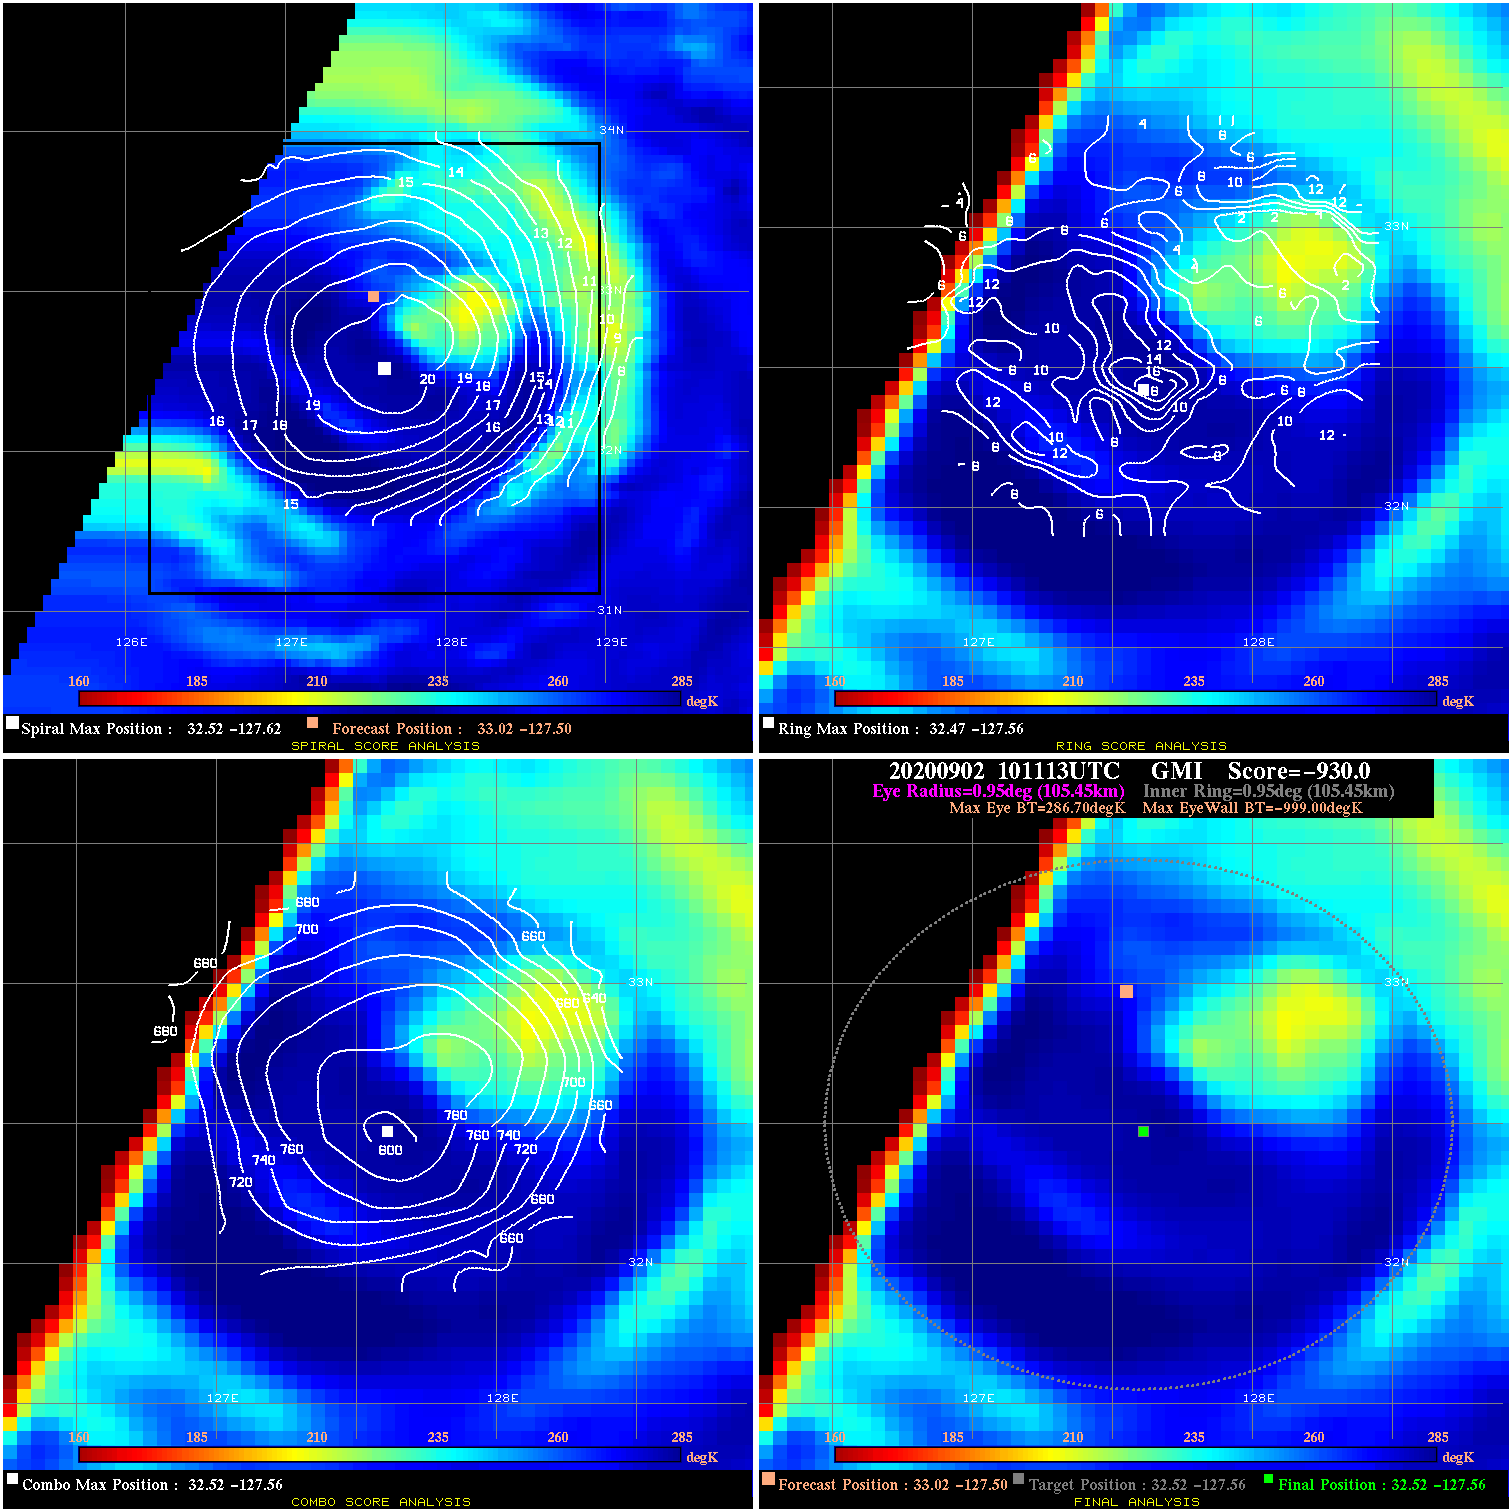
20200902 101113 -930.0 N/A N/A N/A 0.00 100.0 GMI 33.0 -127.5 32.5 -127.6 32.5 -127.6 Analysis Plot
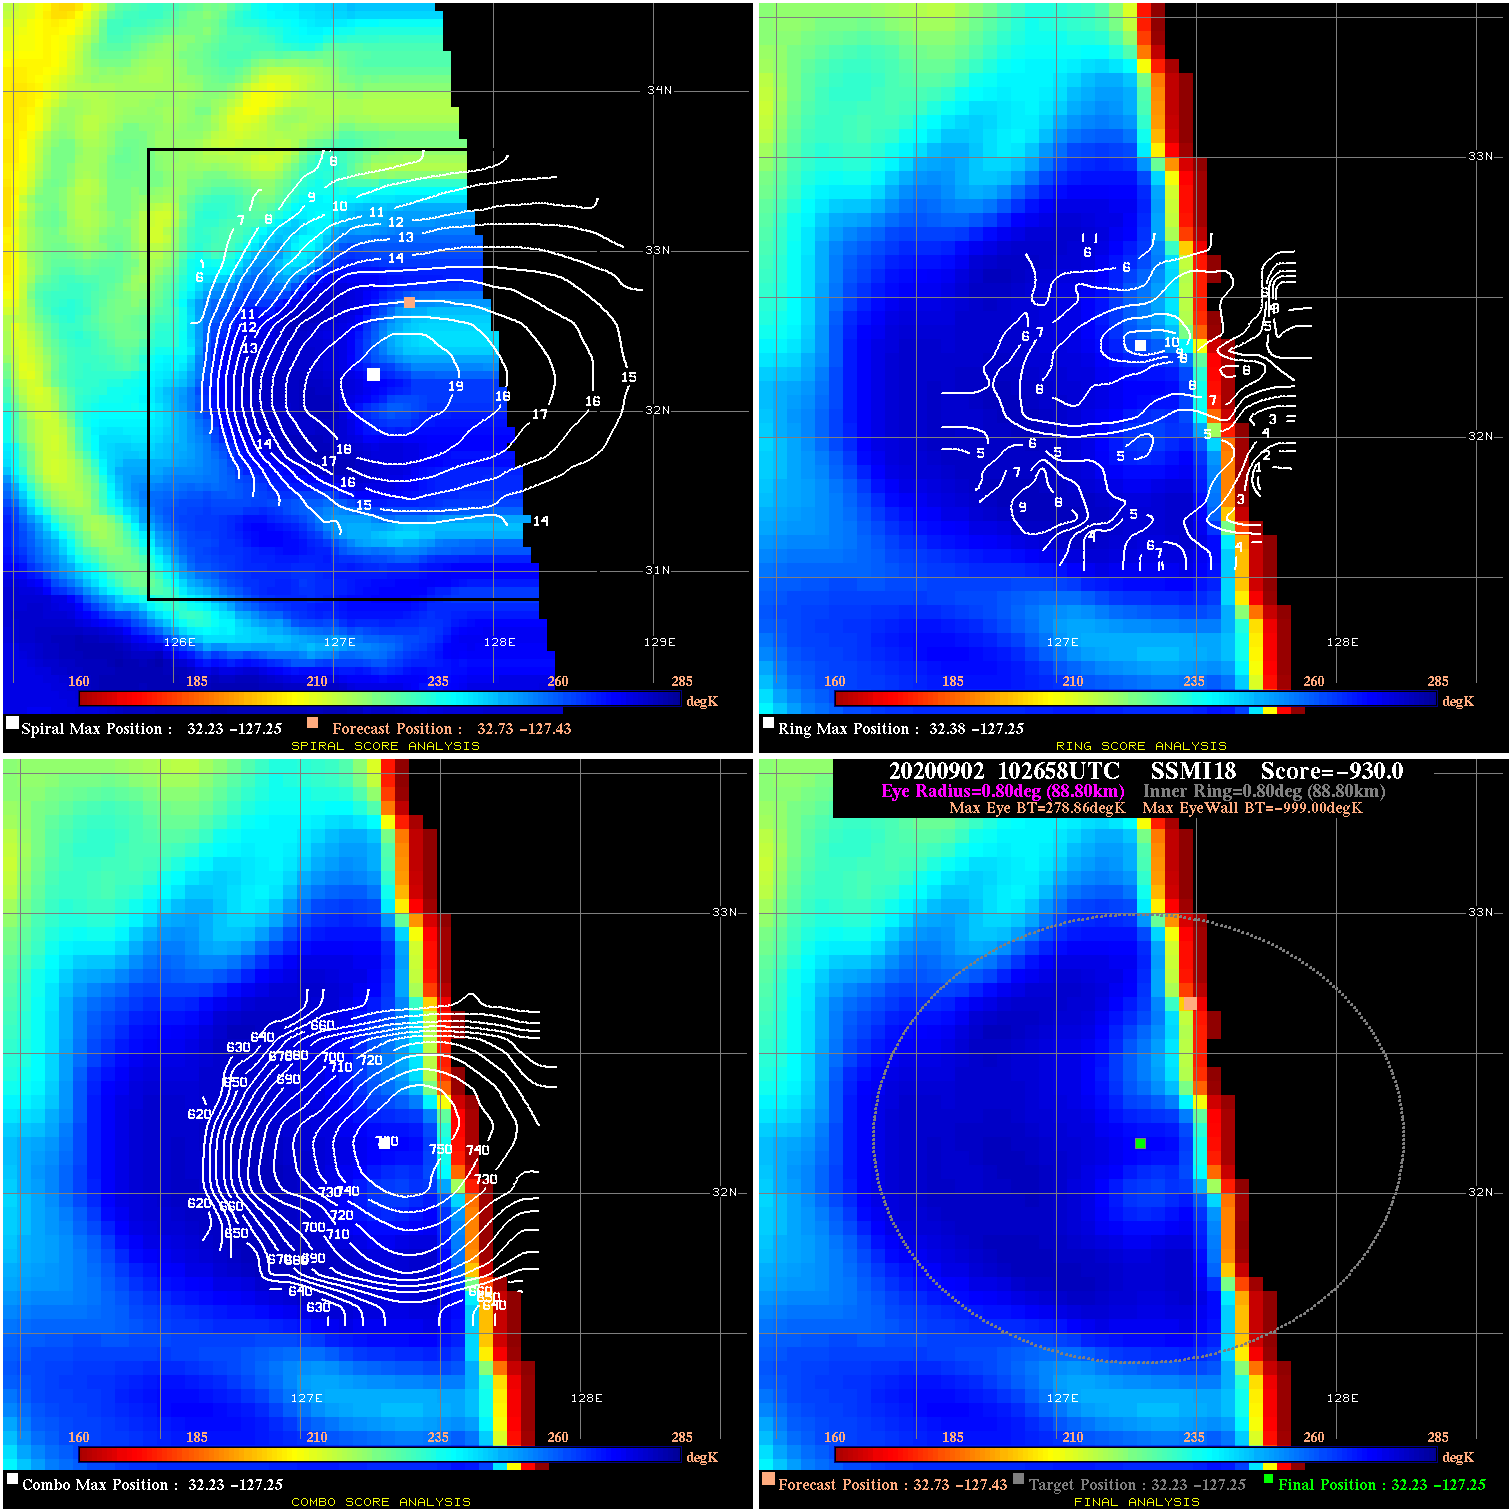
20200902 102658 -930.0 N/A N/A N/A 0.00 100.0 SSMI18 32.7 -127.4 32.2 -127.3 32.2 -127.3 Analysis Plot
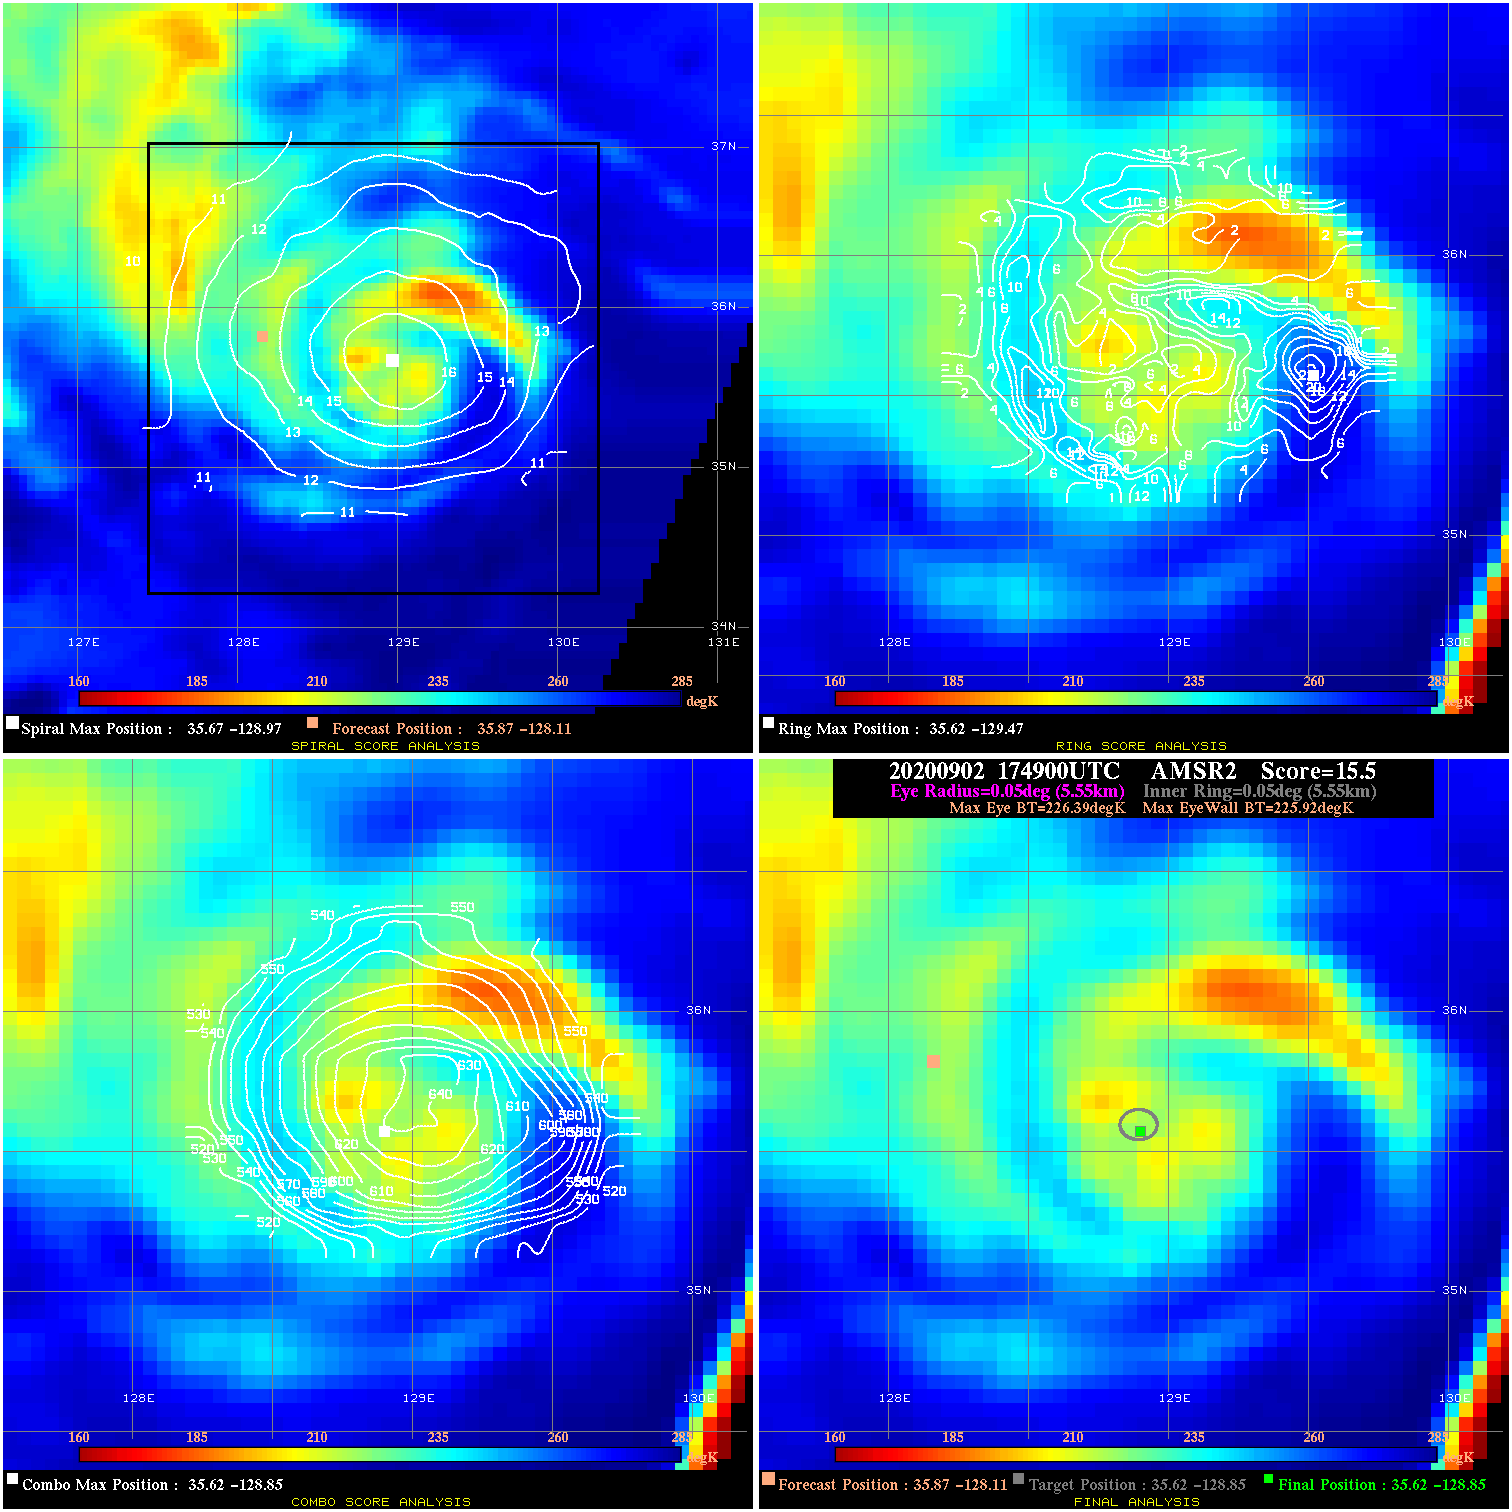
20200902 174900 15.5 N/A 100.0% 11.11 .47 90.0 AMSR2 35.9 -128.1 35.6 -128.9 35.6 -128.9 Analysis Plot
20200902 201228 28.5 >65 kts 98.6% 77.77 13.54 75.0 SSMI15 36.3 -128.9 36.5 -128.9 36.5 -128.9 Analysis Plot
20200902 205109 8.4 N/A 76.7% 66.66 8.45 75.0 SSMI16 36.5 -128.9 36.5 -128.9 36.8 -129.0 Analysis Plot
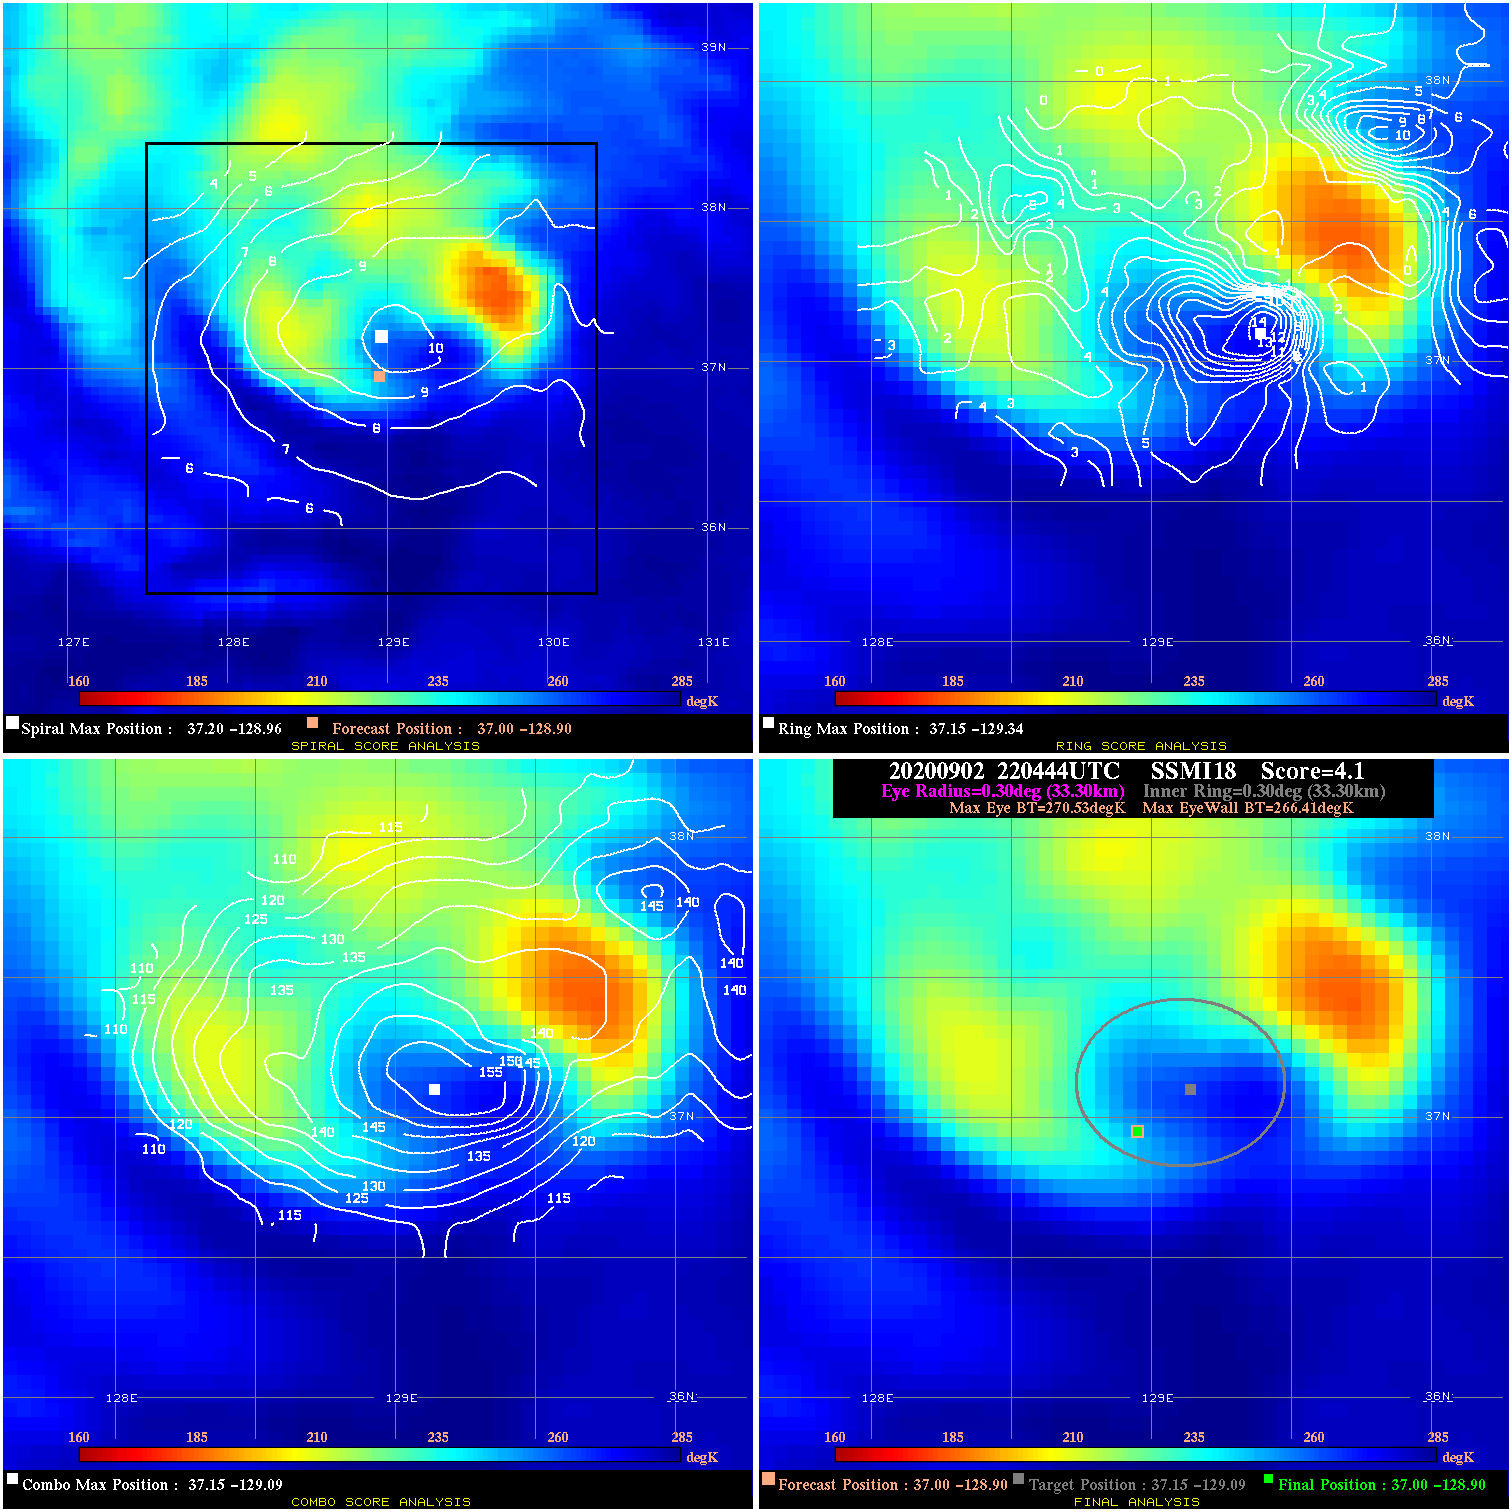
20200902 220444 4.1 N/A 15.1% 66.66 4.12 75.0 SSMI18 37.0 -128.9 37.0 -128.9 37.2 -129.1 Analysis Plot
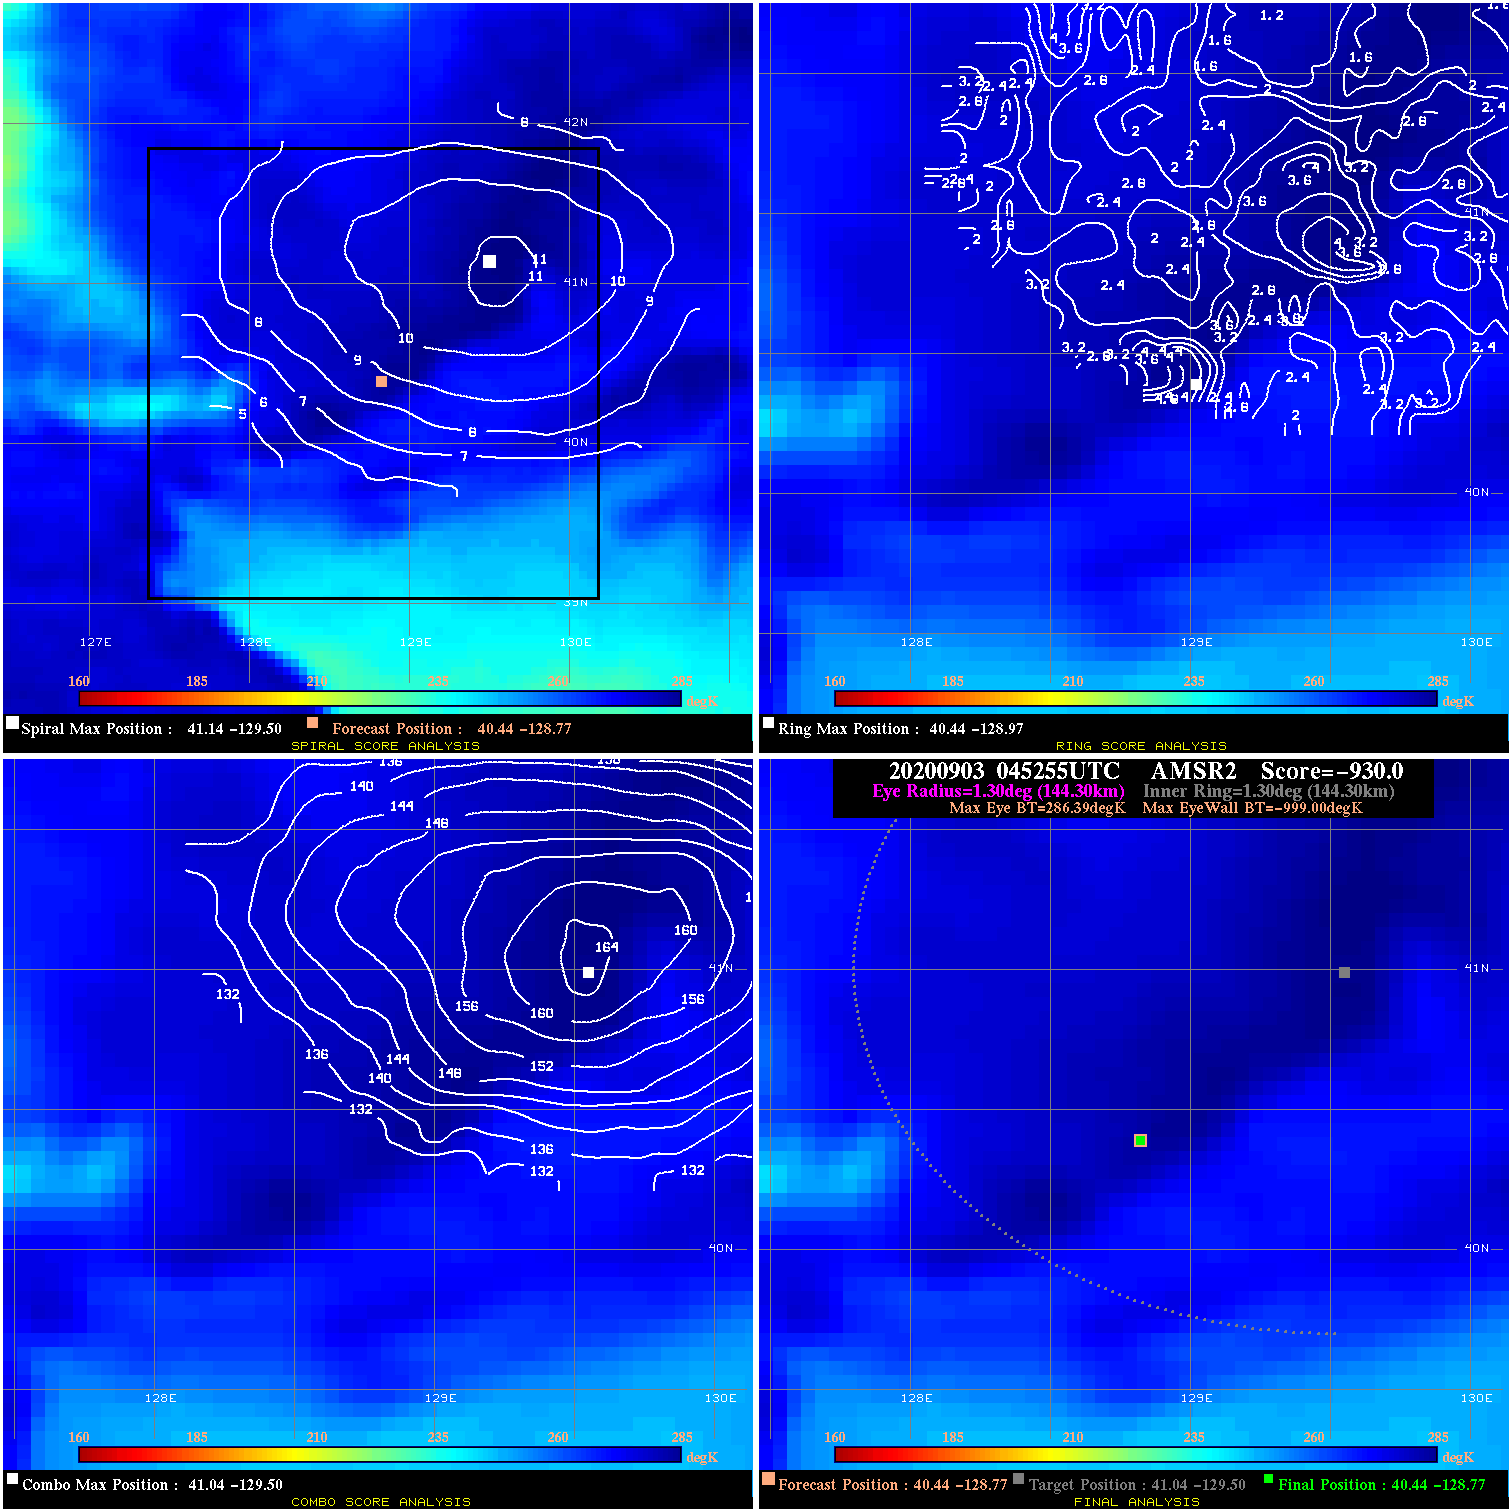
20200903 045255 -930.0 N/A N/A N/A 0.00 75.0 AMSR2 40.4 -128.8 40.4 -128.8 41.0 -129.5 Analysis Plot
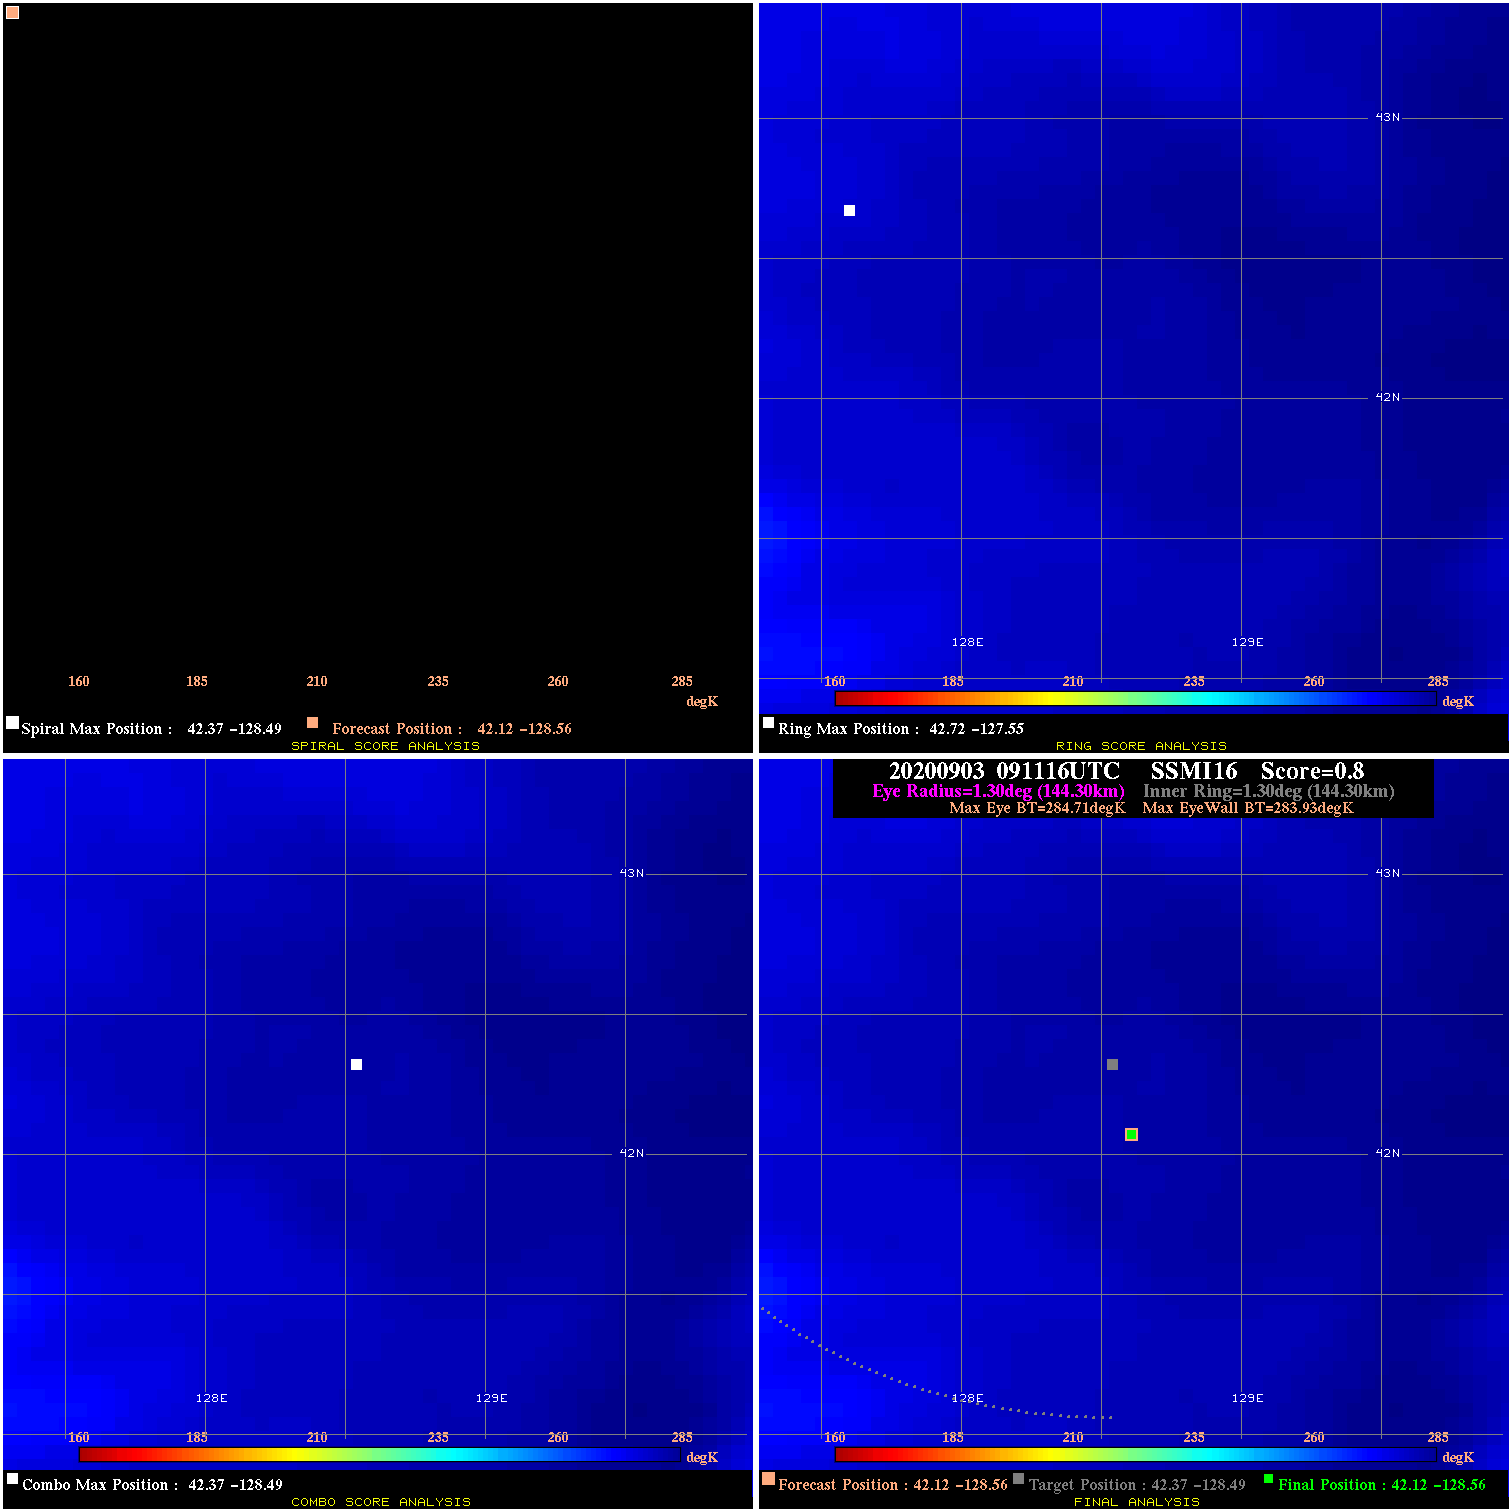
20200903 091116 0.8 N/A N/A 288.86 .78 75.0 SSMI16 42.1 -128.6 42.1 -128.6 42.4 -128.5 Analysis Plot
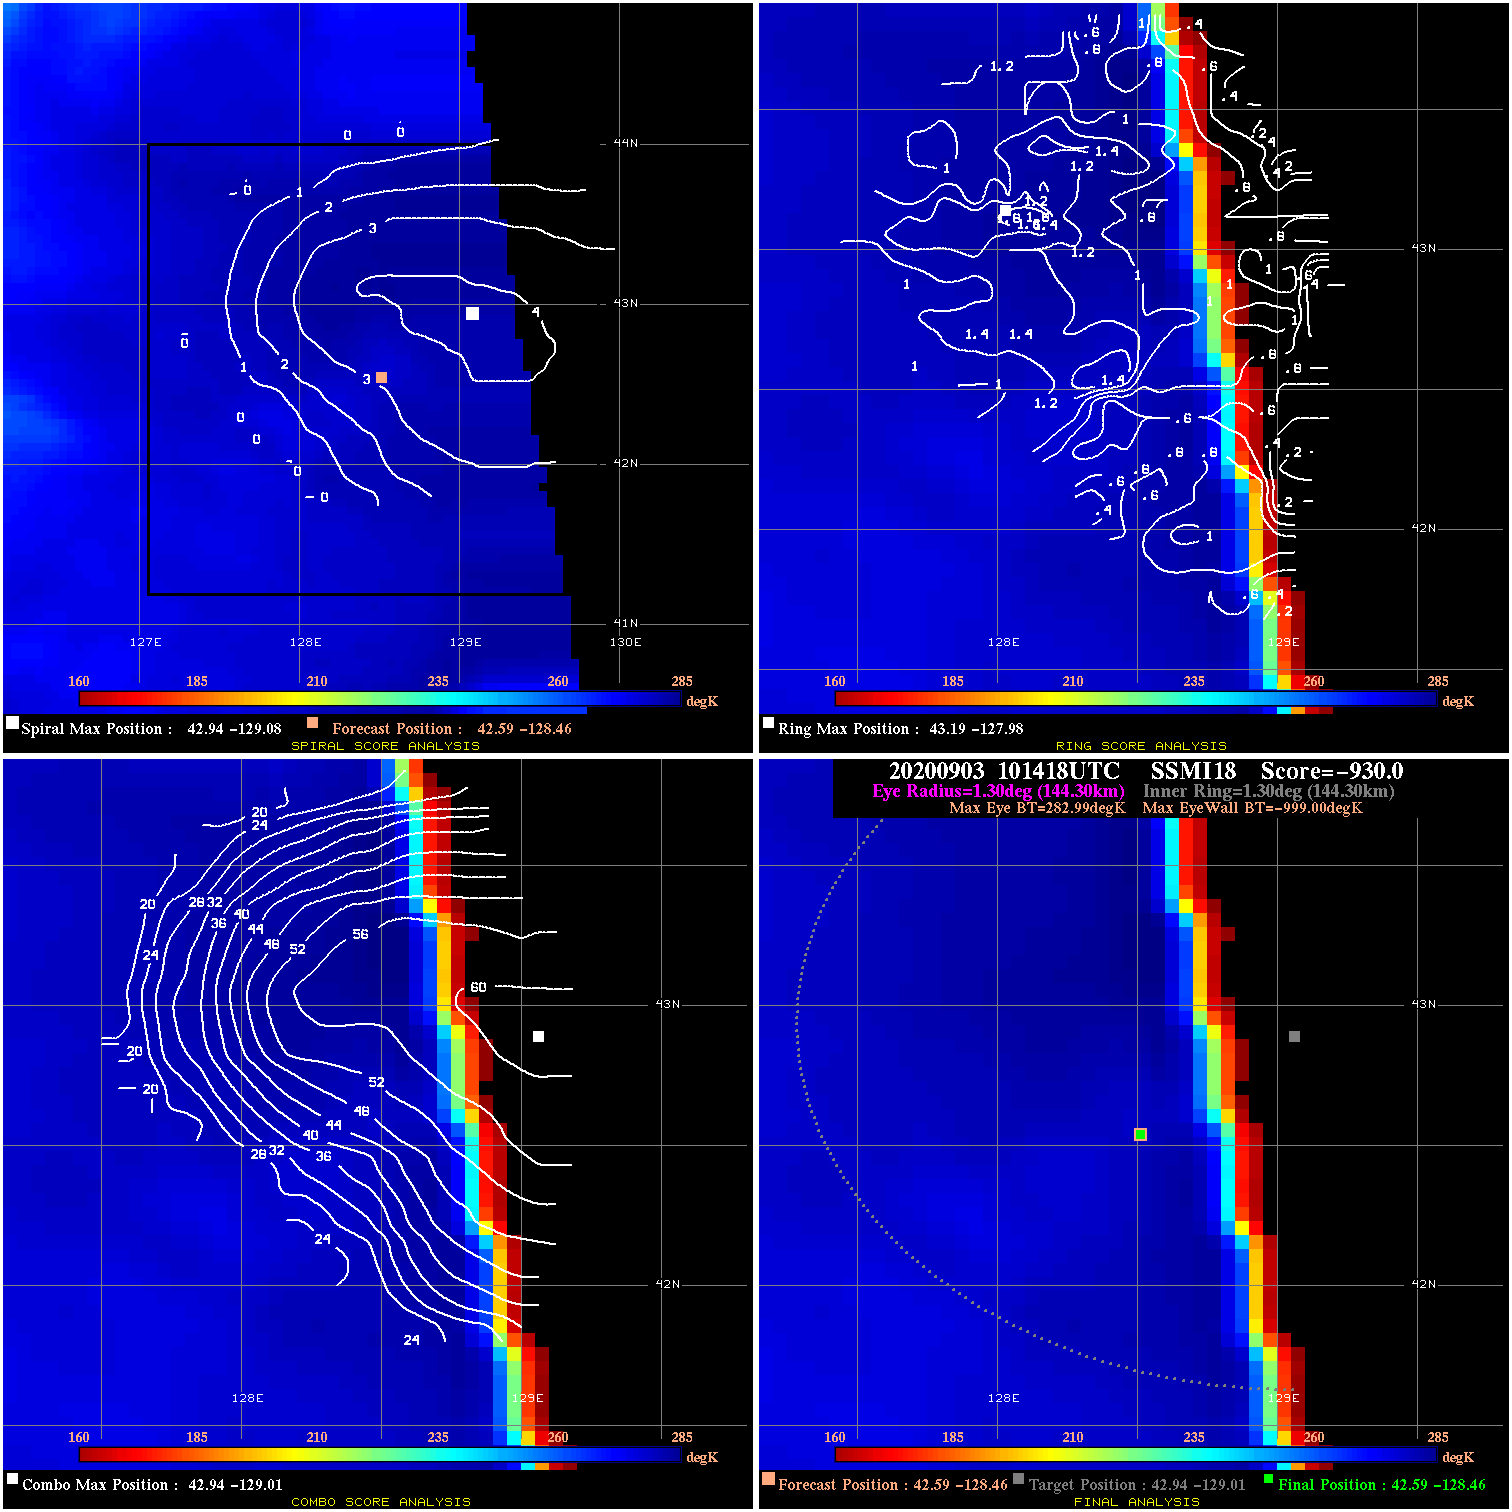
20200903 101418 -930.0 N/A N/A N/A 0.00 75.0 SSMI18 42.6 -128.5 42.6 -128.5 42.9 -129.0 Analysis Plot
|
|
Legend: - Date/Time are determined from PMW imagery at Forecast (initial guess) Lat/Lon position. - Positive/Negative Latitude = North/South Hemisphere; Longitude = Western/Eastern Hemisphere. - "Ring Diam" value indicates the estimated surface eyewall diameter in km (the MI eyewall edge diameter minus 10 km). - "Ring Pct" is the percentage of the "ring" (eyewall inner boundary) that is 1) colder than the "hot spot" (warmest eye pixel) in the eye by 20K, or 2) the percentage that is a) colder than 232K and b) colder than the "hot spot" by 10K, whichever is greater. - Values are red if Ring % <= 65, yellow/brown if Ring % <= 85 and green if Ring % > 85. - "Tb diff" is the difference between the "hot spot" (warmest eye pixel) and the warmest pixel on the eyewall. - Intensity score are listed as negative, and not used, when the JTWC or NHC estimated Vmax is <55 kts in order to rule out weak but highly symmetric TCs. - Error messages in intensity scores: -920 is used when the hottest pixel in the eye is <200K, to prevent false positives; -930 means <85% of eyewall has observations/data. |