Tropical Depression 19W
|
Passive Microwave (PMW) Intensity Information Hurricane Intensity Estimation (HIE) Algorithm Version 9.0 |
Overpass Inten Ring Ring Wind Forecast Final Target
Date Time Score Meaning Pct Diam BTdiff Est Sat Lat Lon Lat Lon Lat Lon
20201019 072801 -1.8 N/A 9.6% 188.87 1.84 25.0 SSMI16 14.5 -128.1 14.5 -128.1 14.2 -128.6 Analysis Plot
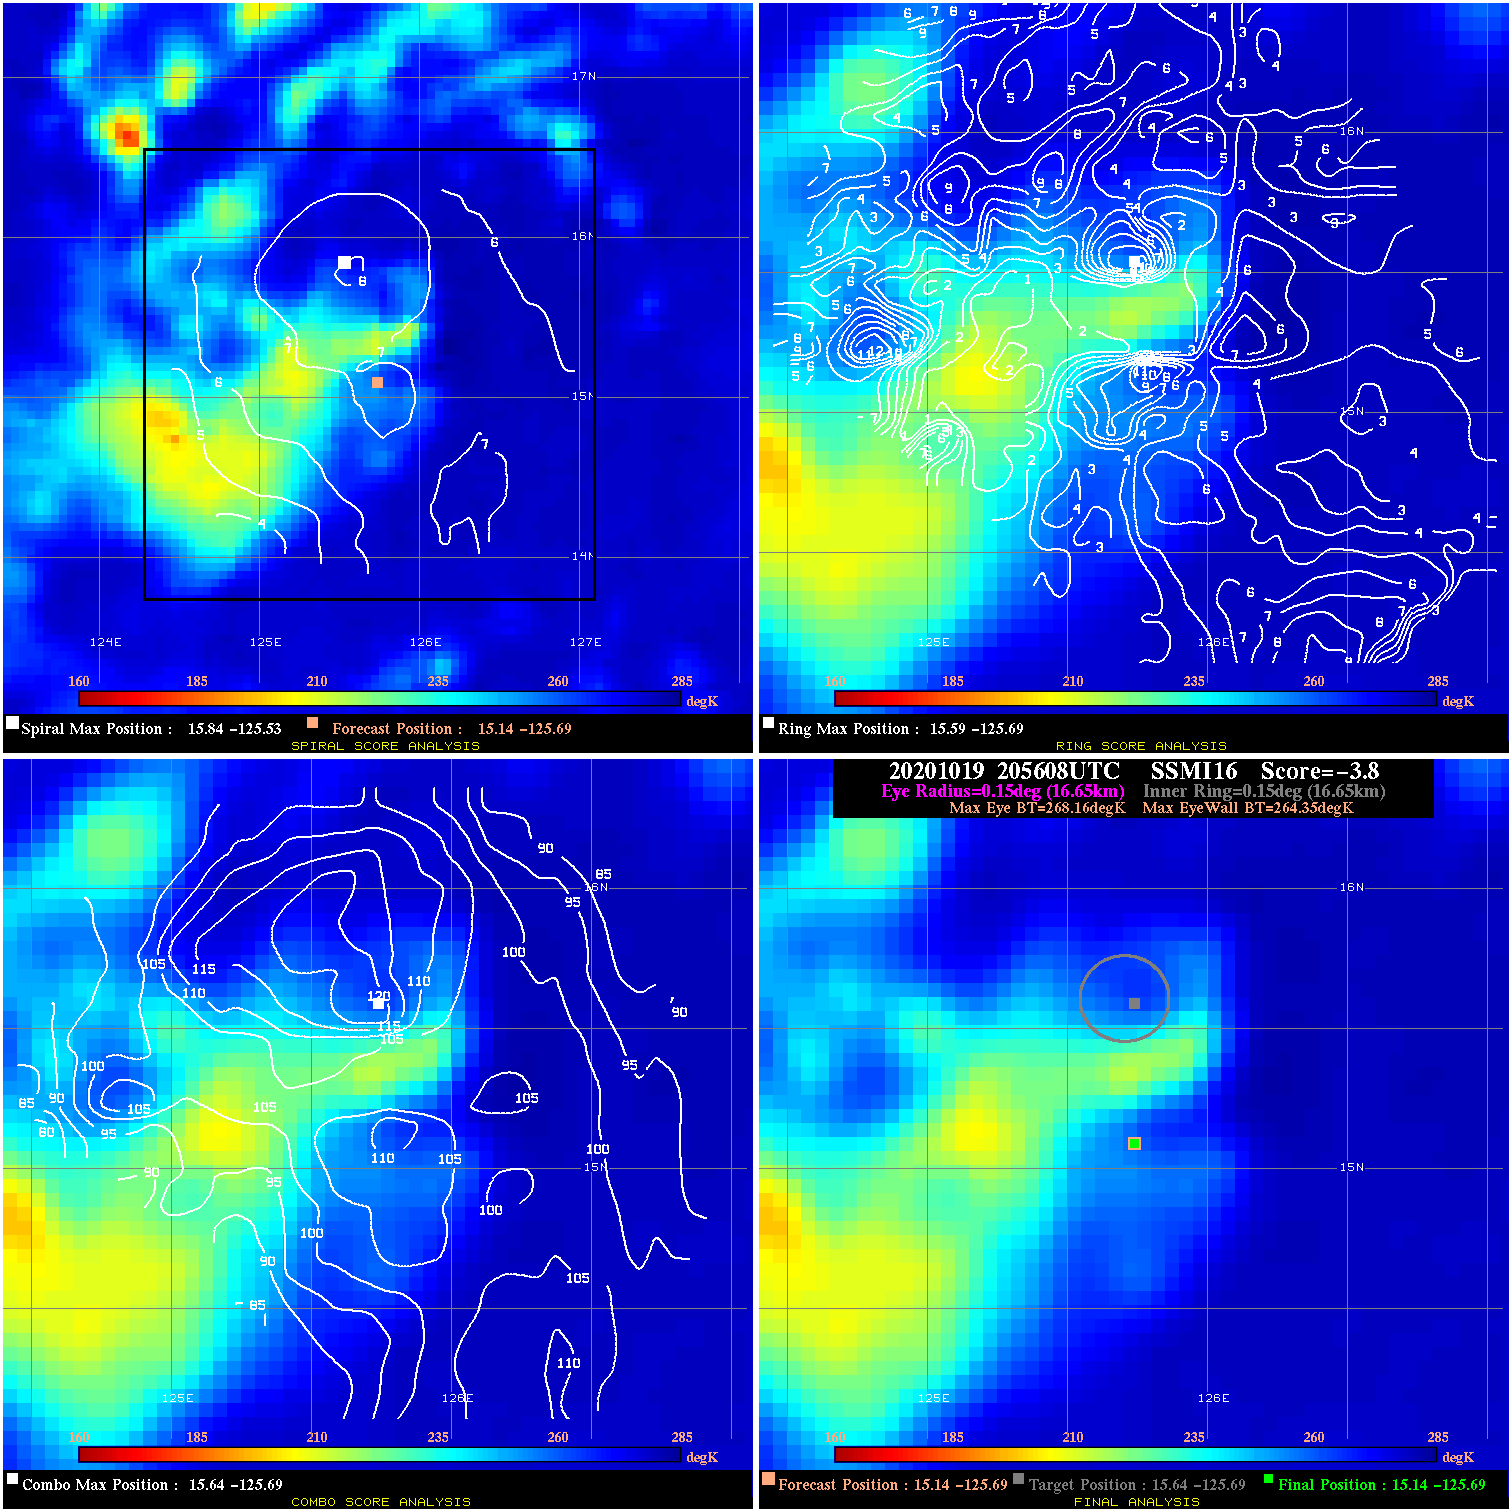
20201019 205608 -3.8 N/A 1.4% 33.33 3.81 30.0 SSMI16 15.1 -125.7 15.1 -125.7 15.6 -125.7 Analysis Plot
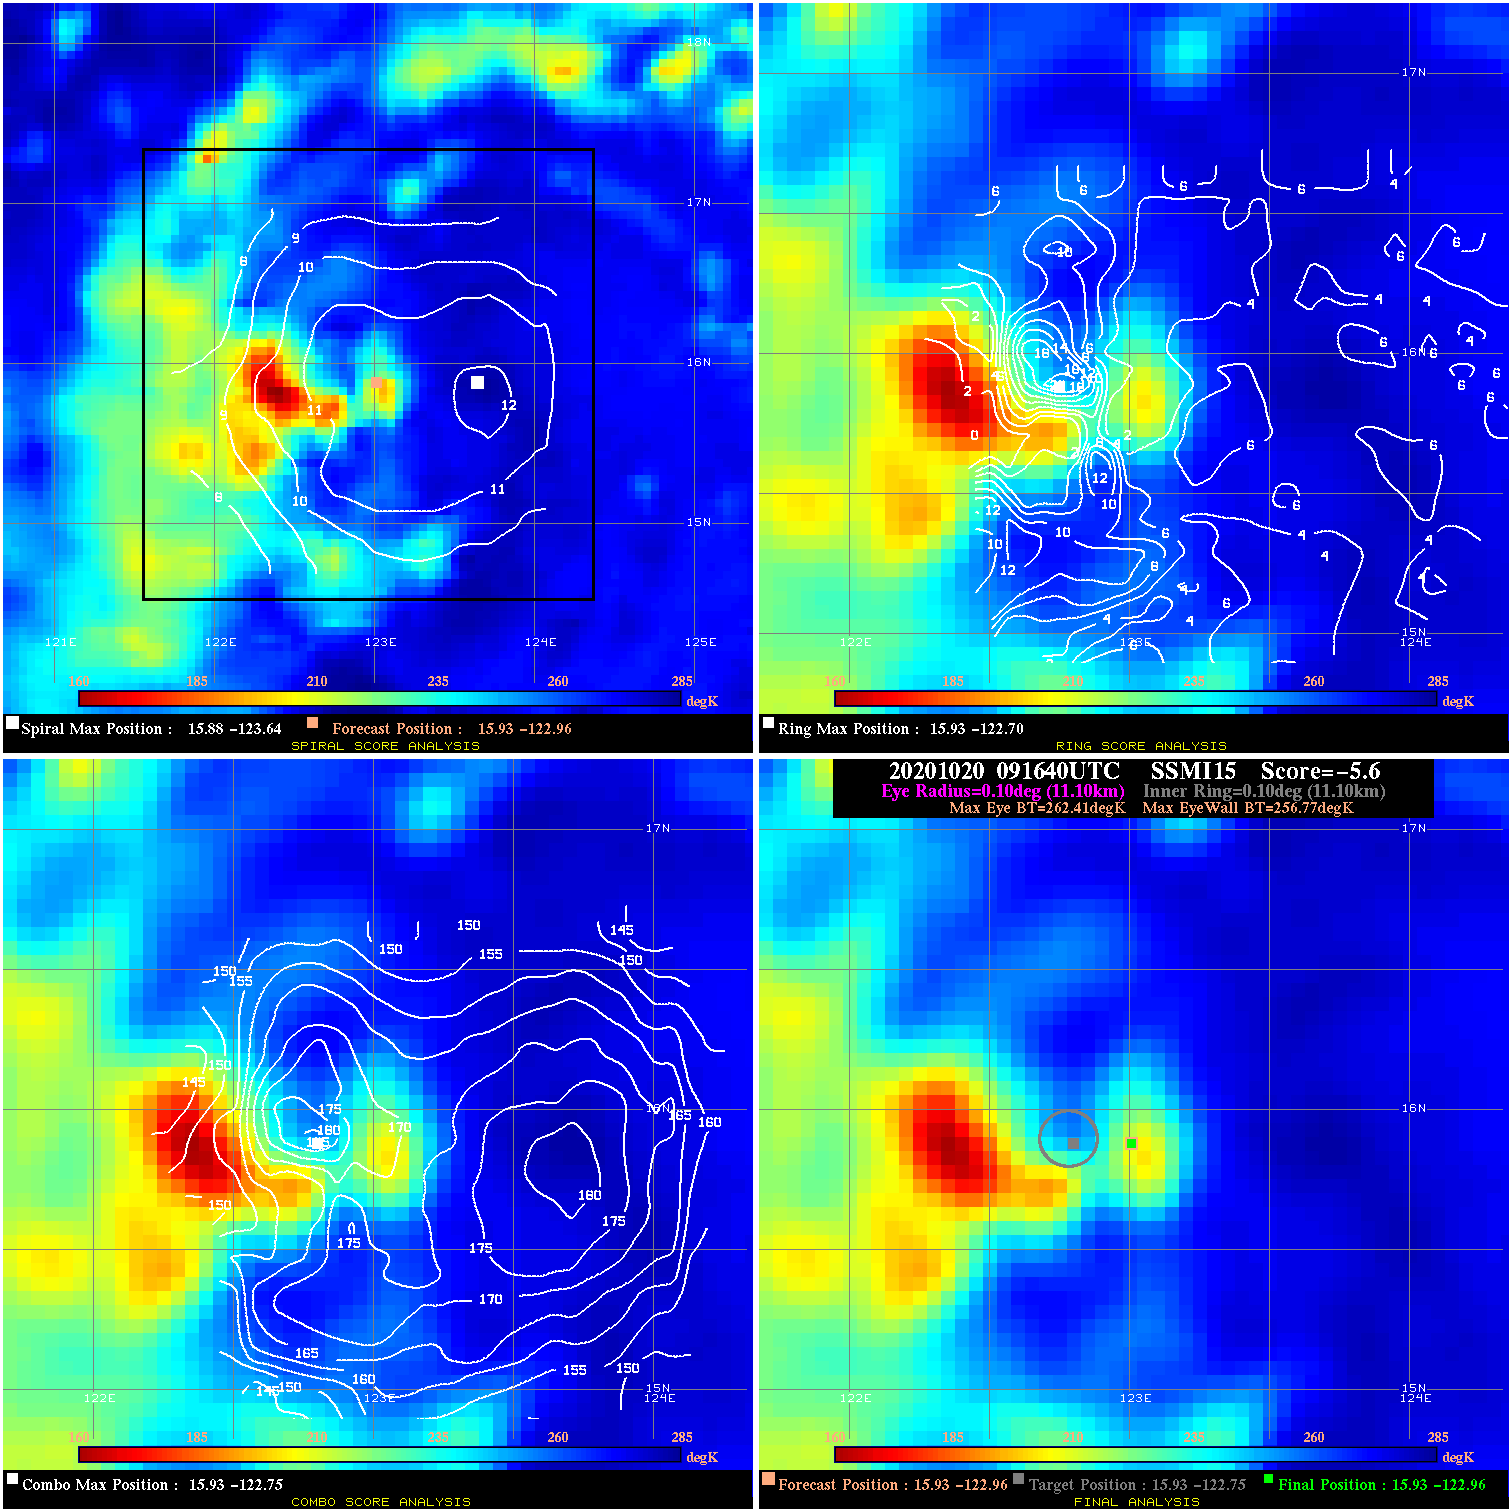
20201020 091640 -5.6 N/A 43.8% 22.22 5.64 40.0 SSMI15 15.9 -123.0 15.9 -123.0 15.9 -122.8 Analysis Plot
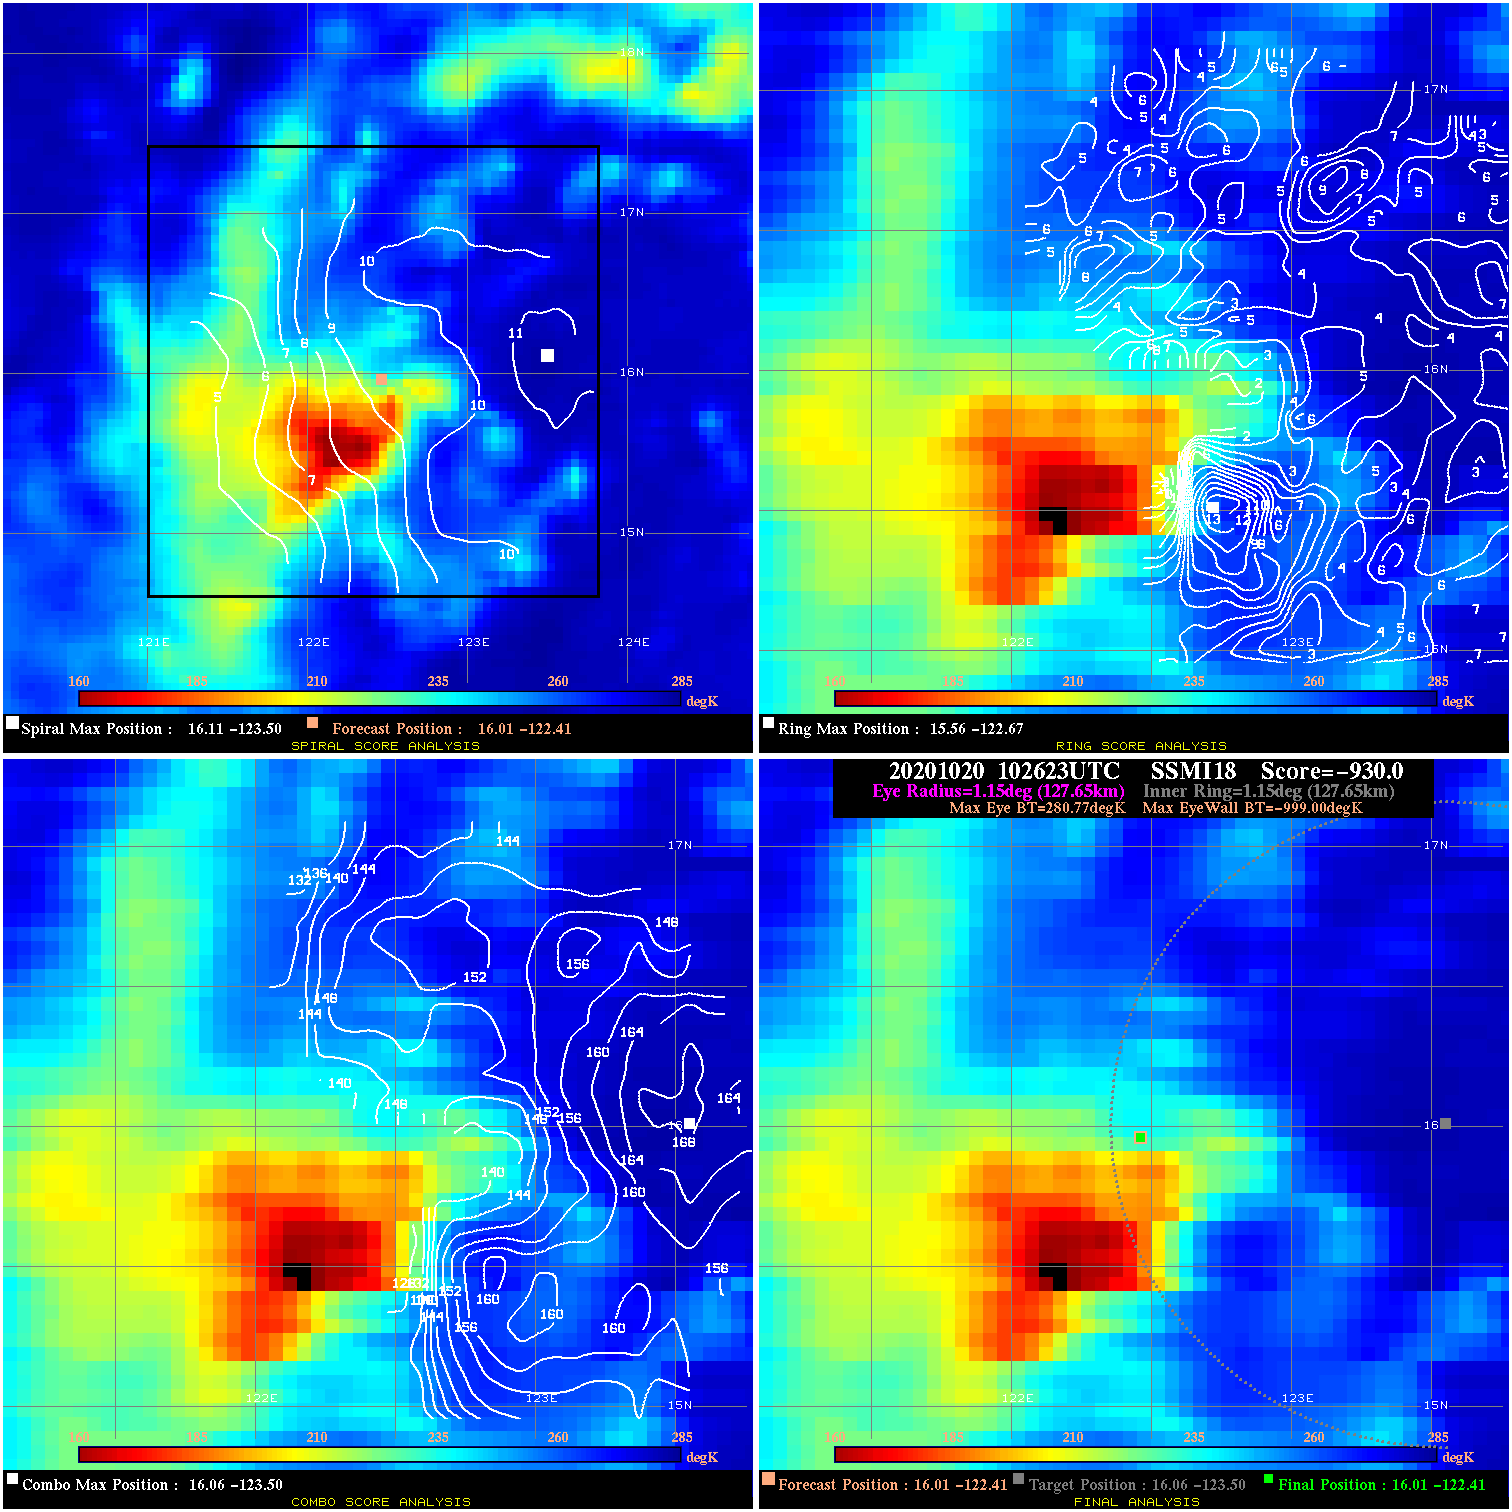
20201020 102623 -930.0 N/A N/A N/A 0.00 40.0 SSMI18 16.0 -122.4 16.0 -122.4 16.1 -123.5 Analysis Plot
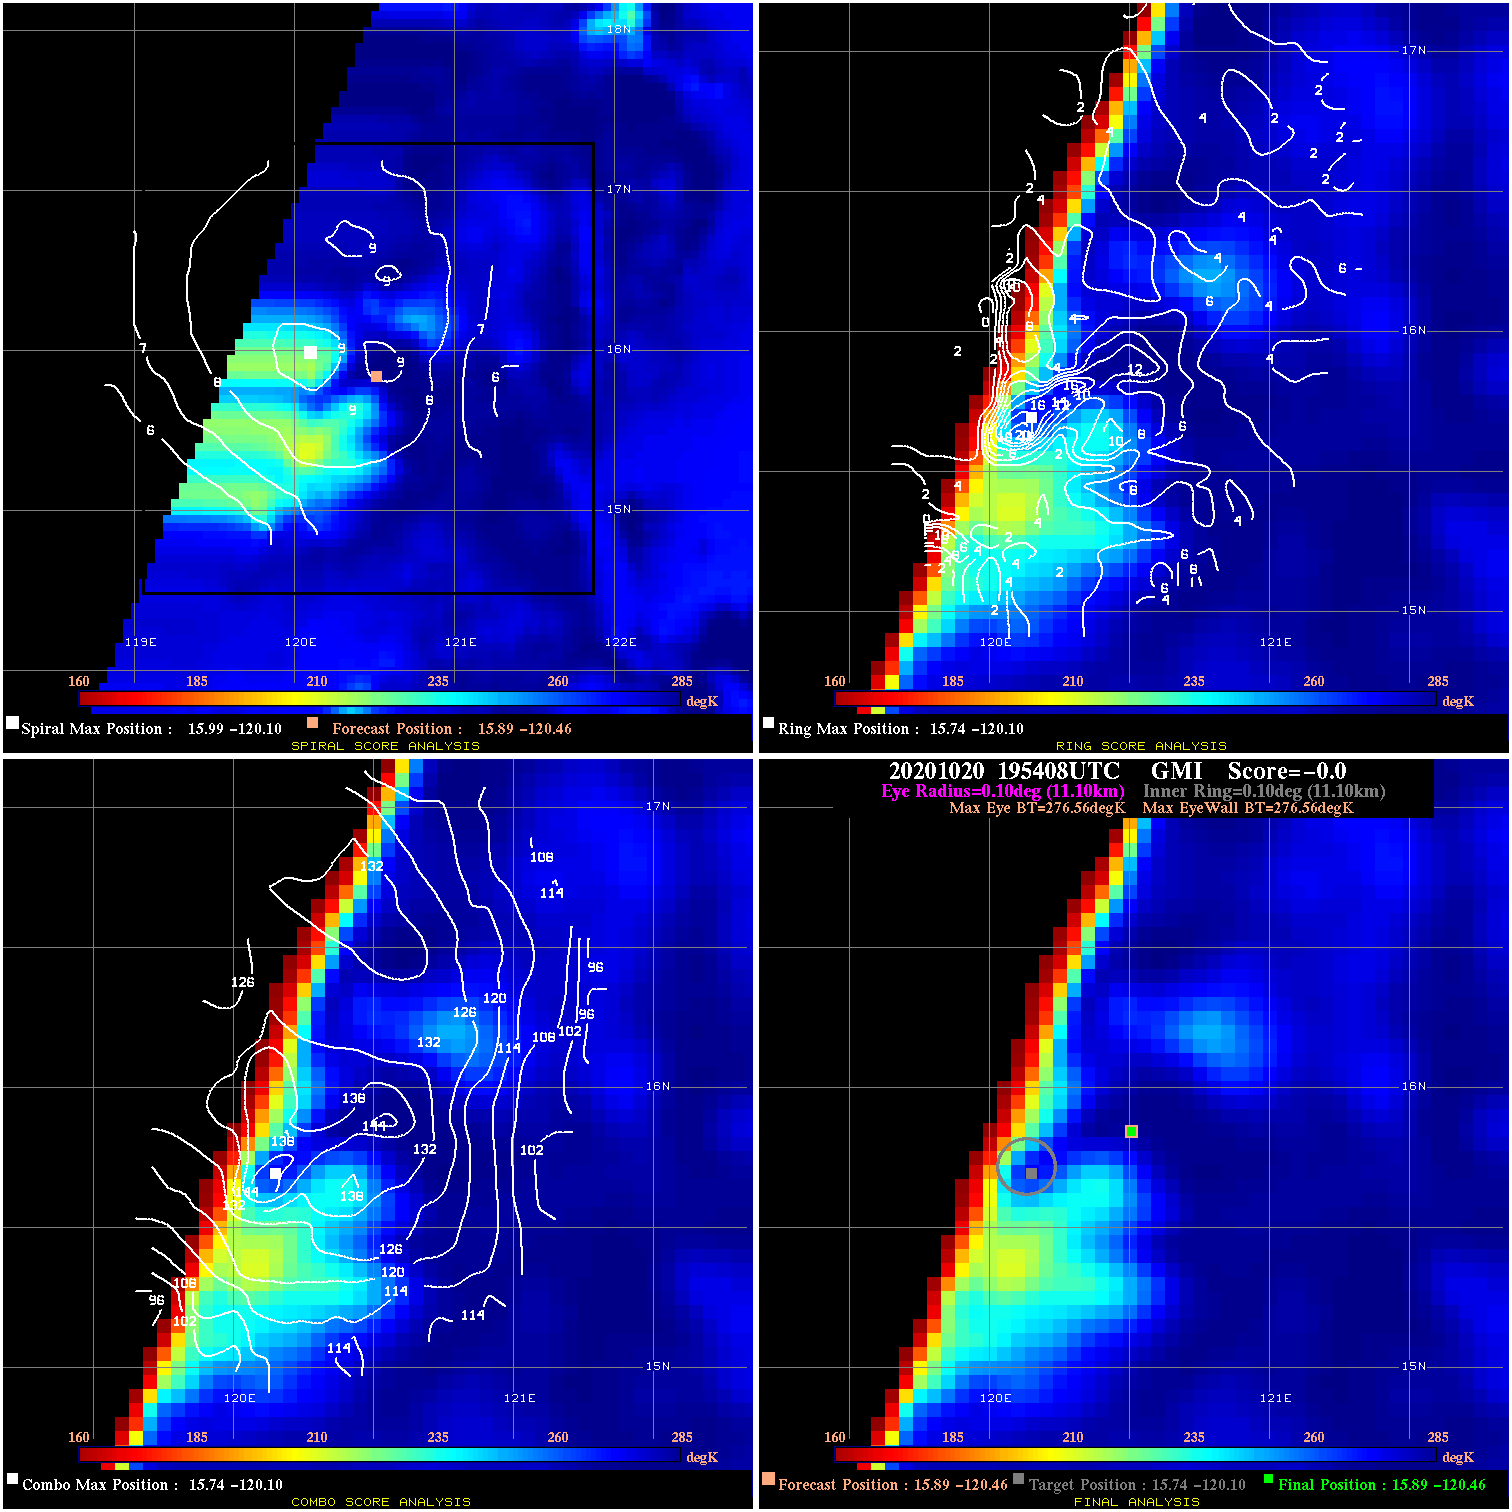
20201020 195408 N/A N/A N/A N/A N/A 45.0 GMI 15.9 -120.5 15.9 -120.5 15.7 -120.1 Analysis Plot
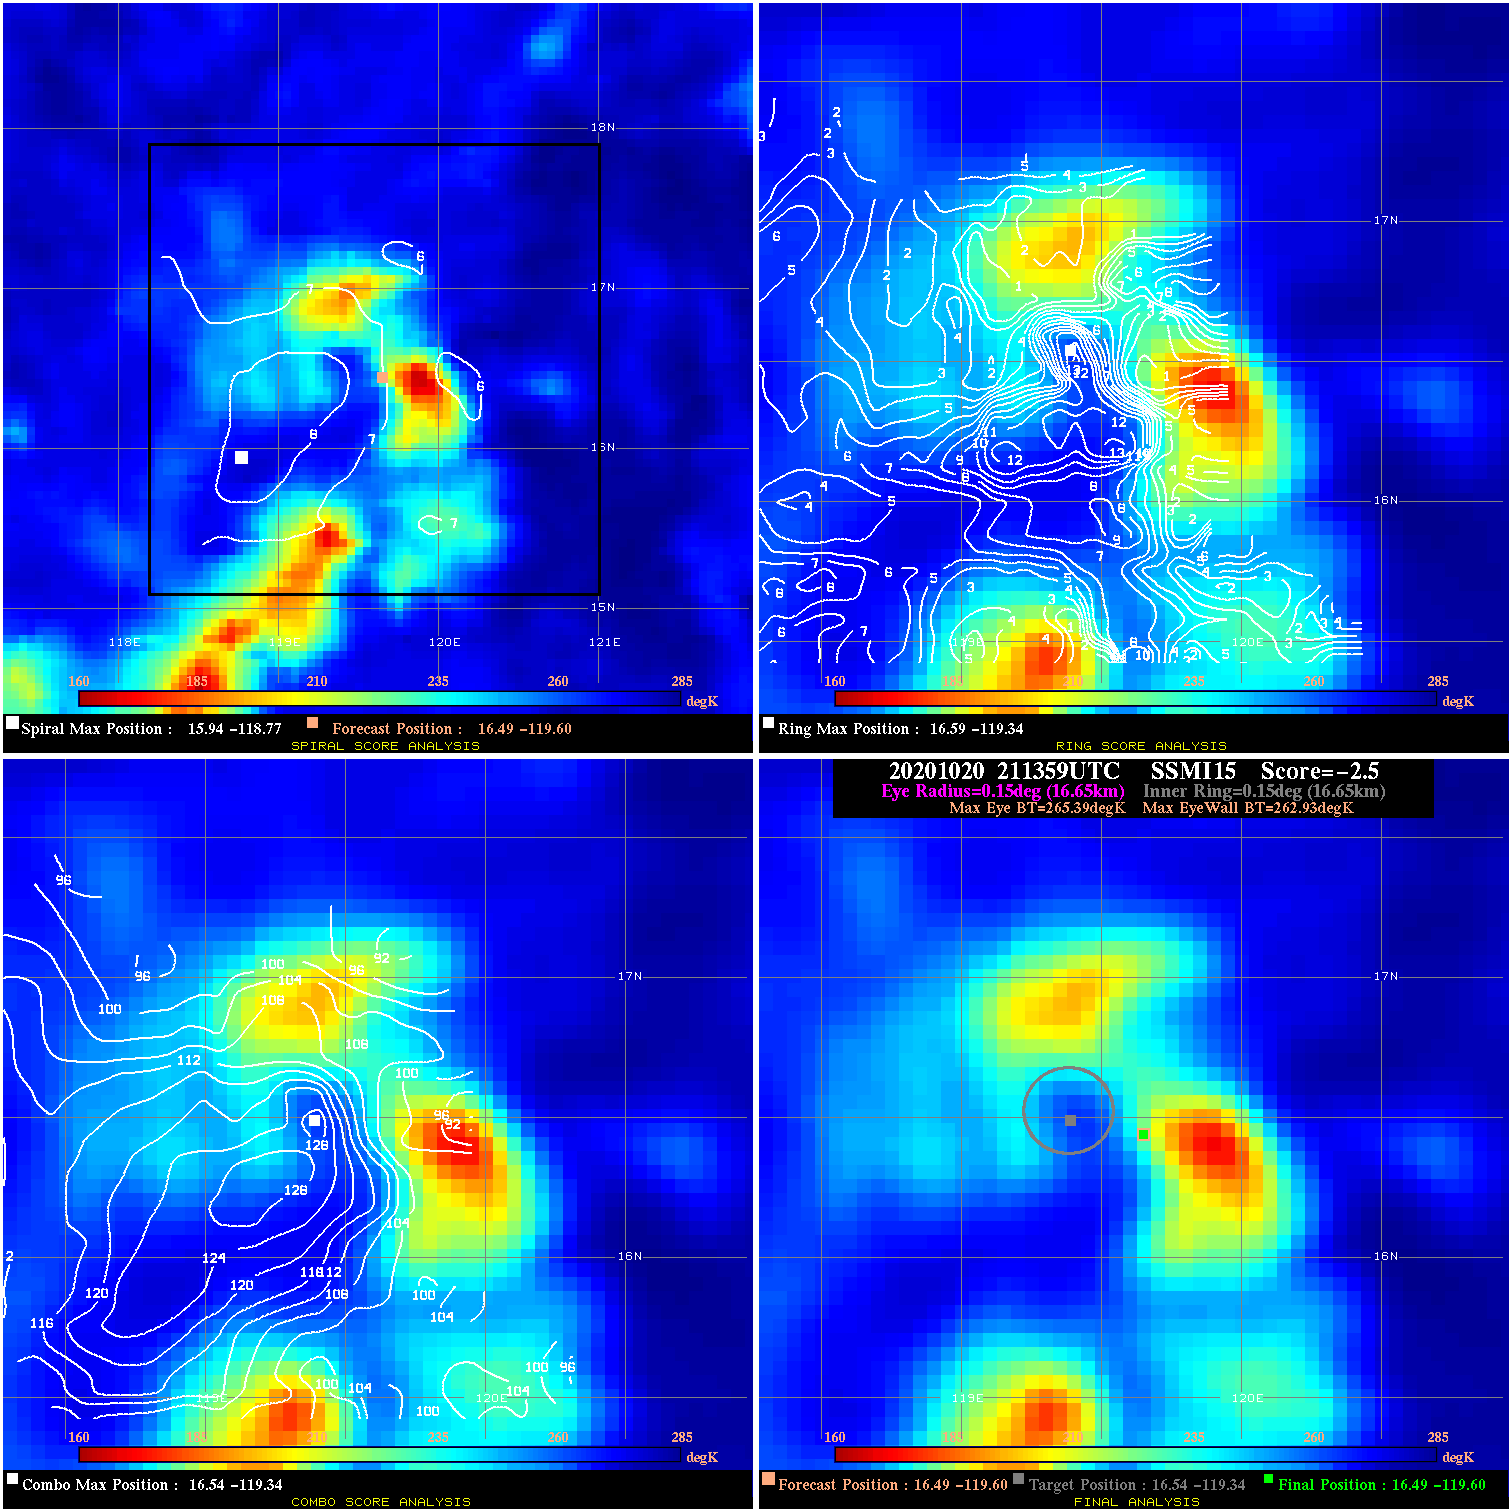
20201020 211359 -2.5 N/A N/A 33.33 2.46 40.0 SSMI15 16.5 -119.6 16.5 -119.6 16.5 -119.3 Analysis Plot
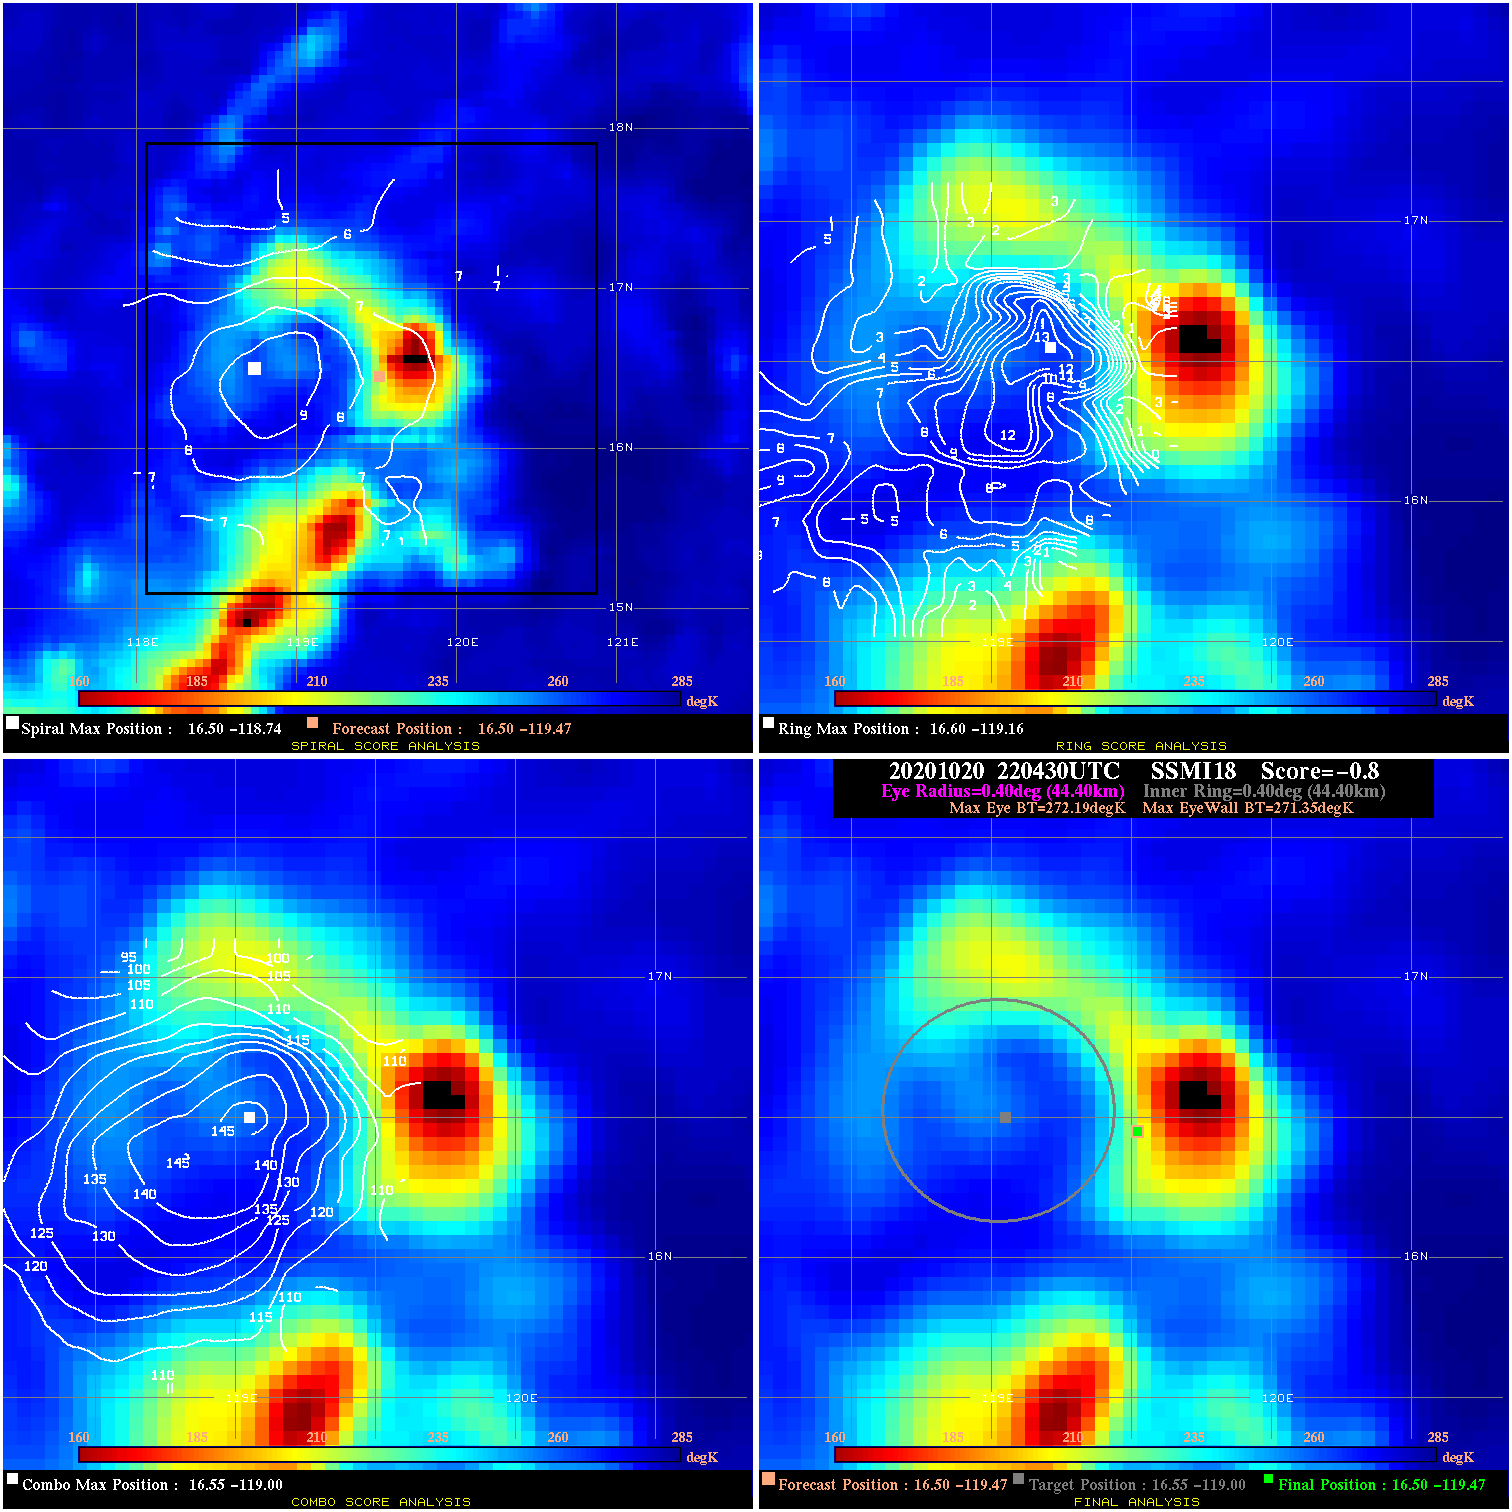
20201020 220430 -0.8 N/A 46.6% 88.88 .84 40.0 SSMI18 16.5 -119.5 16.5 -119.5 16.5 -119.0 Analysis Plot
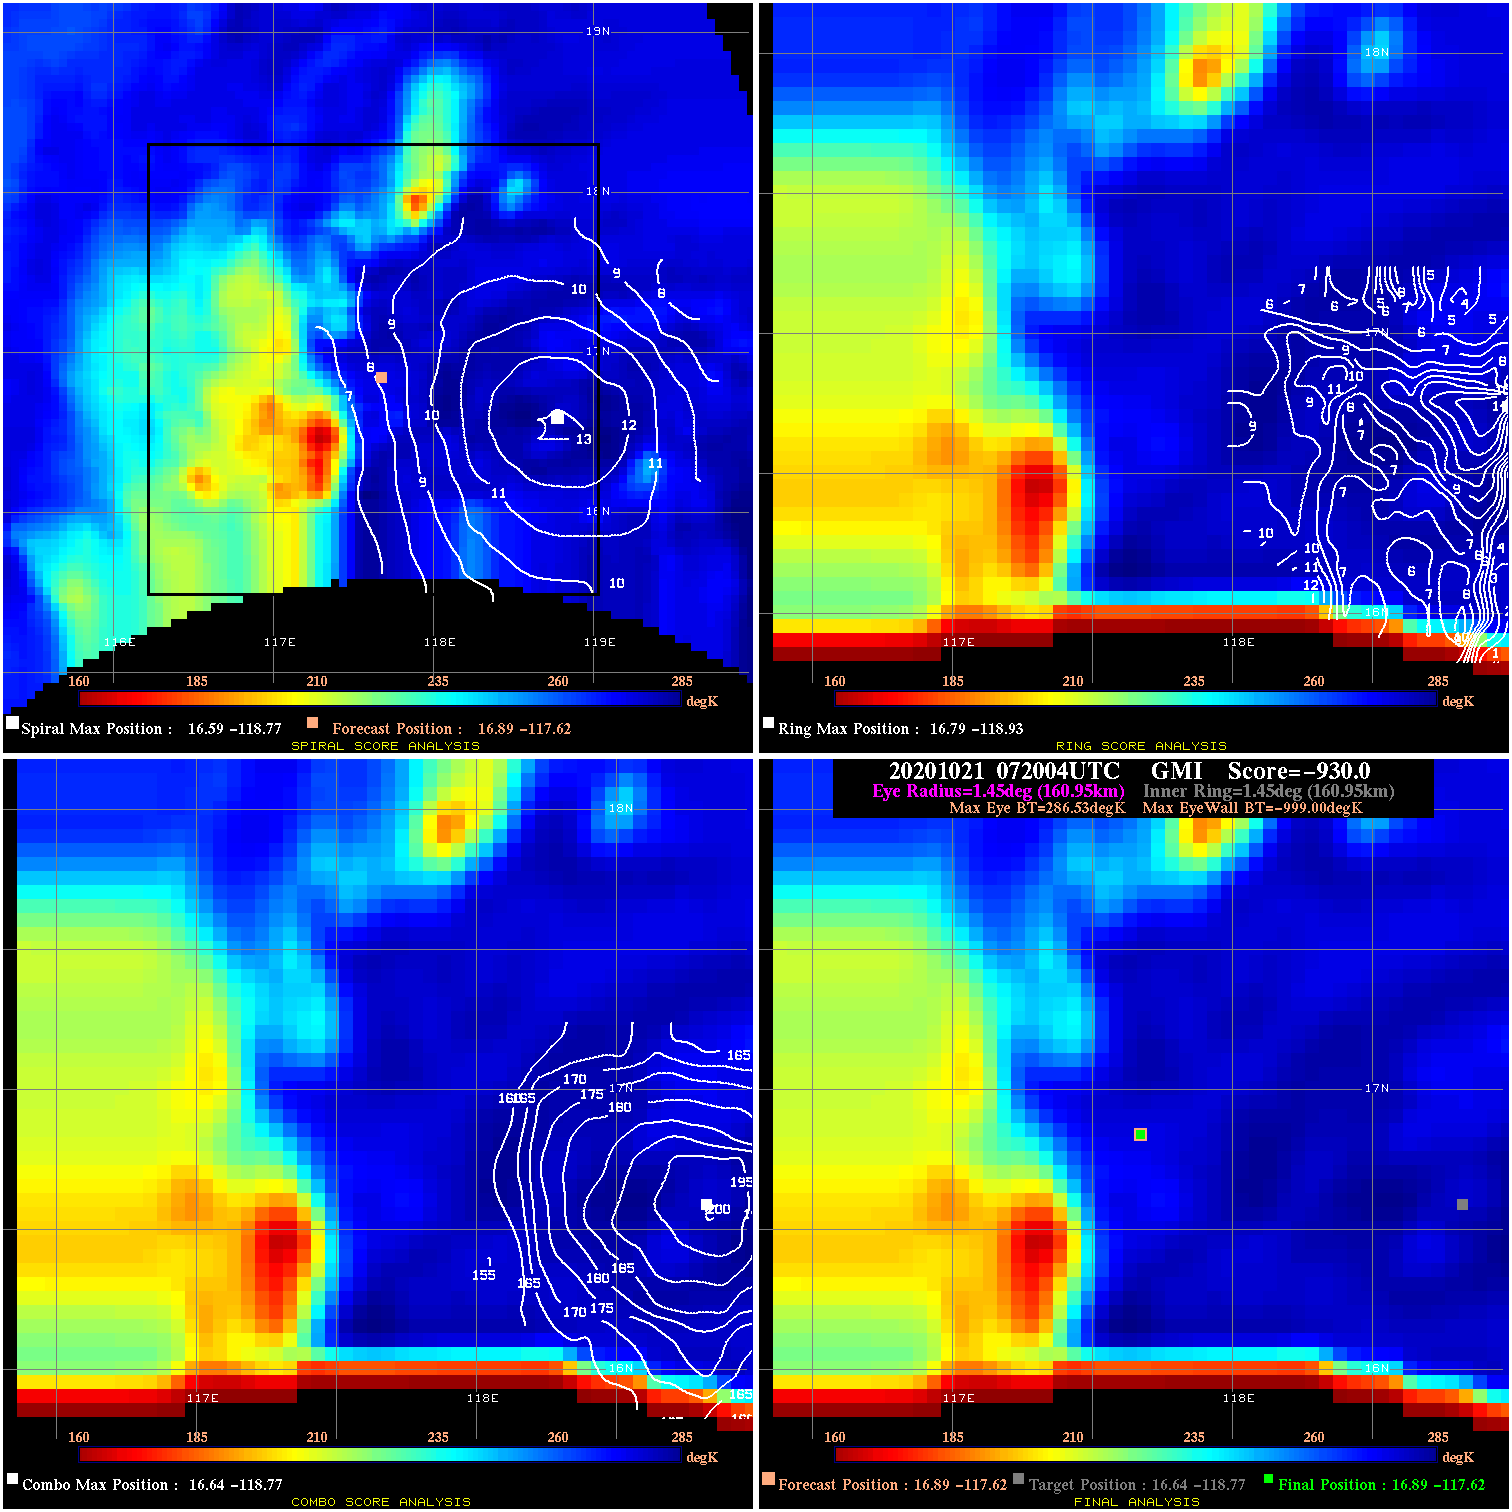
20201021 072004 -930.0 N/A N/A N/A 0.00 45.0 GMI 16.9 -117.6 16.9 -117.6 16.6 -118.8 Analysis Plot
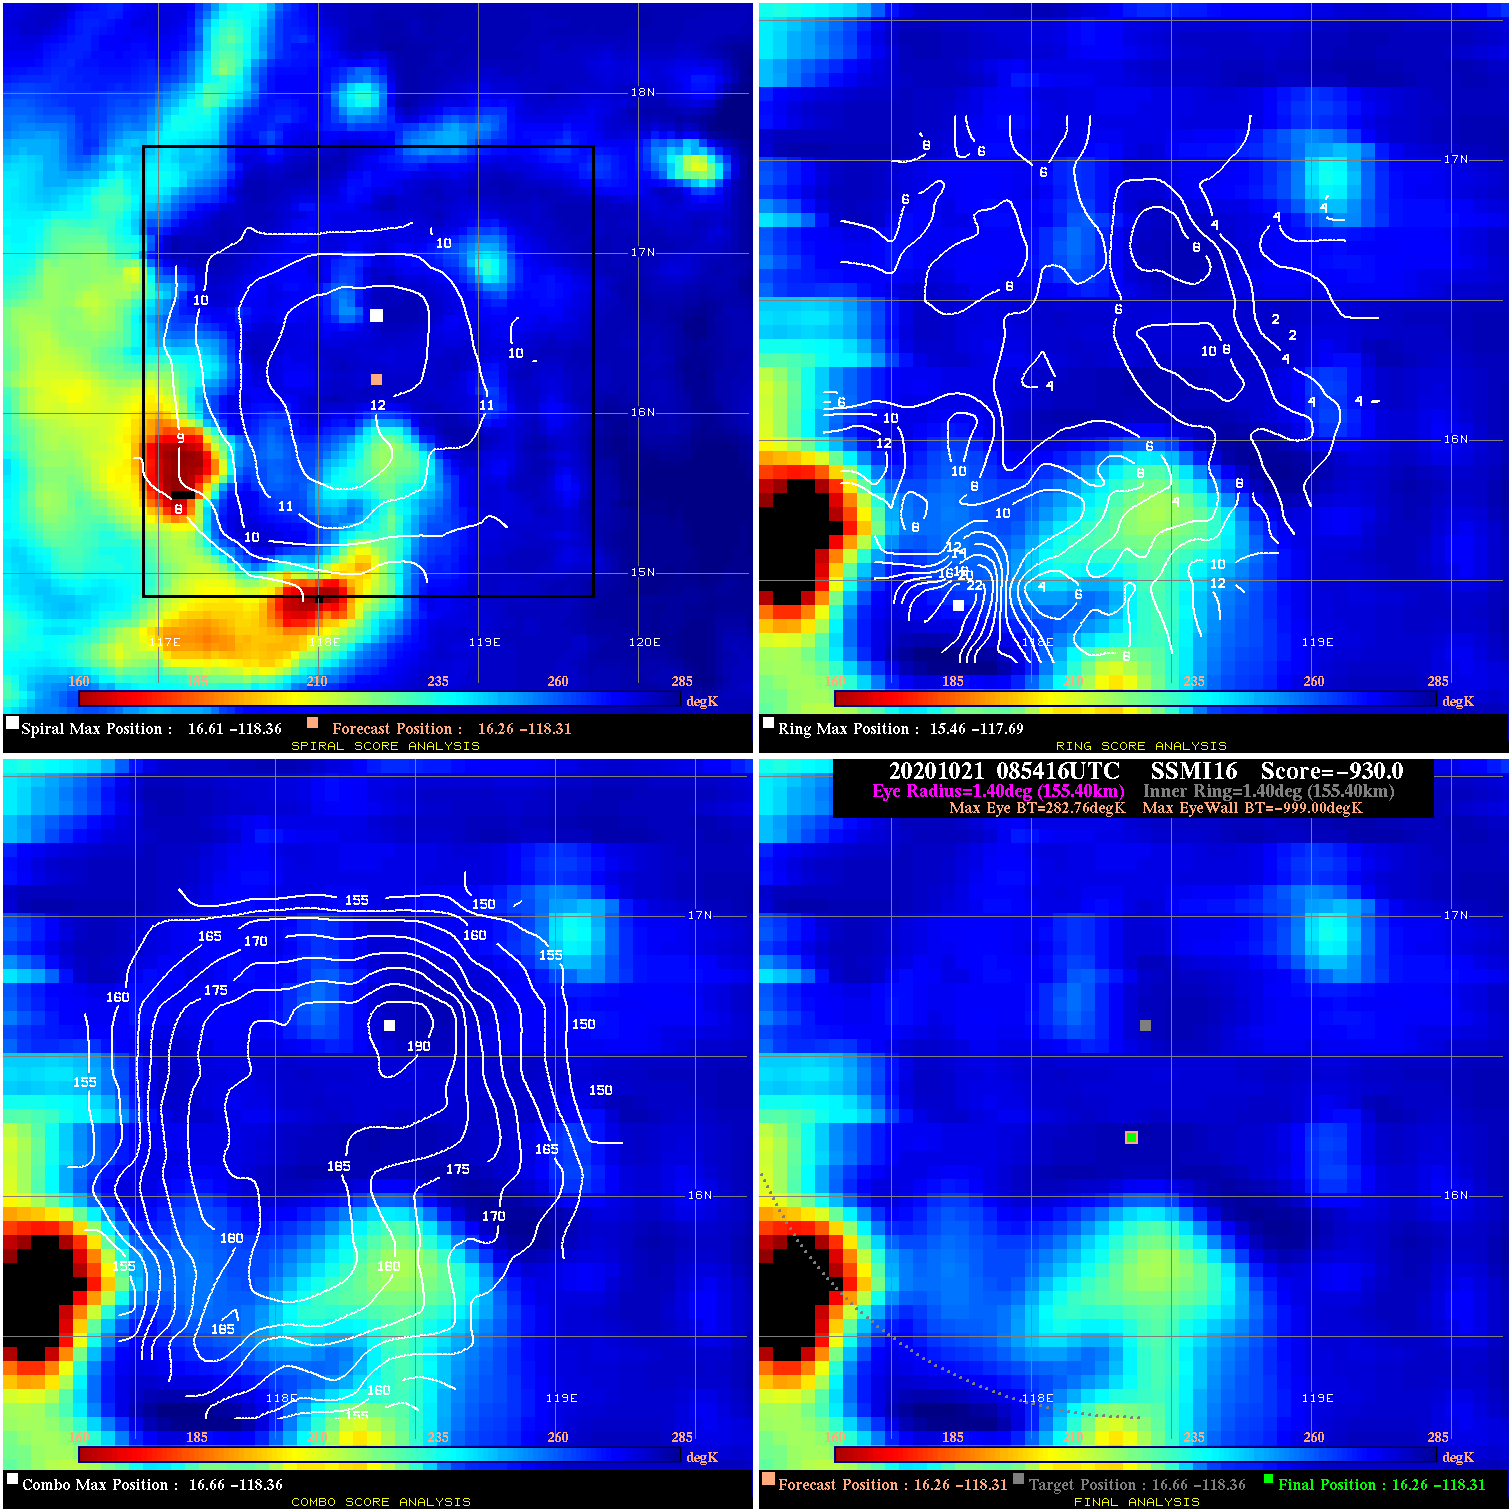
20201021 085416 -930.0 N/A N/A N/A 0.00 45.0 SSMI16 16.3 -118.3 16.3 -118.3 16.7 -118.4 Analysis Plot
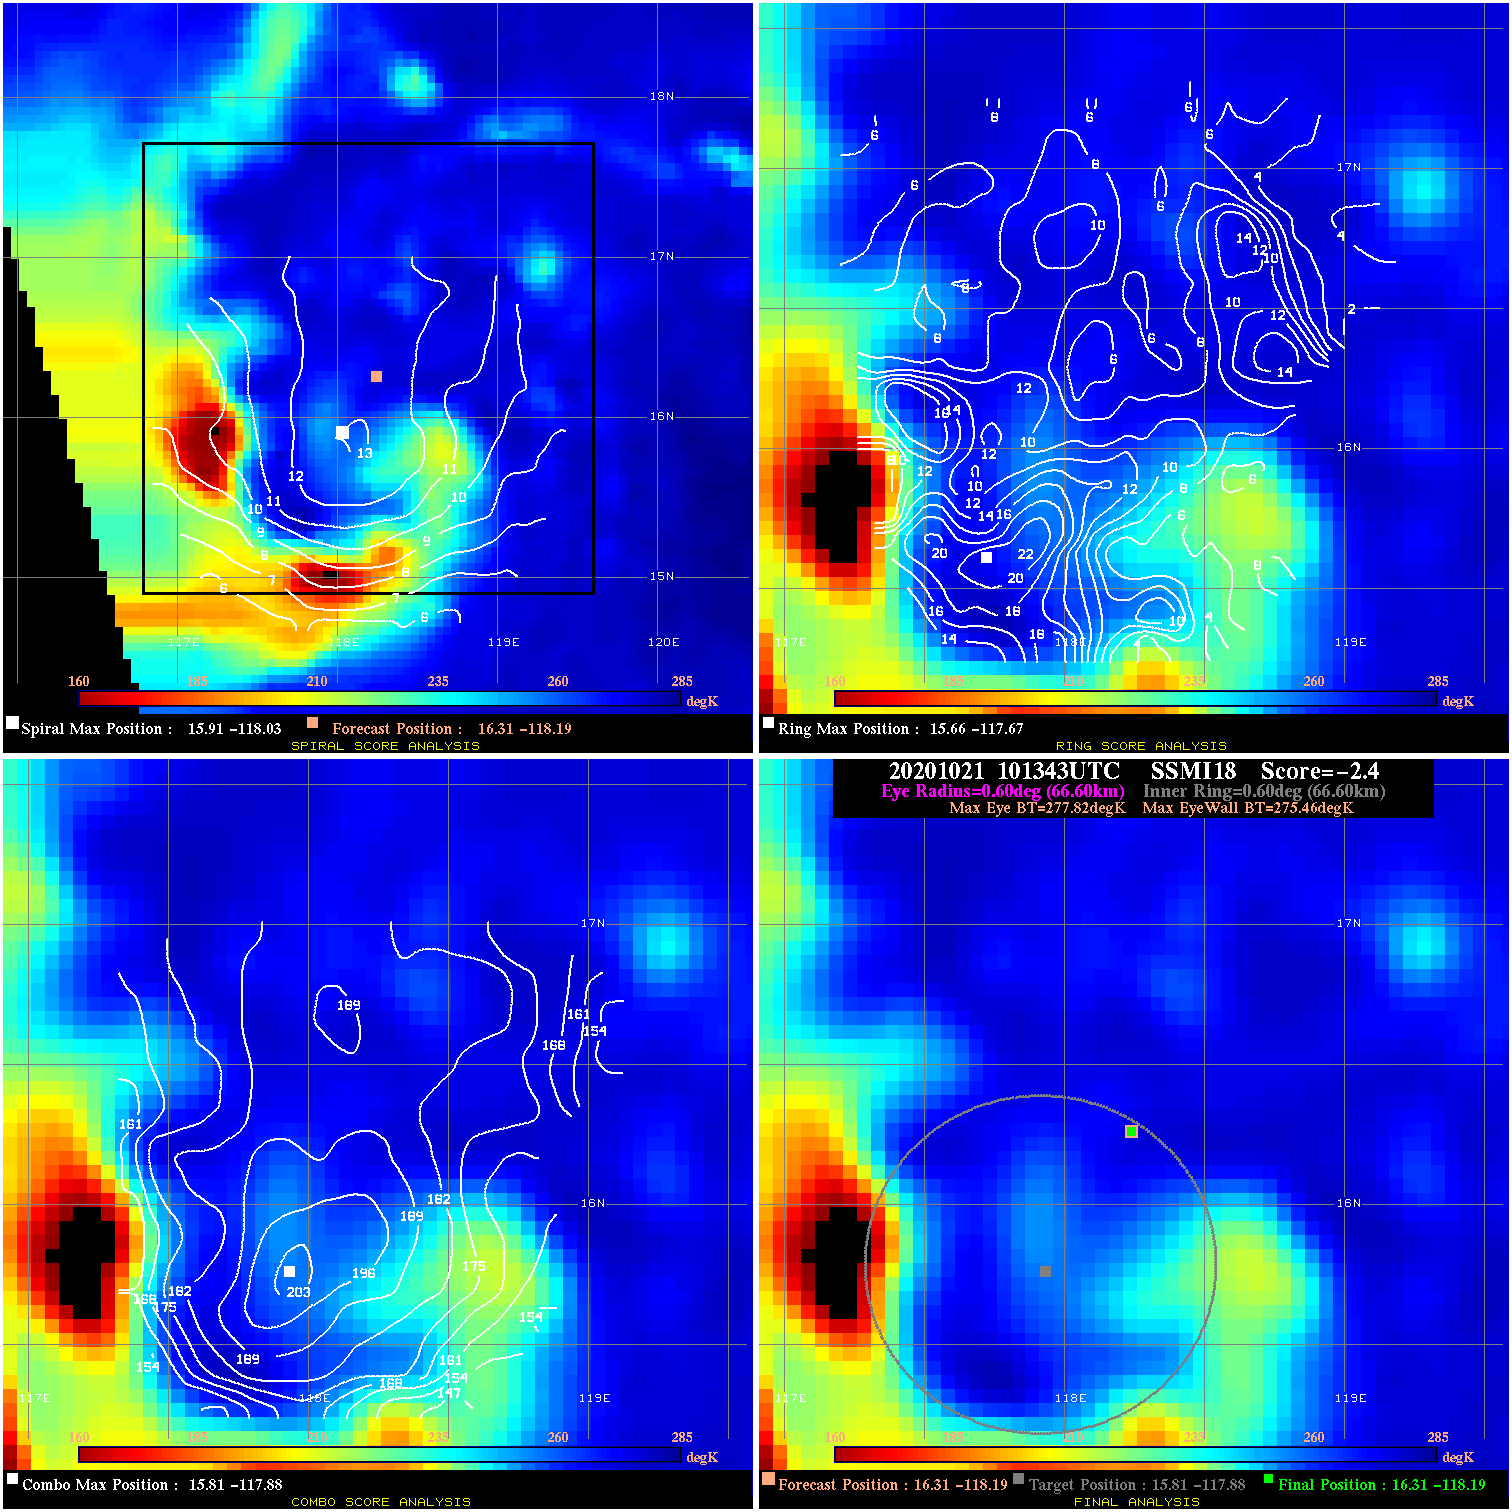
20201021 101343 -2.4 N/A 37.0% 133.32 2.36 45.0 SSMI18 16.3 -118.2 16.3 -118.2 15.8 -117.9 Analysis Plot
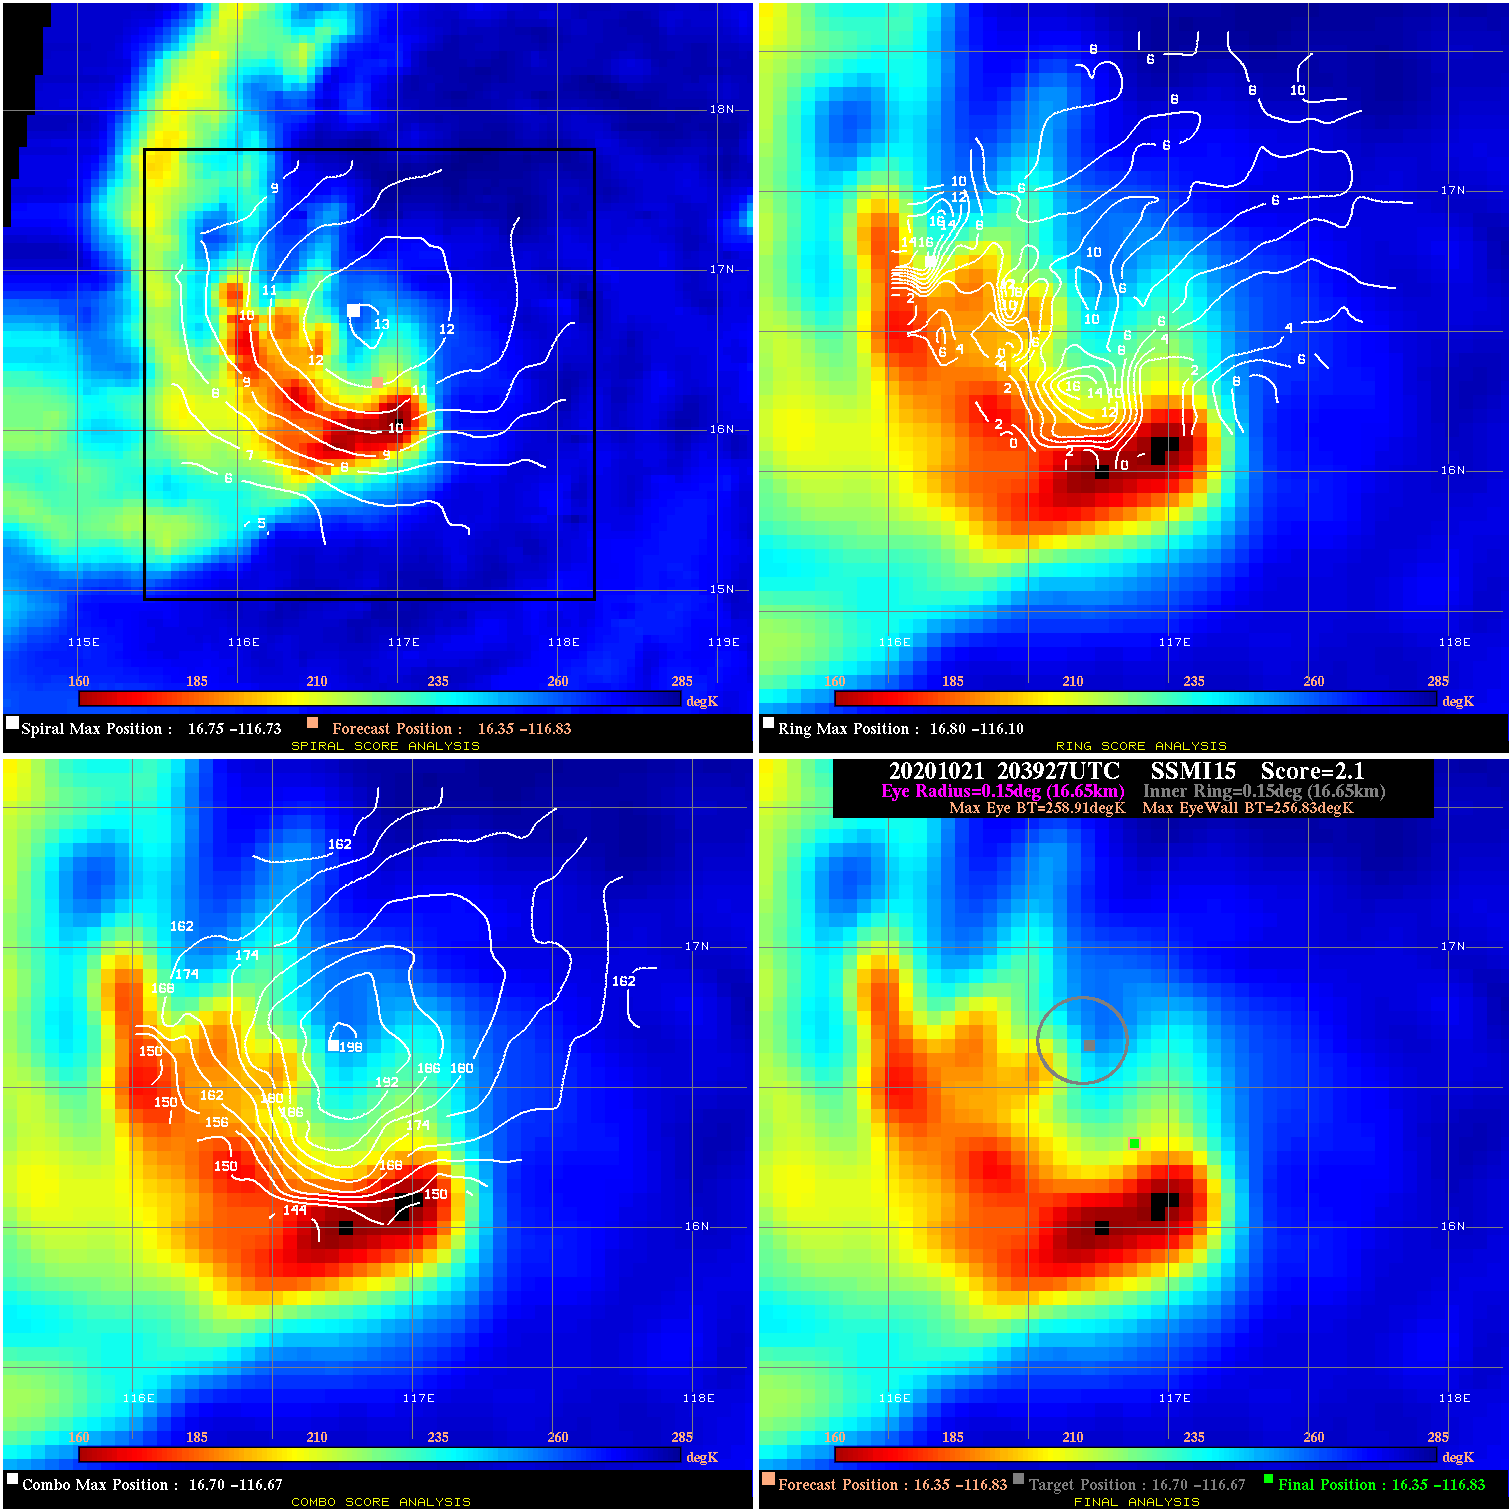
20201021 203927 2.1 N/A 26.0% 33.33 2.08 60.0 SSMI15 16.4 -116.8 16.4 -116.8 16.7 -116.7 Analysis Plot
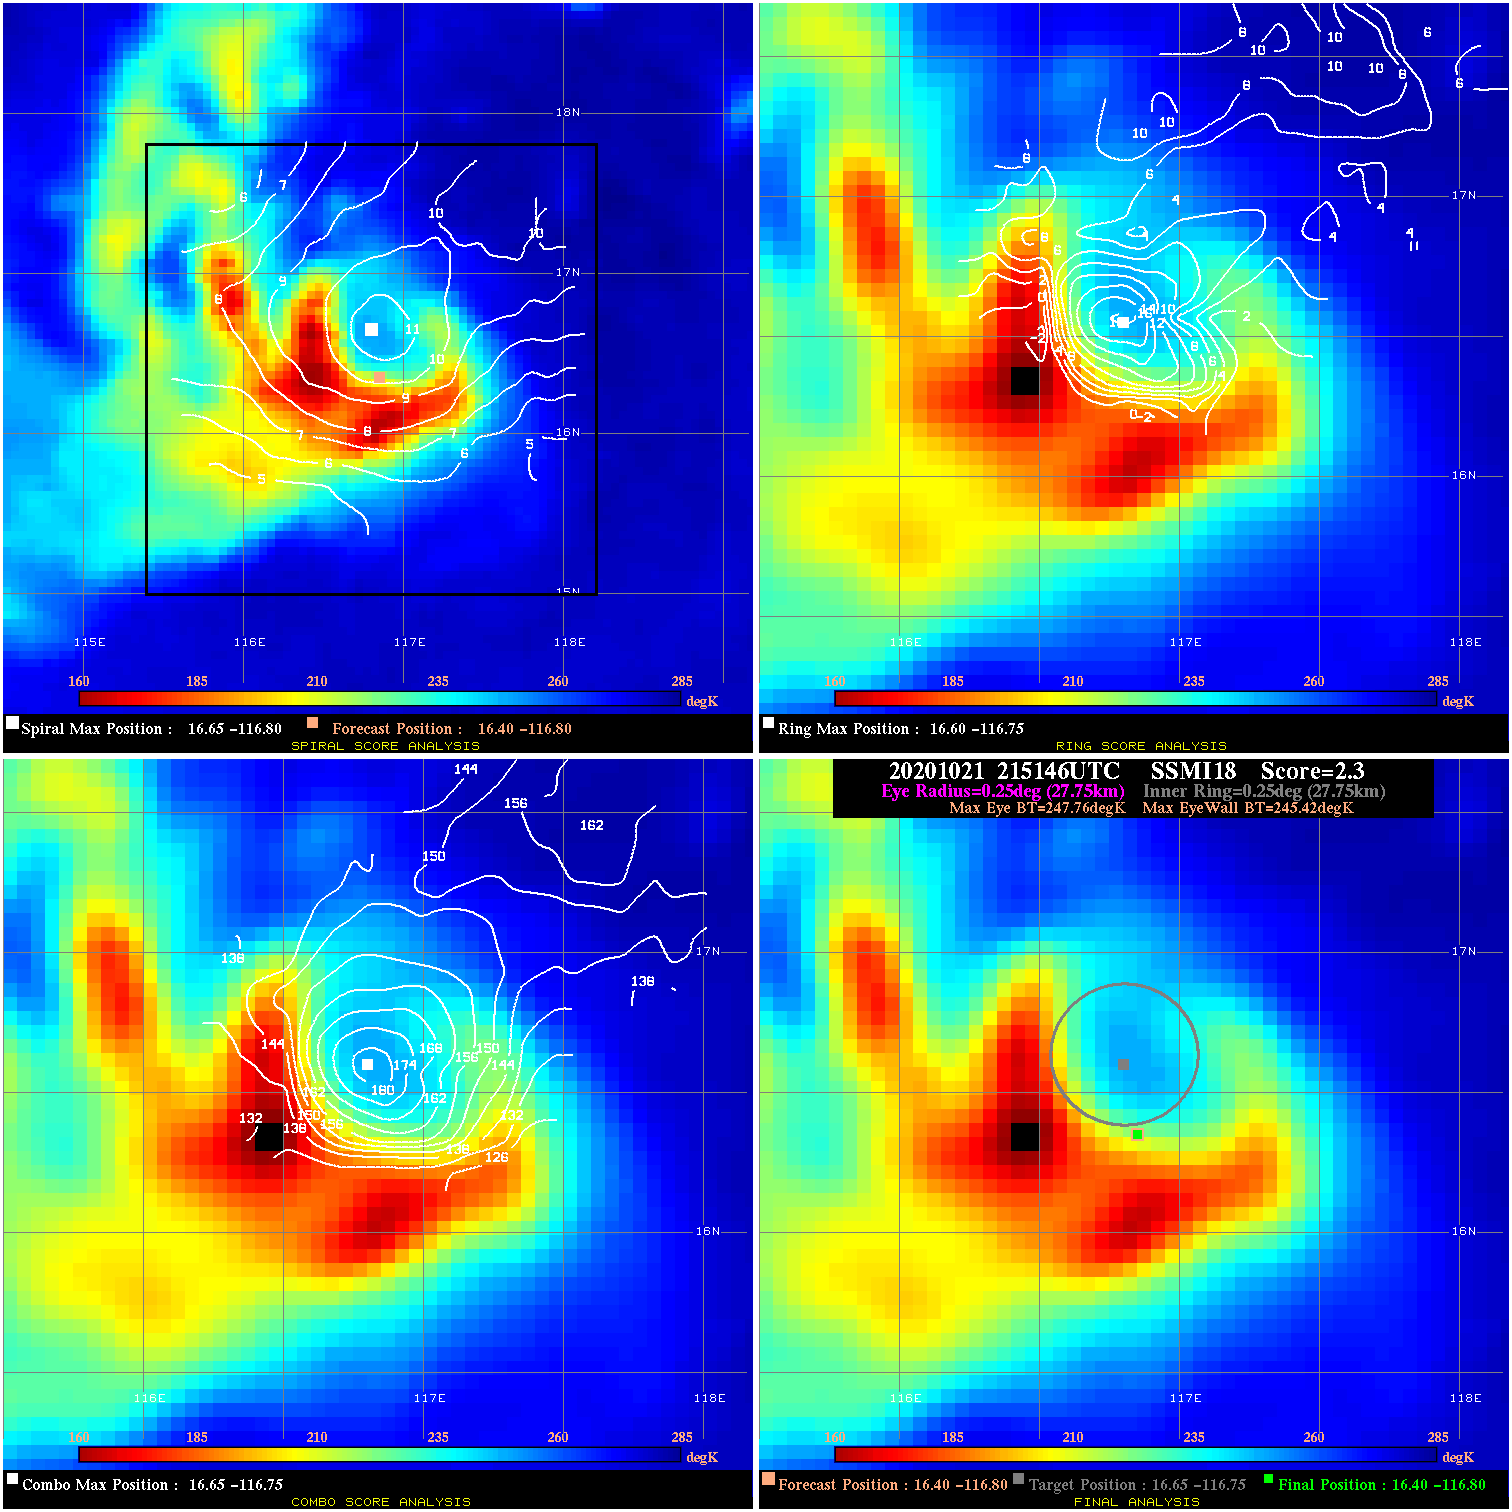
20201021 215146 2.3 N/A 45.2% 55.55 2.34 60.0 SSMI18 16.4 -116.8 16.4 -116.8 16.6 -116.8 Analysis Plot
20201021 221100 11.4 N/A 80.8% 66.66 11.39 60.0 SSMI16 16.4 -116.8 16.4 -116.8 16.6 -116.7 Analysis Plot
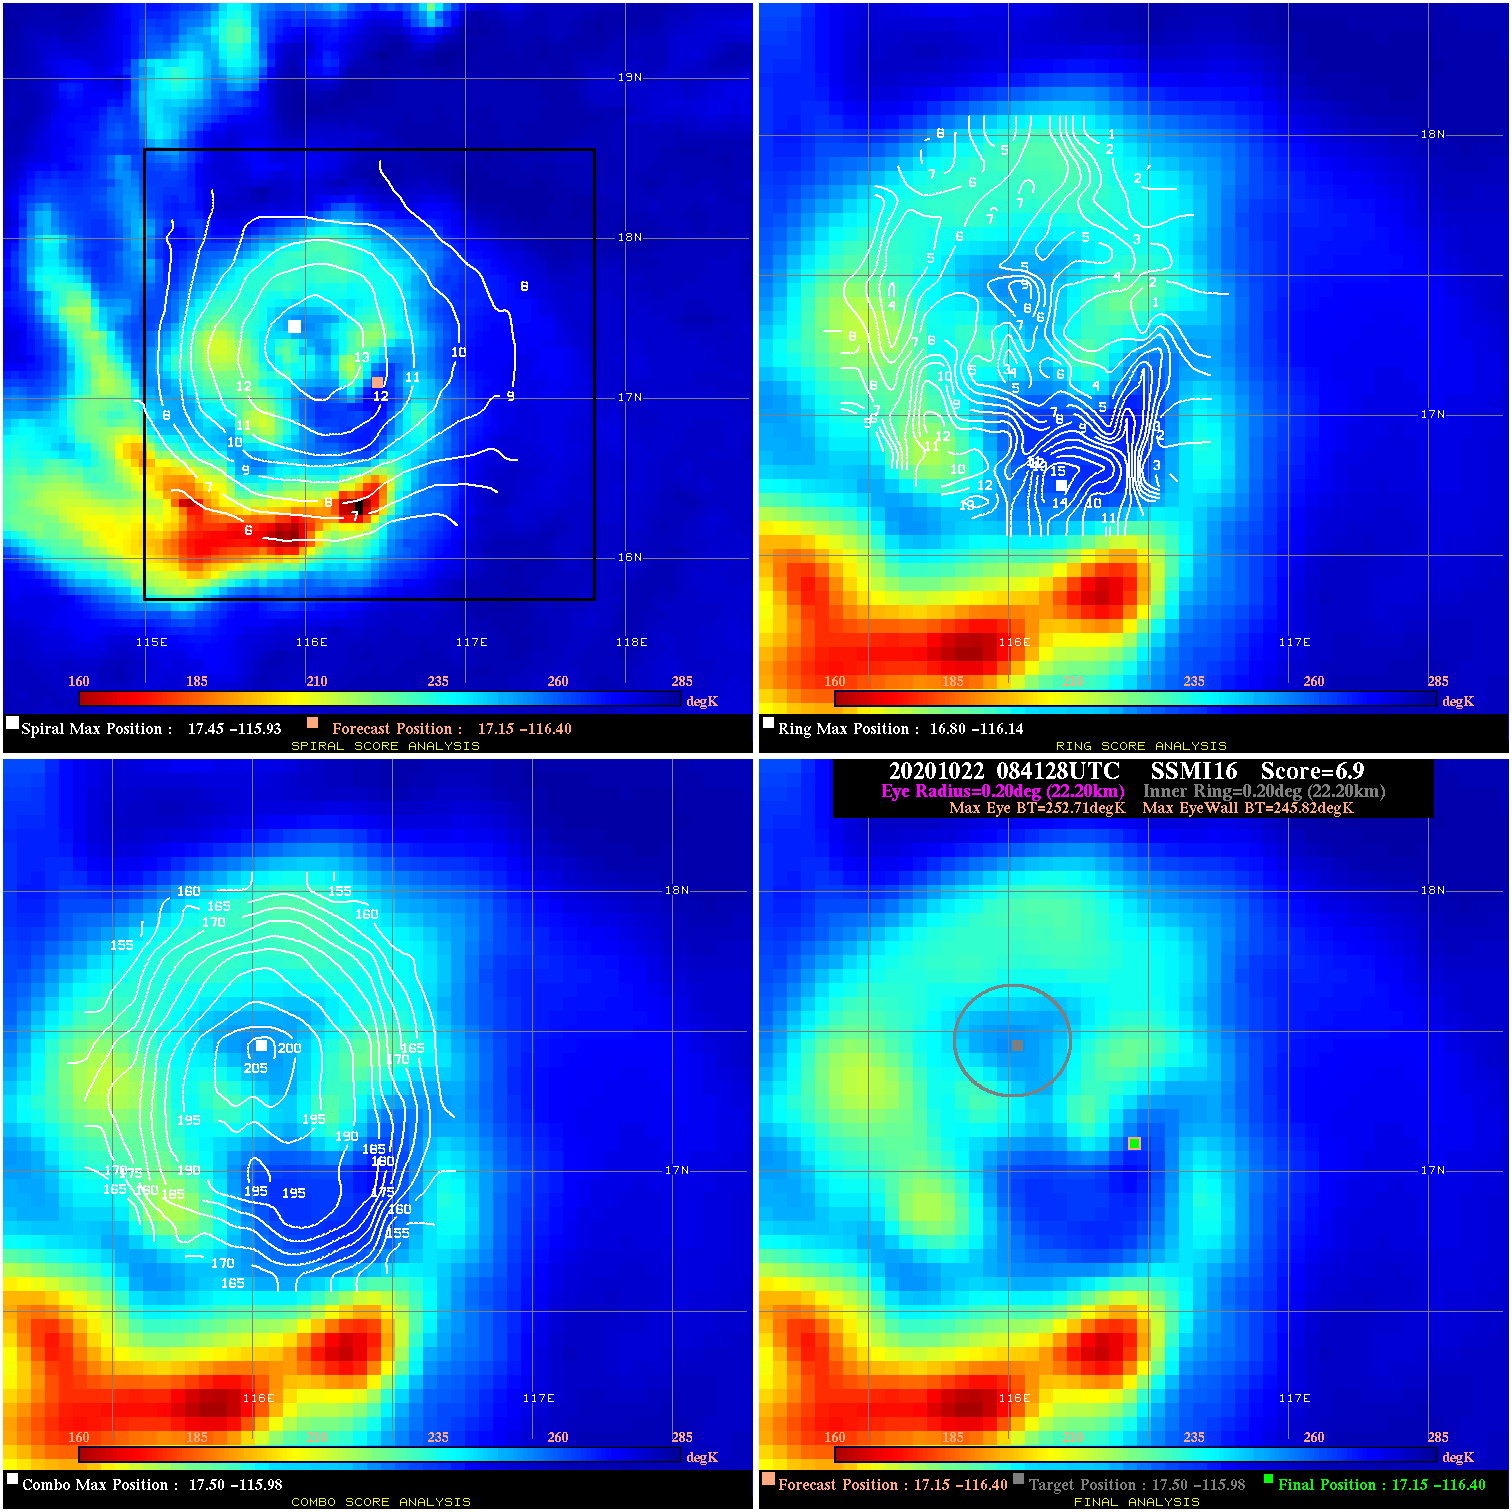
20201022 084128 6.9 N/A 37.0% 44.44 6.89 65.0 SSMI16 17.1 -116.4 17.1 -116.4 17.5 -116.0 Analysis Plot
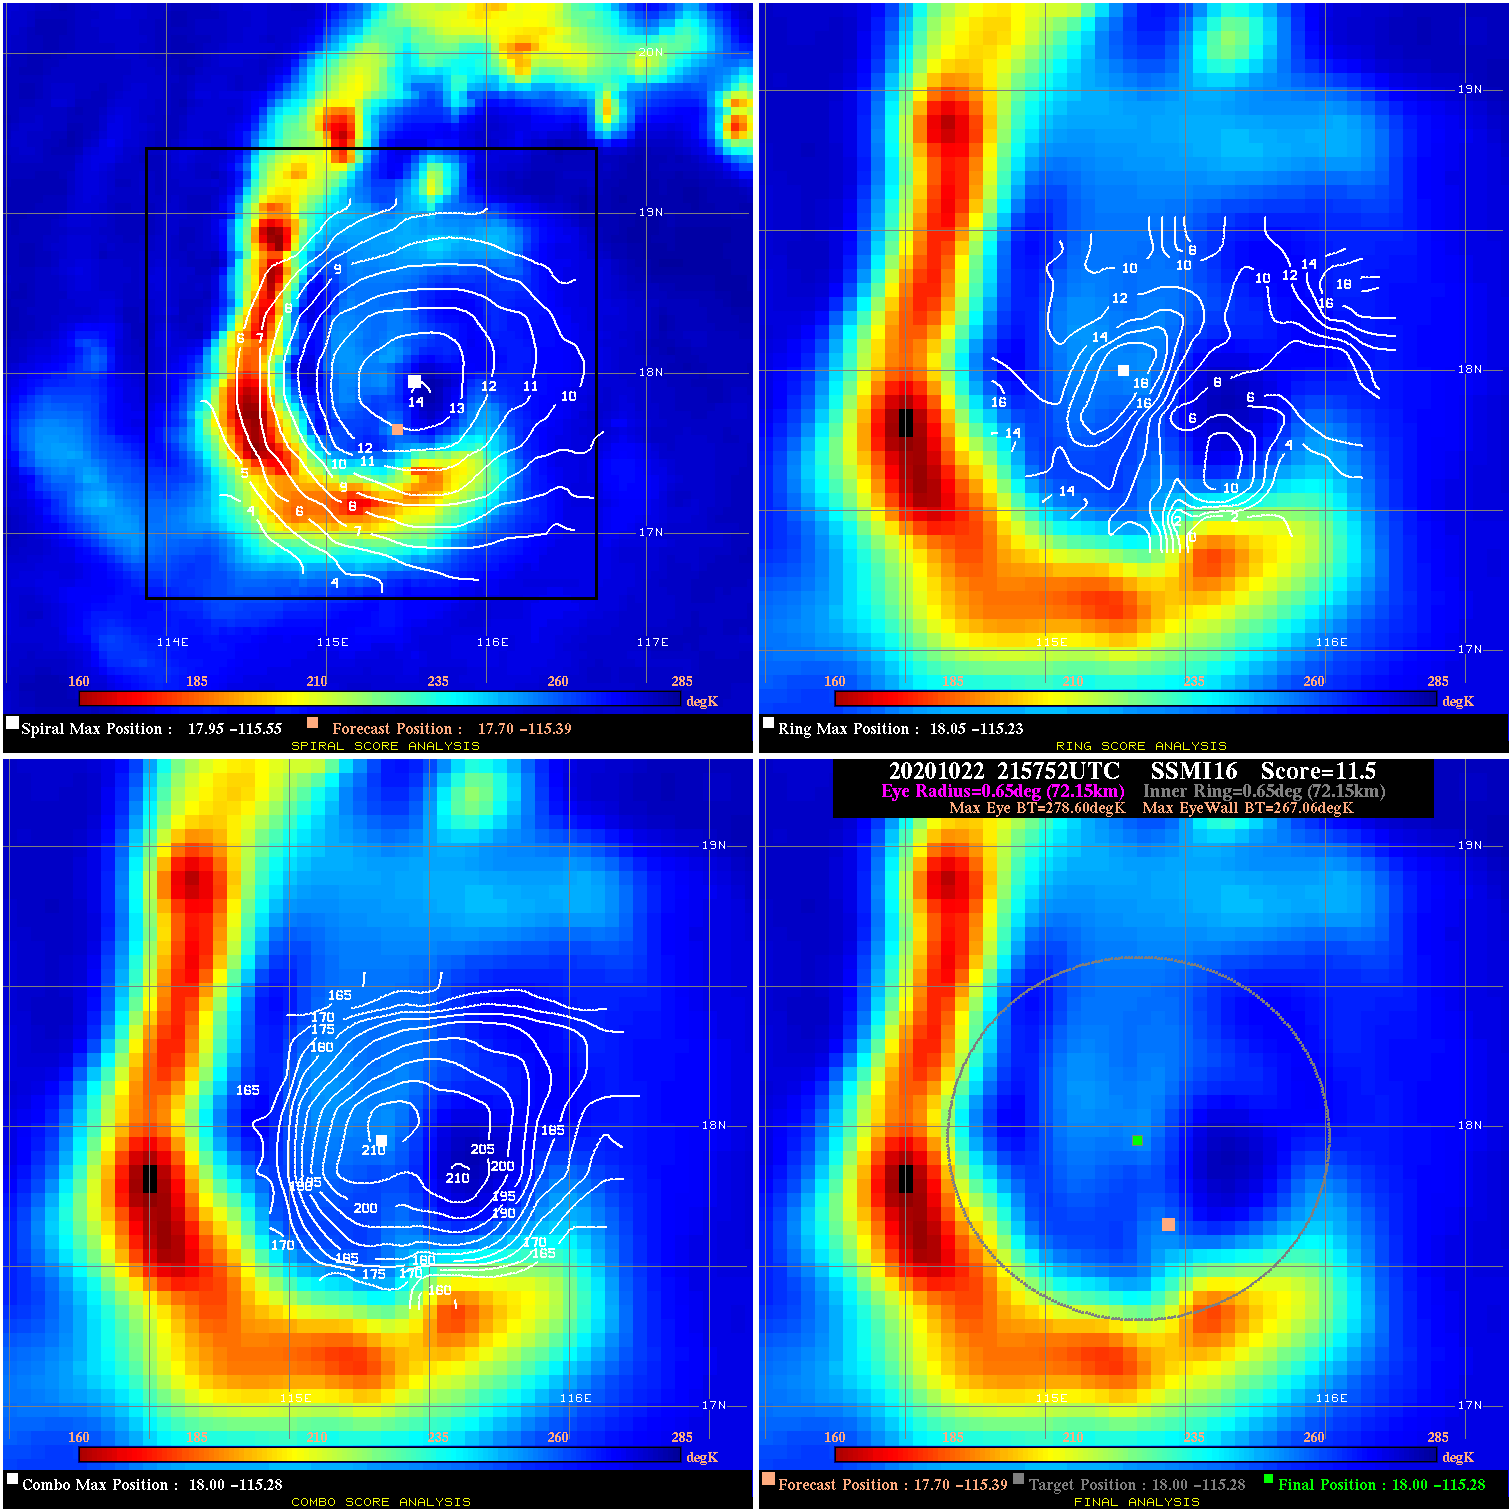
20201022 215752 11.5 N/A 52.1% 144.43 11.54 75.0 SSMI16 17.7 -115.4 18.0 -115.3 18.0 -115.3 Analysis Plot
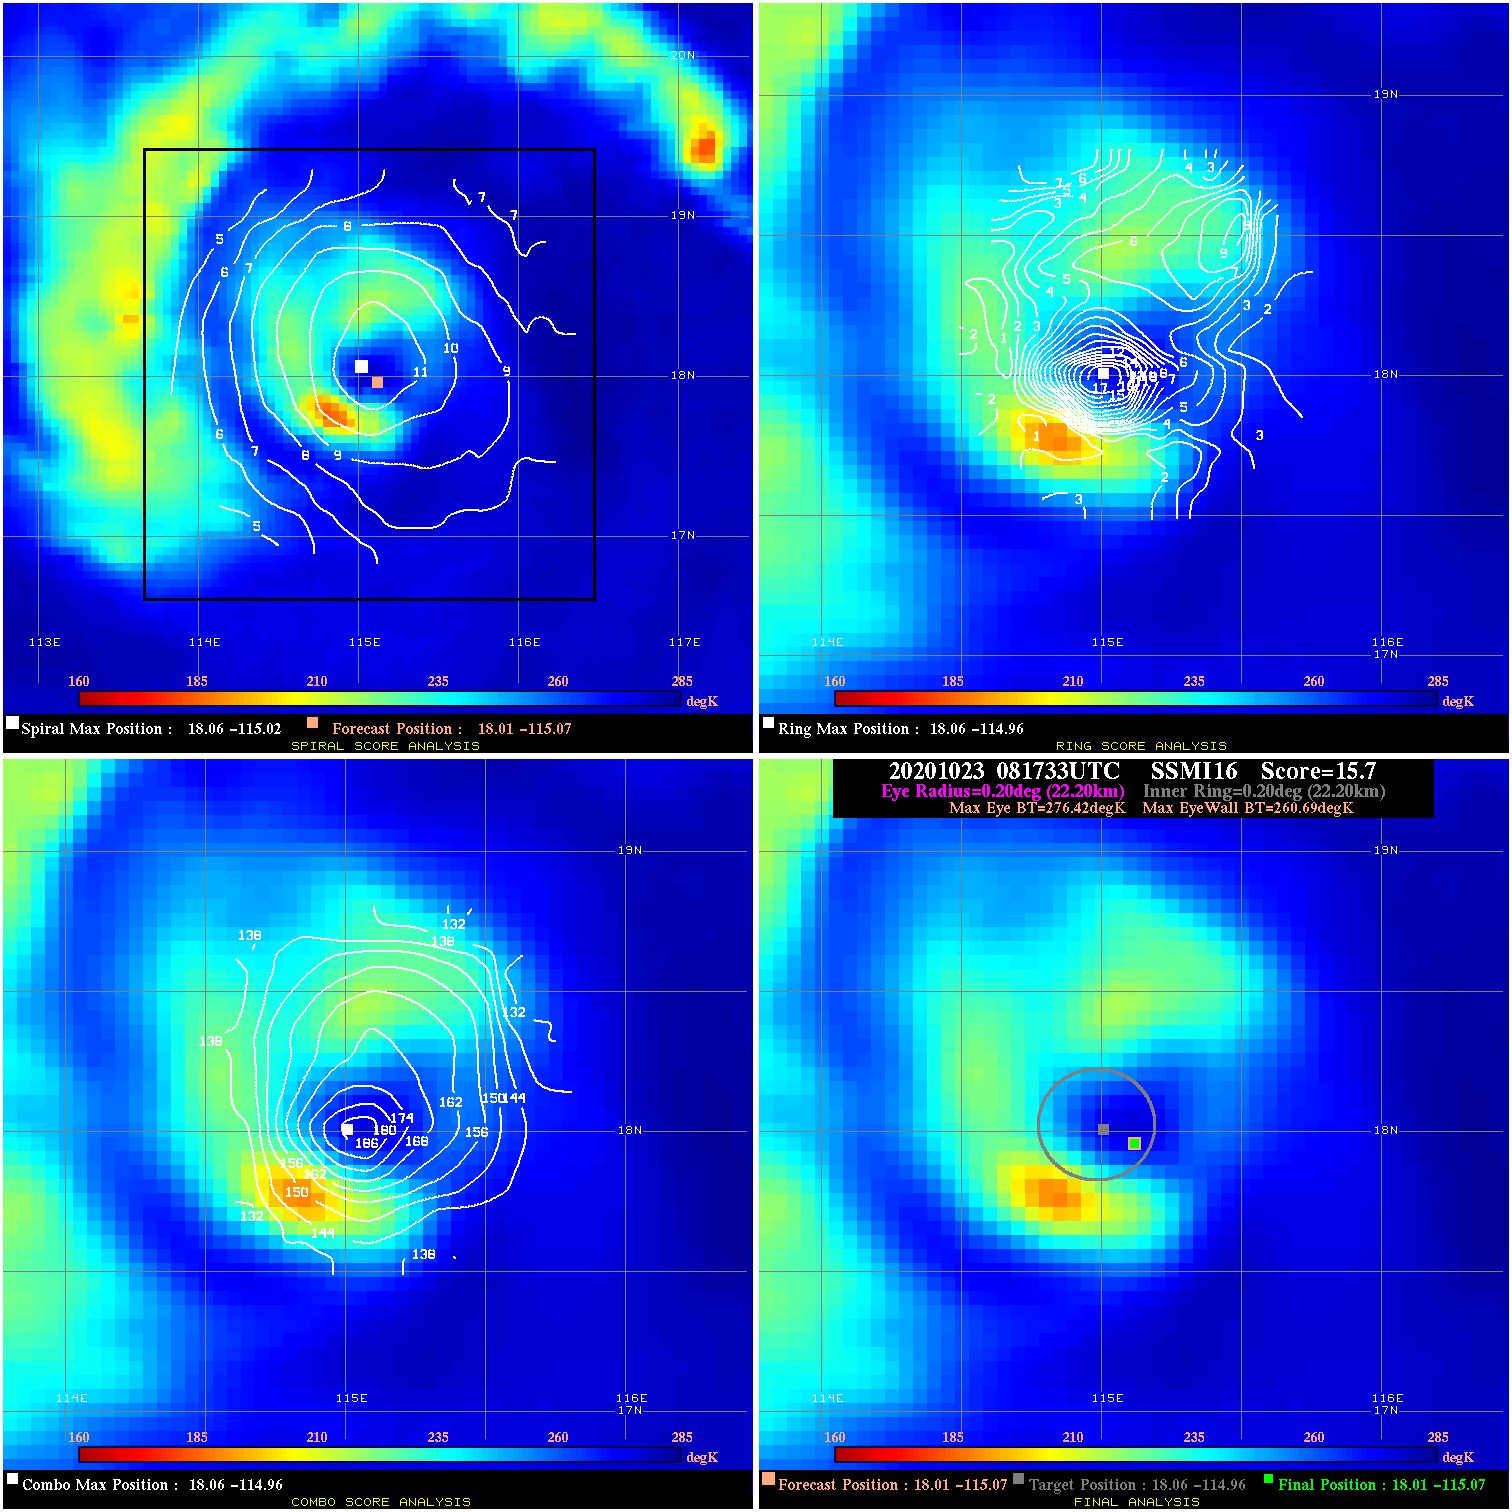
20201023 081733 15.7 N/A 54.8% 44.44 15.73 75.0 SSMI16 18.0 -115.1 18.0 -115.1 18.1 -115.0 Analysis Plot
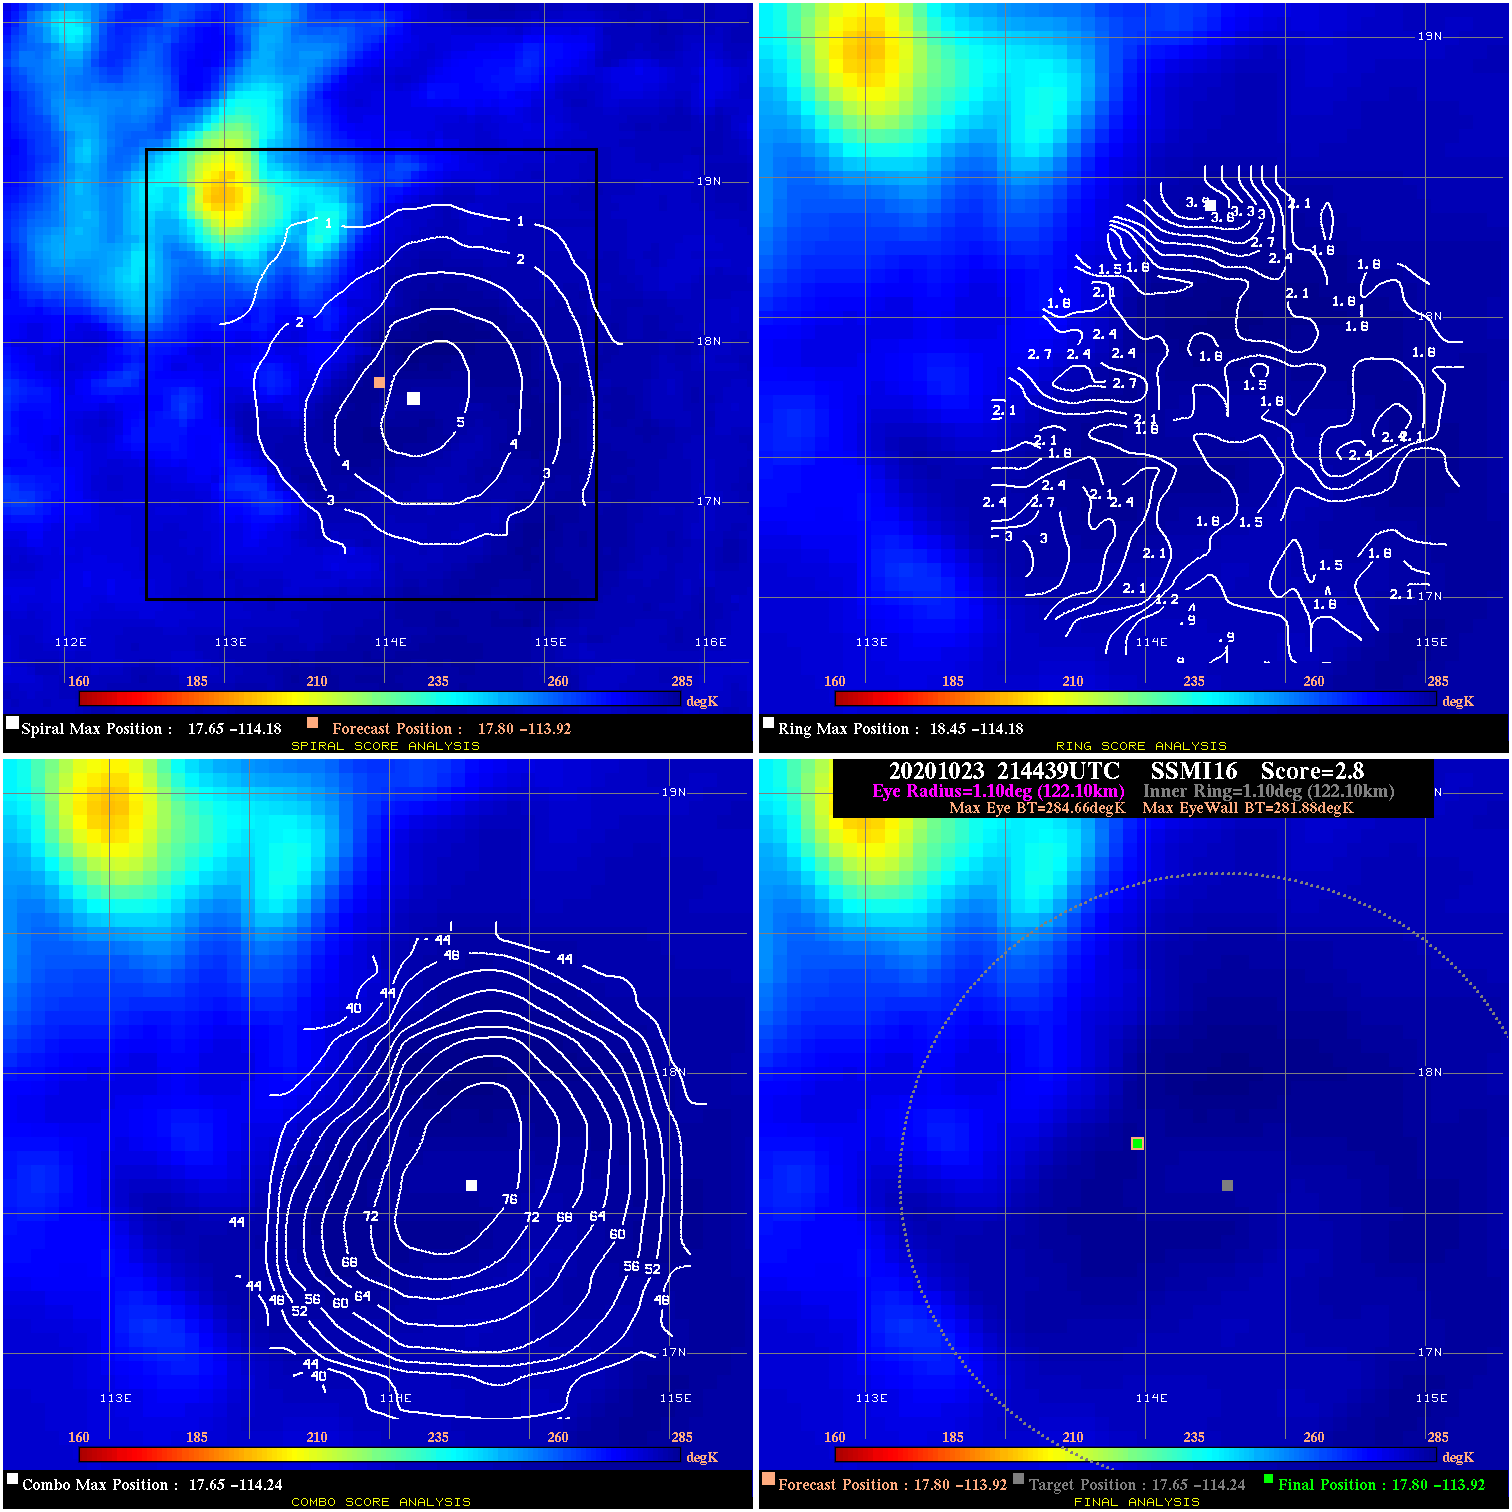
20201023 214439 2.8 N/A N/A 244.42 2.78 65.0 SSMI16 17.8 -113.9 17.8 -113.9 17.6 -114.2 Analysis Plot
20201024 061540 -930.0 N/A N/A N/A 0.00 55.0 GMI 17.7 -112.6 17.7 -112.6 17.7 -112.9 Analysis Plot
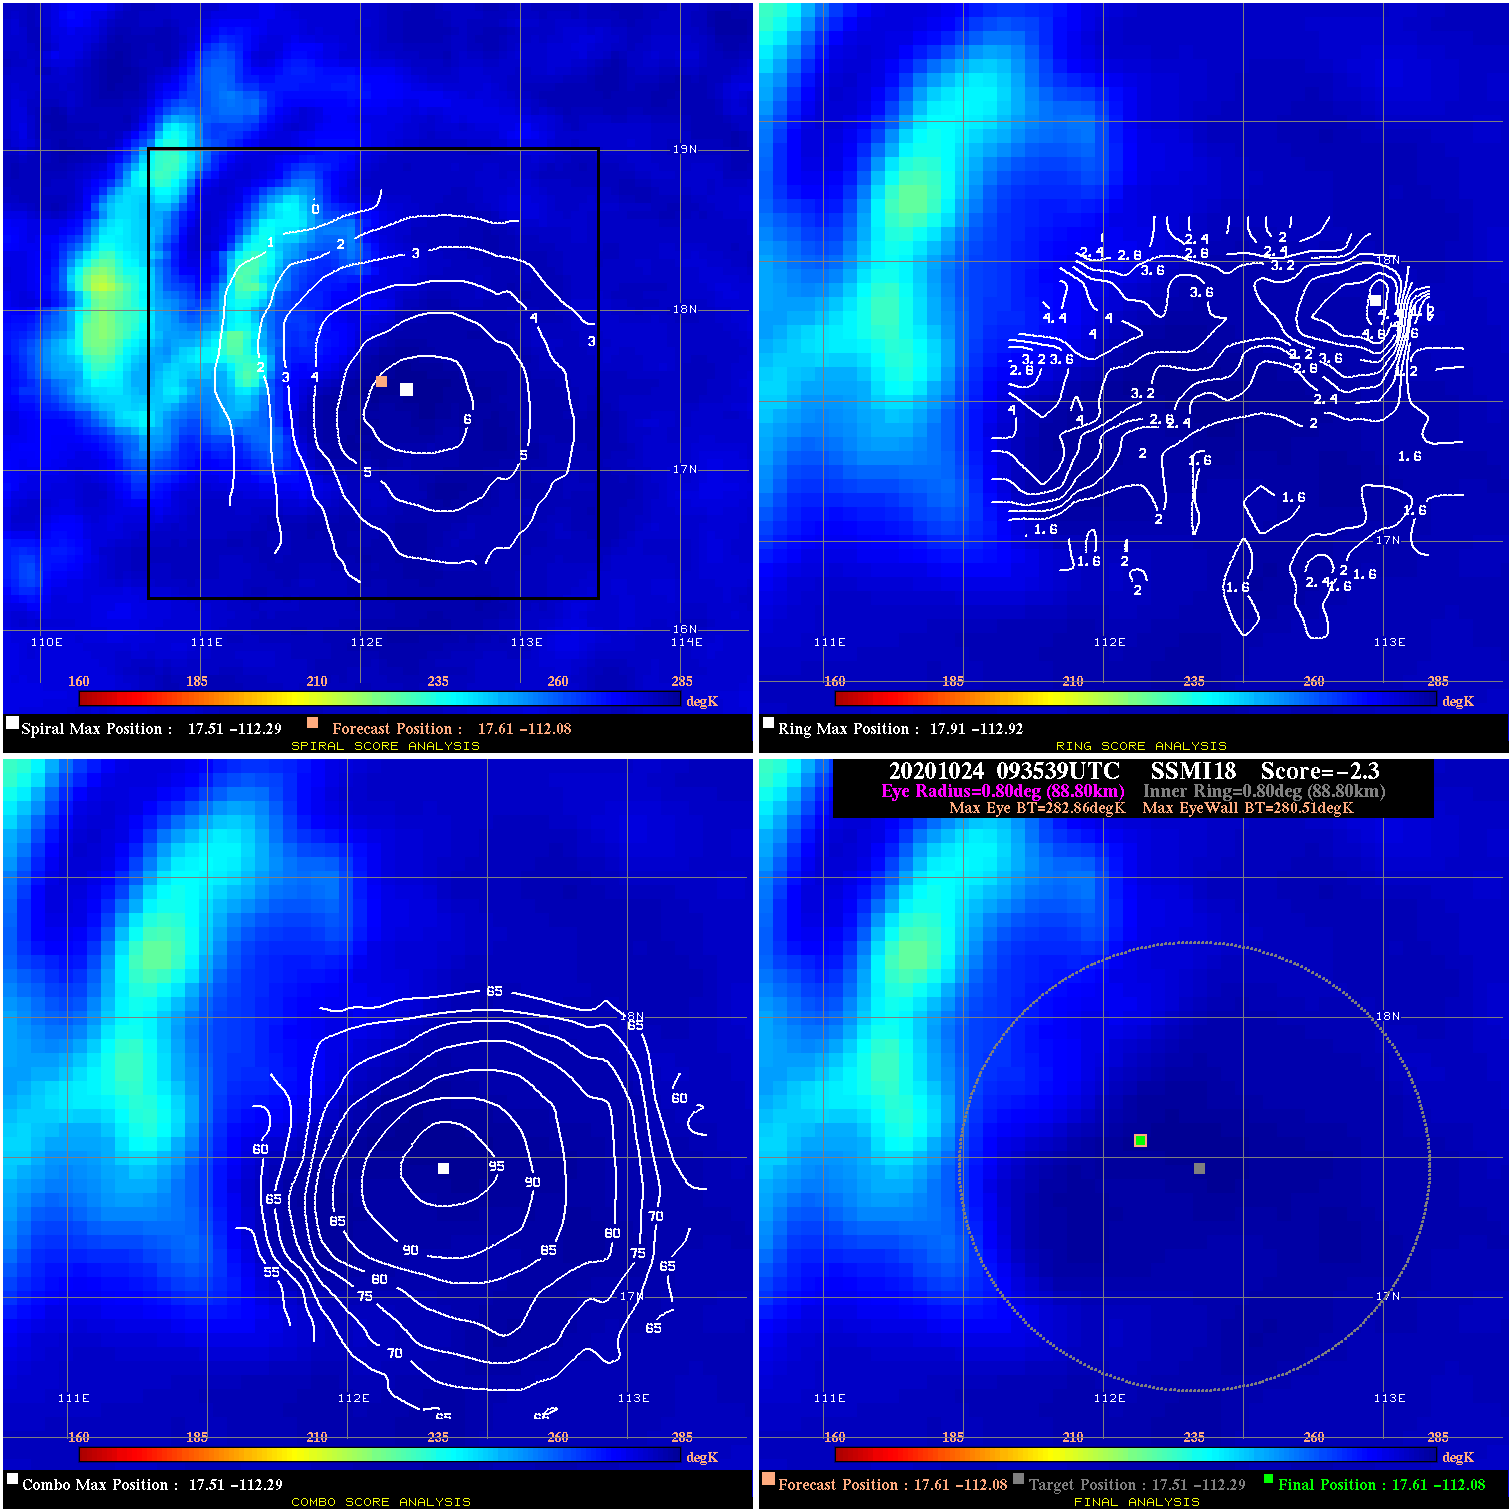
20201024 093539 -2.3 N/A N/A 177.76 2.35 50.0 SSMI18 17.6 -112.1 17.6 -112.1 17.5 -112.3 Analysis Plot
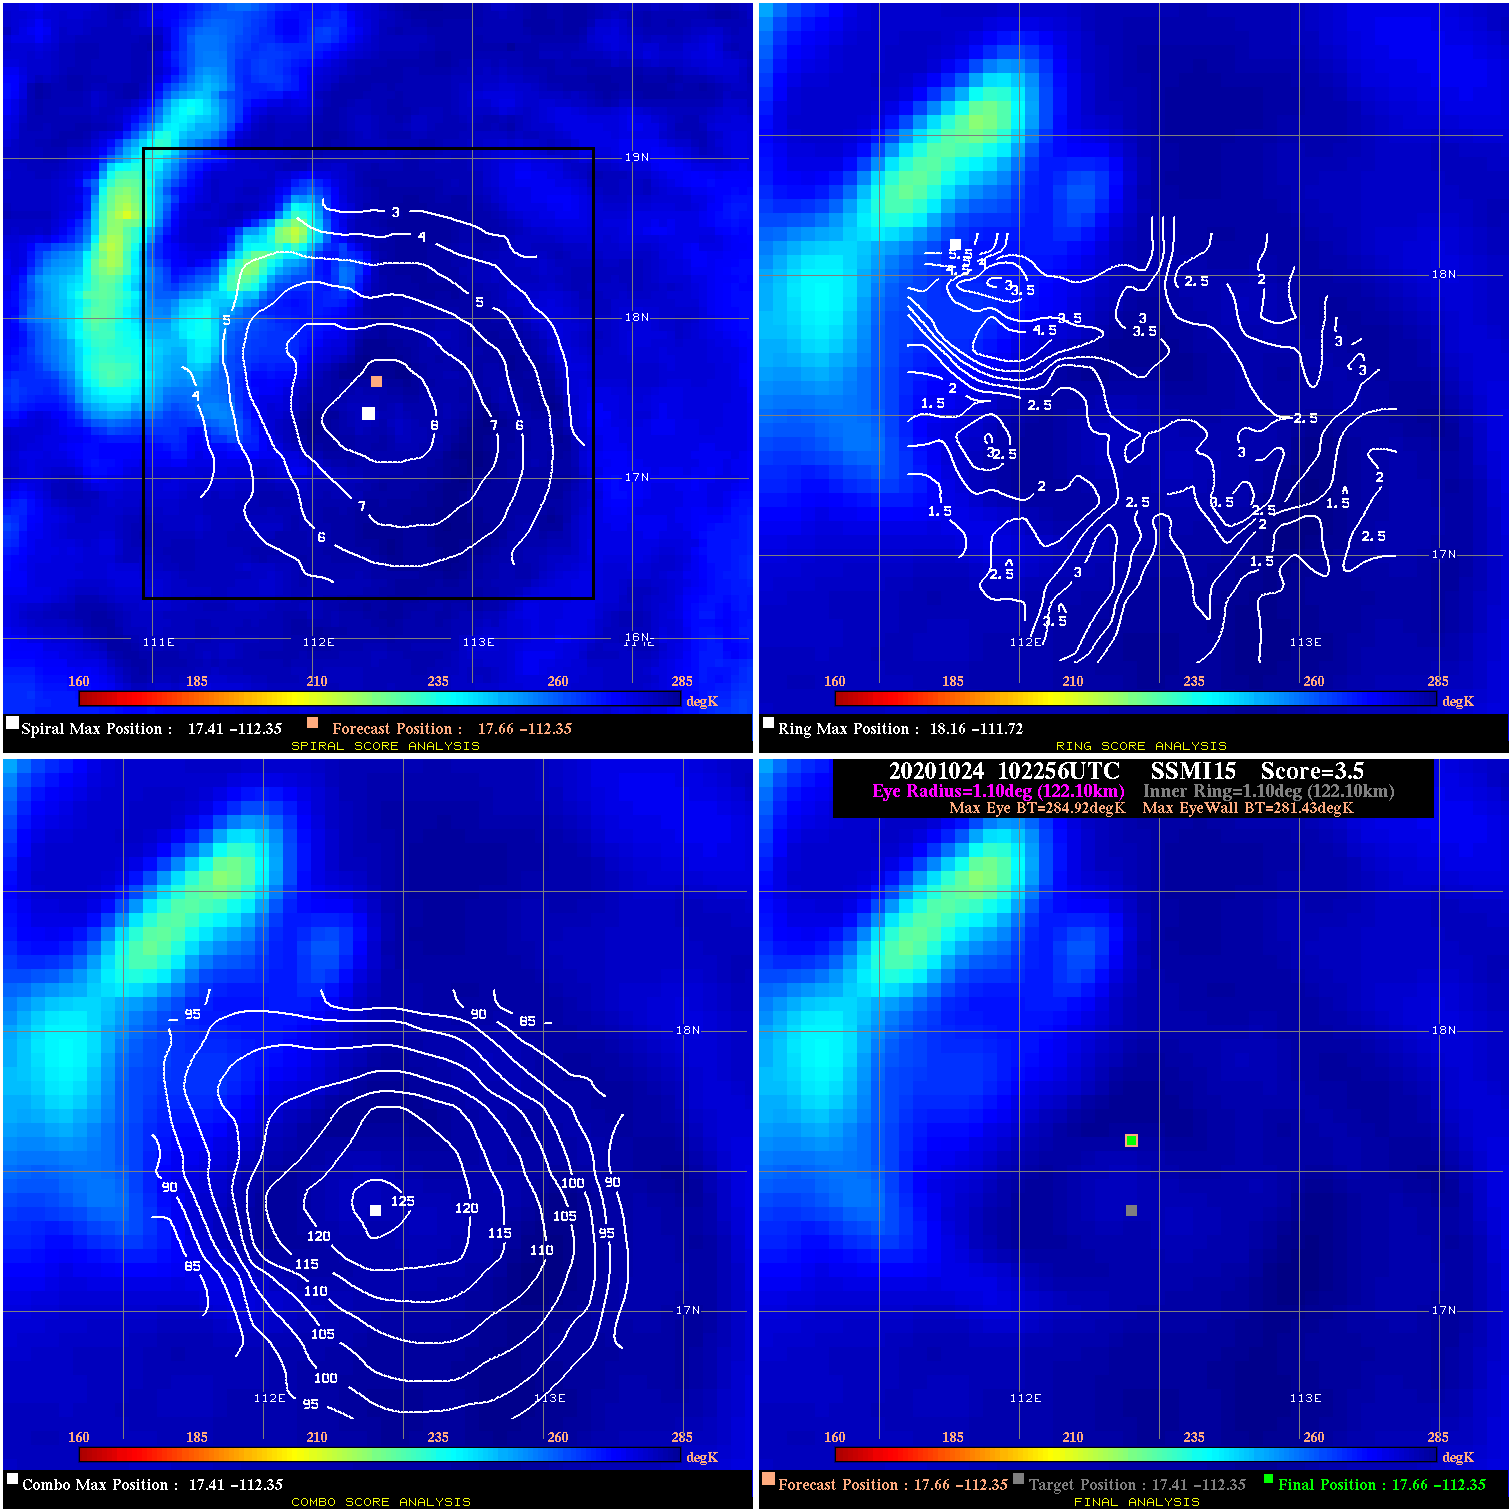
20201024 102256 3.5 N/A 4.1% 244.42 3.49 55.0 SSMI15 17.7 -112.3 17.7 -112.3 17.4 -112.3 Analysis Plot
20201024 214308 N/A N/A N/A N/A N/A 50.0 SSMI15 17.6 -109.7 17.6 -109.7 17.4 -109.2 Analysis Plot
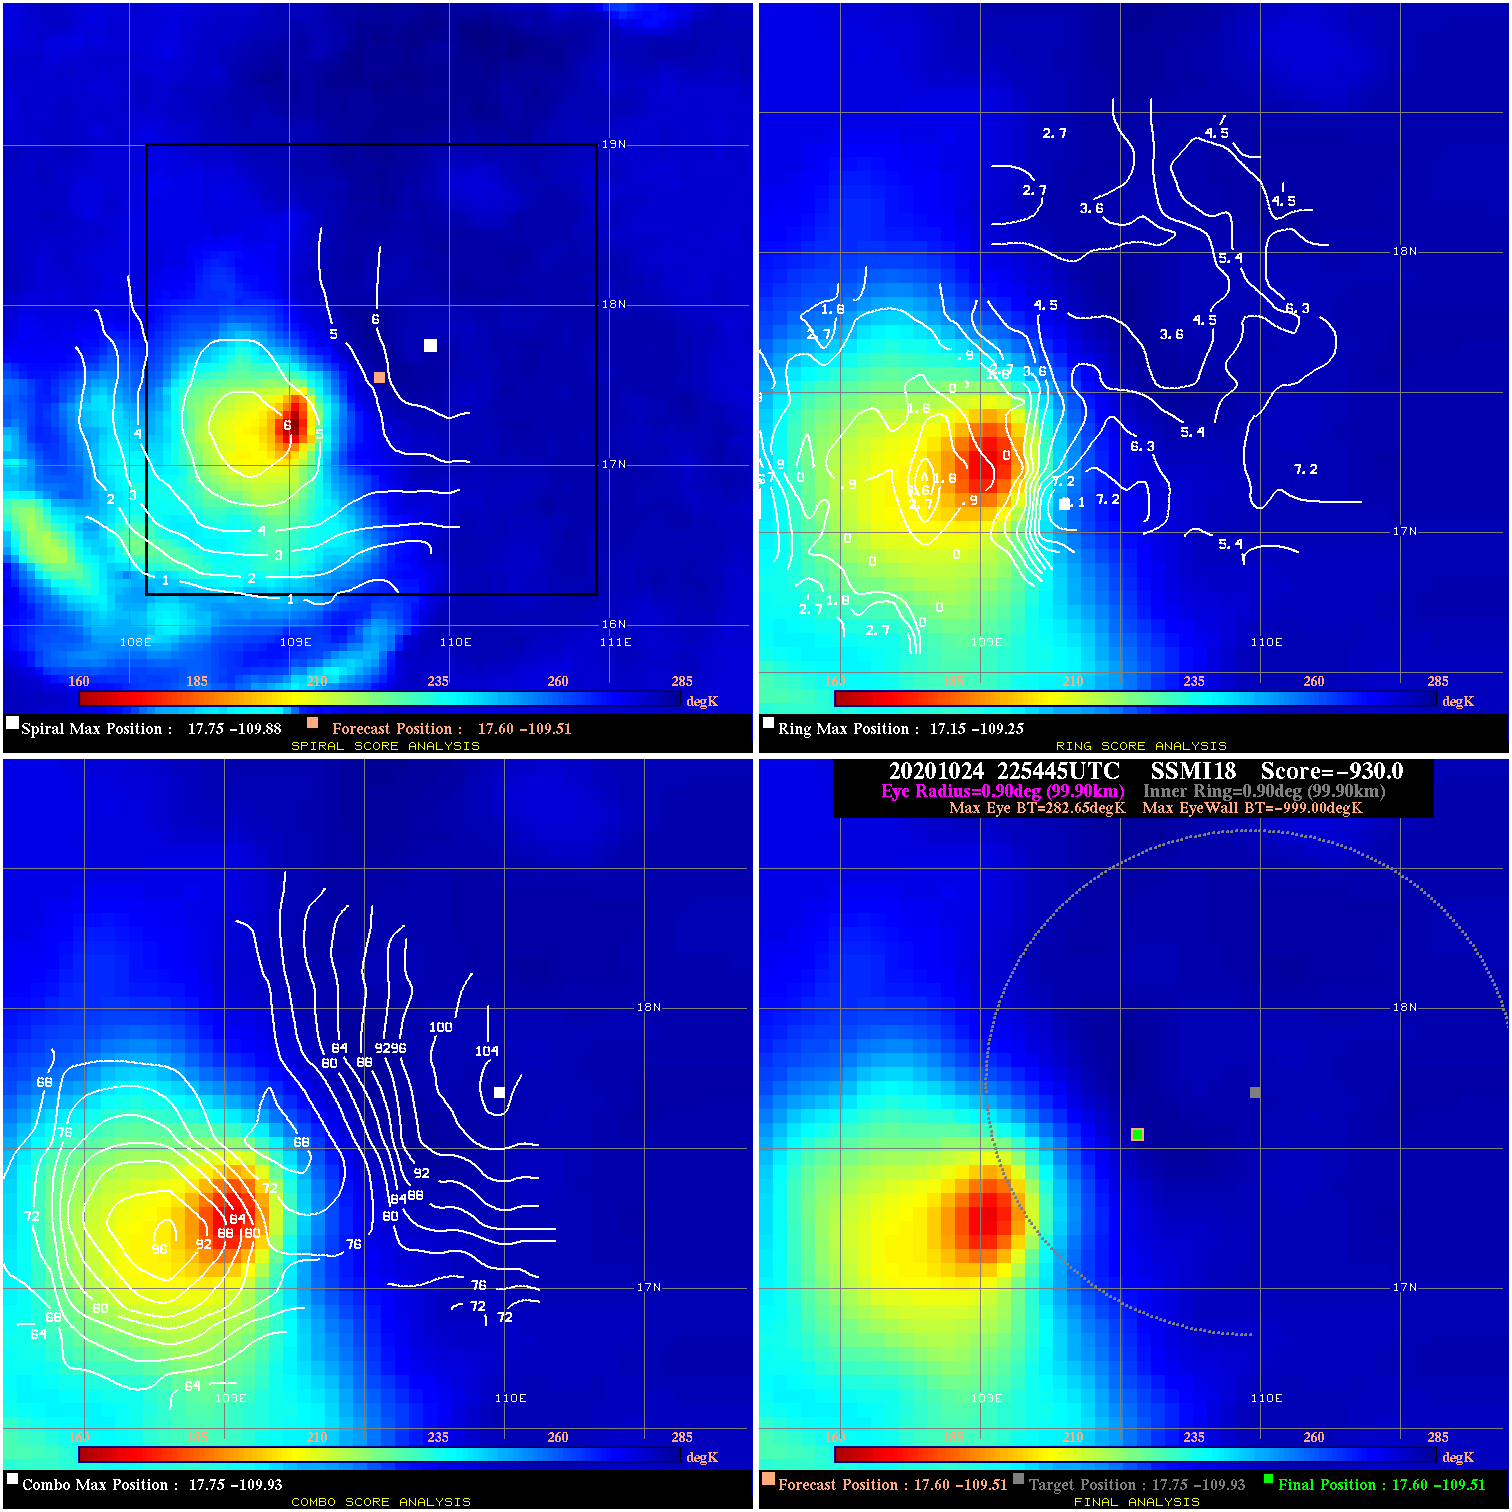
20201024 225445 -930.0 N/A N/A N/A 0.00 50.0 SSMI18 17.6 -109.5 17.6 -109.5 17.8 -109.9 Analysis Plot
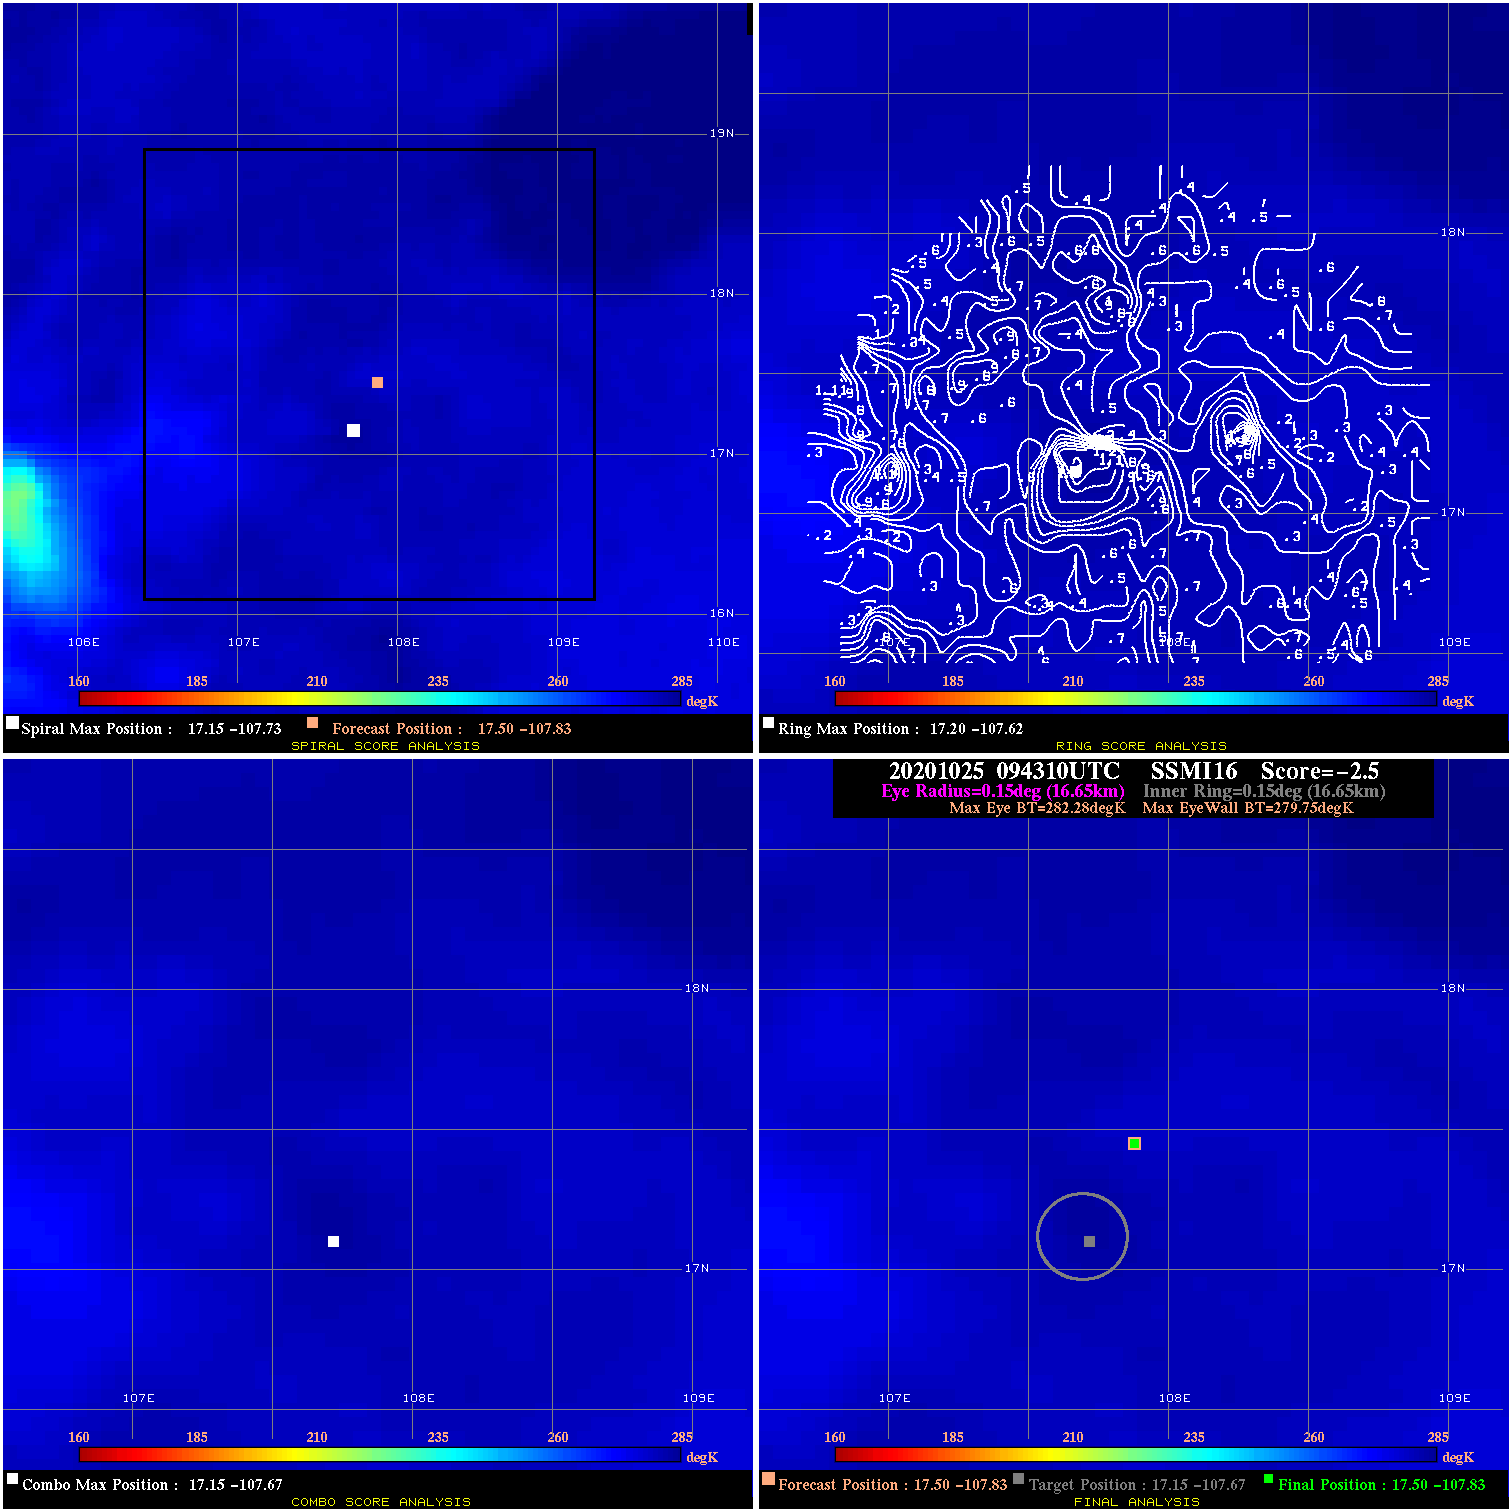
20201025 094310 -2.5 N/A N/A 33.33 2.53 40.0 SSMI16 17.5 -107.8 17.5 -107.8 17.1 -107.7 Analysis Plot
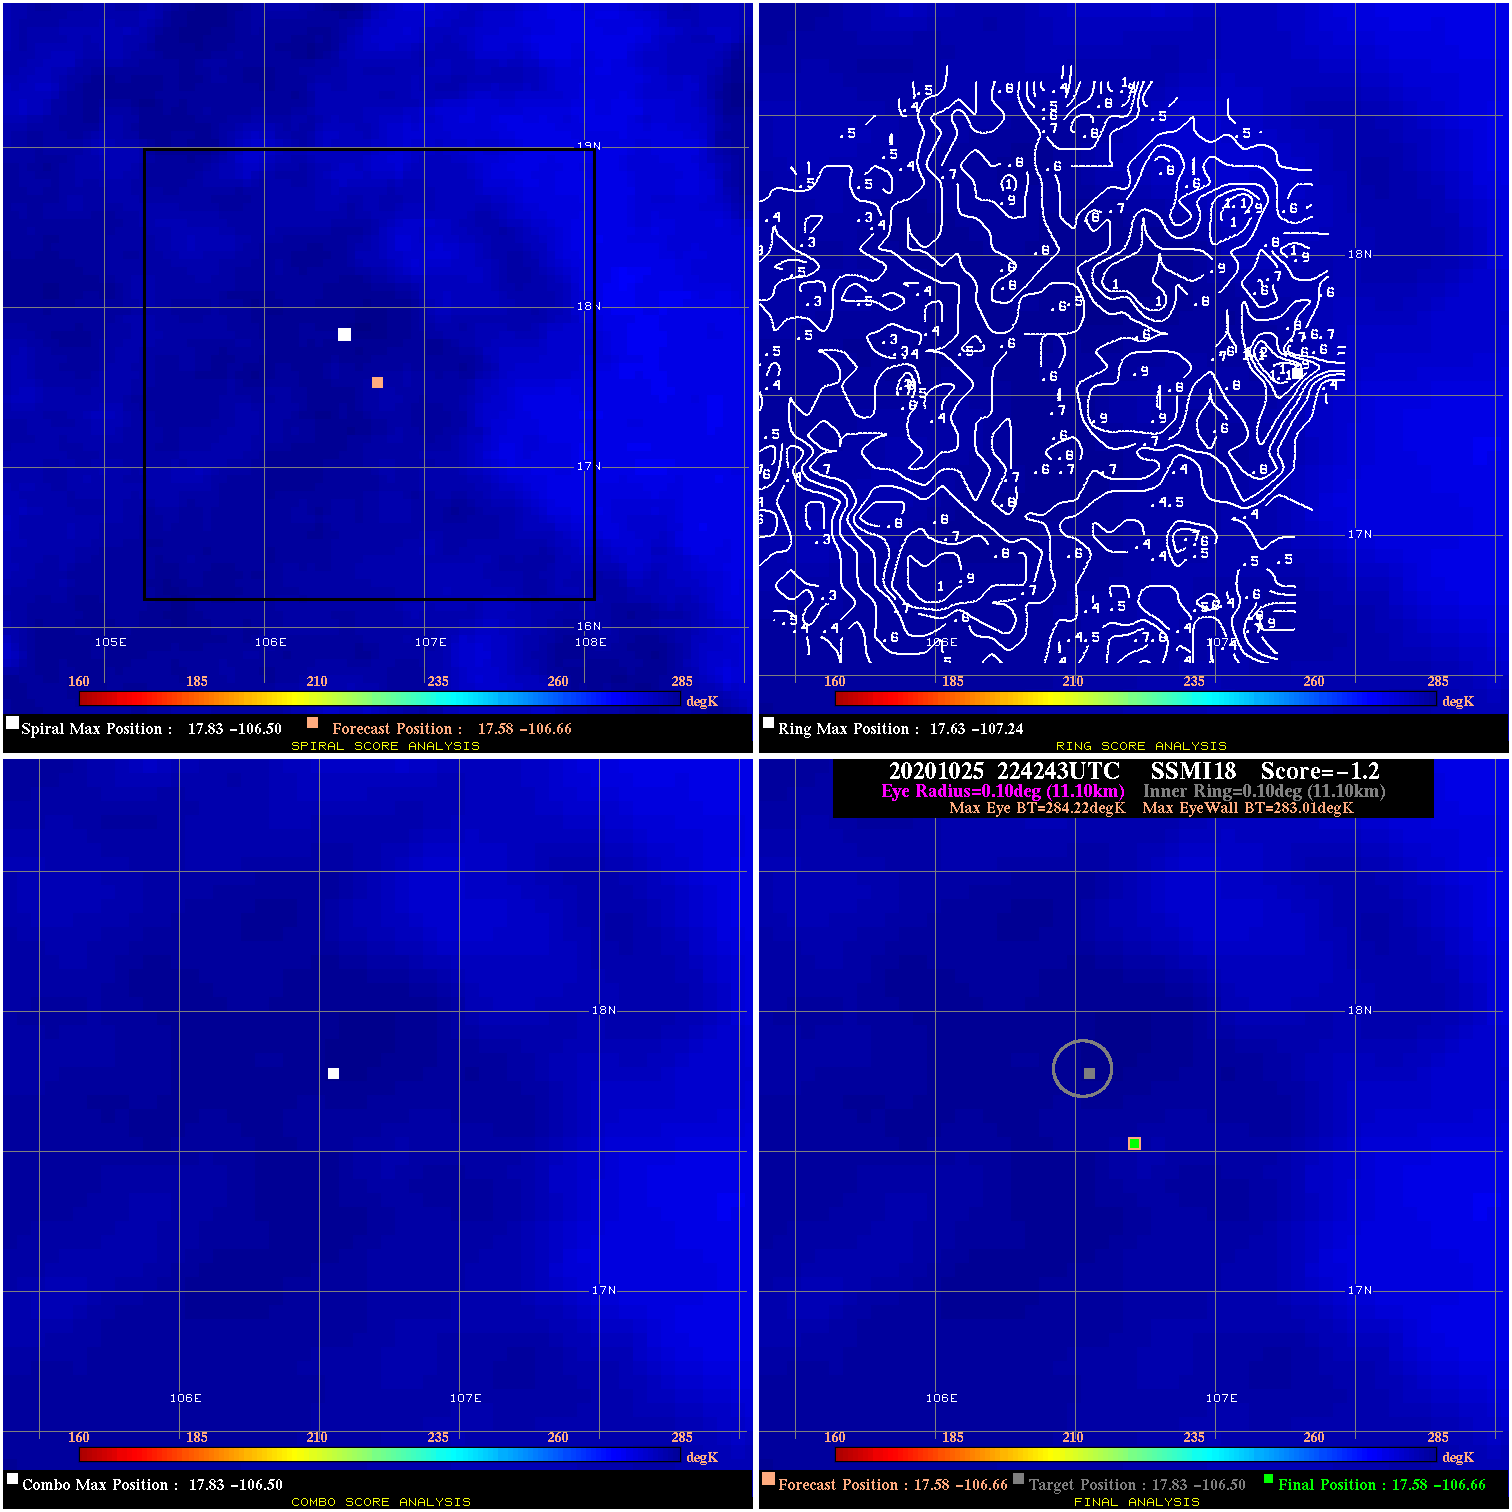
20201025 224243 -1.2 N/A N/A 22.22 1.21 25.0 SSMI18 17.6 -106.7 17.6 -106.7 17.8 -106.5 Analysis Plot
20201025 225832 -930.0 N/A N/A N/A 0.00 25.0 SSMI16 17.6 -106.6 17.6 -106.6 17.7 -106.3 Analysis Plot
20201026 093013 -0.3 N/A N/A 11.11 .28 25.0 SSMI16 17.5 -104.9 17.5 -104.9 17.3 -104.7 Analysis Plot
|
|
Legend: - Date/Time are determined from PMW imagery at Forecast (initial guess) Lat/Lon position. - Positive/Negative Latitude = North/South Hemisphere; Longitude = Western/Eastern Hemisphere. - "Ring Diam" value indicates the estimated surface eyewall diameter in km (the MI eyewall edge diameter minus 10 km). - "Ring Pct" is the percentage of the "ring" (eyewall inner boundary) that is 1) colder than the "hot spot" (warmest eye pixel) in the eye by 20K, or 2) the percentage that is a) colder than 232K and b) colder than the "hot spot" by 10K, whichever is greater. - Values are red if Ring % <= 65, yellow/brown if Ring % <= 85 and green if Ring % > 85. - "Tb diff" is the difference between the "hot spot" (warmest eye pixel) and the warmest pixel on the eyewall. - Intensity score are listed as negative, and not used, when the JTWC or NHC estimated Vmax is <55 kts in order to rule out weak but highly symmetric TCs. - Error messages in intensity scores: -920 is used when the hottest pixel in the eye is <200K, to prevent false positives; -930 means <85% of eyewall has observations/data. |