Tropical Storm 01L
|
Passive Microwave (PMW) Intensity Information Hurricane Intensity Estimation (HIE) Algorithm Version 9.0 |
Overpass Inten Ring Ring Wind Forecast Final Target
Date Time Score Meaning Pct Diam BTdiff Est Sat Lat Lon Lat Lon Lat Lon
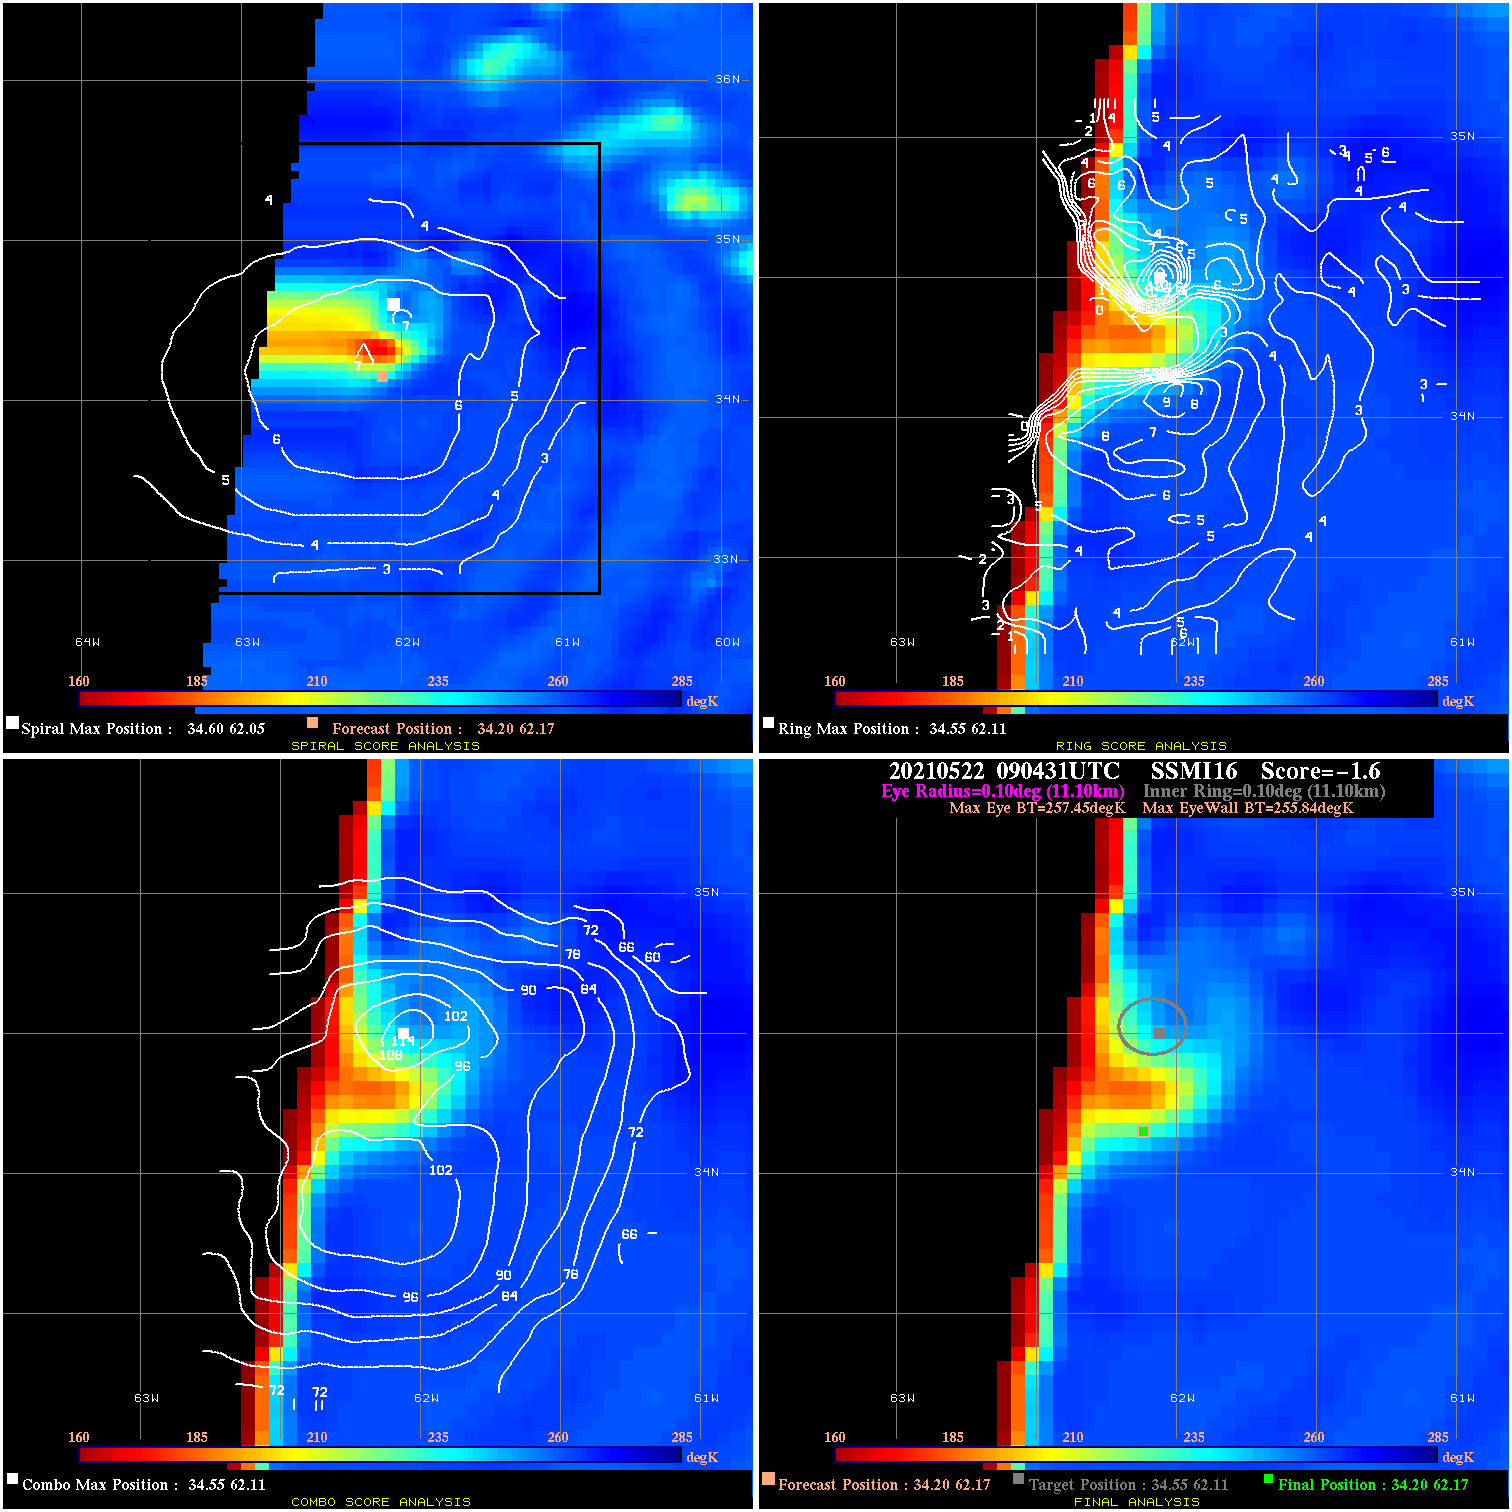
20210522 090431 -1.6 N/A 41.1% 22.22 1.61 40.0 SSMI16 34.2 62.2 34.2 62.2 34.5 62.1 Analysis Plot
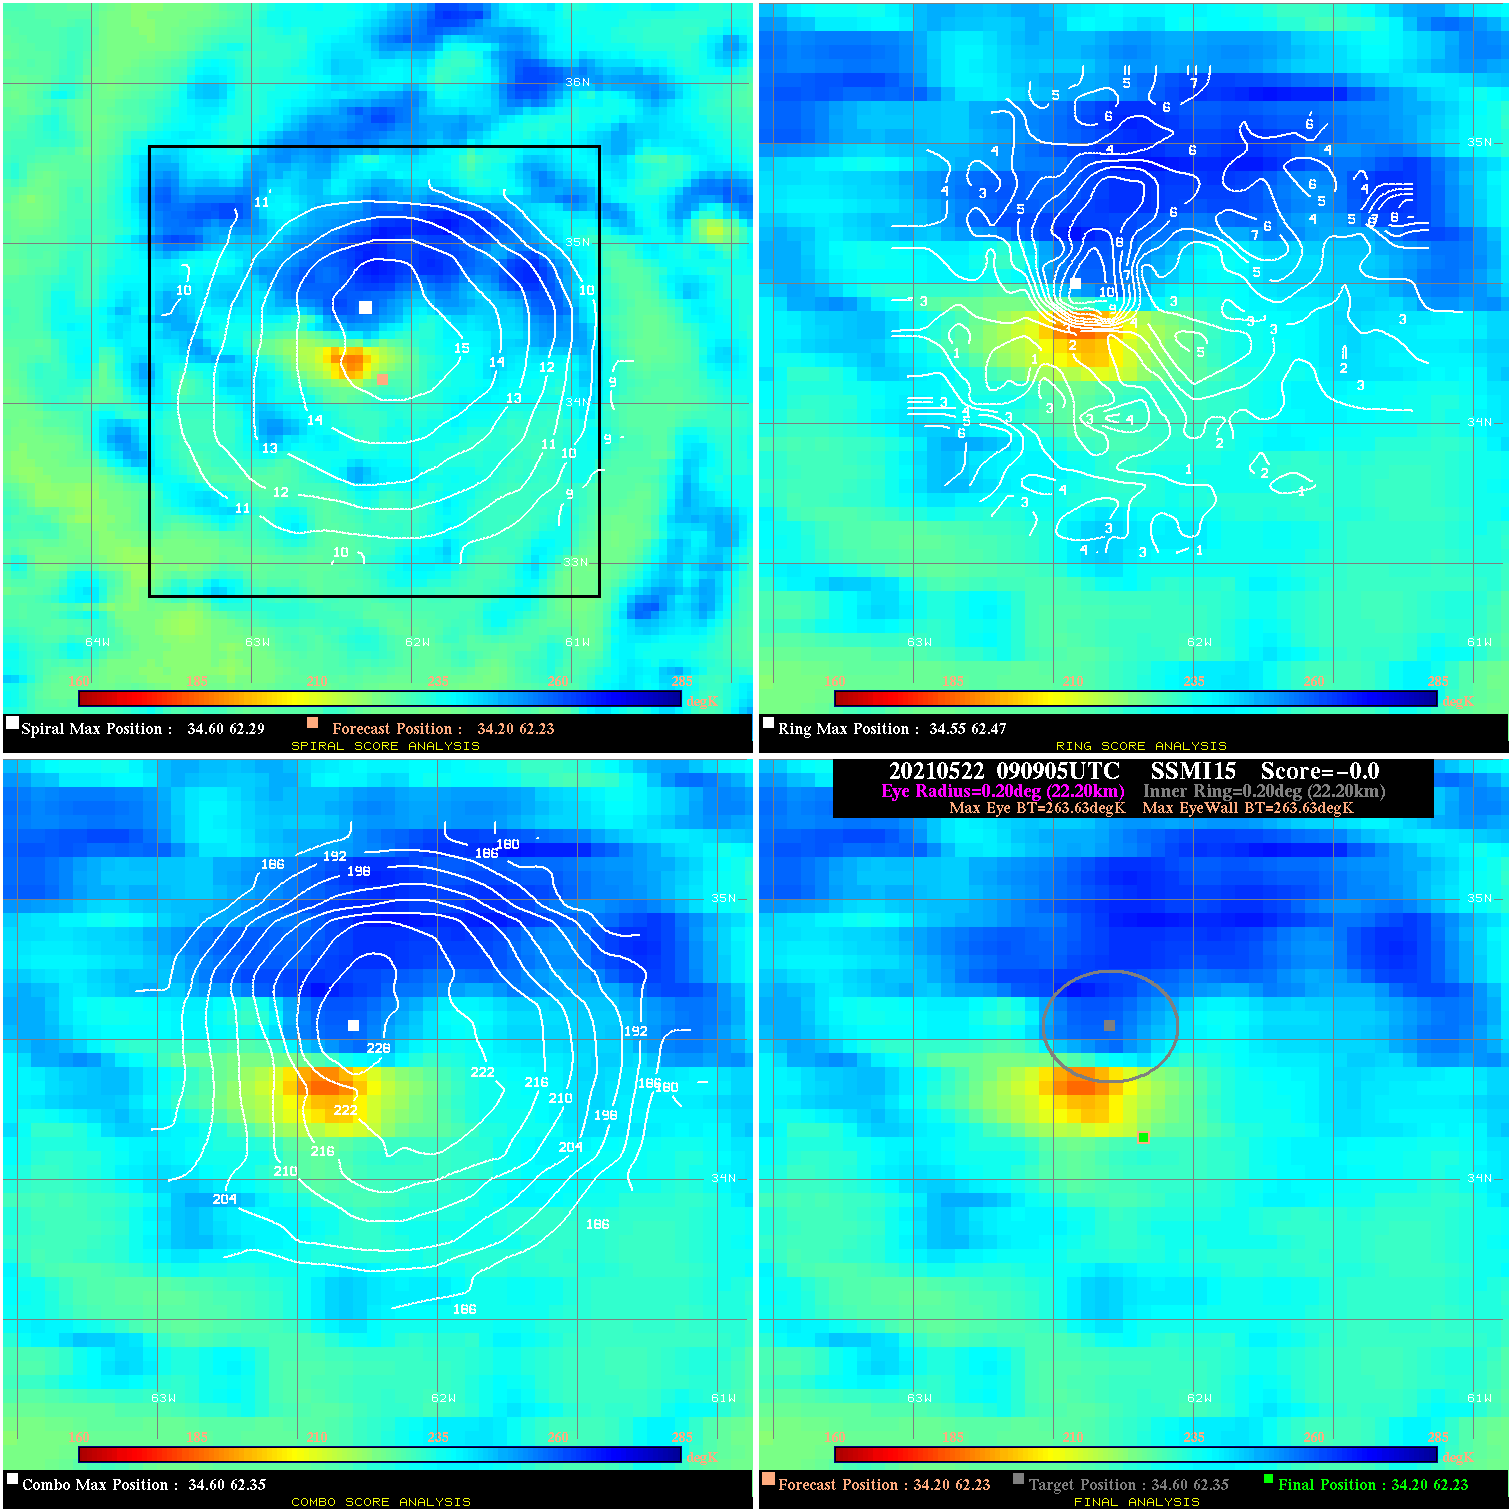
20210522 090905 N/A N/A N/A N/A N/A 40.0 SSMI15 34.2 62.2 34.2 62.2 34.6 62.3 Analysis Plot
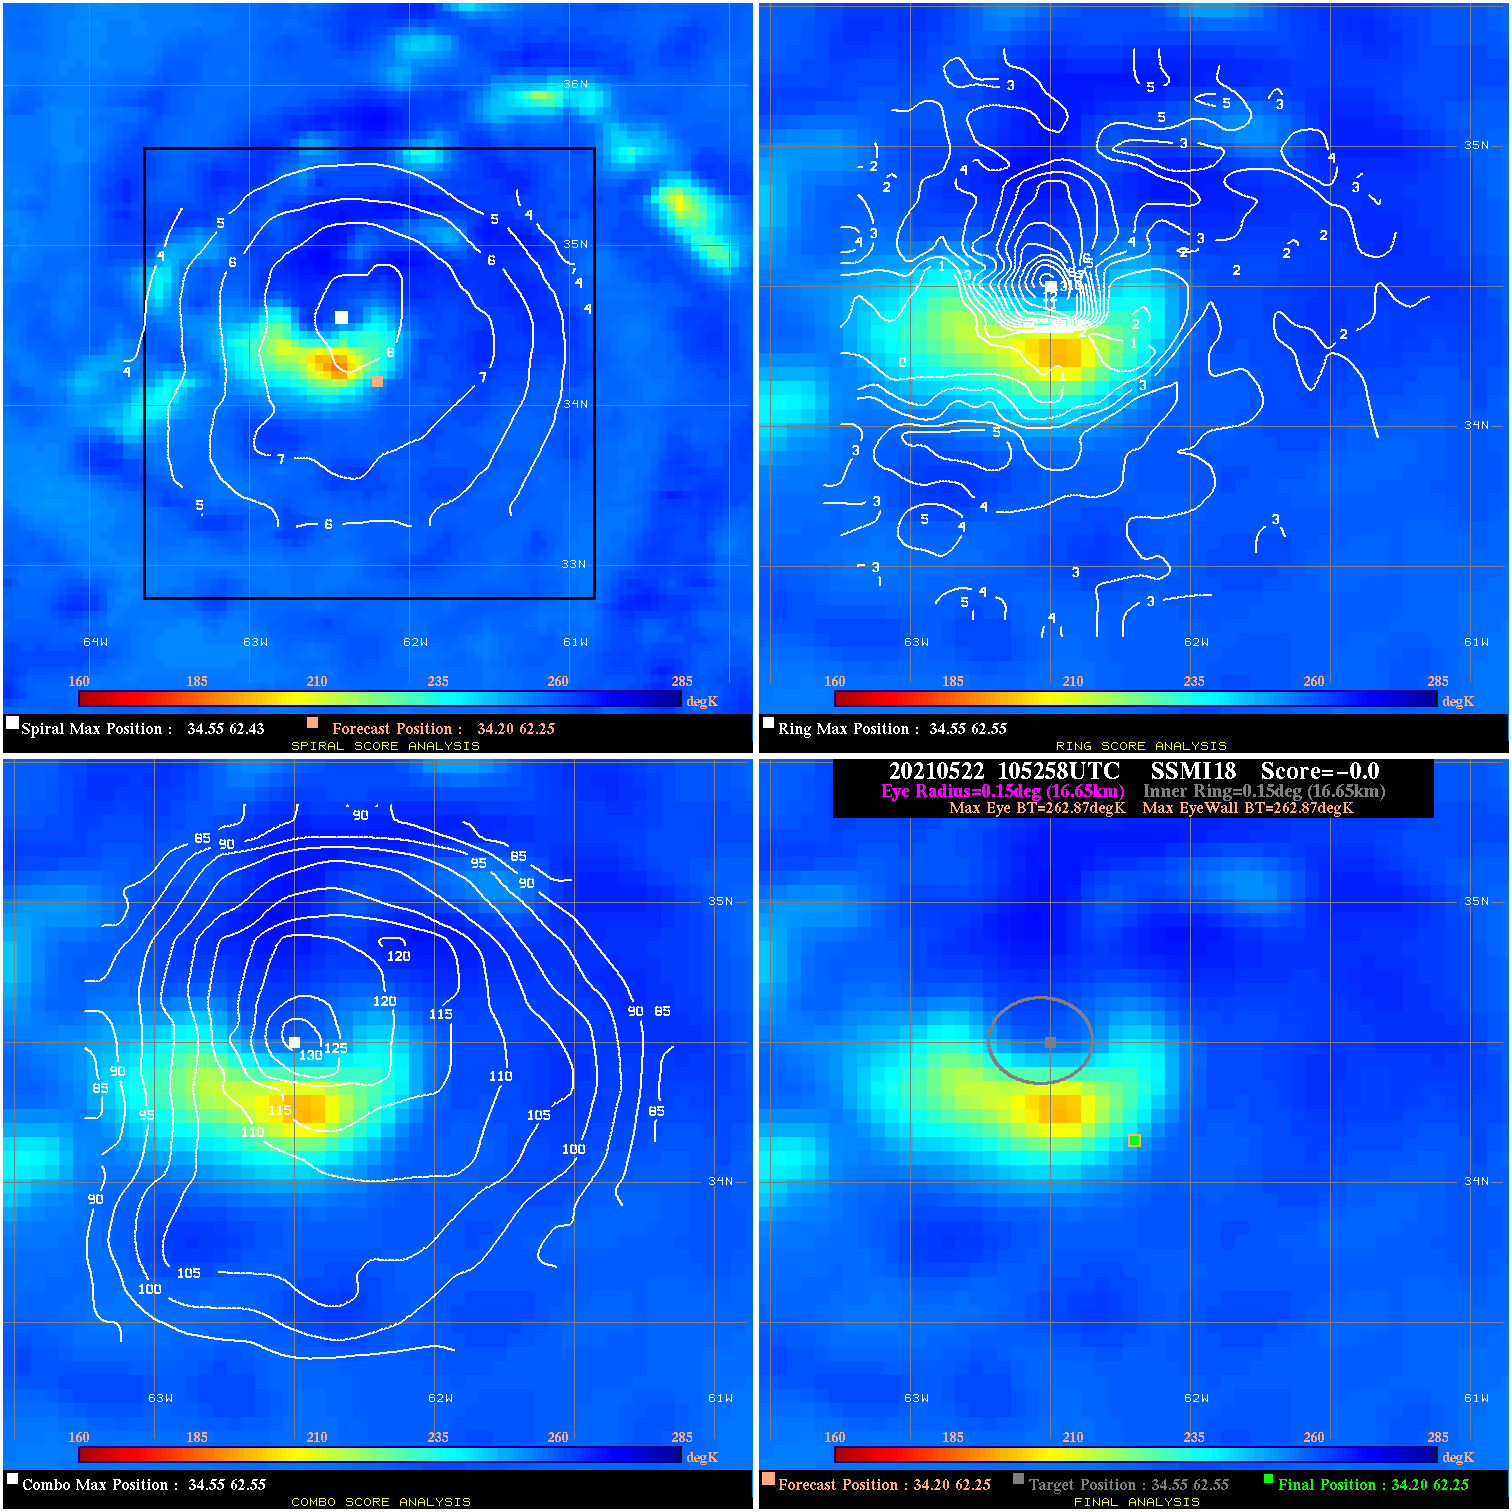
20210522 105258 N/A N/A N/A N/A N/A 40.0 SSMI18 34.2 62.3 34.2 62.3 34.5 62.5 Analysis Plot
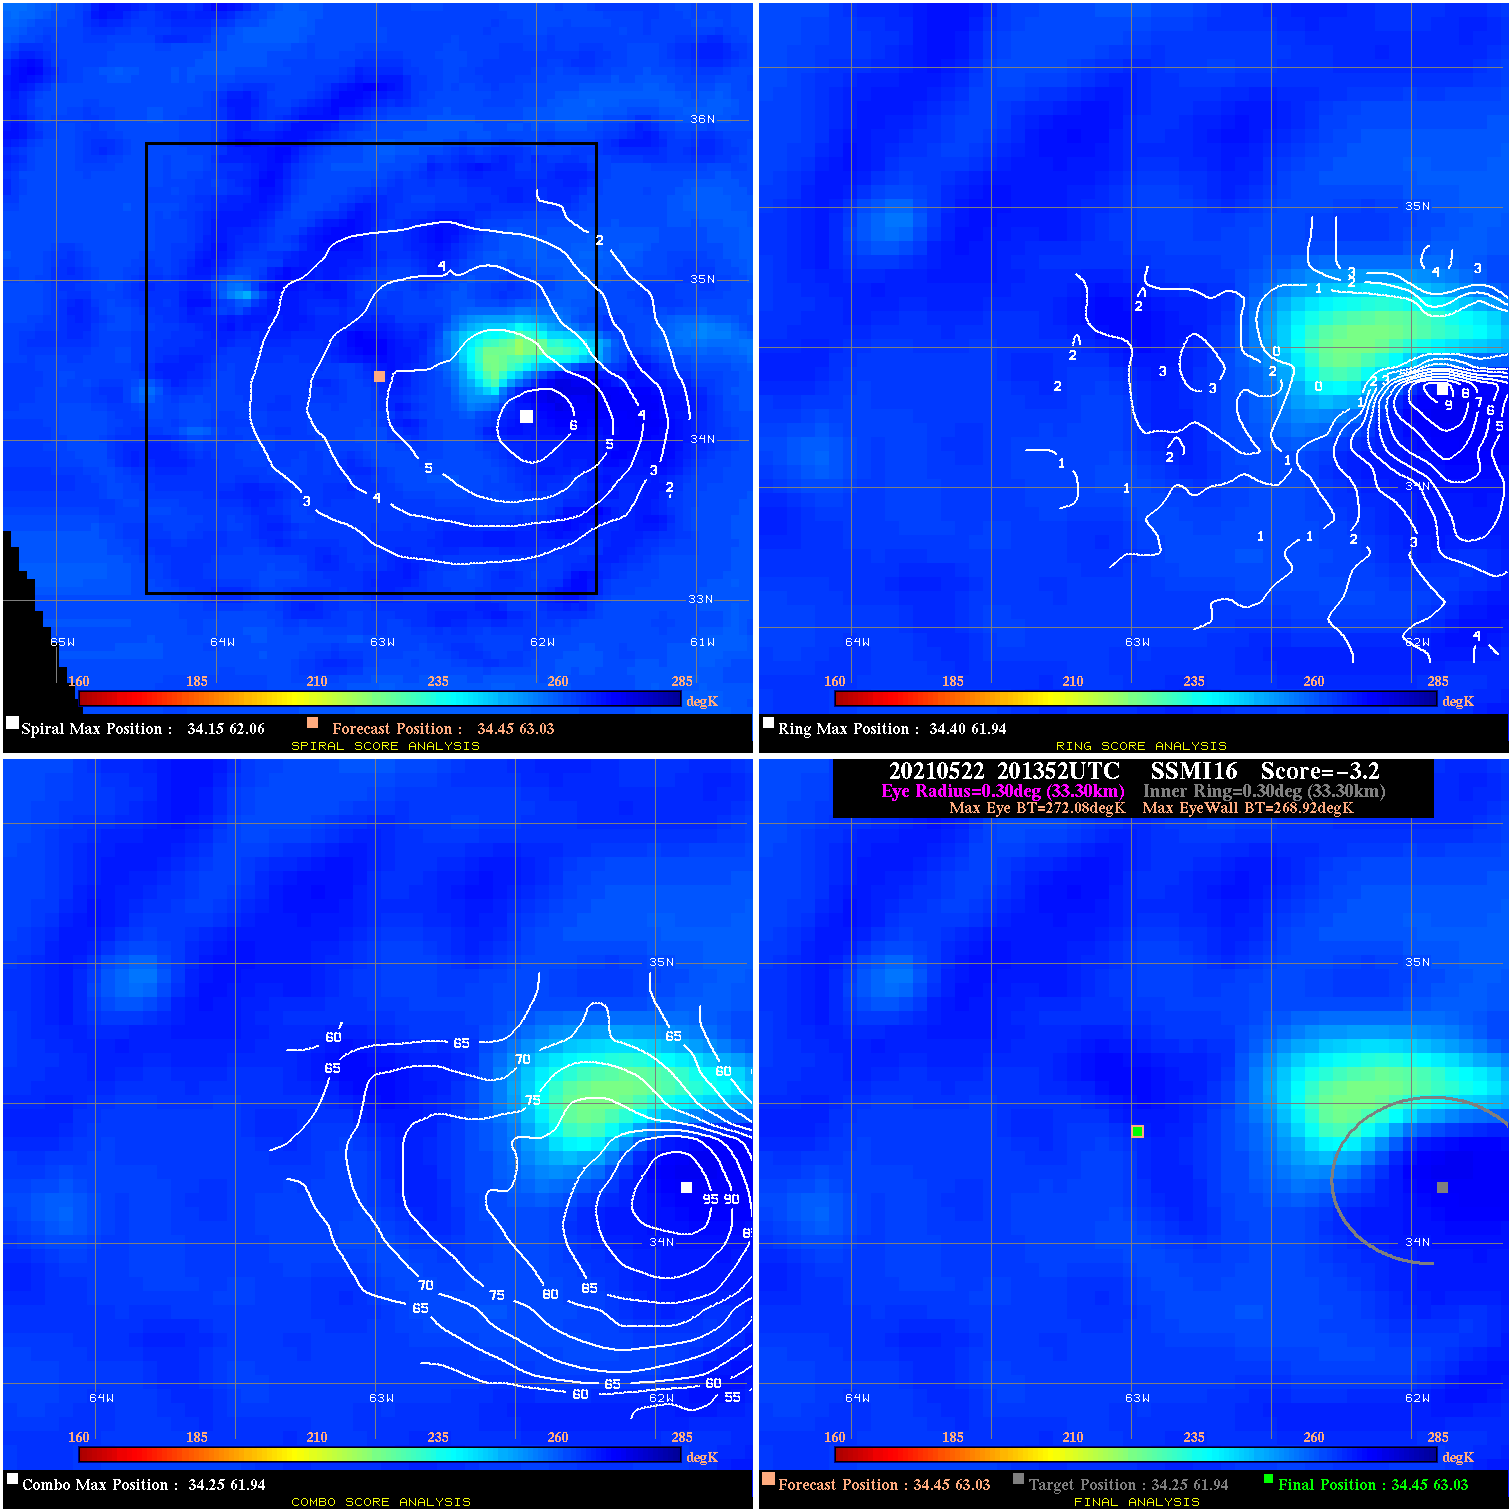
20210522 201352 -3.2 N/A N/A 66.66 3.16 40.0 SSMI16 34.5 63.0 34.5 63.0 34.3 61.9 Analysis Plot
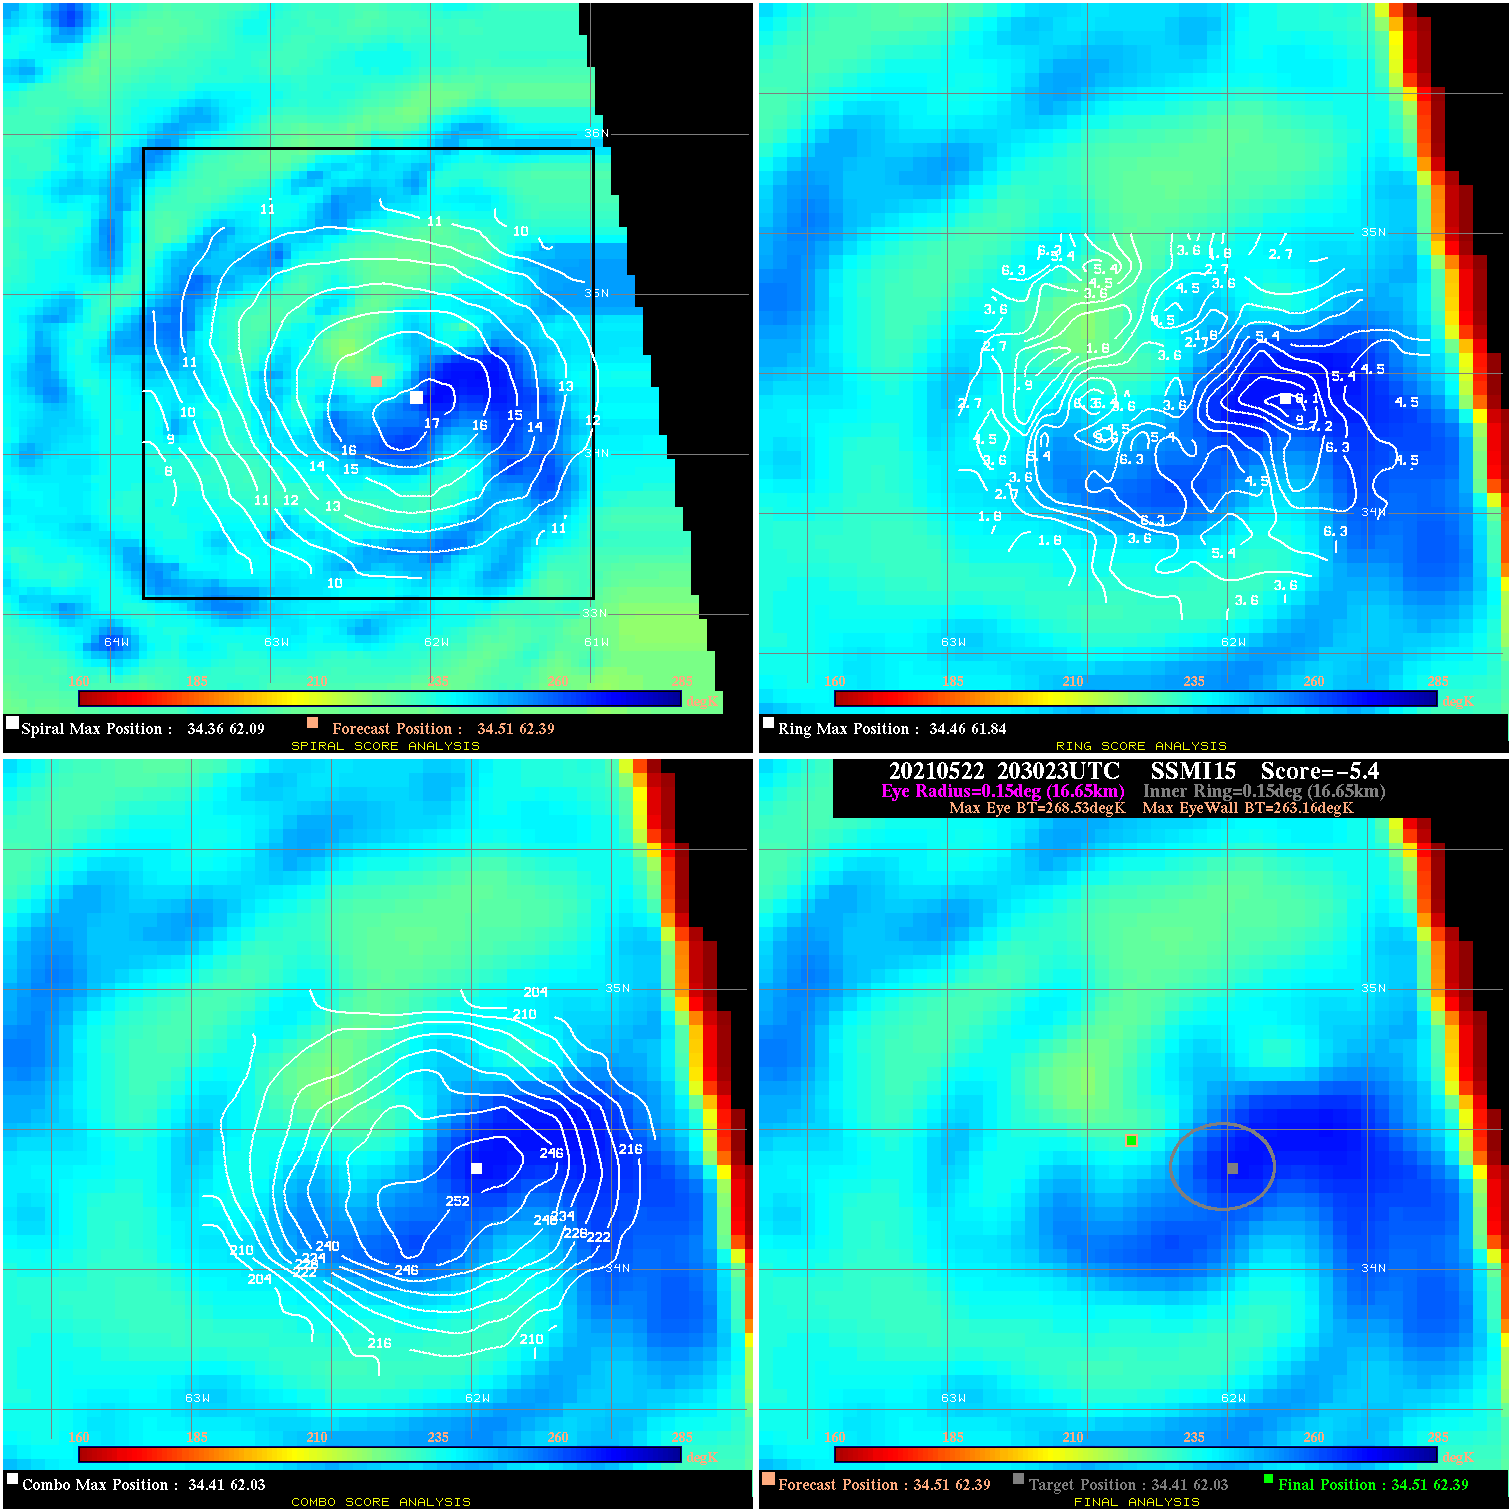
20210522 203023 -5.4 N/A 9.6% 33.33 5.37 35.0 SSMI15 34.5 62.4 34.5 62.4 34.4 62.0 Analysis Plot
20210522 222315 -4.0 N/A N/A 33.33 3.96 35.0 SSMI18 34.5 62.4 34.5 62.4 34.4 62.3 Analysis Plot
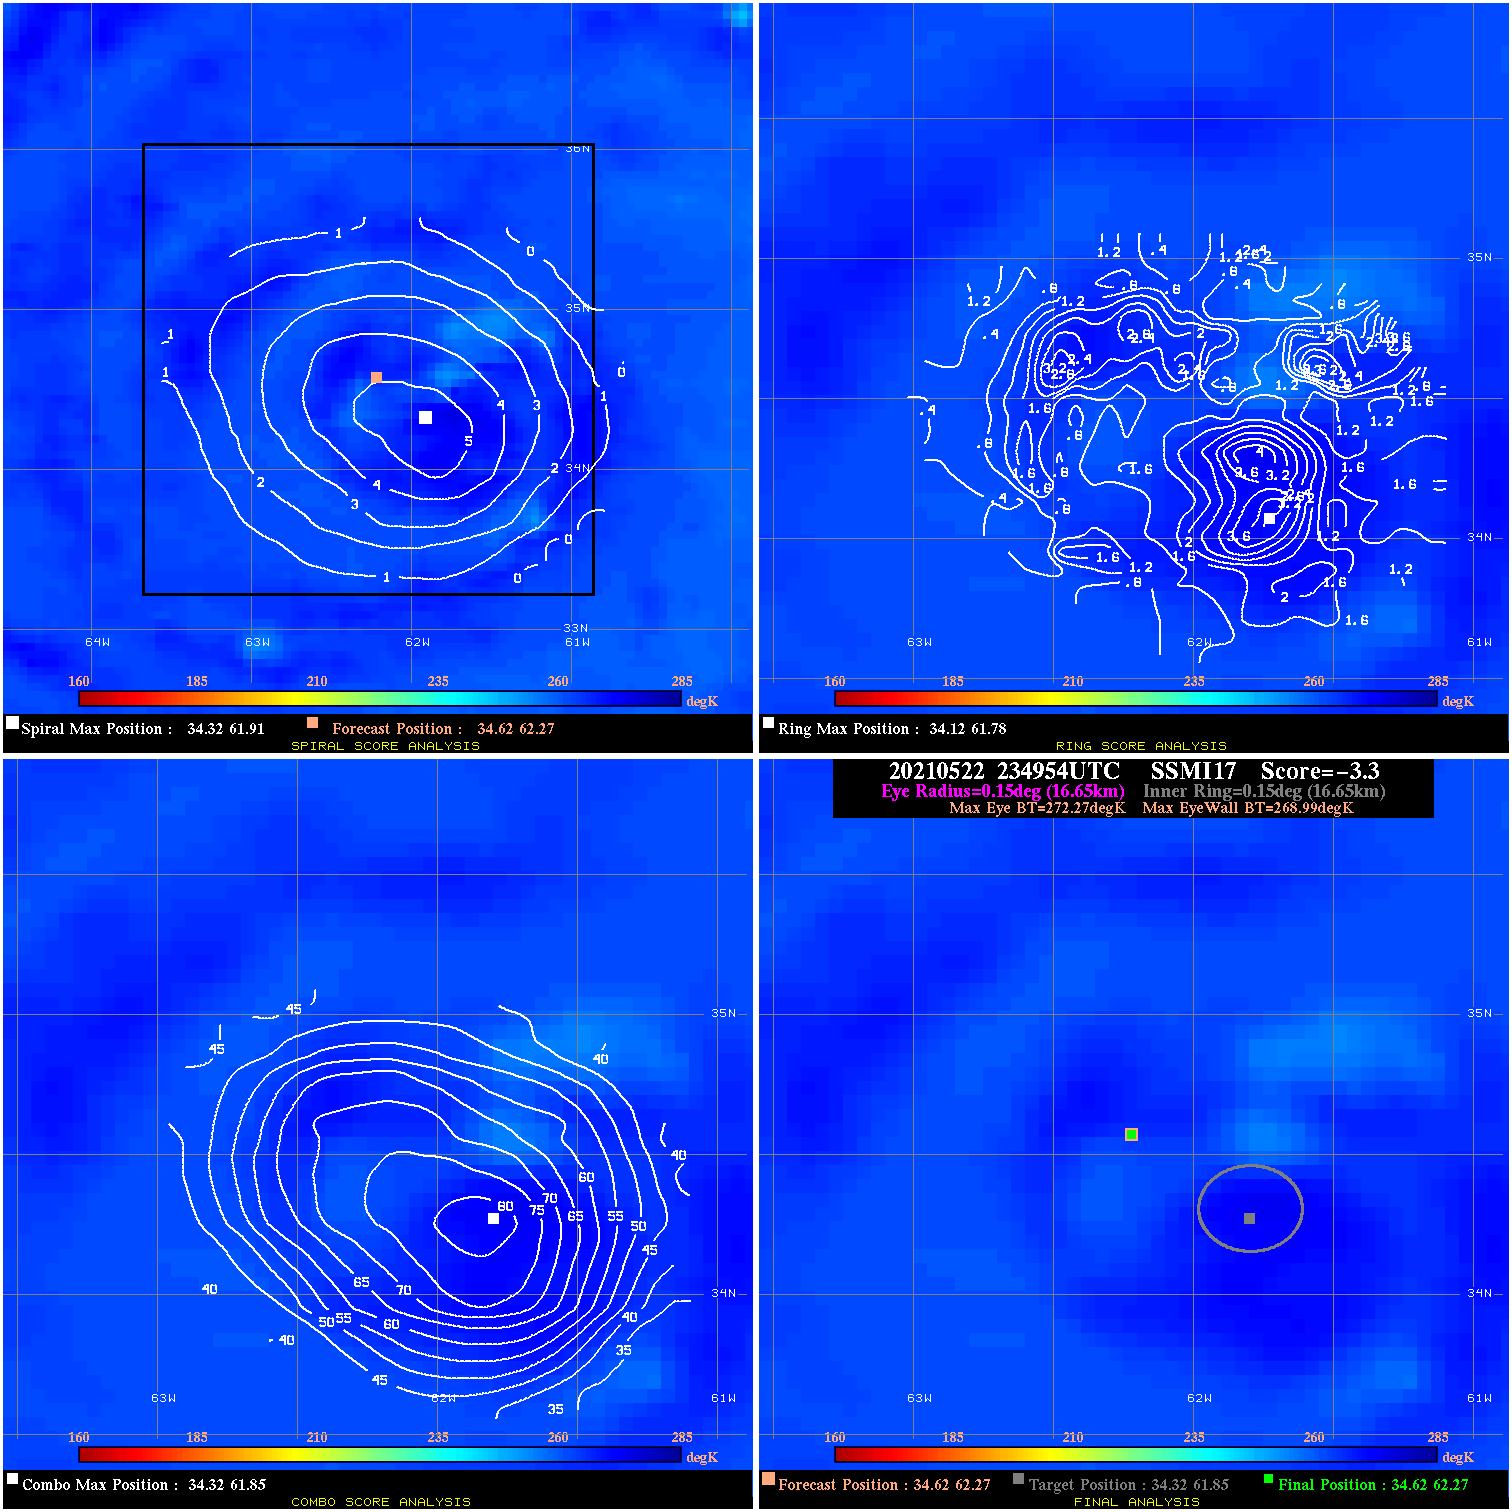
20210522 234954 -3.3 N/A N/A 33.33 3.28 35.0 SSMI17 34.6 62.3 34.6 62.3 34.3 61.8 Analysis Plot
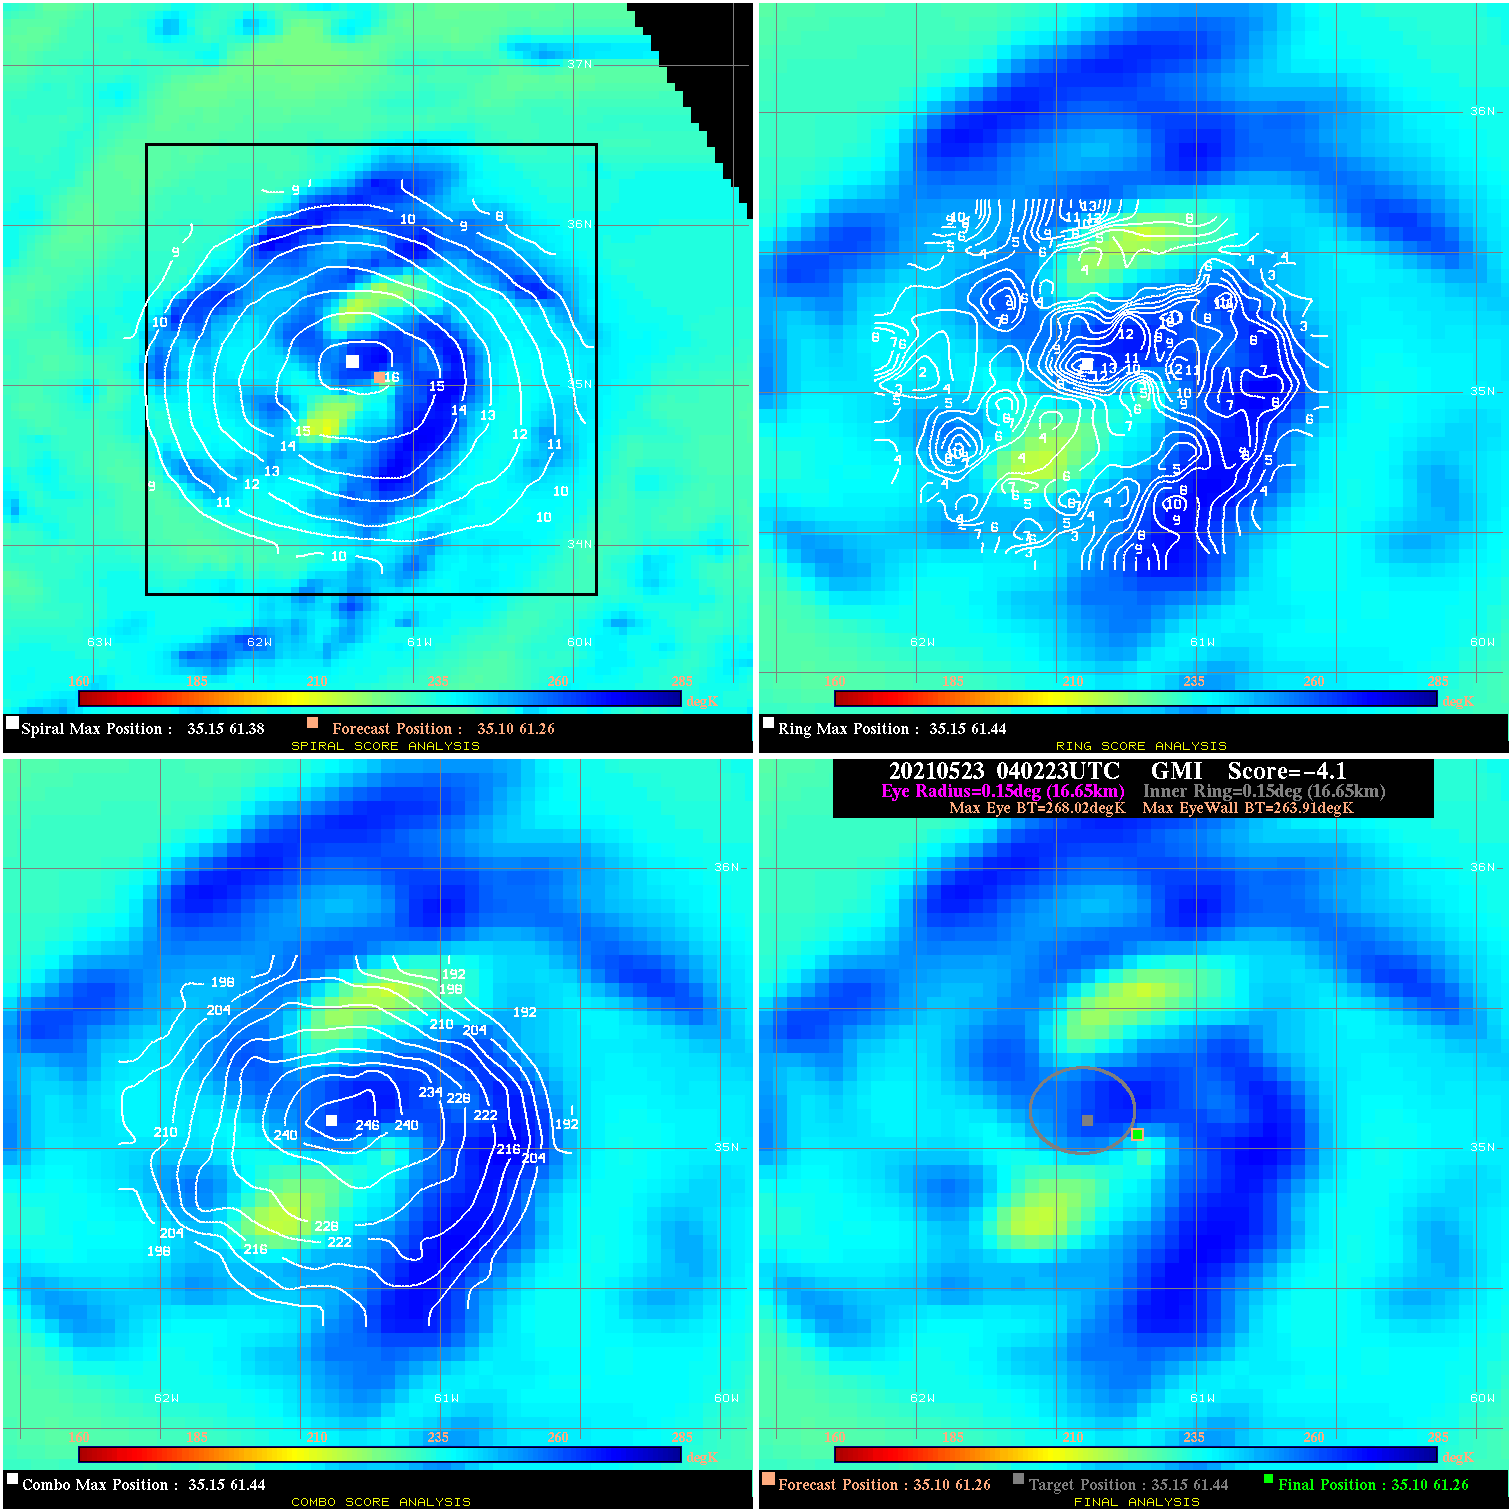
20210523 040223 -4.1 N/A 19.2% 33.33 4.11 40.0 GMI 35.1 61.3 35.1 61.3 35.2 61.4 Analysis Plot
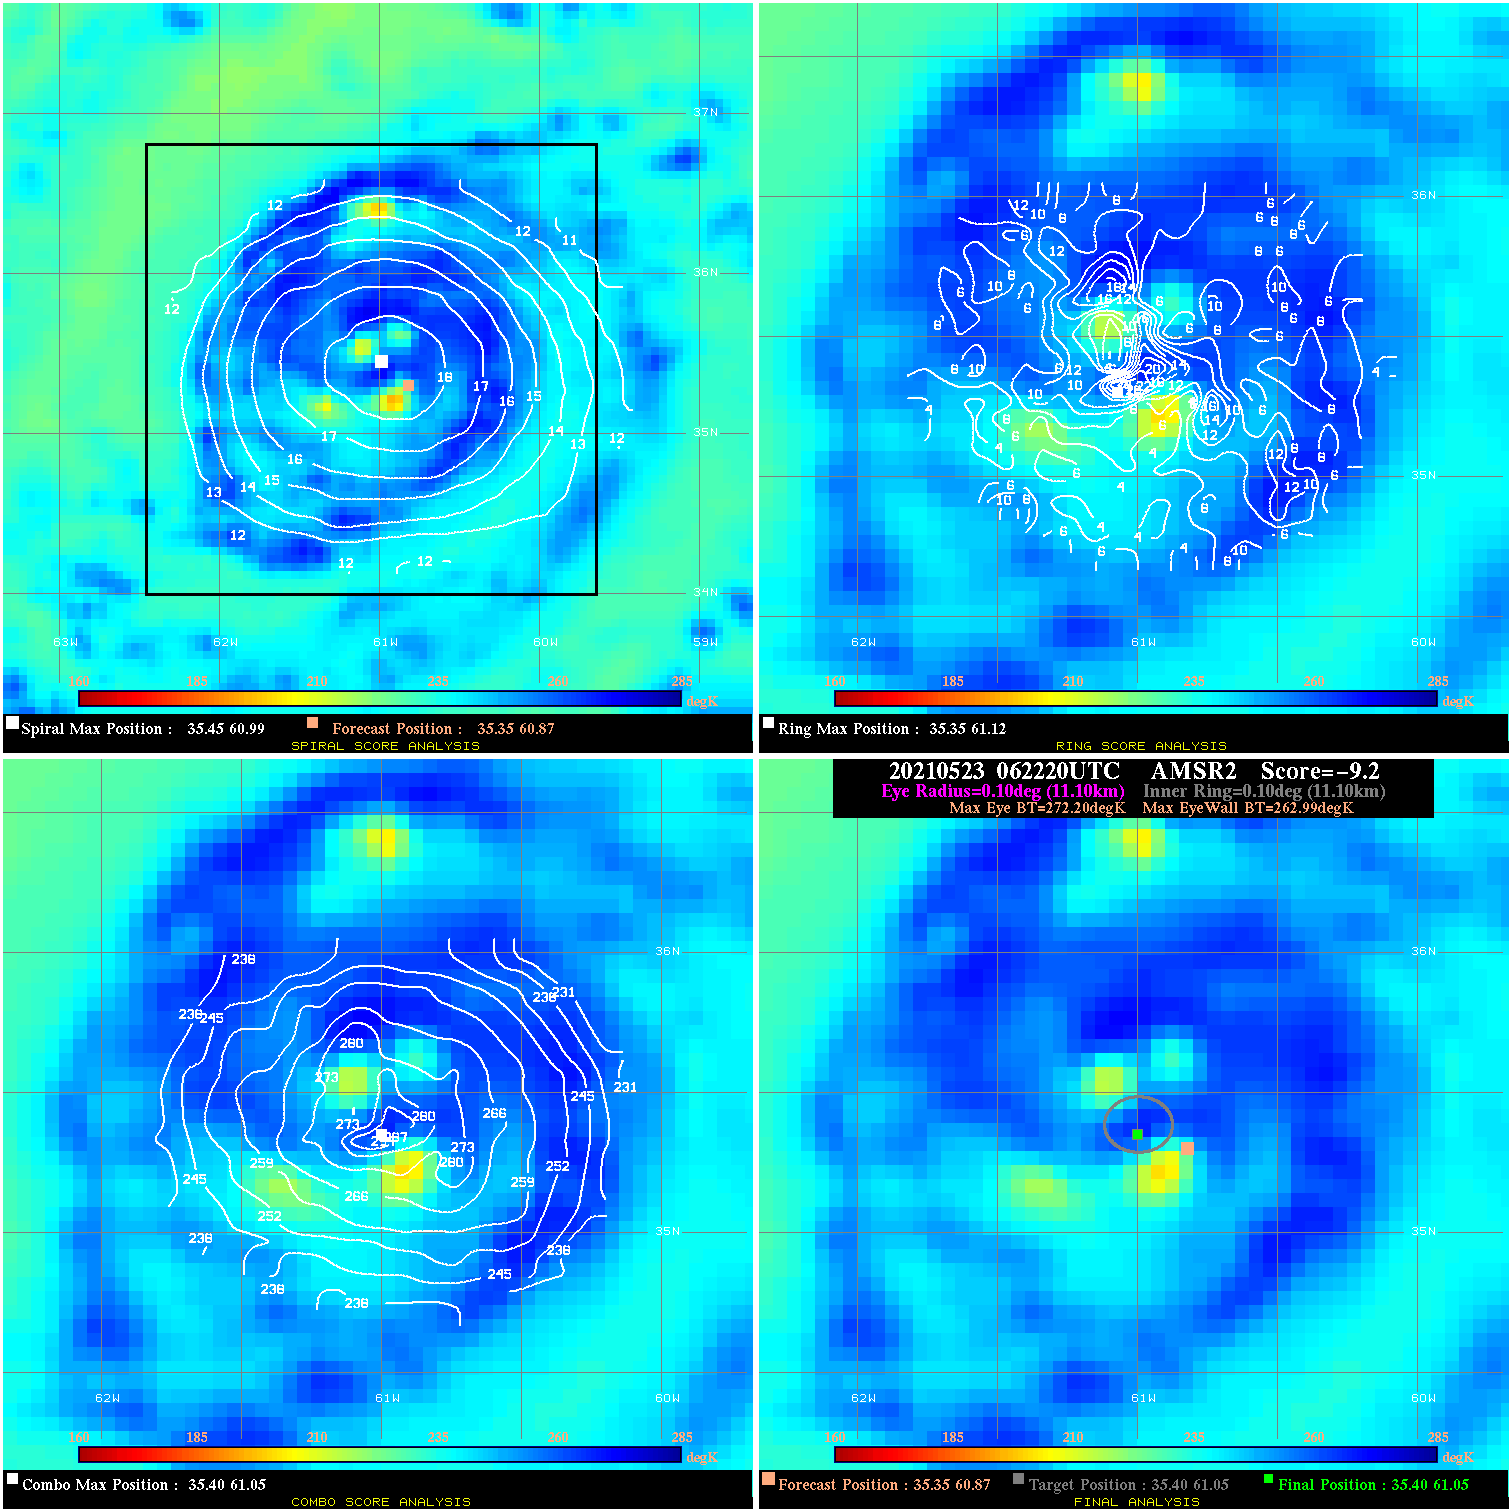
20210523 062220 -9.2 N/A 24.7% 22.22 9.21 40.0 AMSR2 35.3 60.9 35.4 61.0 35.4 61.0 Analysis Plot
20210523 091003 -8.4 N/A N/A 66.66 8.35 40.0 SSMI15 35.7 60.5 35.8 60.5 35.8 60.5 Analysis Plot
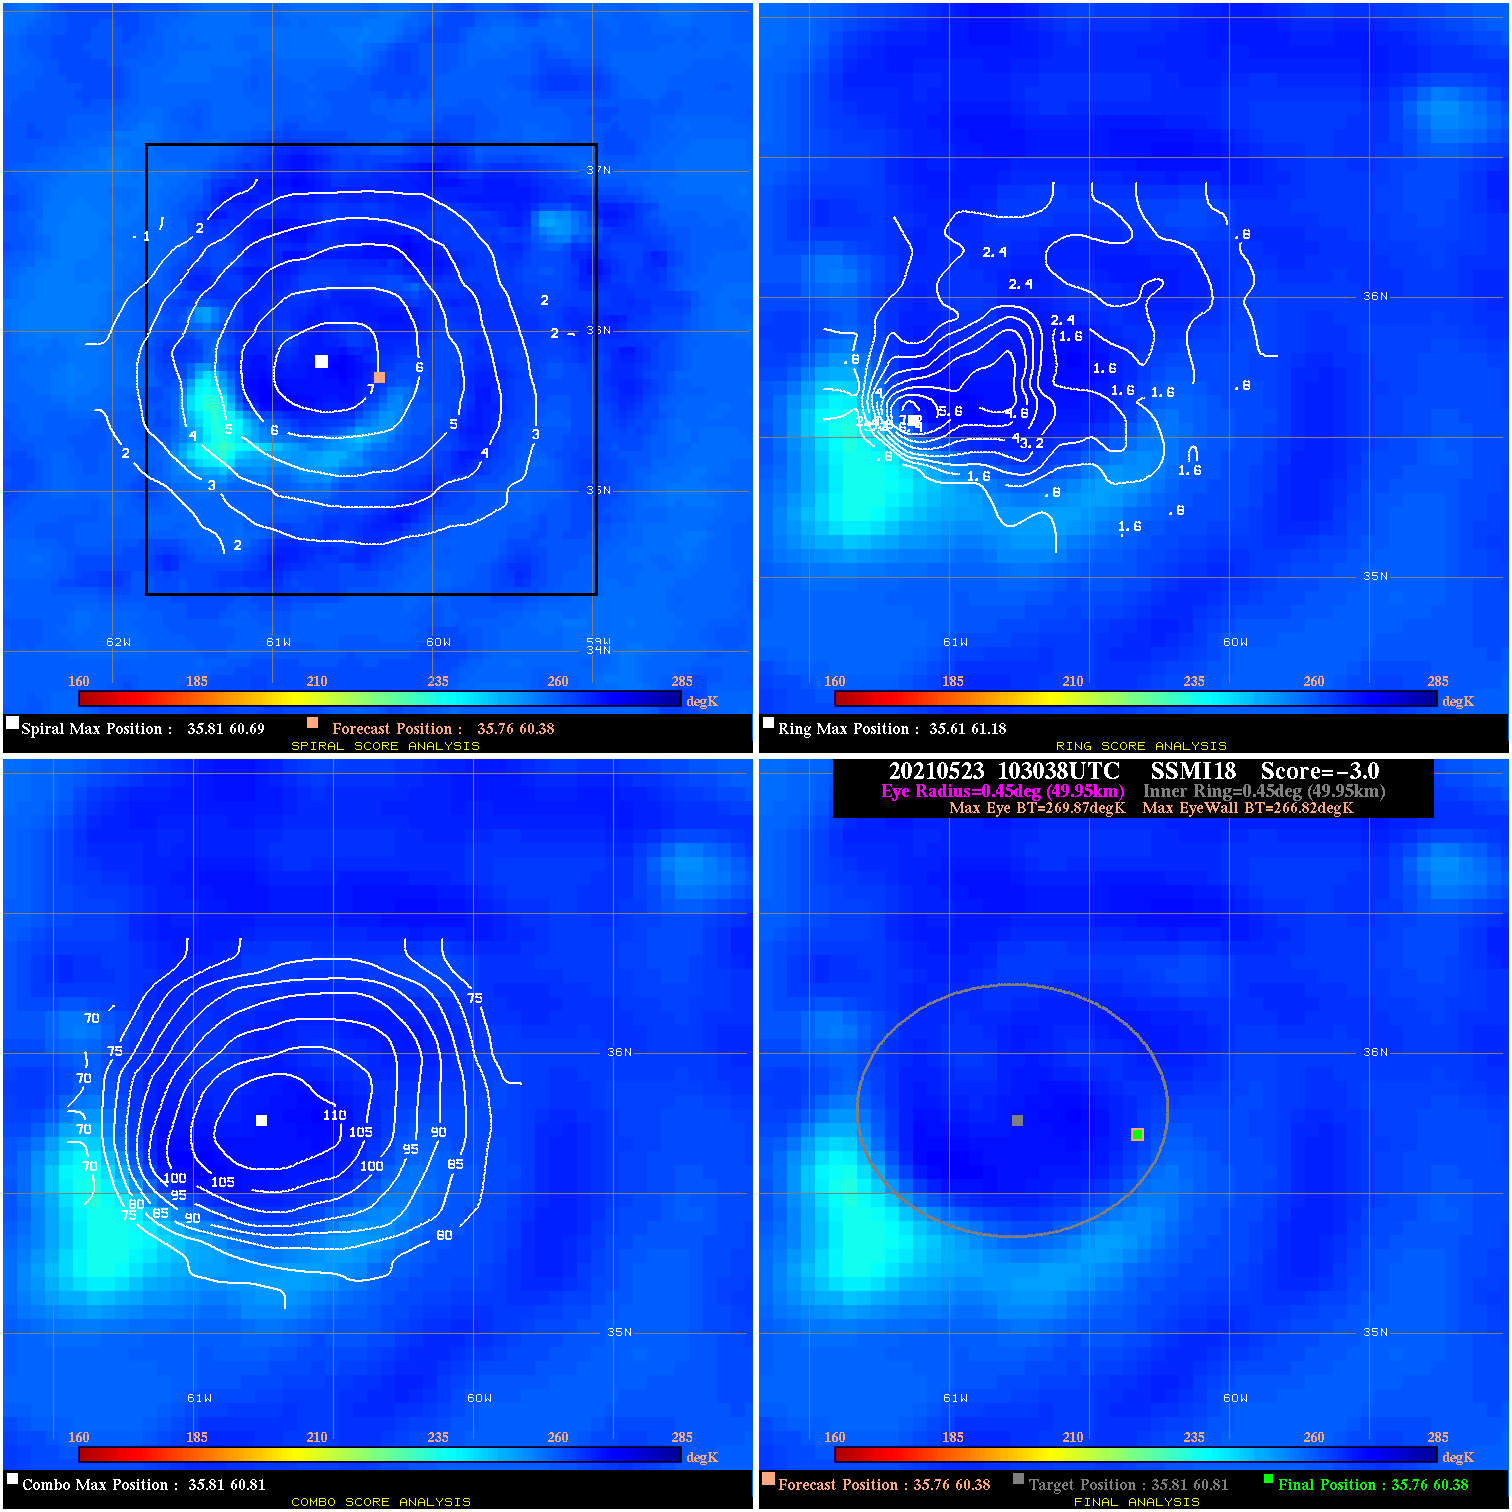
20210523 103038 -3.0 N/A N/A 99.99 3.05 40.0 SSMI18 35.8 60.4 35.8 60.4 35.8 60.8 Analysis Plot
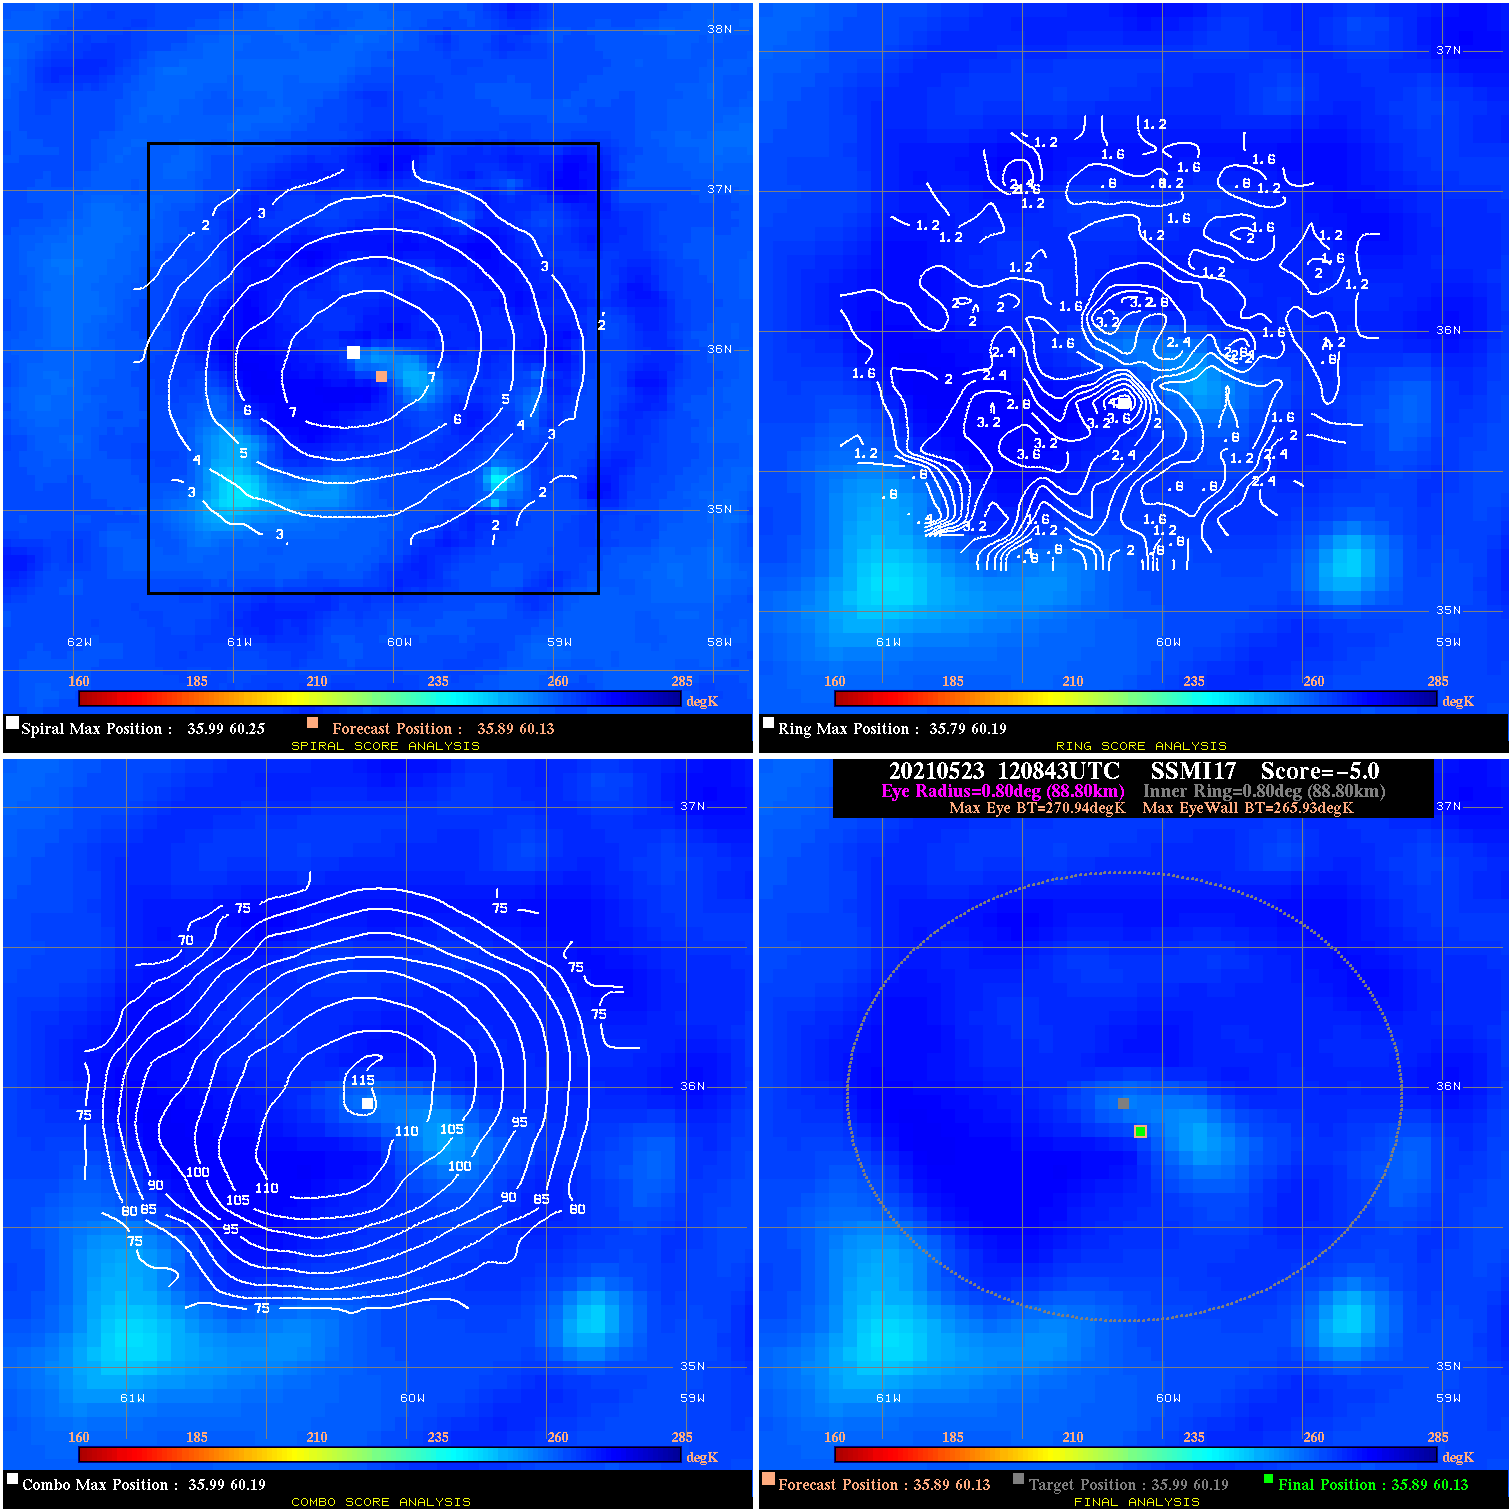
20210523 120843 -5.0 N/A N/A 177.76 5.01 40.0 SSMI17 35.9 60.1 35.9 60.1 36.0 60.2 Analysis Plot
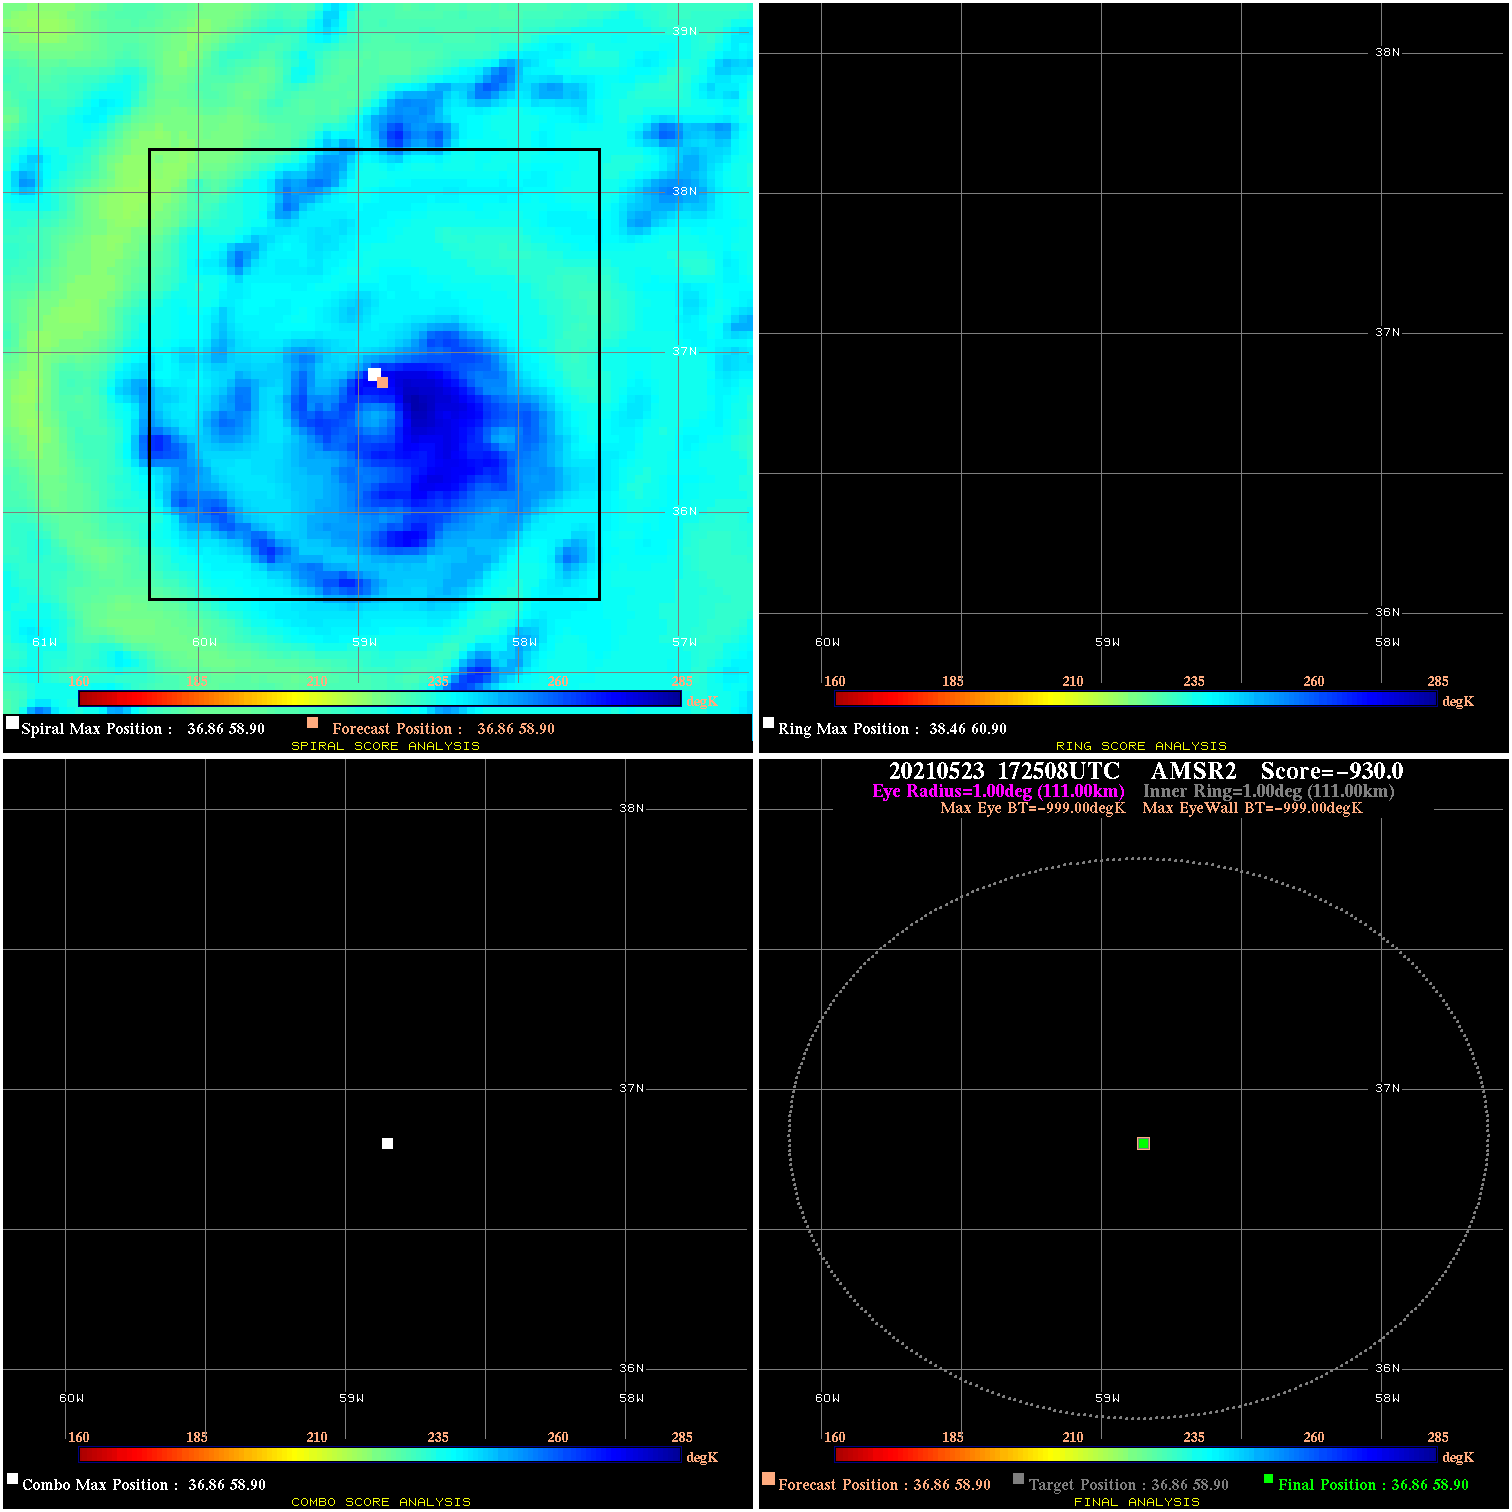
20210523 172508 N/A N/A N/A N/A N/A 35.0 AMSR2 36.9 58.9 36.9 58.9 36.9 58.9 Analysis Plot
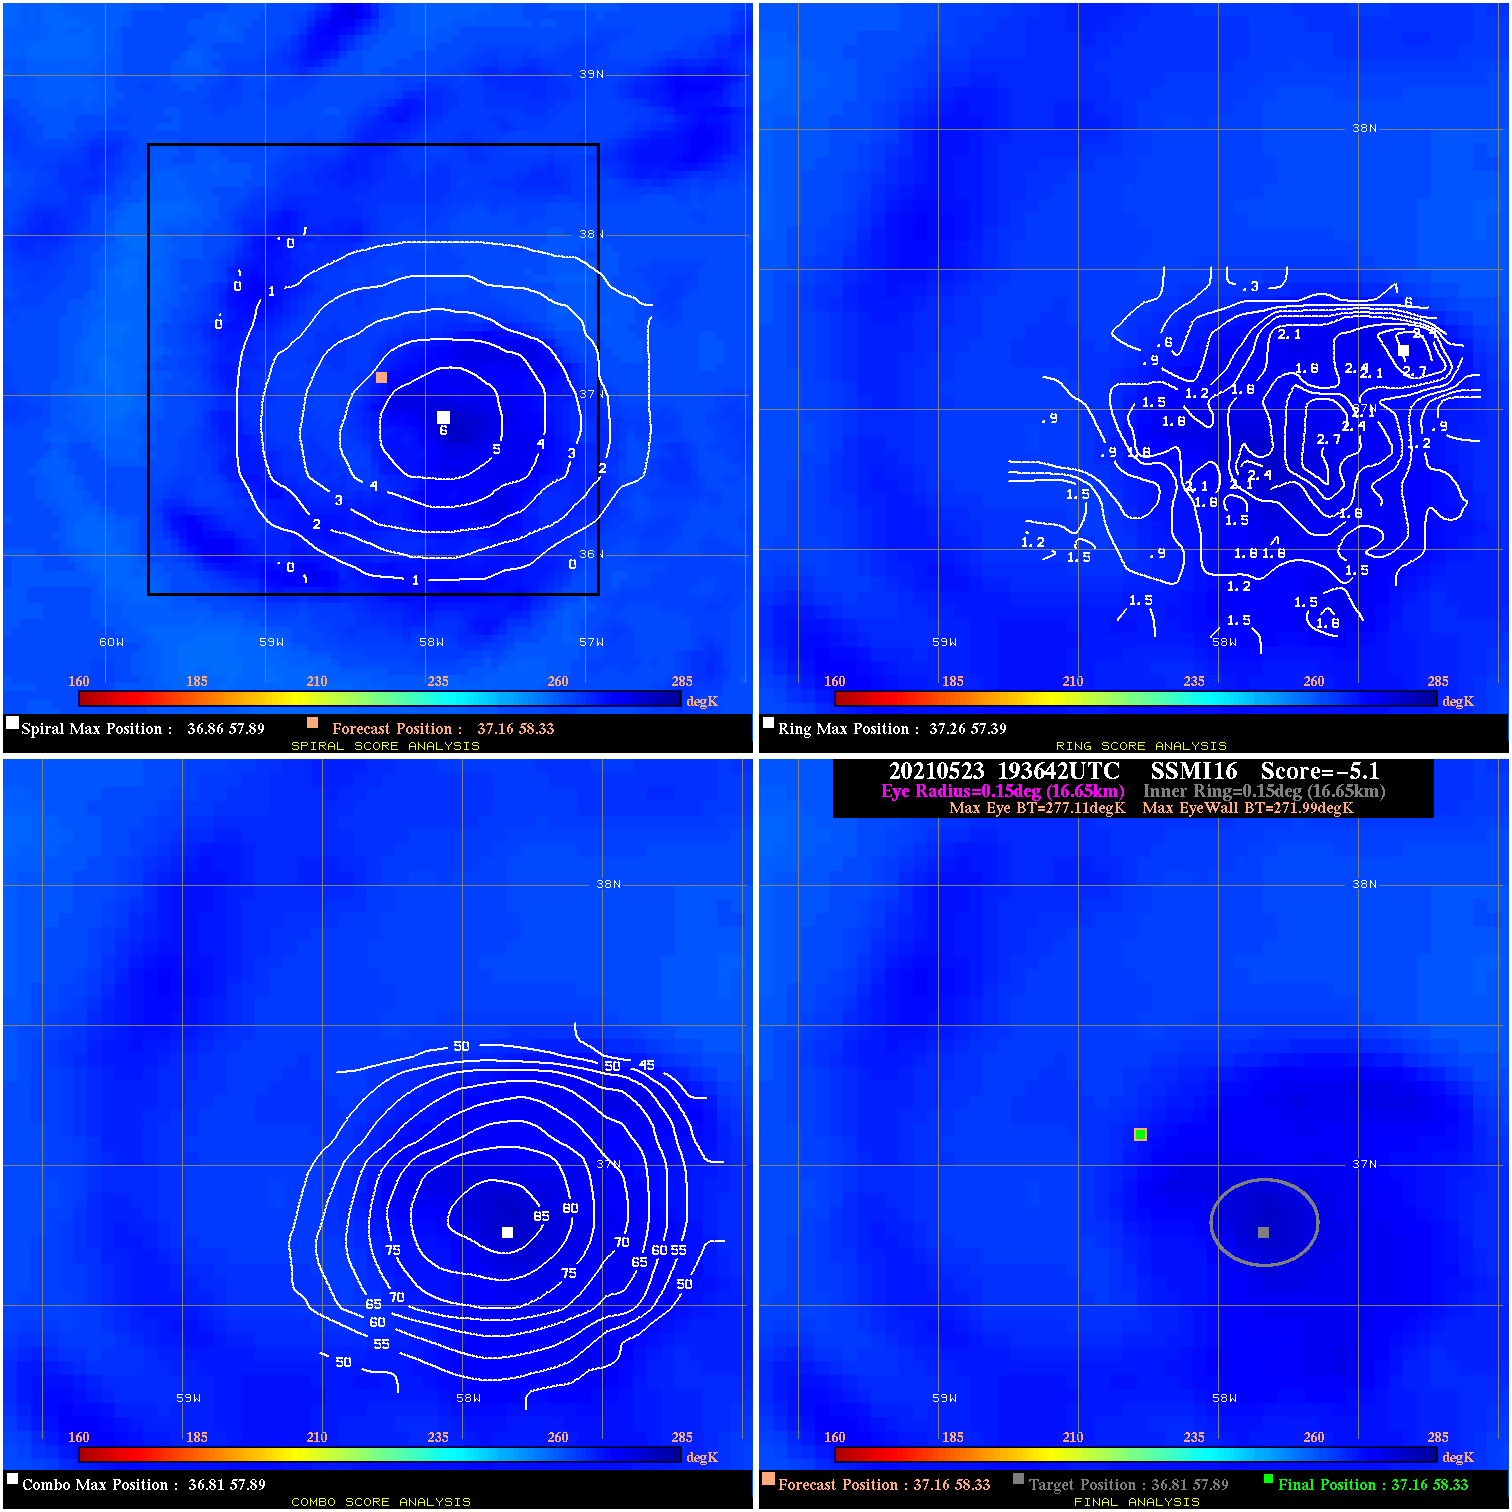
20210523 193642 -5.1 N/A N/A 33.33 5.12 35.0 SSMI16 37.2 58.3 37.2 58.3 36.8 57.9 Analysis Plot
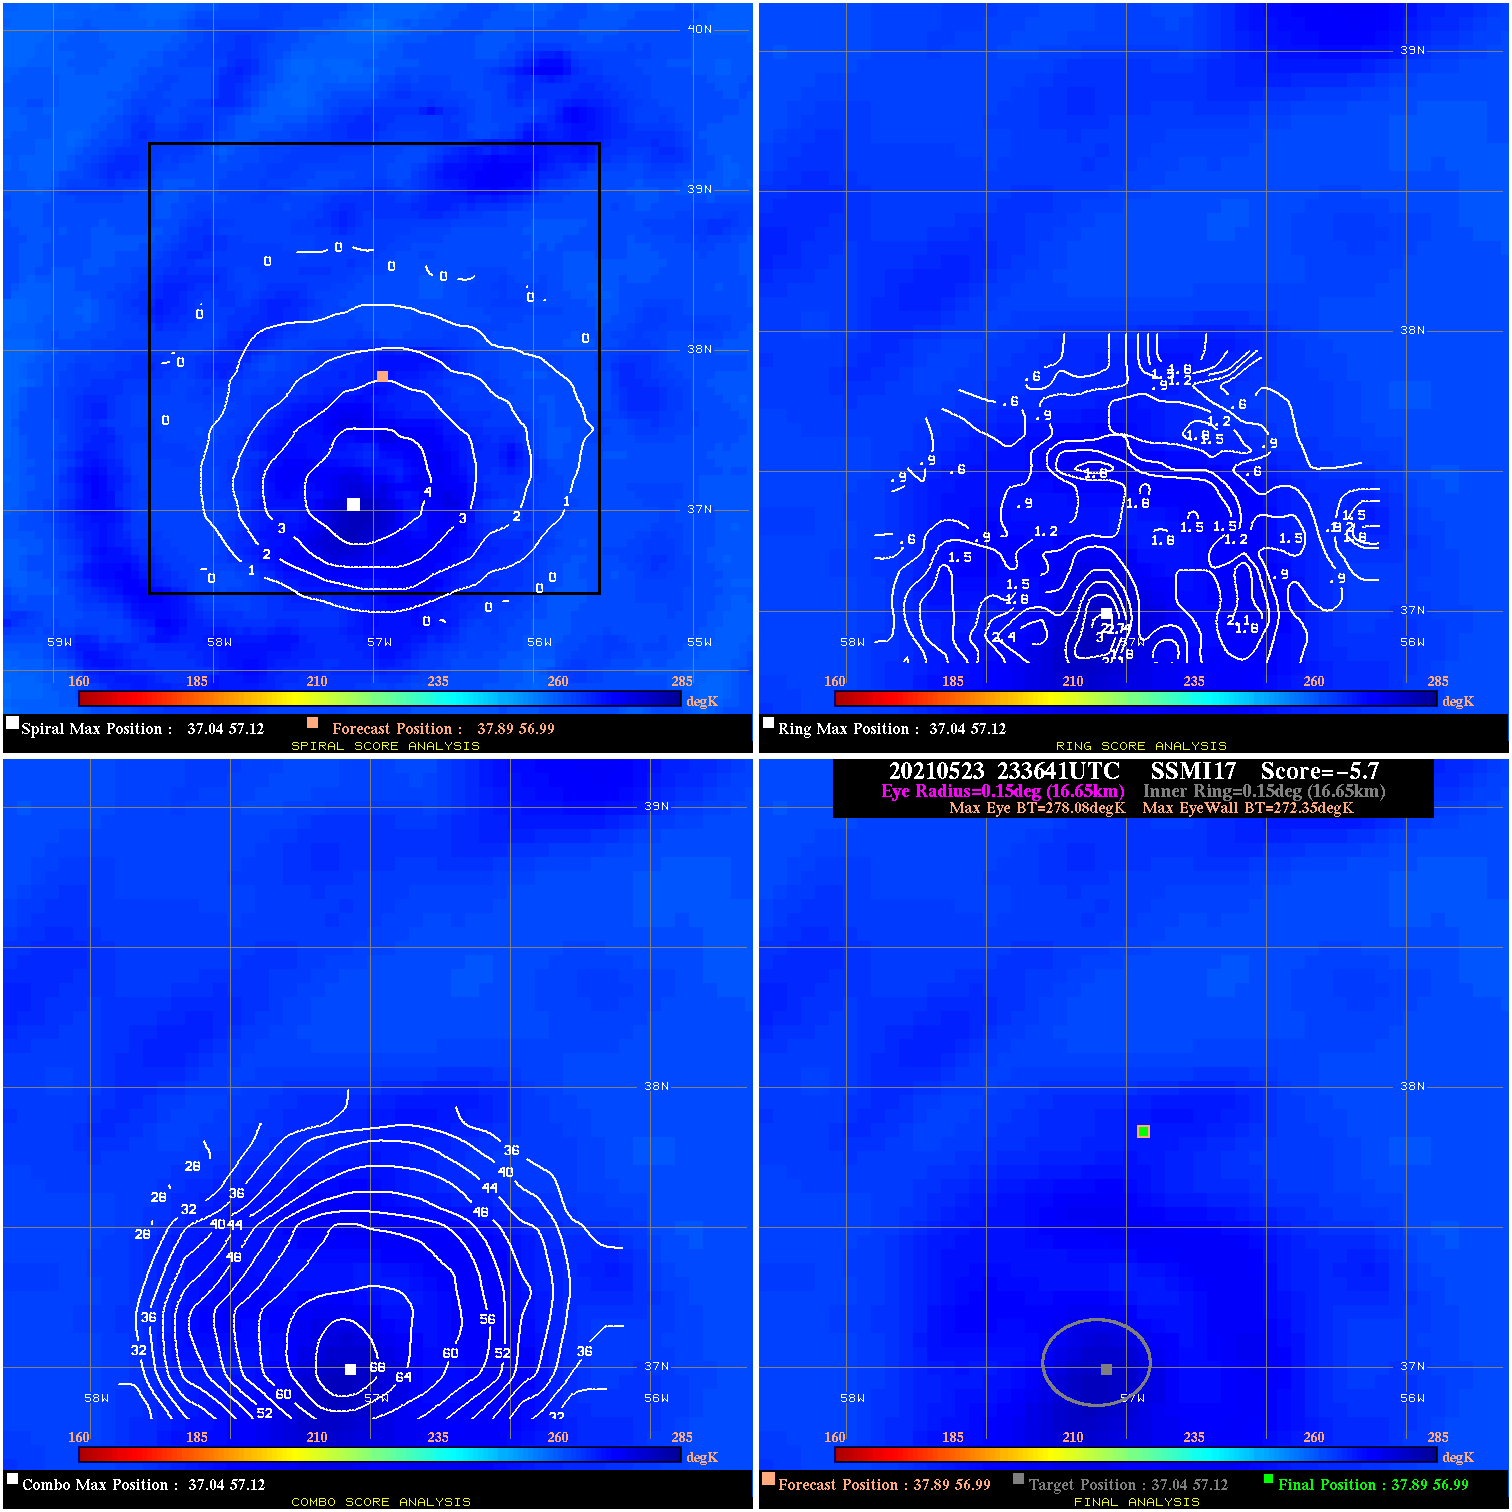
20210523 233641 -5.7 N/A N/A 33.33 5.73 35.0 SSMI17 37.9 57.0 37.9 57.0 37.0 57.1 Analysis Plot
|
|
Legend: - Date/Time are determined from PMW imagery at Forecast (initial guess) Lat/Lon position. - Positive/Negative Latitude = North/South Hemisphere; Longitude = Western/Eastern Hemisphere. - "Ring Diam" value indicates the estimated surface eyewall diameter in km (the MI eyewall edge diameter minus 10 km). - "Ring Pct" is the percentage of the "ring" (eyewall inner boundary) that is 1) colder than the "hot spot" (warmest eye pixel) in the eye by 20K, or 2) the percentage that is a) colder than 232K and b) colder than the "hot spot" by 10K, whichever is greater. - Values are red if Ring % <= 65, yellow/brown if Ring % <= 85 and green if Ring % > 85. - "Tb diff" is the difference between the "hot spot" (warmest eye pixel) and the warmest pixel on the eyewall. - Intensity score are listed as negative, and not used, when the JTWC or NHC estimated Vmax is <55 kts in order to rule out weak but highly symmetric TCs. - Error messages in intensity scores: -920 is used when the hottest pixel in the eye is <200K, to prevent false positives; -930 means <85% of eyewall has observations/data. |