Tropical Depression 03A
|
Passive Microwave (PMW) Intensity Information Hurricane Intensity Estimation (HIE) Algorithm Version 9.0 |
Overpass Inten Ring Ring Wind Forecast Final Target
Date Time Score Meaning Pct Diam BTdiff Est Sat Lat Lon Lat Lon Lat Lon
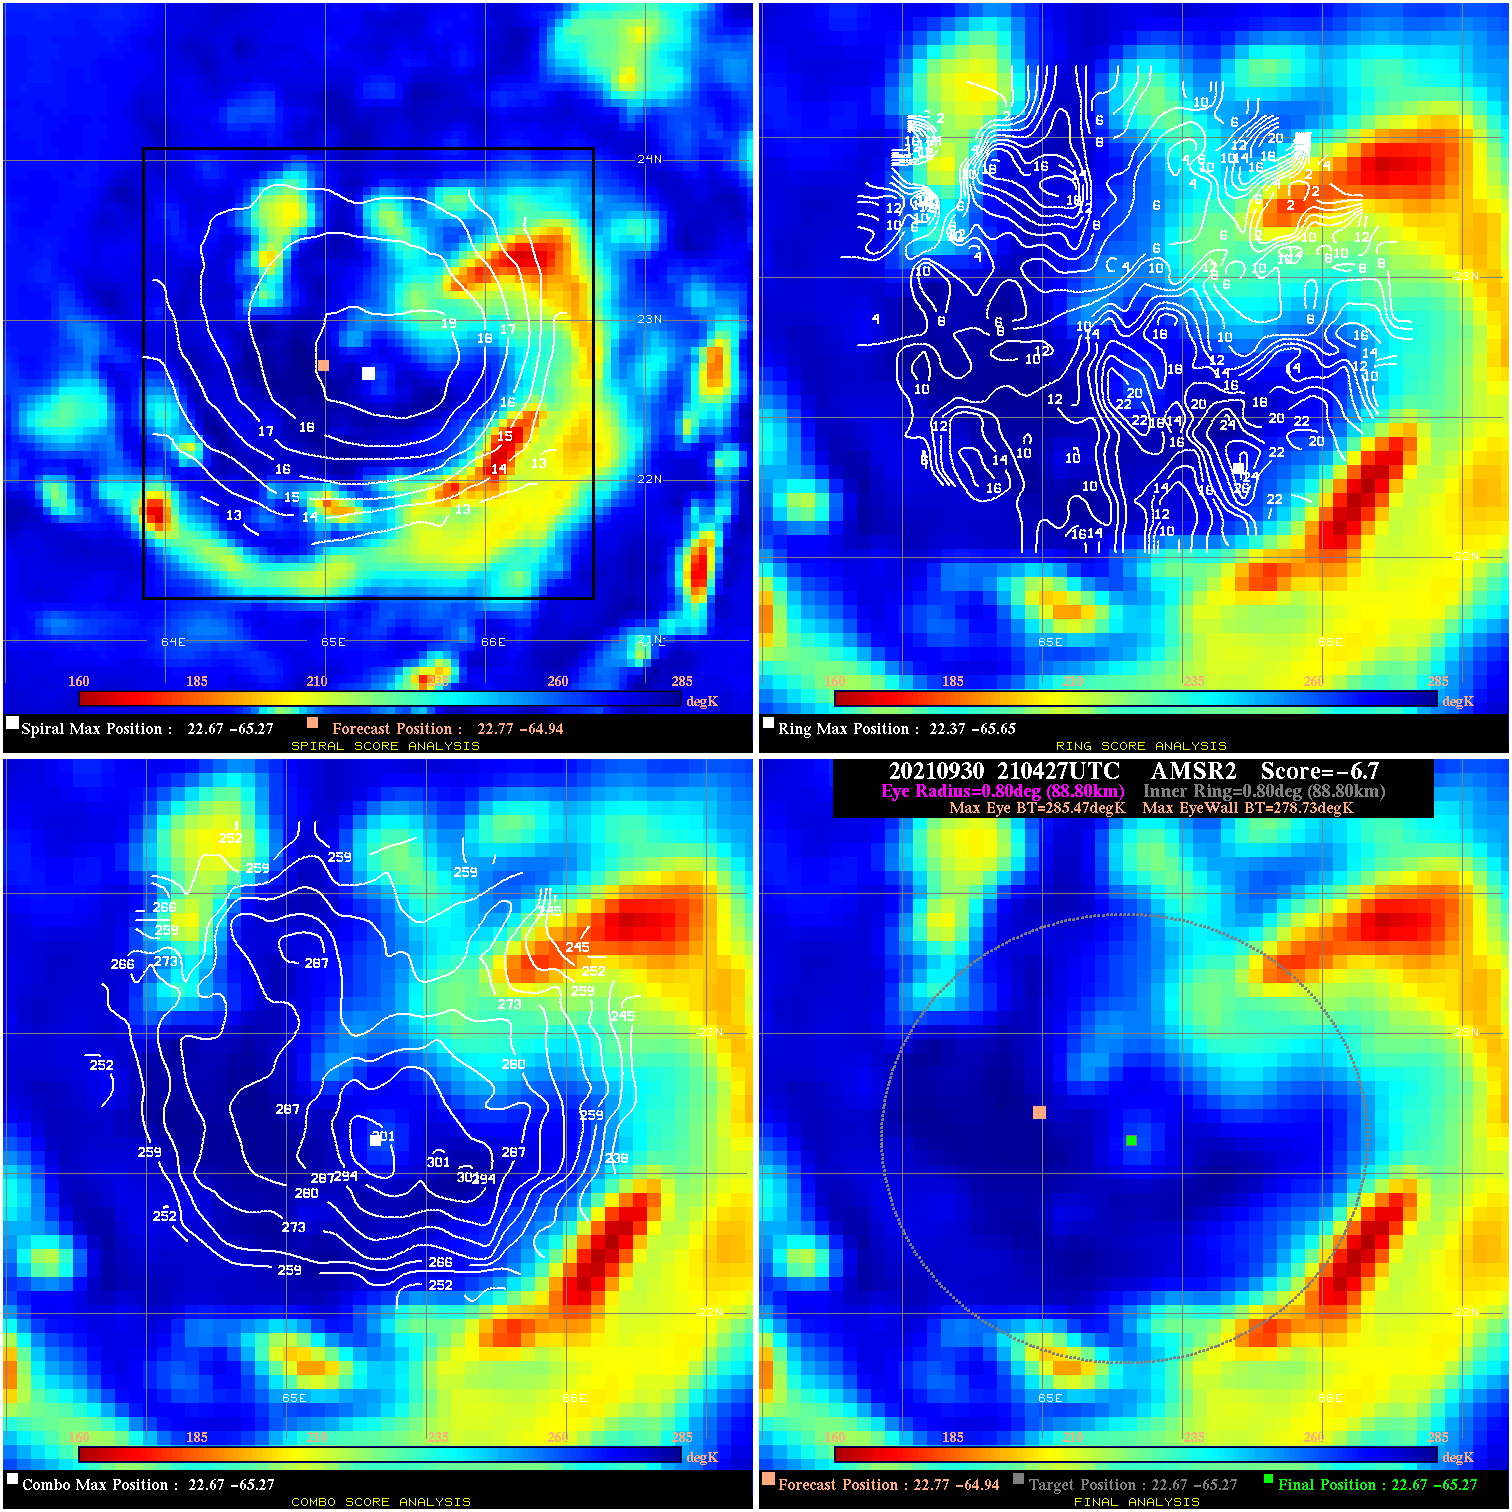
20210930 210427 -6.7 N/A 45.2% 177.76 6.74 40.0 AMSR2 22.8 -64.9 22.7 -65.3 22.7 -65.3 Analysis Plot
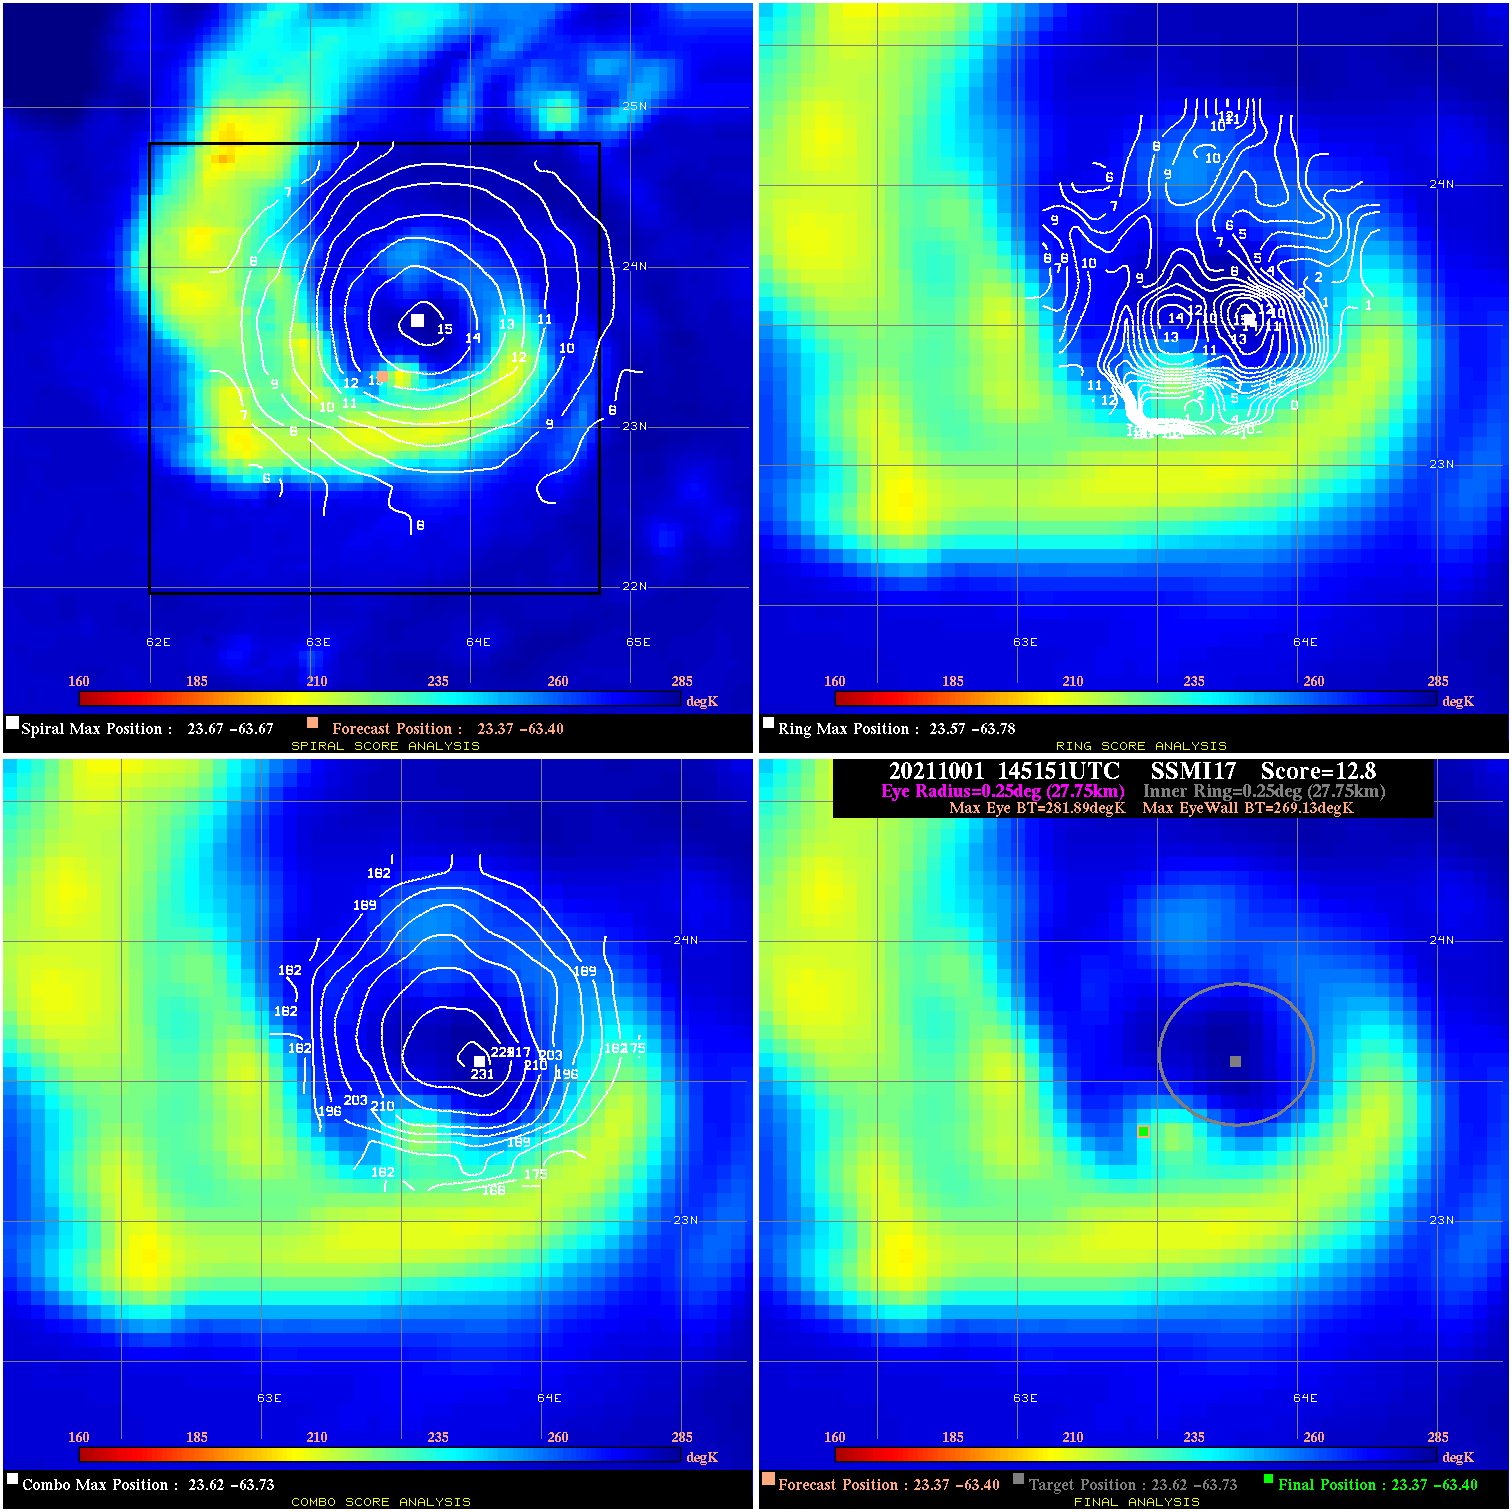
20211001 145151 12.8 N/A 35.6% 55.55 12.76 60.0 SSMI17 23.4 -63.4 23.4 -63.4 23.6 -63.7 Analysis Plot
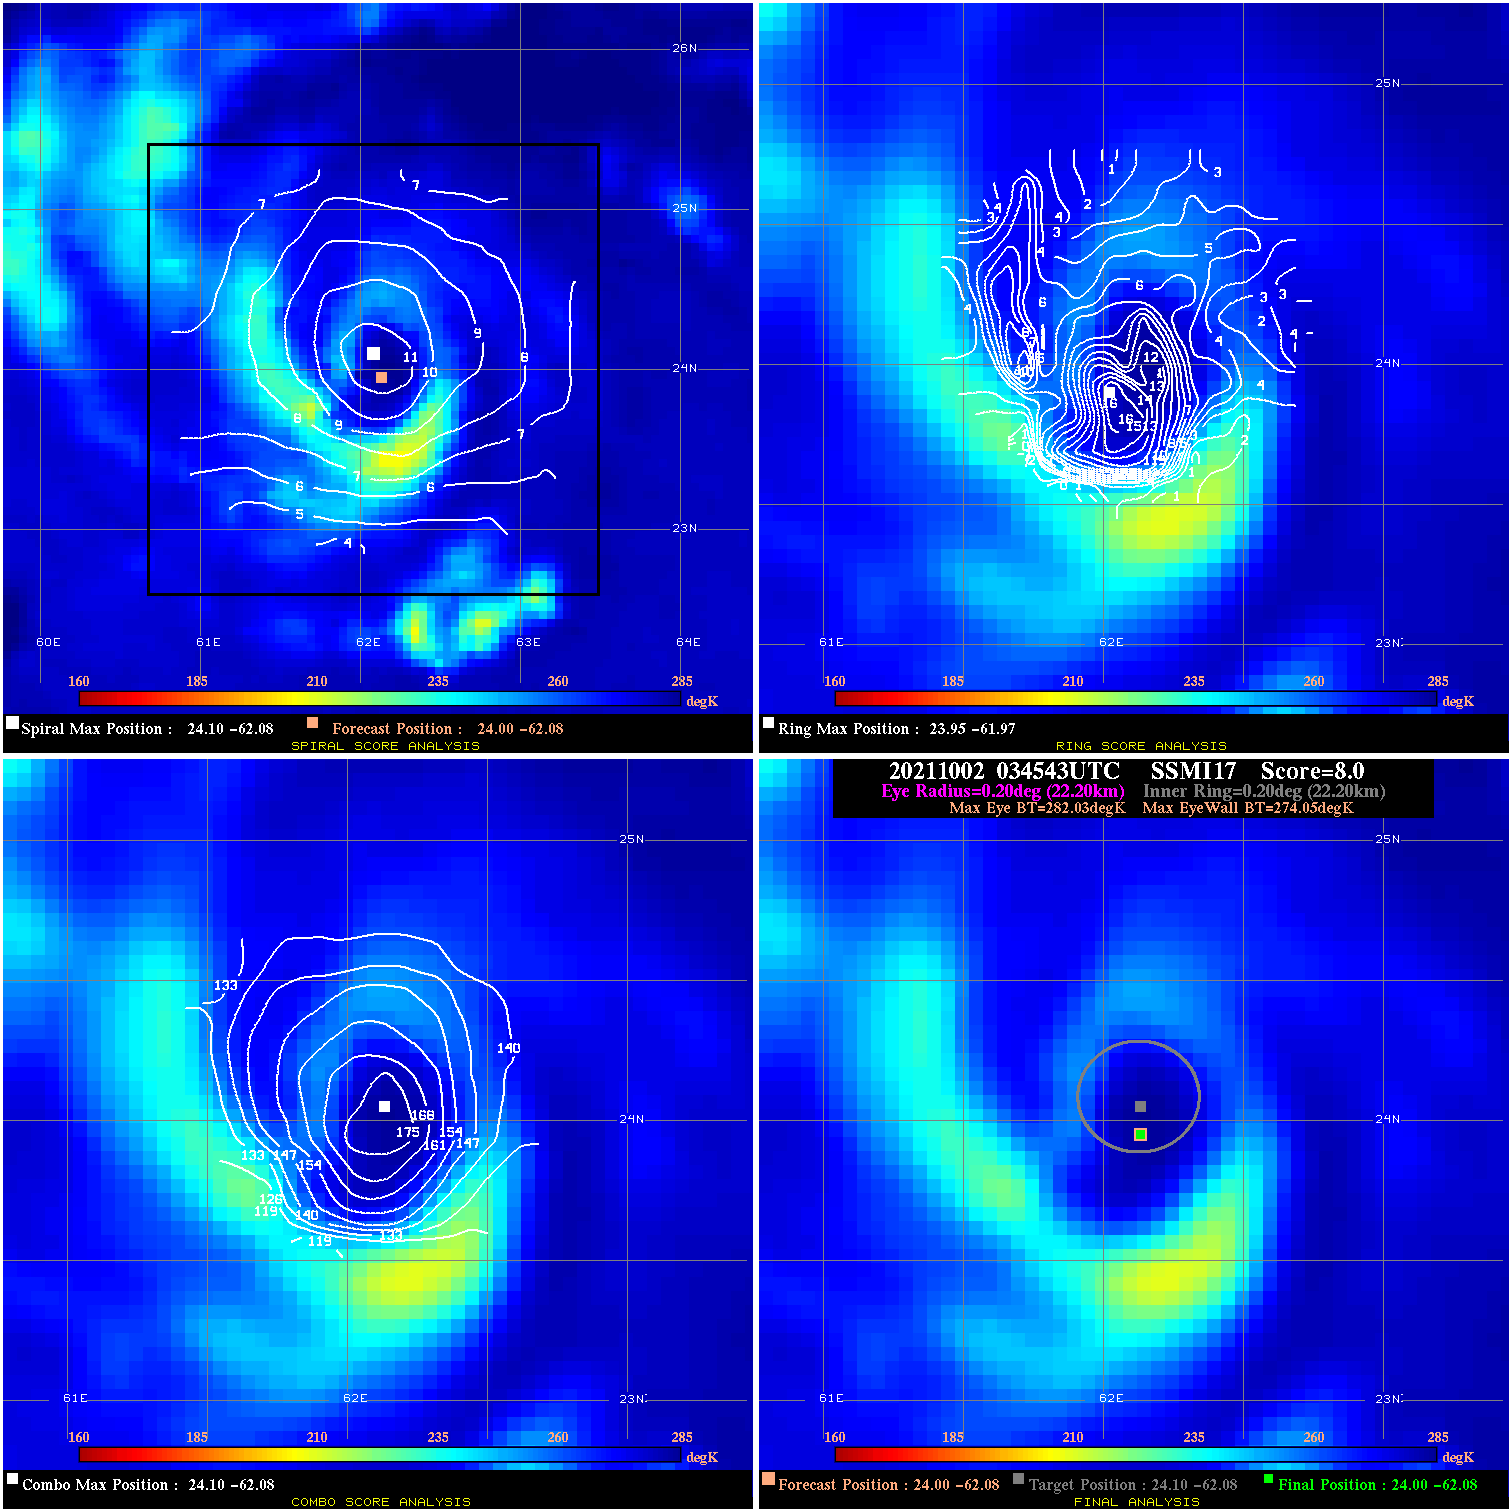
20211002 034543 8.0 N/A 6.8% 44.44 7.98 65.0 SSMI17 24.0 -62.1 24.0 -62.1 24.1 -62.1 Analysis Plot
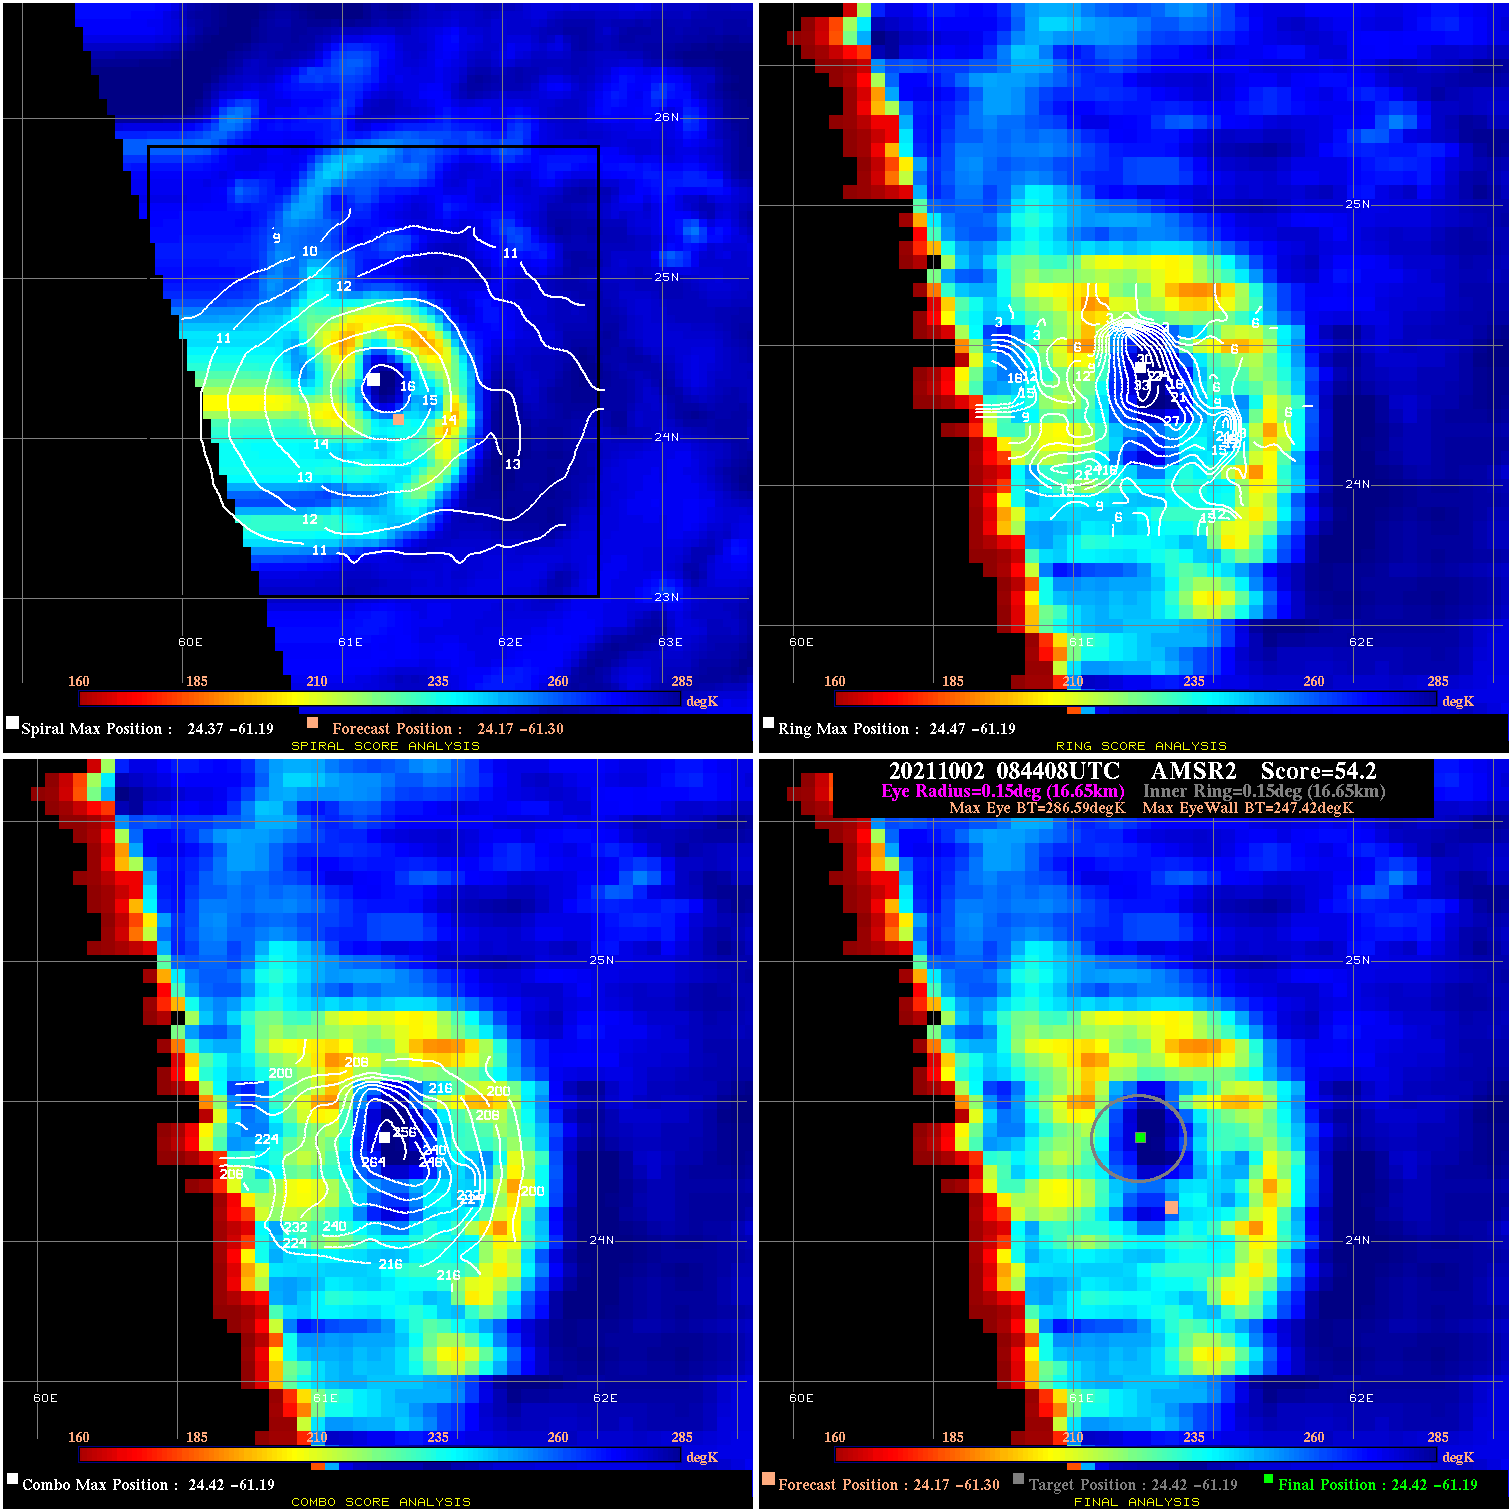
20211002 084408 54.2 >65 kts 100.0% 33.33 39.17 60.0 AMSR2 24.2 -61.3 24.4 -61.2 24.4 -61.2 Analysis Plot
20211002 131315 36.4 >65 kts 100.0% 33.33 21.37 60.0 SSMI16 24.4 -60.8 24.4 -60.8 24.3 -60.3 Analysis Plot
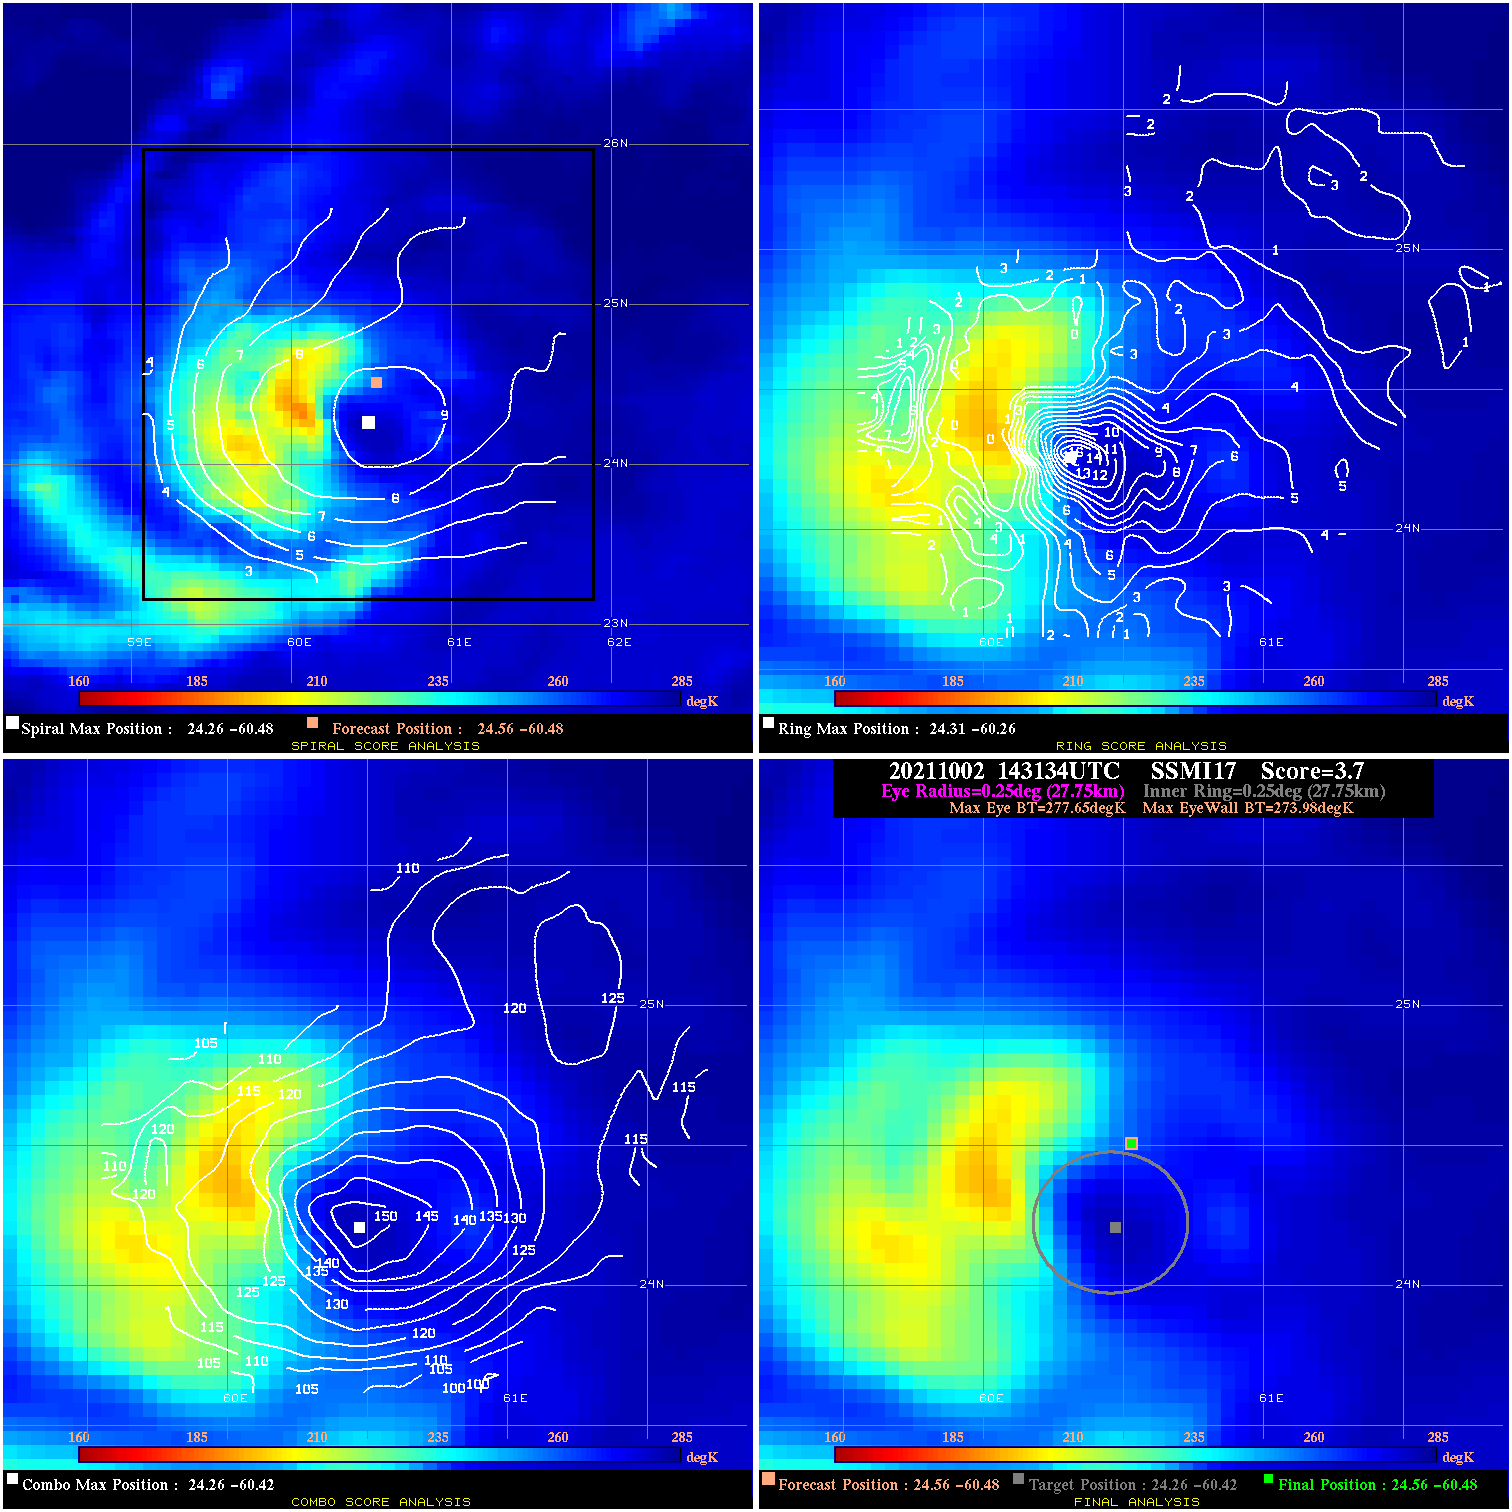
20211002 143134 3.7 N/A 17.8% 55.55 3.67 65.0 SSMI17 24.6 -60.5 24.6 -60.5 24.3 -60.4 Analysis Plot
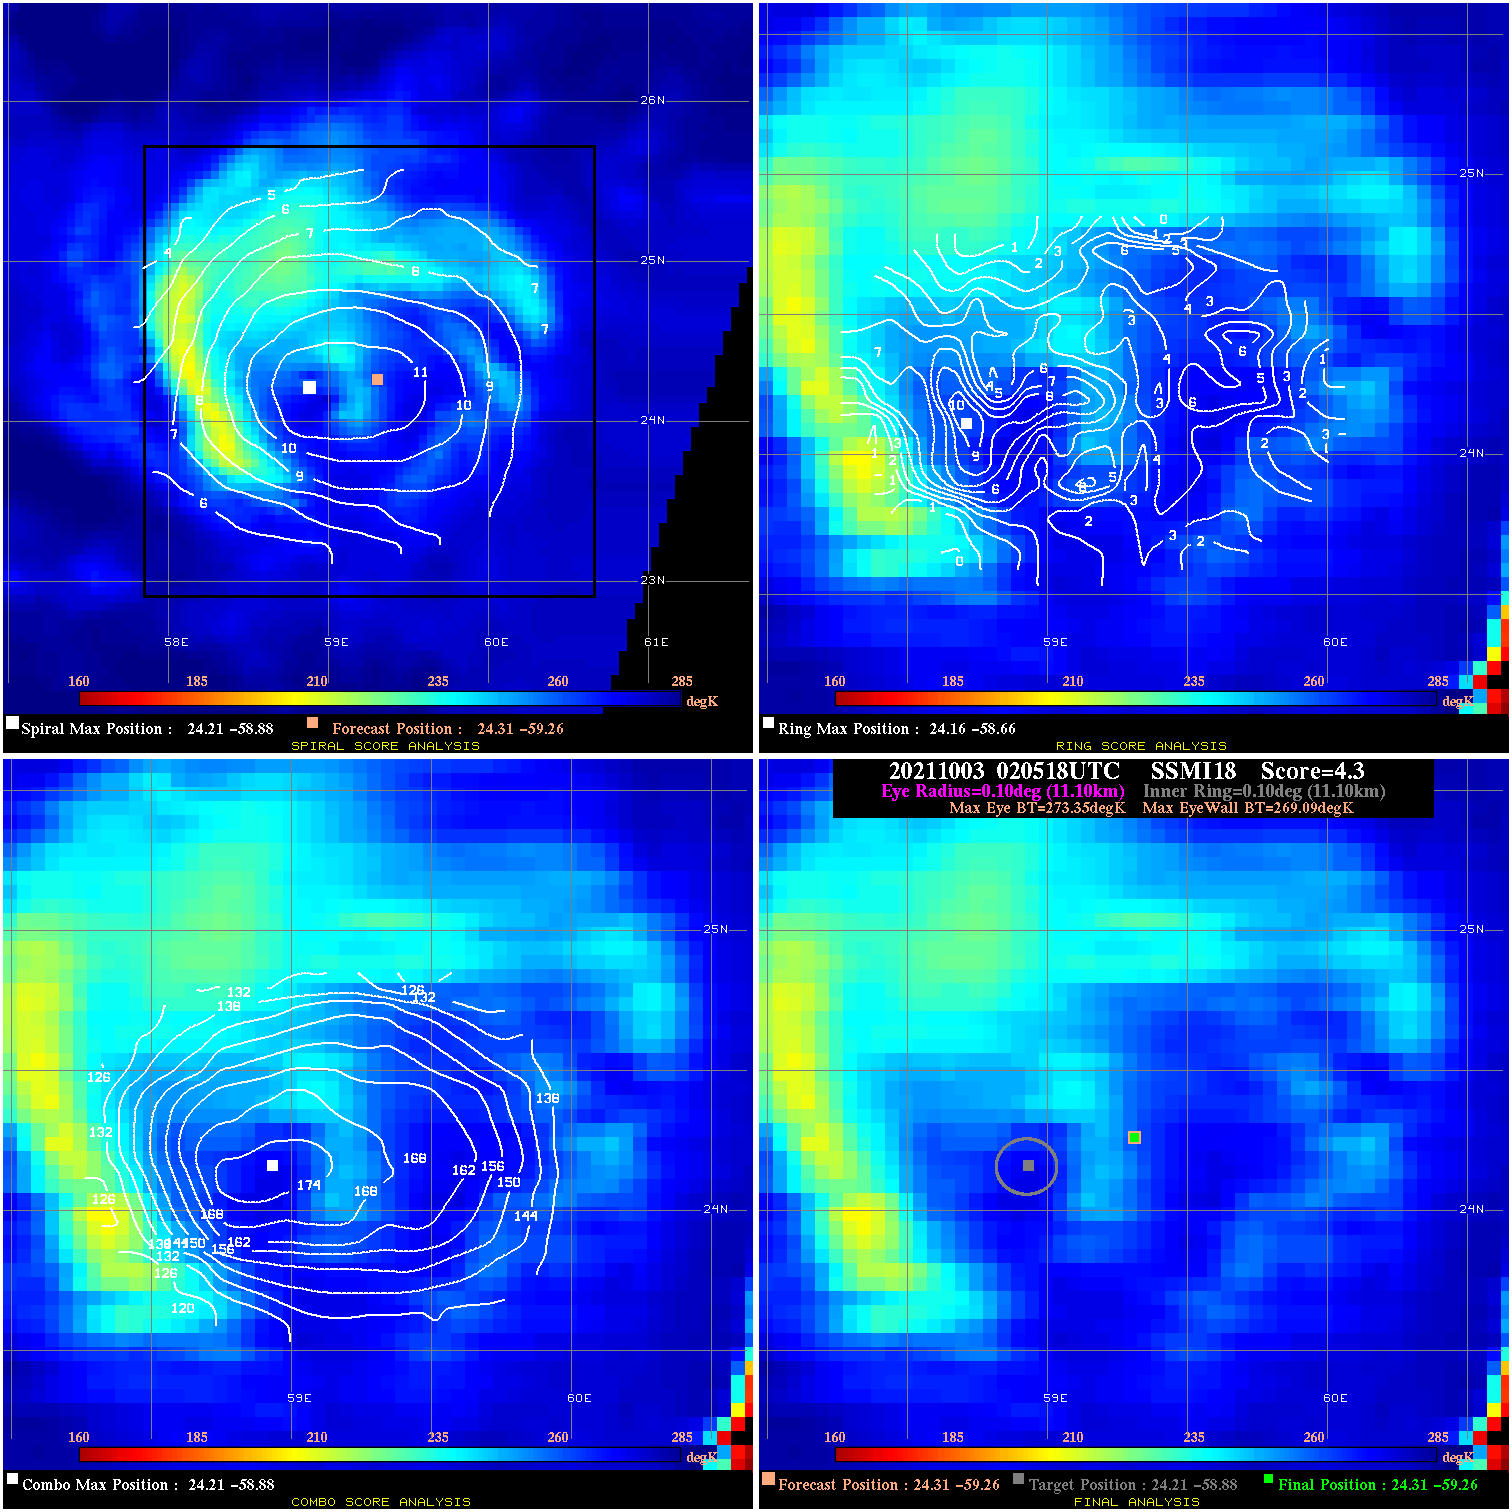
20211003 020518 4.3 N/A N/A 22.22 4.26 65.0 SSMI18 24.3 -59.3 24.3 -59.3 24.2 -58.9 Analysis Plot
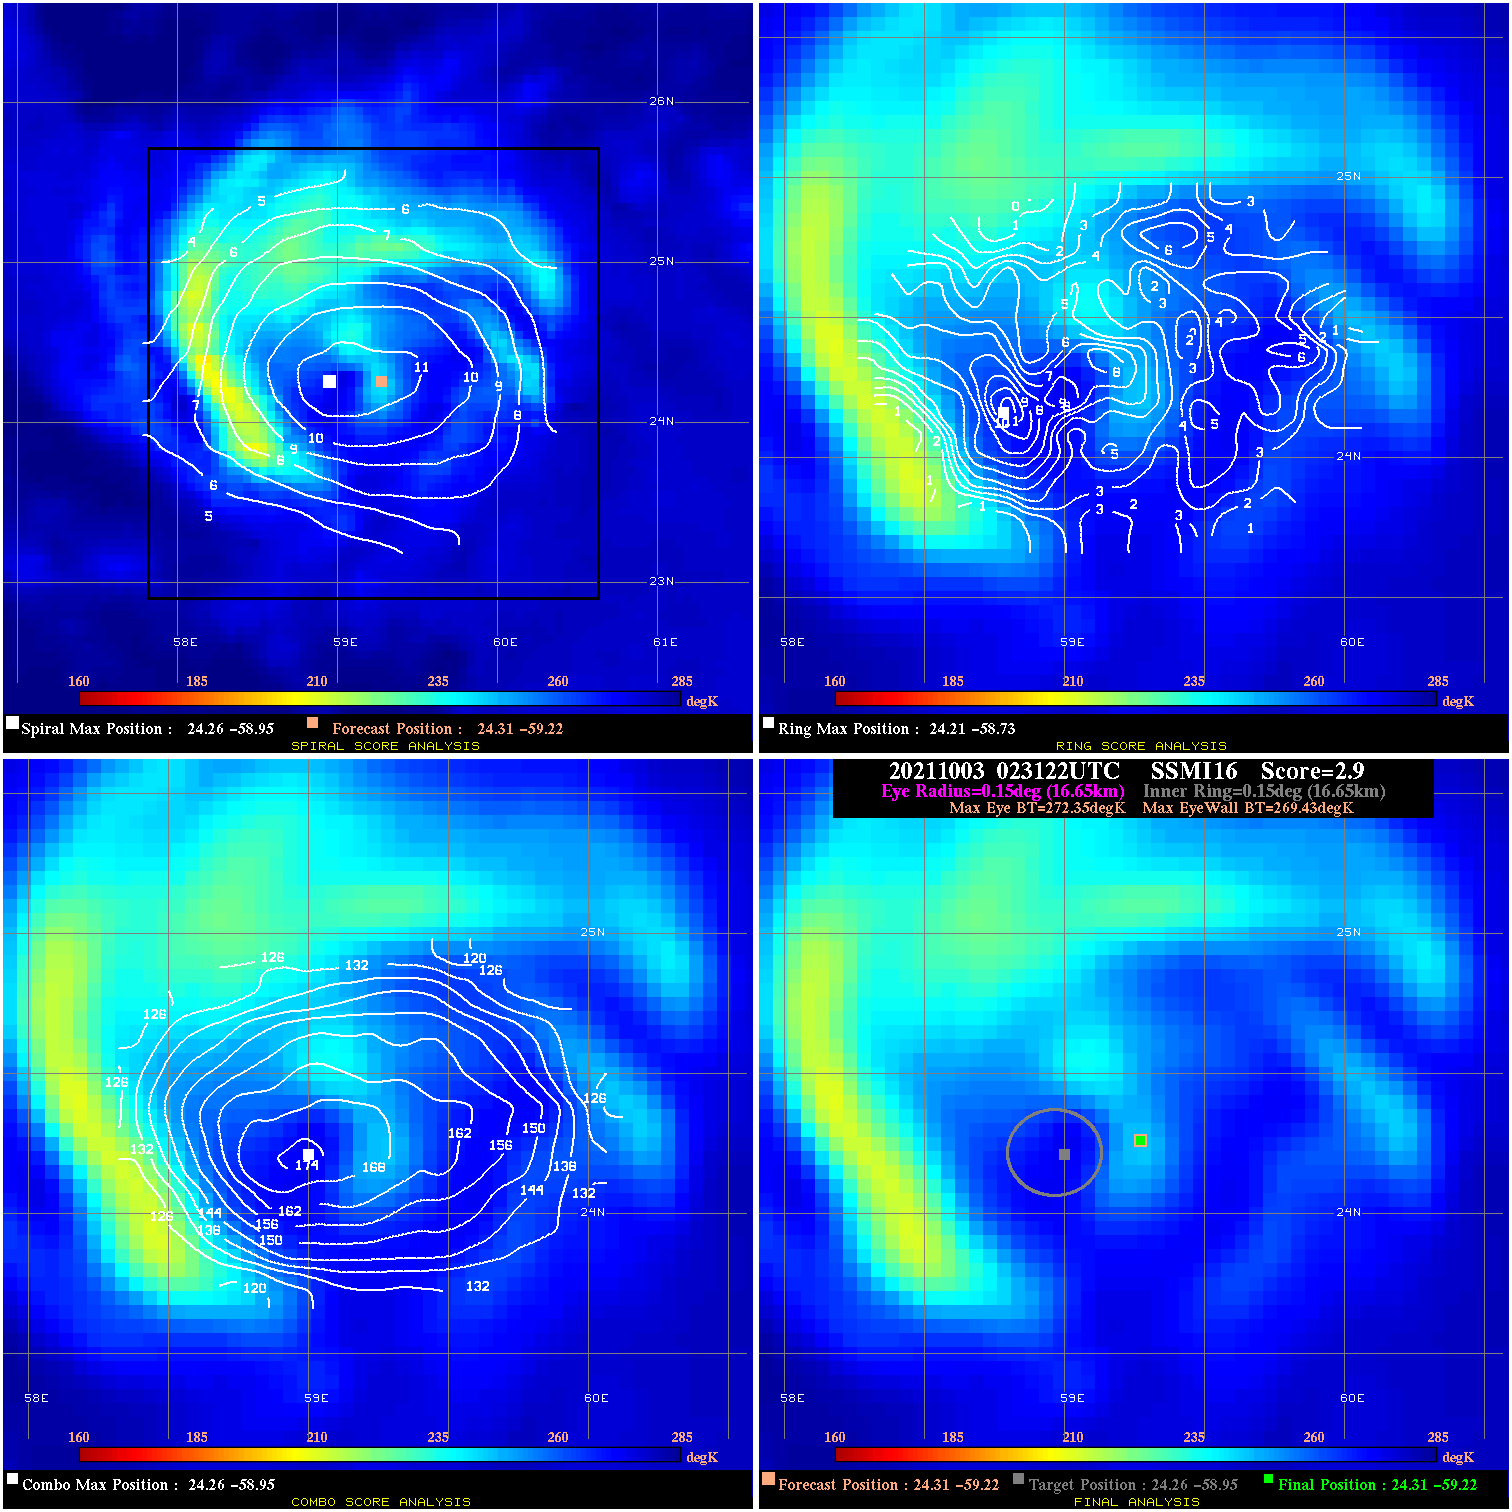
20211003 023122 2.9 N/A N/A 33.33 2.92 65.0 SSMI16 24.3 -59.2 24.3 -59.2 24.3 -59.0 Analysis Plot
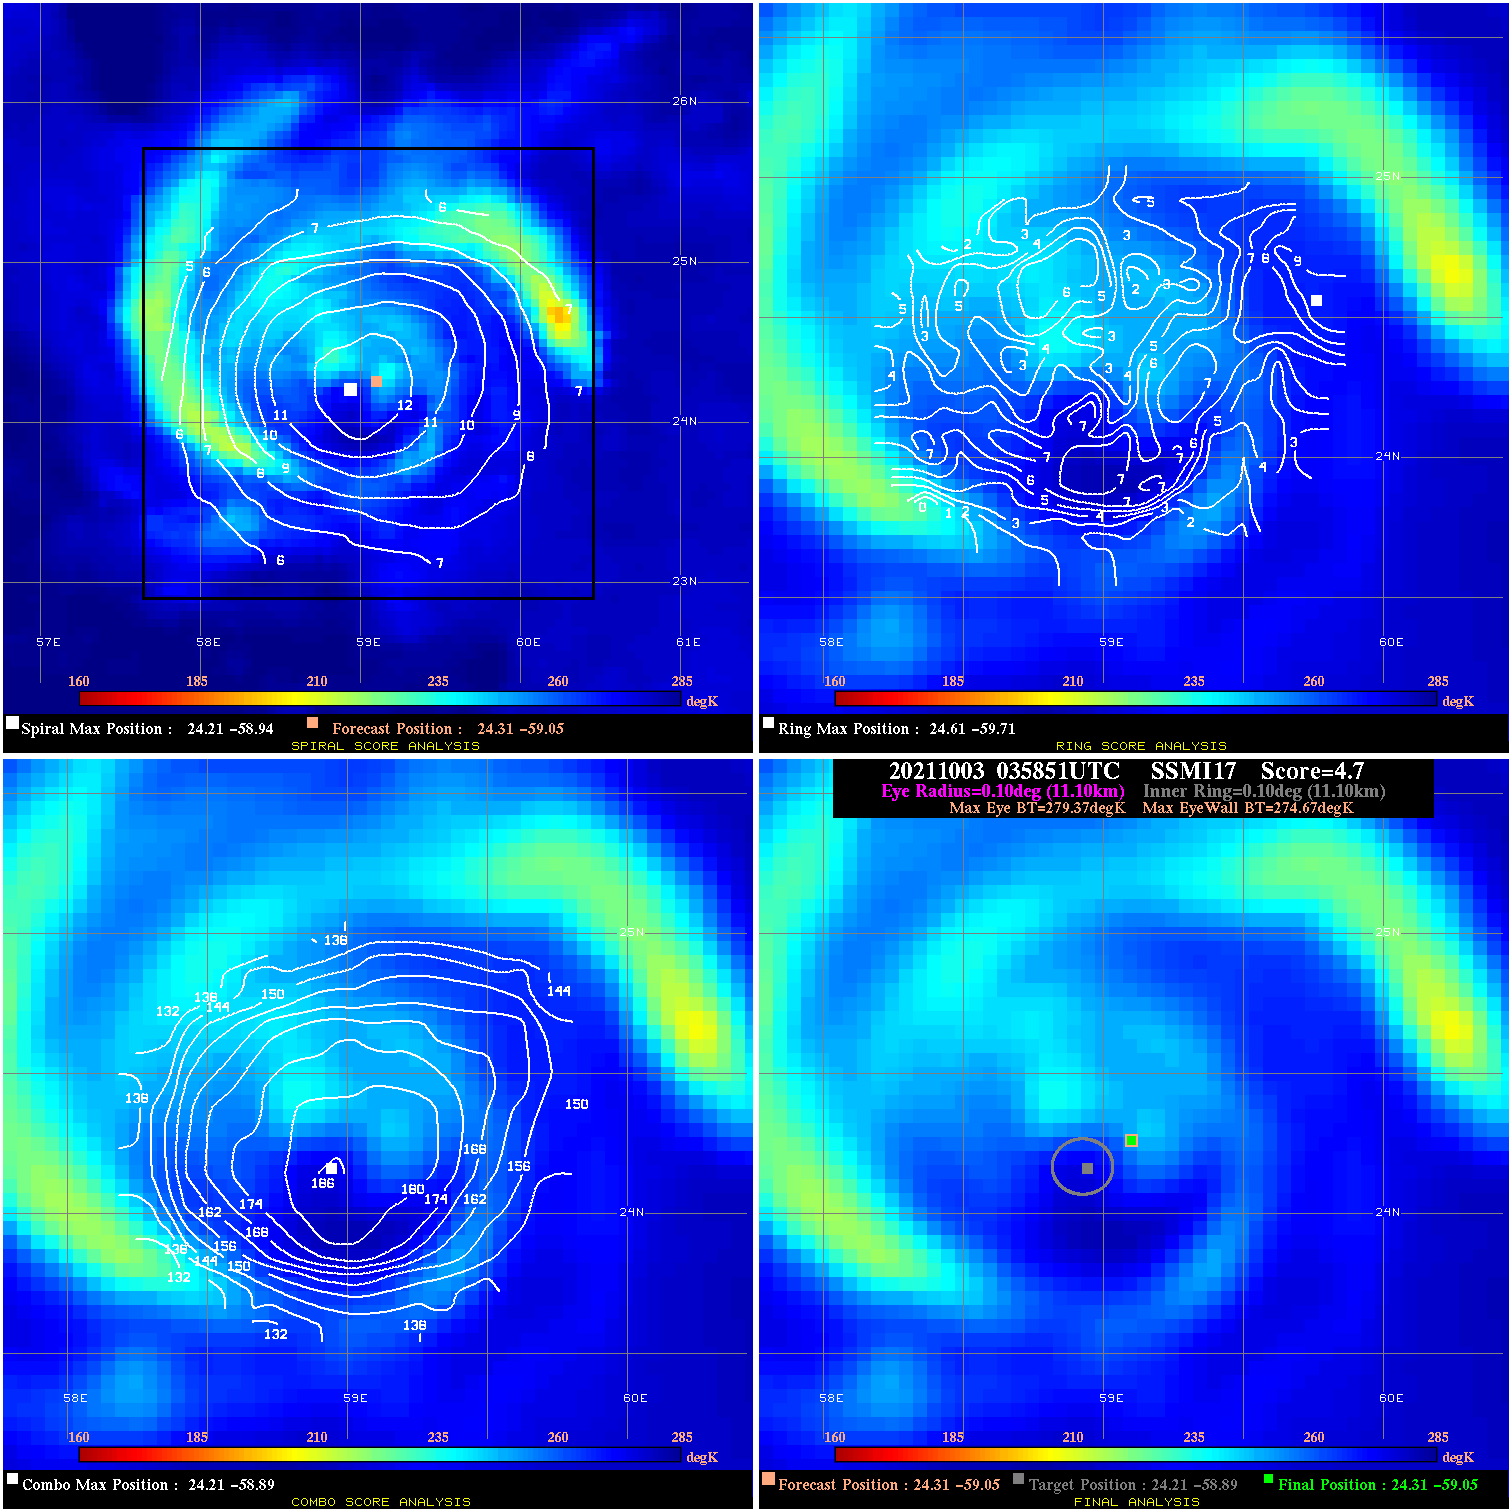
20211003 035851 4.7 N/A N/A 22.22 4.70 65.0 SSMI17 24.3 -59.0 24.3 -59.0 24.2 -58.9 Analysis Plot
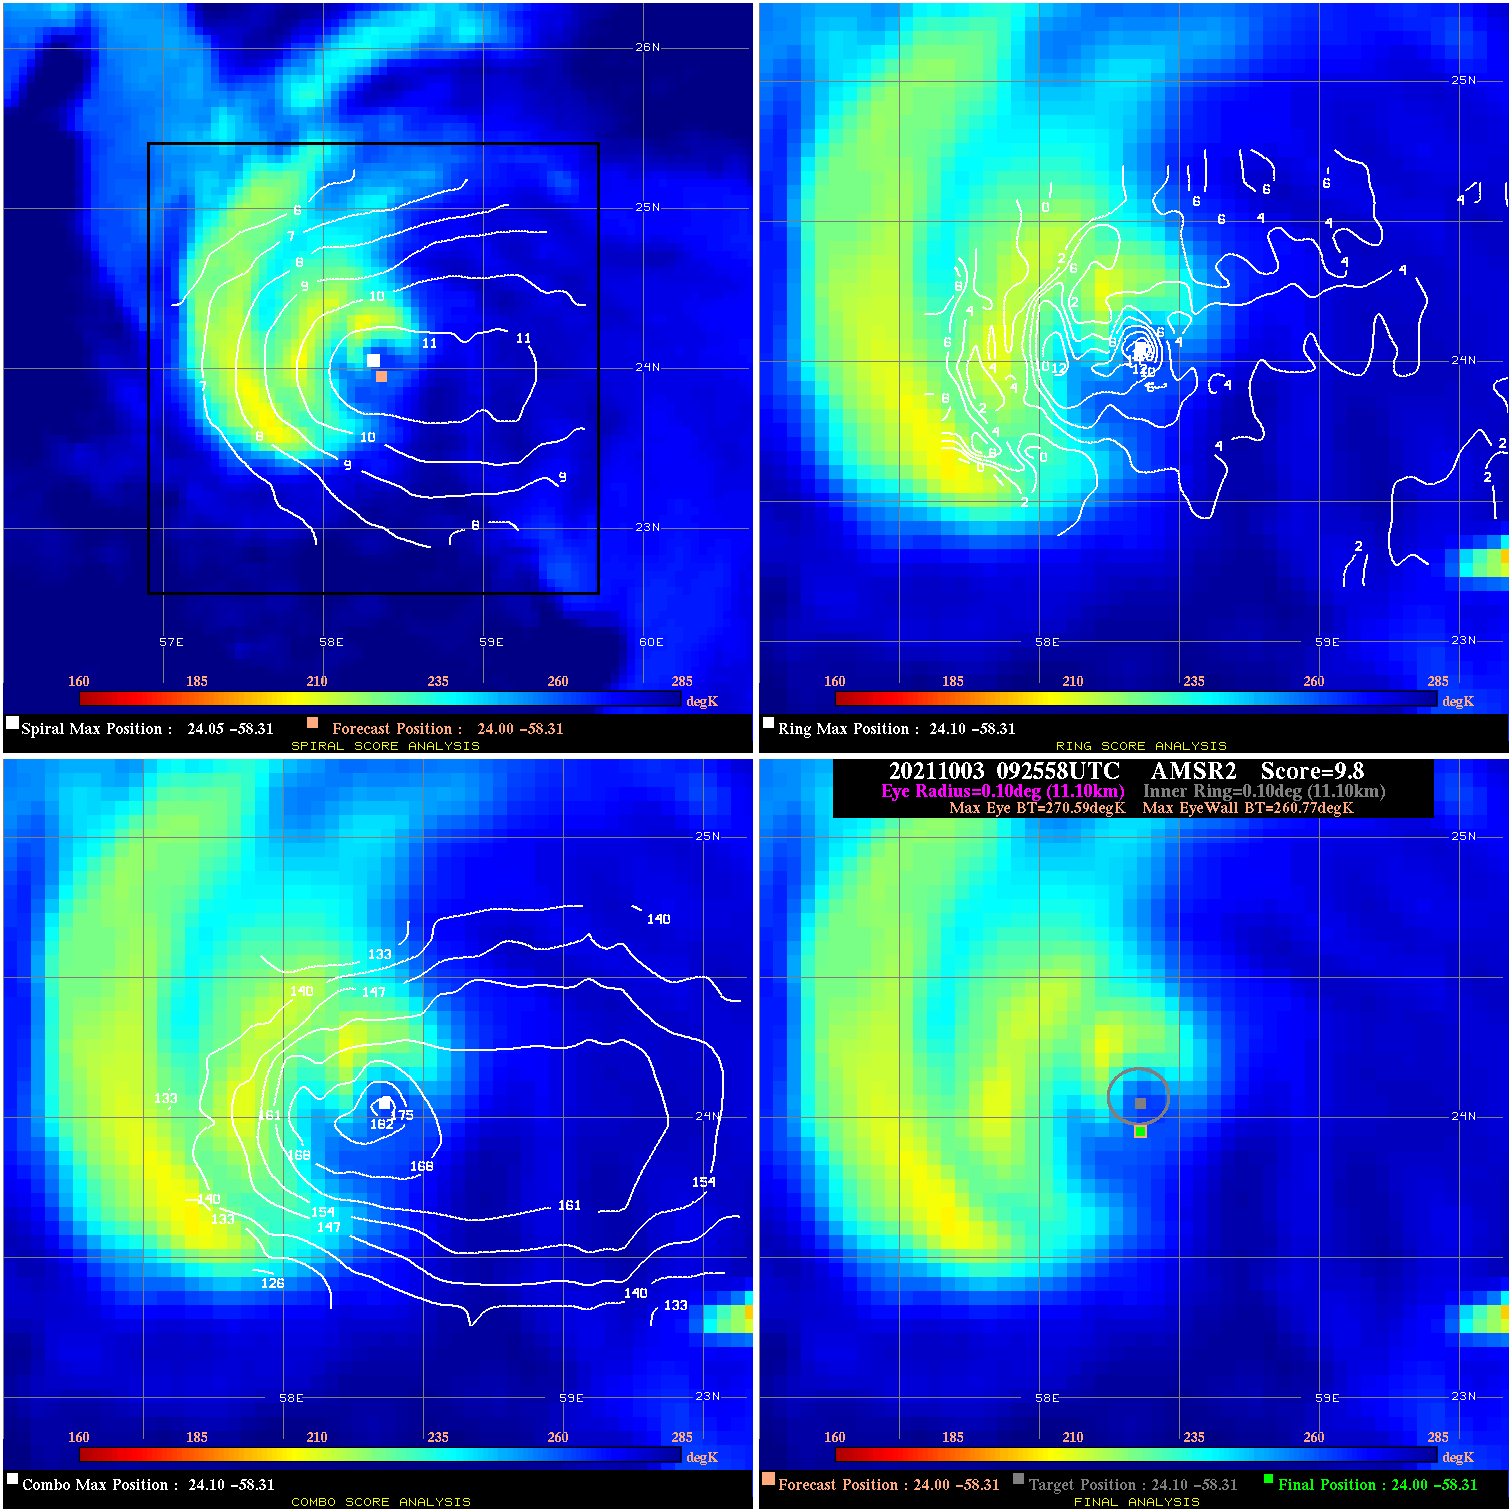
20211003 092558 9.8 N/A 35.6% 22.22 9.82 70.0 AMSR2 24.0 -58.3 24.0 -58.3 24.1 -58.3 Analysis Plot
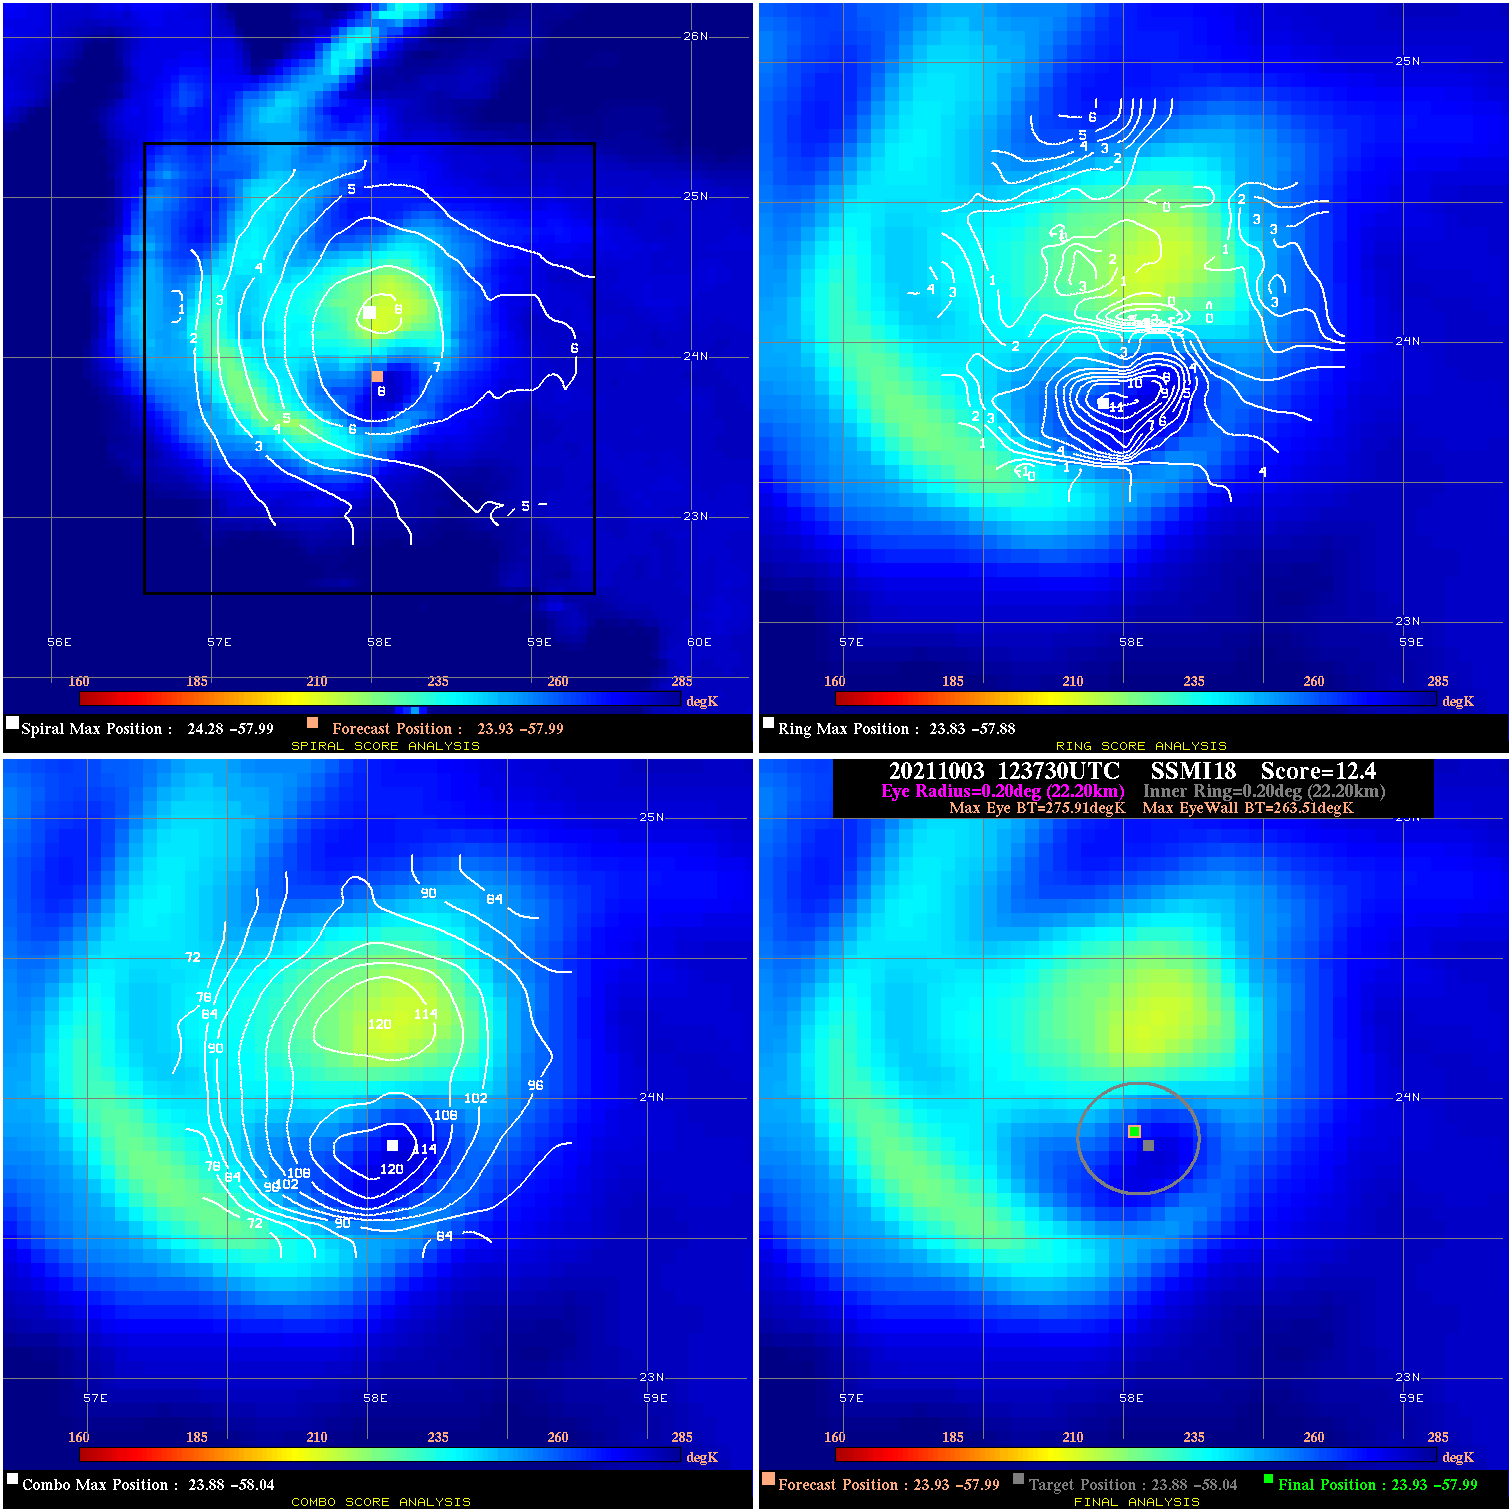
20211003 123730 12.4 N/A 23.3% 44.44 12.40 70.0 SSMI18 23.9 -58.0 23.9 -58.0 23.9 -58.0 Analysis Plot
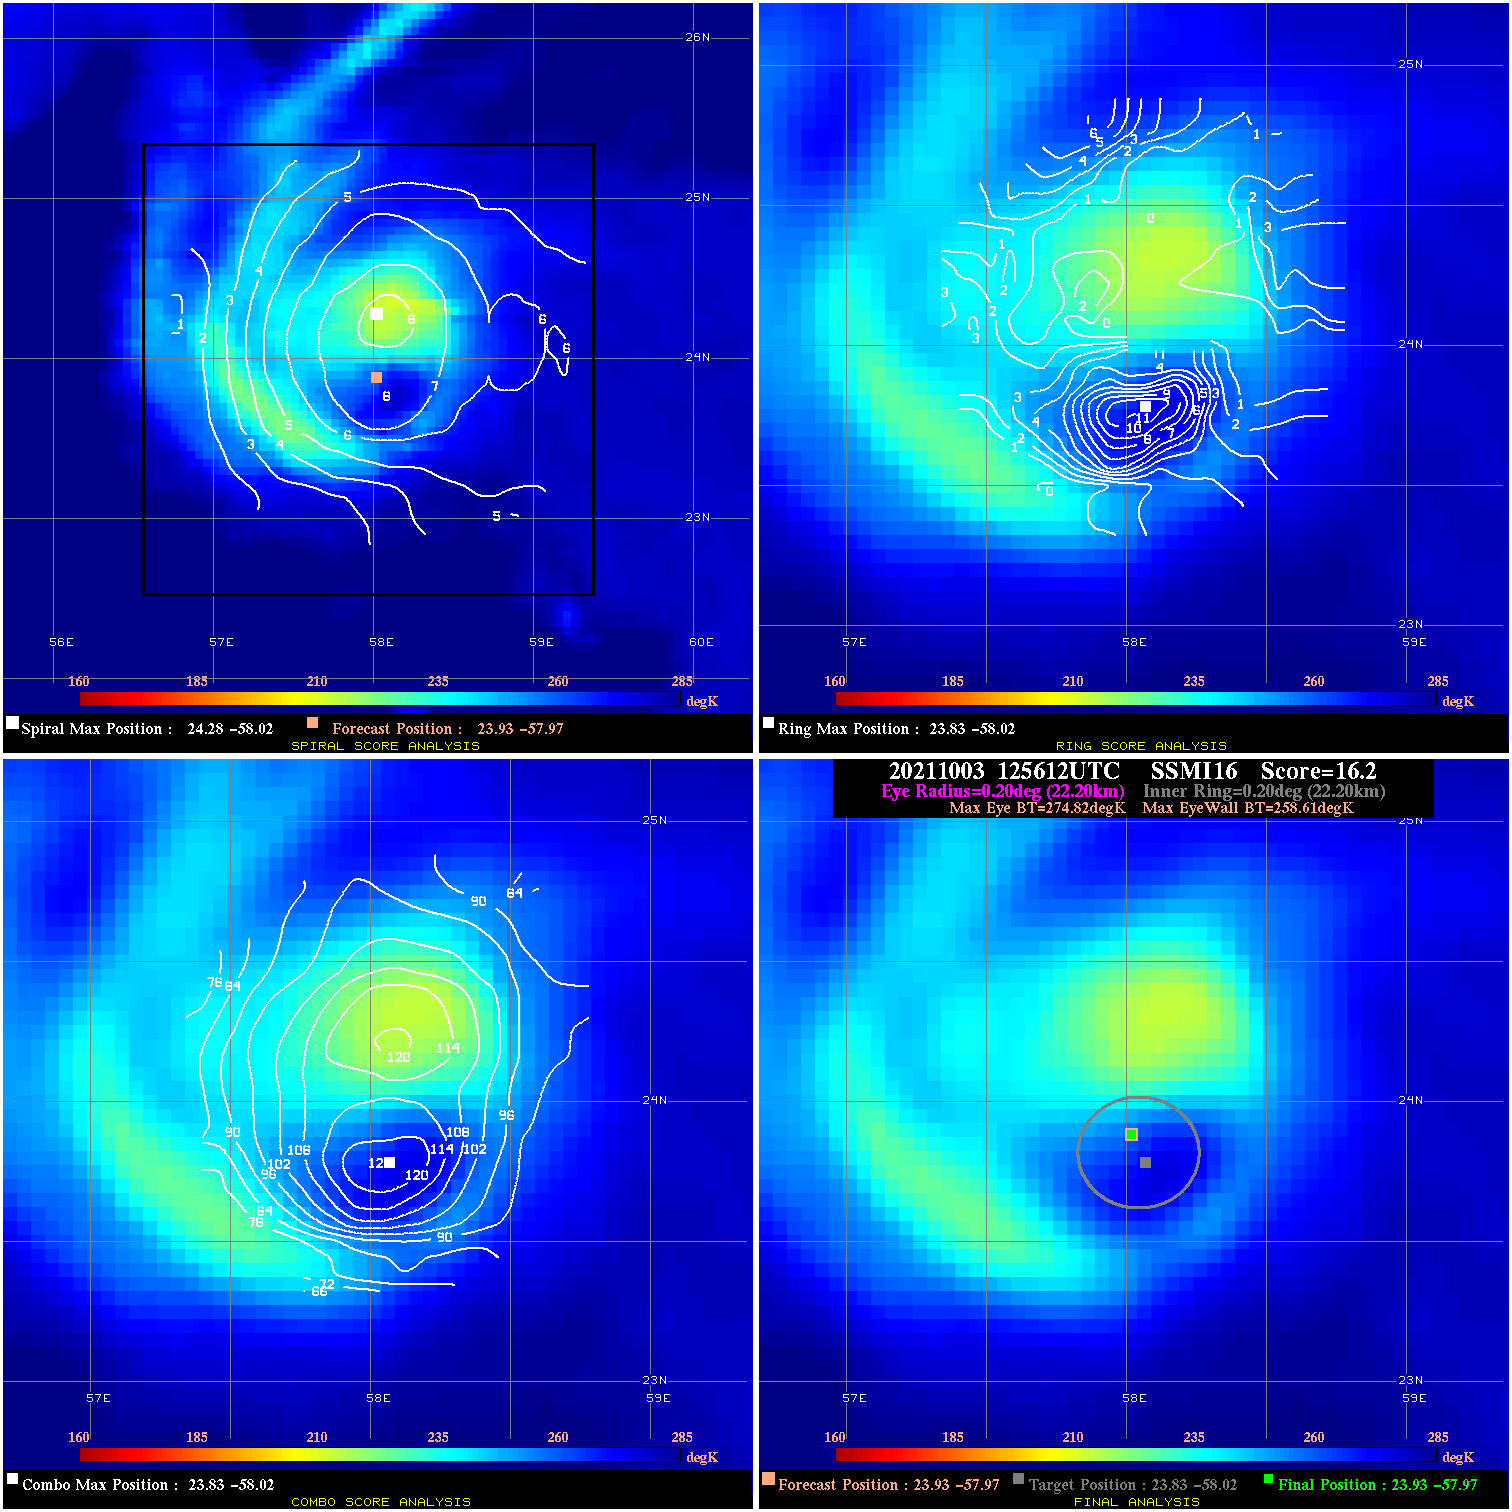
20211003 125612 16.2 N/A 19.2% 44.44 16.21 70.0 SSMI16 23.9 -58.0 23.9 -58.0 23.8 -58.0 Analysis Plot
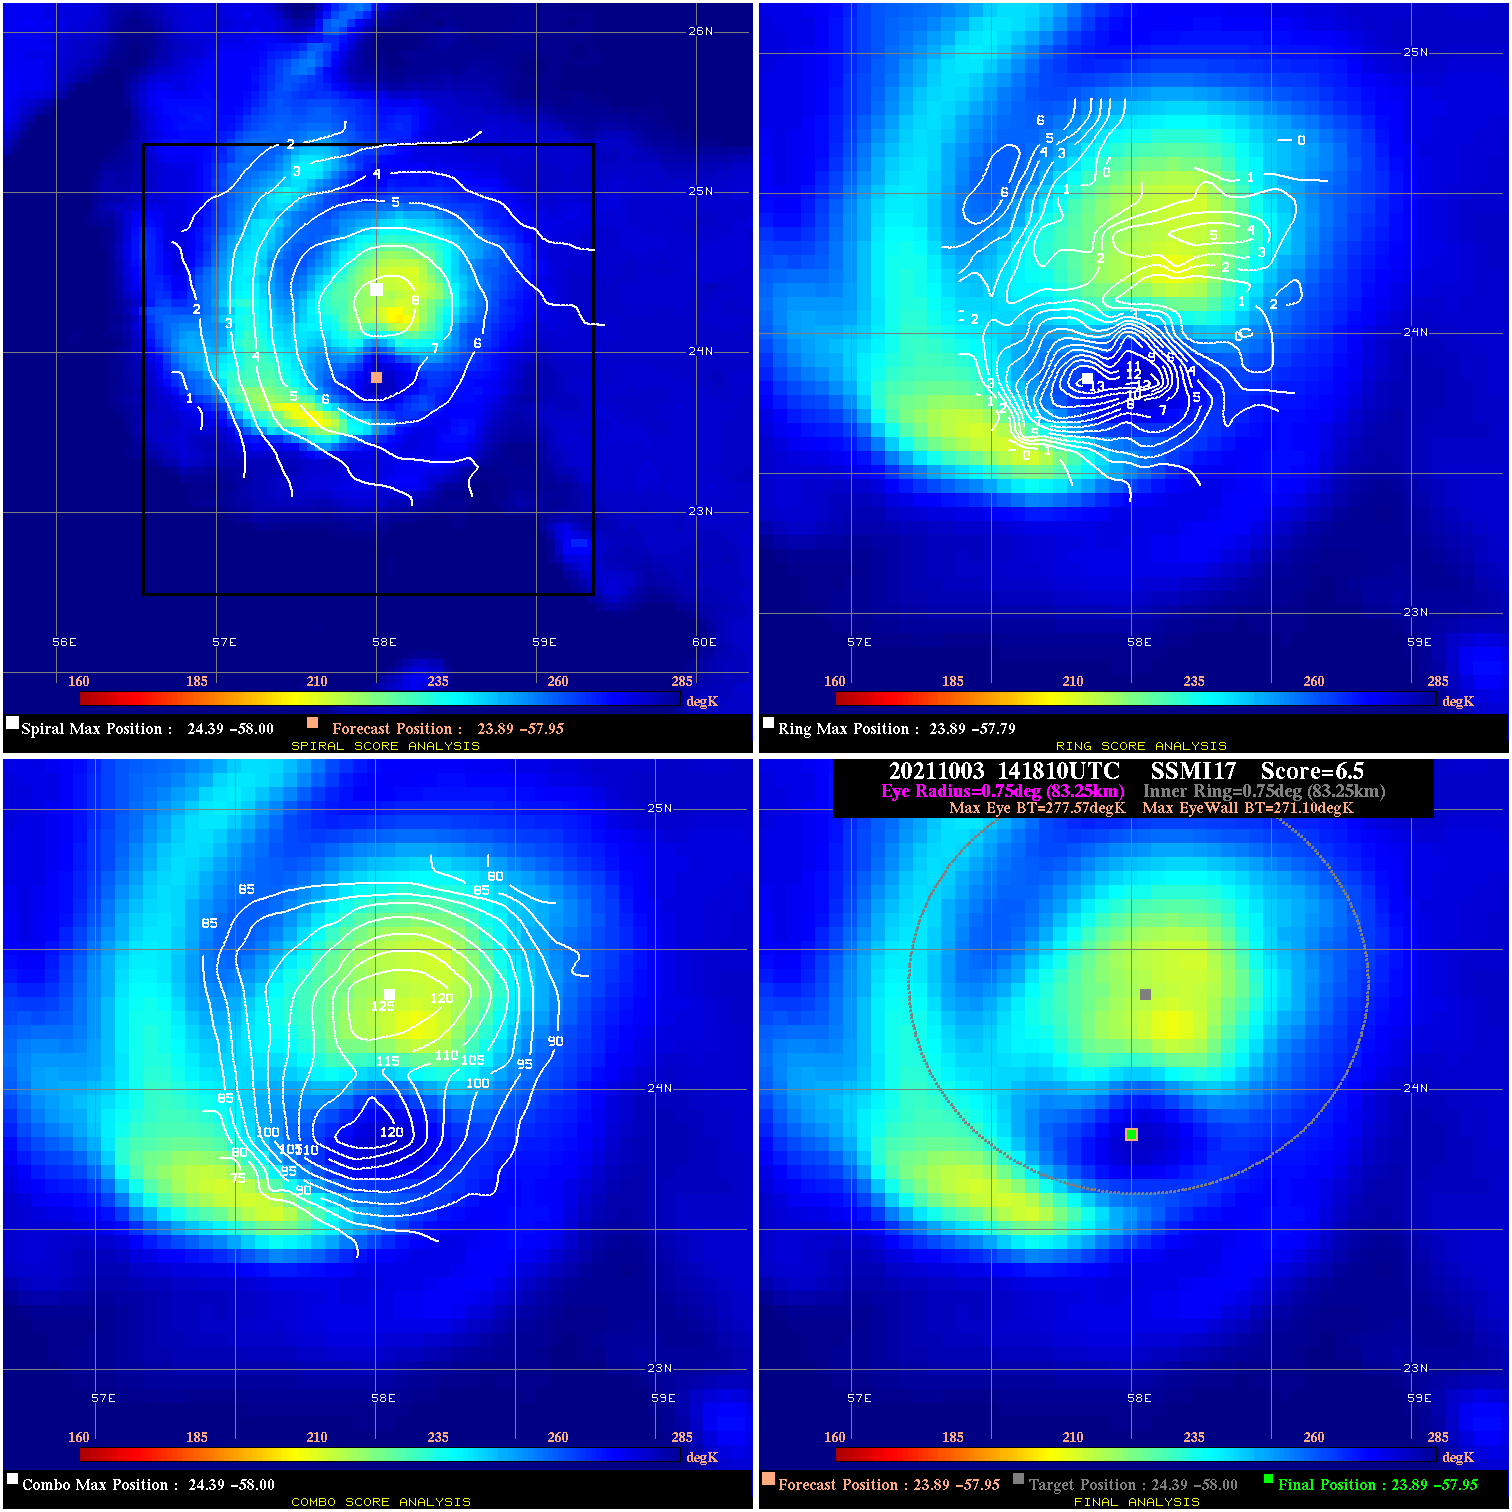
20211003 141810 6.5 N/A N/A 166.65 6.47 65.0 SSMI17 23.9 -58.0 23.9 -58.0 24.4 -58.0 Analysis Plot
20211003 213519 18.5 N/A 100.0% 33.33 3.51 55.0 AMSR2 23.5 -57.0 23.5 -57.0 23.8 -56.9 Analysis Plot
20211004 015311 -930.0 N/A N/A N/A 0.00 55.0 SSMI18 23.3 -56.7 23.3 -56.7 22.7 -57.3 Analysis Plot
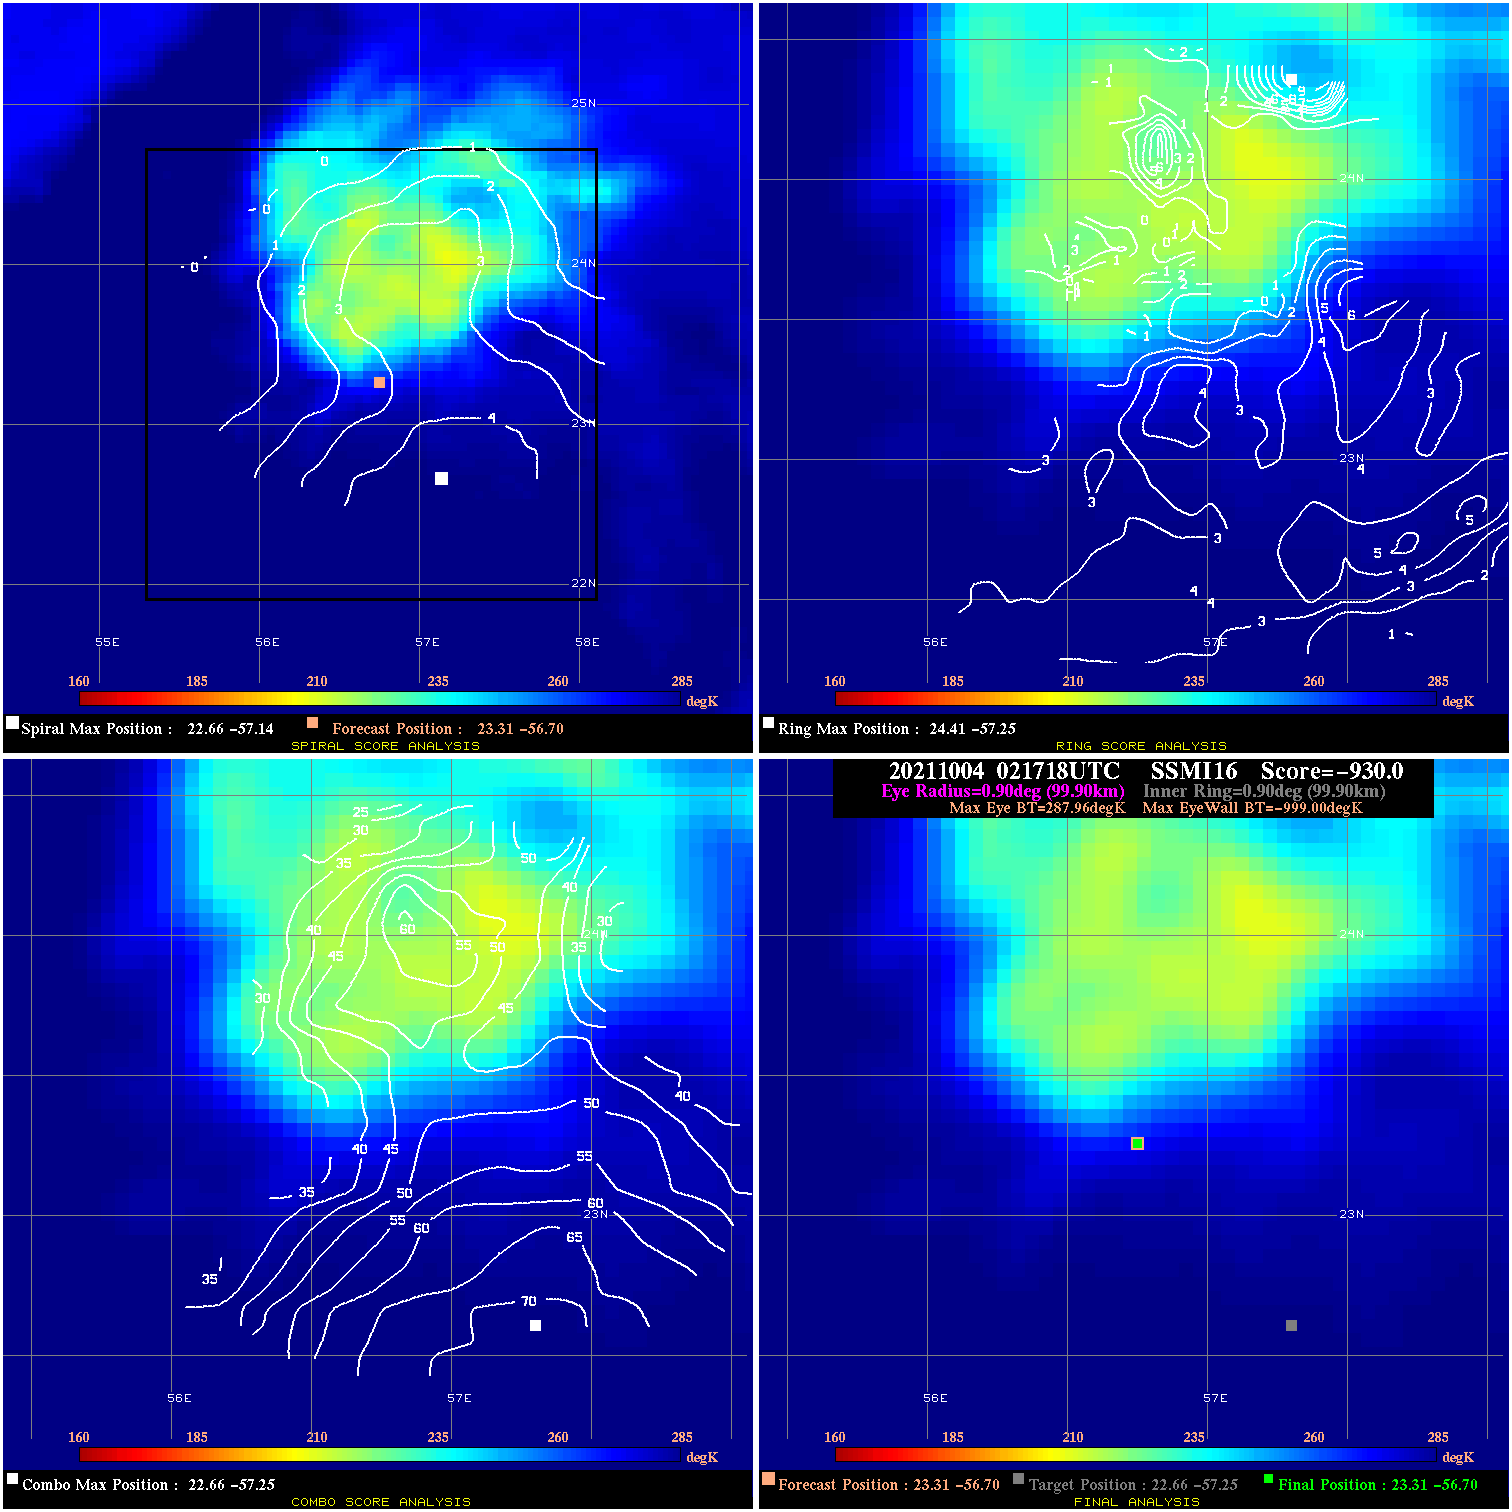
20211004 021718 -930.0 N/A N/A N/A 0.00 55.0 SSMI16 23.3 -56.7 23.3 -56.7 22.7 -57.3 Analysis Plot
20211004 034450 -930.0 N/A N/A N/A 0.00 55.0 SSMI17 23.2 -56.6 23.2 -56.6 22.6 -57.4 Analysis Plot
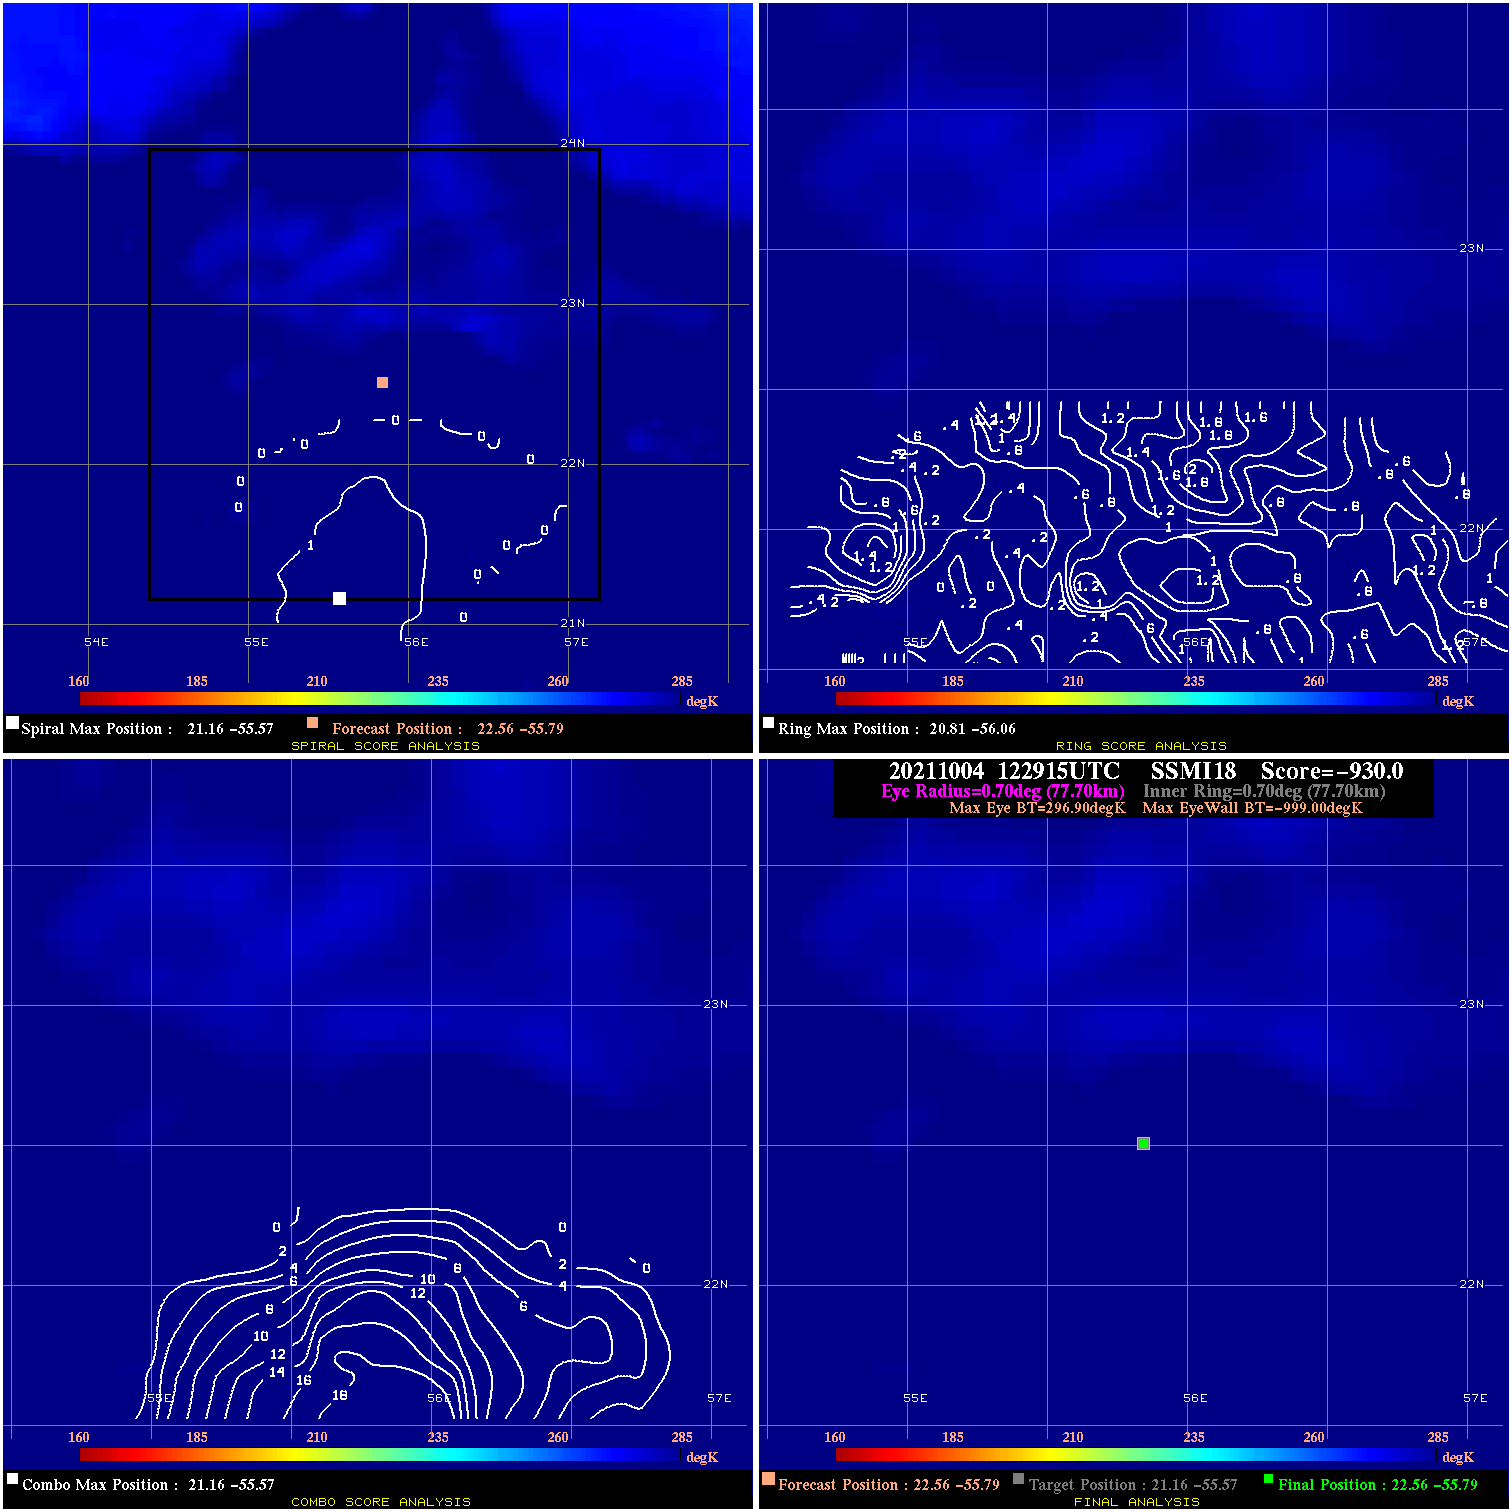
20211004 122915 -930.0 N/A N/A N/A 0.00 55.0 SSMI18 22.6 -55.8 22.6 -55.8 21.2 -55.6 Analysis Plot
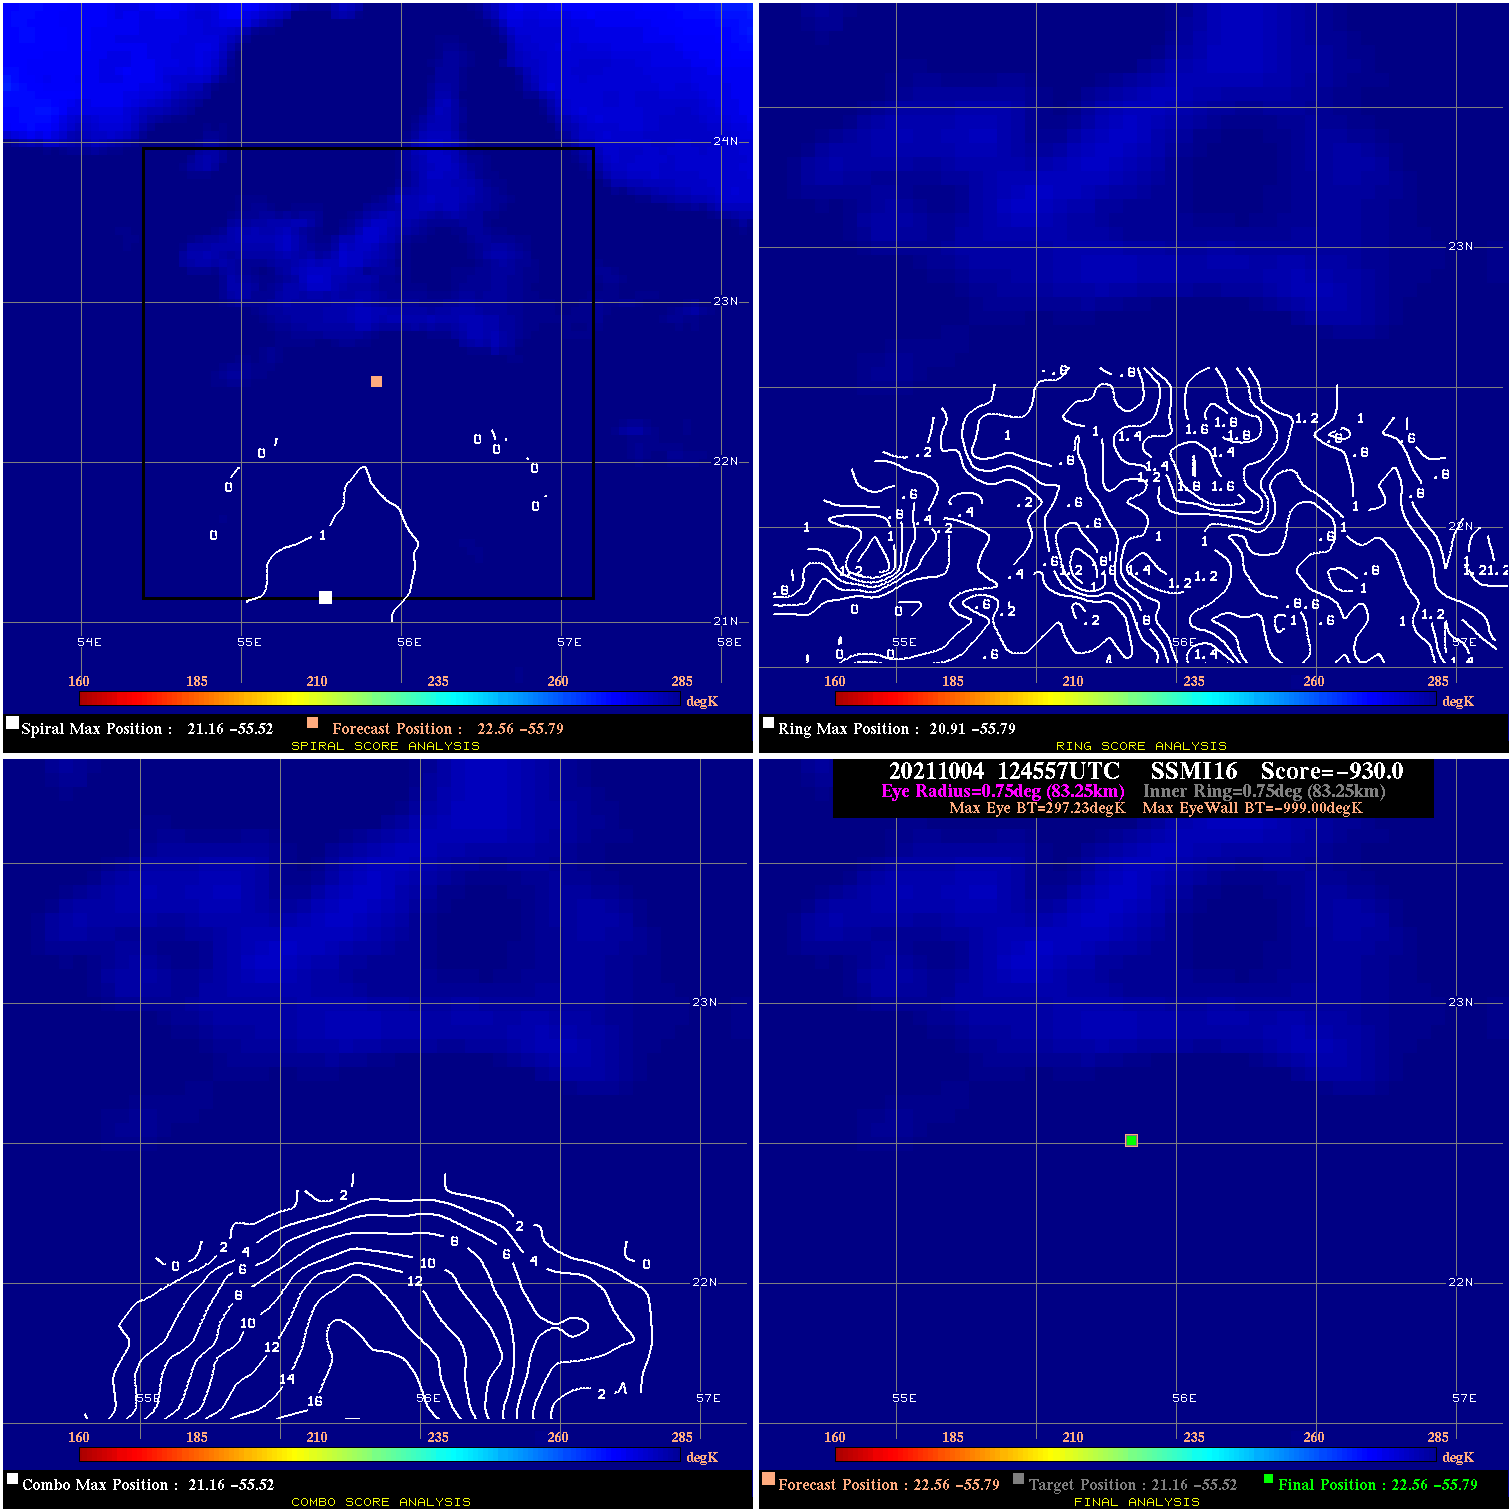
20211004 124557 -930.0 N/A N/A N/A 0.00 55.0 SSMI16 22.6 -55.8 22.6 -55.8 21.2 -55.5 Analysis Plot
|
|
Legend: - Date/Time are determined from PMW imagery at Forecast (initial guess) Lat/Lon position. - Positive/Negative Latitude = North/South Hemisphere; Longitude = Western/Eastern Hemisphere. - "Ring Diam" value indicates the estimated surface eyewall diameter in km (the MI eyewall edge diameter minus 10 km). - "Ring Pct" is the percentage of the "ring" (eyewall inner boundary) that is 1) colder than the "hot spot" (warmest eye pixel) in the eye by 20K, or 2) the percentage that is a) colder than 232K and b) colder than the "hot spot" by 10K, whichever is greater. - Values are red if Ring % <= 65, yellow/brown if Ring % <= 85 and green if Ring % > 85. - "Tb diff" is the difference between the "hot spot" (warmest eye pixel) and the warmest pixel on the eyewall. - Intensity score are listed as negative, and not used, when the JTWC or NHC estimated Vmax is <55 kts in order to rule out weak but highly symmetric TCs. - Error messages in intensity scores: -920 is used when the hottest pixel in the eye is <200K, to prevent false positives; -930 means <85% of eyewall has observations/data. |