|
| Geo IR |
85-92GHz |
| Date/Time_(UTC) |
Source |
Sensor |
Vmax(kts) |
ARCHER Lat |
Lon |
Geo-ref Lat |
Lon |
50% cert. rad. |
95% cert. rad. |
Eye diam (deg) |
% cert. of eye |
|
|
|
|
 |
 |
|
|
|
 |
 |
|
|
|
 |
 |
|
|
|
 |
 |
|
|
|
 |
 |
|
|
|
 |
 |
|
|
|
 |
 |
|
|
|
 |
 |
|
|
|
 |
 |
|
|
|
 |
 |
|
|
|
 |
 |
|
|
|
 |
 |
|
|
|
 |
 |
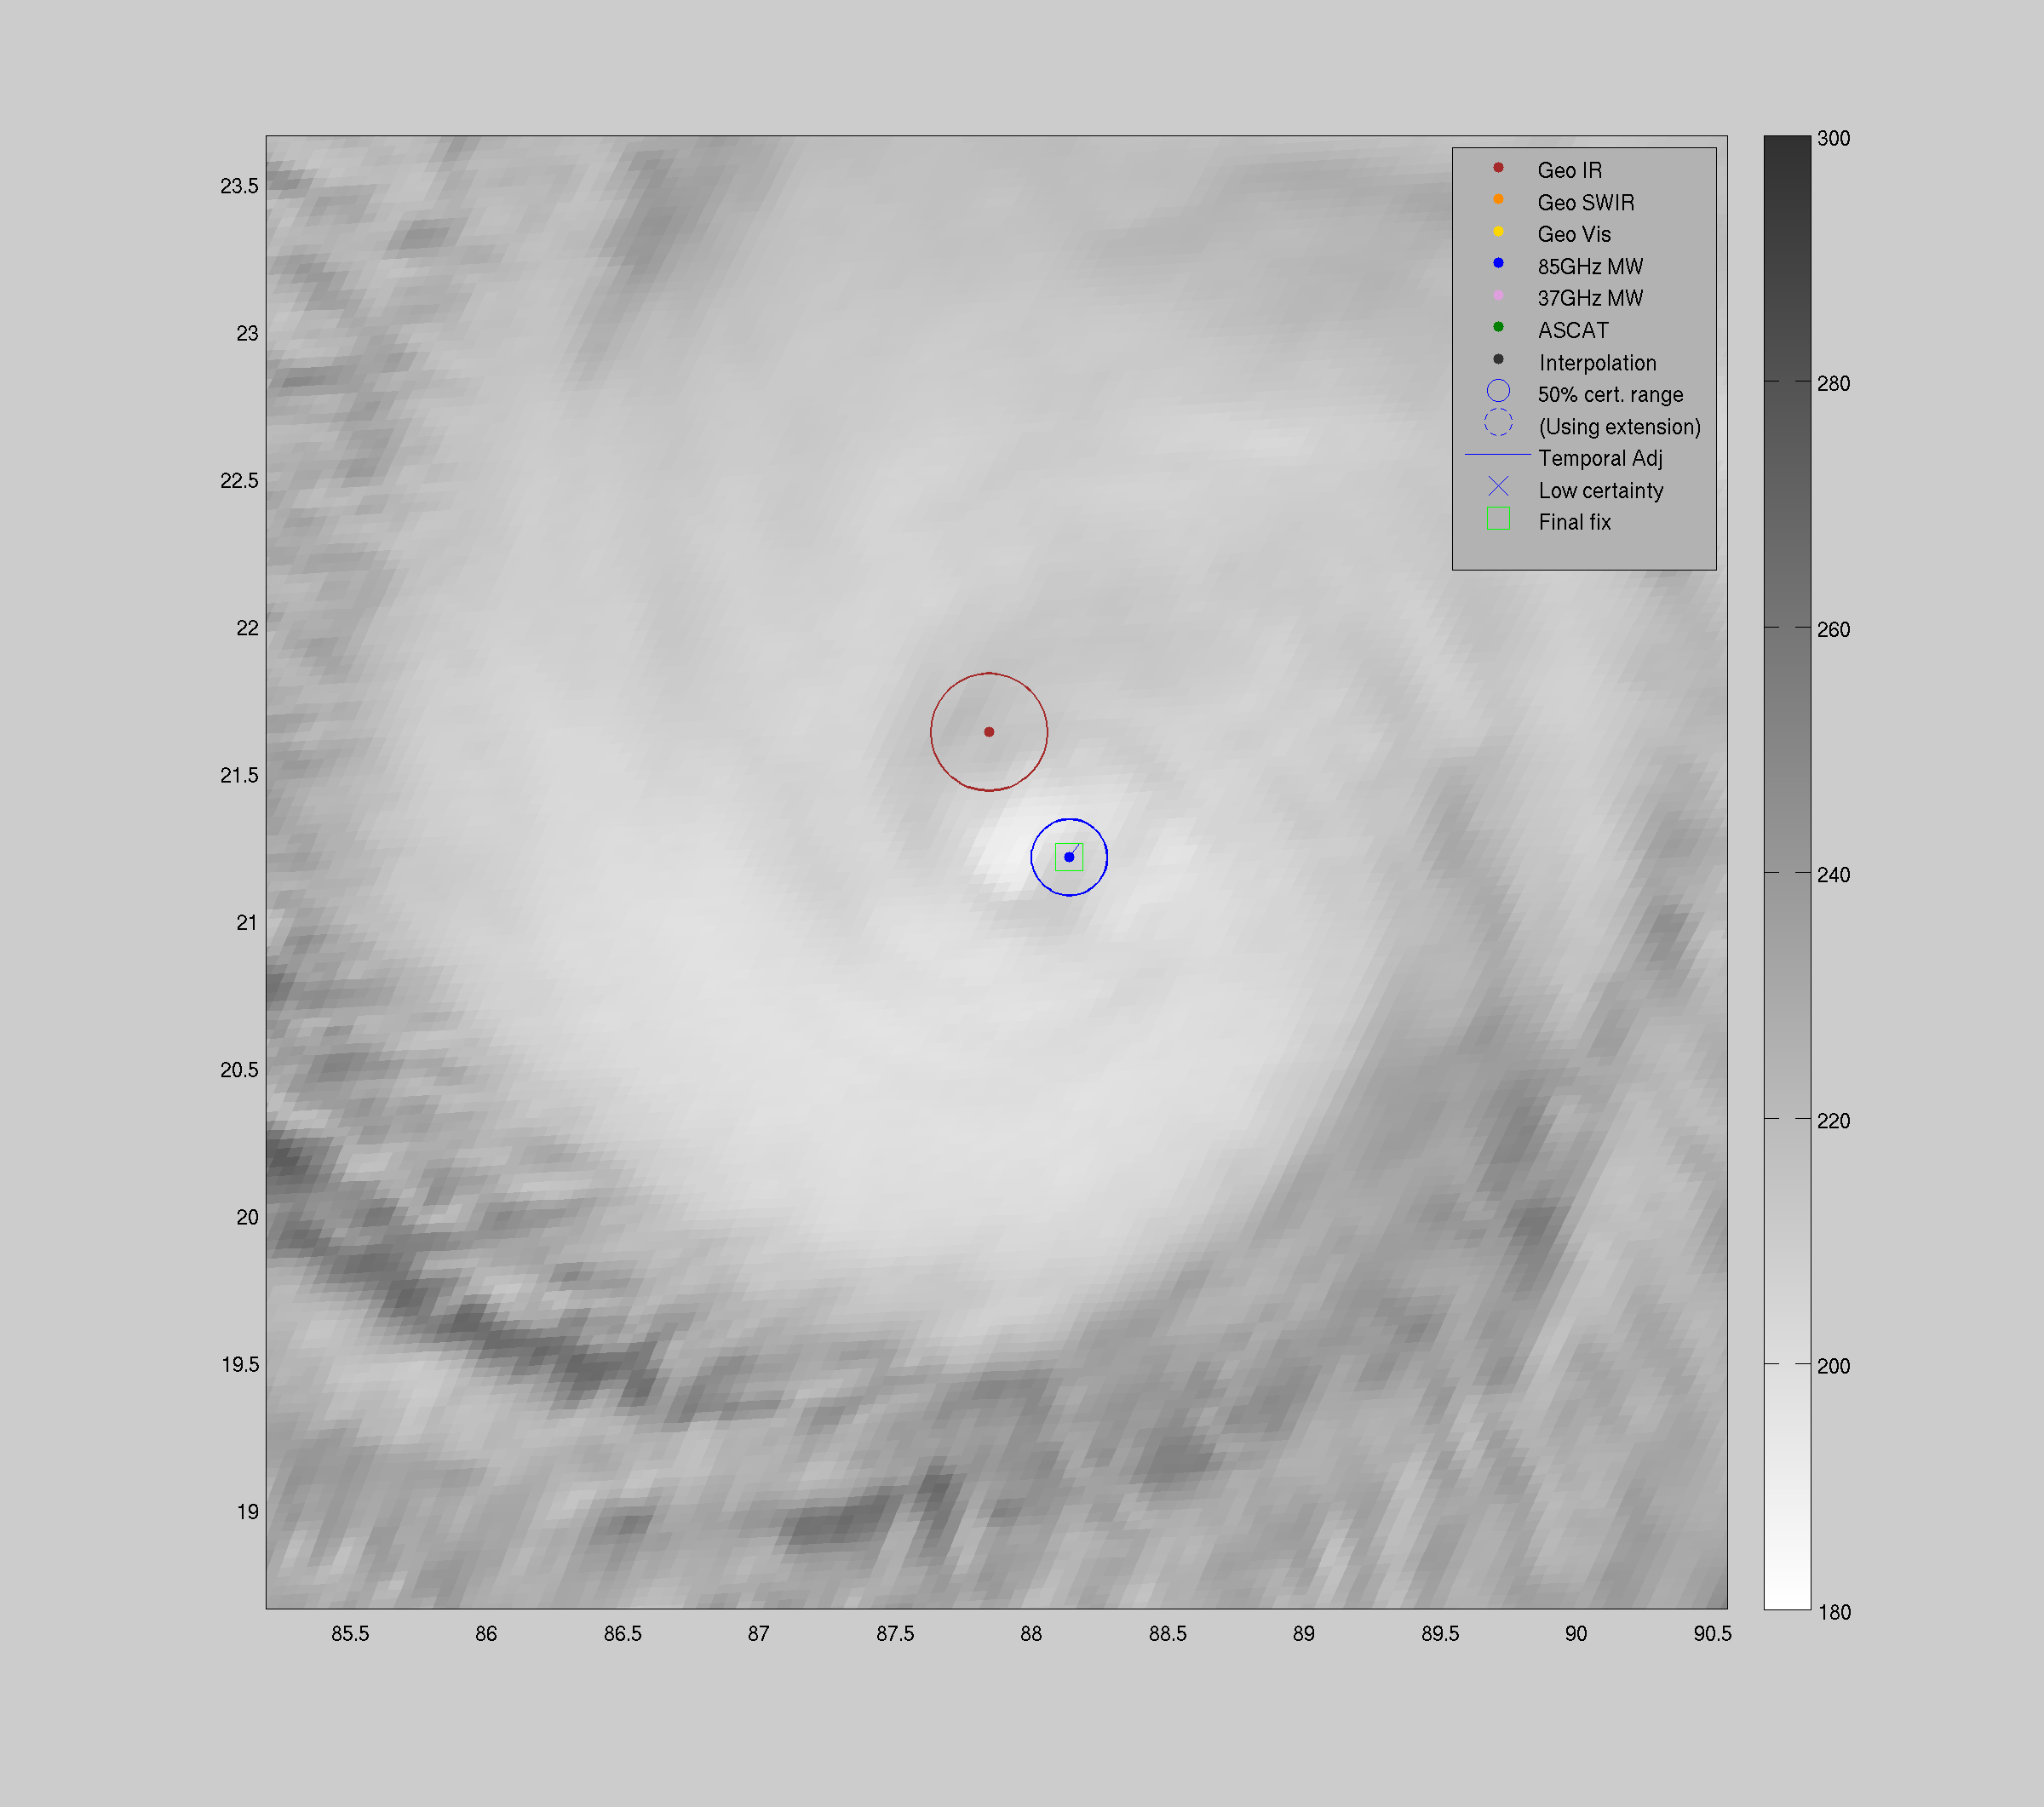
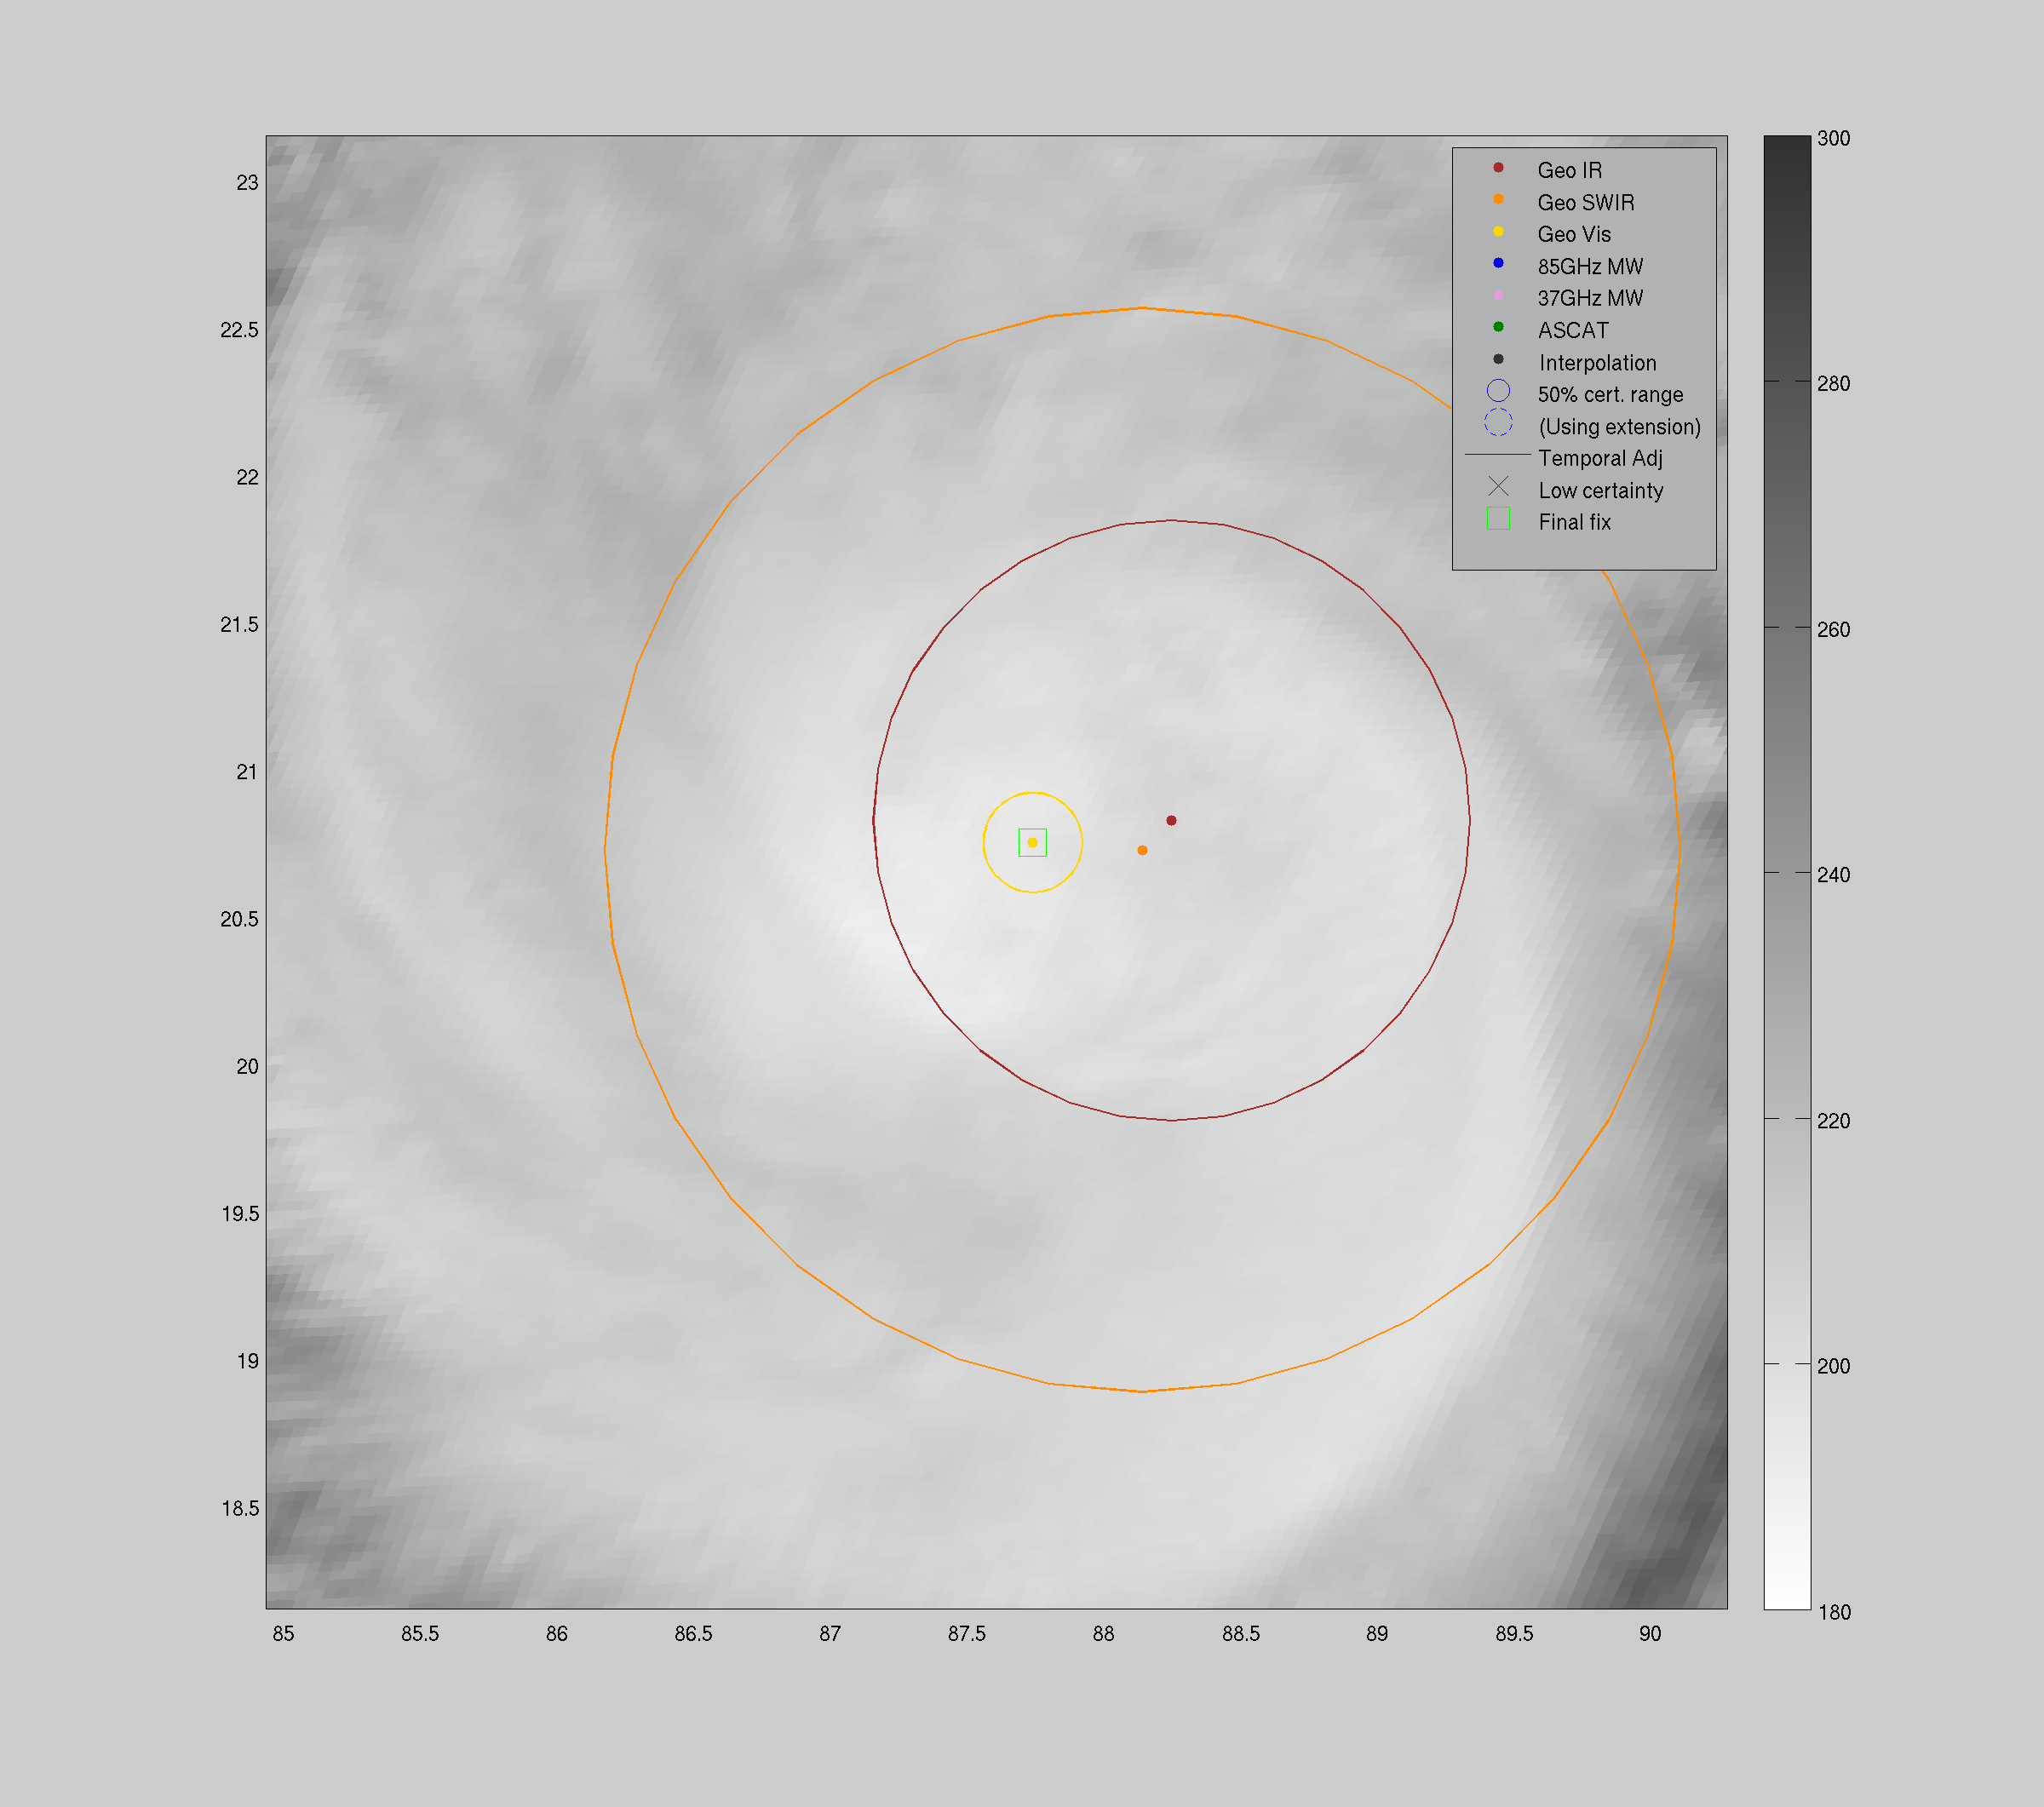
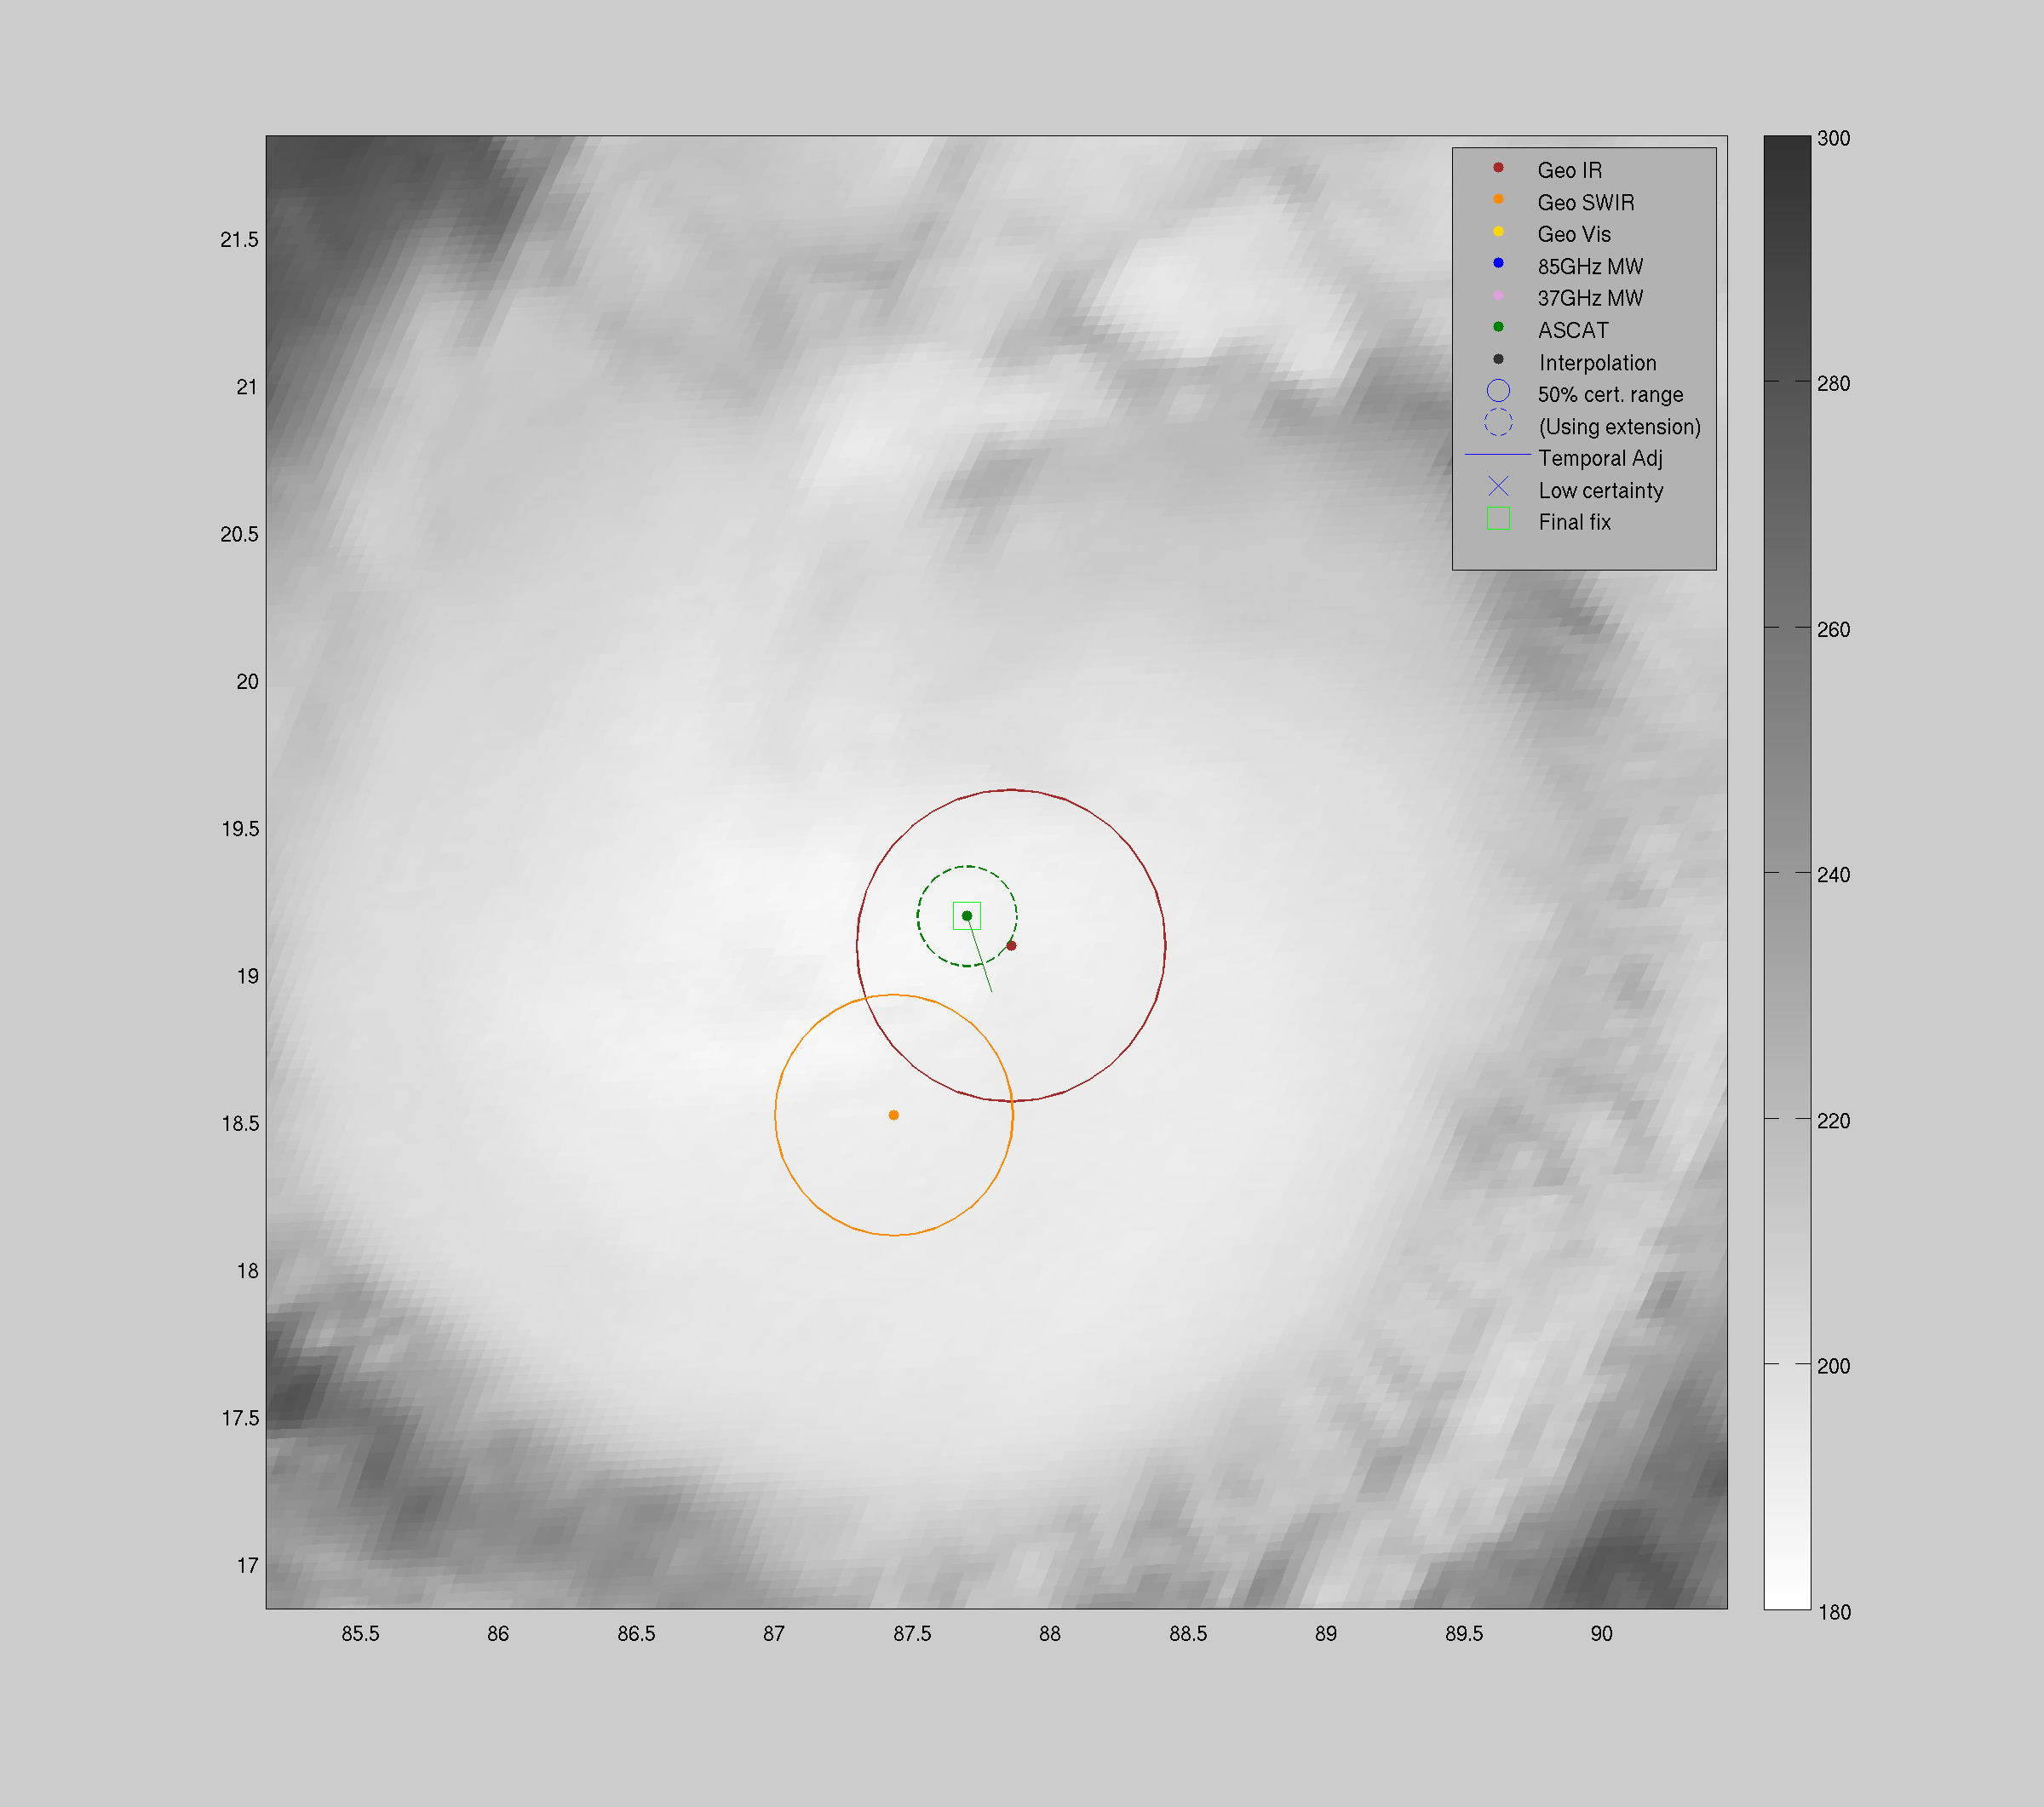
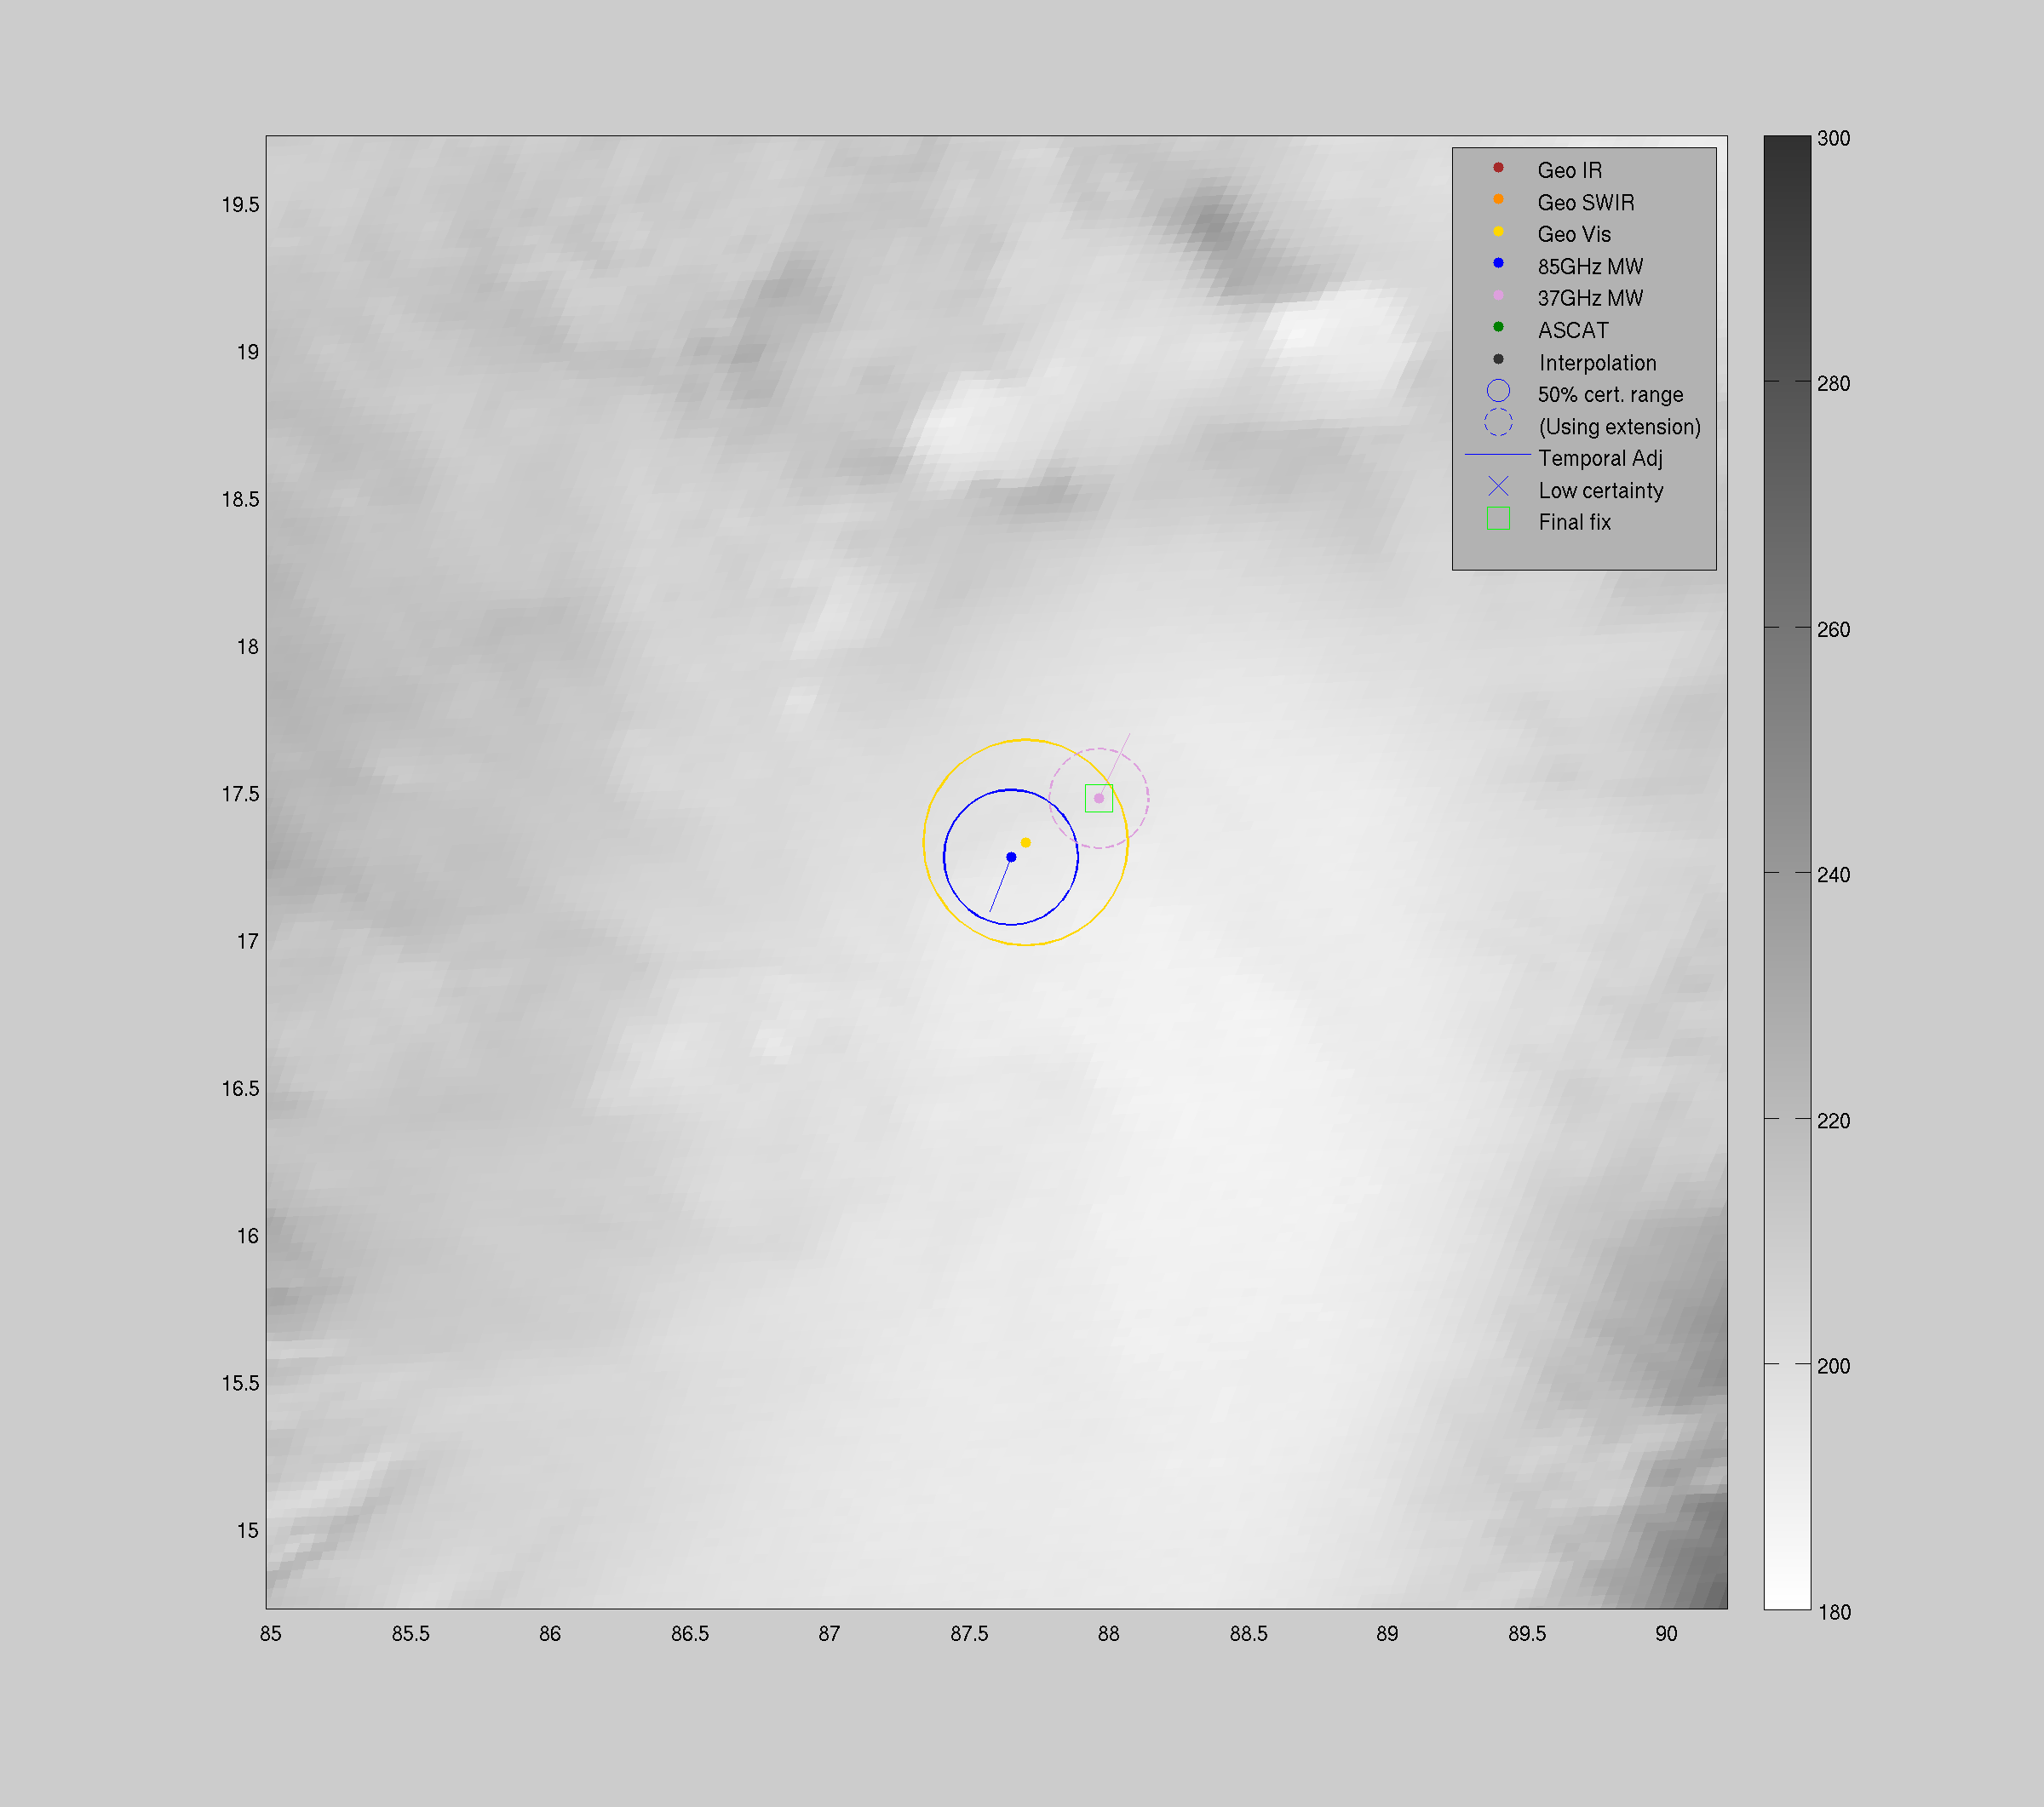
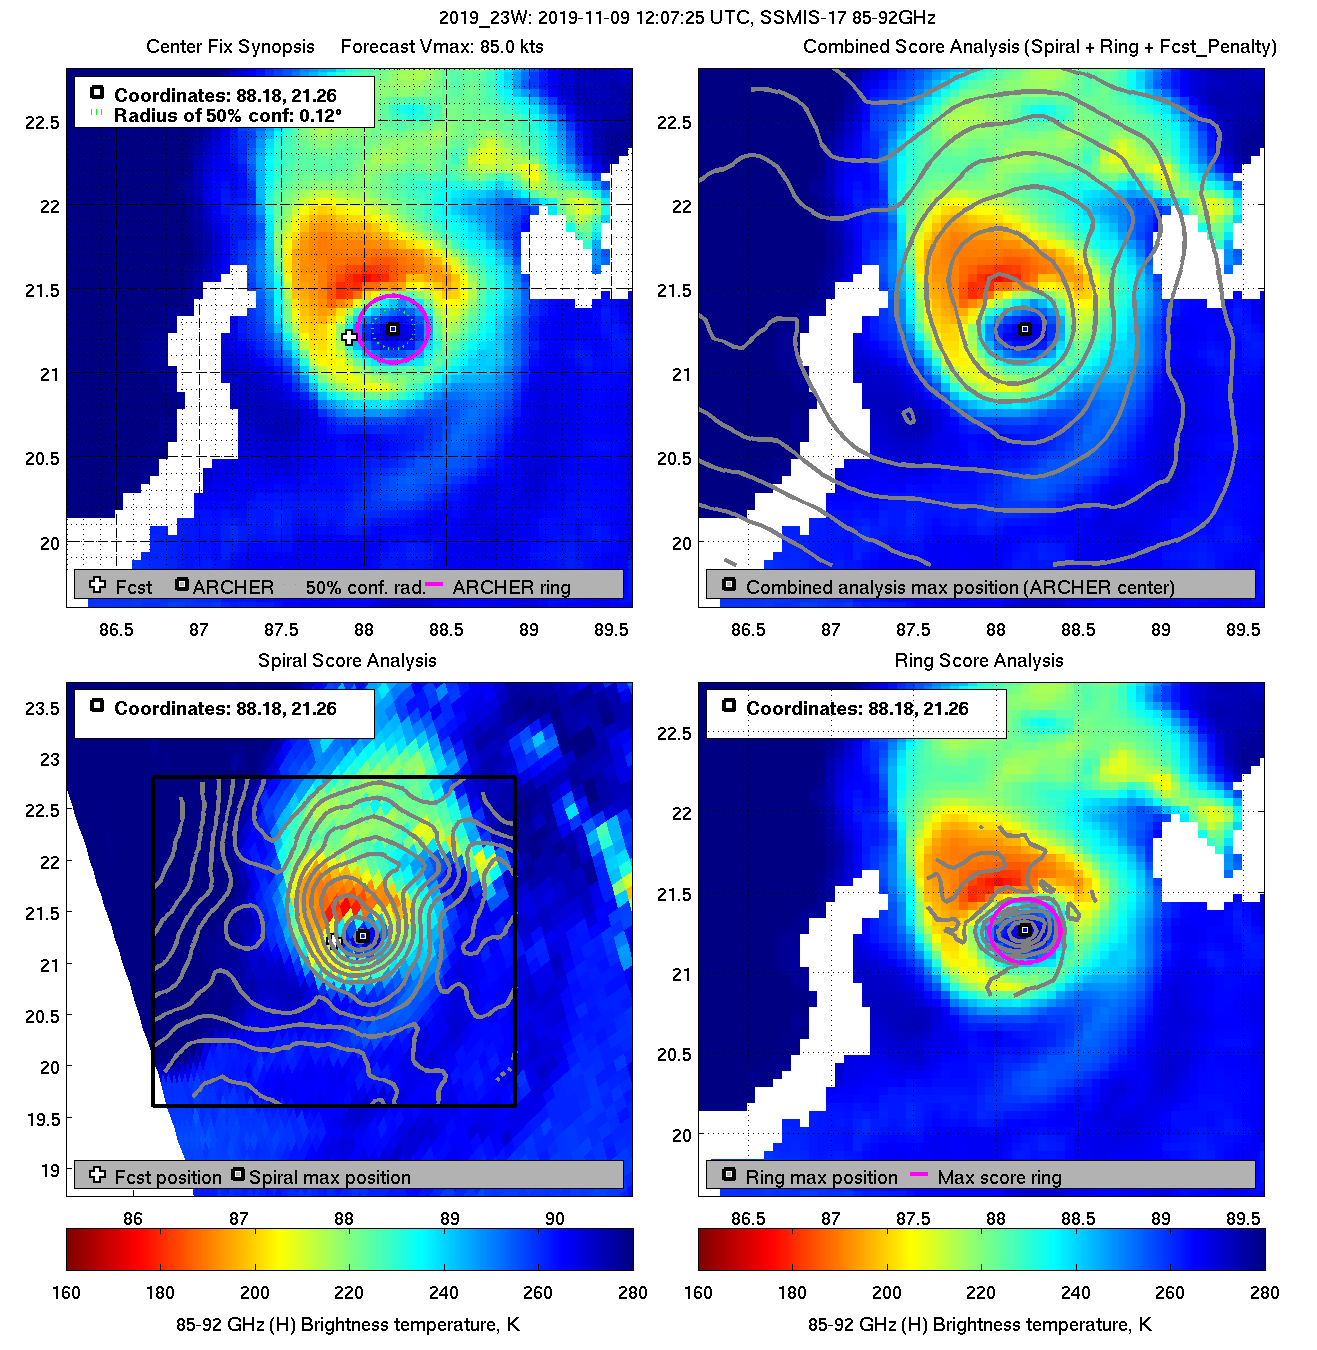
| 20191109 12:07:25 * |
SSMIS-17 |
85-92GHz |
85.0 |
21.26 |
88.18 |
21.21 |
88.13 |
0.12 |
0.35 |
0.40 |
99.6 |
|
|
|
 |
 |
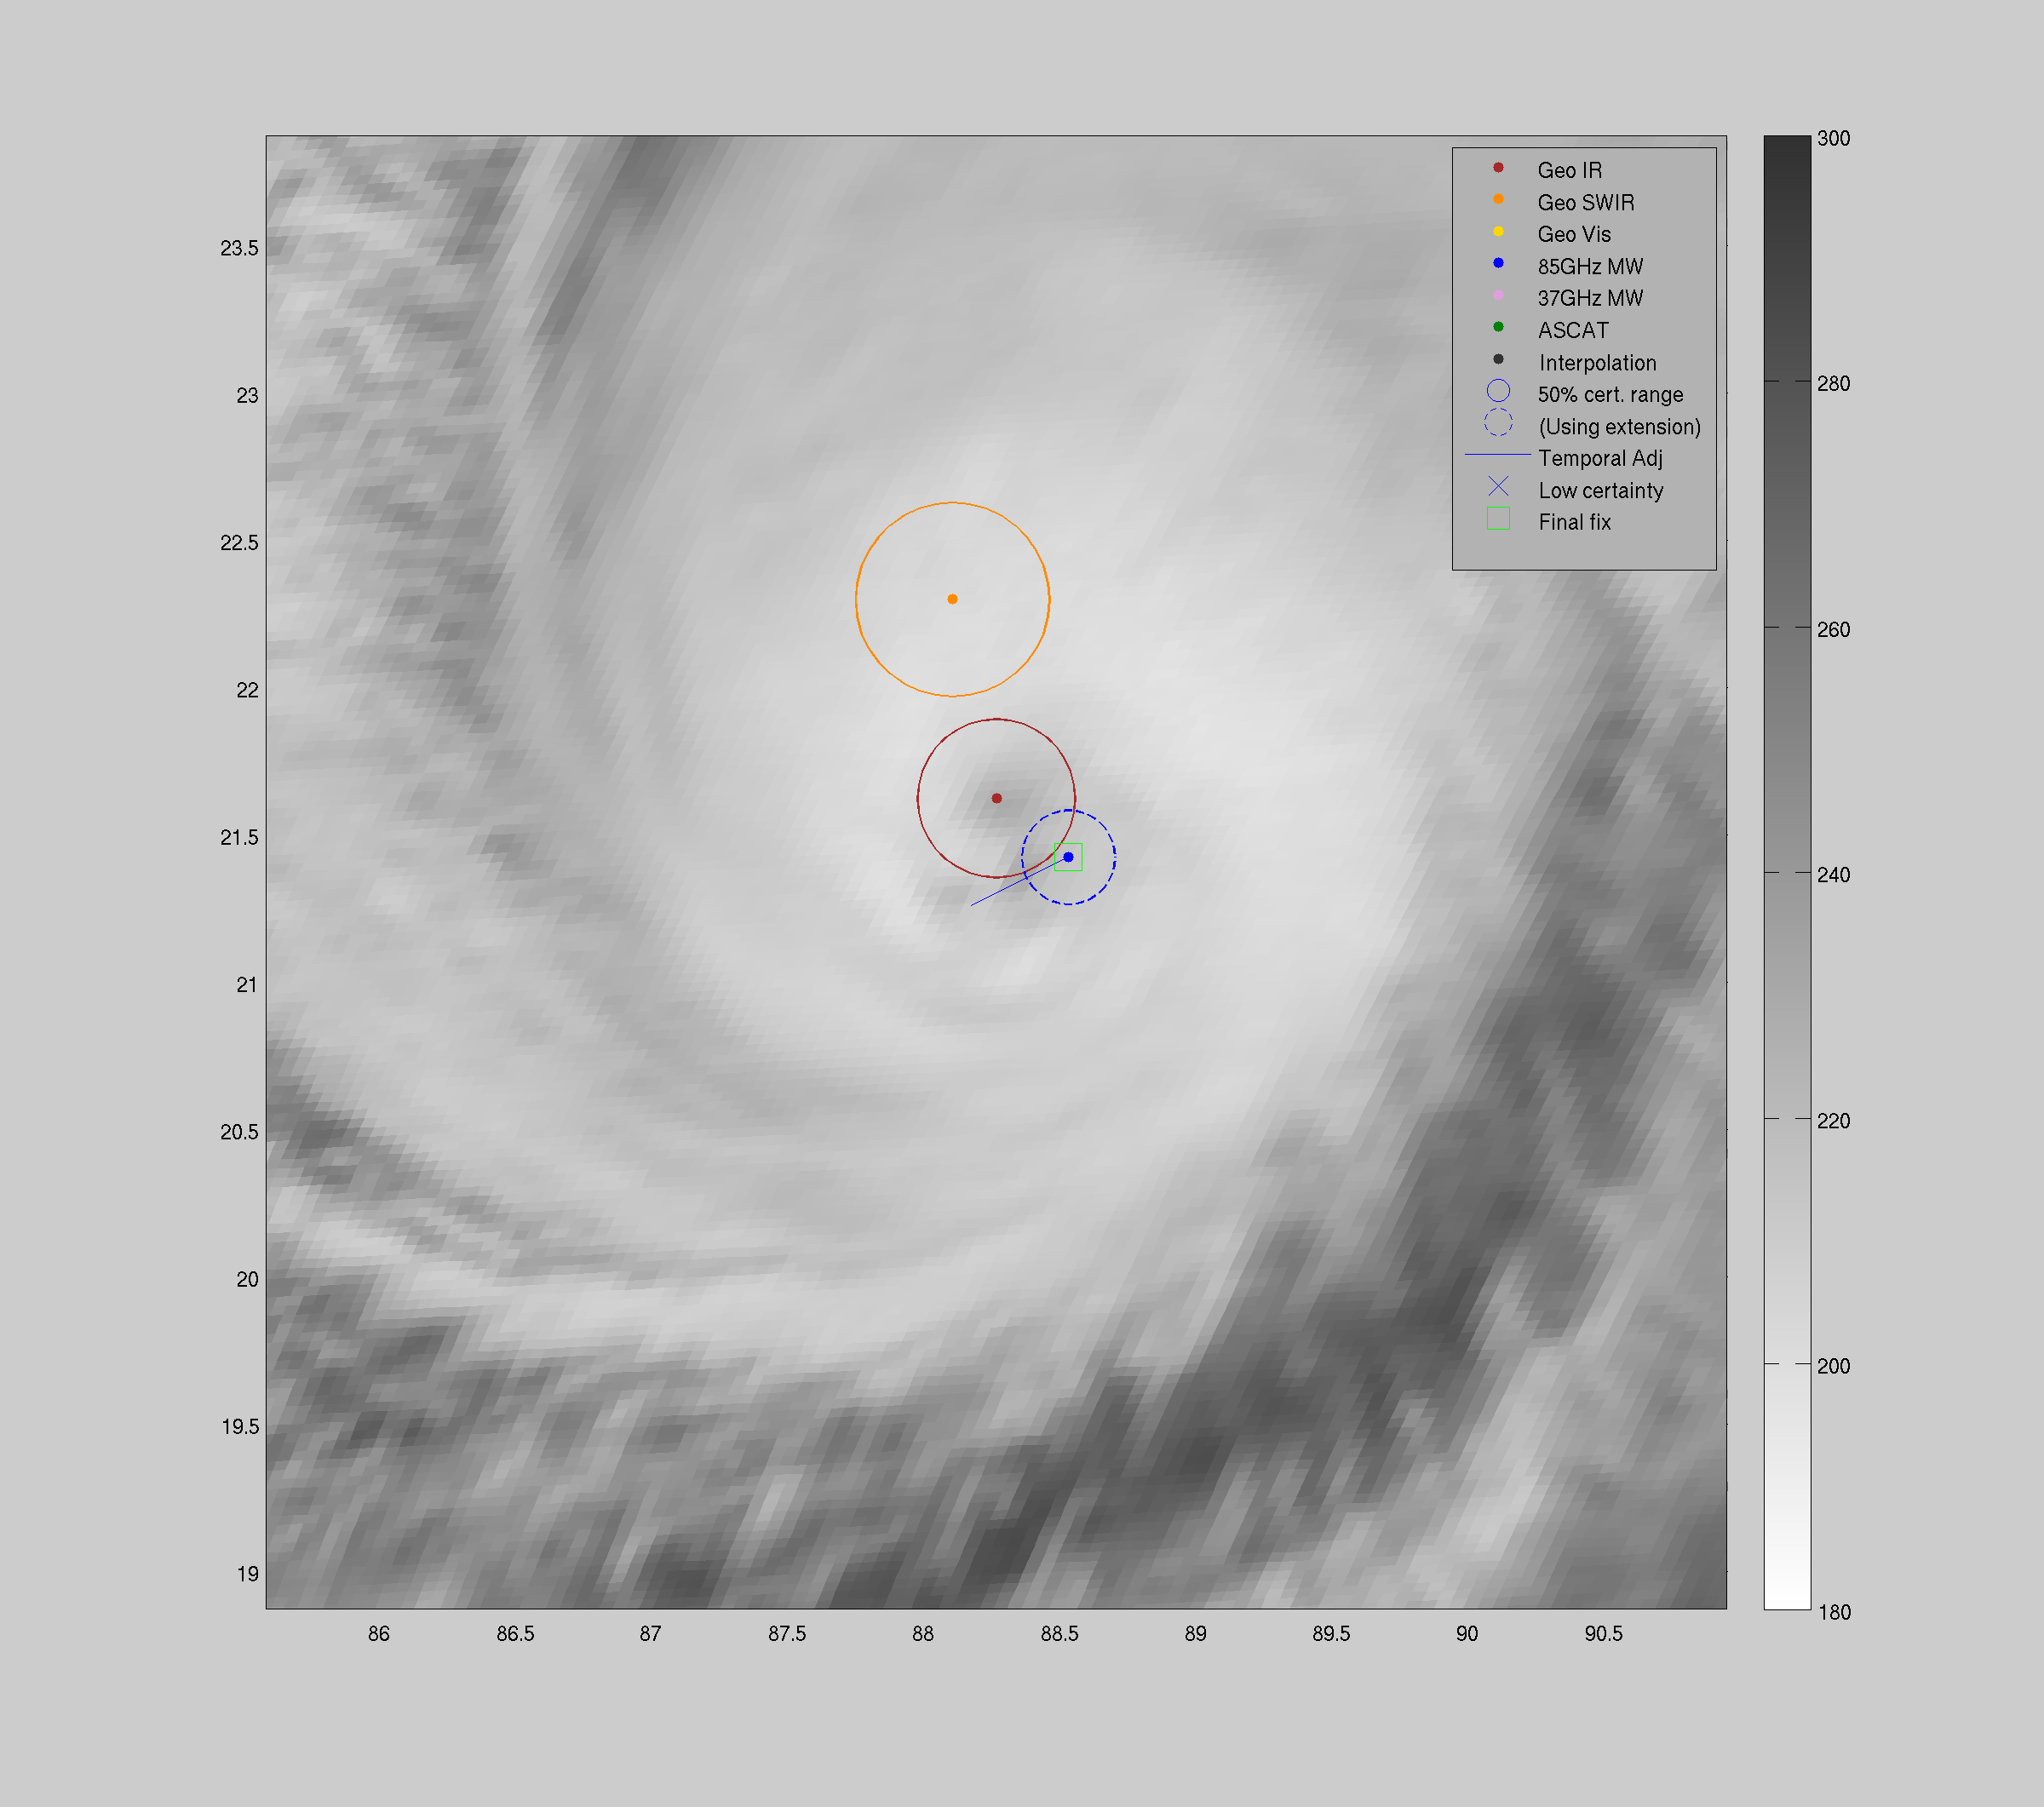
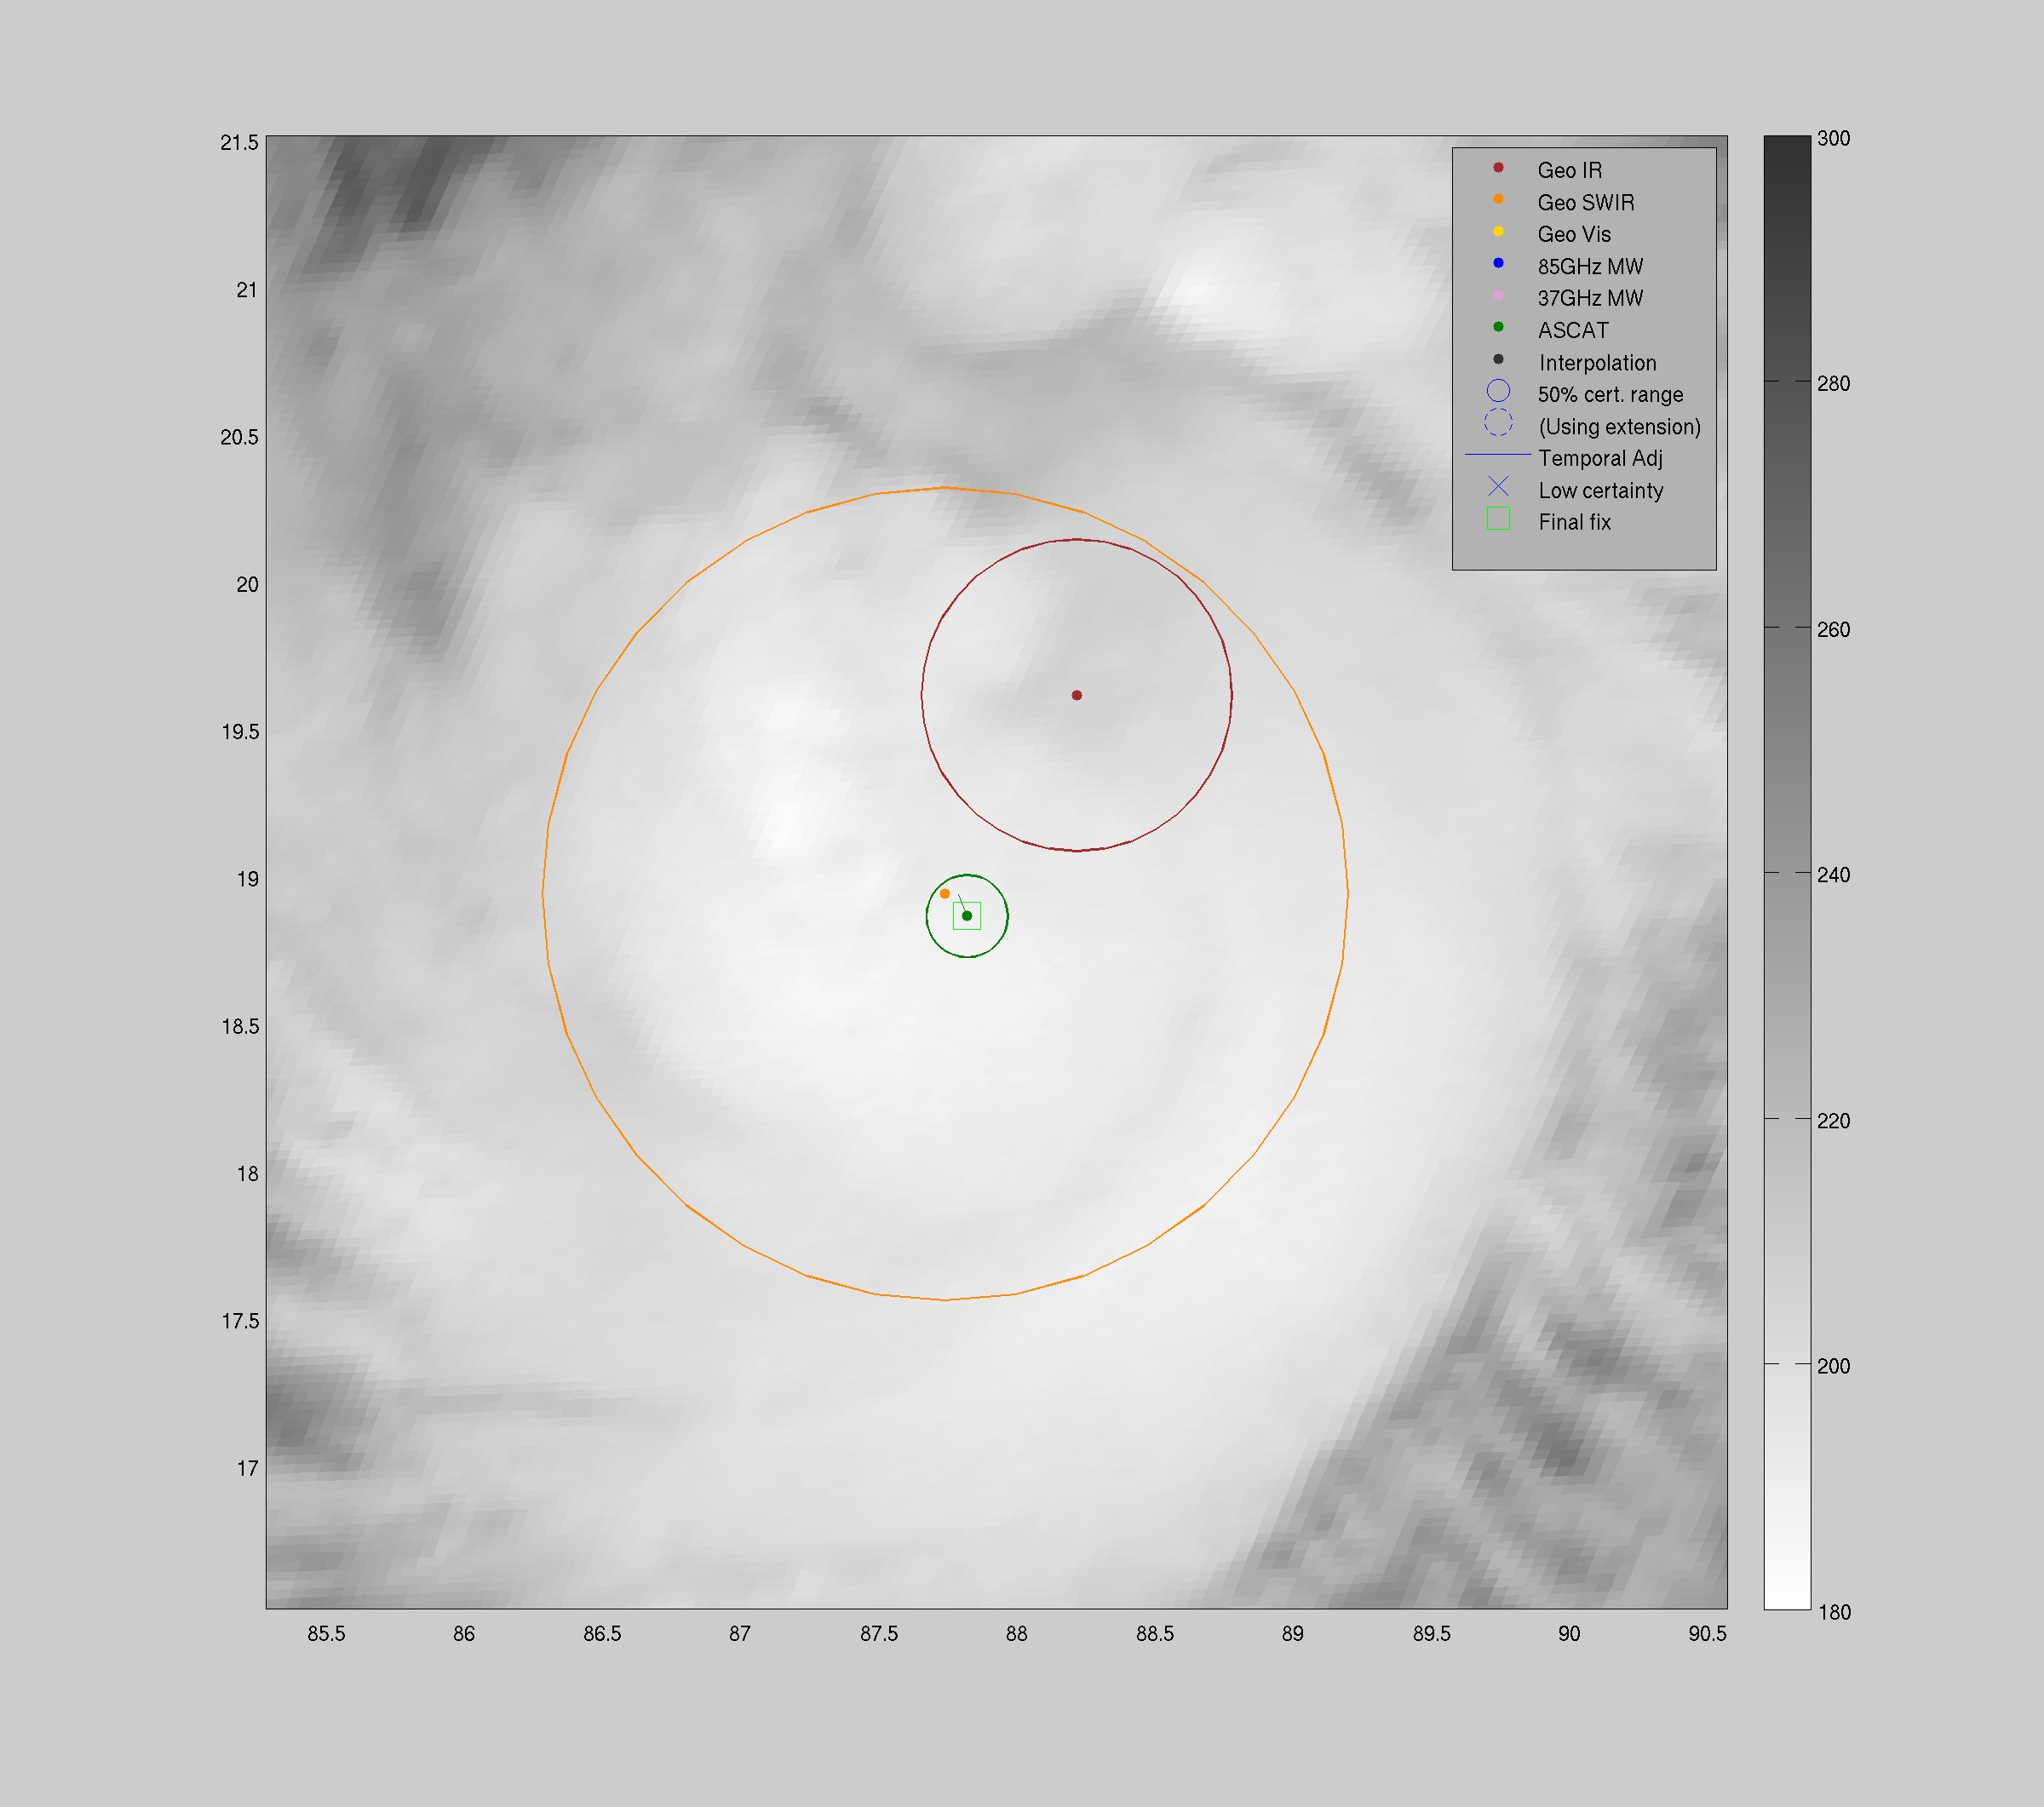
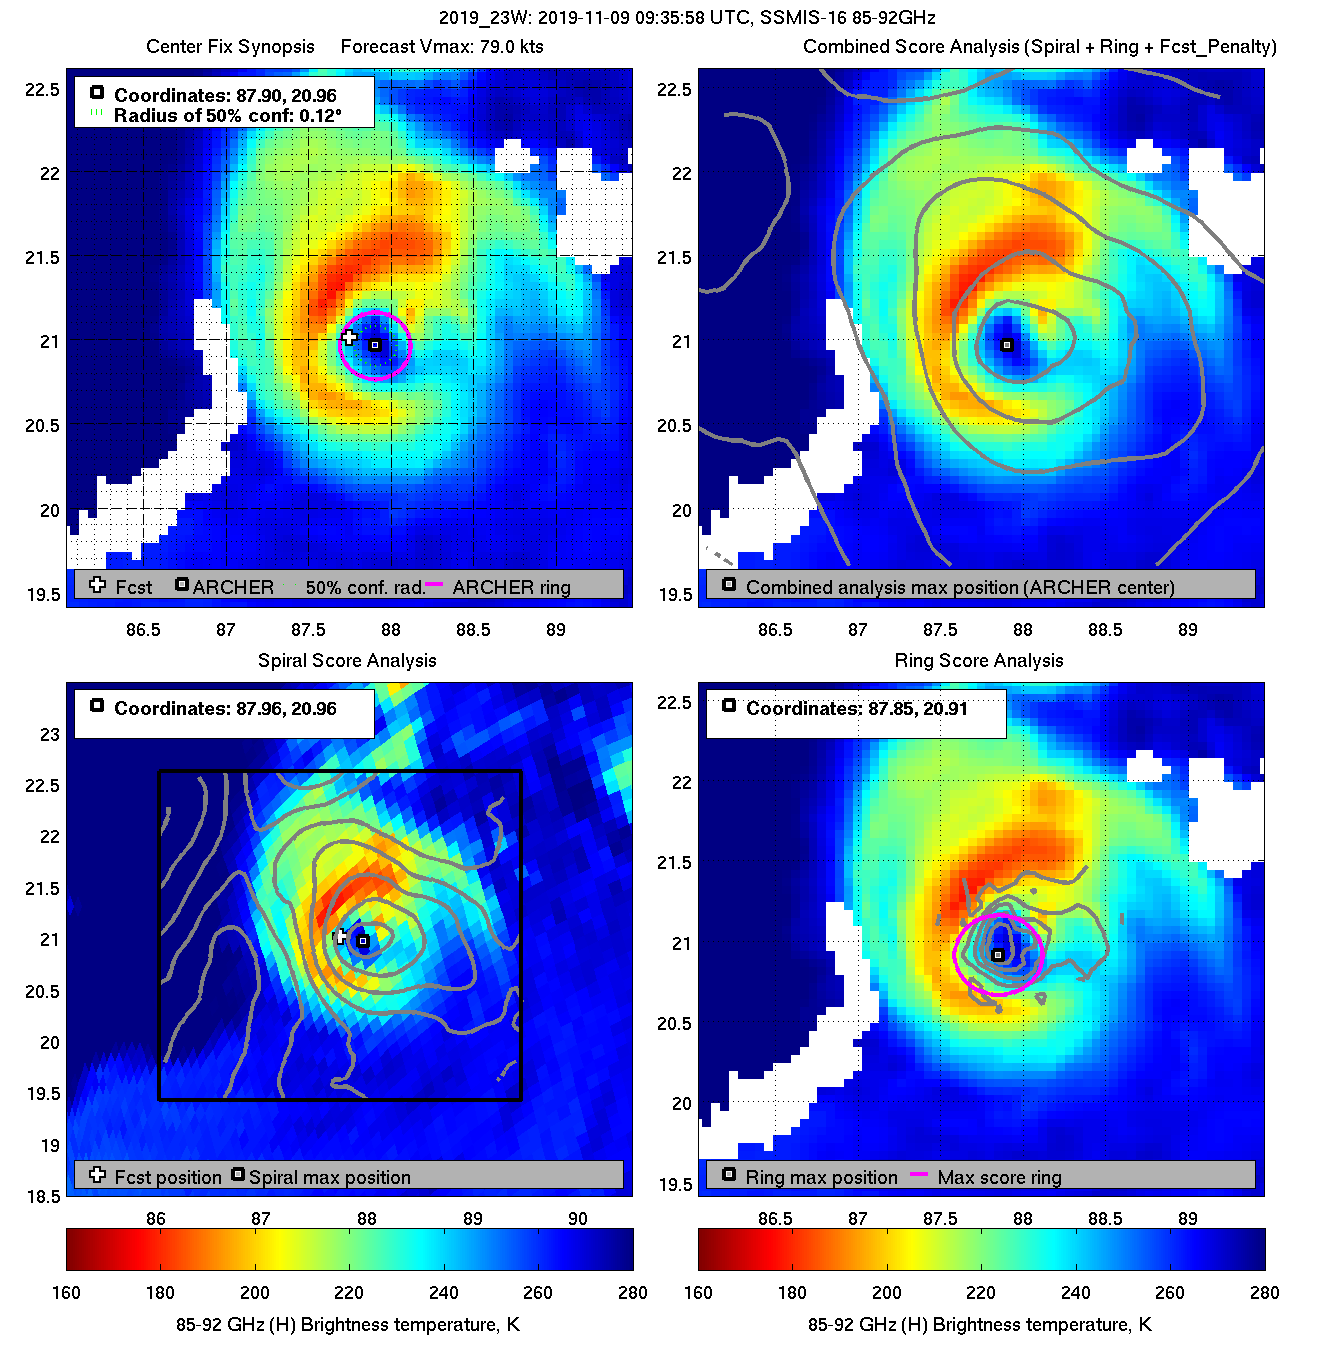
| 20191109 09:35:58 * |
SSMIS-16 |
85-92GHz |
79.0 |
20.96 |
87.90 |
20.87 |
87.84 |
0.12 |
0.34 |
0.40 |
99.0 |
|
|
|
 |
 |
|
|
|
 |
 |
|
|
|
 |
 |
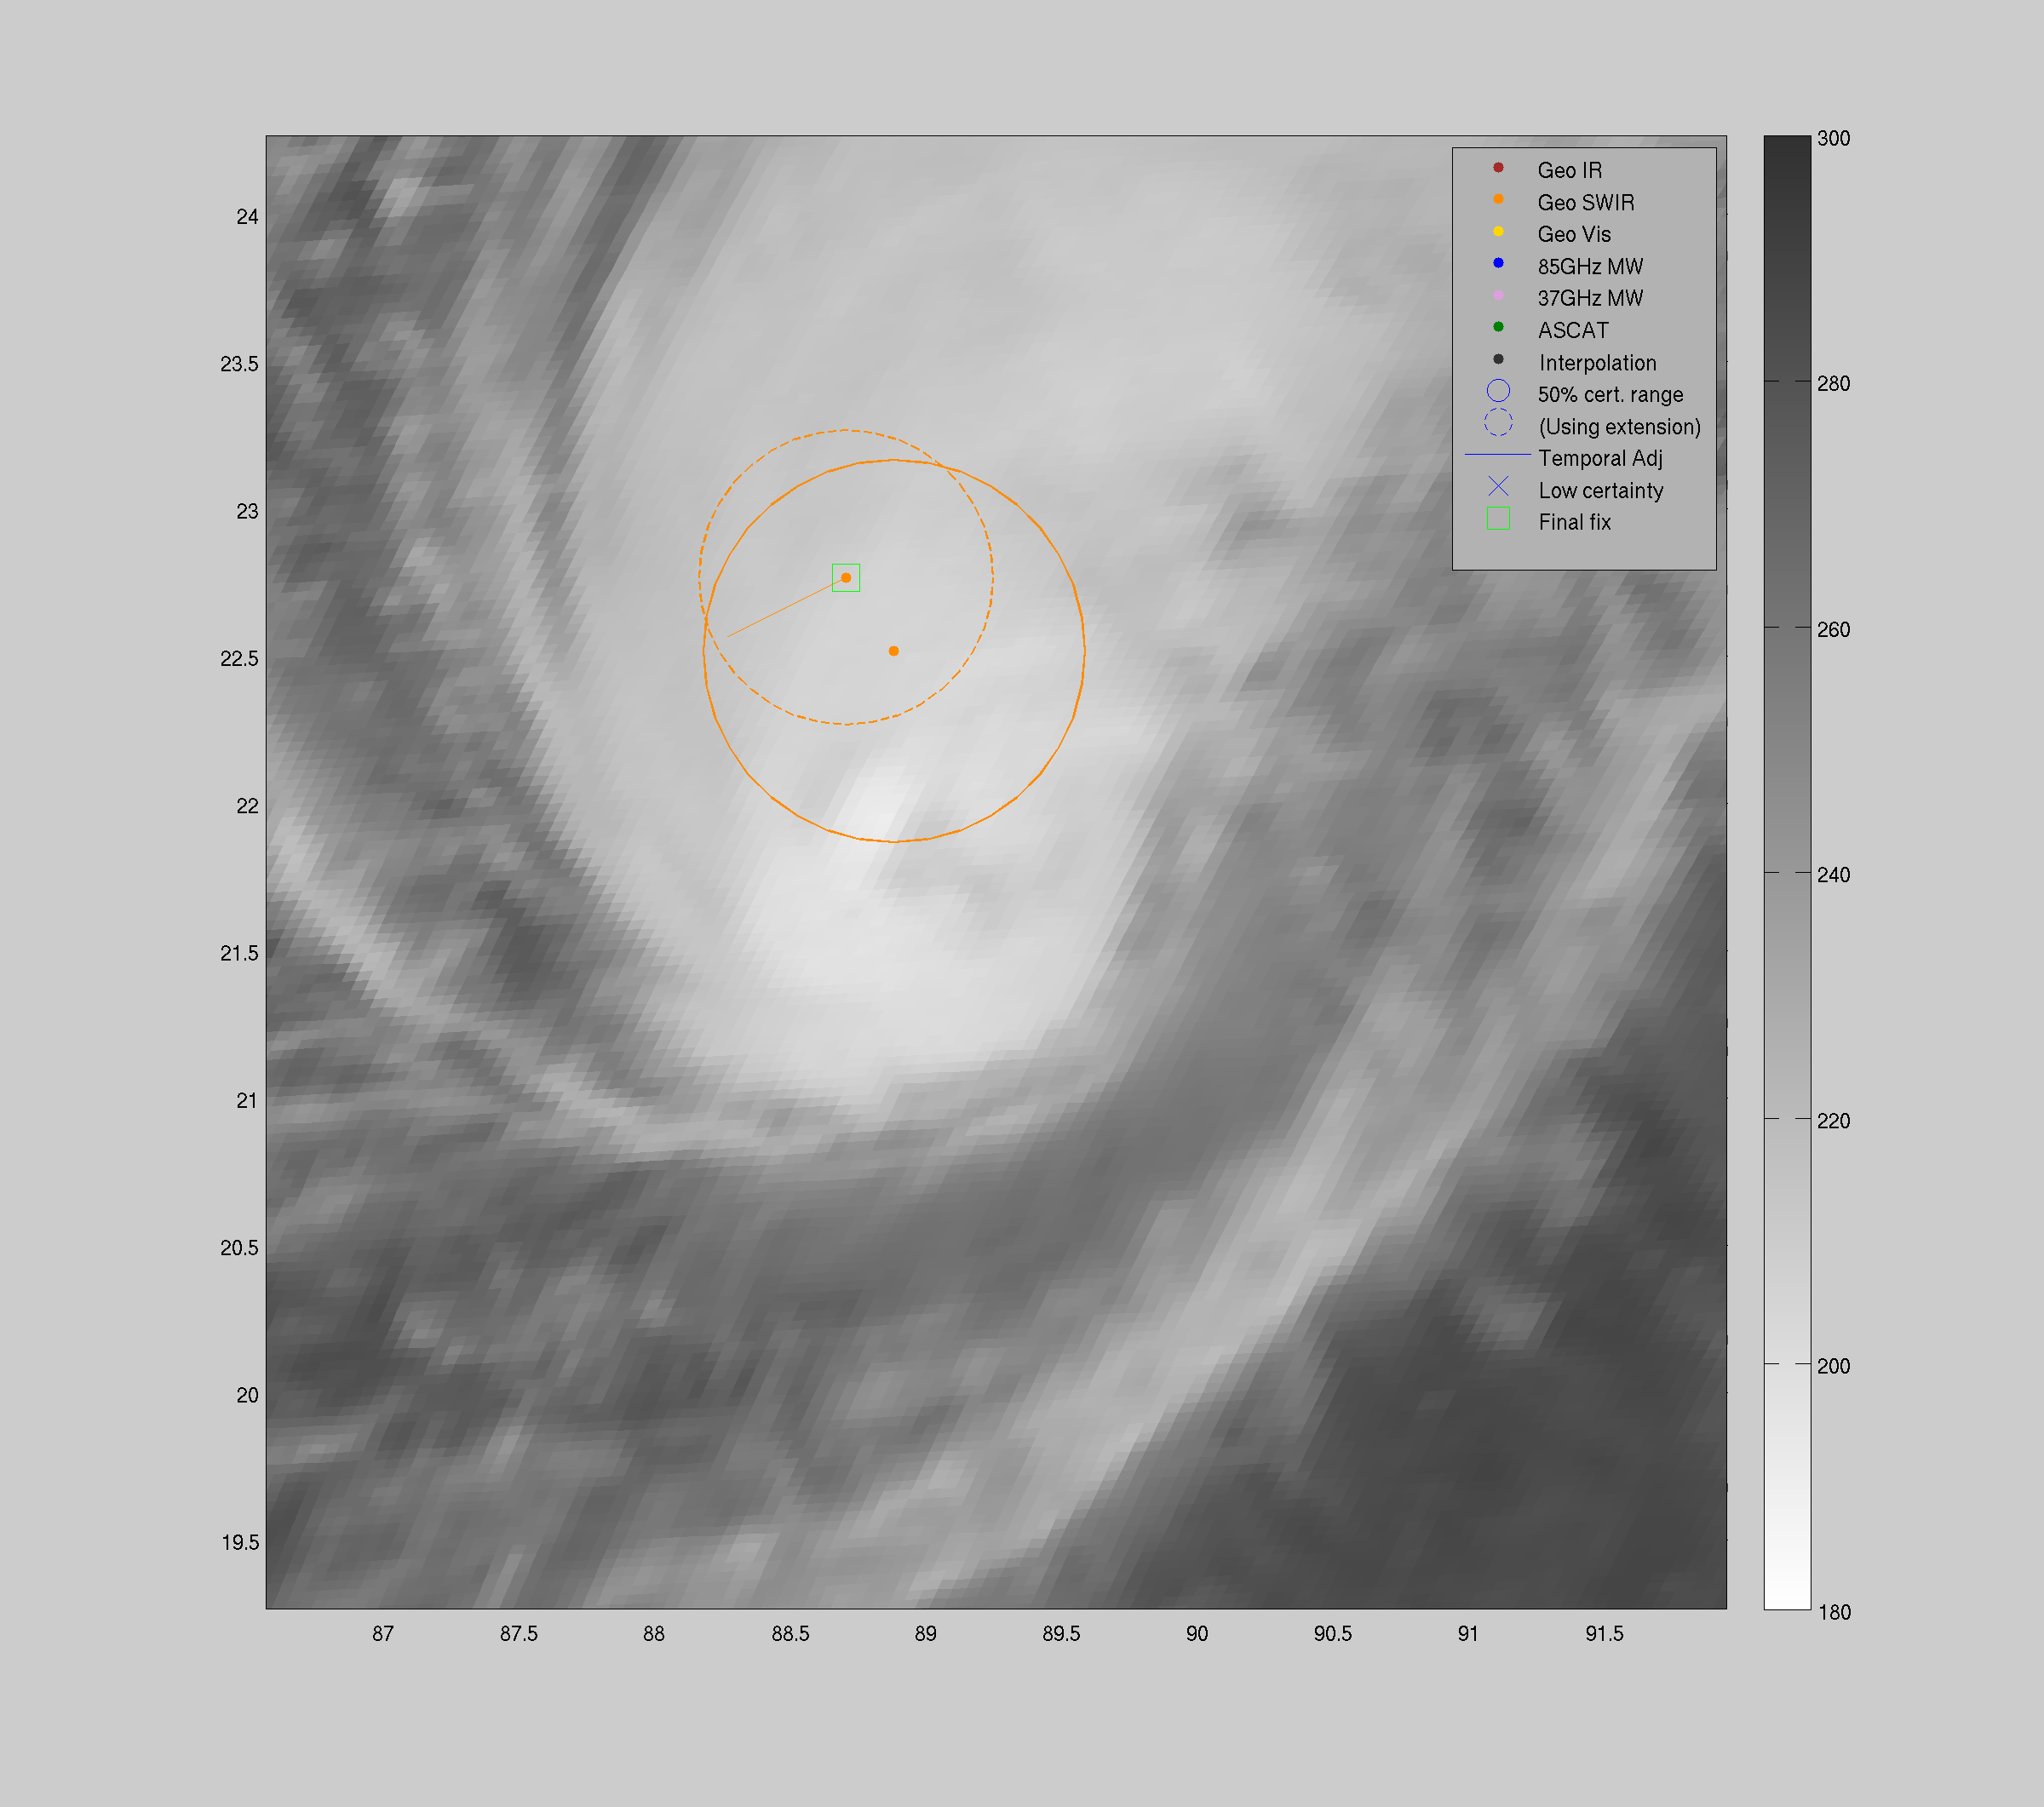
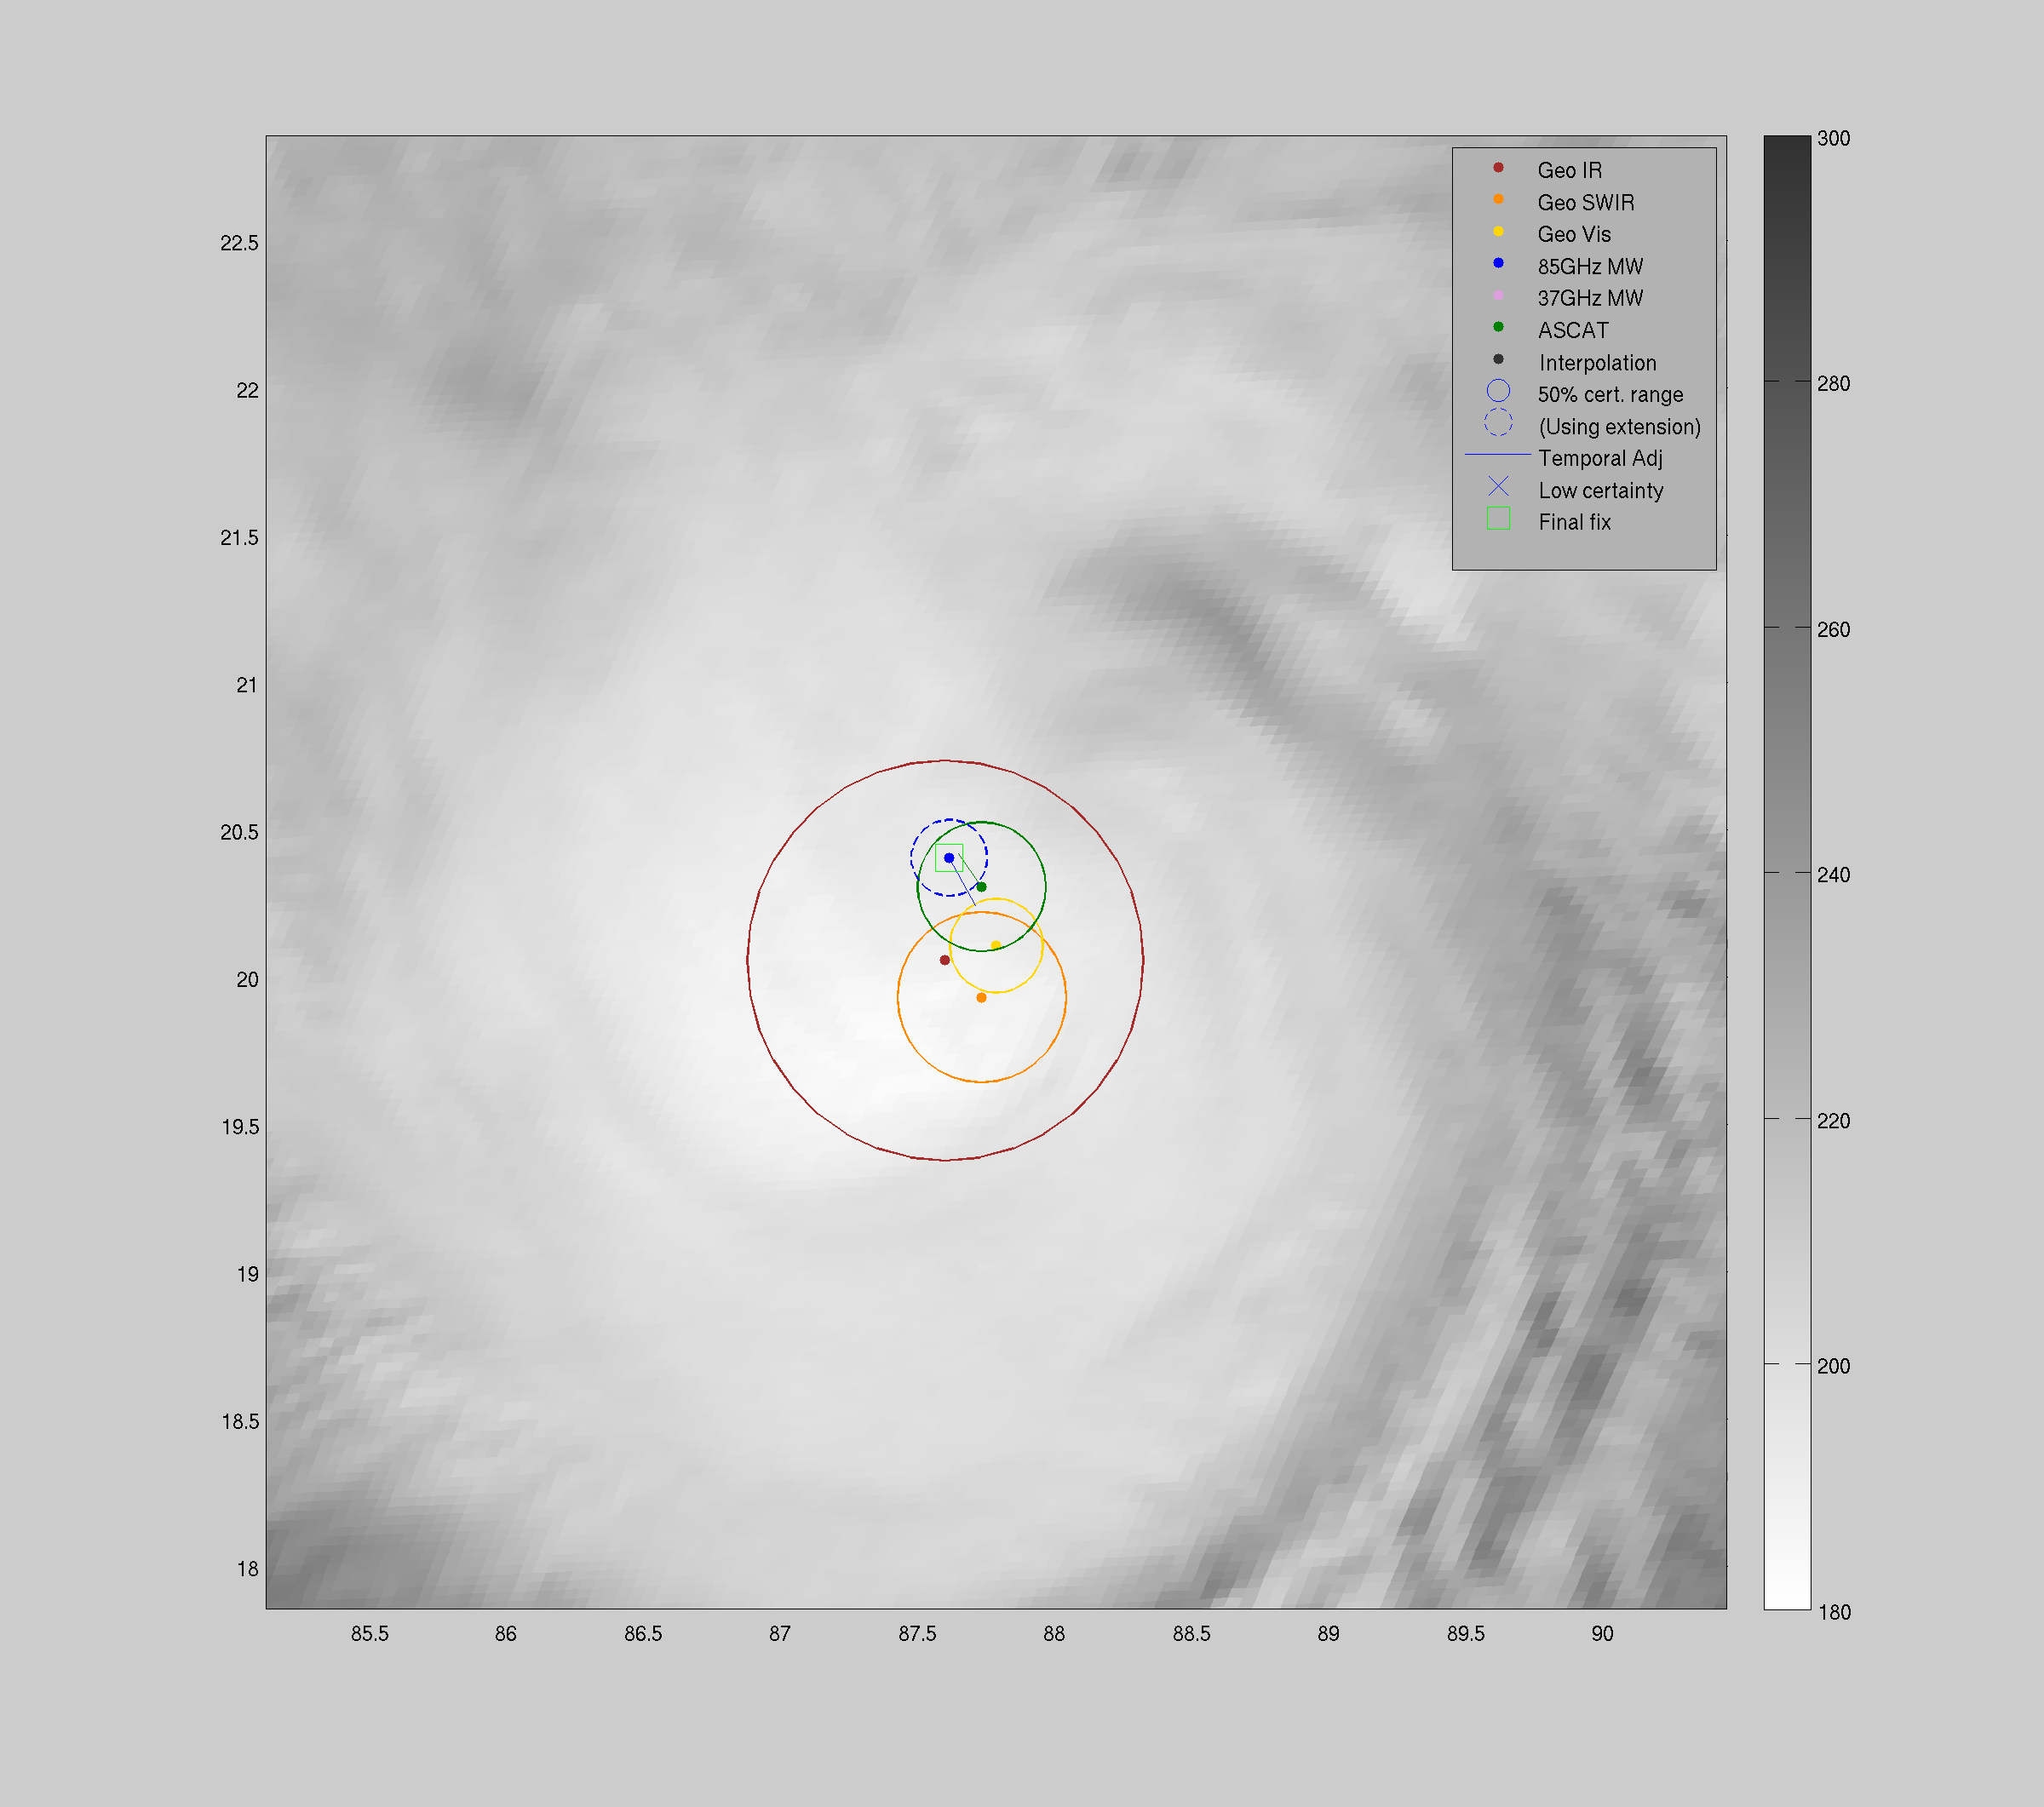
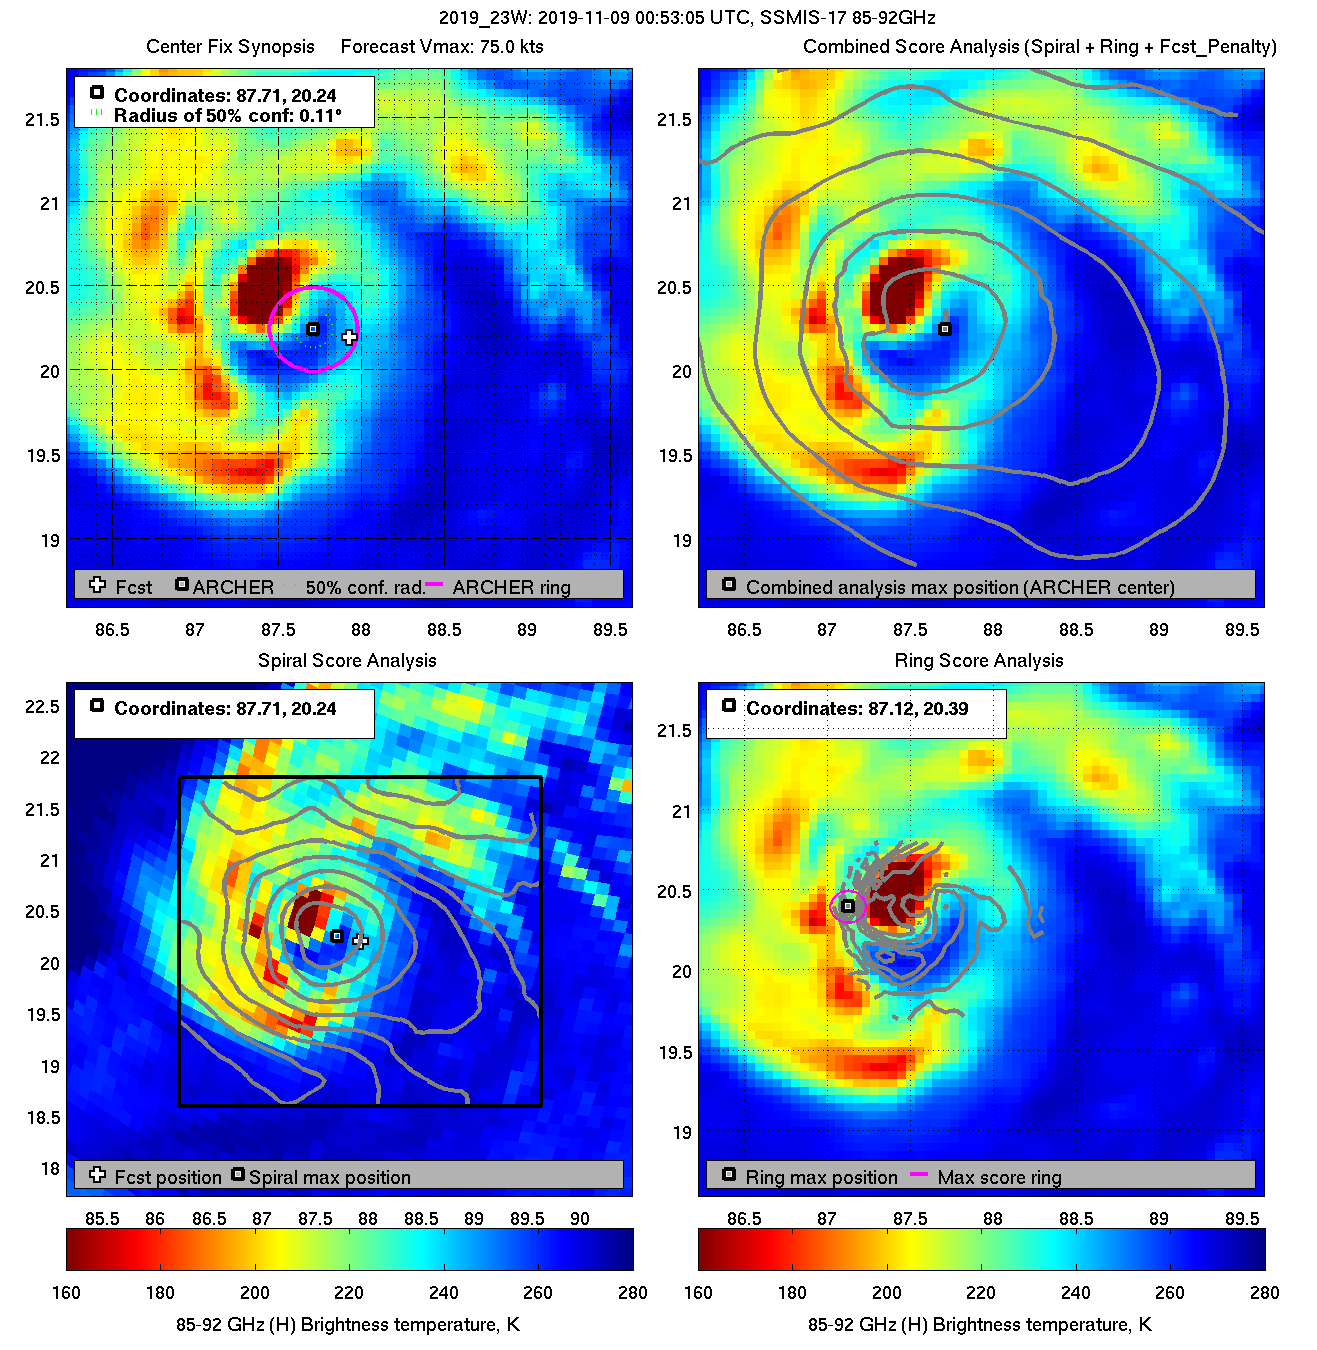
| 20191109 00:53:05 * |
SSMIS-17 |
85-92GHz |
75.0 |
20.24 |
87.71 |
20.09 |
87.73 |
0.11 |
0.31 |
0.50 |
96.1 |
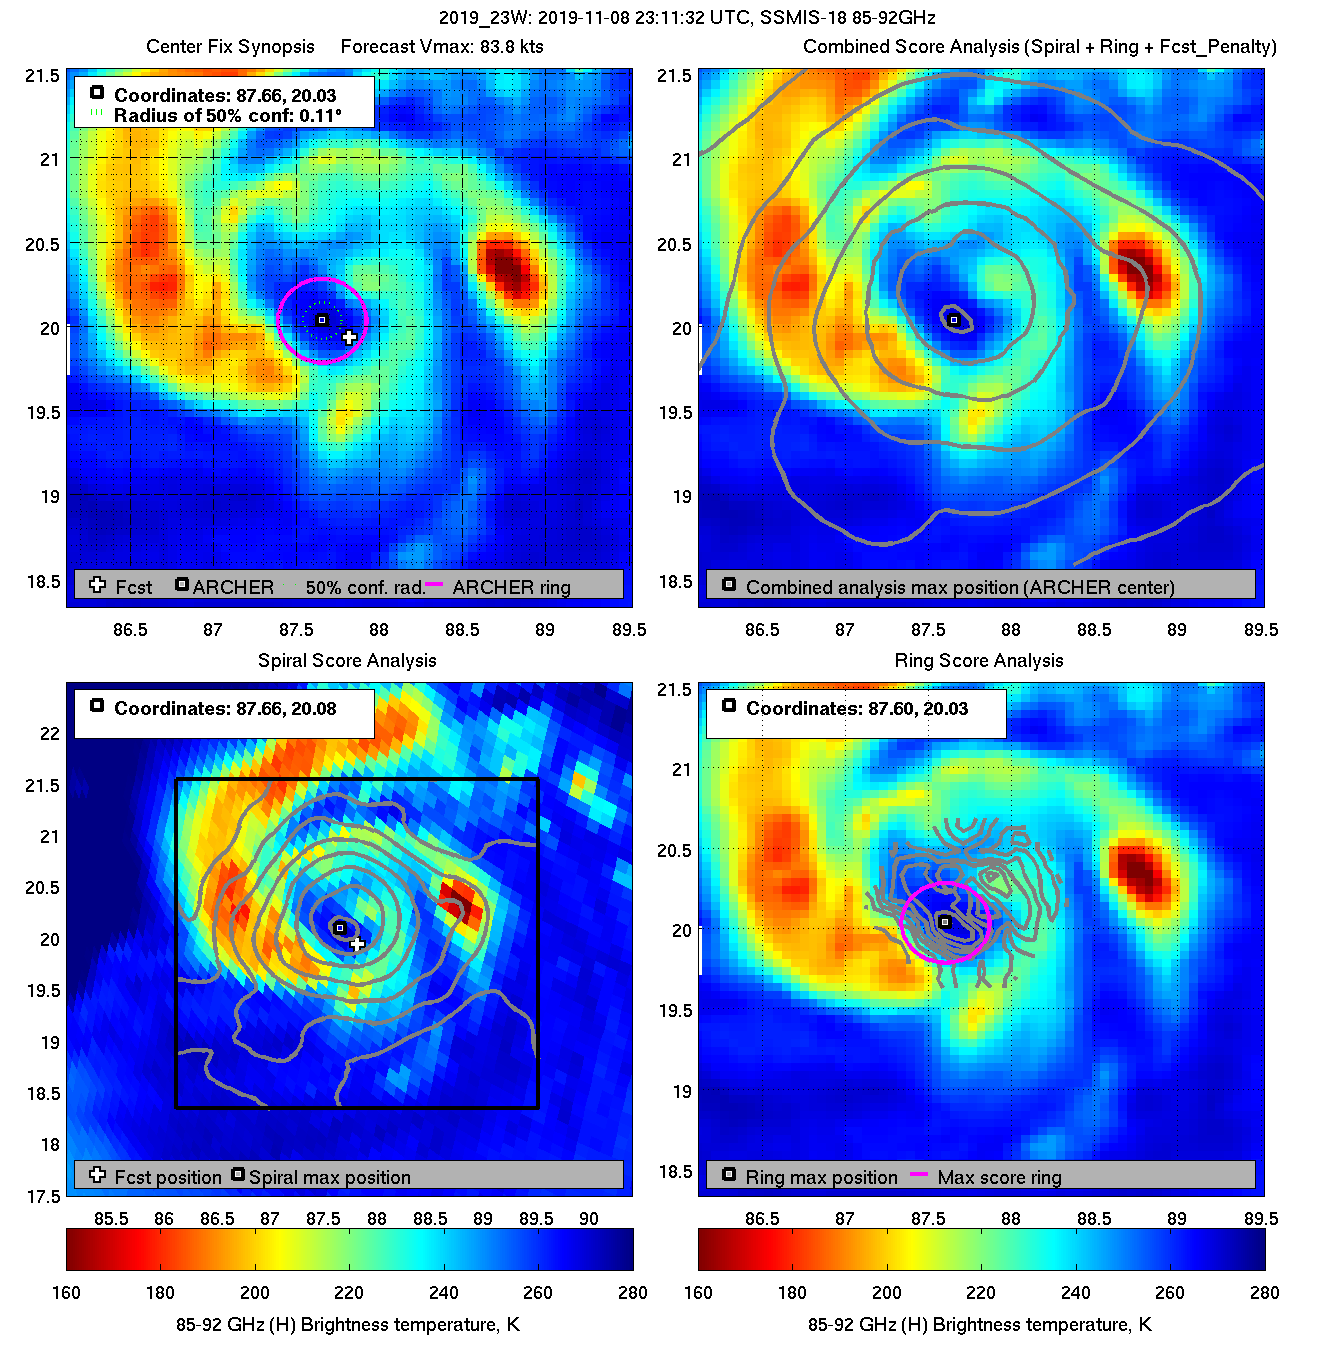
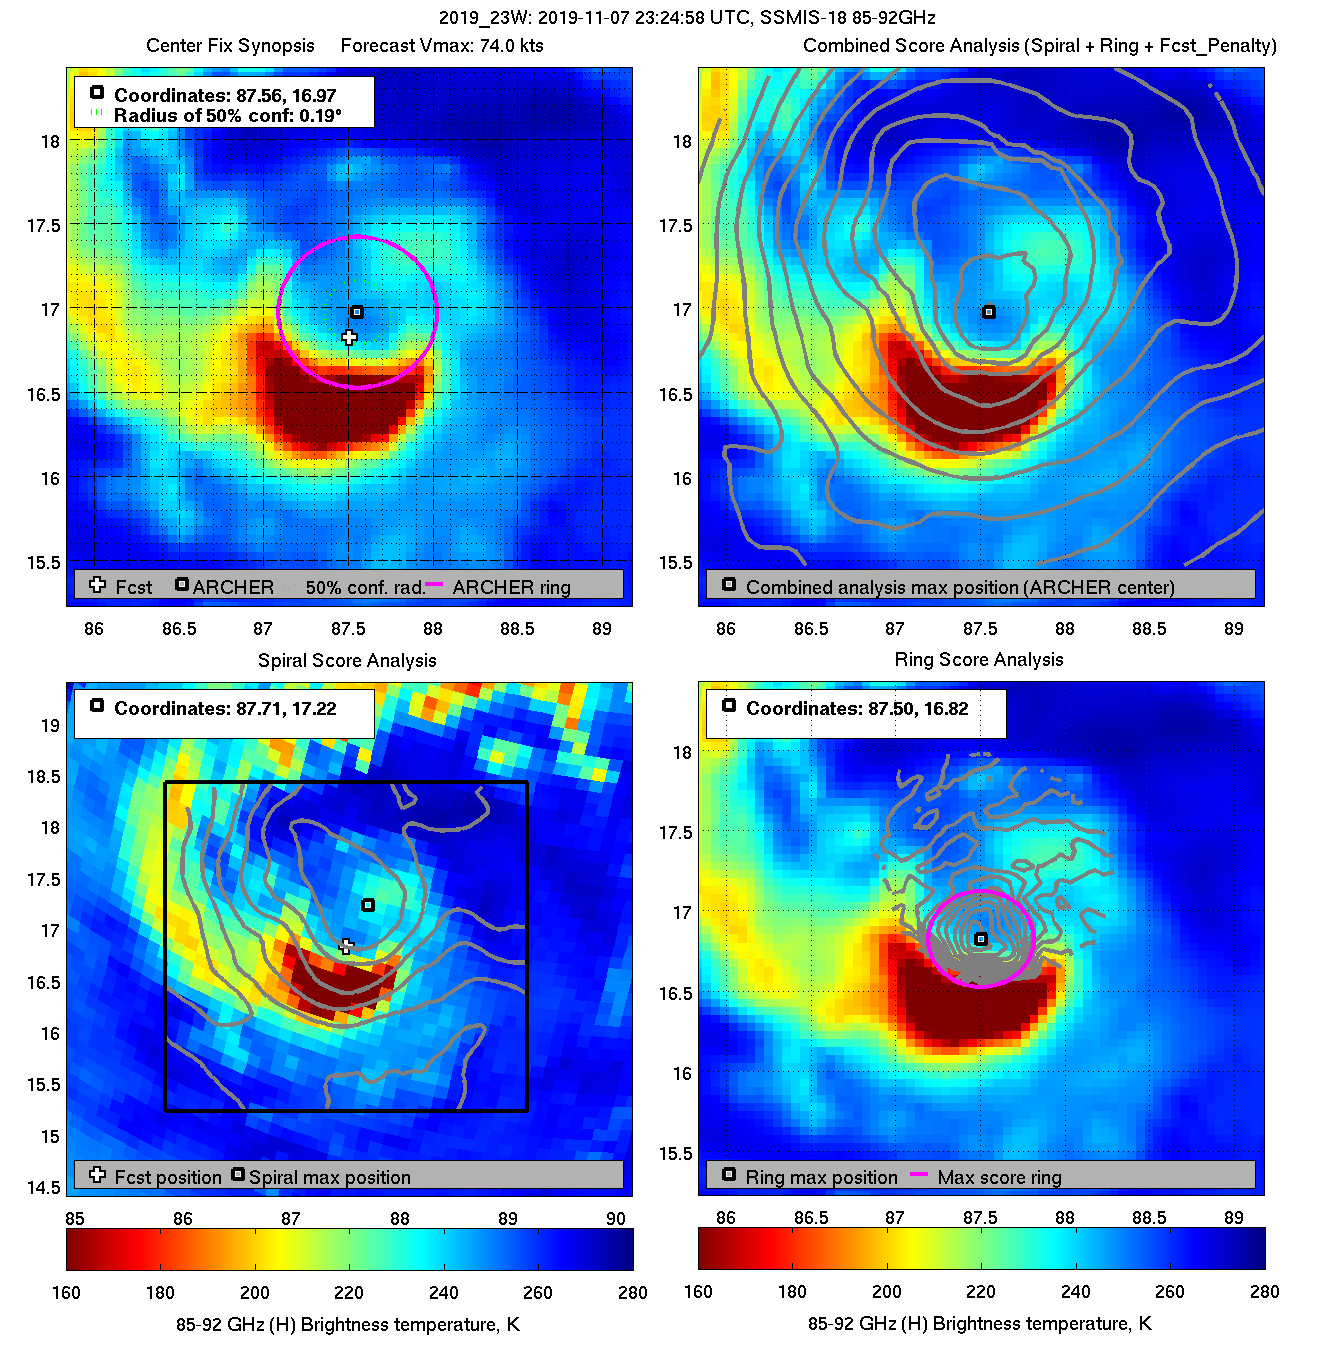
| 20191108 23:11:32 |
SSMIS-18 |
85-92GHz |
83.8 |
20.03 |
87.66 |
20.07 |
87.66 |
0.11 |
0.32 |
0.50 |
91.3 |
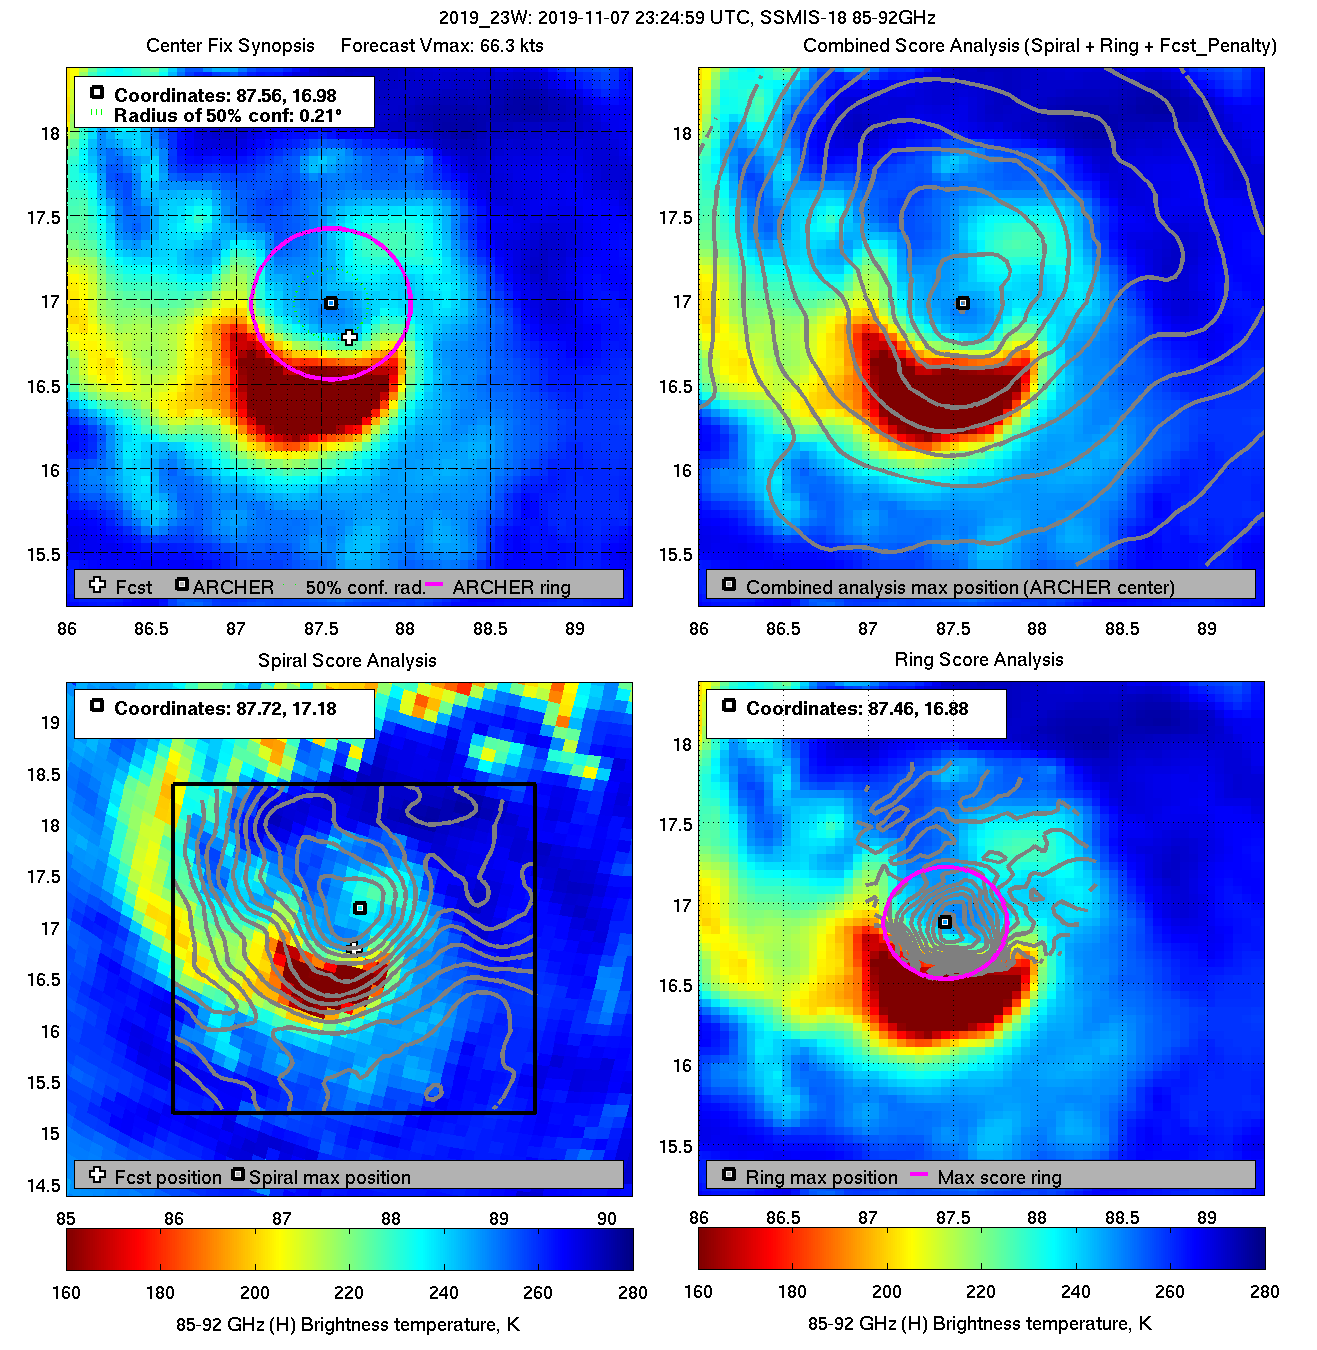
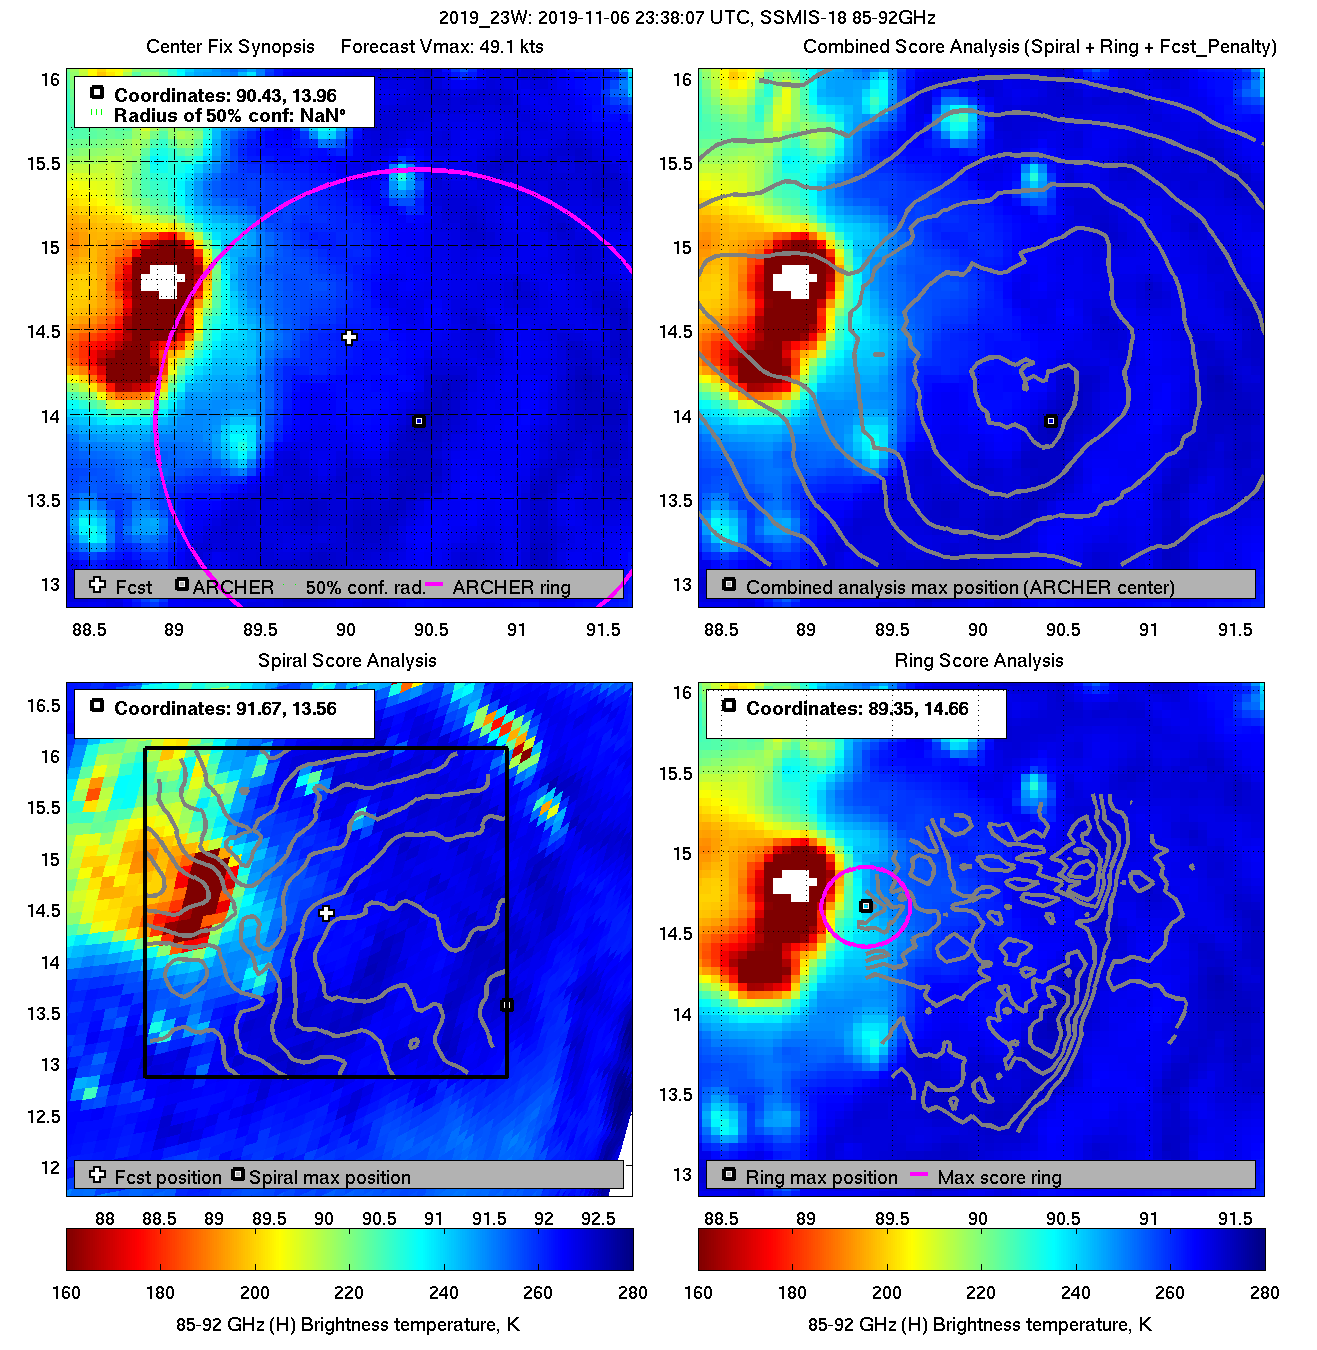
| 20191108 23:11:29 * |
SSMIS-18 |
85-92GHz |
76.3 |
20.01 |
87.67 |
20.05 |
87.67 |
0.11 |
0.32 |
0.50 |
91.8 |
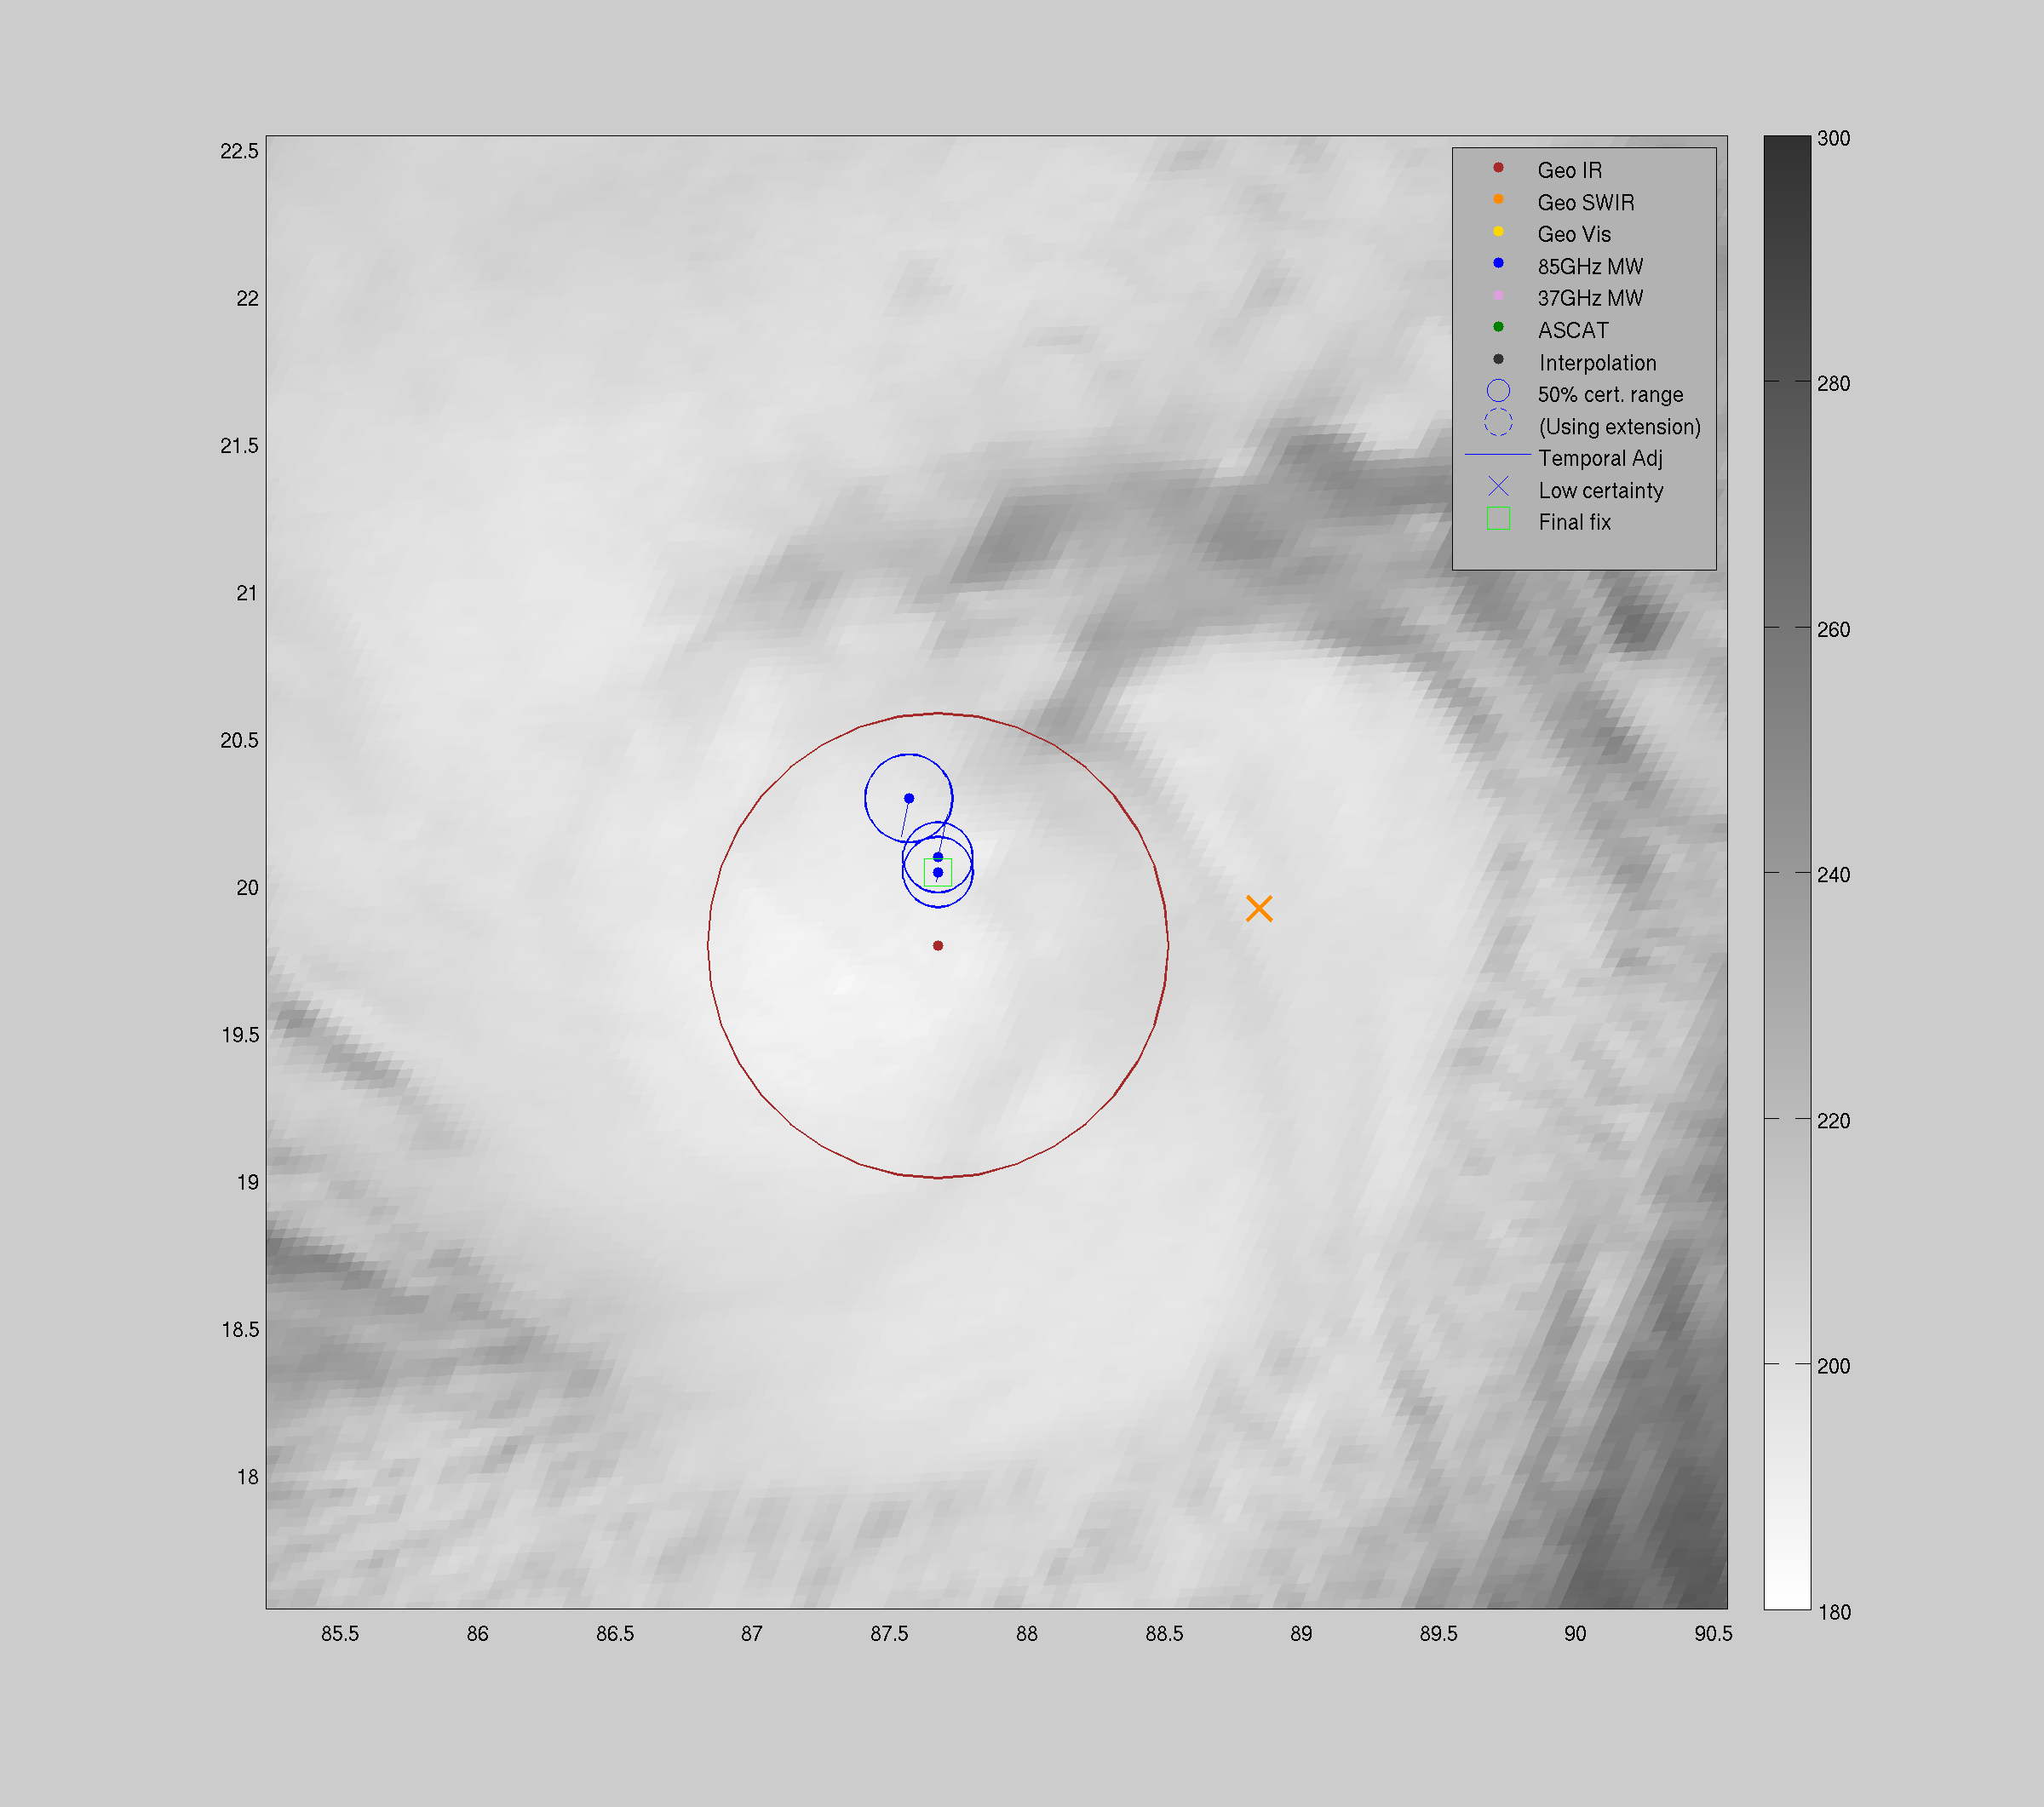
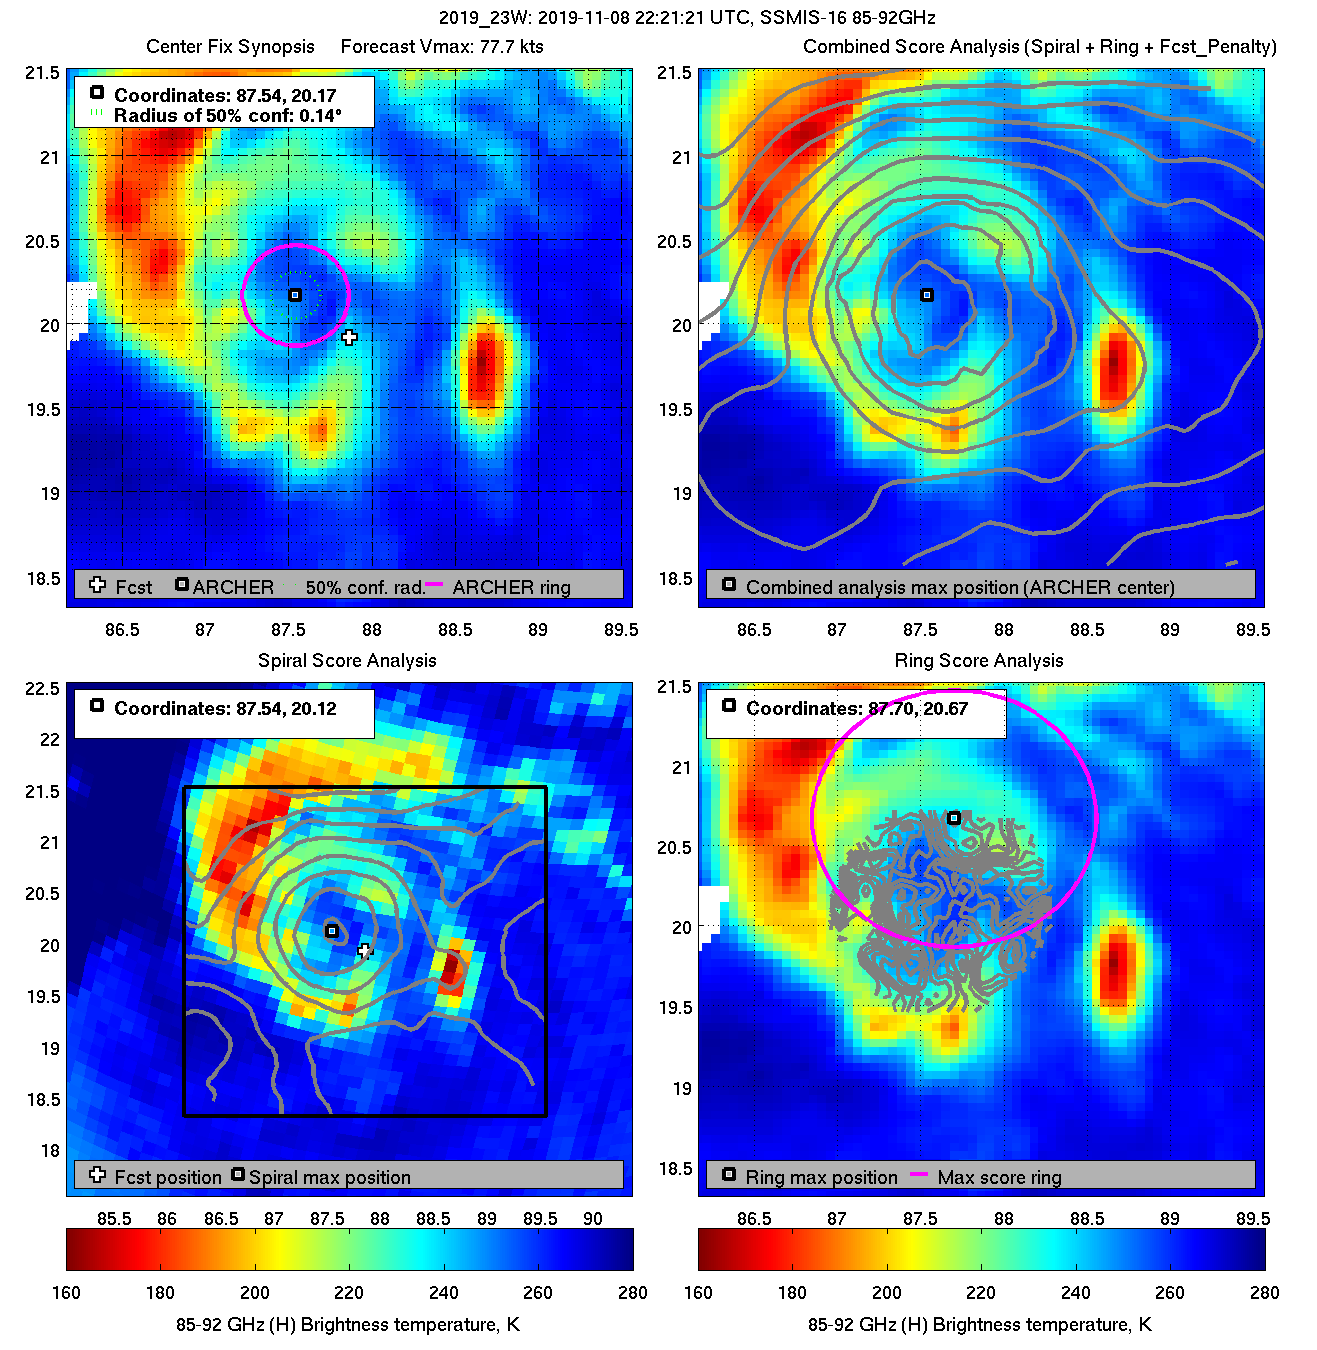
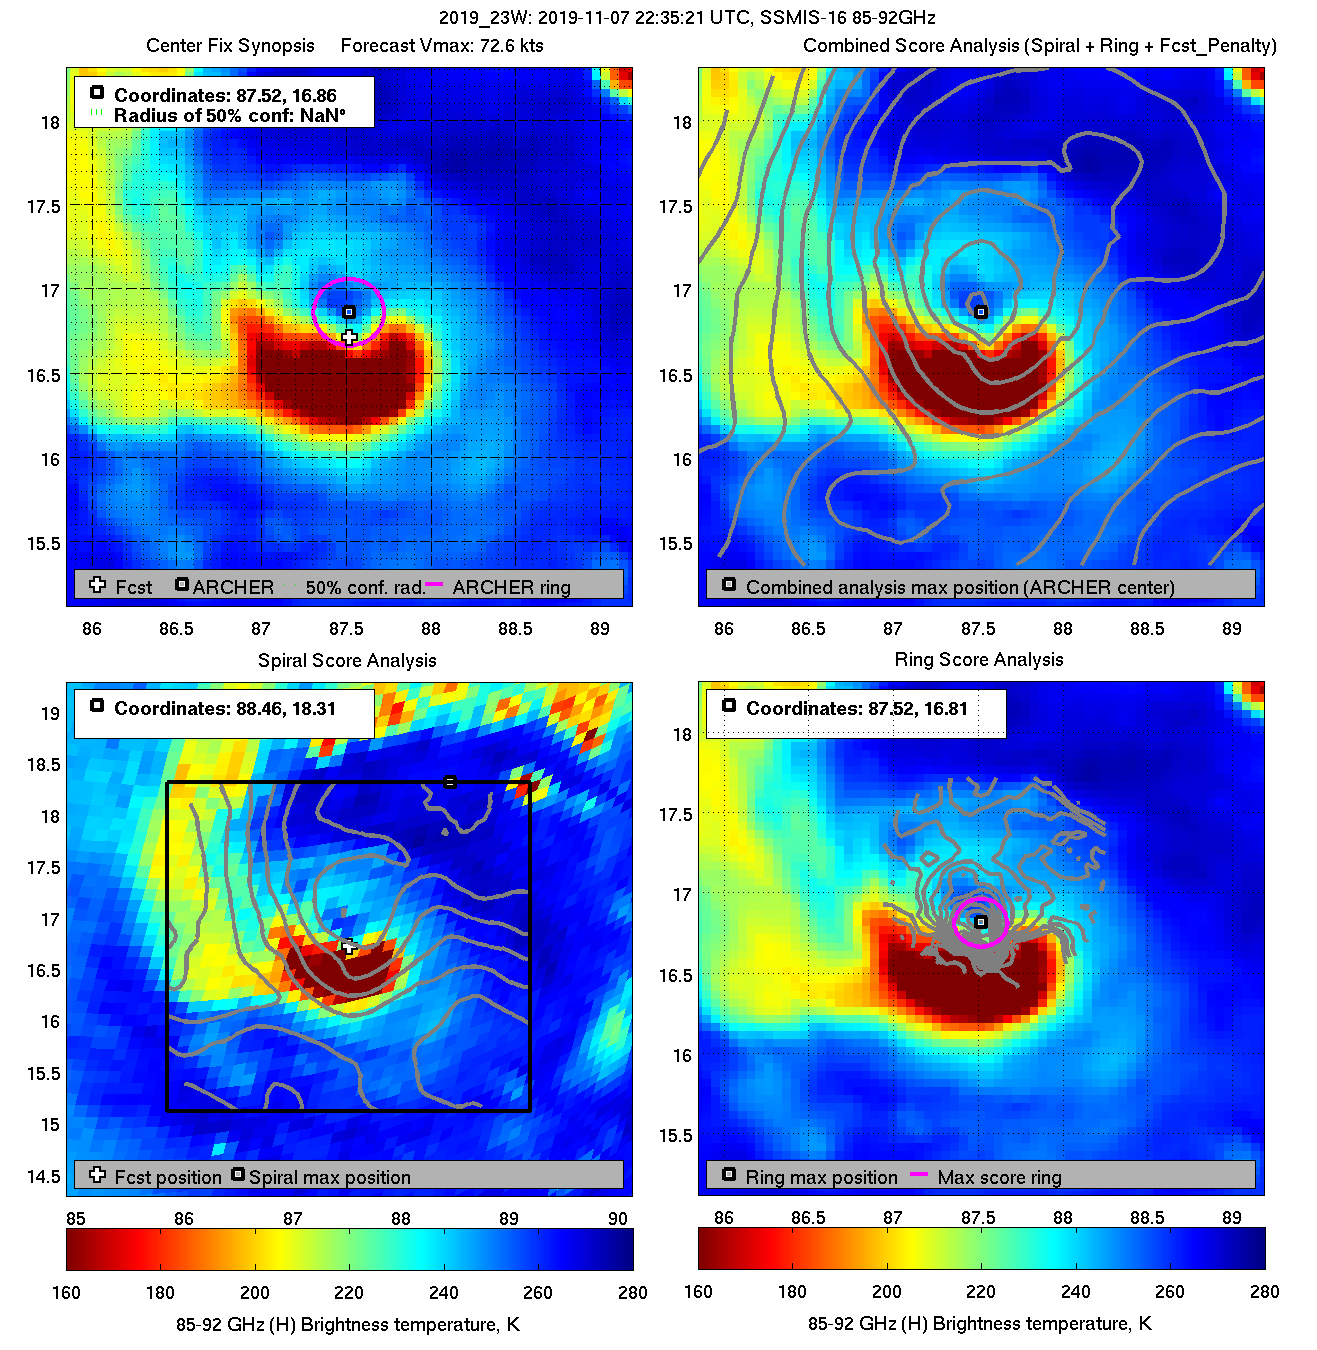
| 20191108 22:21:21 |
SSMIS-16 |
85-92GHz |
77.7 |
20.17 |
87.54 |
20.30 |
87.56 |
0.14 |
0.39 |
0.60 |
56.4 |
|
|
|
 |
 |
|
|
|
 |
 |
|
|
|
 |
 |
|
|
|
 |
 |
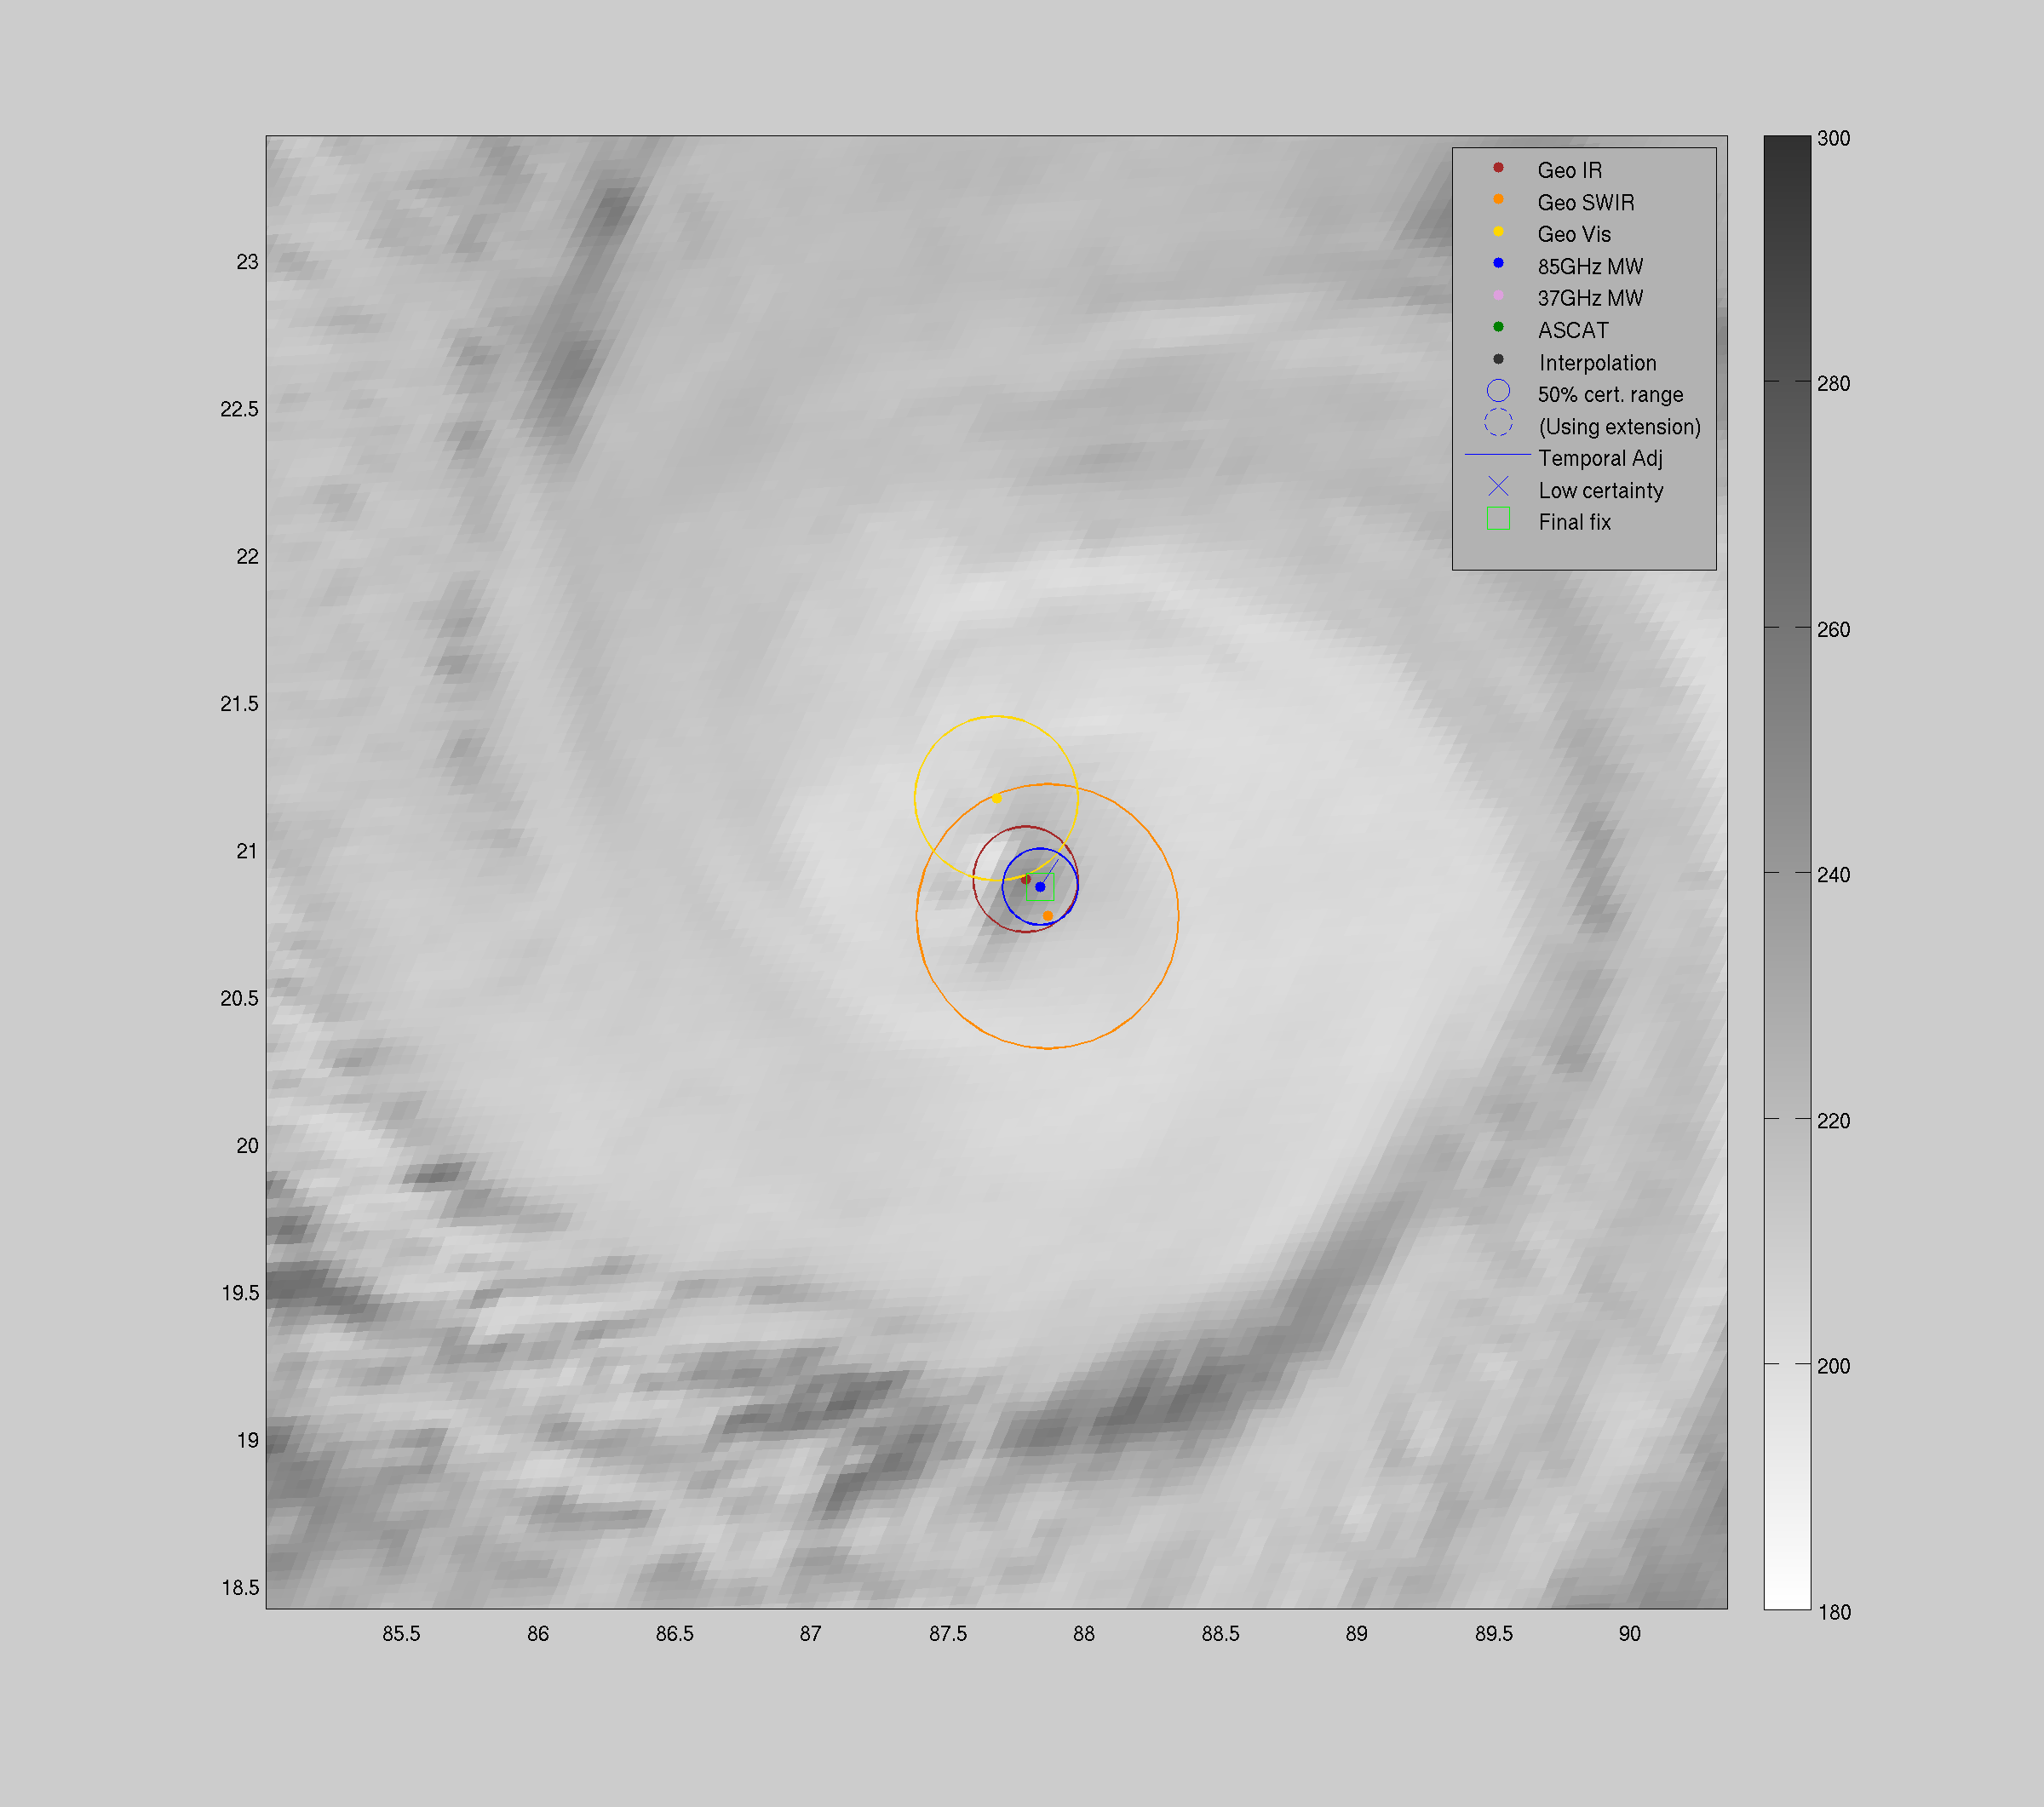
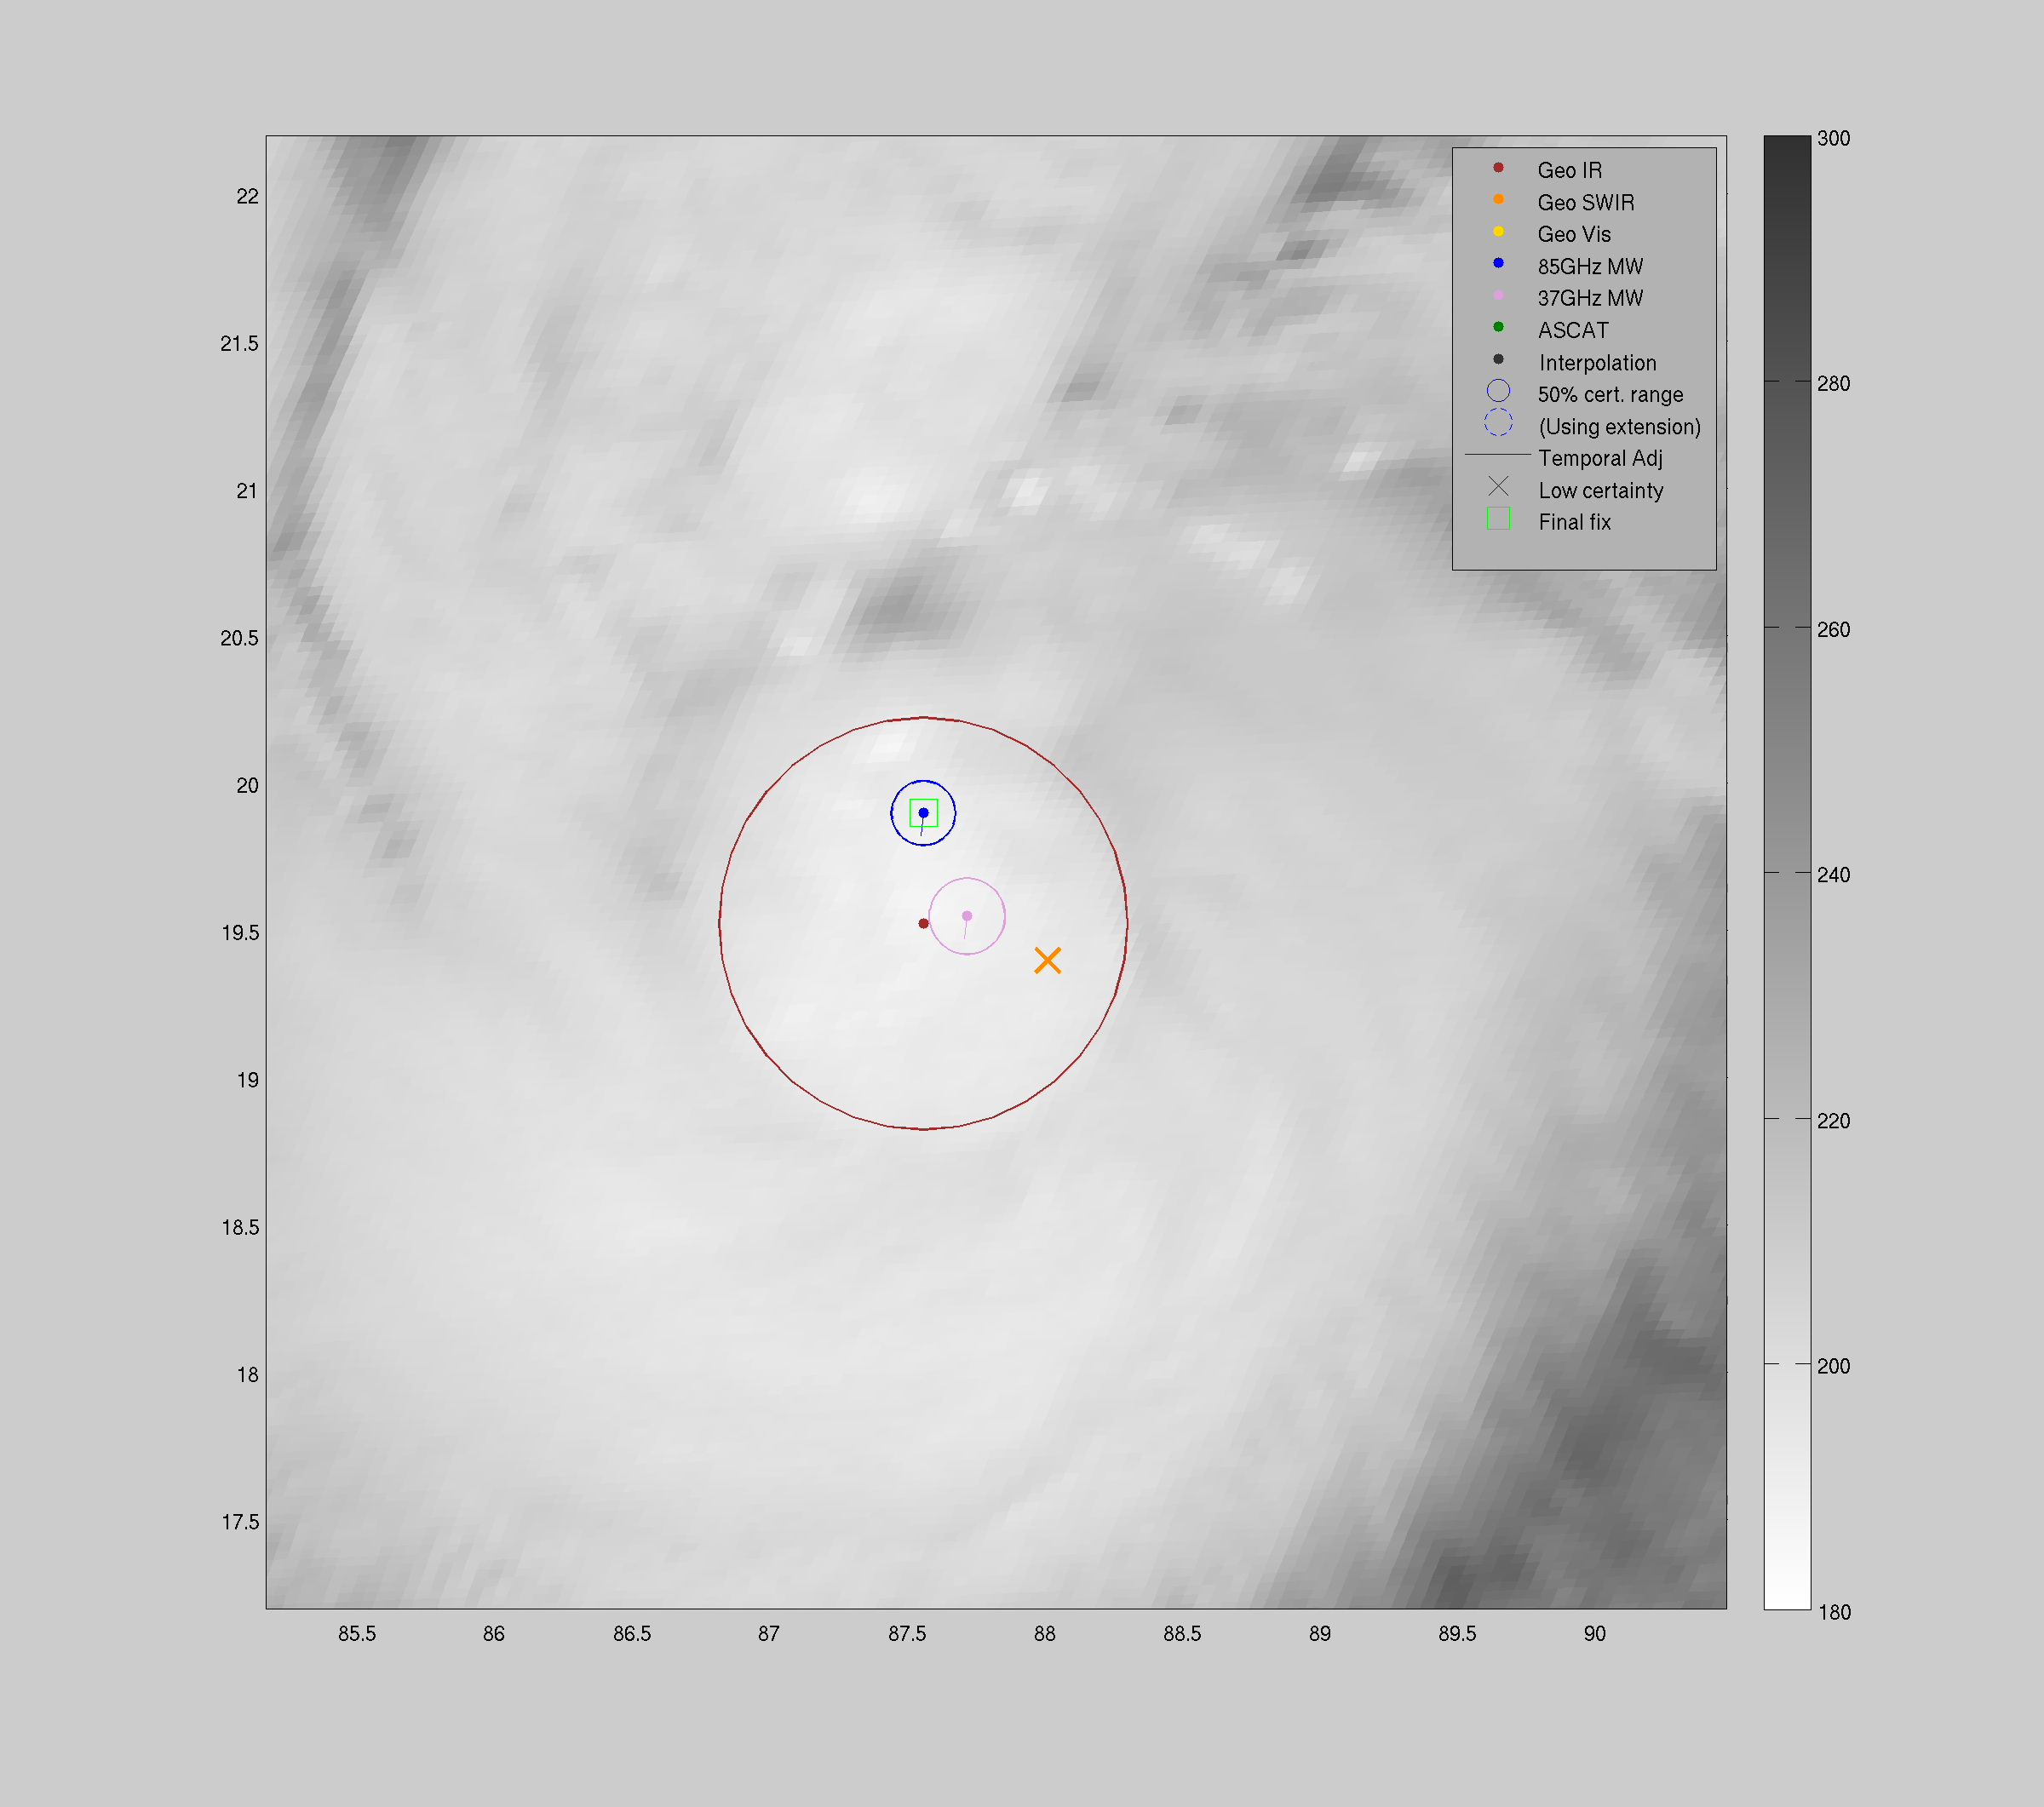
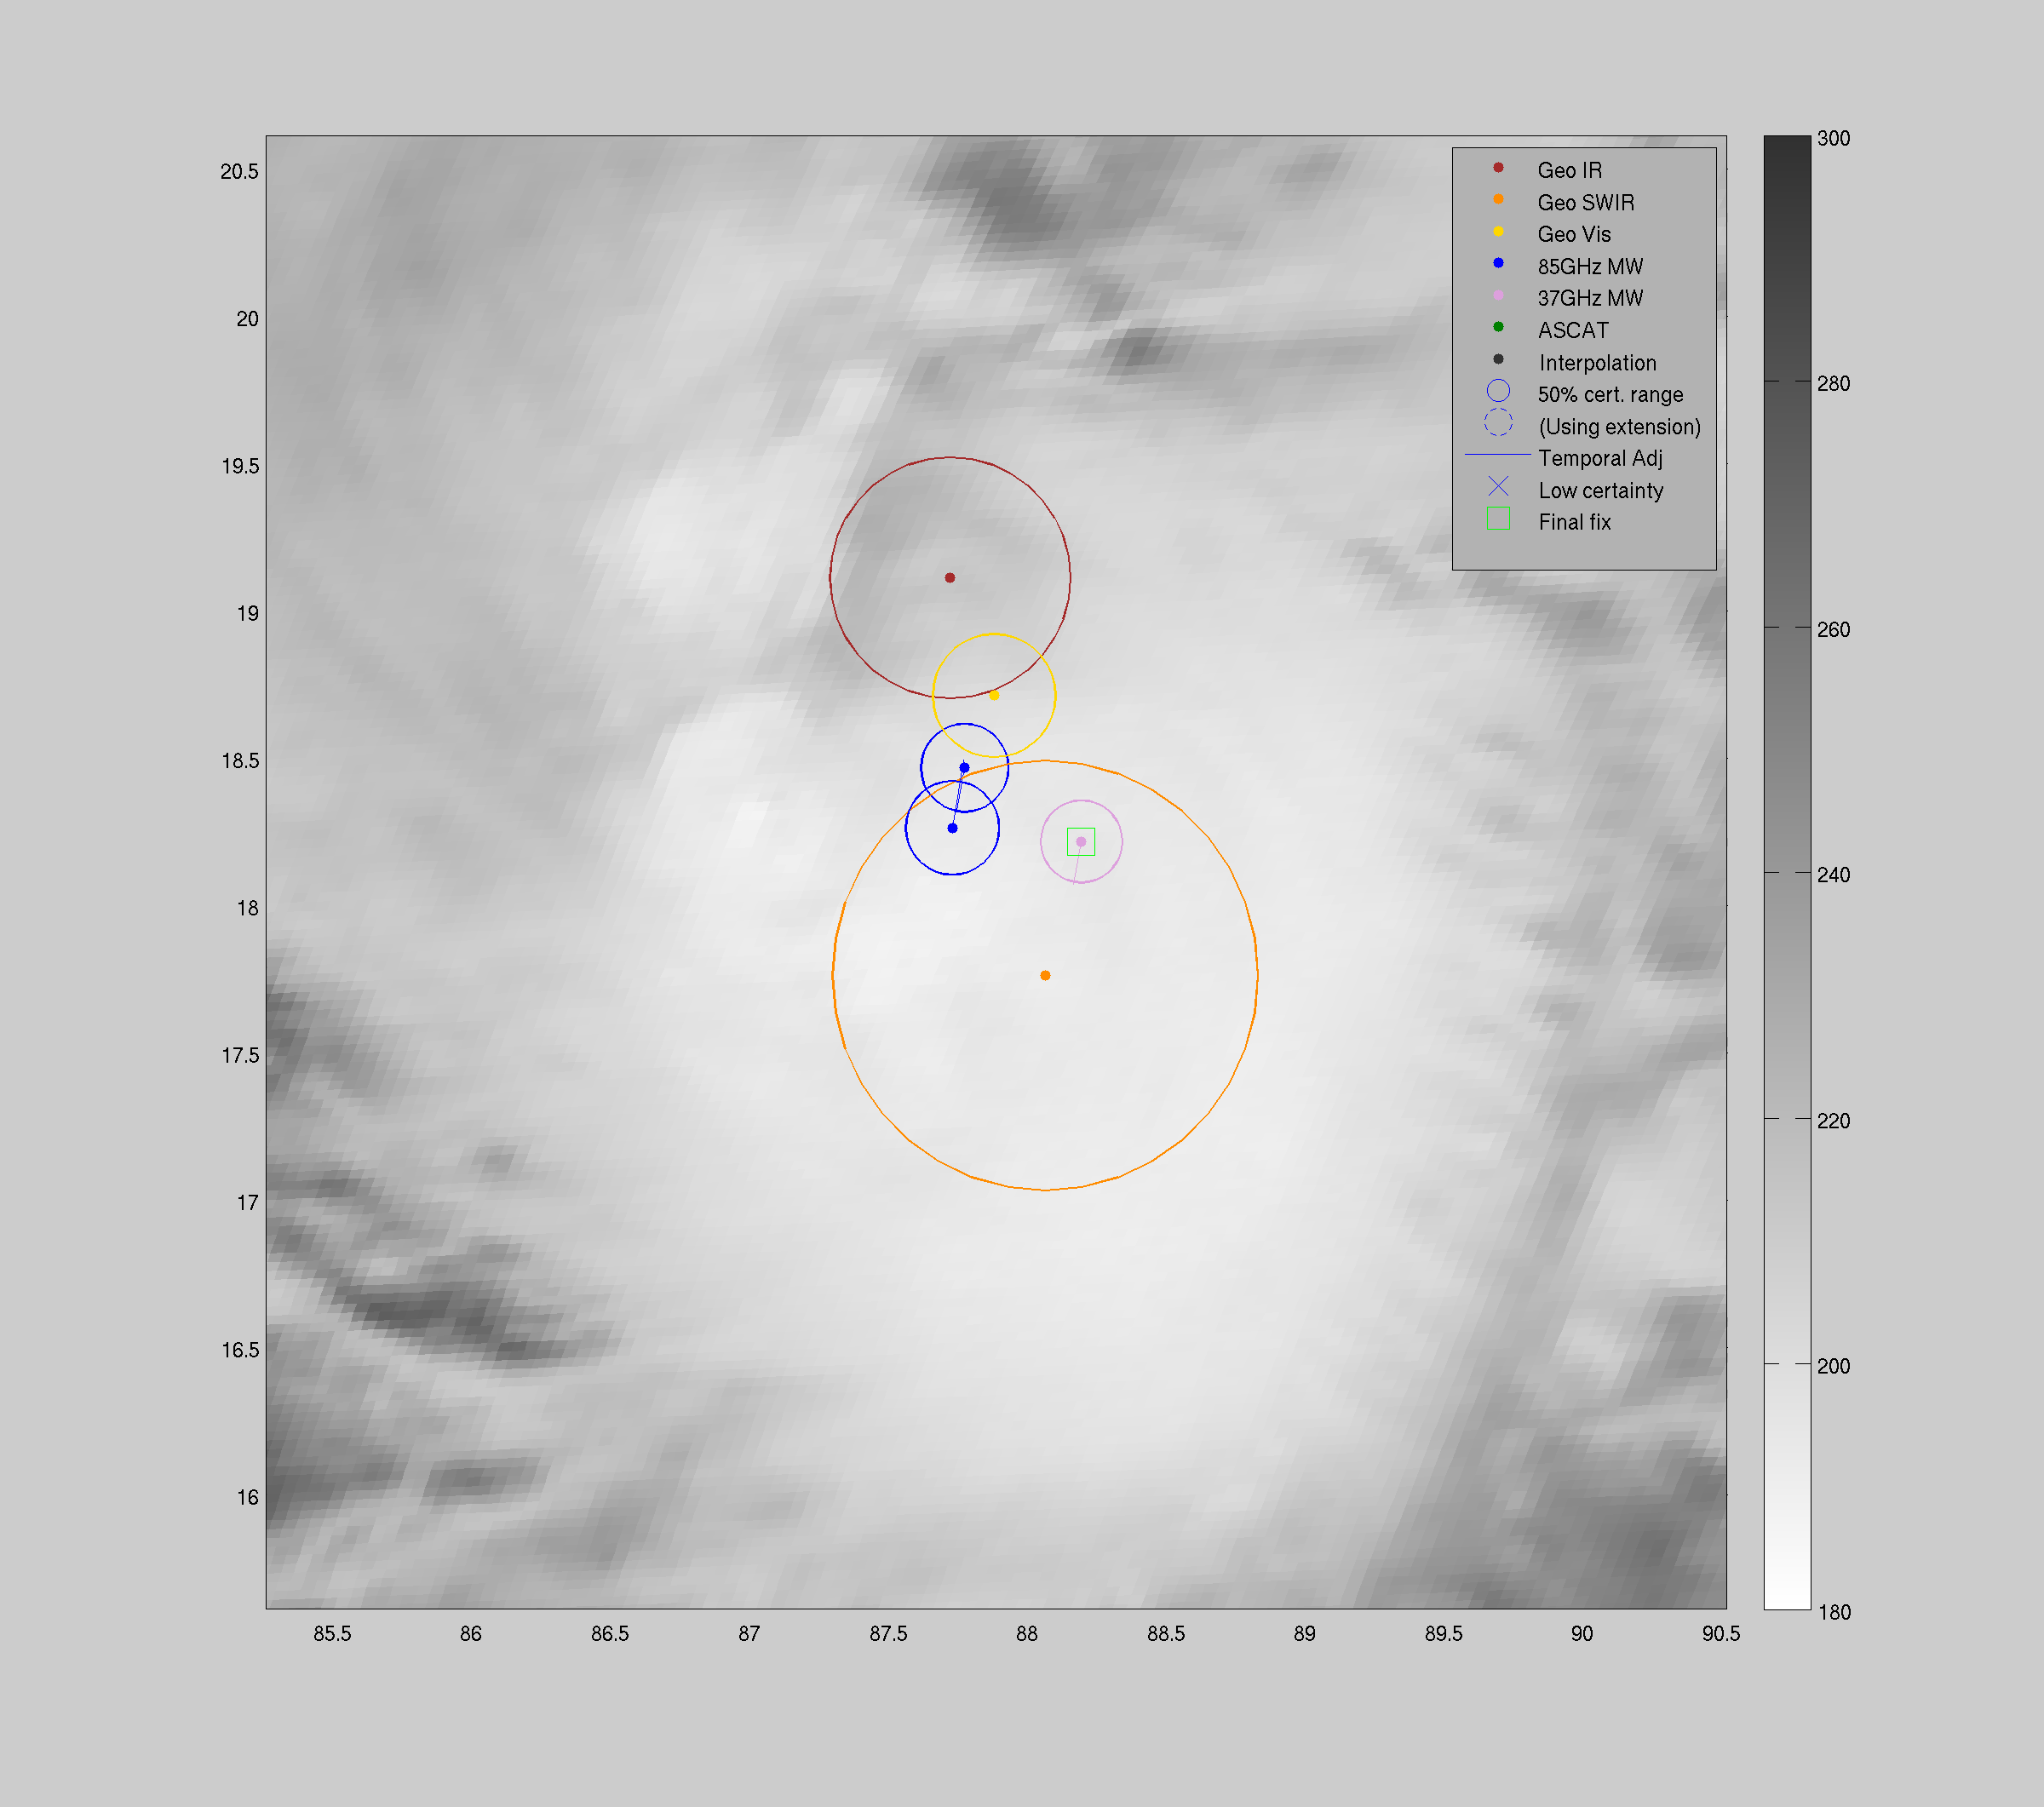
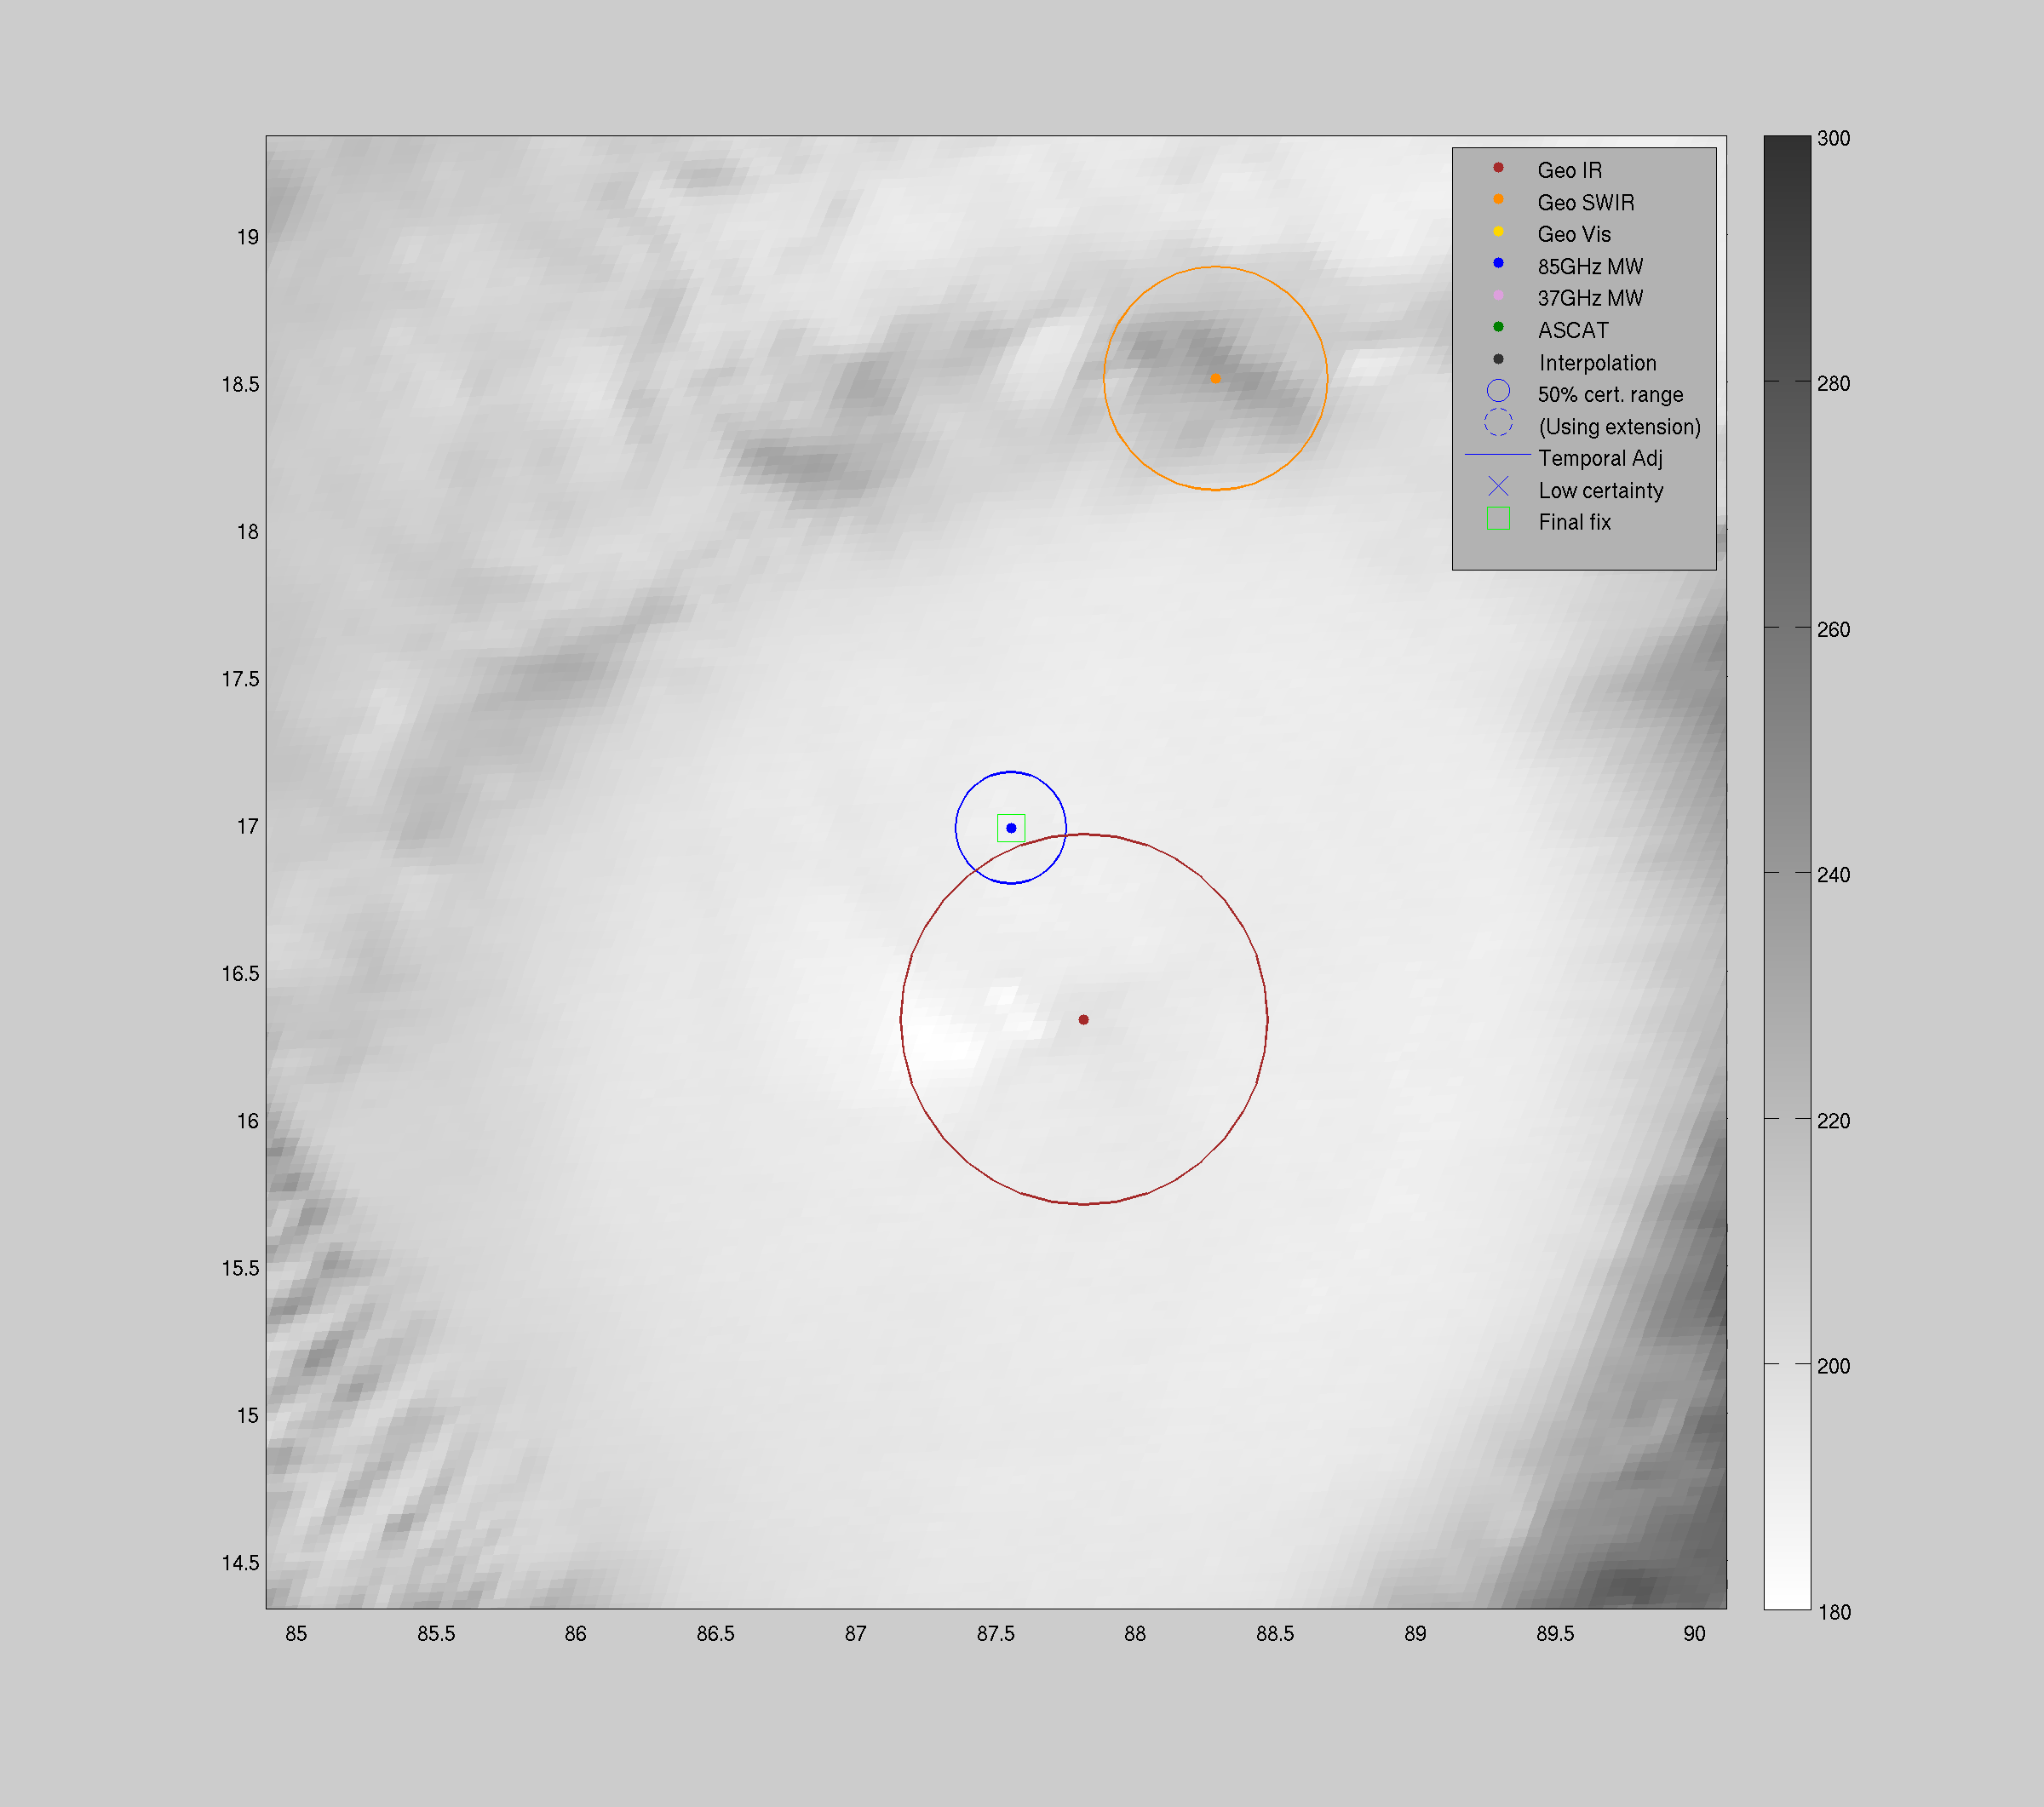
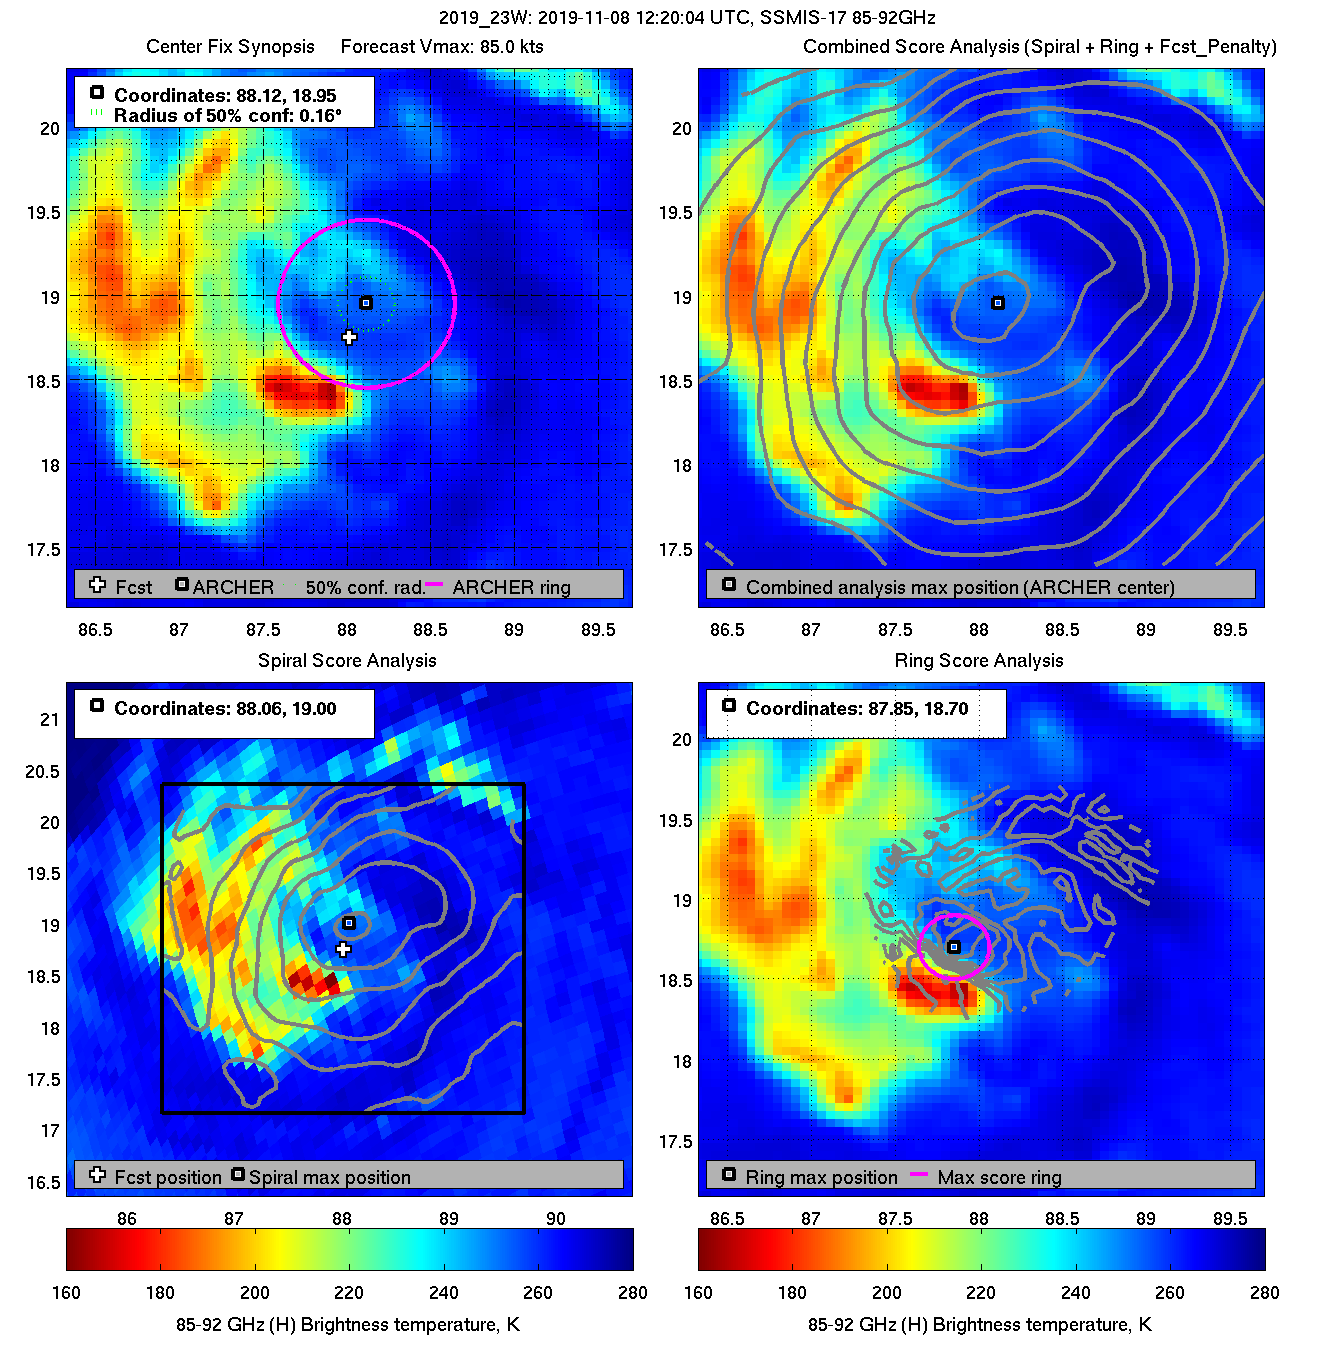
| 20191108 12:20:04 |
SSMIS-17 |
85-92GHz |
85.0 |
18.95 |
88.12 |
18.83 |
88.12 |
0.16 |
0.45 |
1.00 |
9.9 |
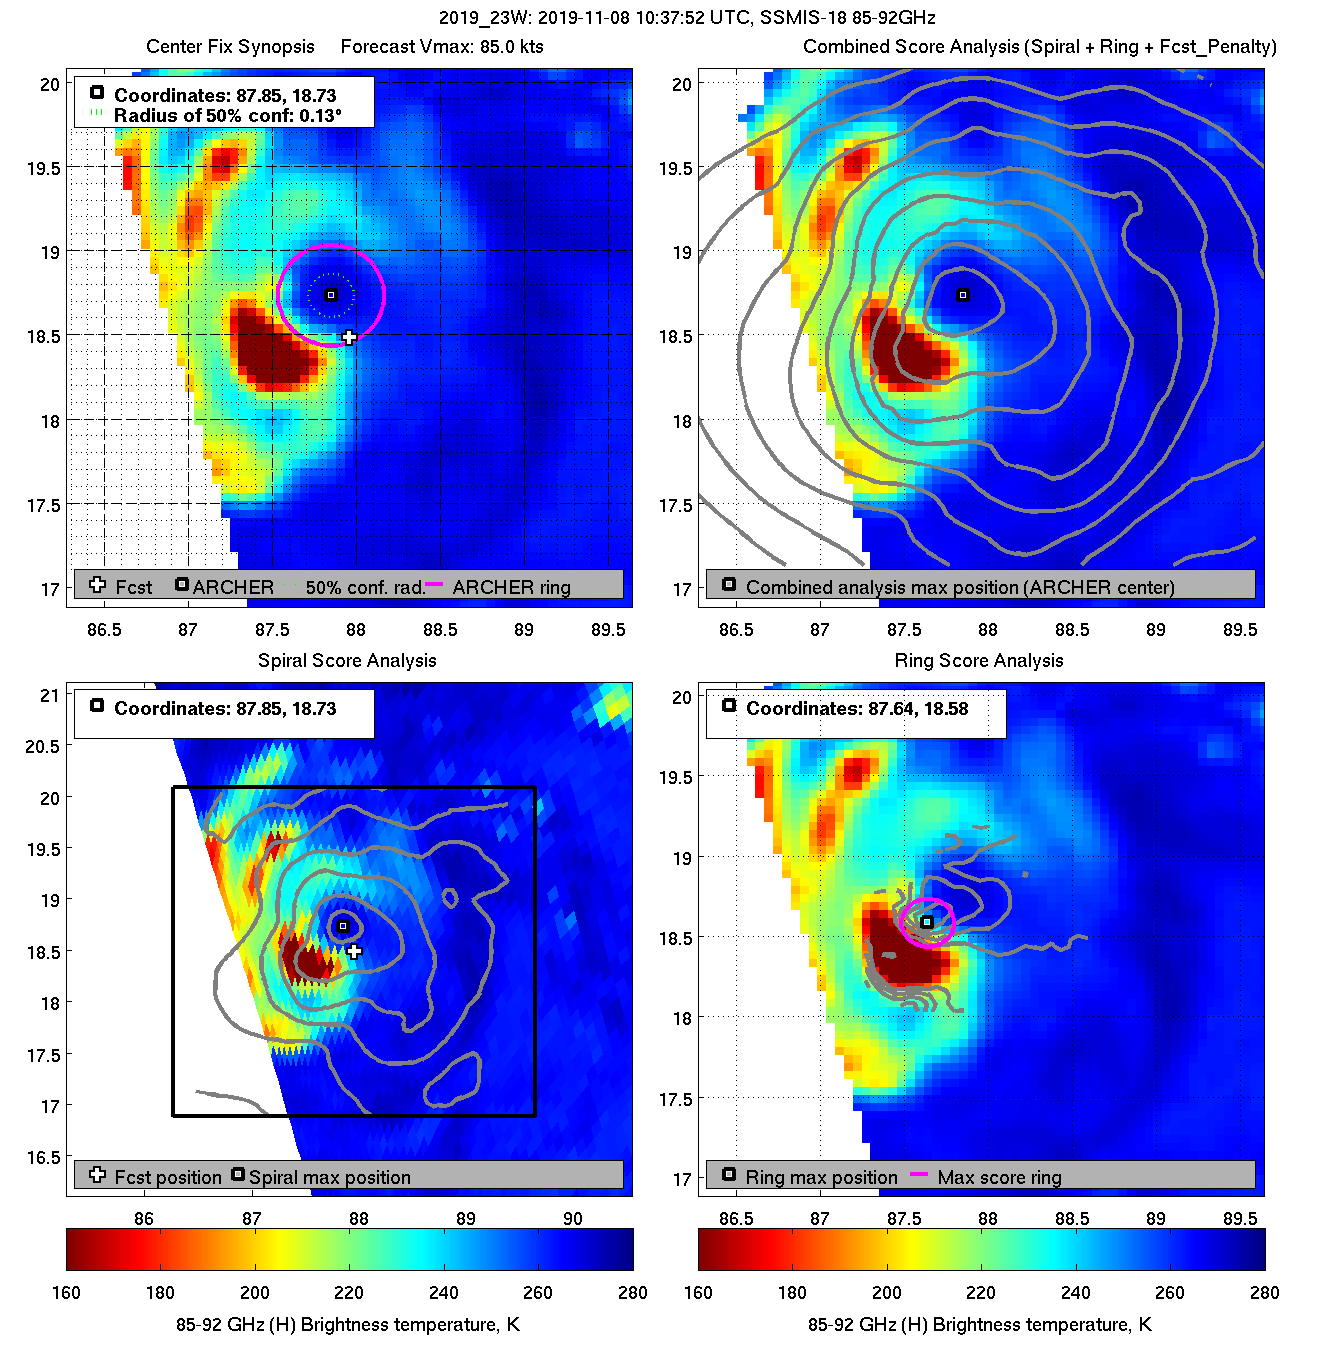
| 20191108 10:37:52 * |
SSMIS-18 |
85-92GHz |
85.0 |
18.73 |
87.85 |
18.87 |
87.86 |
0.13 |
0.37 |
0.60 |
76.9 |
|
|
|
 |
 |
|
|
|
 |
 |
|
|
|
 |
 |
|
|
|
 |
 |
|
|
|
 |
 |
|
|
|
 |
 |
|
|
|
 |
 |
|
|
|
 |
 |
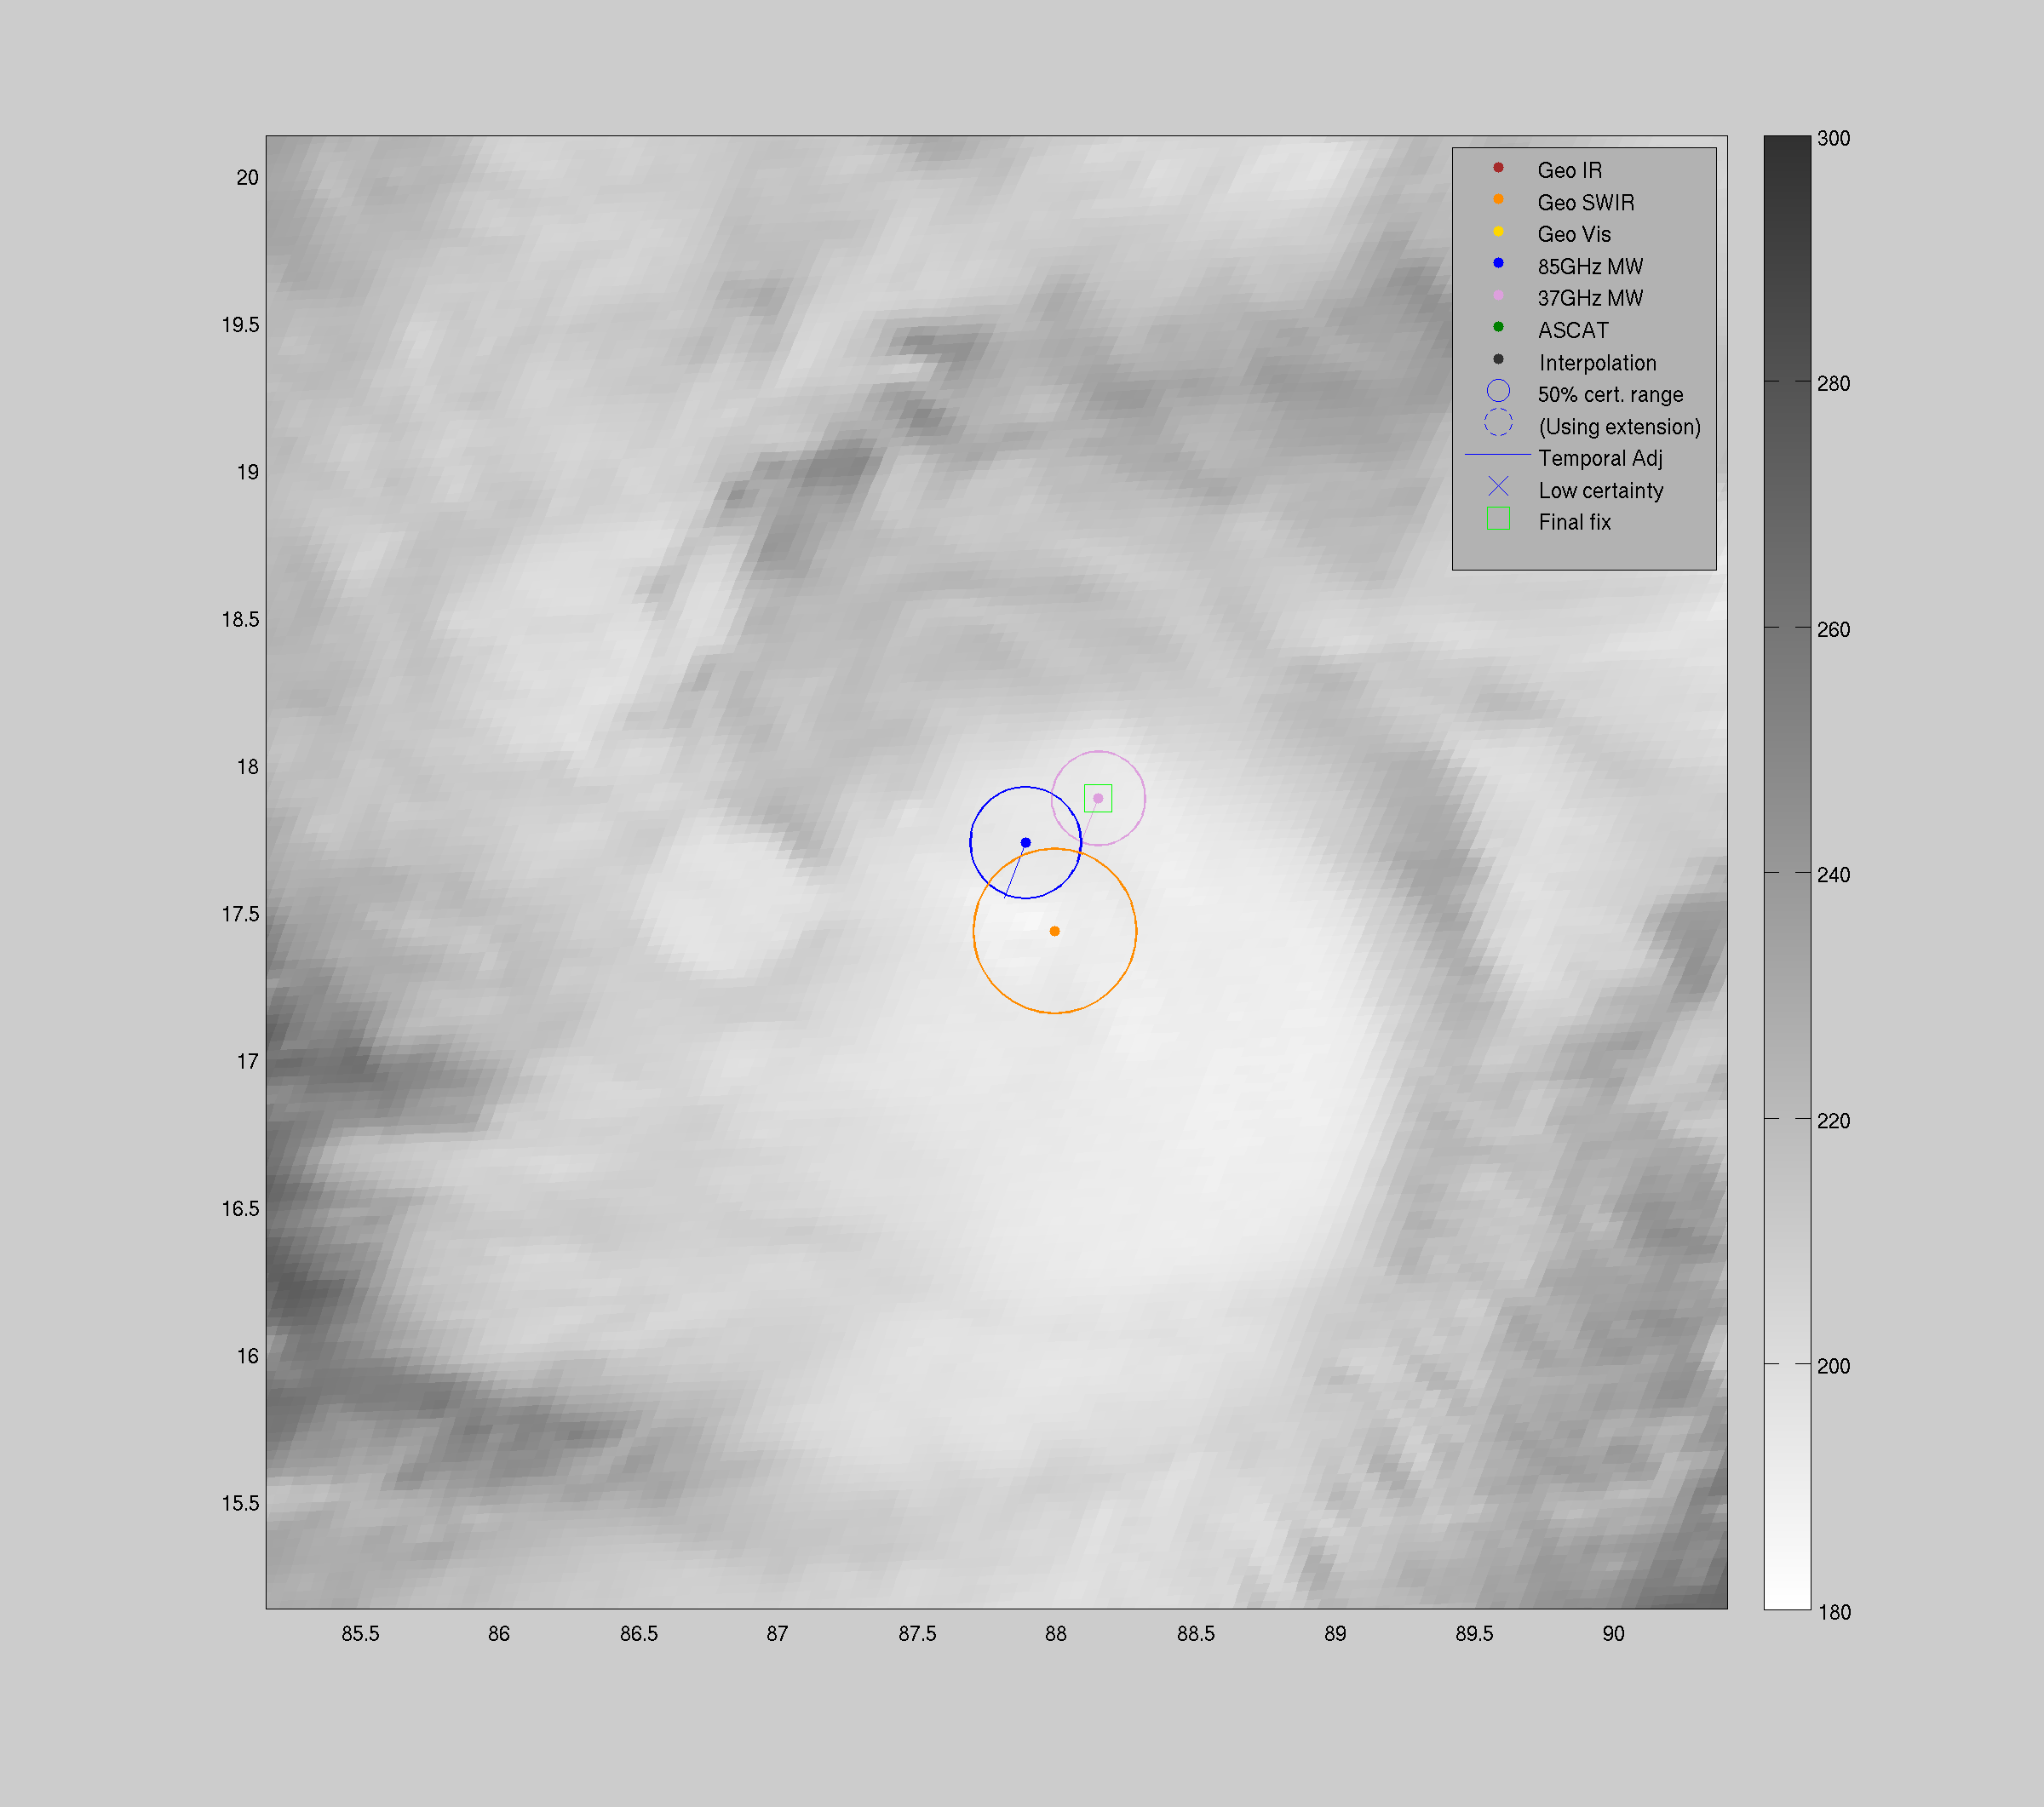
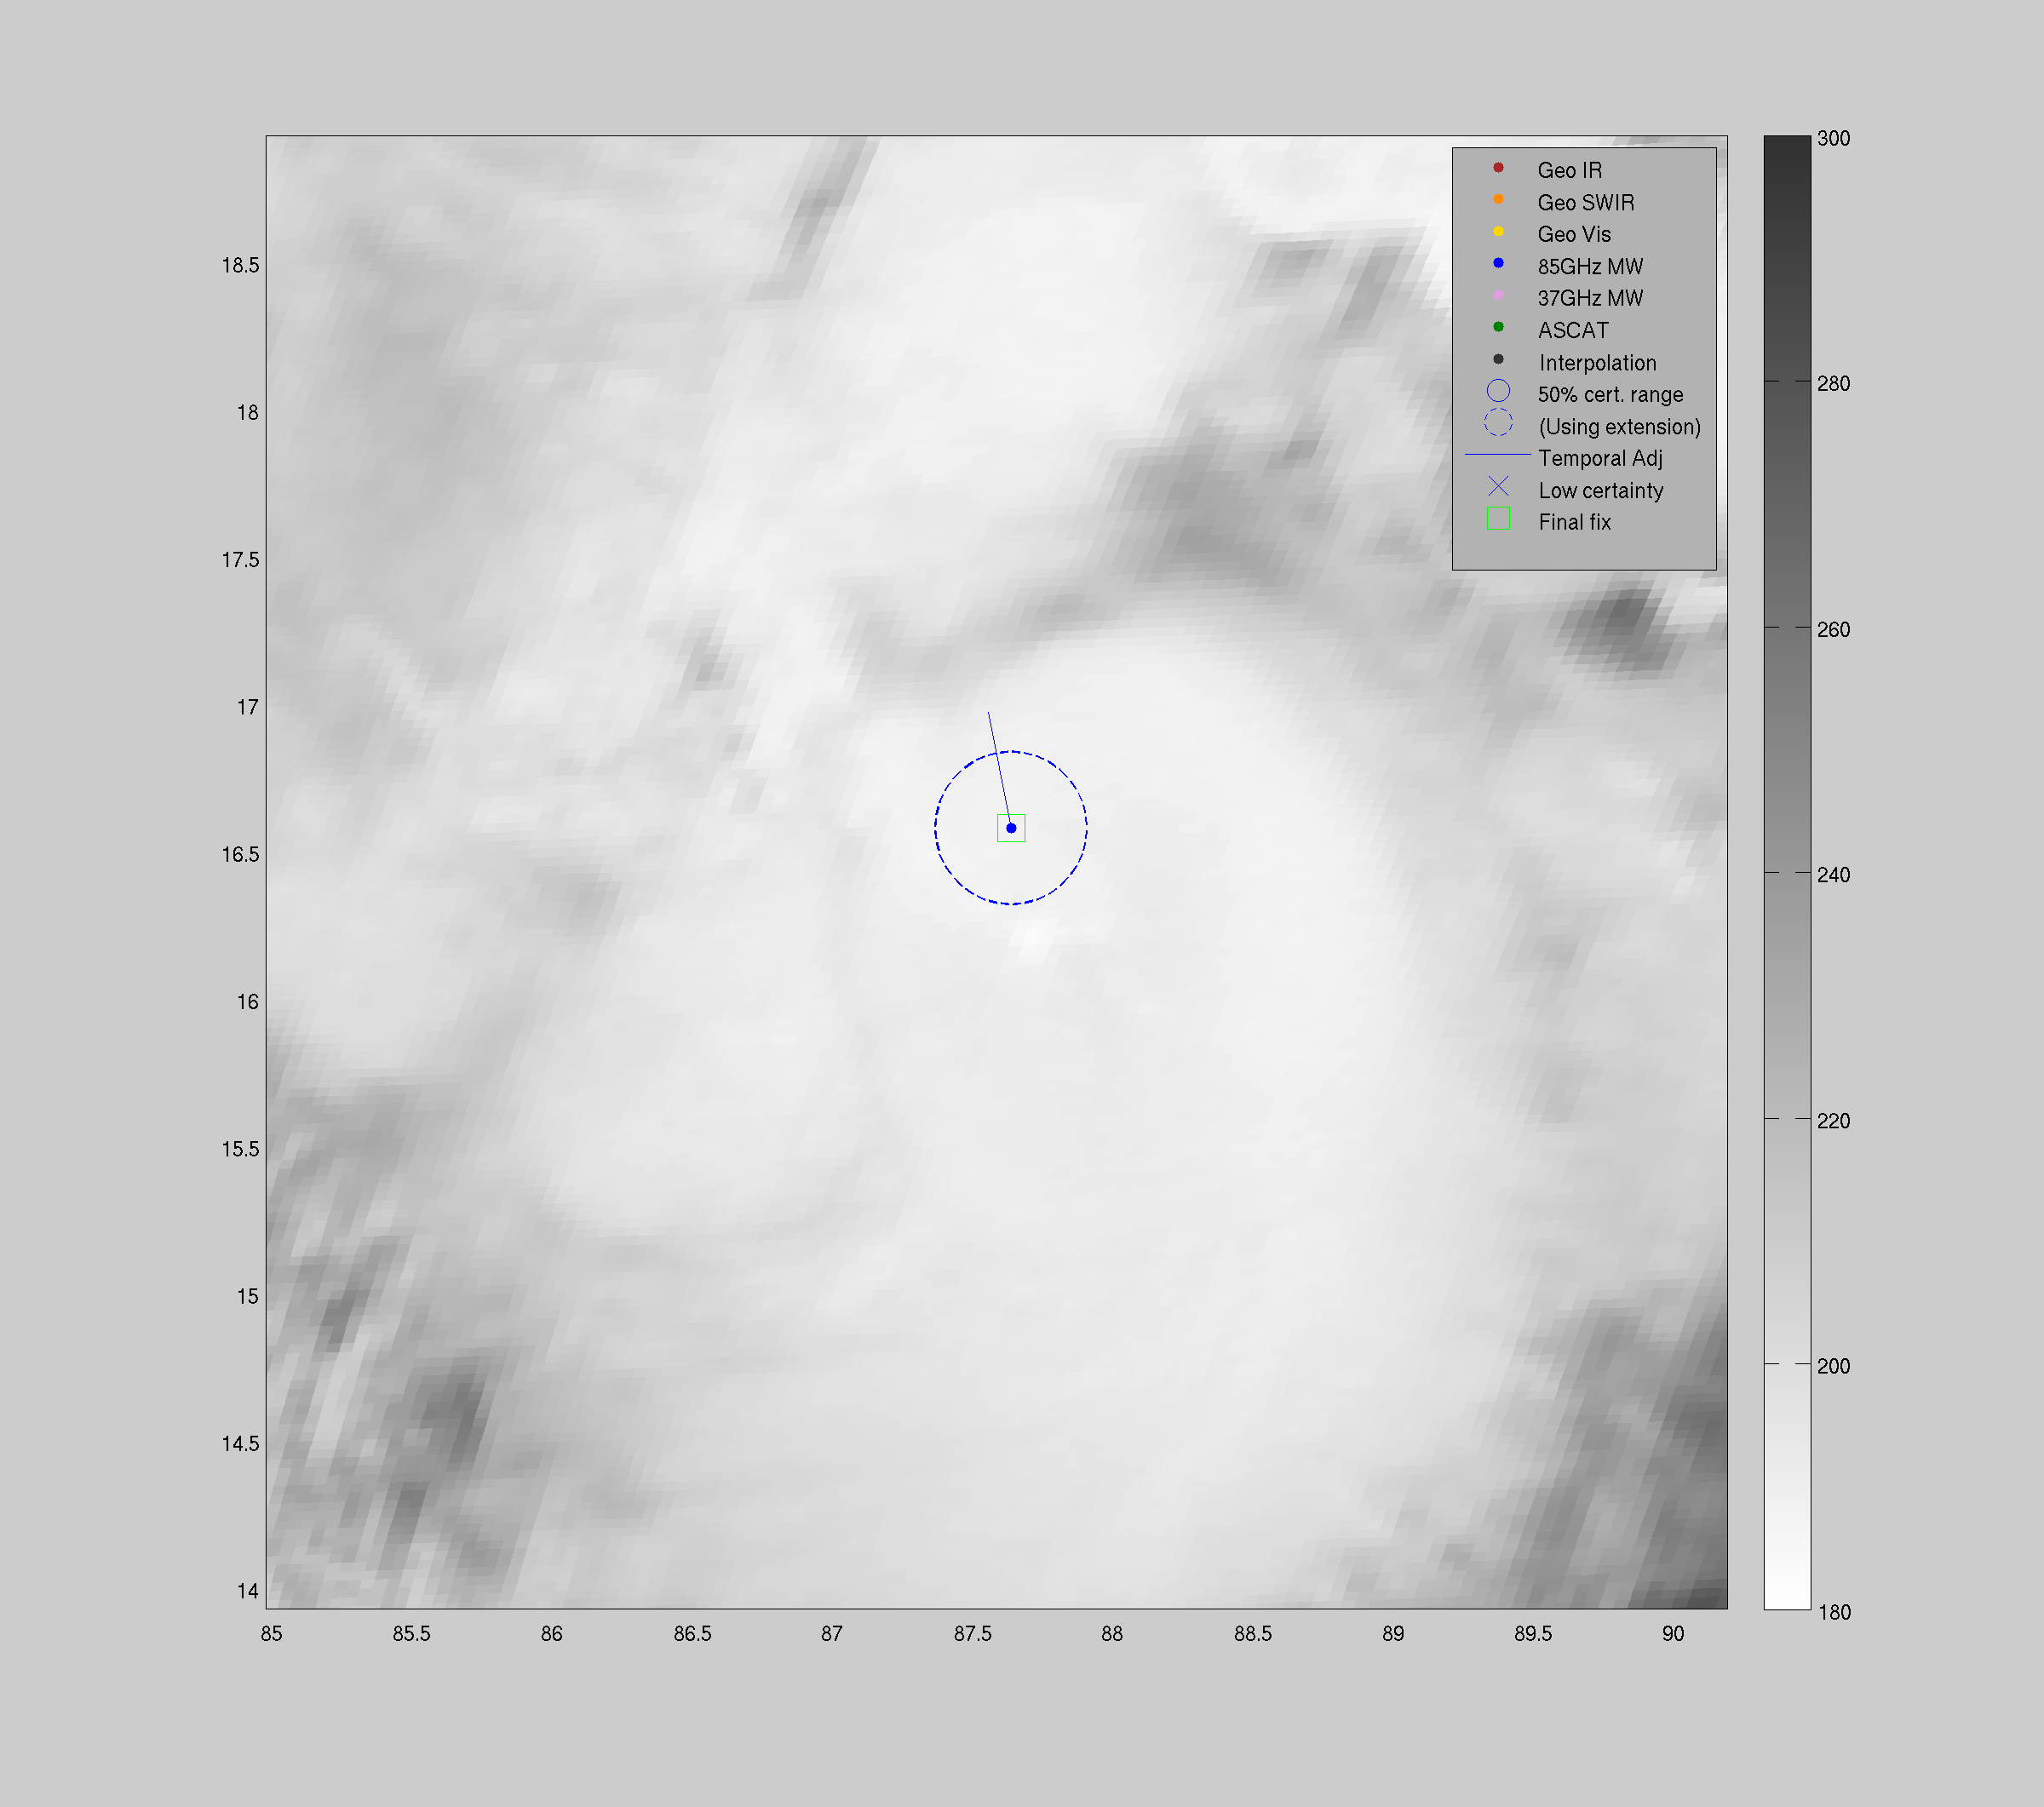
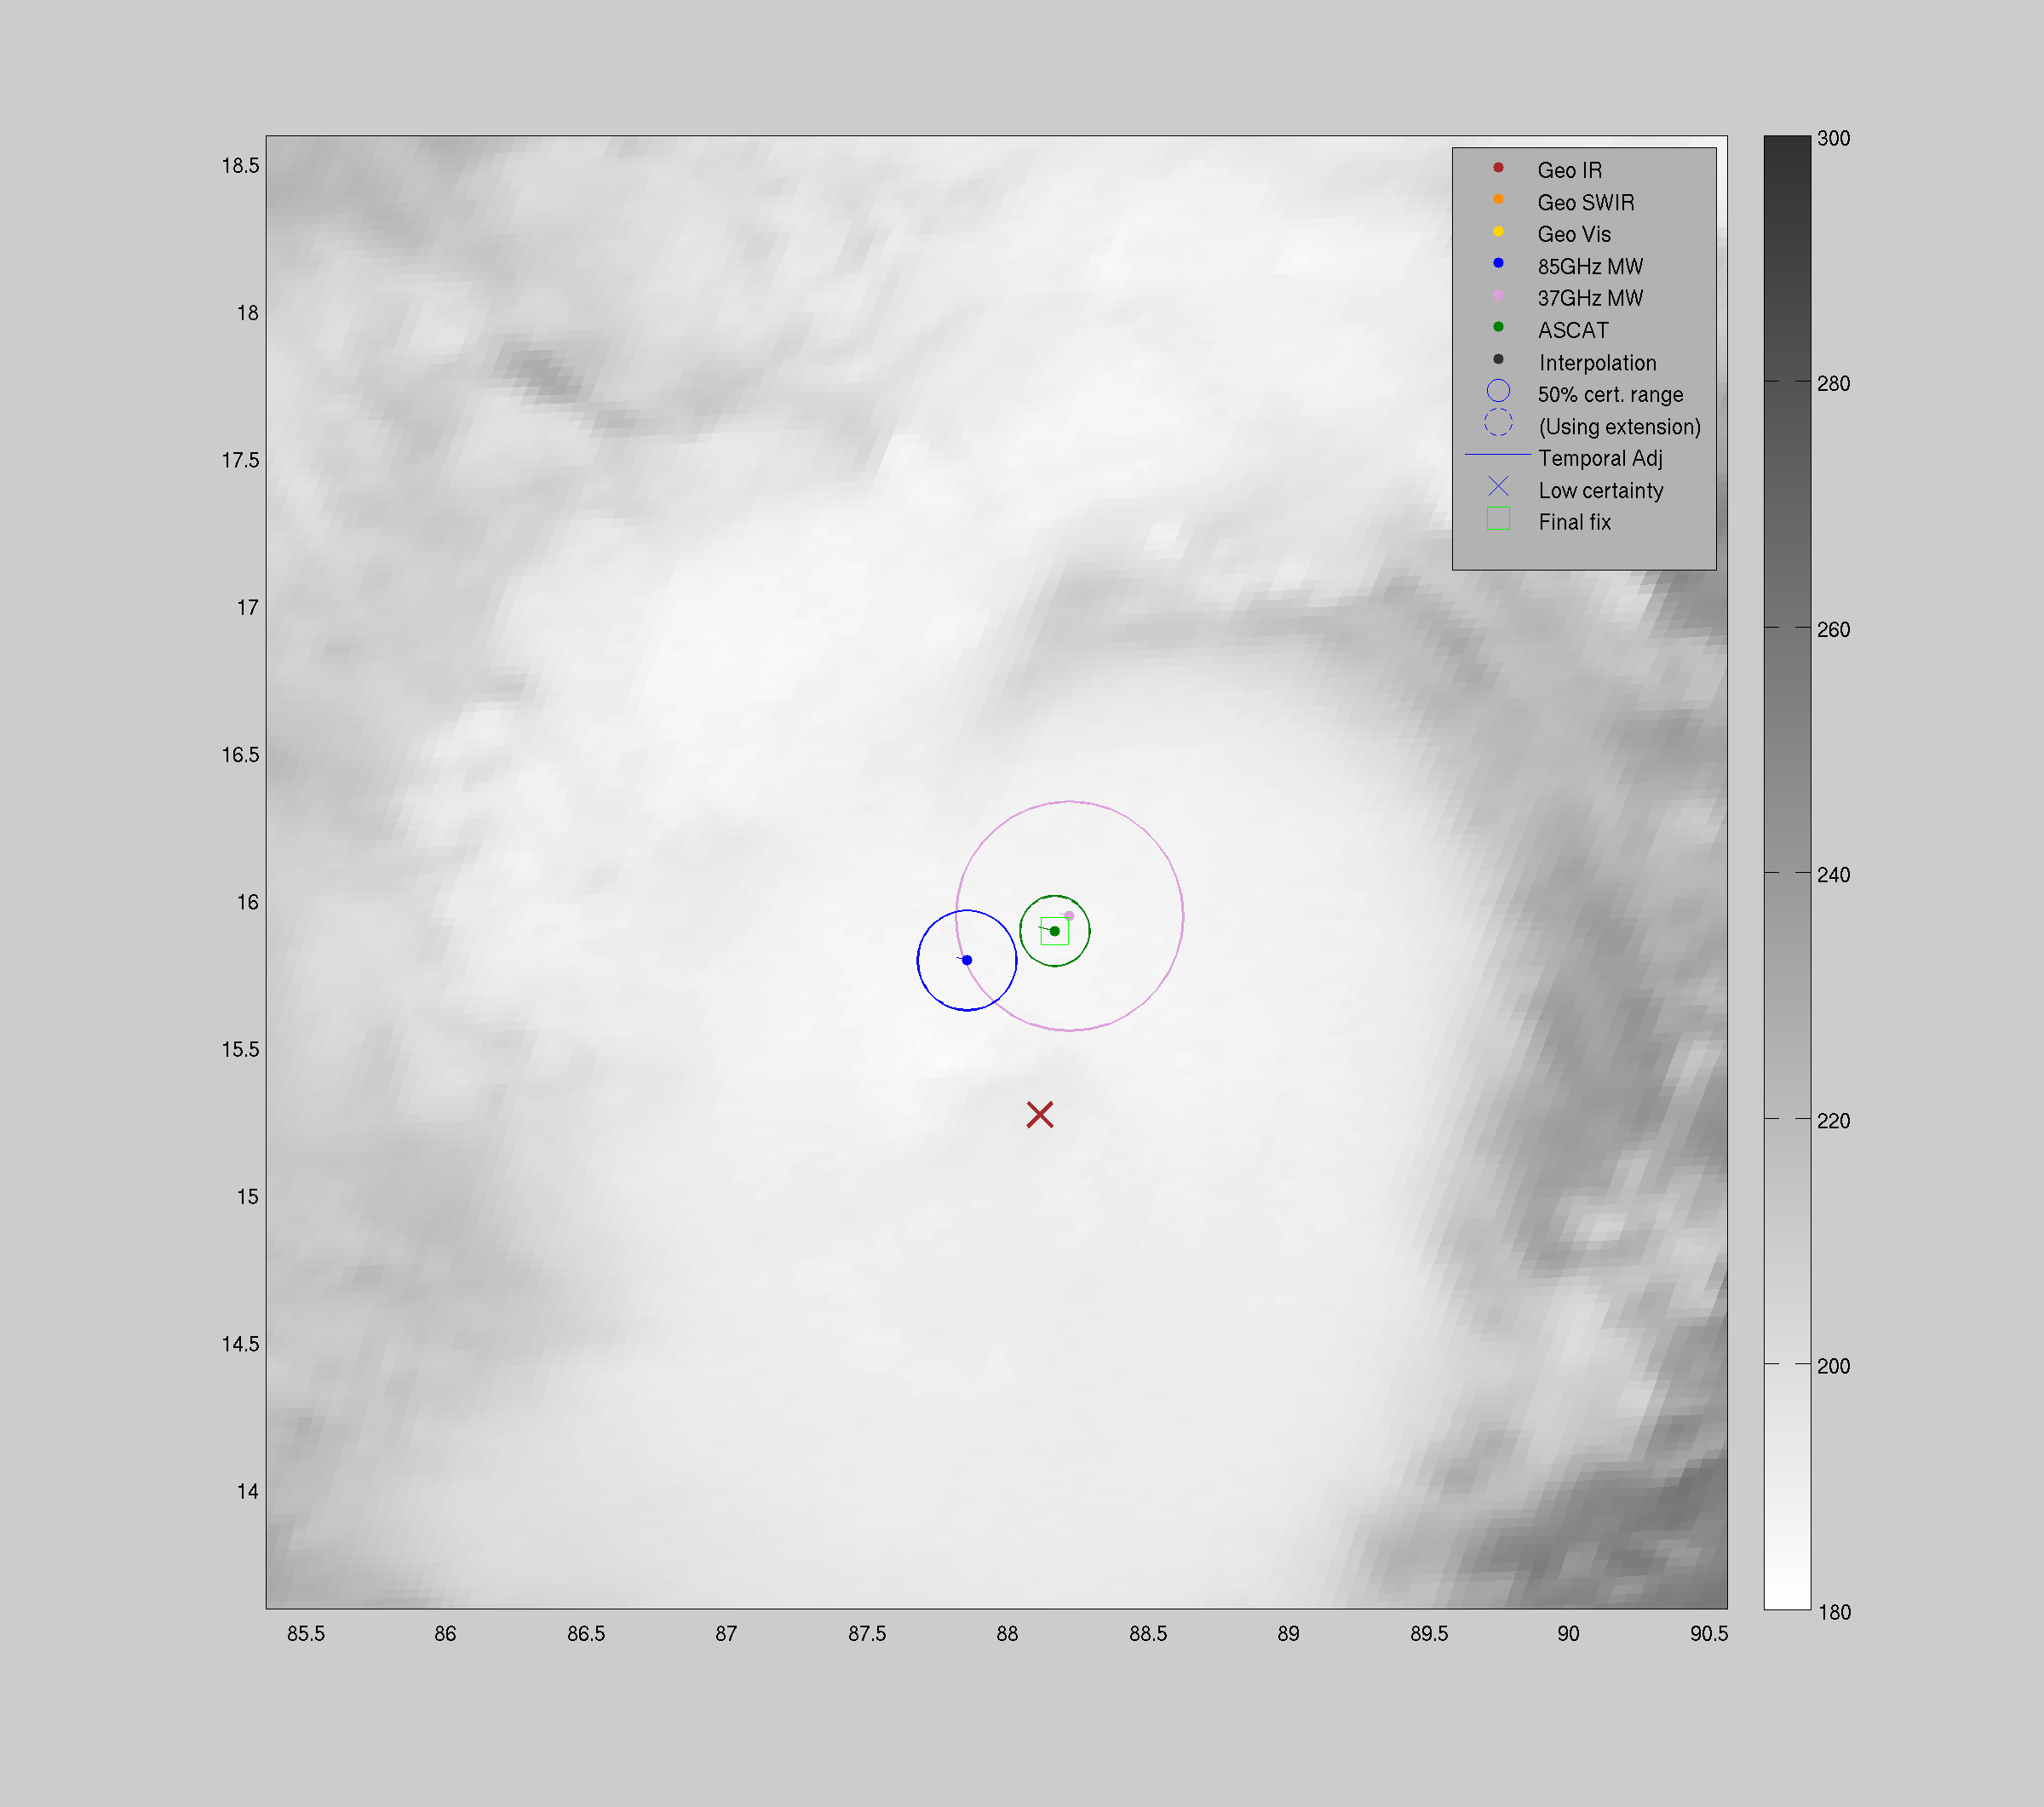
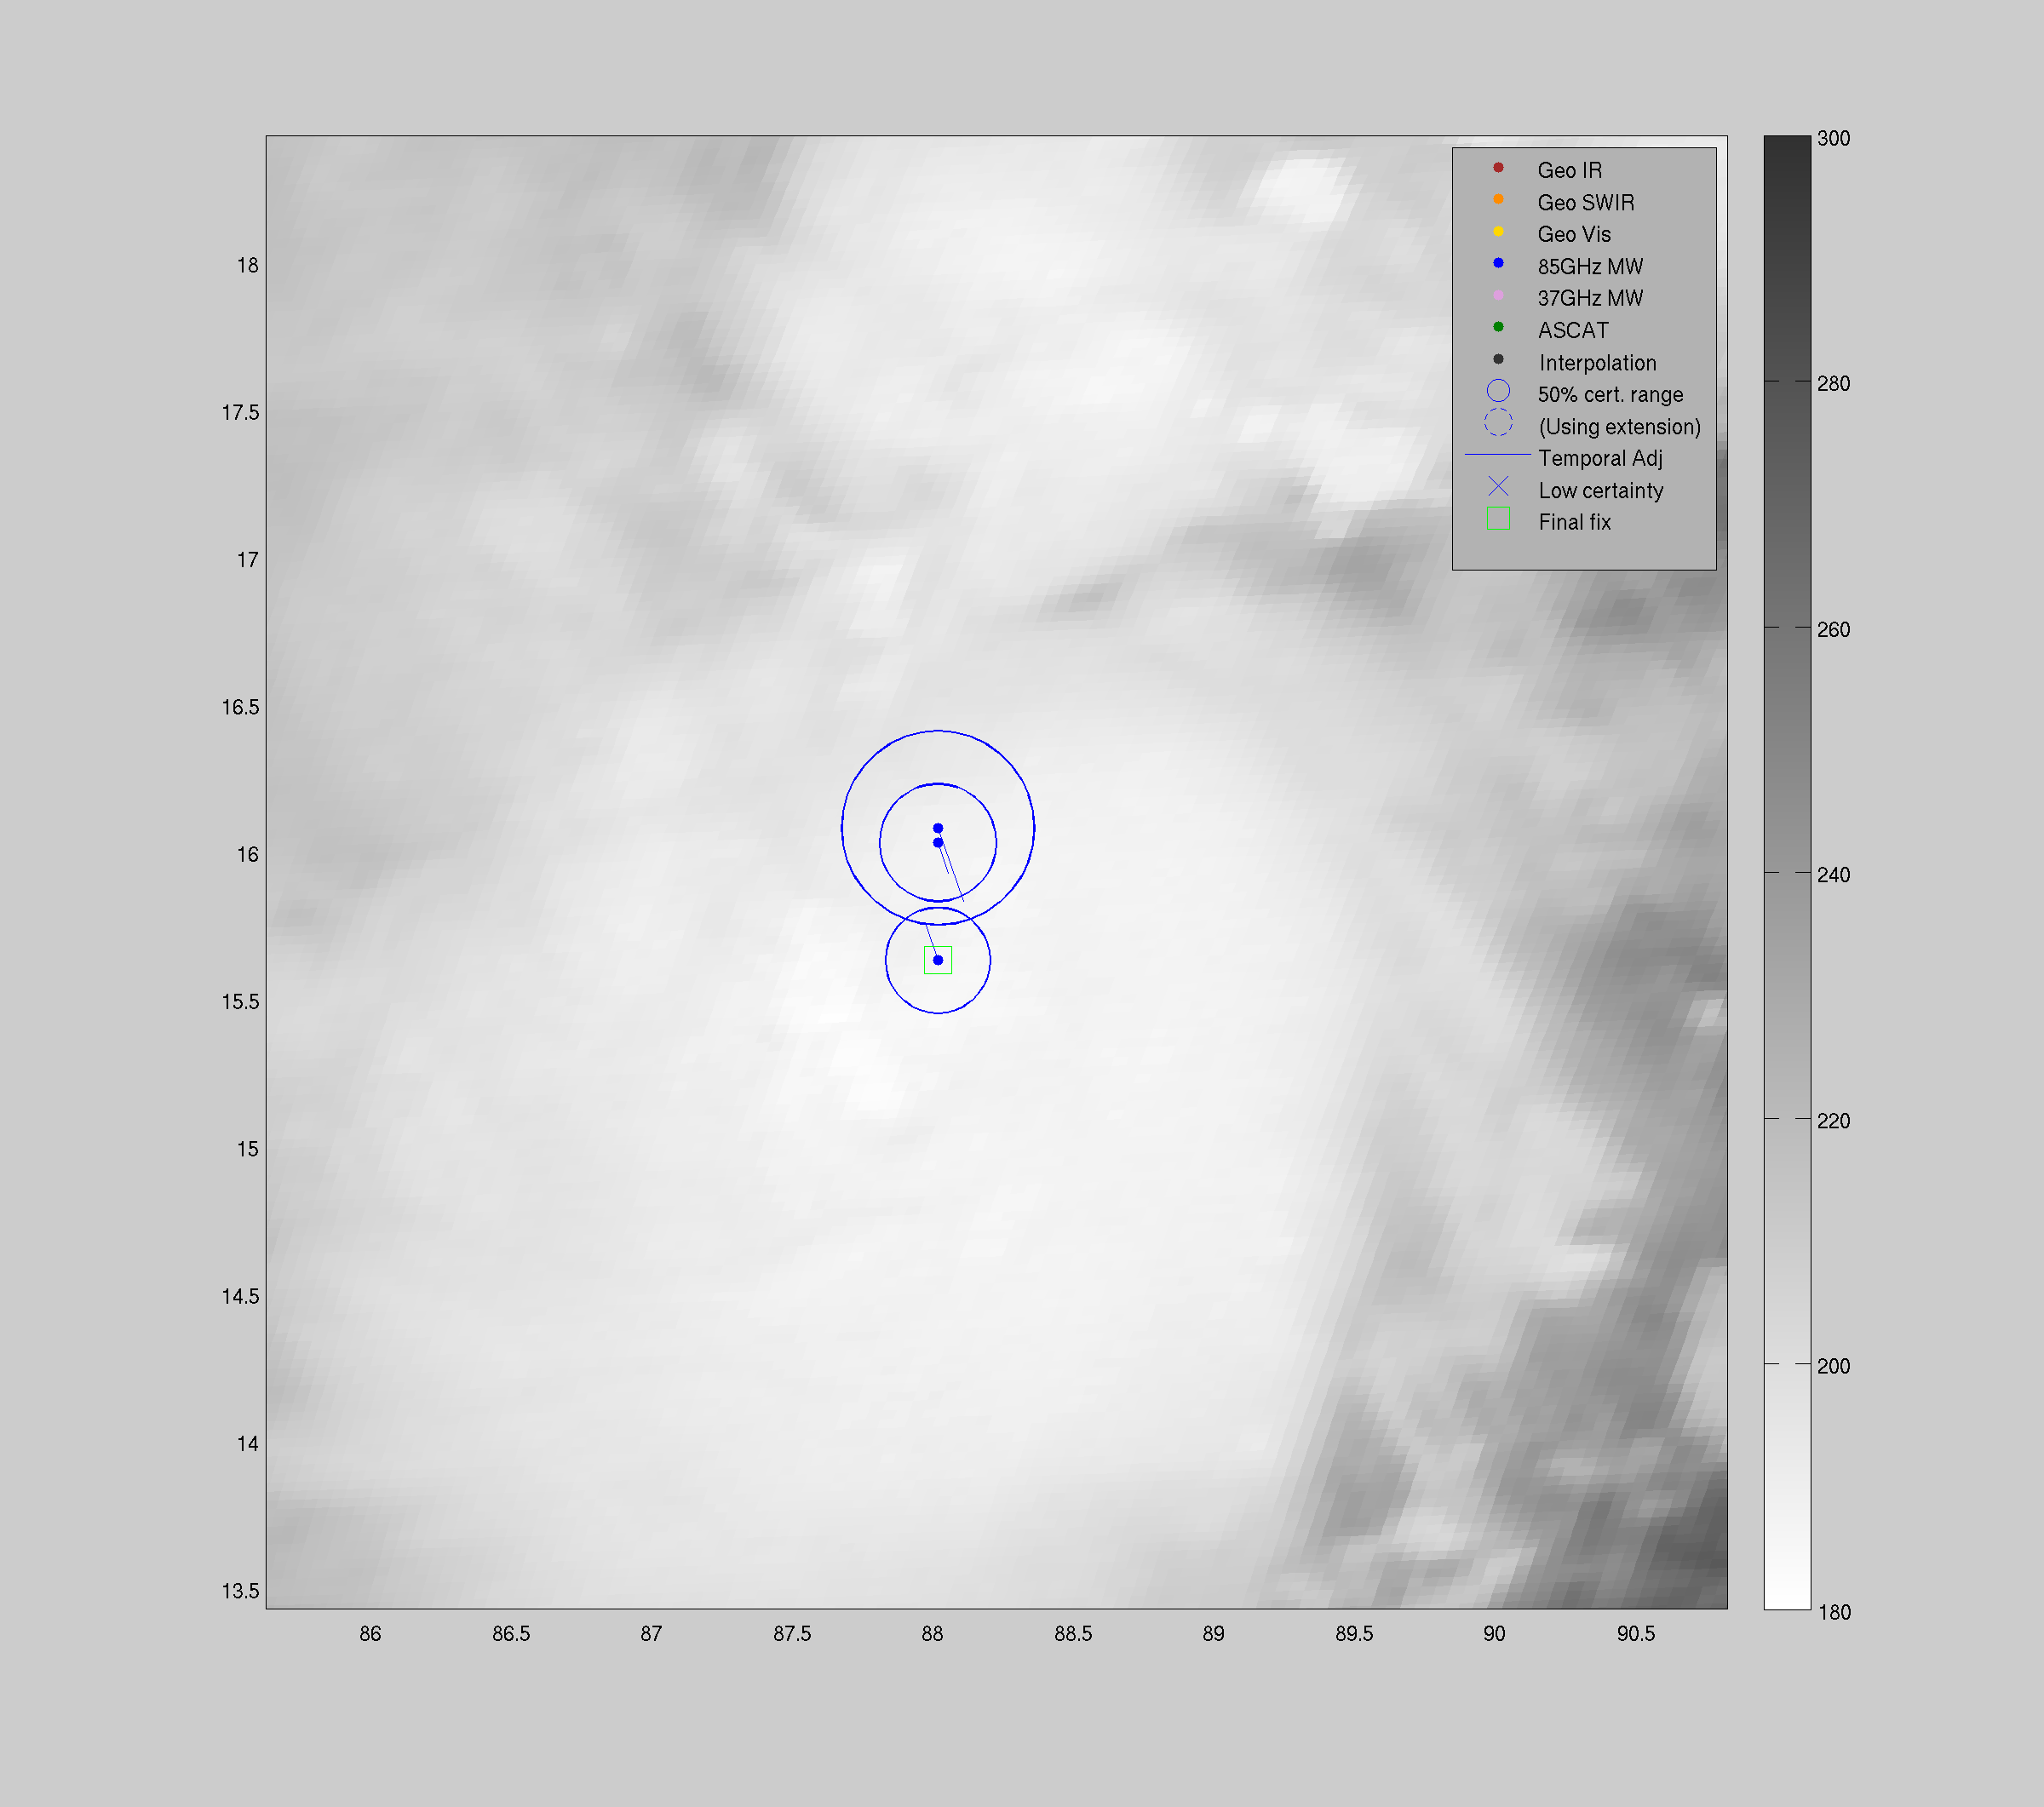
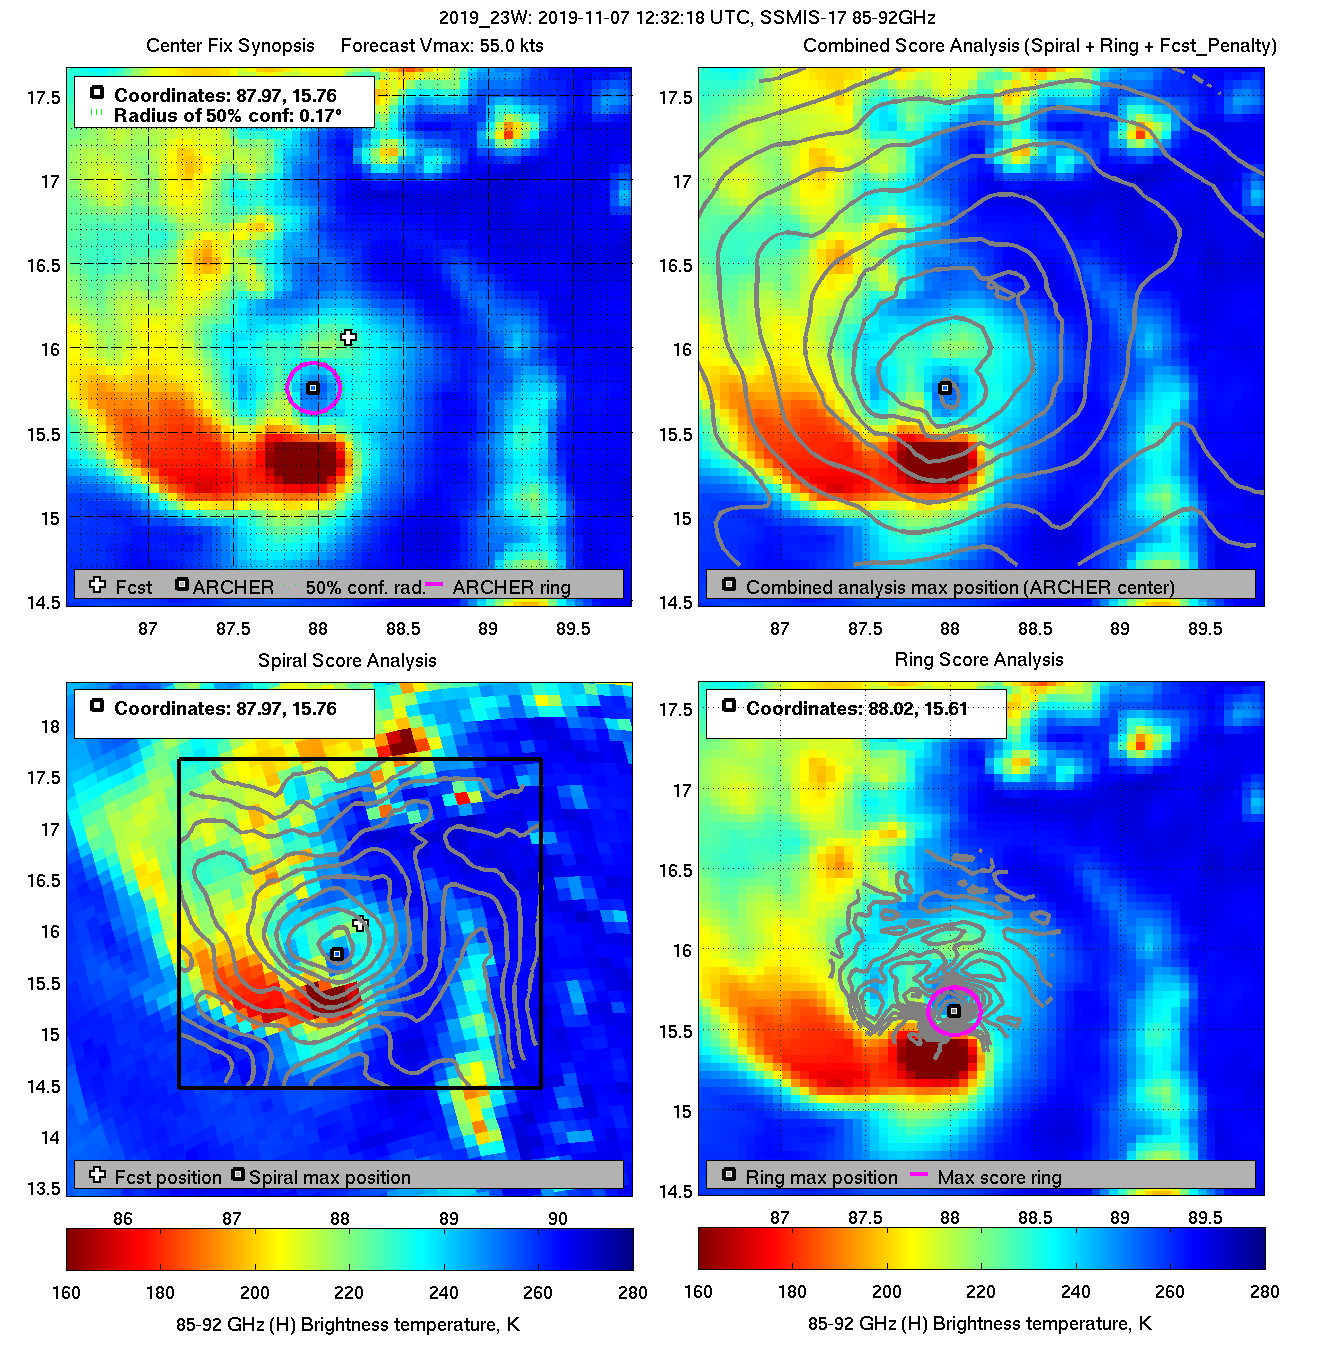
| 20191107 12:32:18 * |
SSMIS-17 |
85-92GHz |
55.0 |
15.76 |
87.97 |
15.70 |
88.06 |
0.17 |
0.49 |
0.30 |
75.1 |
| 20191107 10:49:40 * |
SSMIS-18 |
85-92GHz |
55.0 |
15.93 |
88.05 |
16.01 |
88.00 |
0.20 |
0.56 |
1.00 |
64.9 |
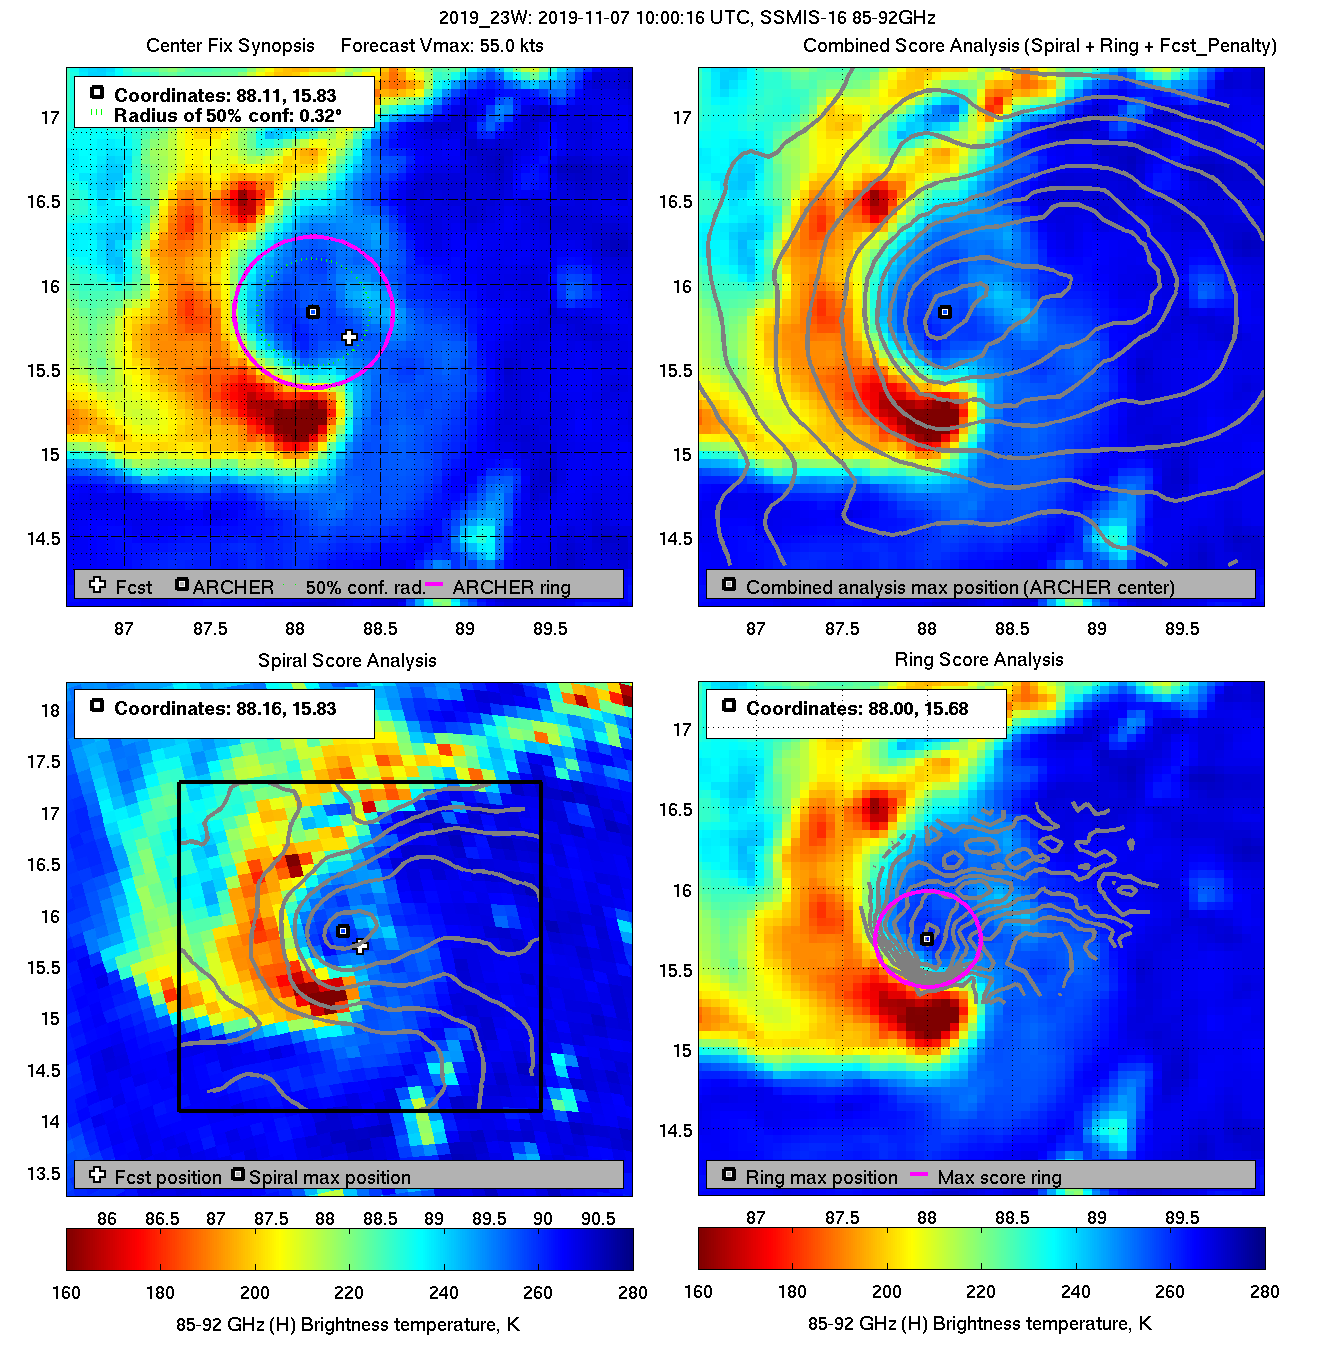
| 20191107 10:00:16 |
SSMIS-16 |
85-92GHz |
55.0 |
15.83 |
88.11 |
16.05 |
88.00 |
0.32 |
0.89 |
0.90 |
35.3 |
|
|
|
 |
 |
|
|
|
 |
 |
|
|
|
 |
 |
|
|
|
 |
 |
|
|
|
 |
 |
|
|
|
 |
 |
|
|
|
 |
 |
|
|
|
 |
 |
|
|
|
 |
 |
|
|
|
 |
 |
|
|
|
 |
 |
|
|
|
 |
 |
|
|
|
 |
 |
|
|
|
 |
 |
|
|
|
 |
 |
|
|
|
 |
 |
|
|
|
 |
 |
|
|
|
 |
 |
|
|
|
 |
 |
|
|
|
 |
 |
|
|
|
 |
 |
|
|
|
 |
 |
|
|
|
 |
 |
|
|
|
 |
 |
|
|
|
 |
 |
|
|
|
 |
 |
|
|
|
 |
 |
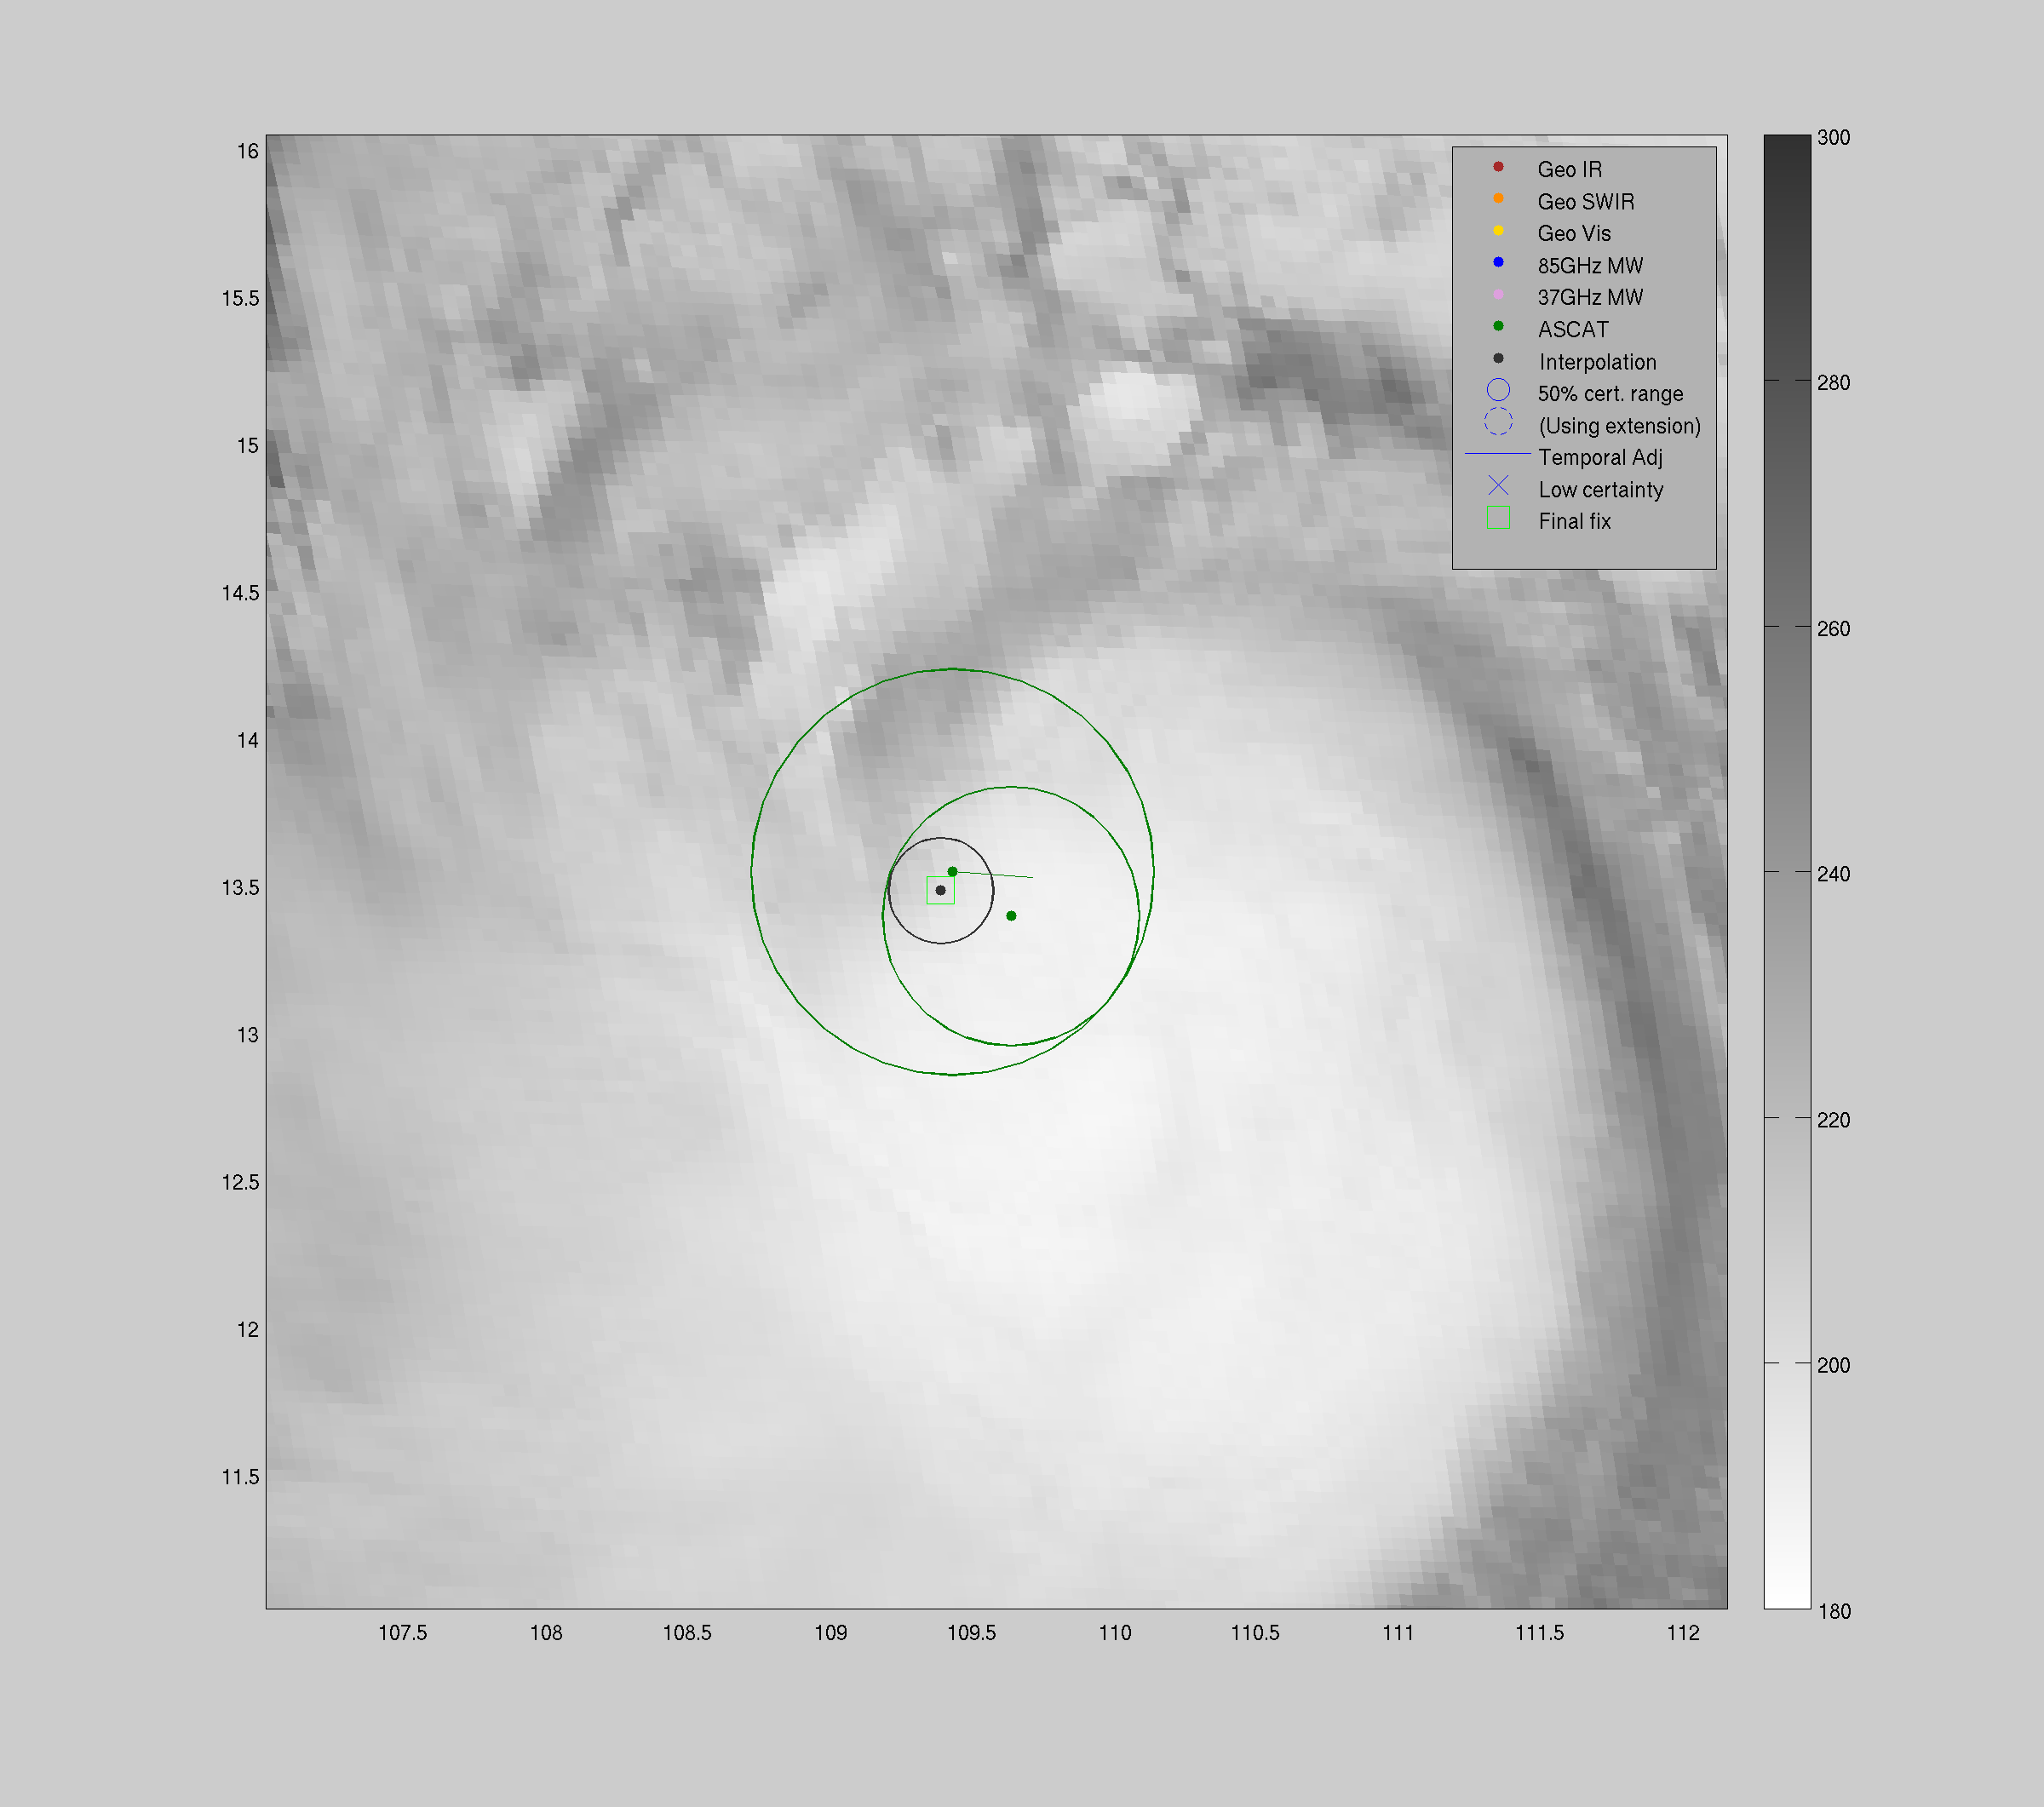
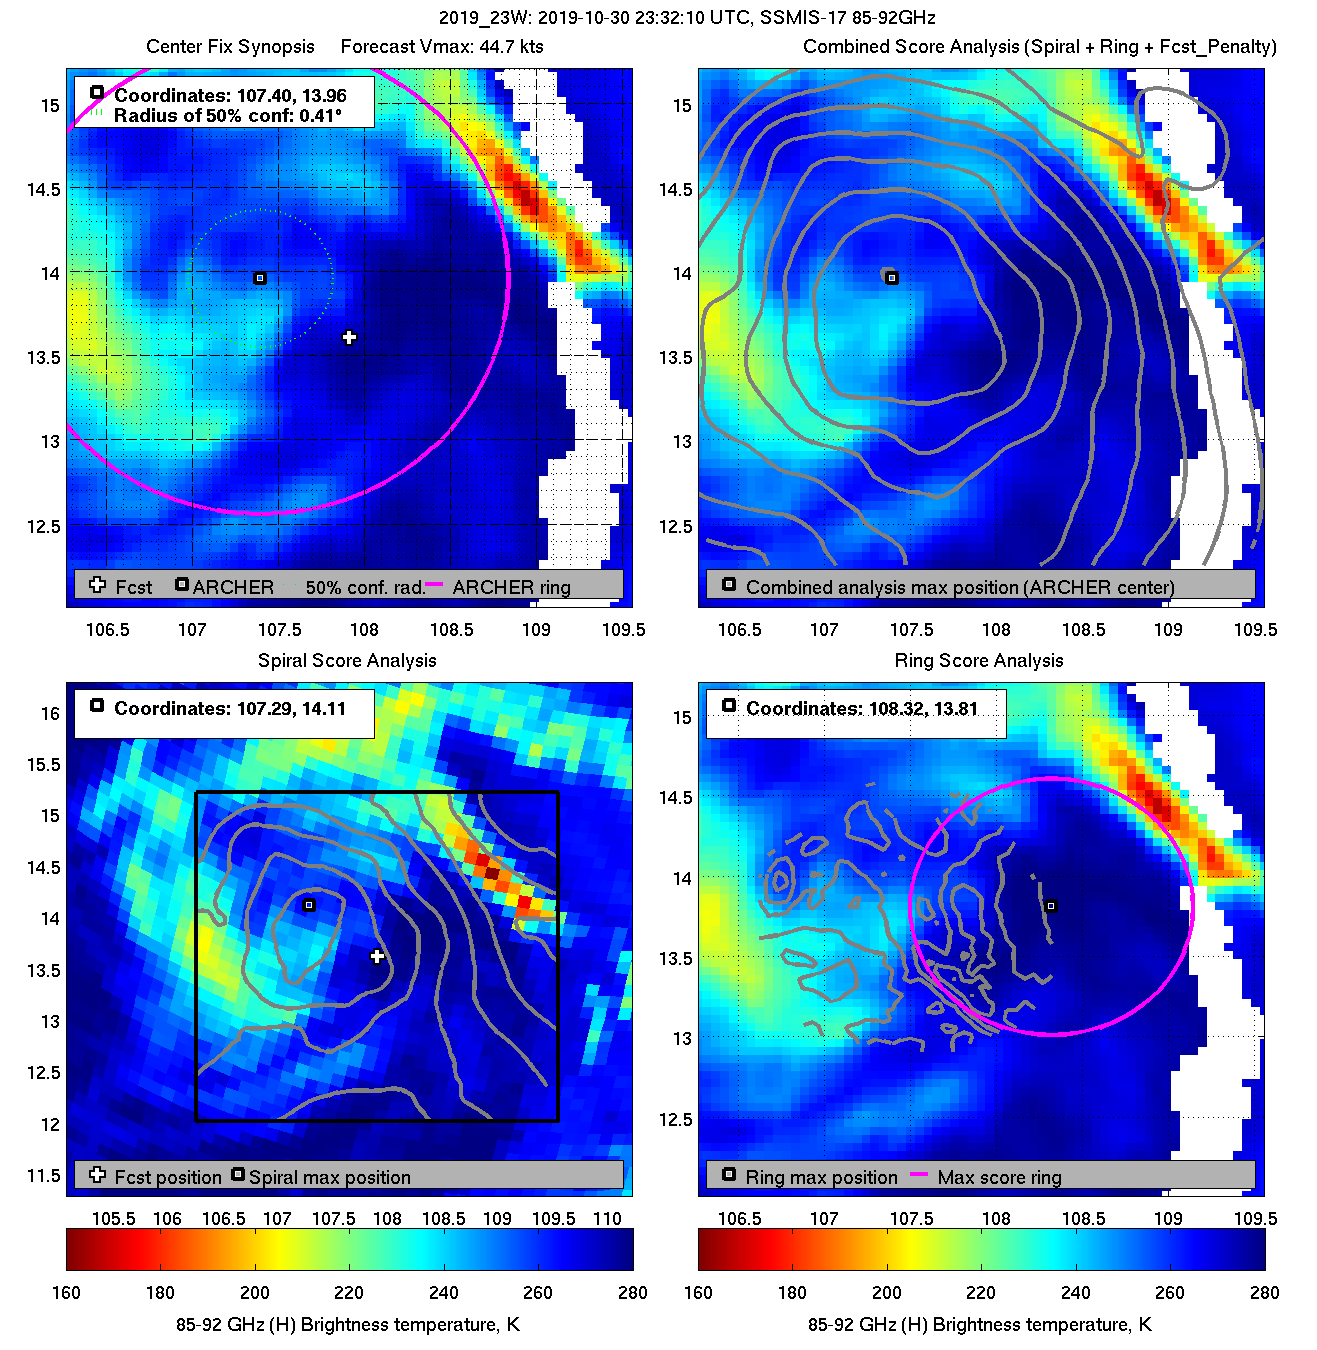
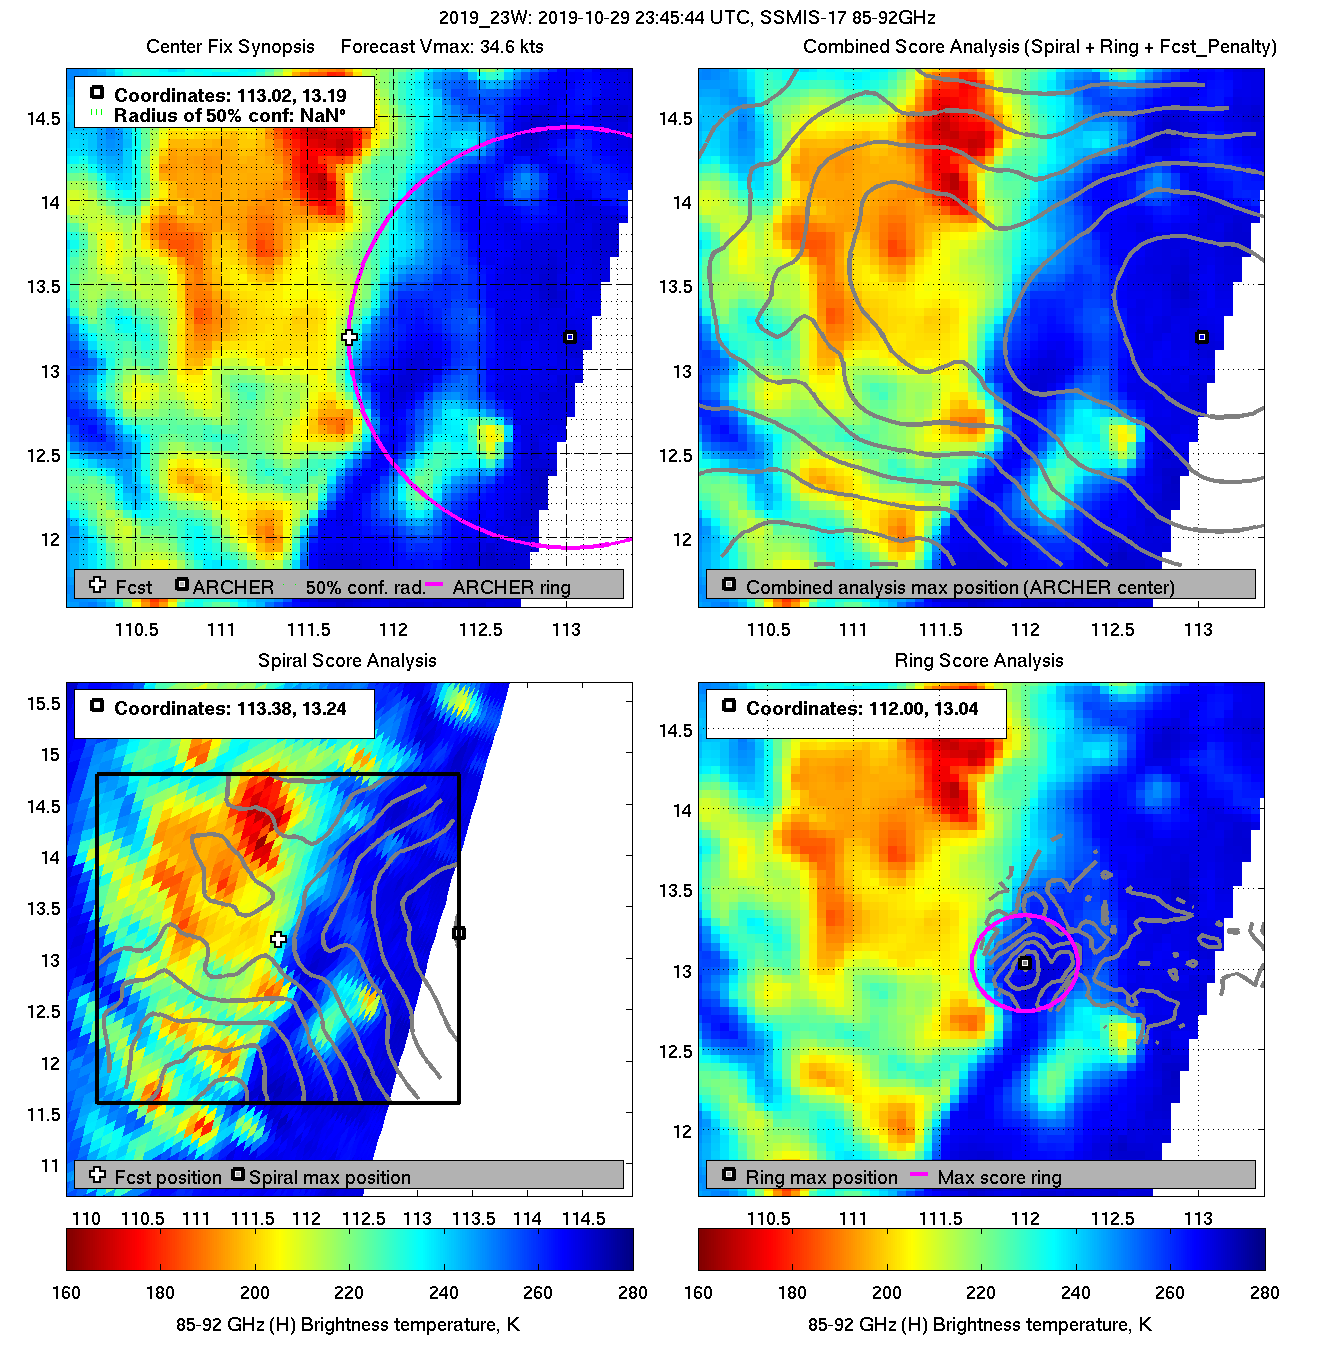
| 20191030 23:32:10 |
SSMIS-17 |
85-92GHz |
44.7 |
13.96 |
107.40 |
13.96 |
107.40 |
0.42 |
1.18 |
2.80 |
4.3 |
|
|
|
 |
 |
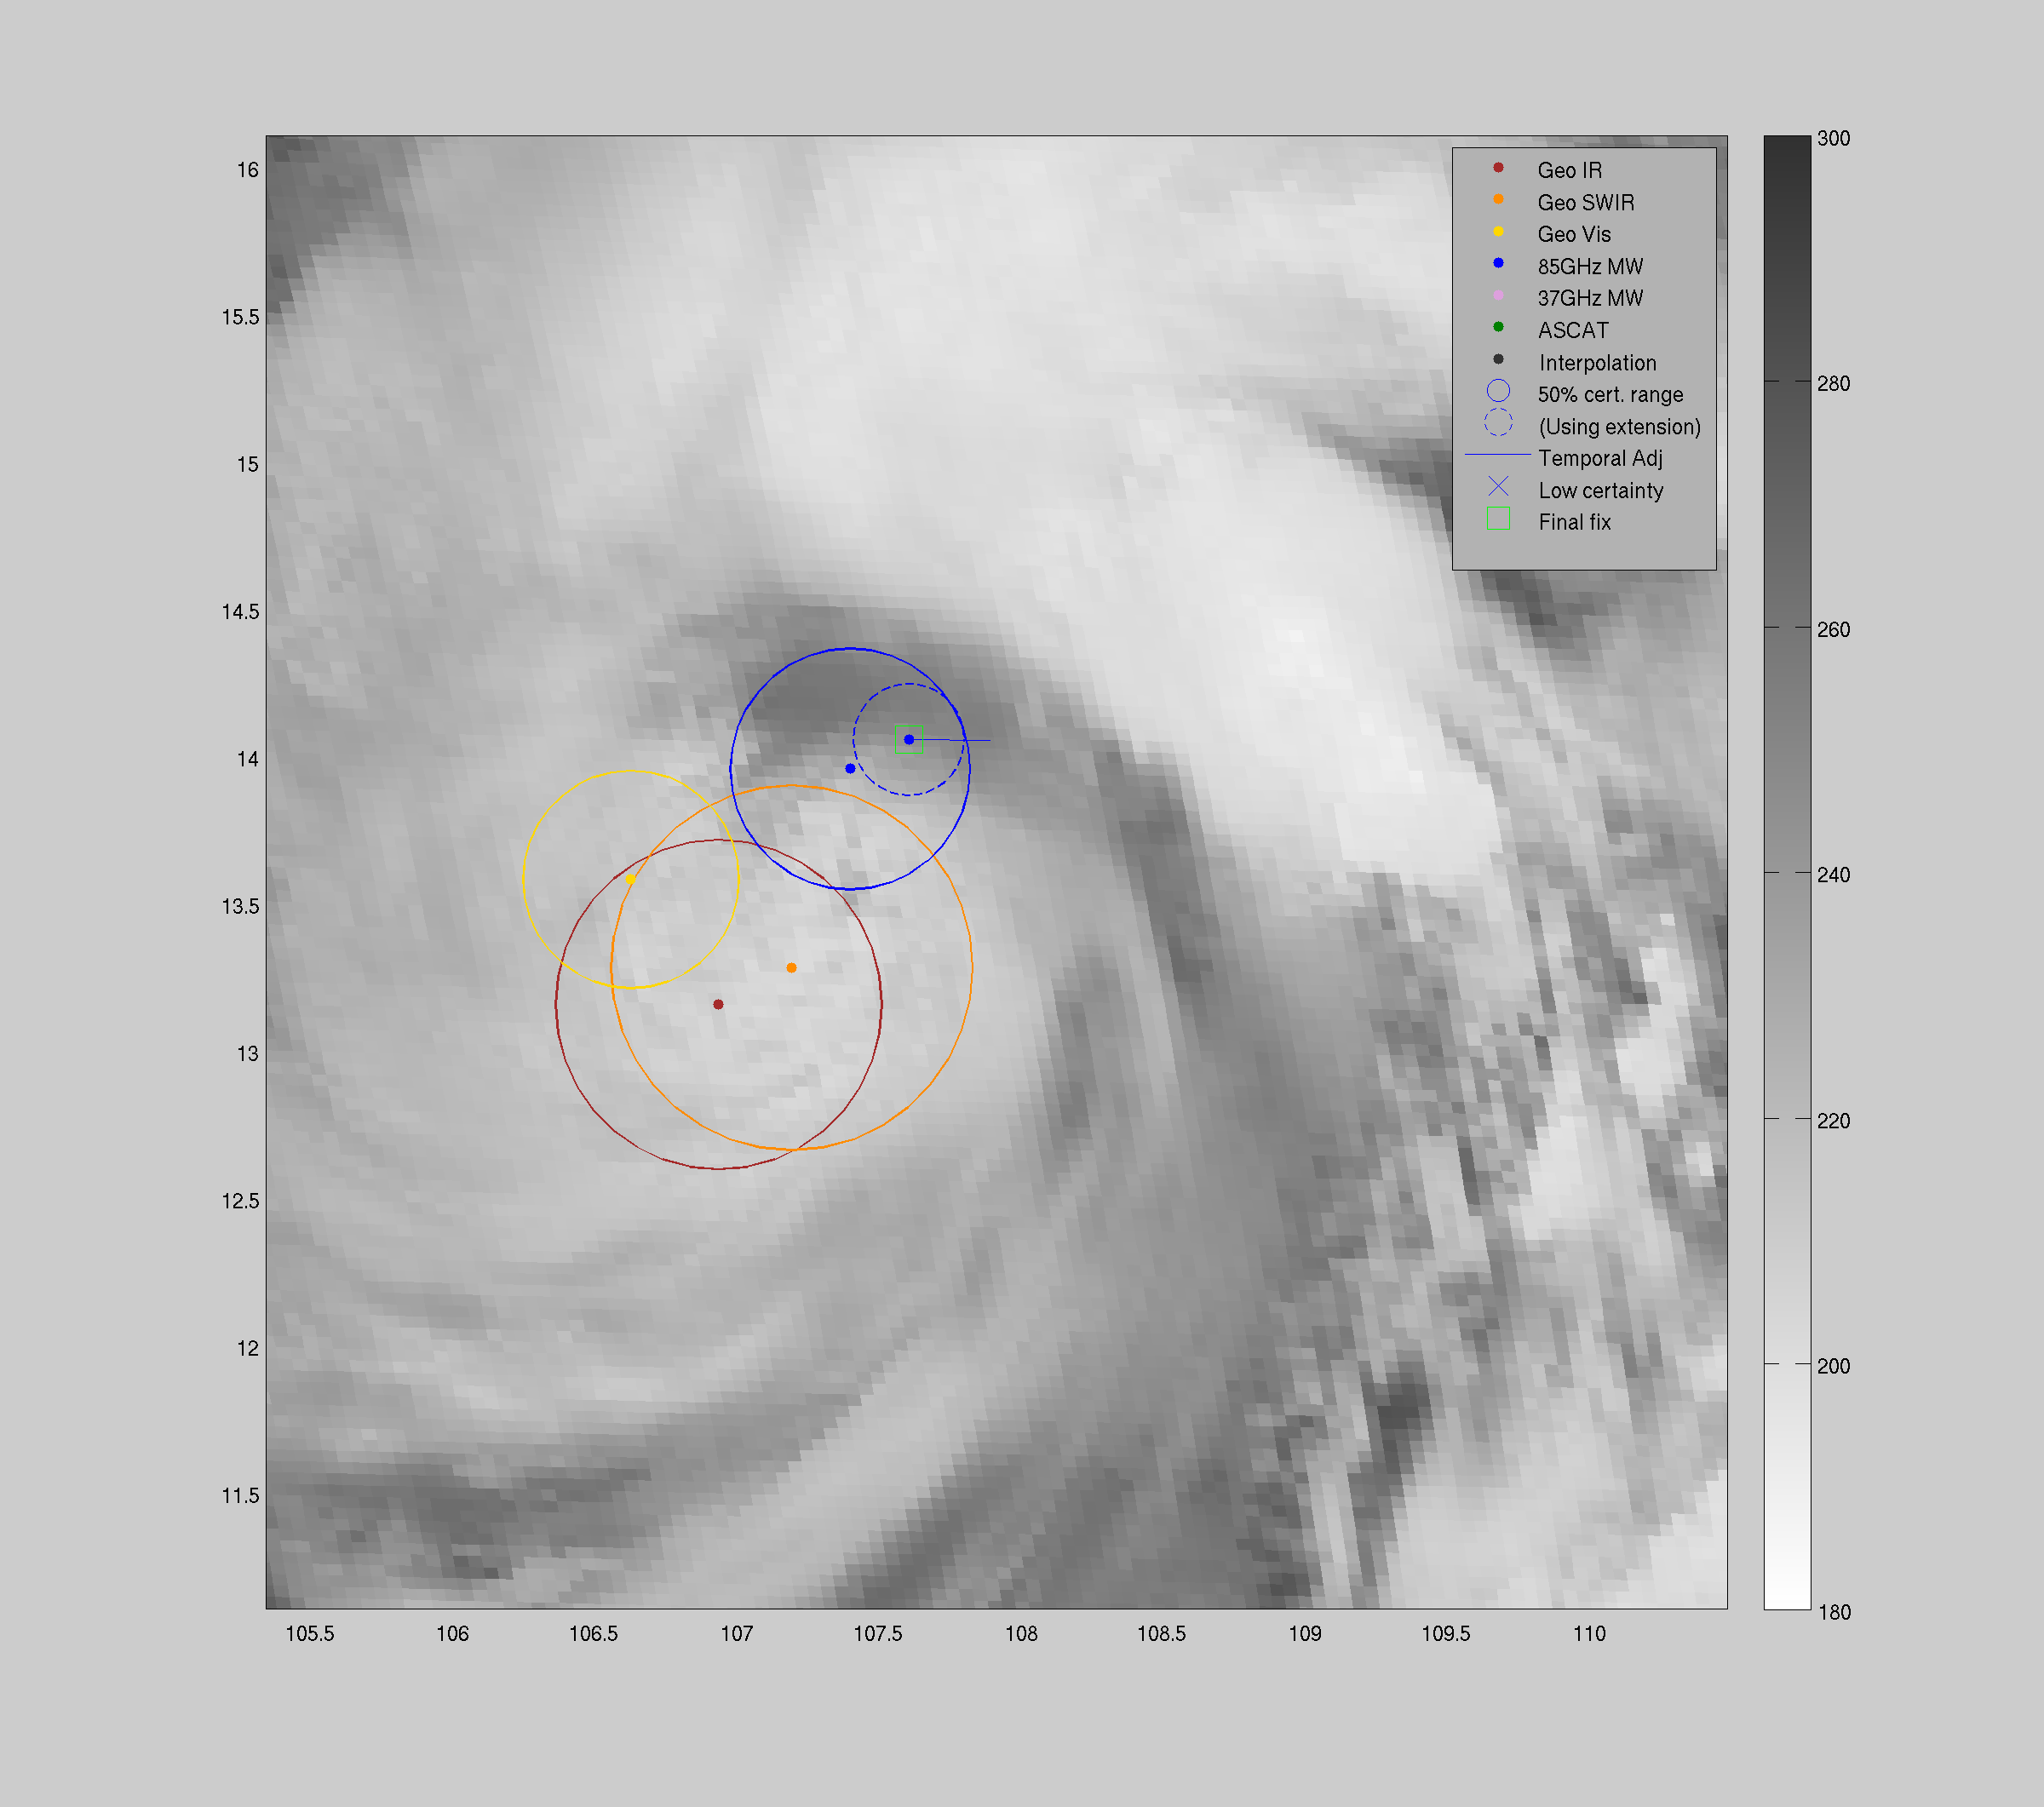
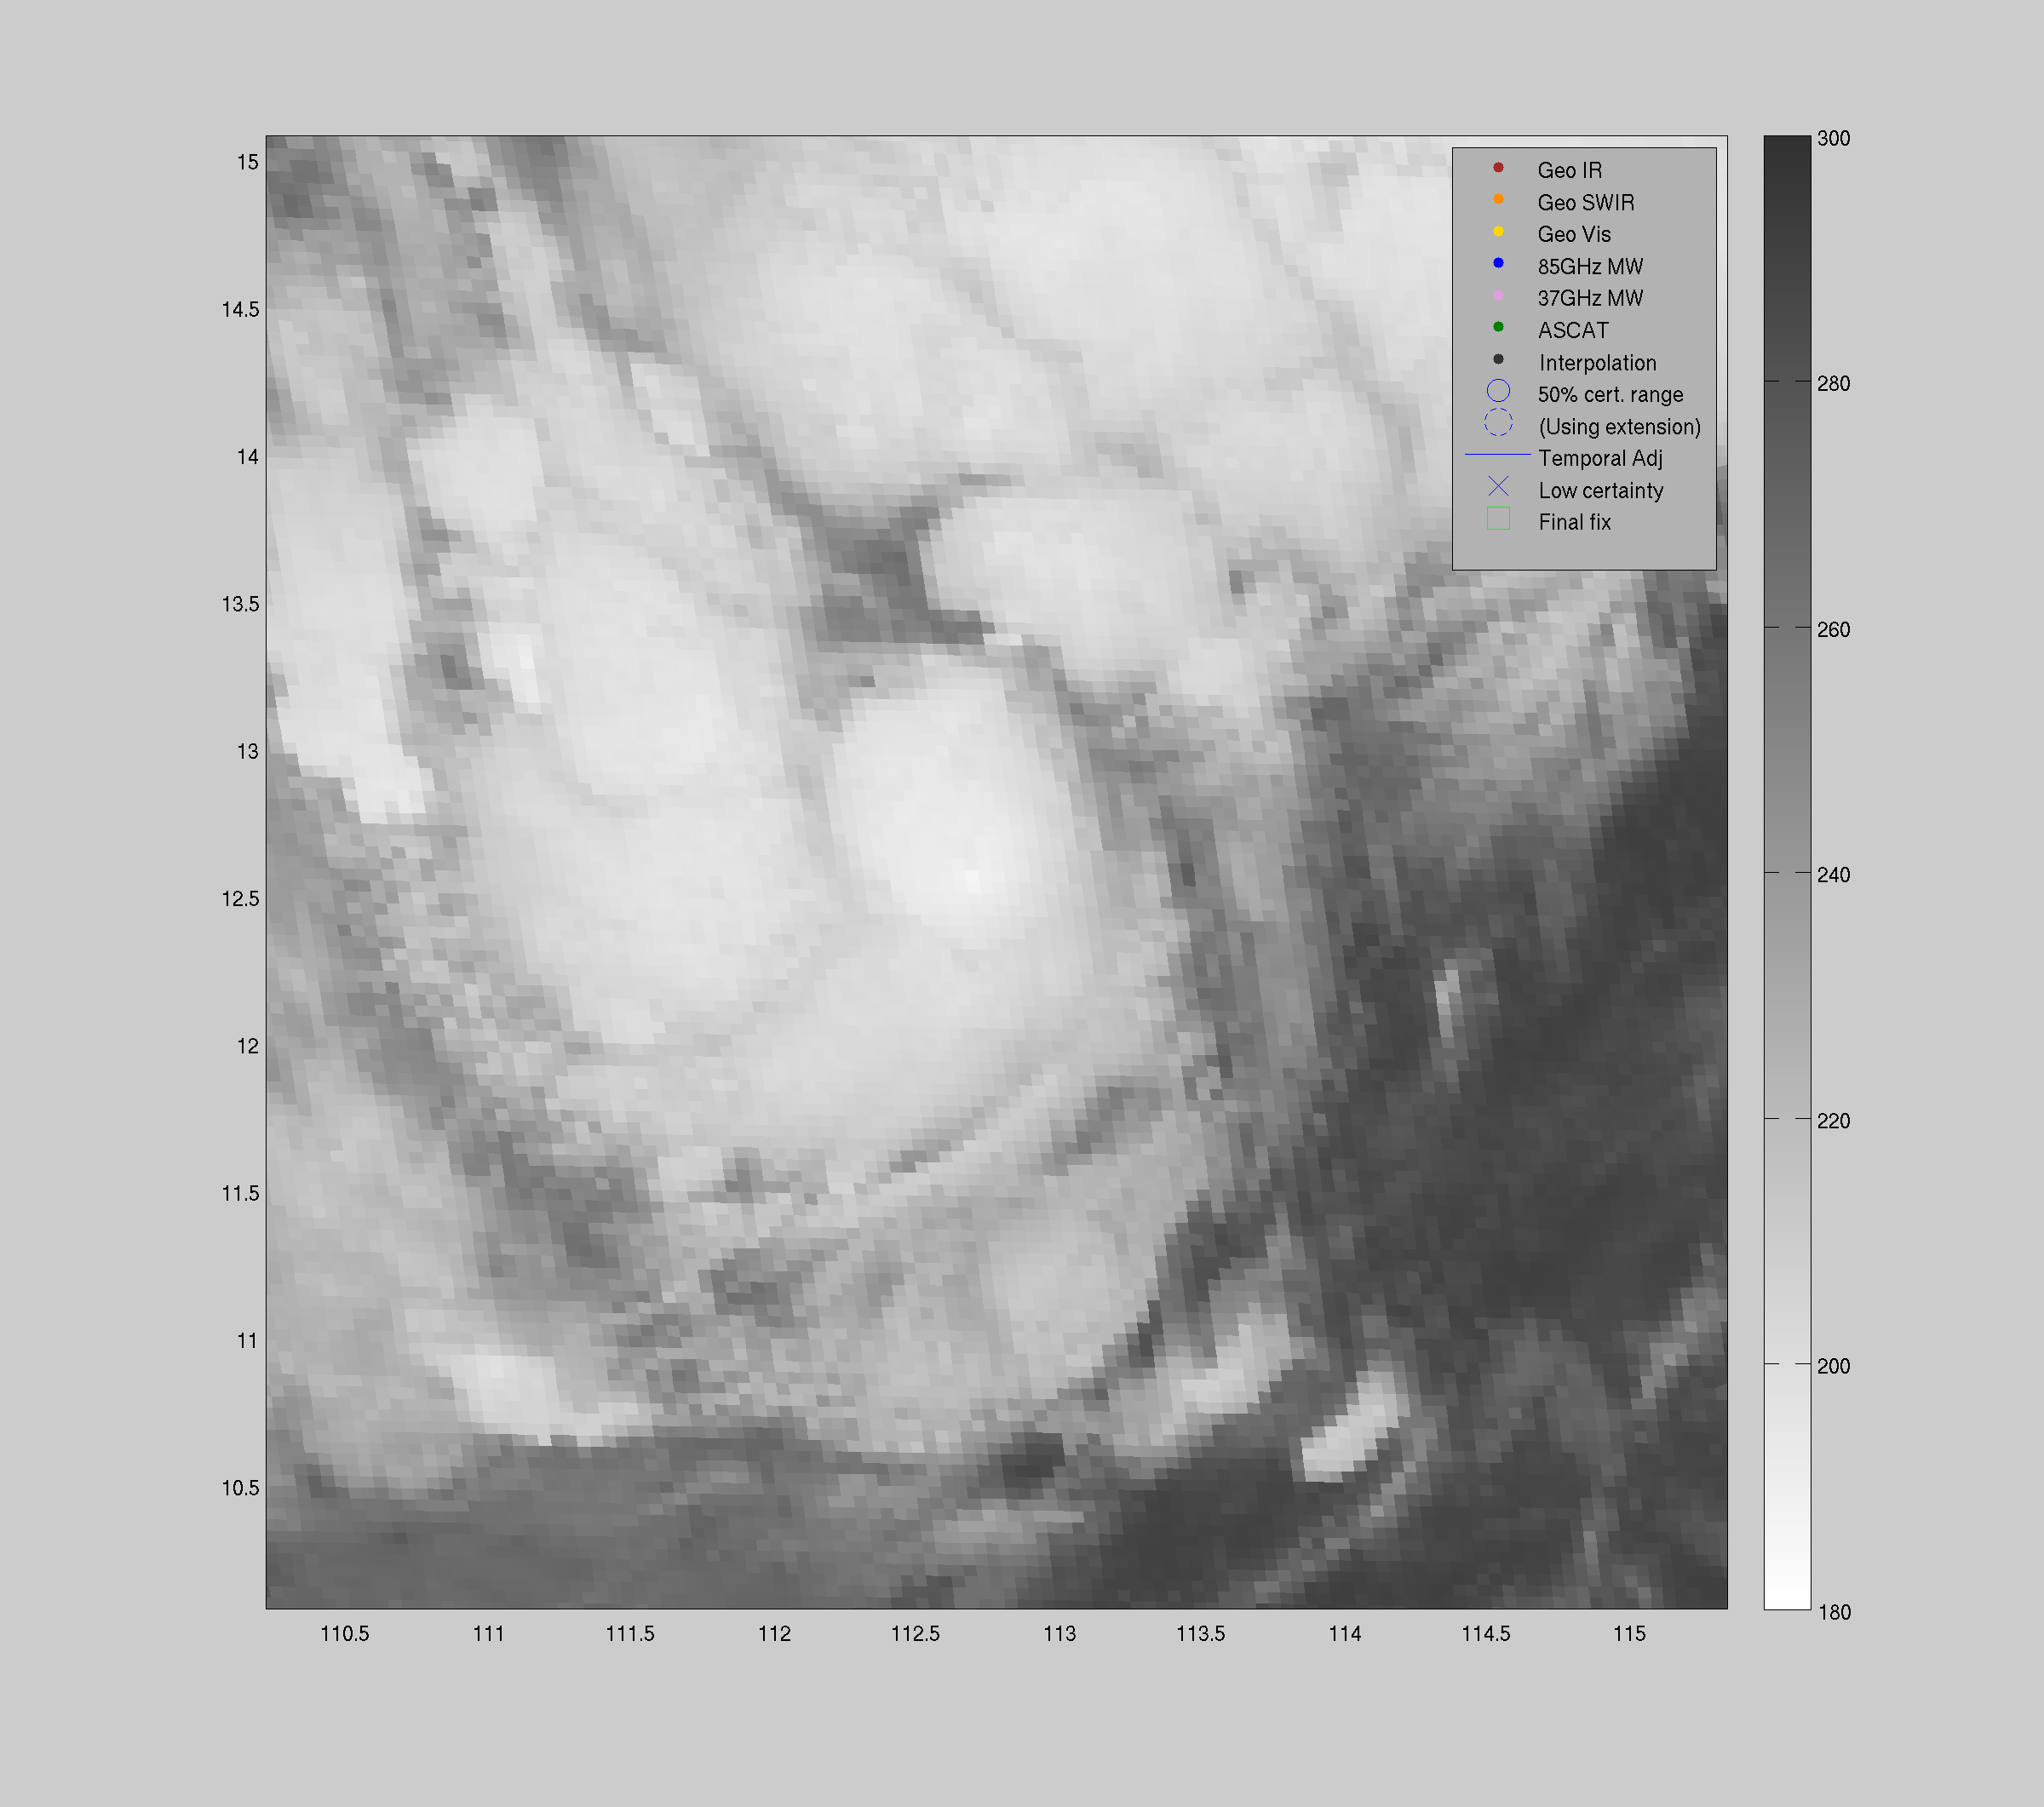
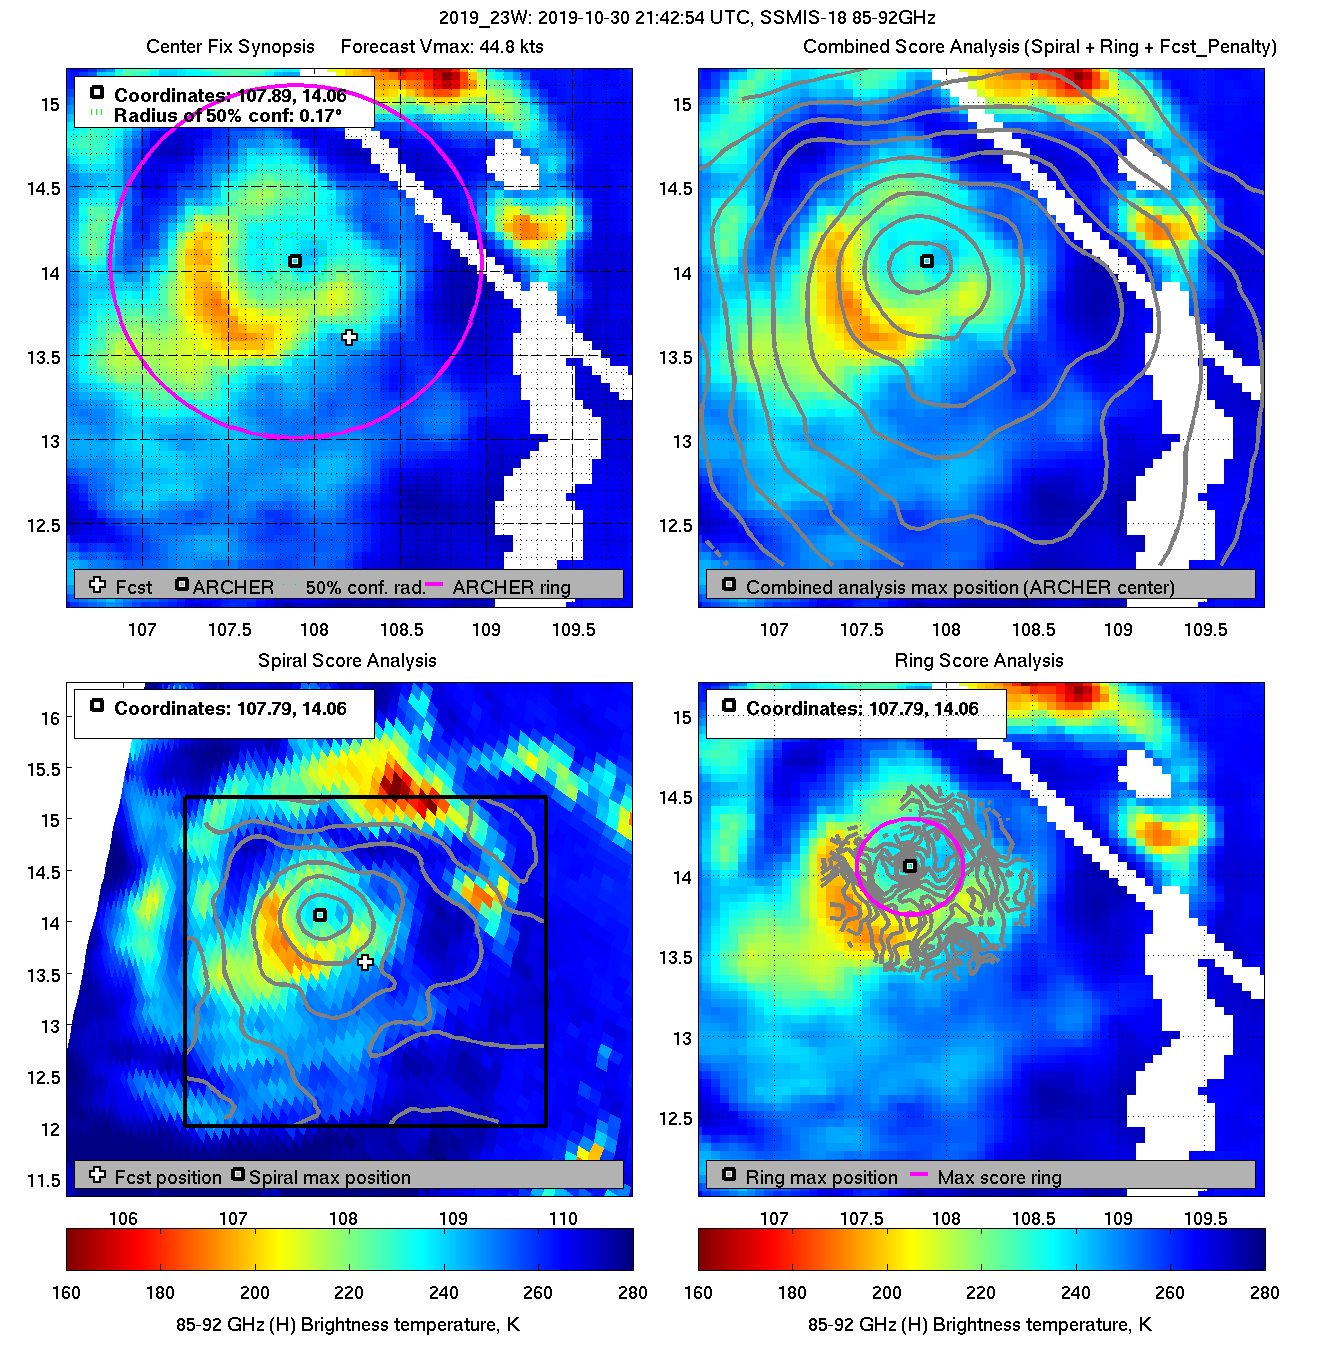
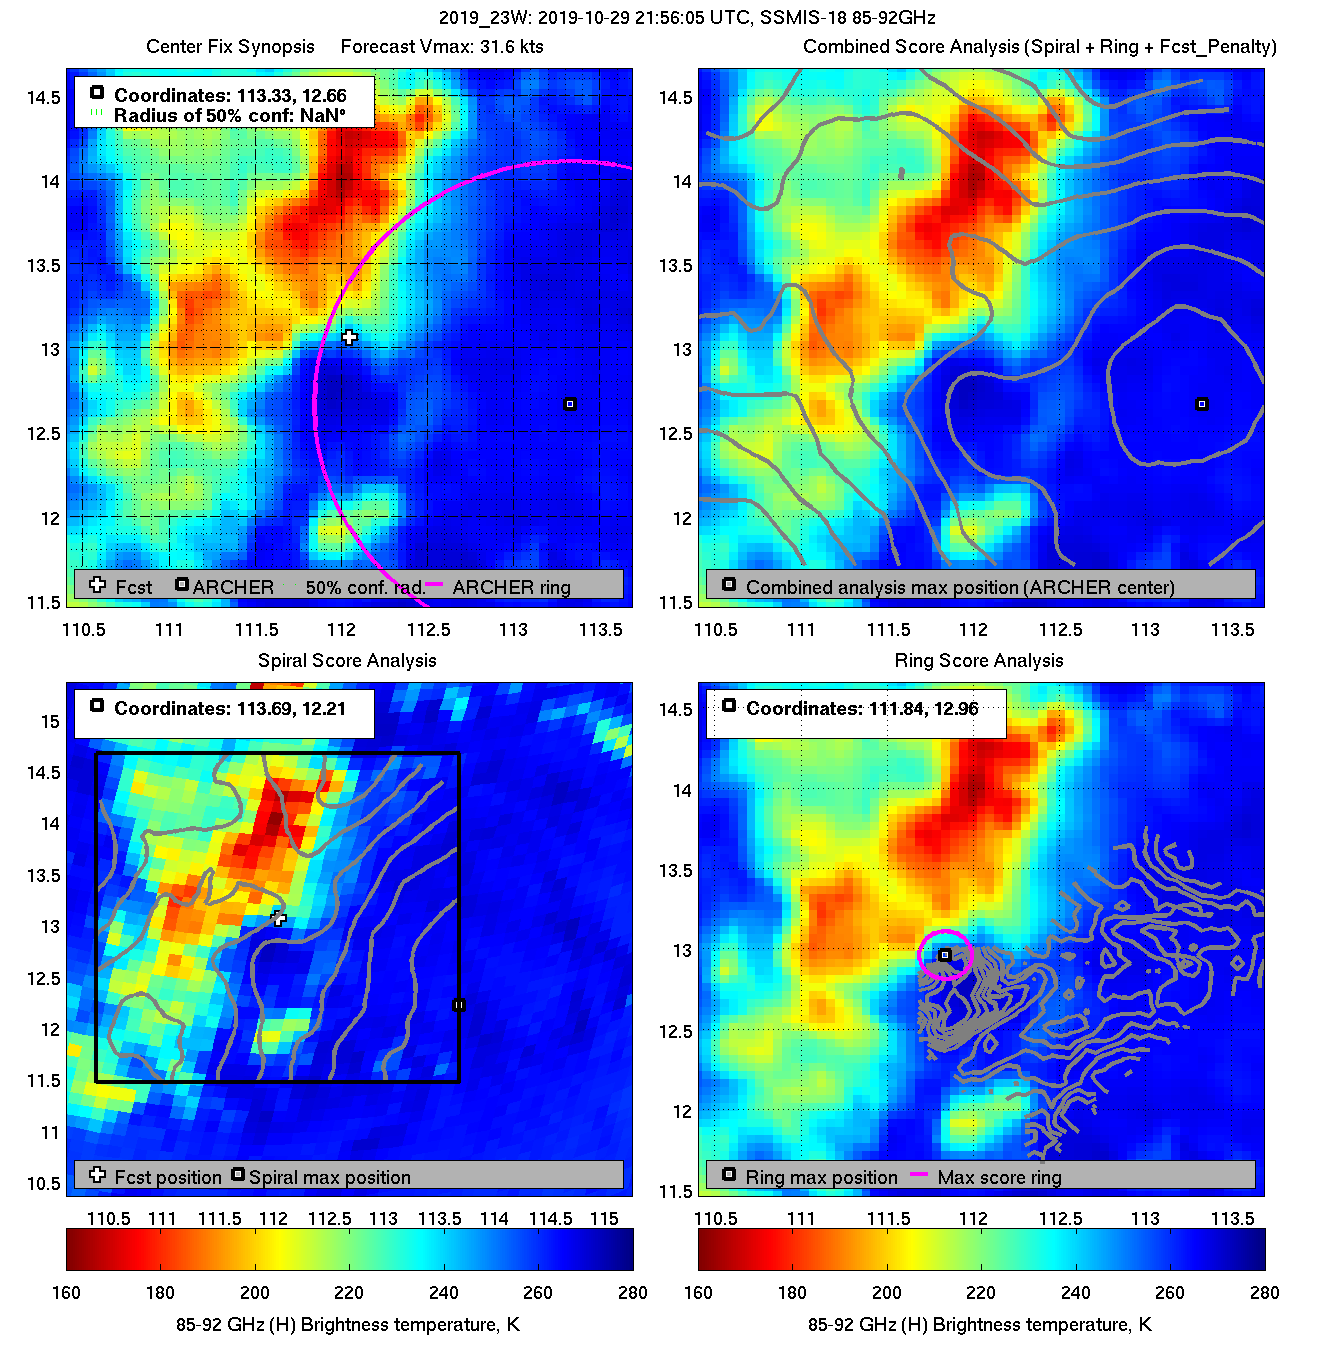
| 20191030 21:42:54 * |
SSMIS-18 |
85-92GHz |
44.8 |
14.06 |
107.89 |
14.05 |
108.09 |
0.17 |
0.49 |
2.10 |
45.1 |
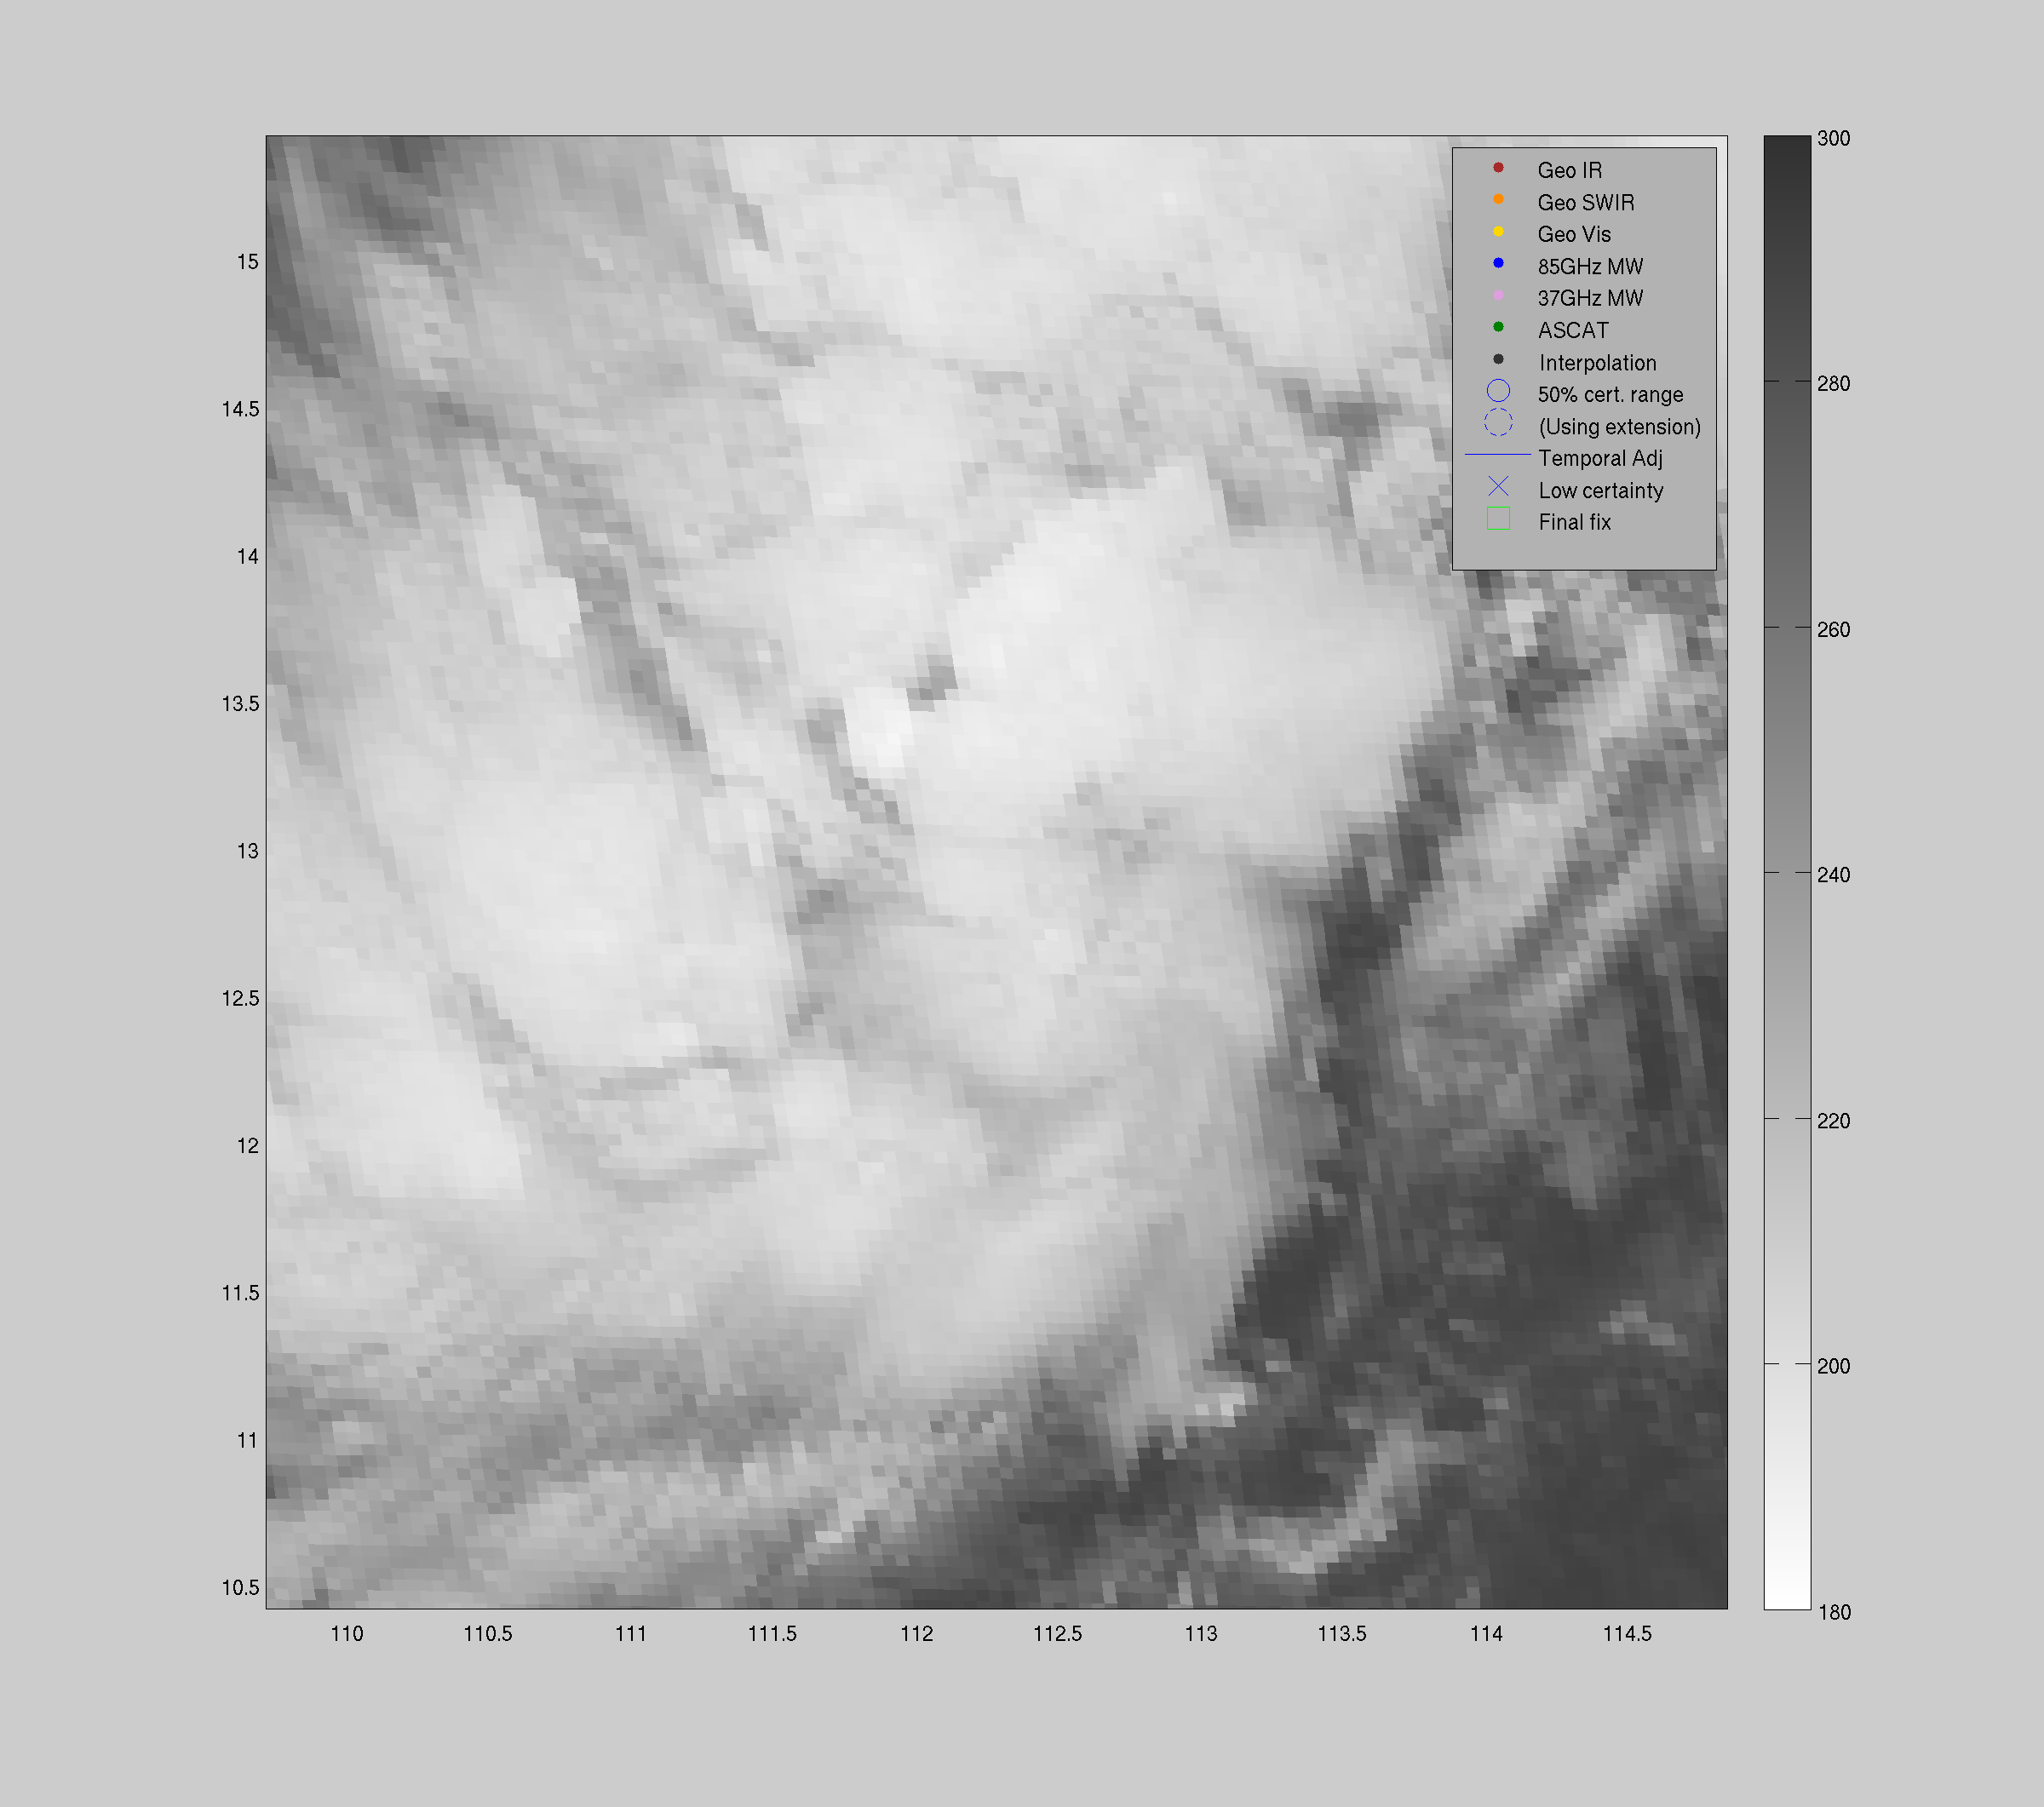
| 20191030 20:57:30 |
SSMIS-16 |
85-92GHz |
44.8 |
13.95 |
108.01 |
13.95 |
108.09 |
0.48 |
1.37 |
0.30 |
5.6 |
|
|
|
 |
 |
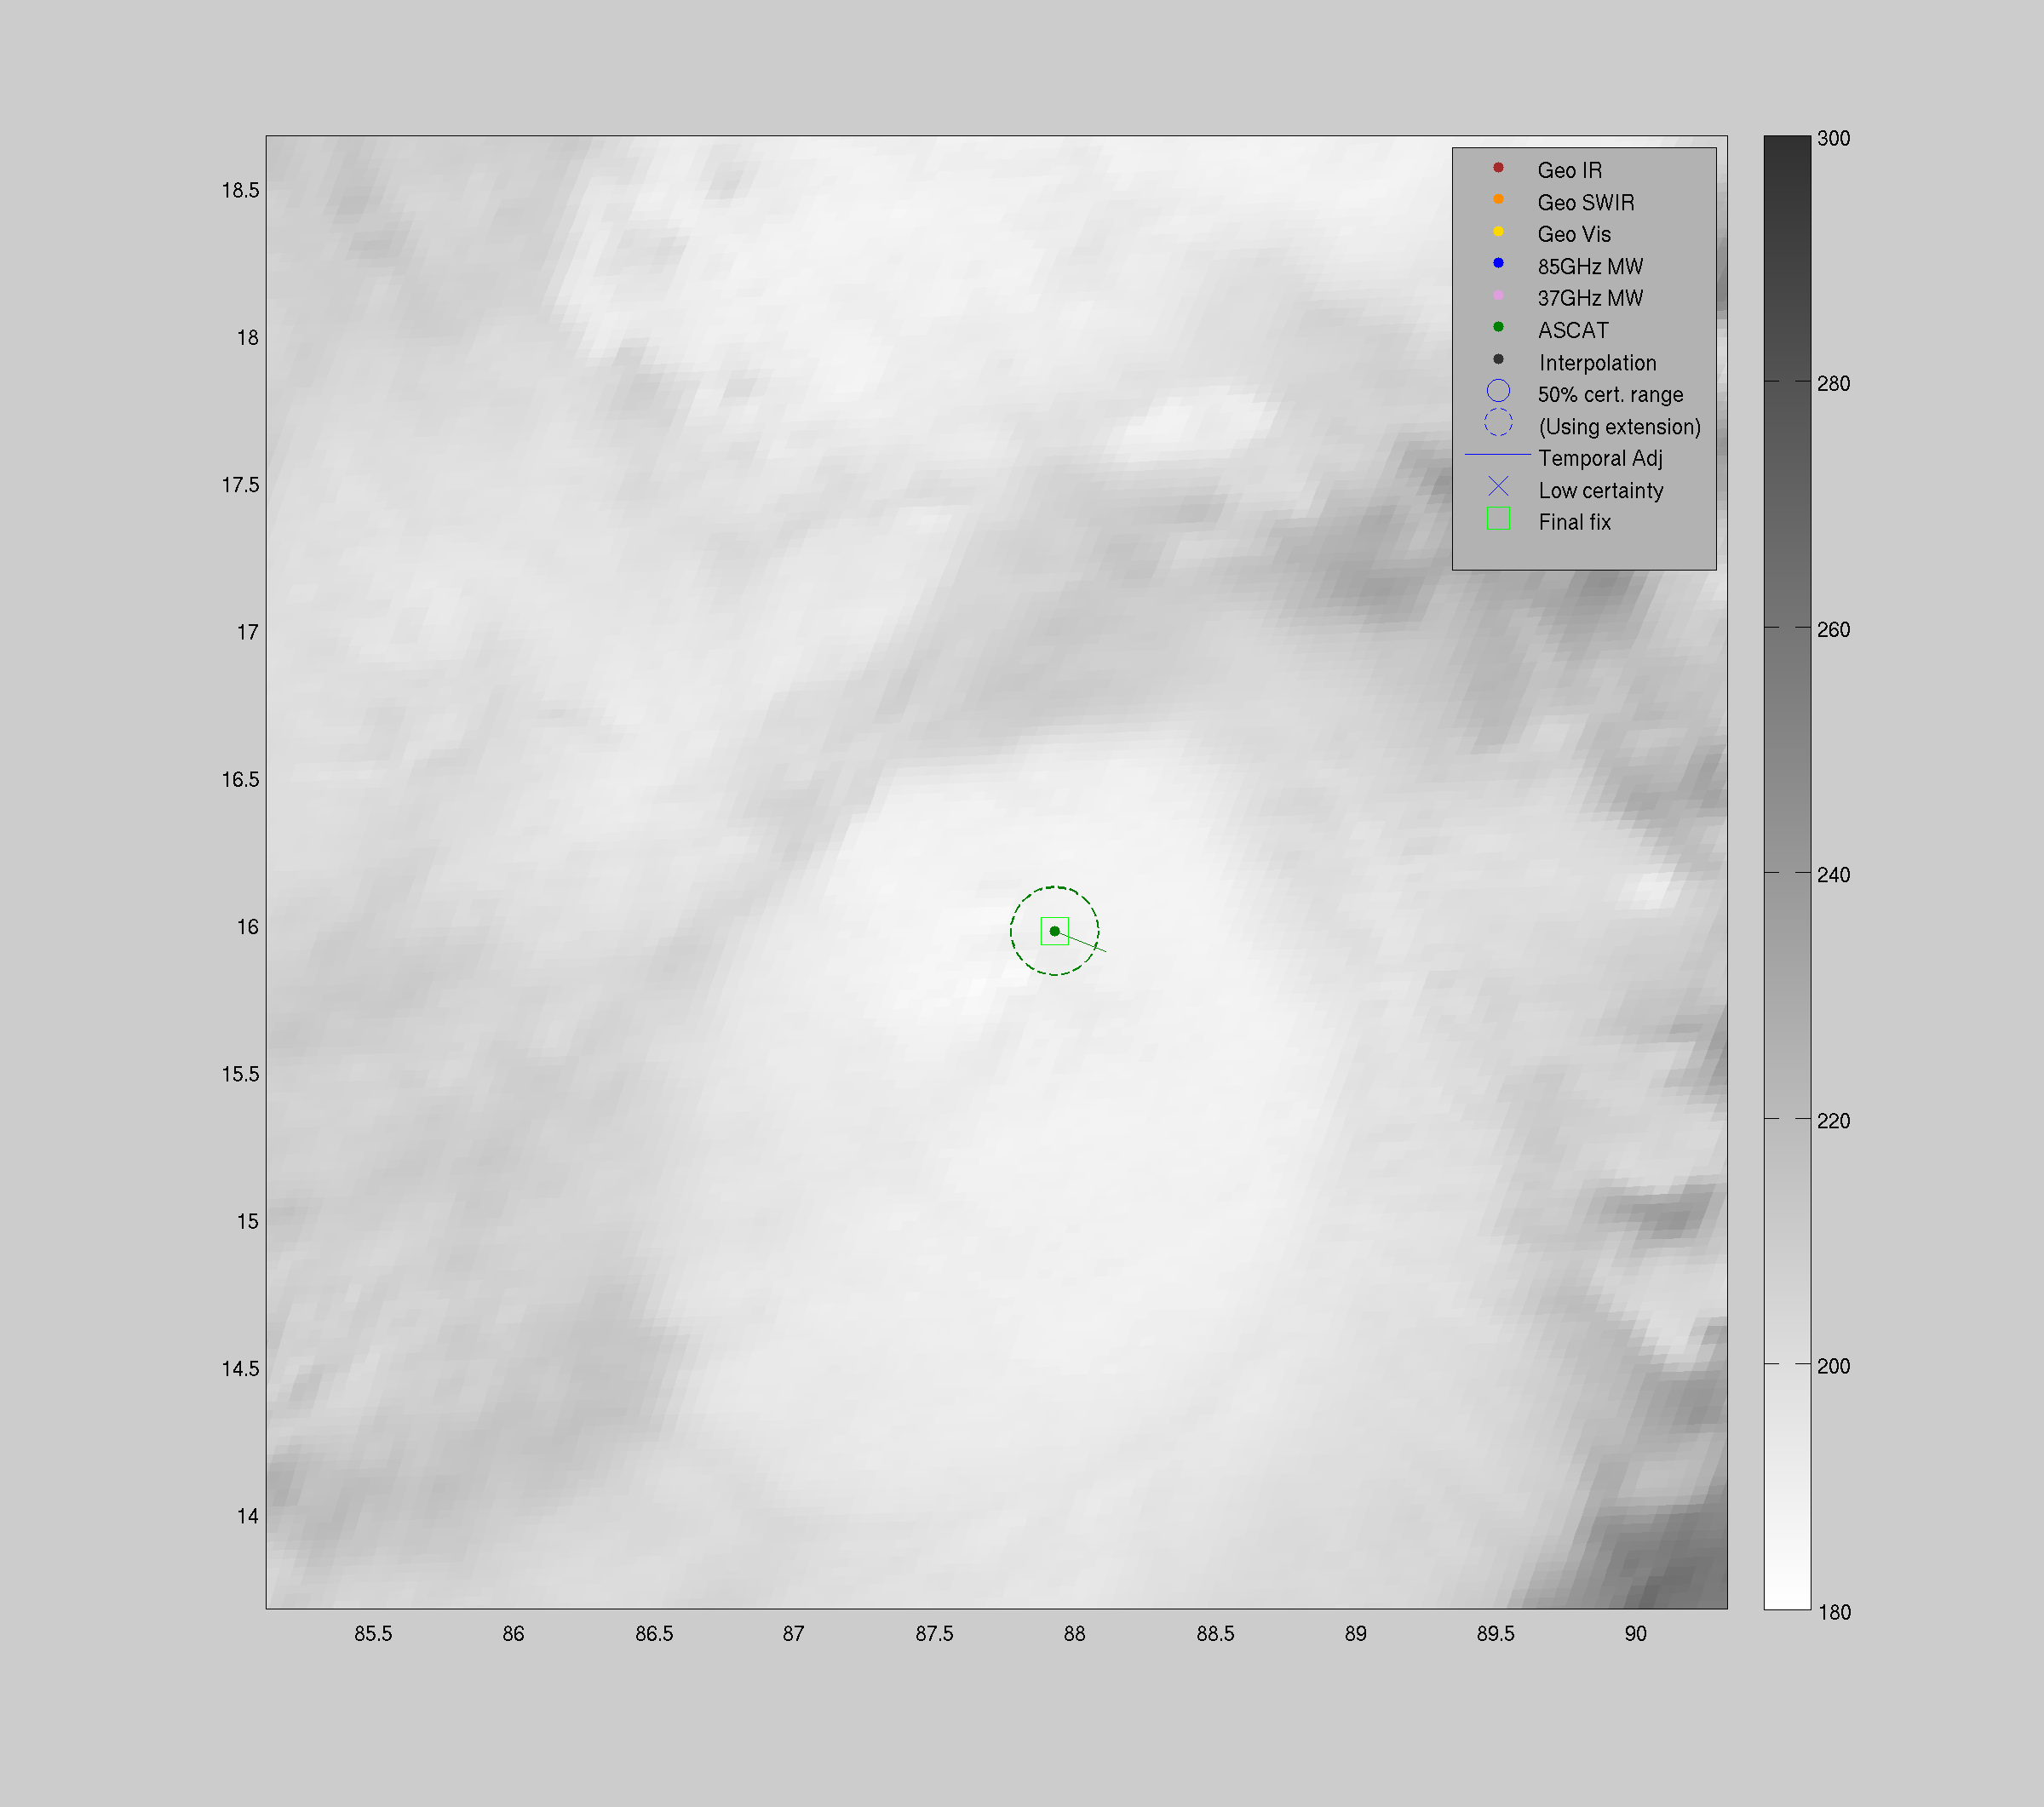
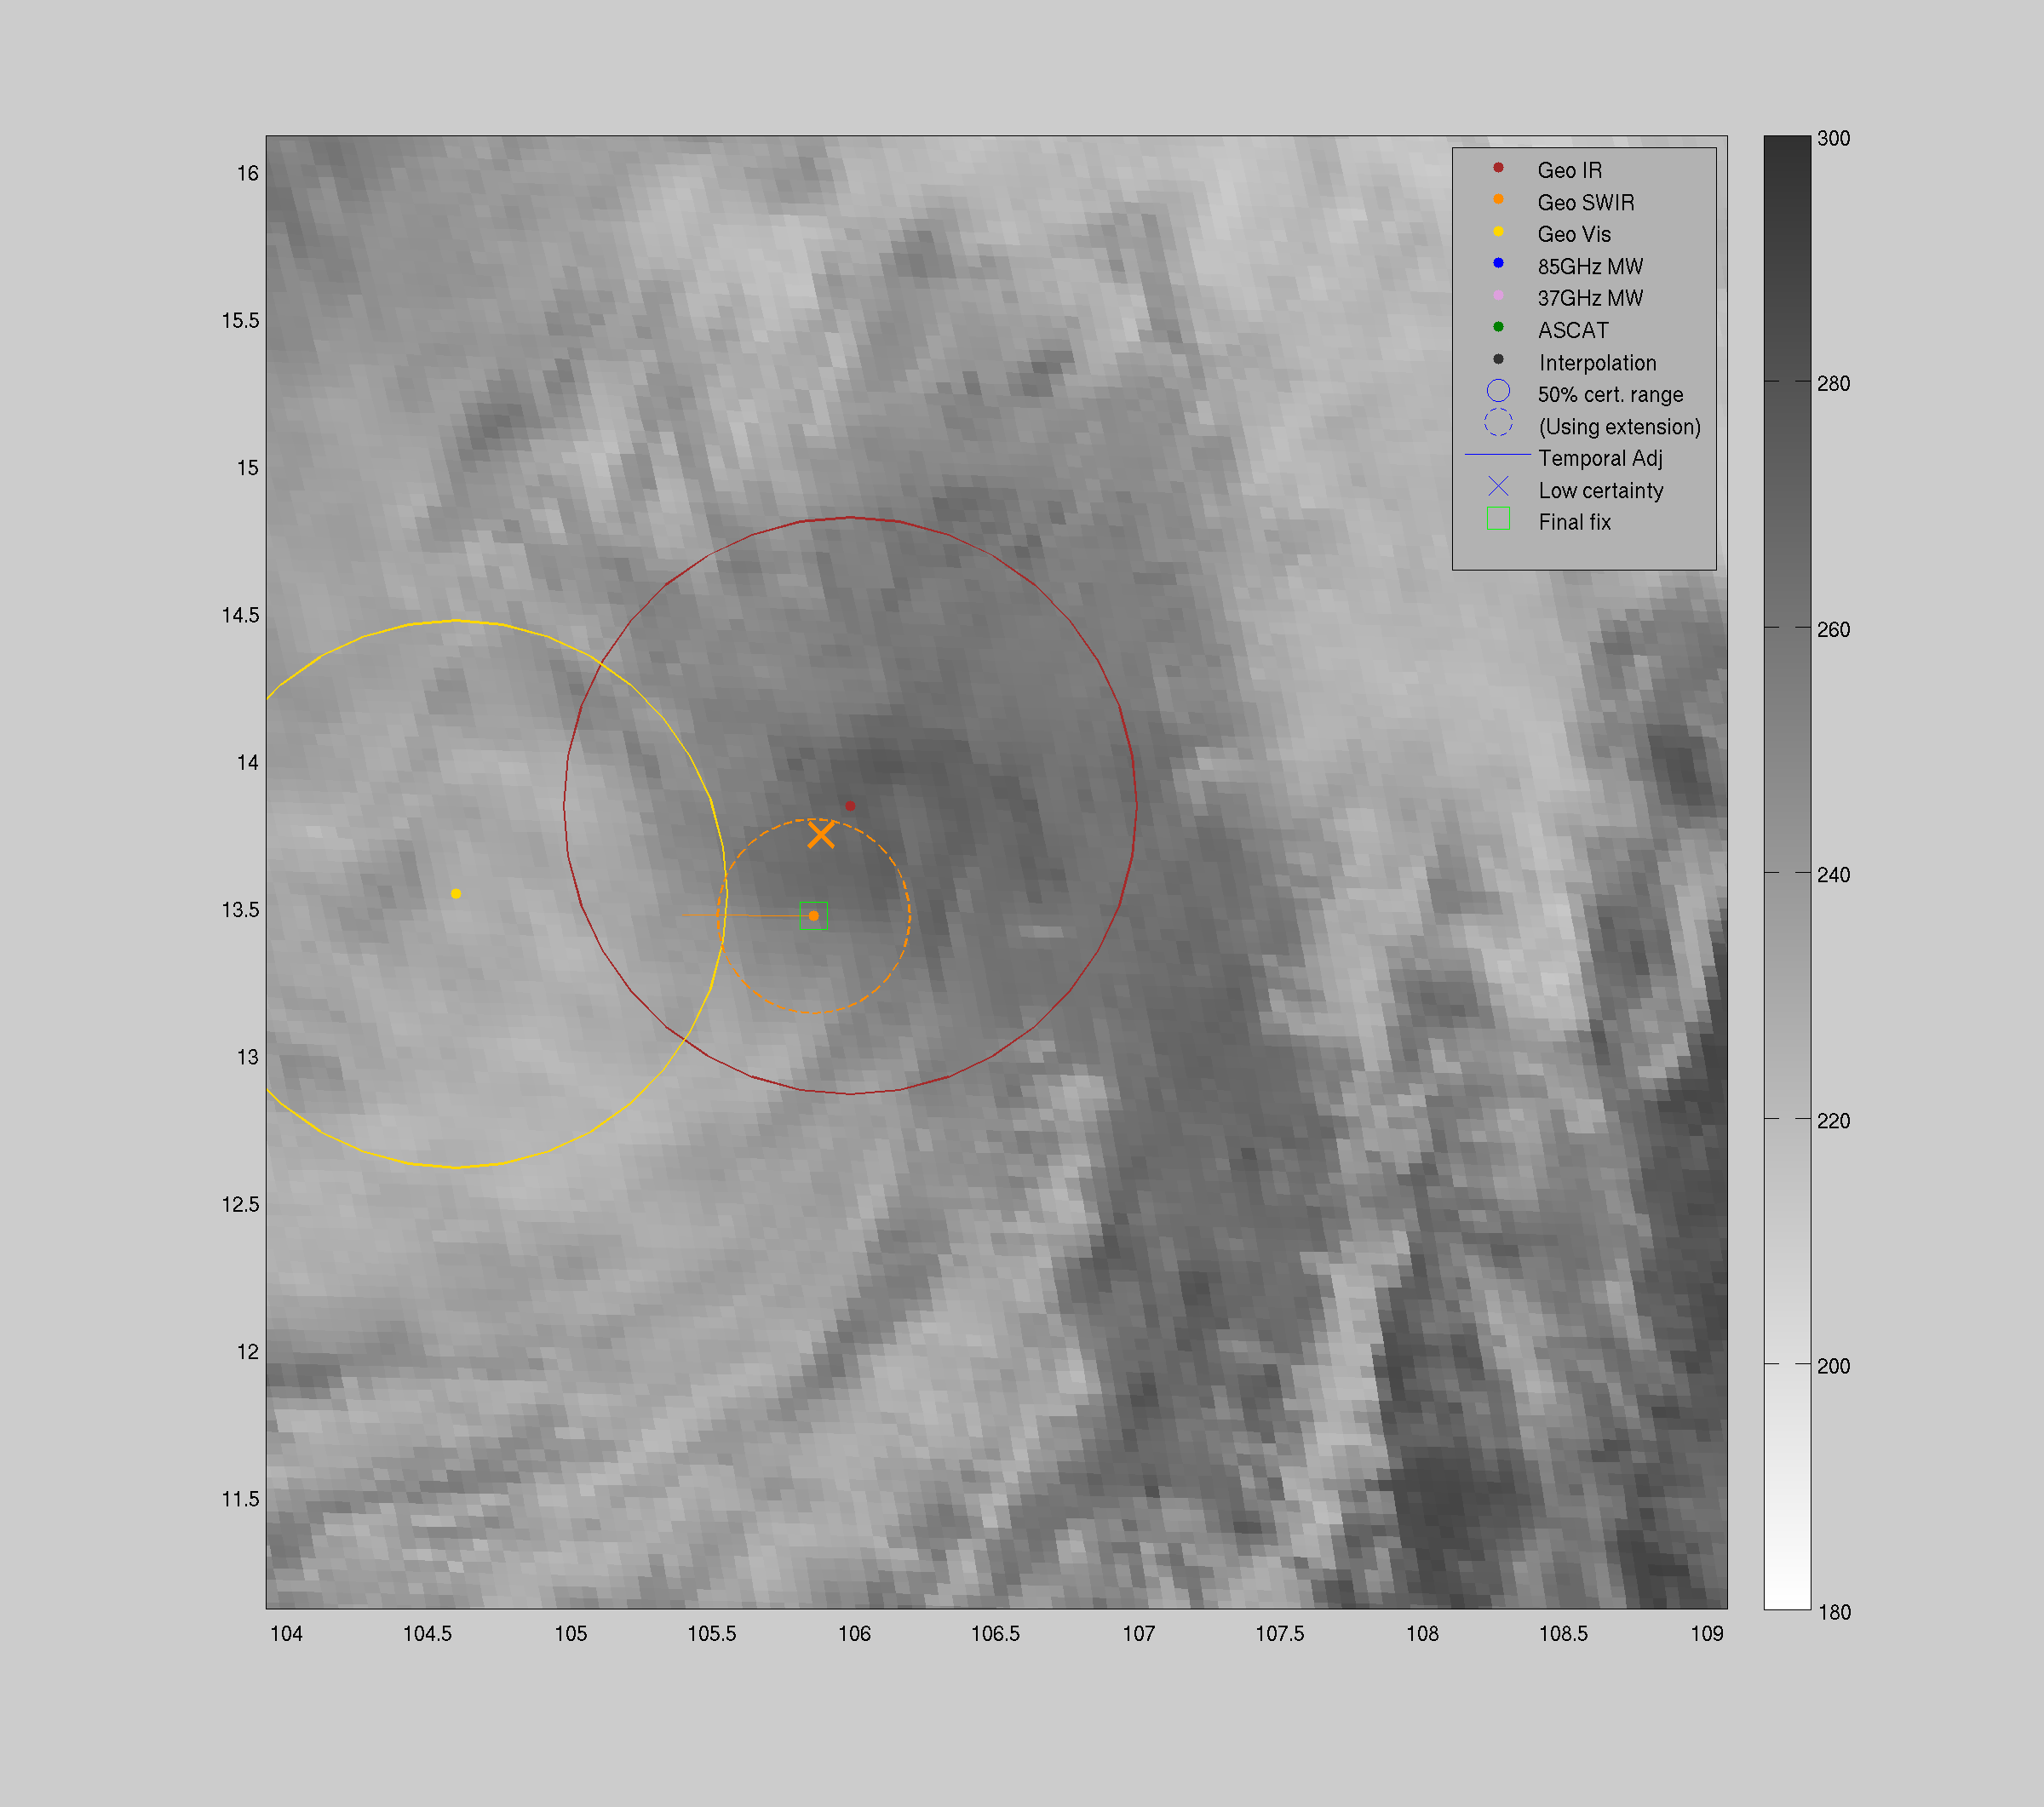
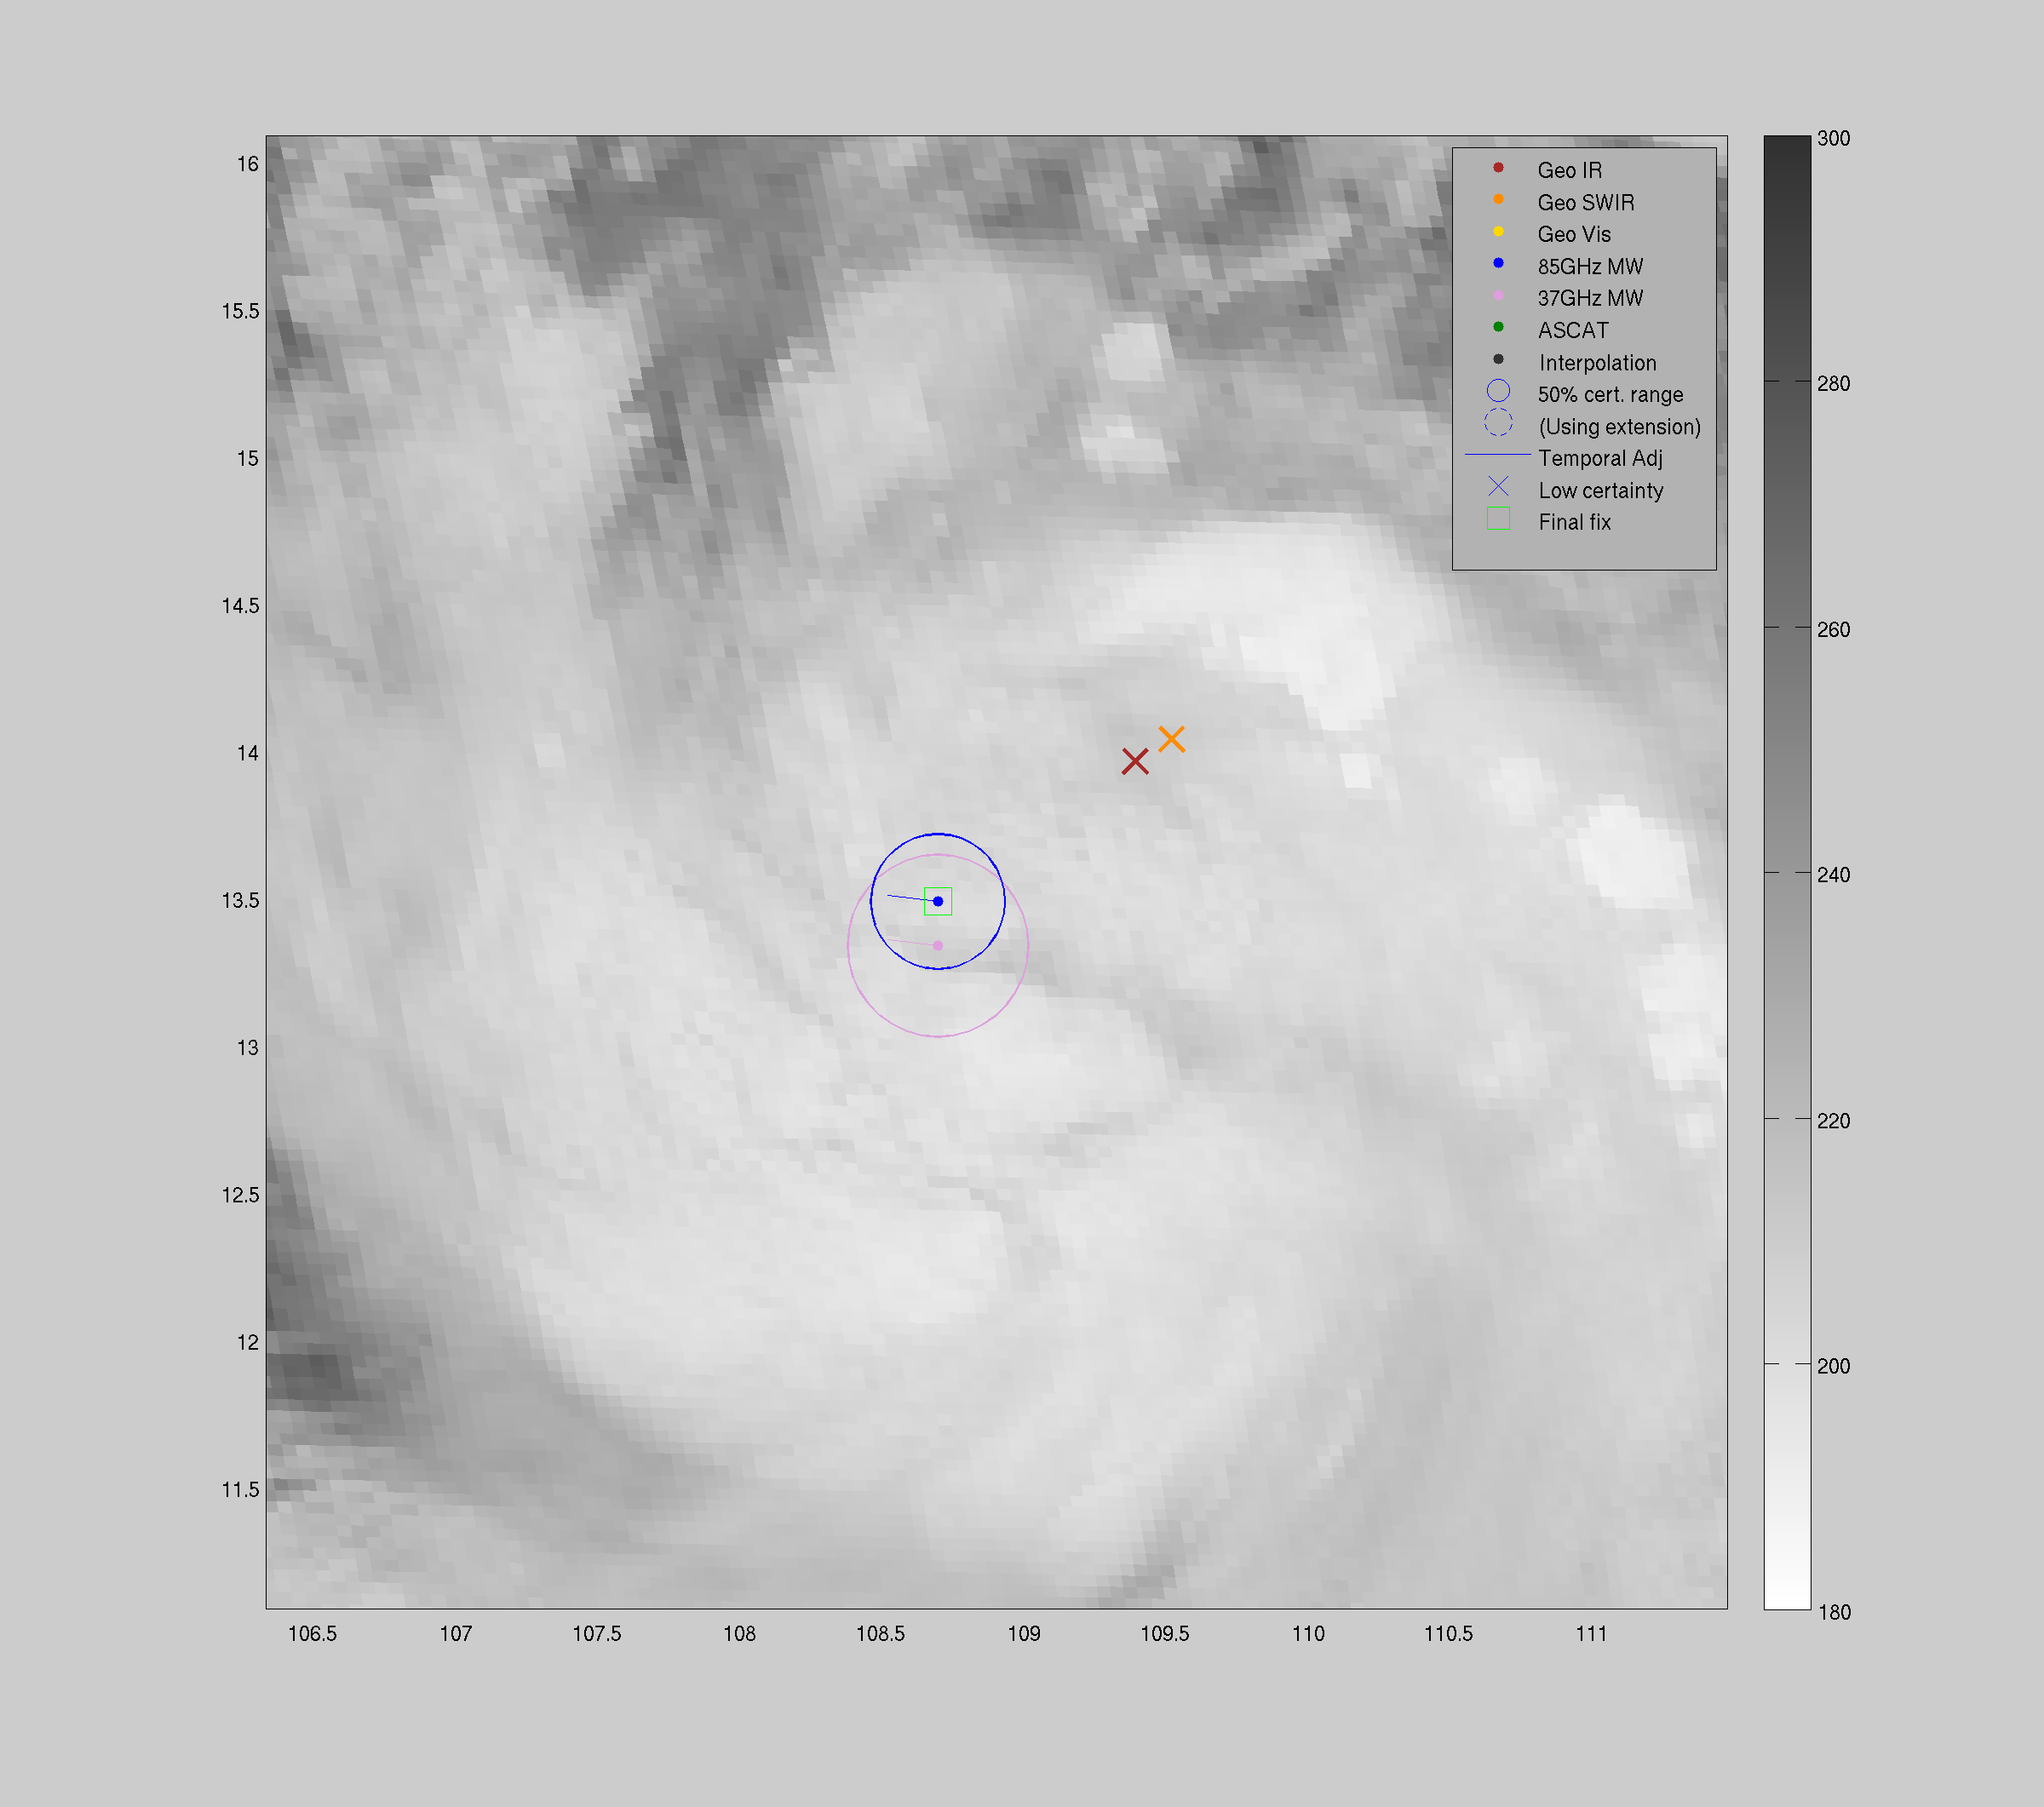
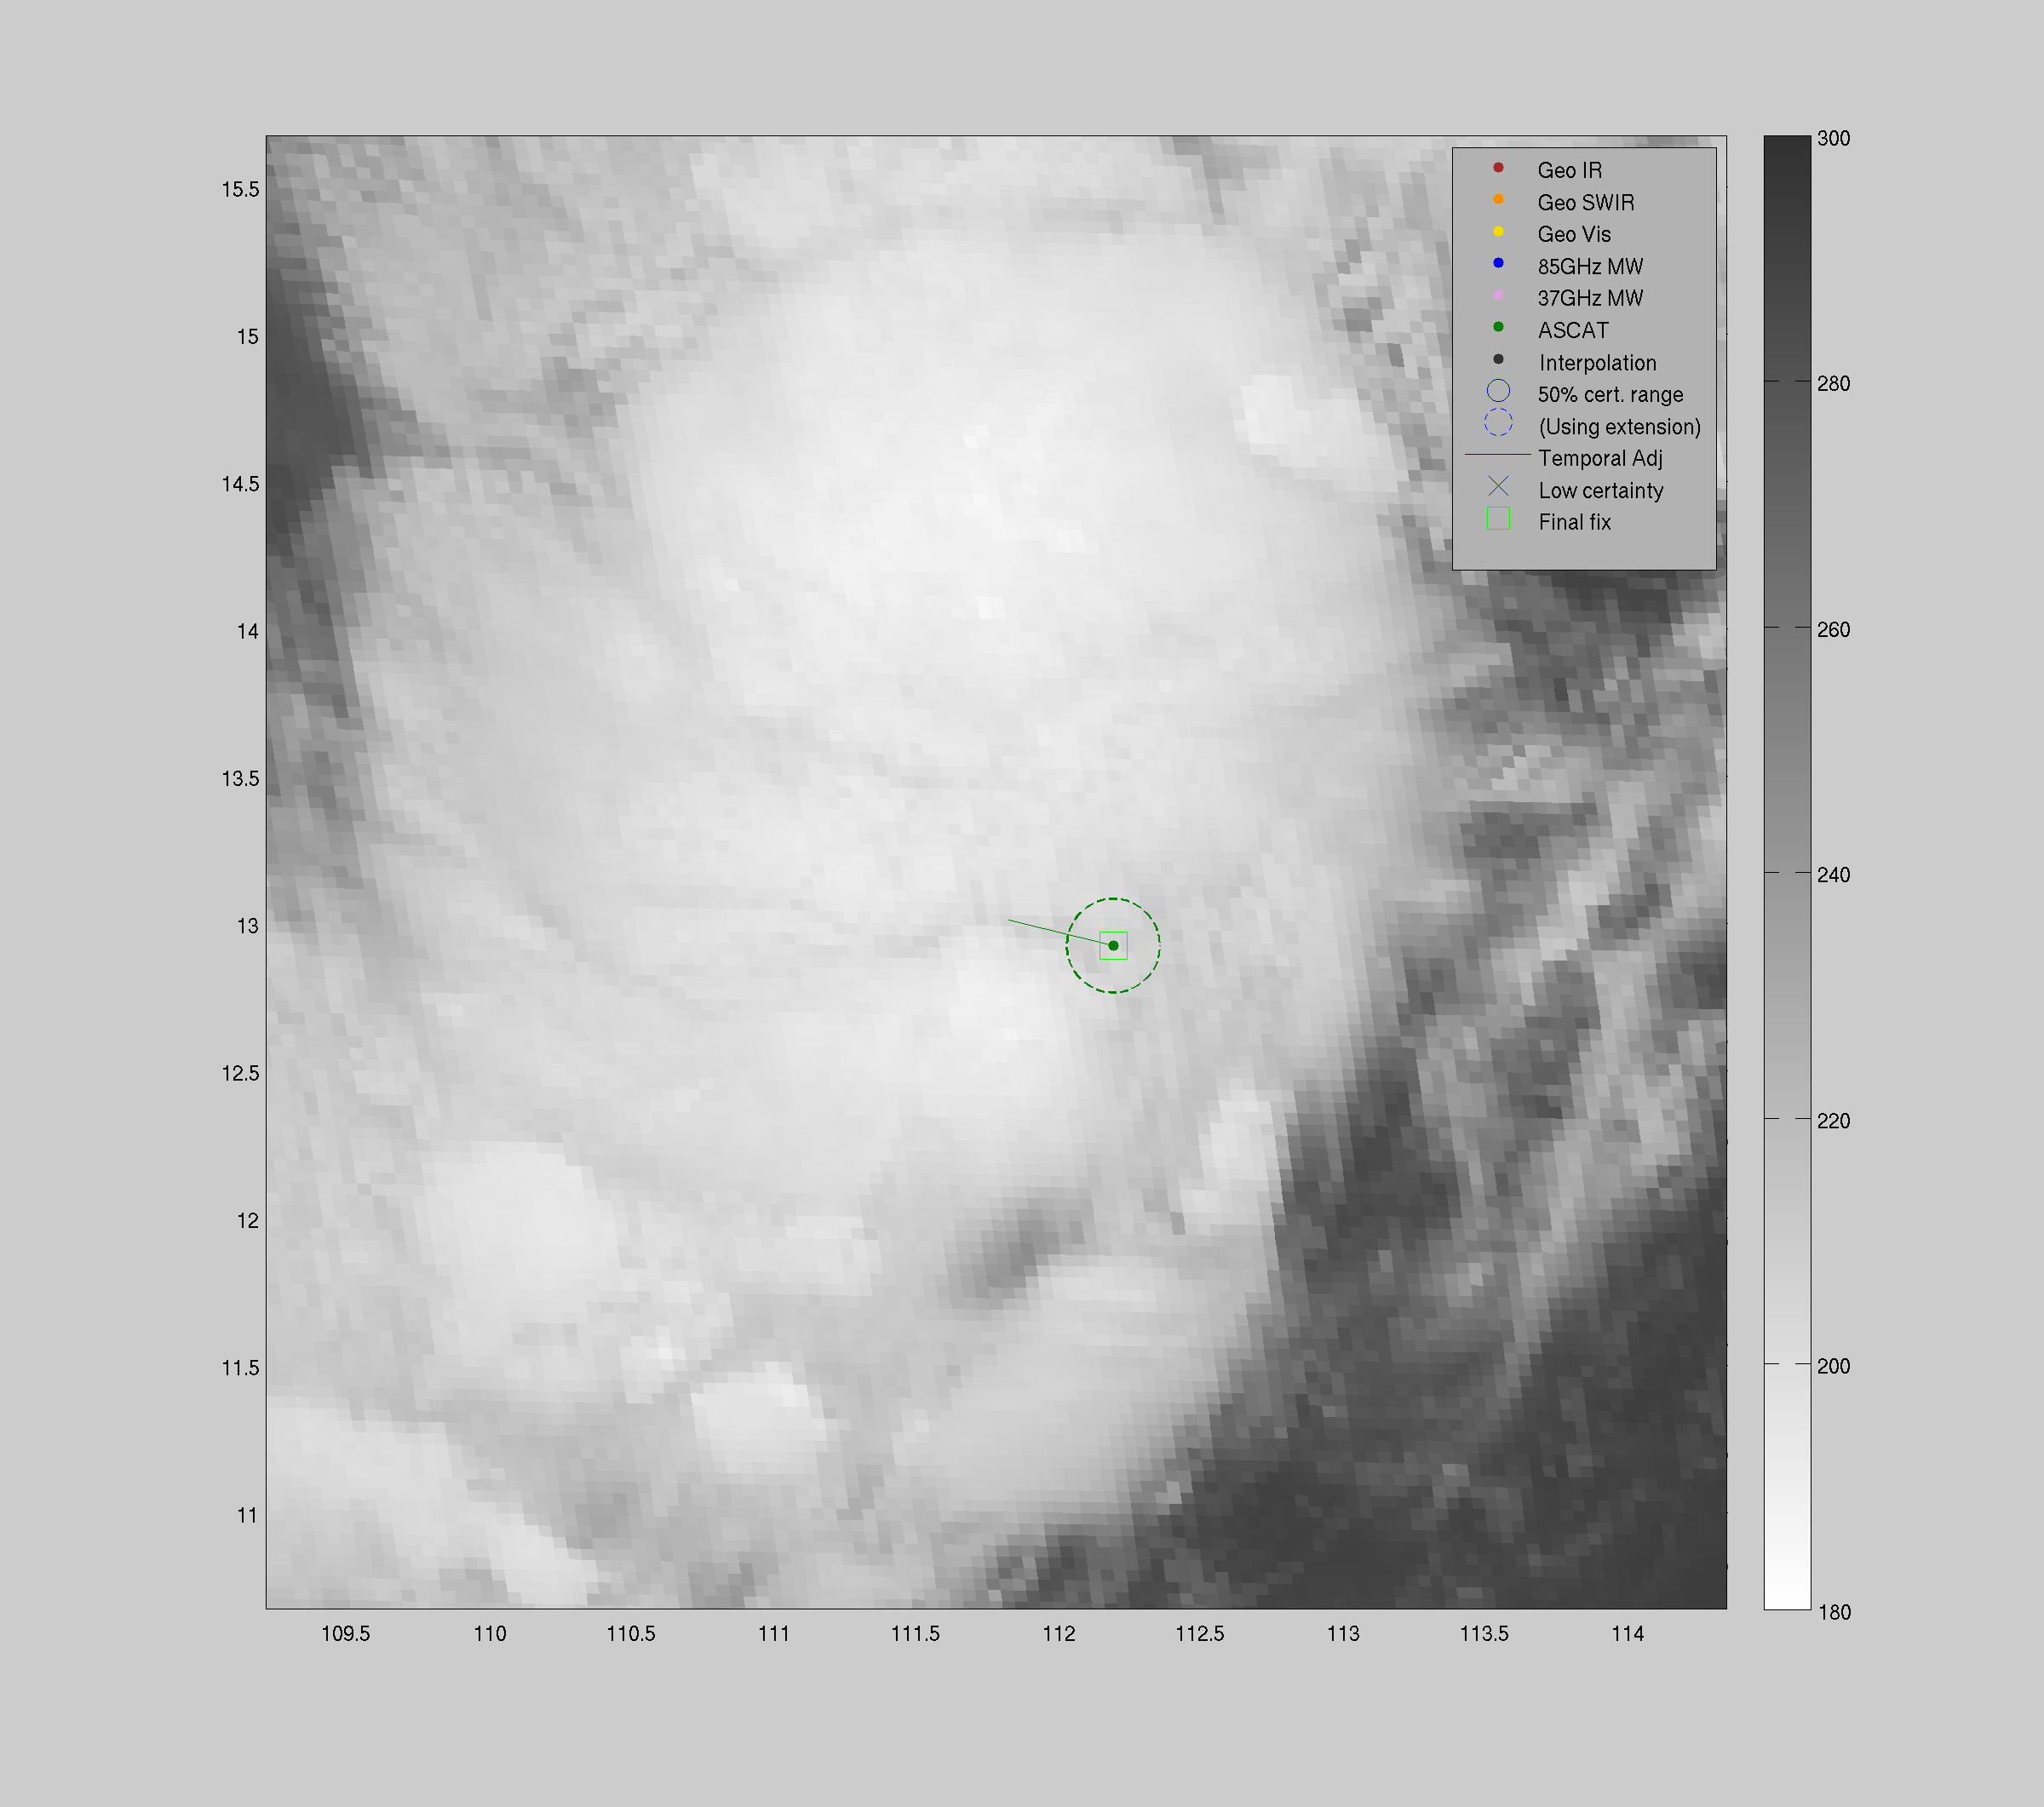
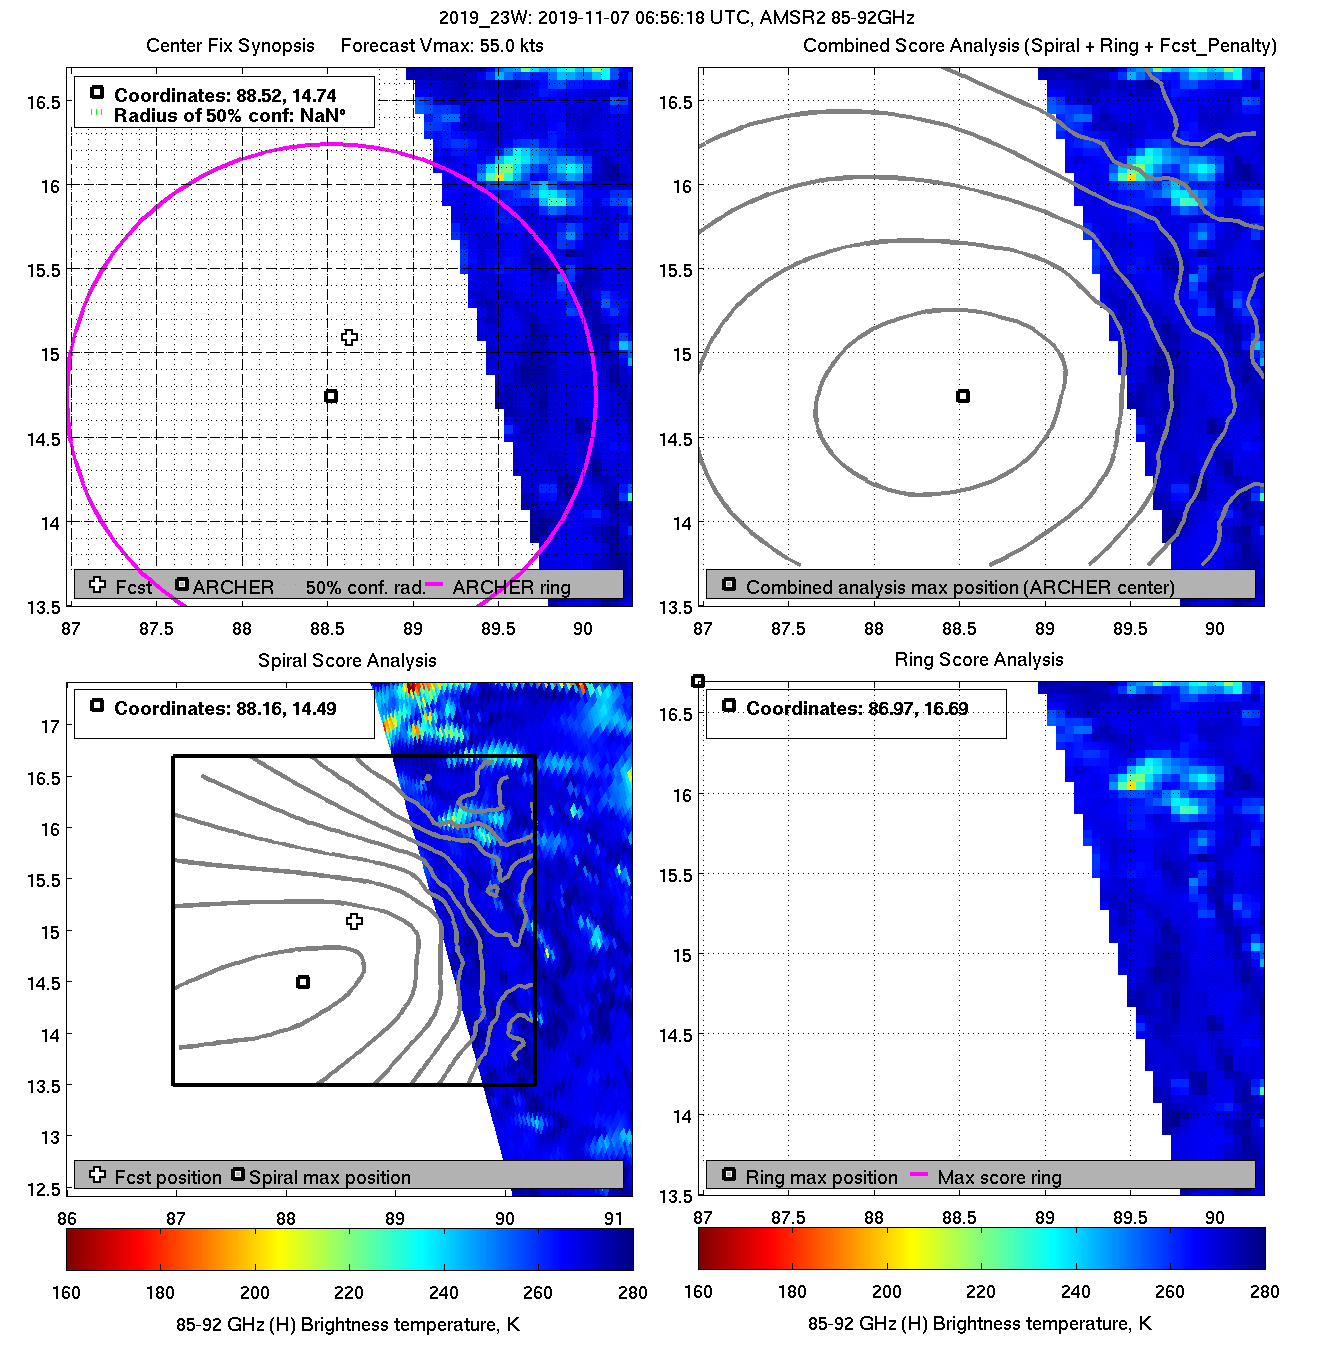
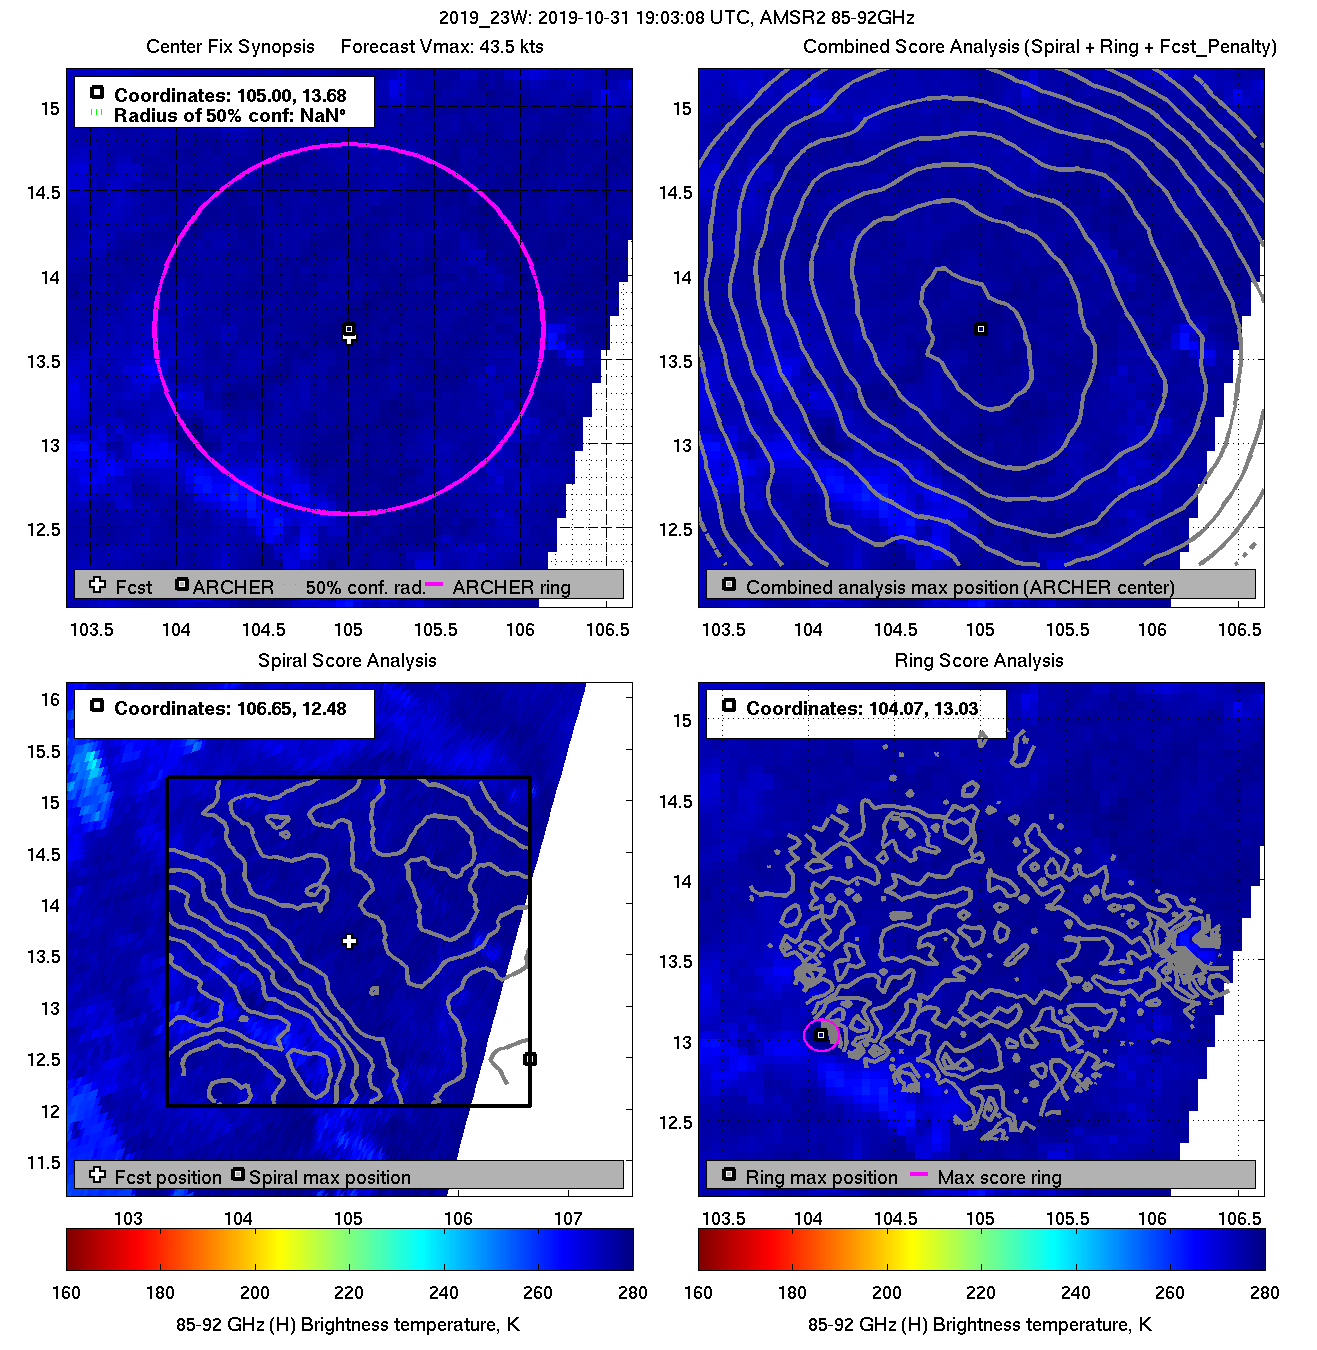
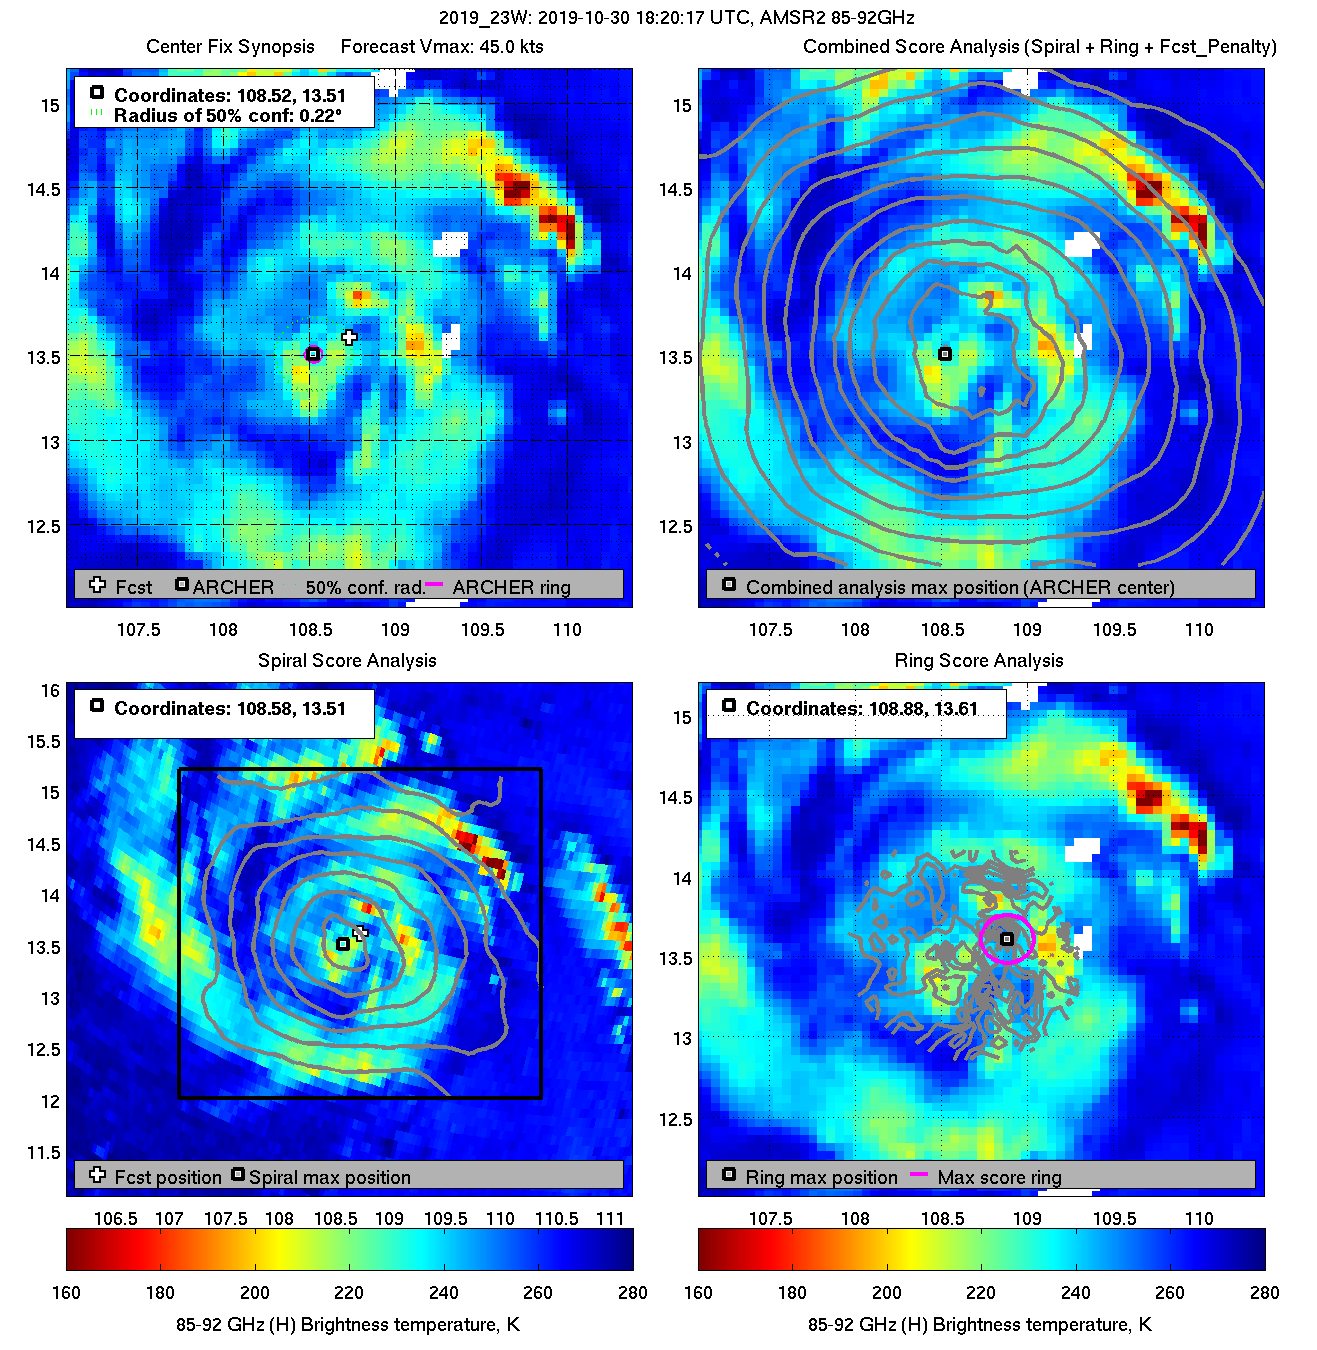
| 20191030 18:20:17 * |
AMSR2 |
85-92GHz |
45.0 |
13.51 |
108.52 |
13.51 |
108.67 |
0.22 |
0.63 |
0.10 |
45.9 |
|
|
|
 |
 |
|
|
|
 |
 |
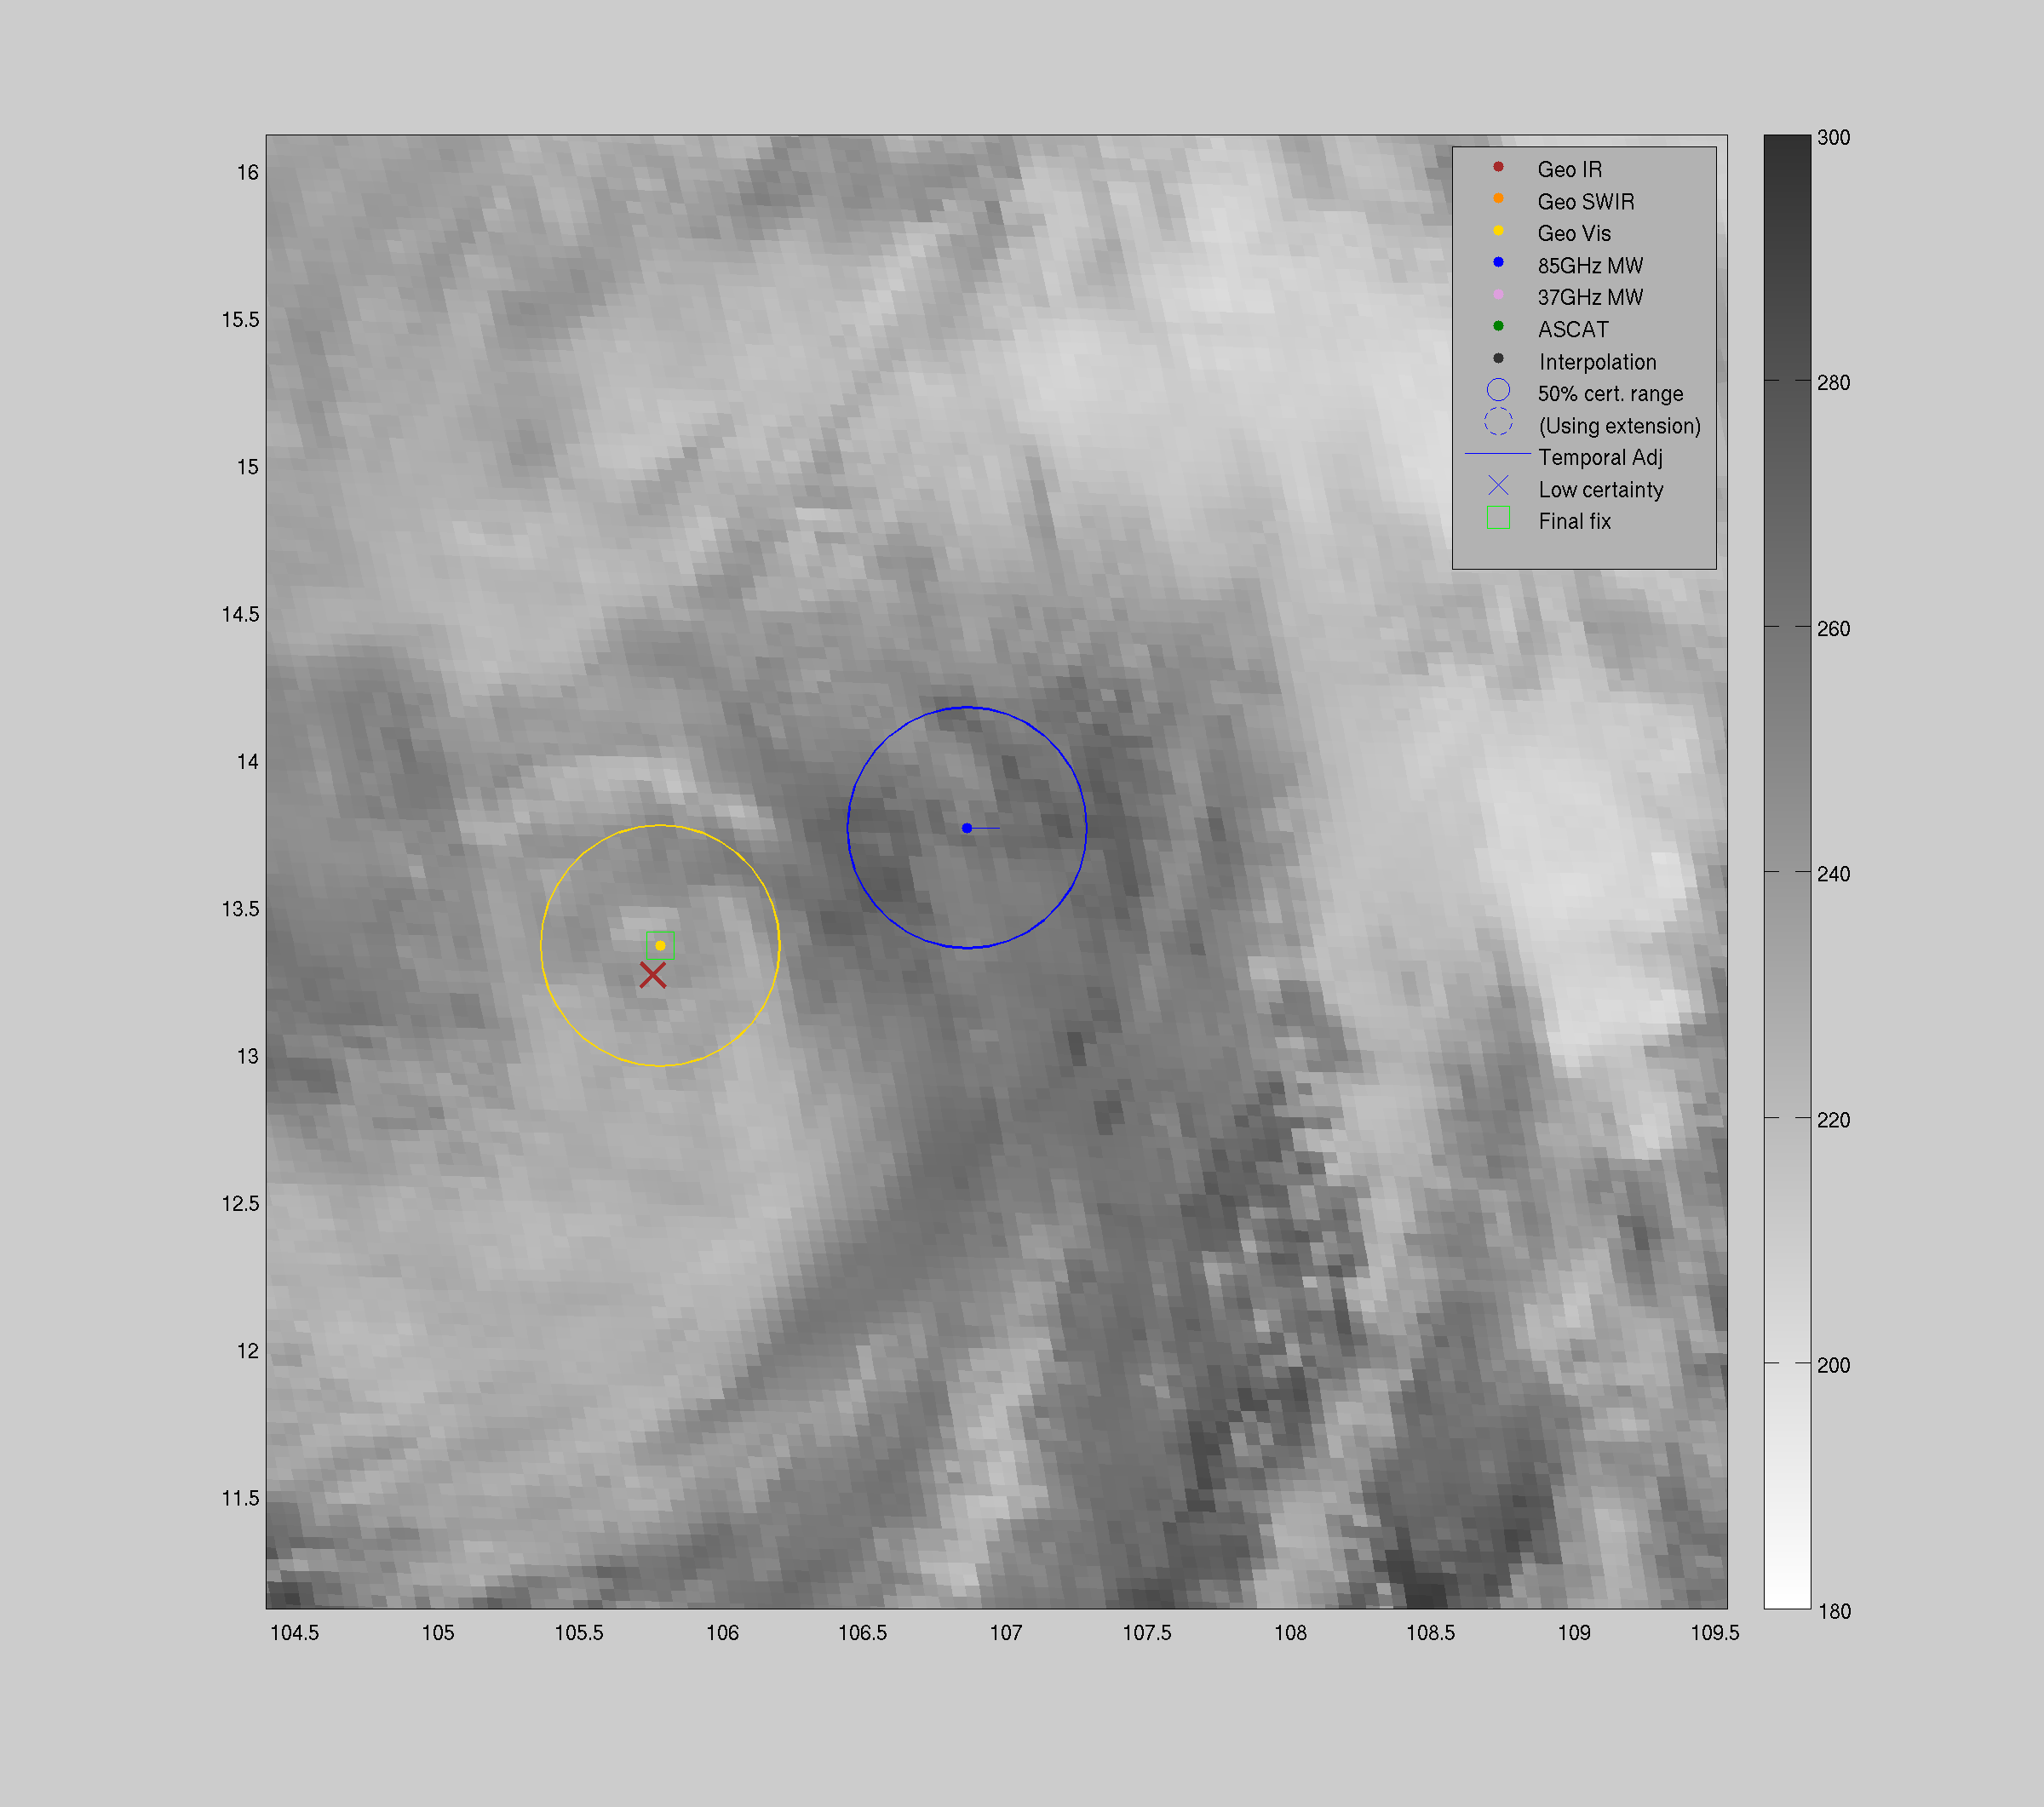
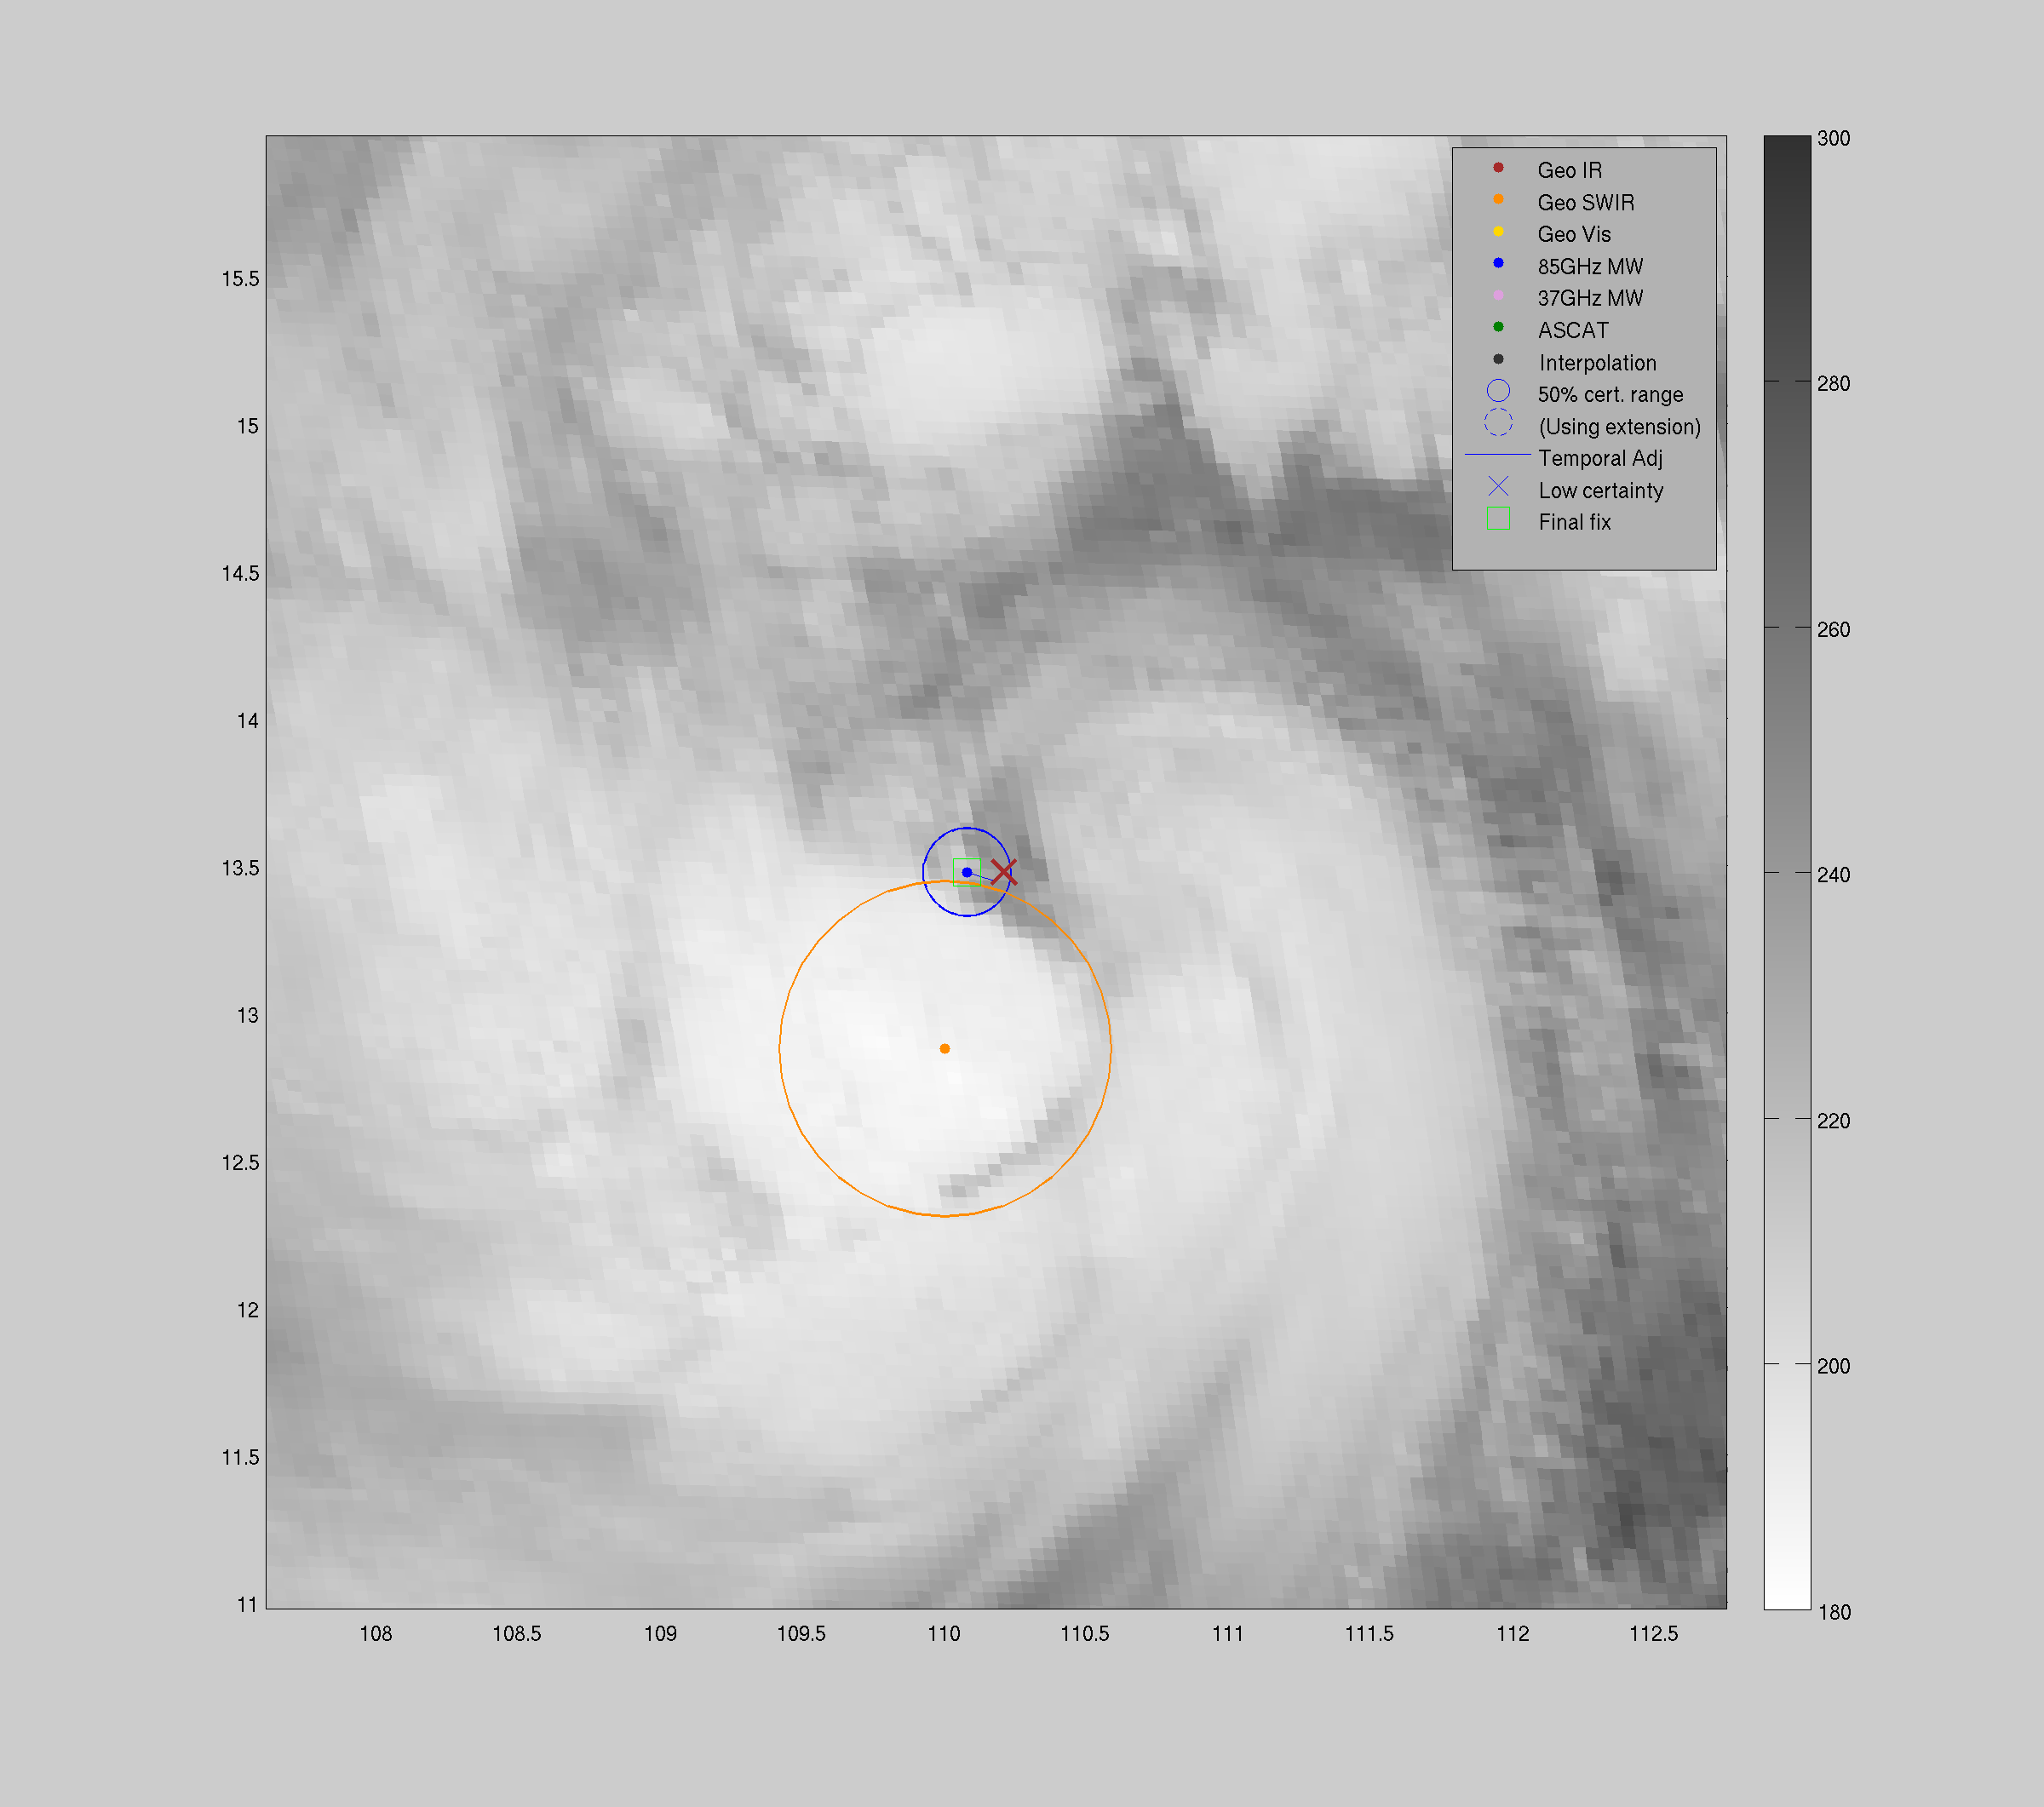
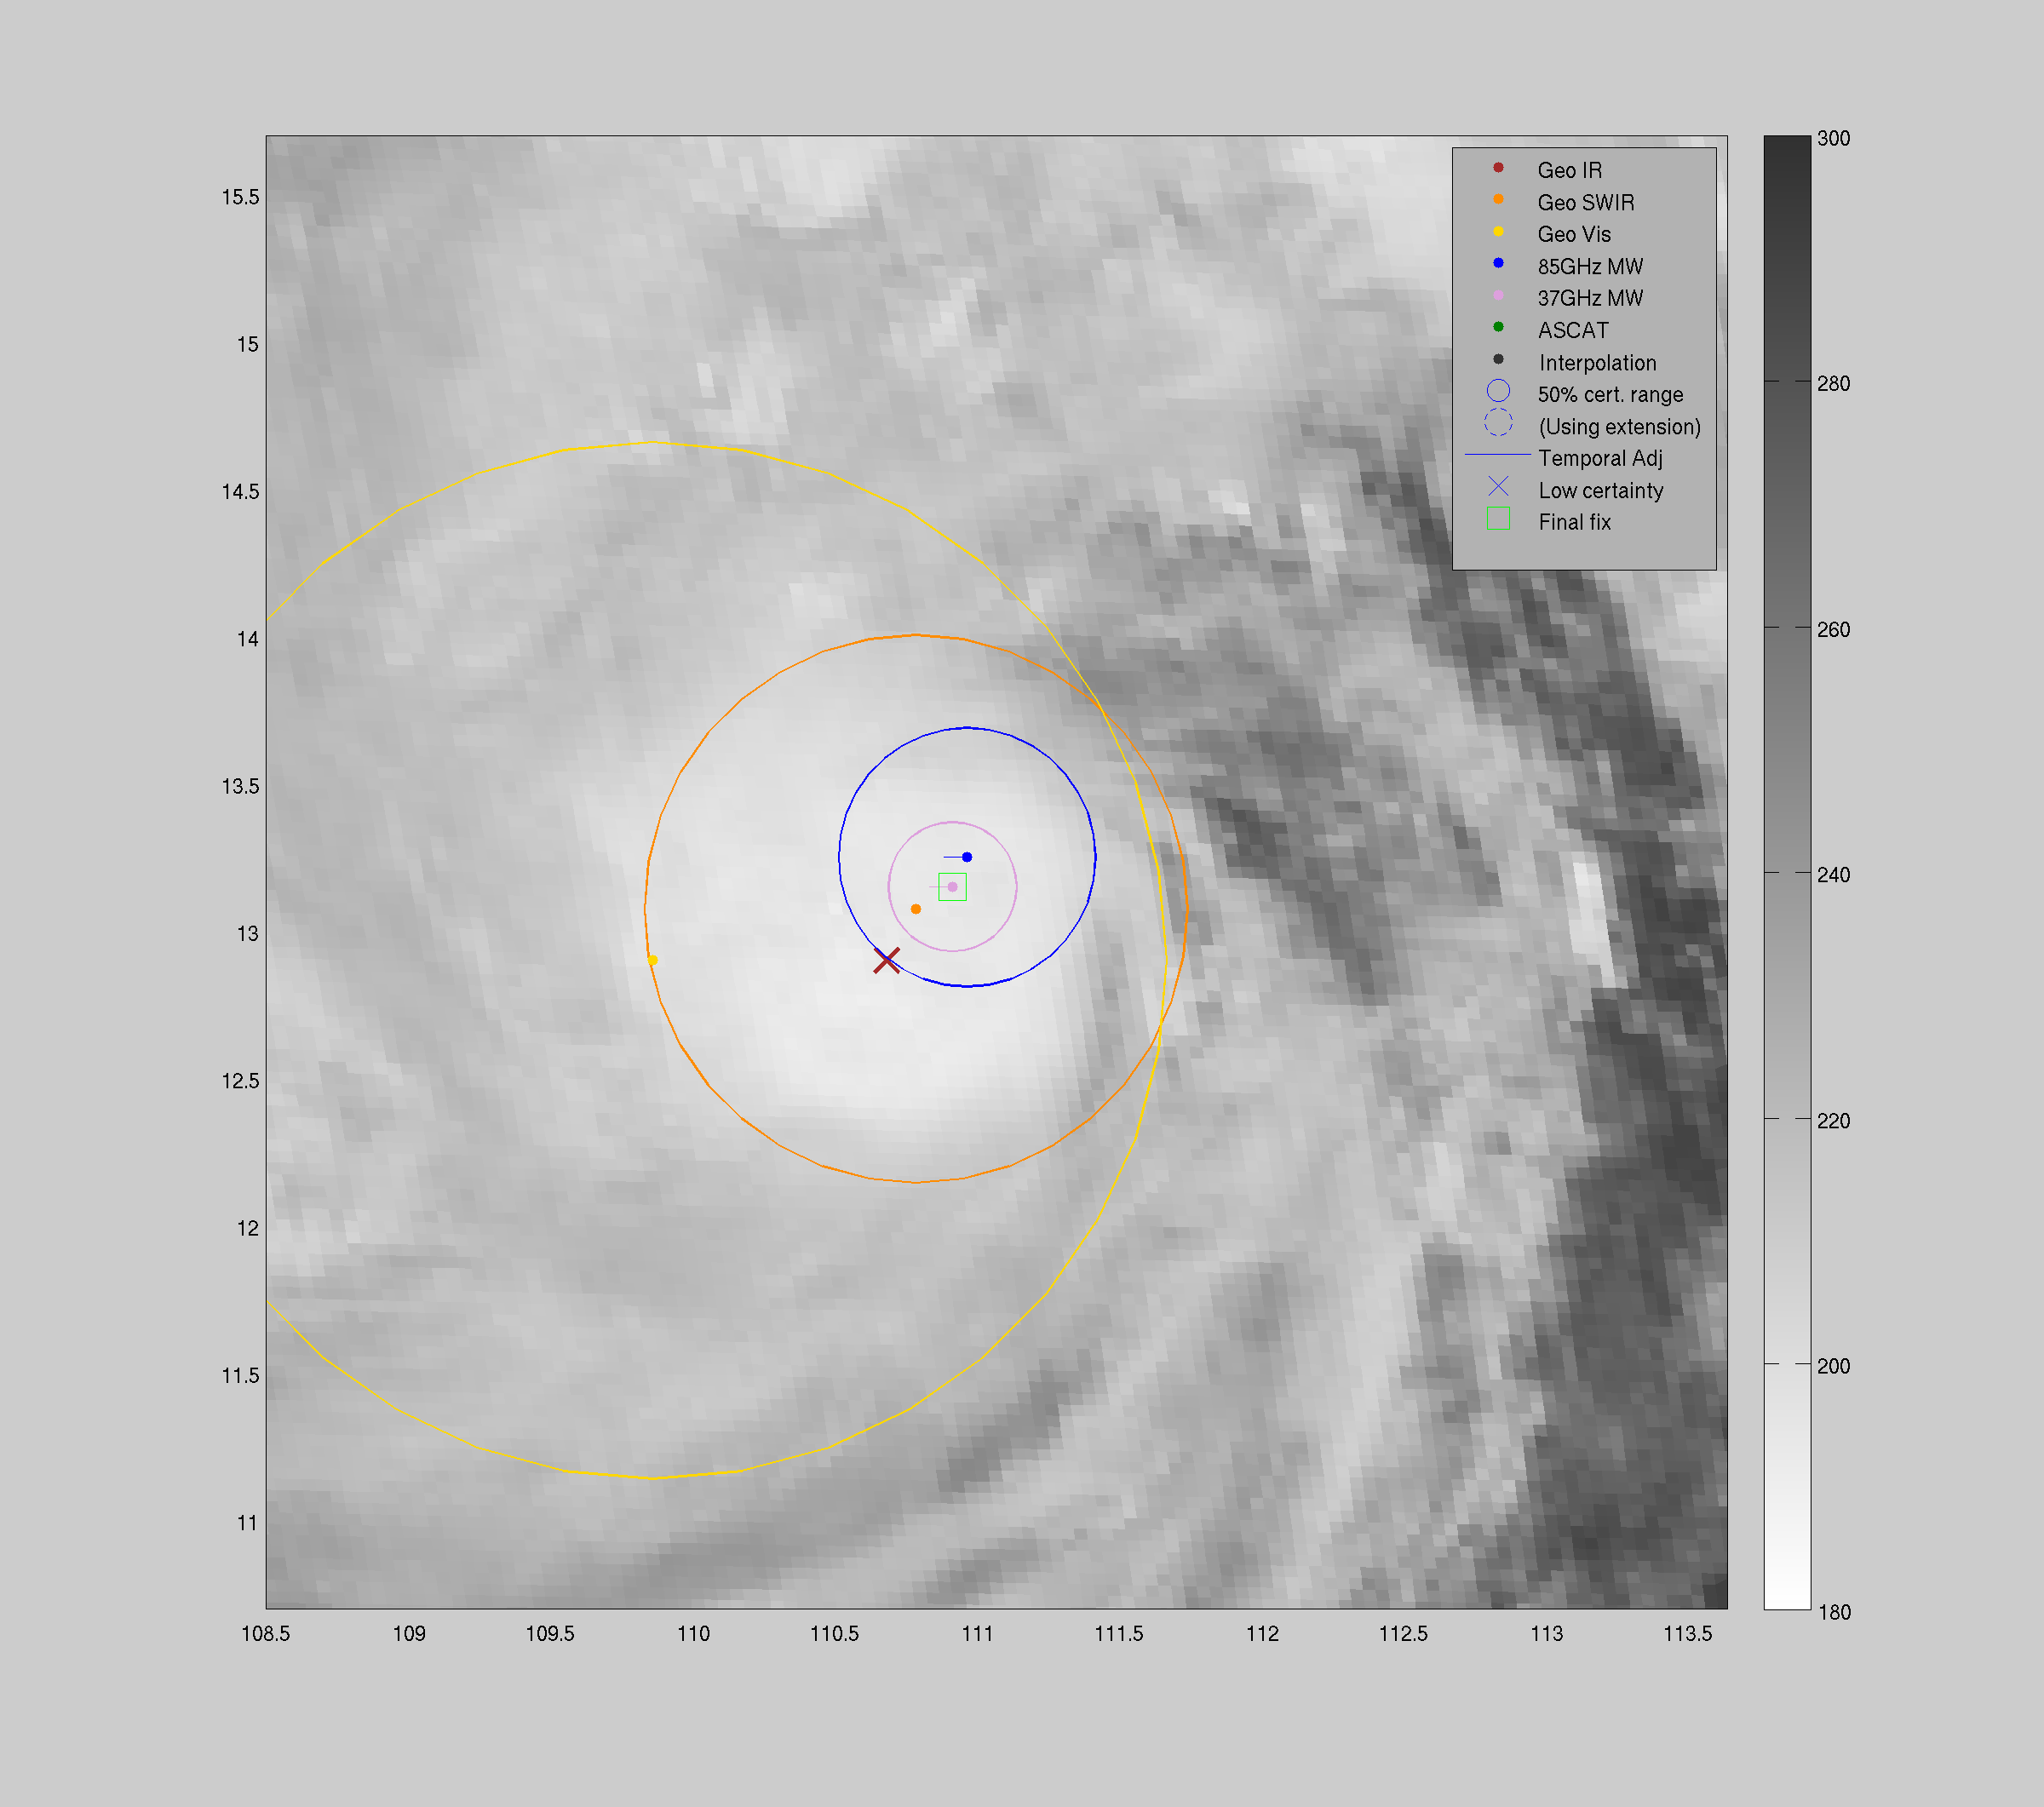
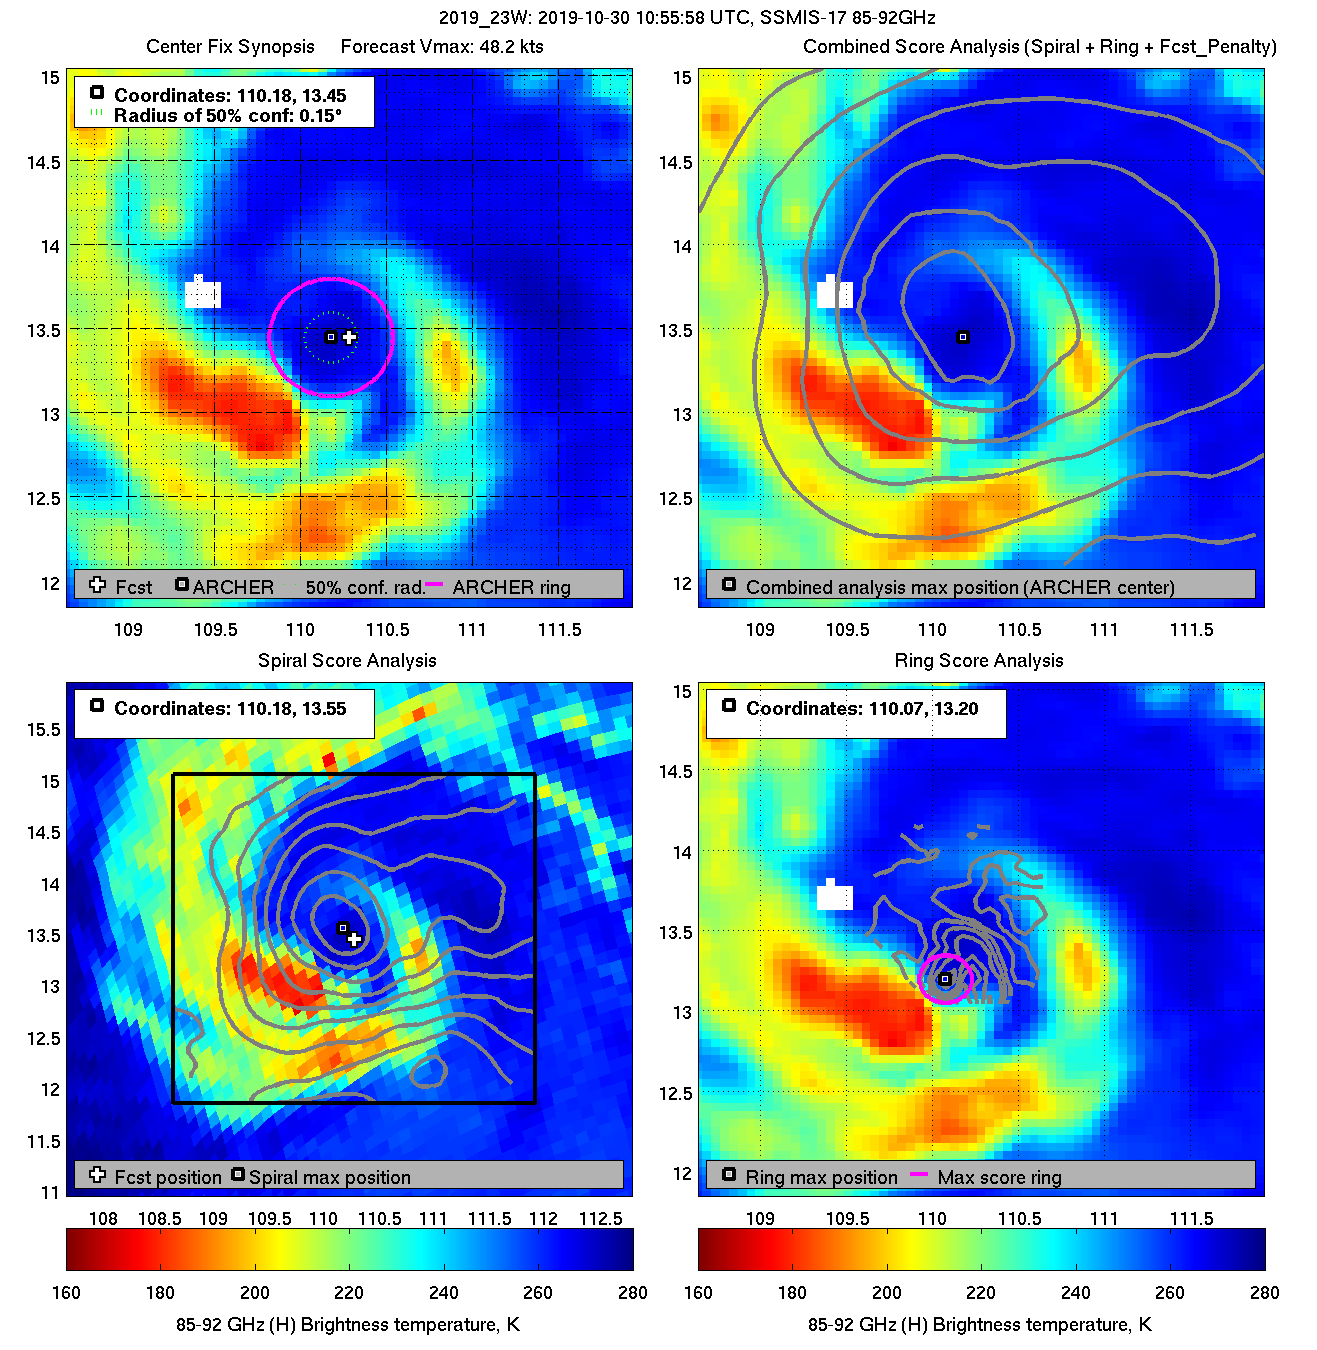
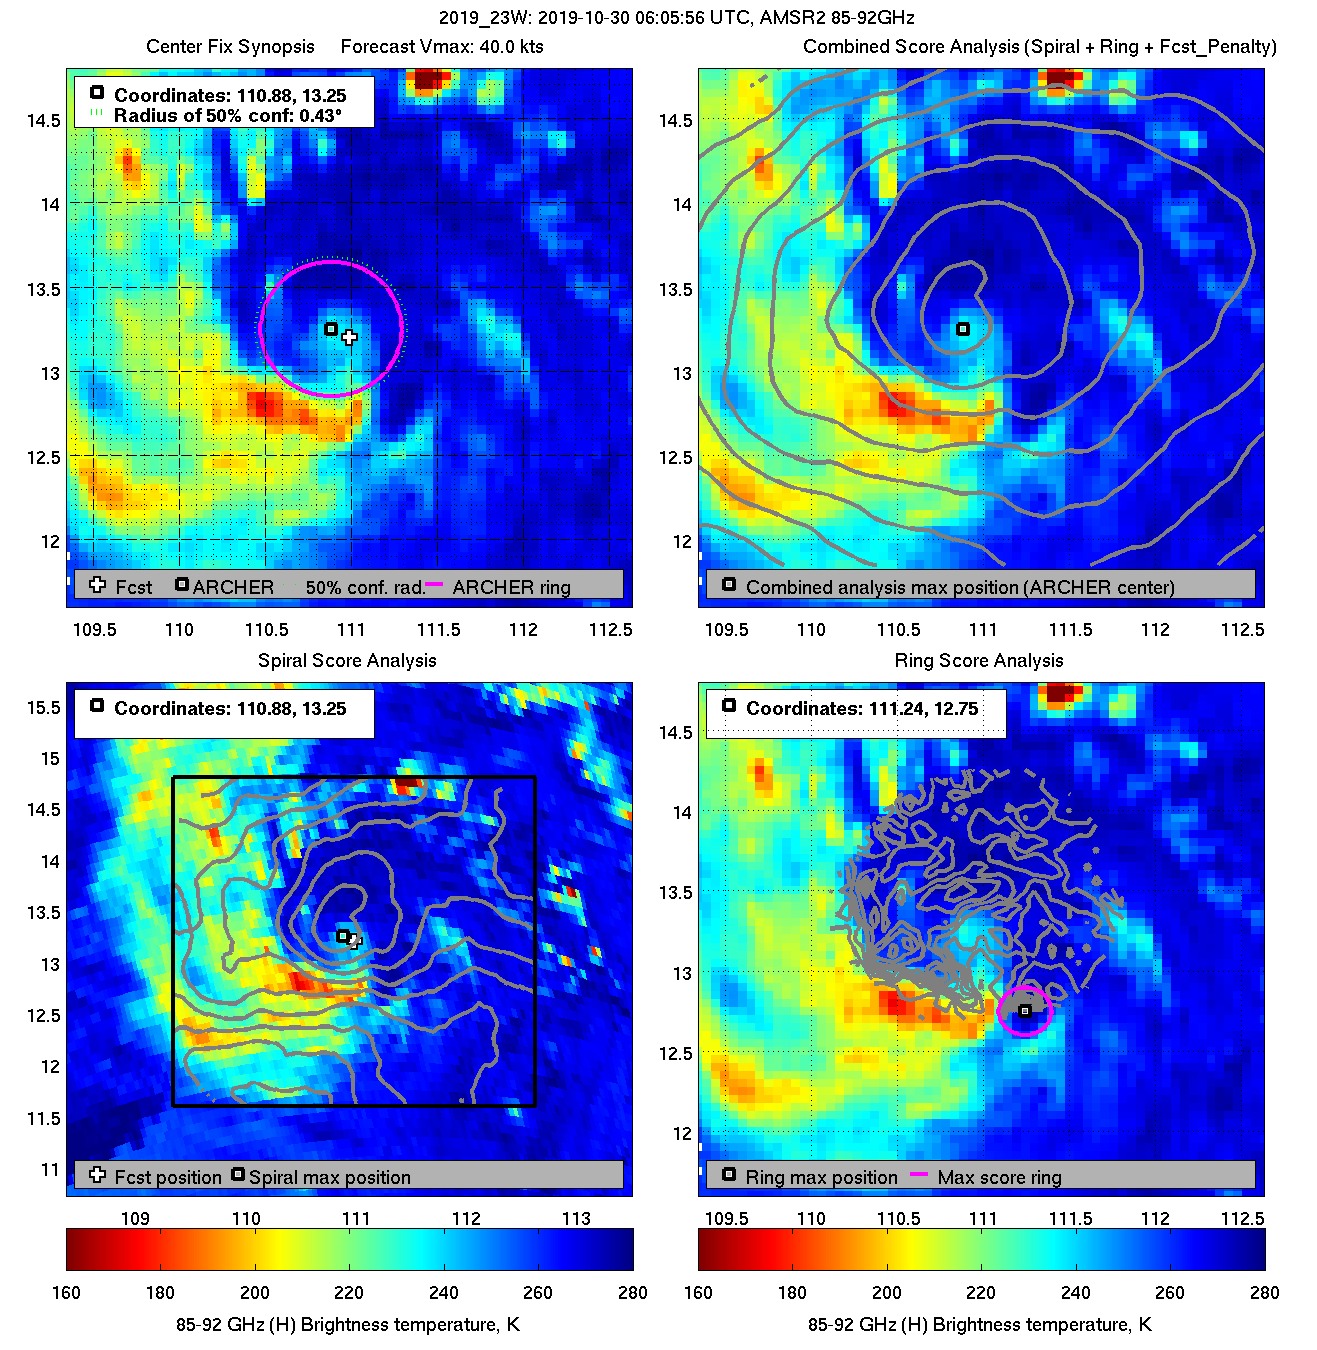
| 20191030 10:55:58 * |
SSMIS-17 |
85-92GHz |
48.2 |
13.45 |
110.18 |
13.47 |
110.08 |
0.15 |
0.41 |
0.70 |
81.4 |
|
|
|
 |
 |
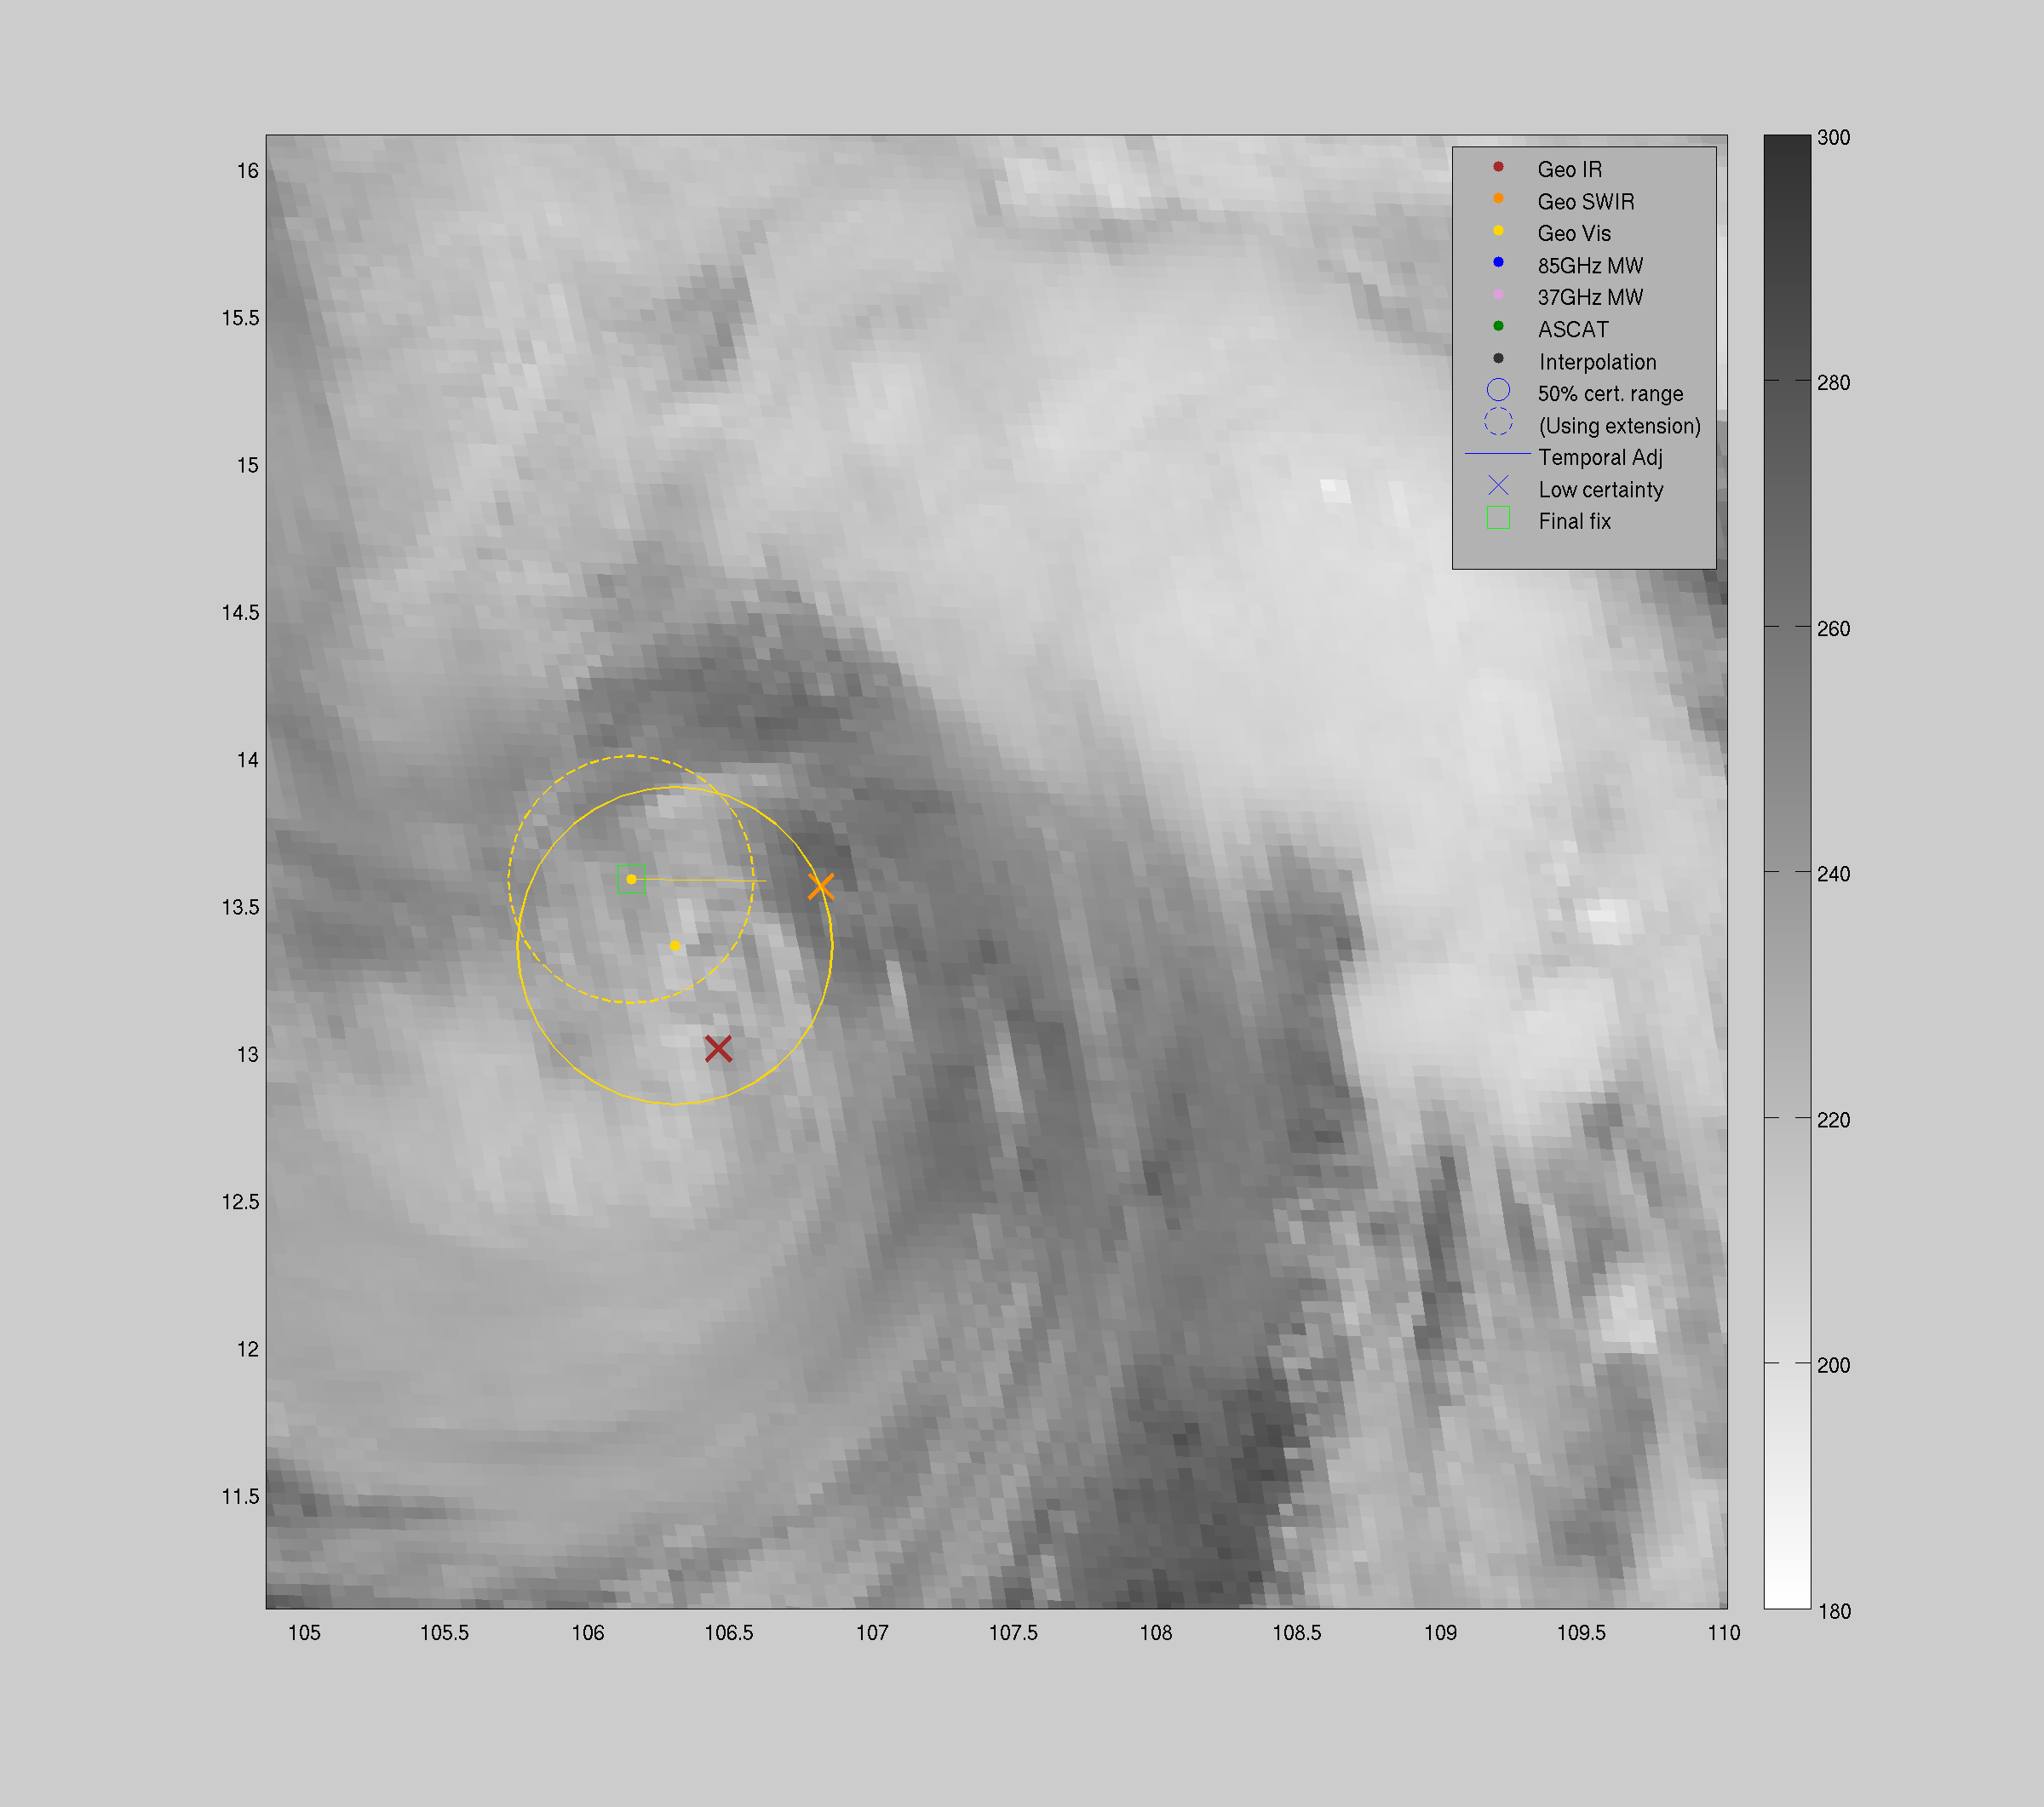
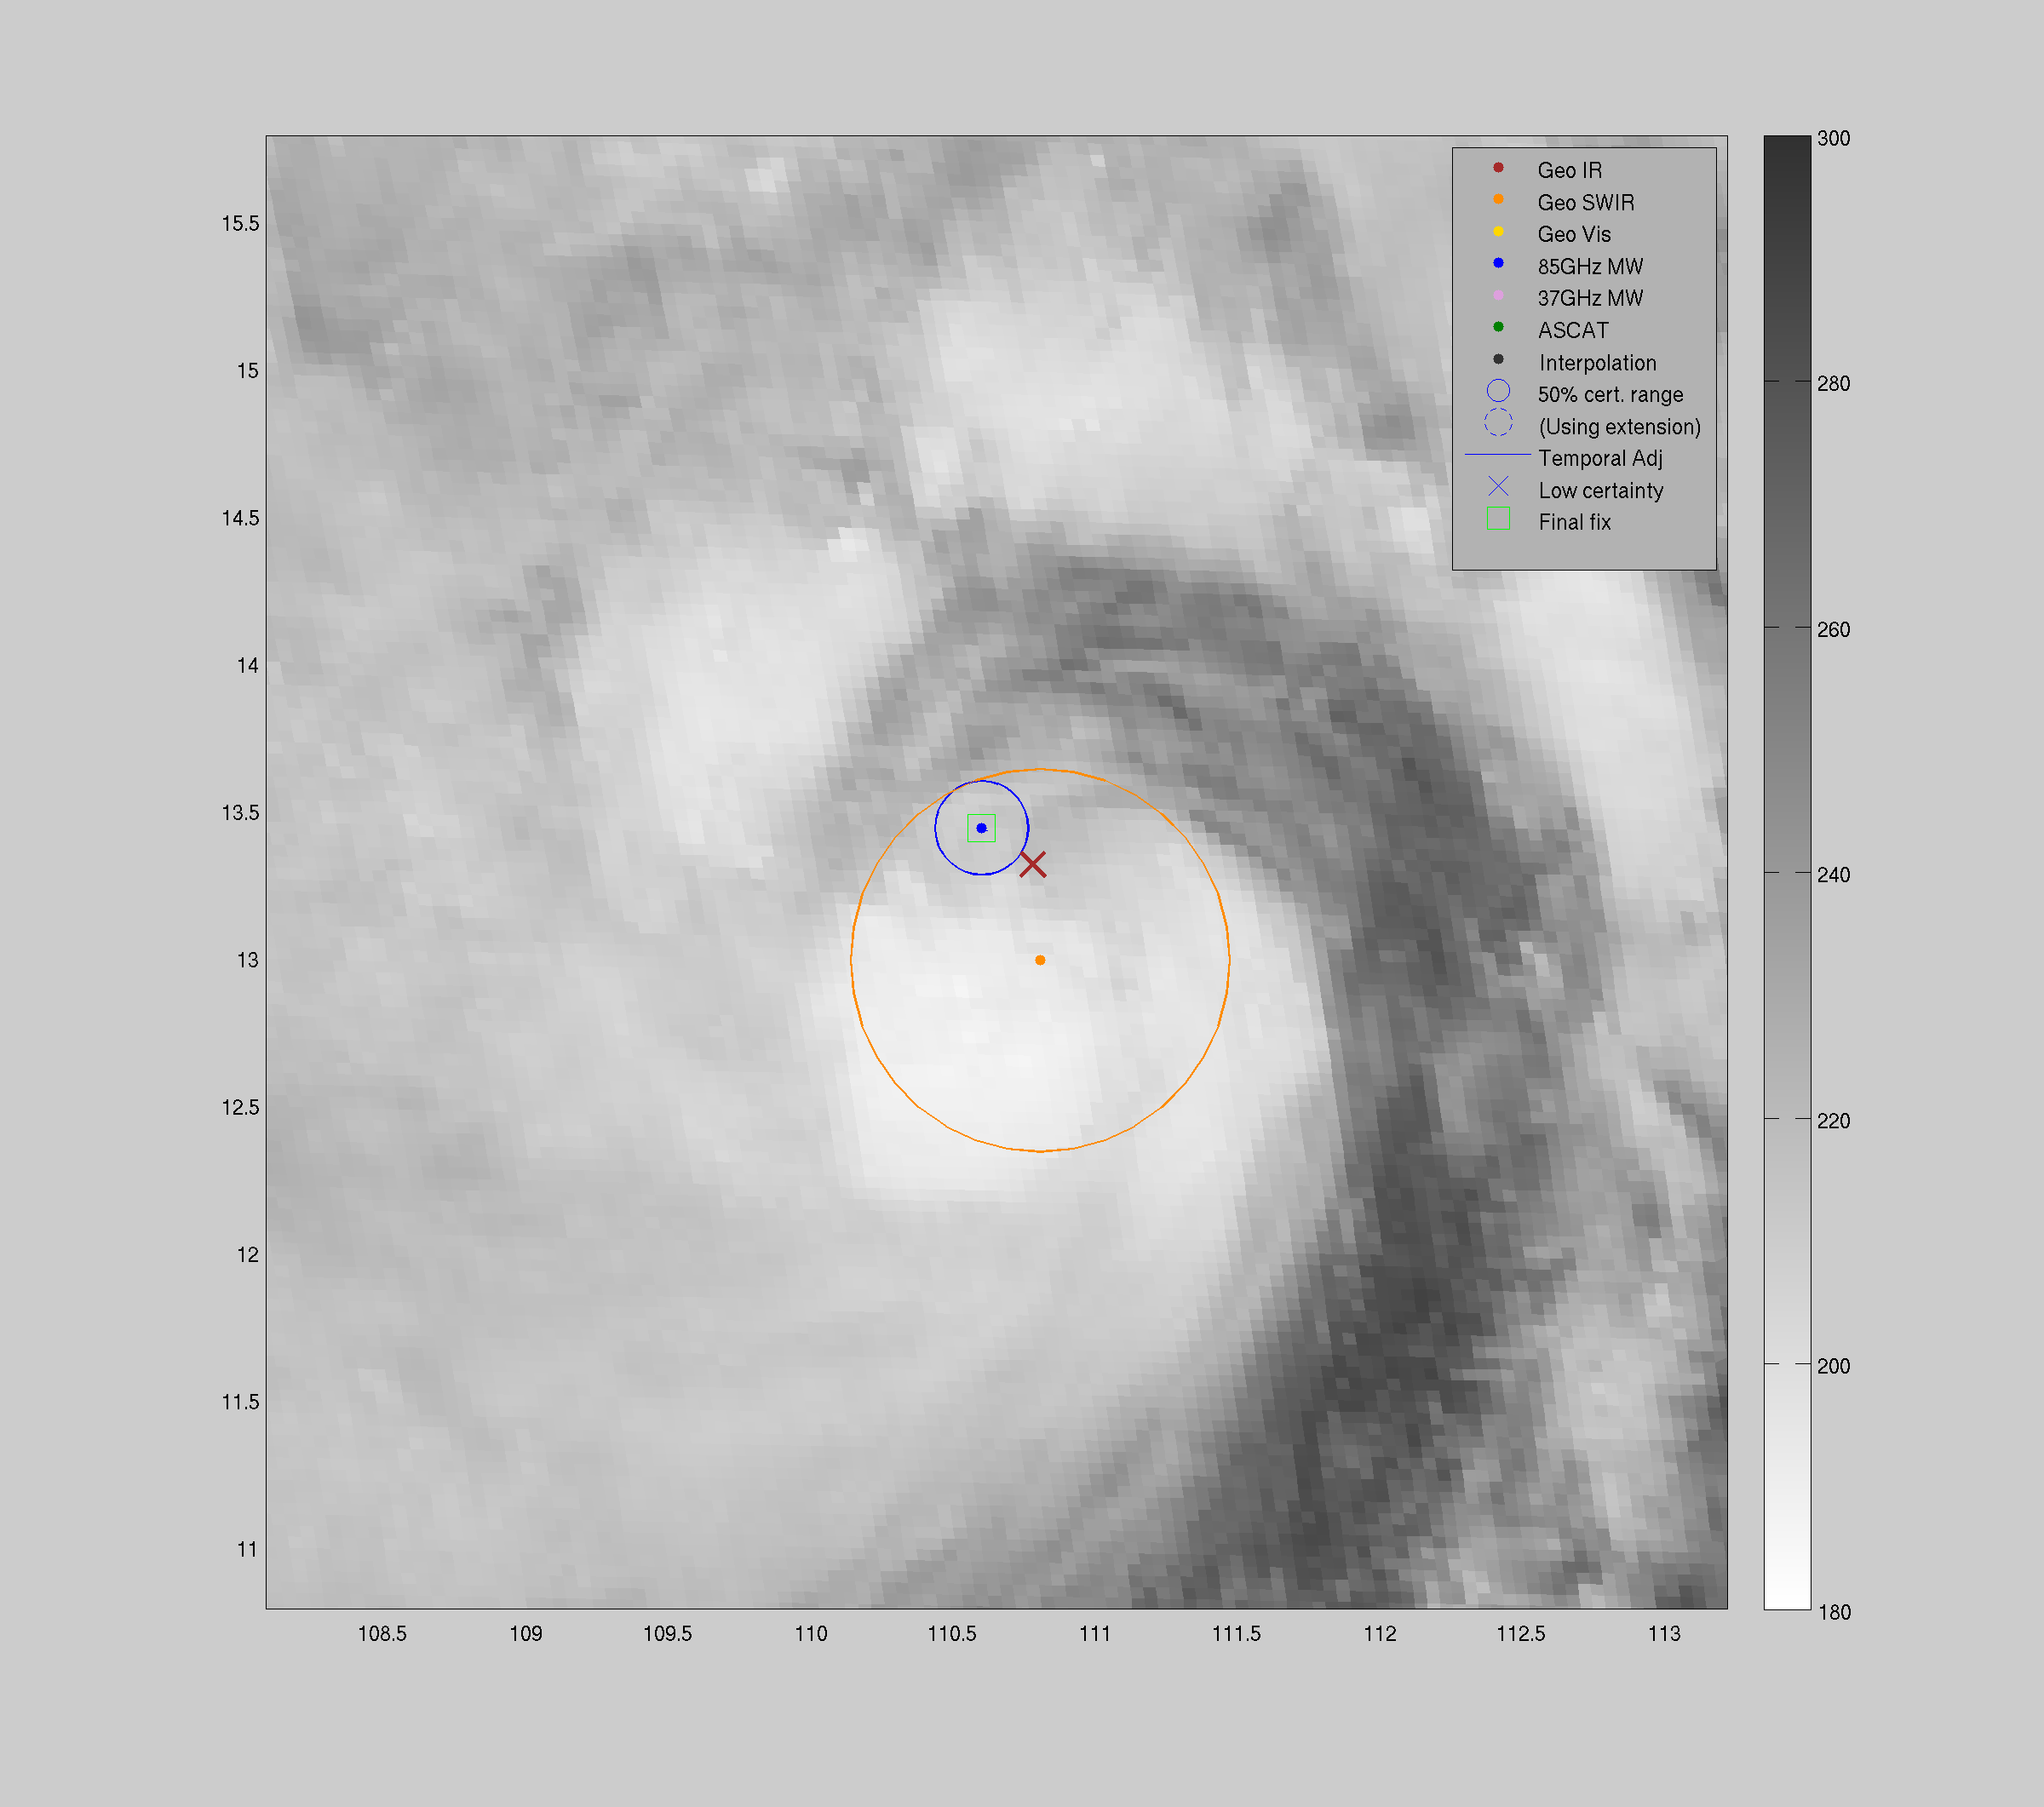
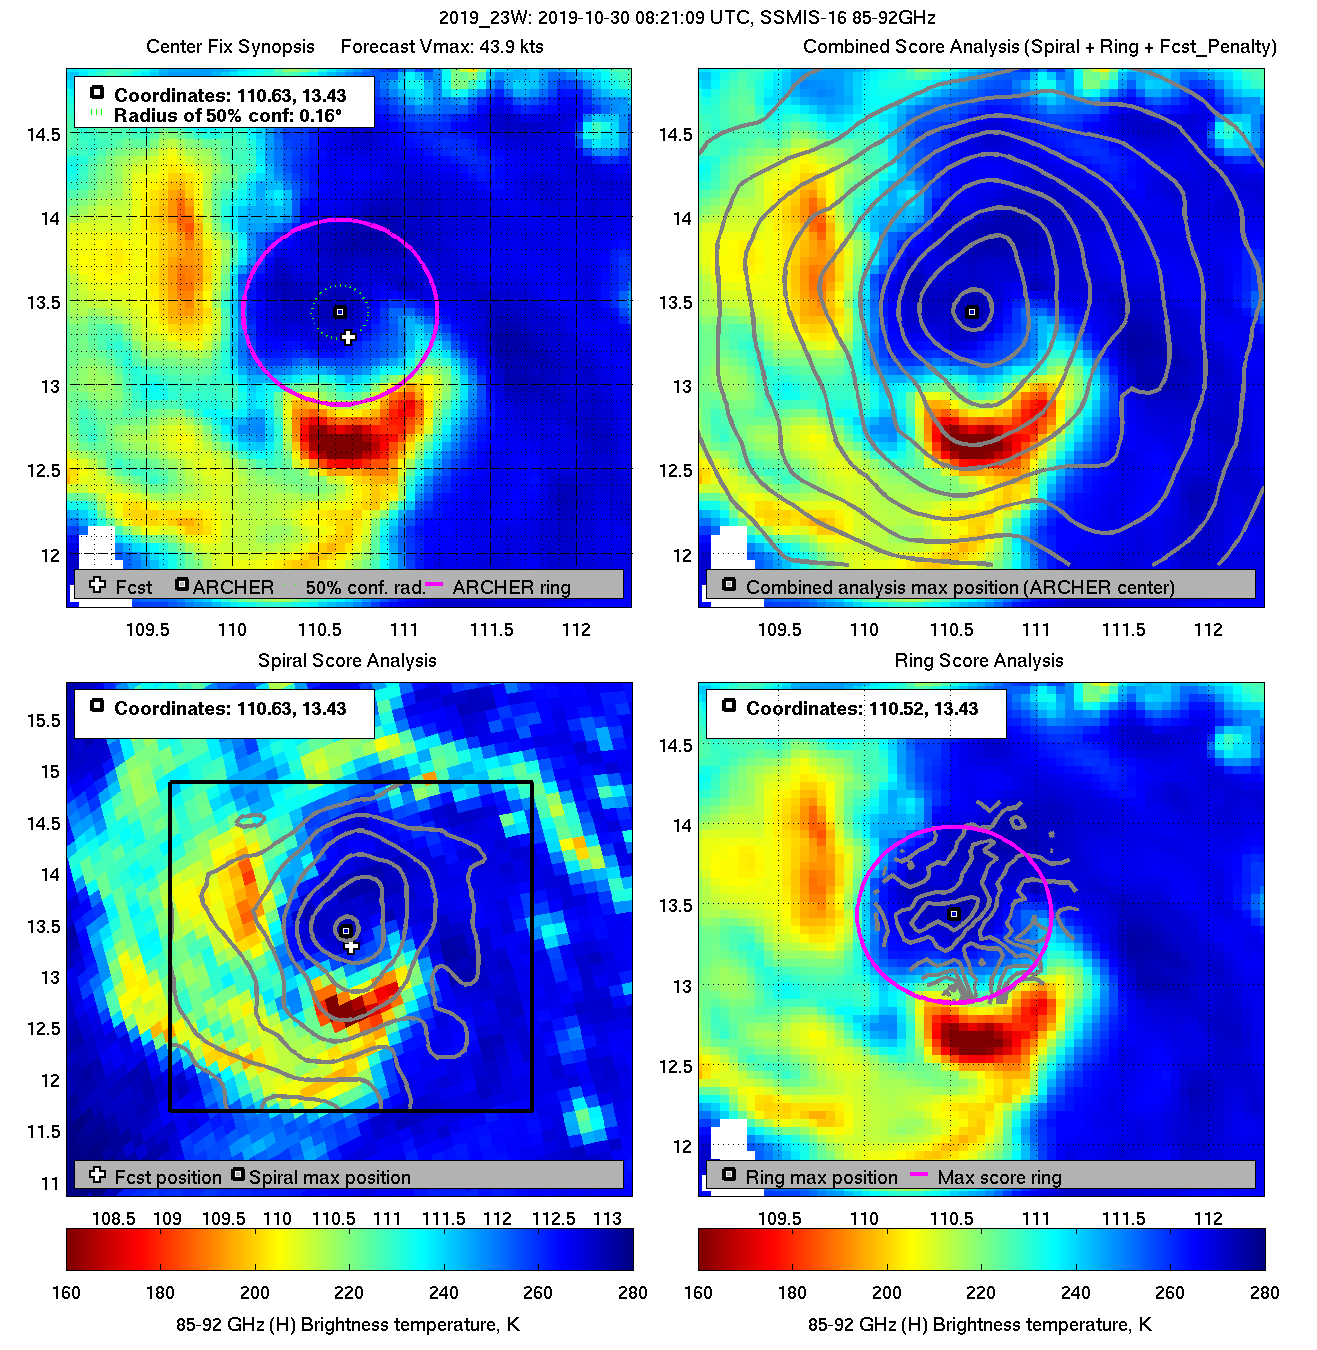
| 20191030 08:21:09 * |
SSMIS-16 |
85-92GHz |
43.9 |
13.43 |
110.63 |
13.44 |
110.60 |
0.16 |
0.46 |
1.10 |
69.9 |
|
|
|
 |
 |
|
|
|
 |
 |
|
|
|
 |
 |
|
|
|
 |
 |
|
|
|
 |
 |
|


