Return to Front Page
____________________
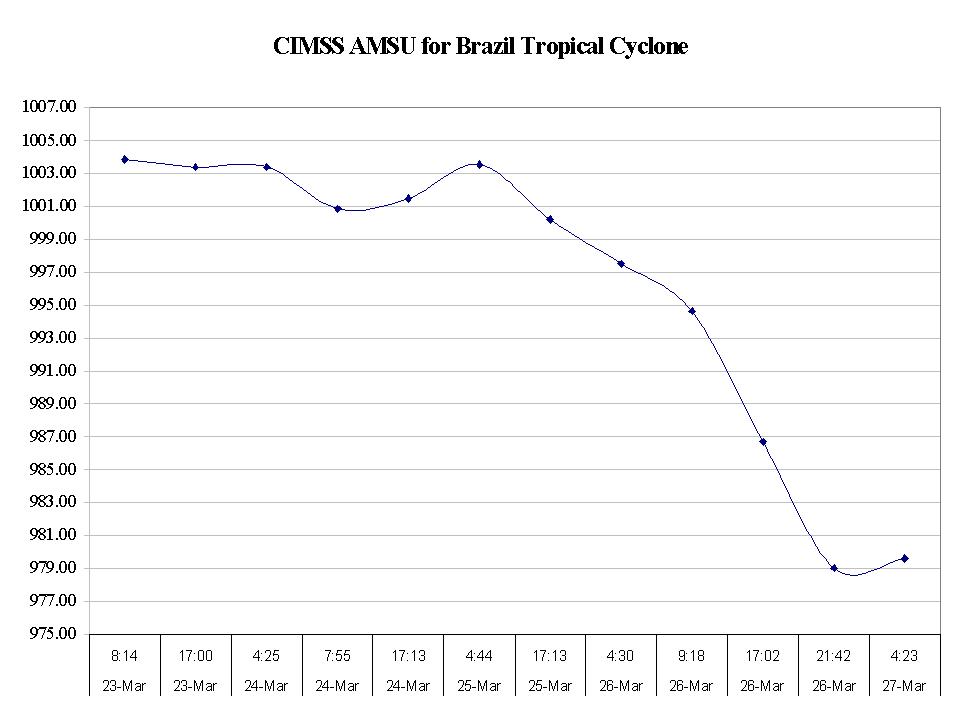
Hurricane Catarina
(a.k.a. Brazilian Tropical Cyclone)
(Courtesy UW-CIMSS TC Group)
Satellite Products
AODT
AMSU
Time Series Graph
History File Listing
AMSU Mosaic
AMSU MSLP Graph
Satellite Winds
Satellite Movies
Upper Level Winds
March 24/1800UTC
March 25/1800UTC
March 26/1800UTC
March 27/1800UTC
March 28/1800UTC
Lower Level Winds
March 24/1800UTC
March 25/1800UTC
March 27/1800UTC
March 28/1800UTC
Water Vapor :
JAVA
|
FLI
Enhanced Infrared :
JAVA
|
FLI
GOES-12 and MET-8 Visible
(courtesy CIMSS/Scott Bachmeier)
Infrared/Visible
(courtesy NOAA/NESDIS/ORA and
CIMSS Fire Group)
Visible and Infrared
(courtesy NOAA/SSD)
Infrared
(courtesy NASA/GSFC)
Enhanced Infrared
(courtesy NOAA/NCDC)
Visible and Infrared
(courtesy CIRA/Ray Zehr)
Microwave Products
(courtesy NRL-Monterey/Jeff Hawkins)
Scatterometer Products
(courtesy Univ. of Guam/Roger Edson)
SSMI and TRMM
click on "ALL" in top-left
corner and select "01L.NONAME"
Wind Fields
MODIS Imagery
DMSP Imagery
(courtesy NASA/GSFC)
March 26/13:10UTC
March 27/13:55UTC
March 27/16:30UTC
March 27
(courtesy AFWA/Paul McCrone)
March 25/11:03UTC
- Visible
March 25/11:03UTC
- 3-Channel
March 25/11:03UTC
- Infrared
March 25/09:37UTC
- Visible
March 25/09:37UTC
- 3-Channel
March 25/09:37UTC
- Infrared
March 26/01:11UTC
- Night-Visible
March 26/01:11UTC
- Infrared
March 26/12:28UTC
- 3-Channel
March 26/12:28UTC
- Visible
Intensity Information
Synoptic Discussion
Working Best Track
(courtesy Anteon Corp./Roger Edson)
Text Listing
Excel File
Intensity Timelines
Text Listing
(courtesy NOAA/SAB)
Text Listing
Track Plot
(courtesy AFWA/Paul McCrone)
27 March 2004
(courtesy Lance Bosart)
Penn State Meteorology 241
Case Study
(courtesy Lee Grenci)