|
||

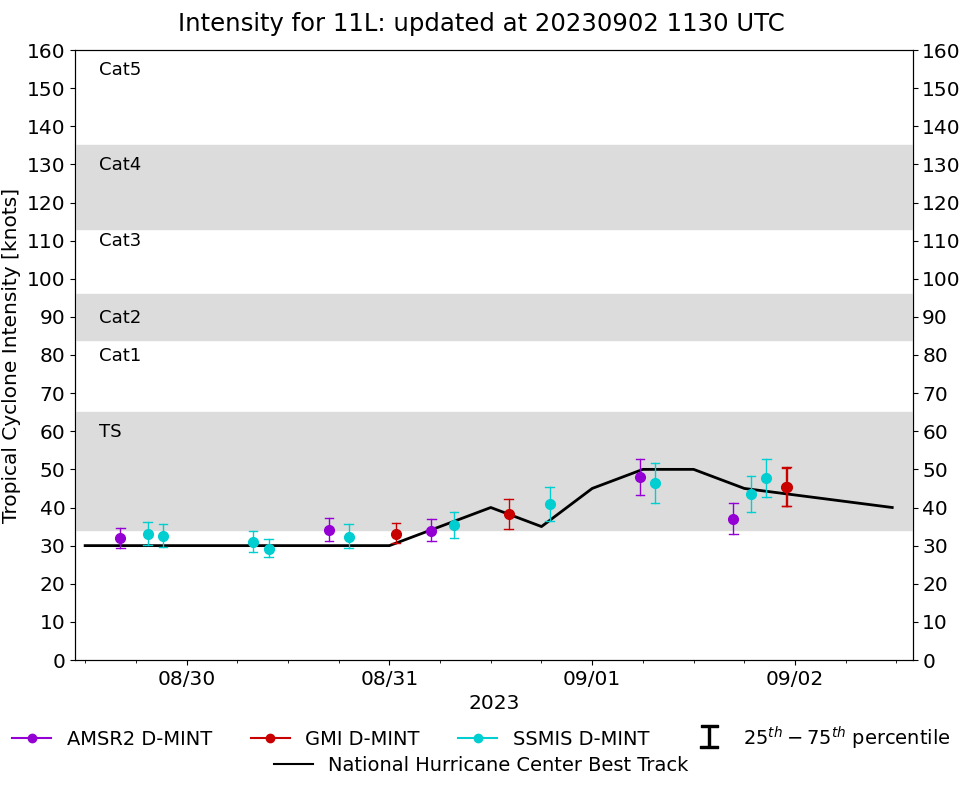 |
D-MINT HISTORY FILE for 2023_11L
| Date | Time | MW Sensor | MSLP | Vmax (30th-70th percentile average) | Vmax 25th percentile | Vmax 75th percentile | Image |
| 20230901 | 2300 UTC | GMI | 987 hPa | 45 kts | 40 kts | 51 kts | 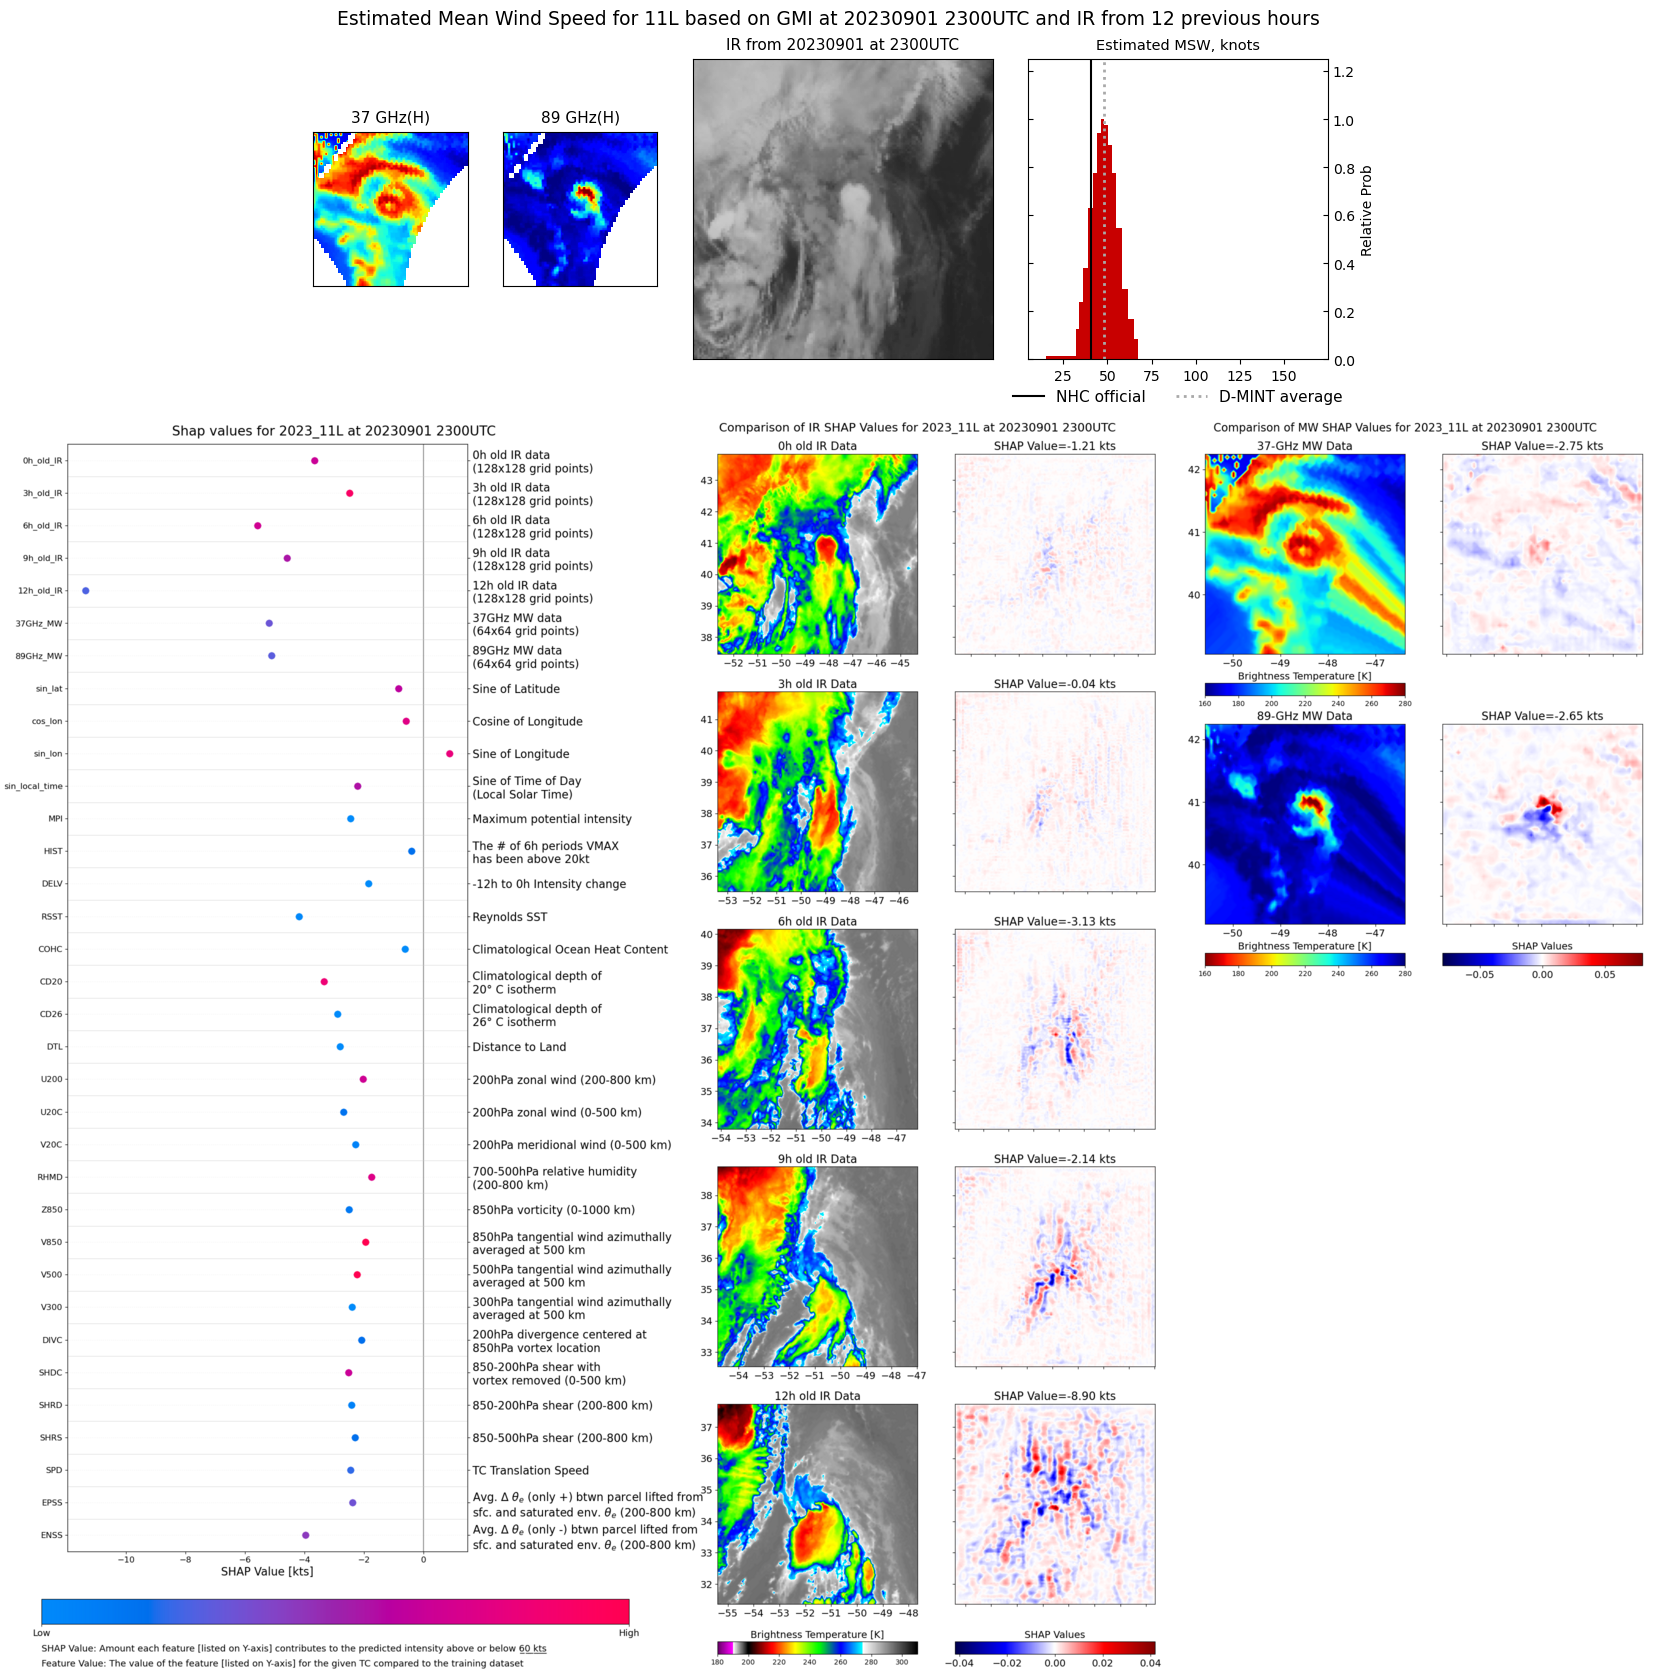 |
| 20230901 | 2256 UTC | GMI | 987 hPa | 45 kts | 40 kts | 50 kts | 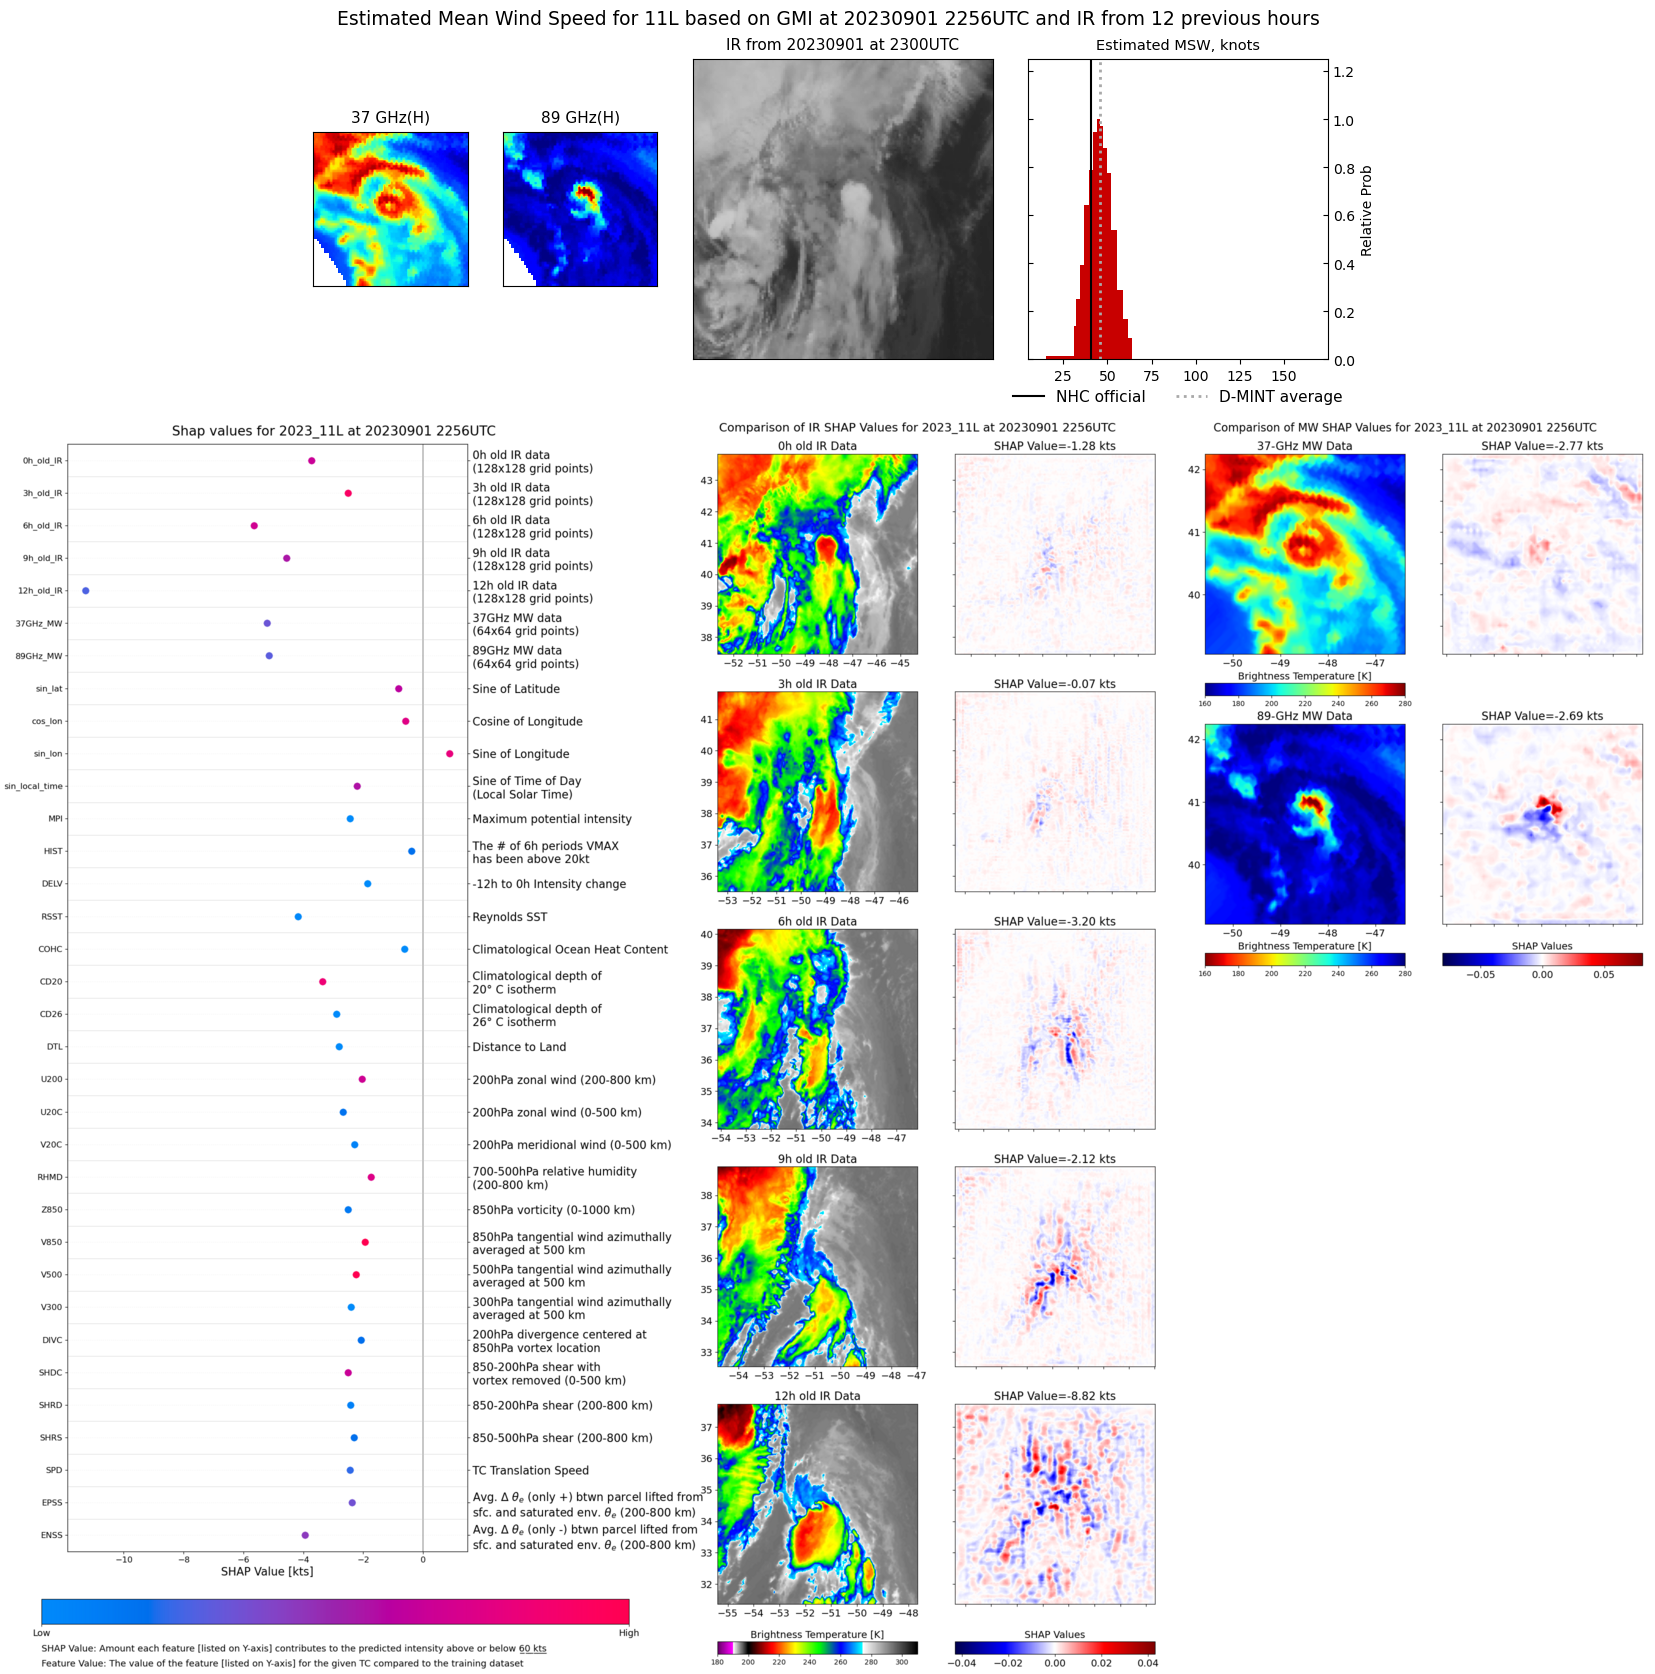 |
| 20230901 | 2037 UTC | SSMISF17 | 987 hPa | 48 kts | 43 kts | 53 kts | 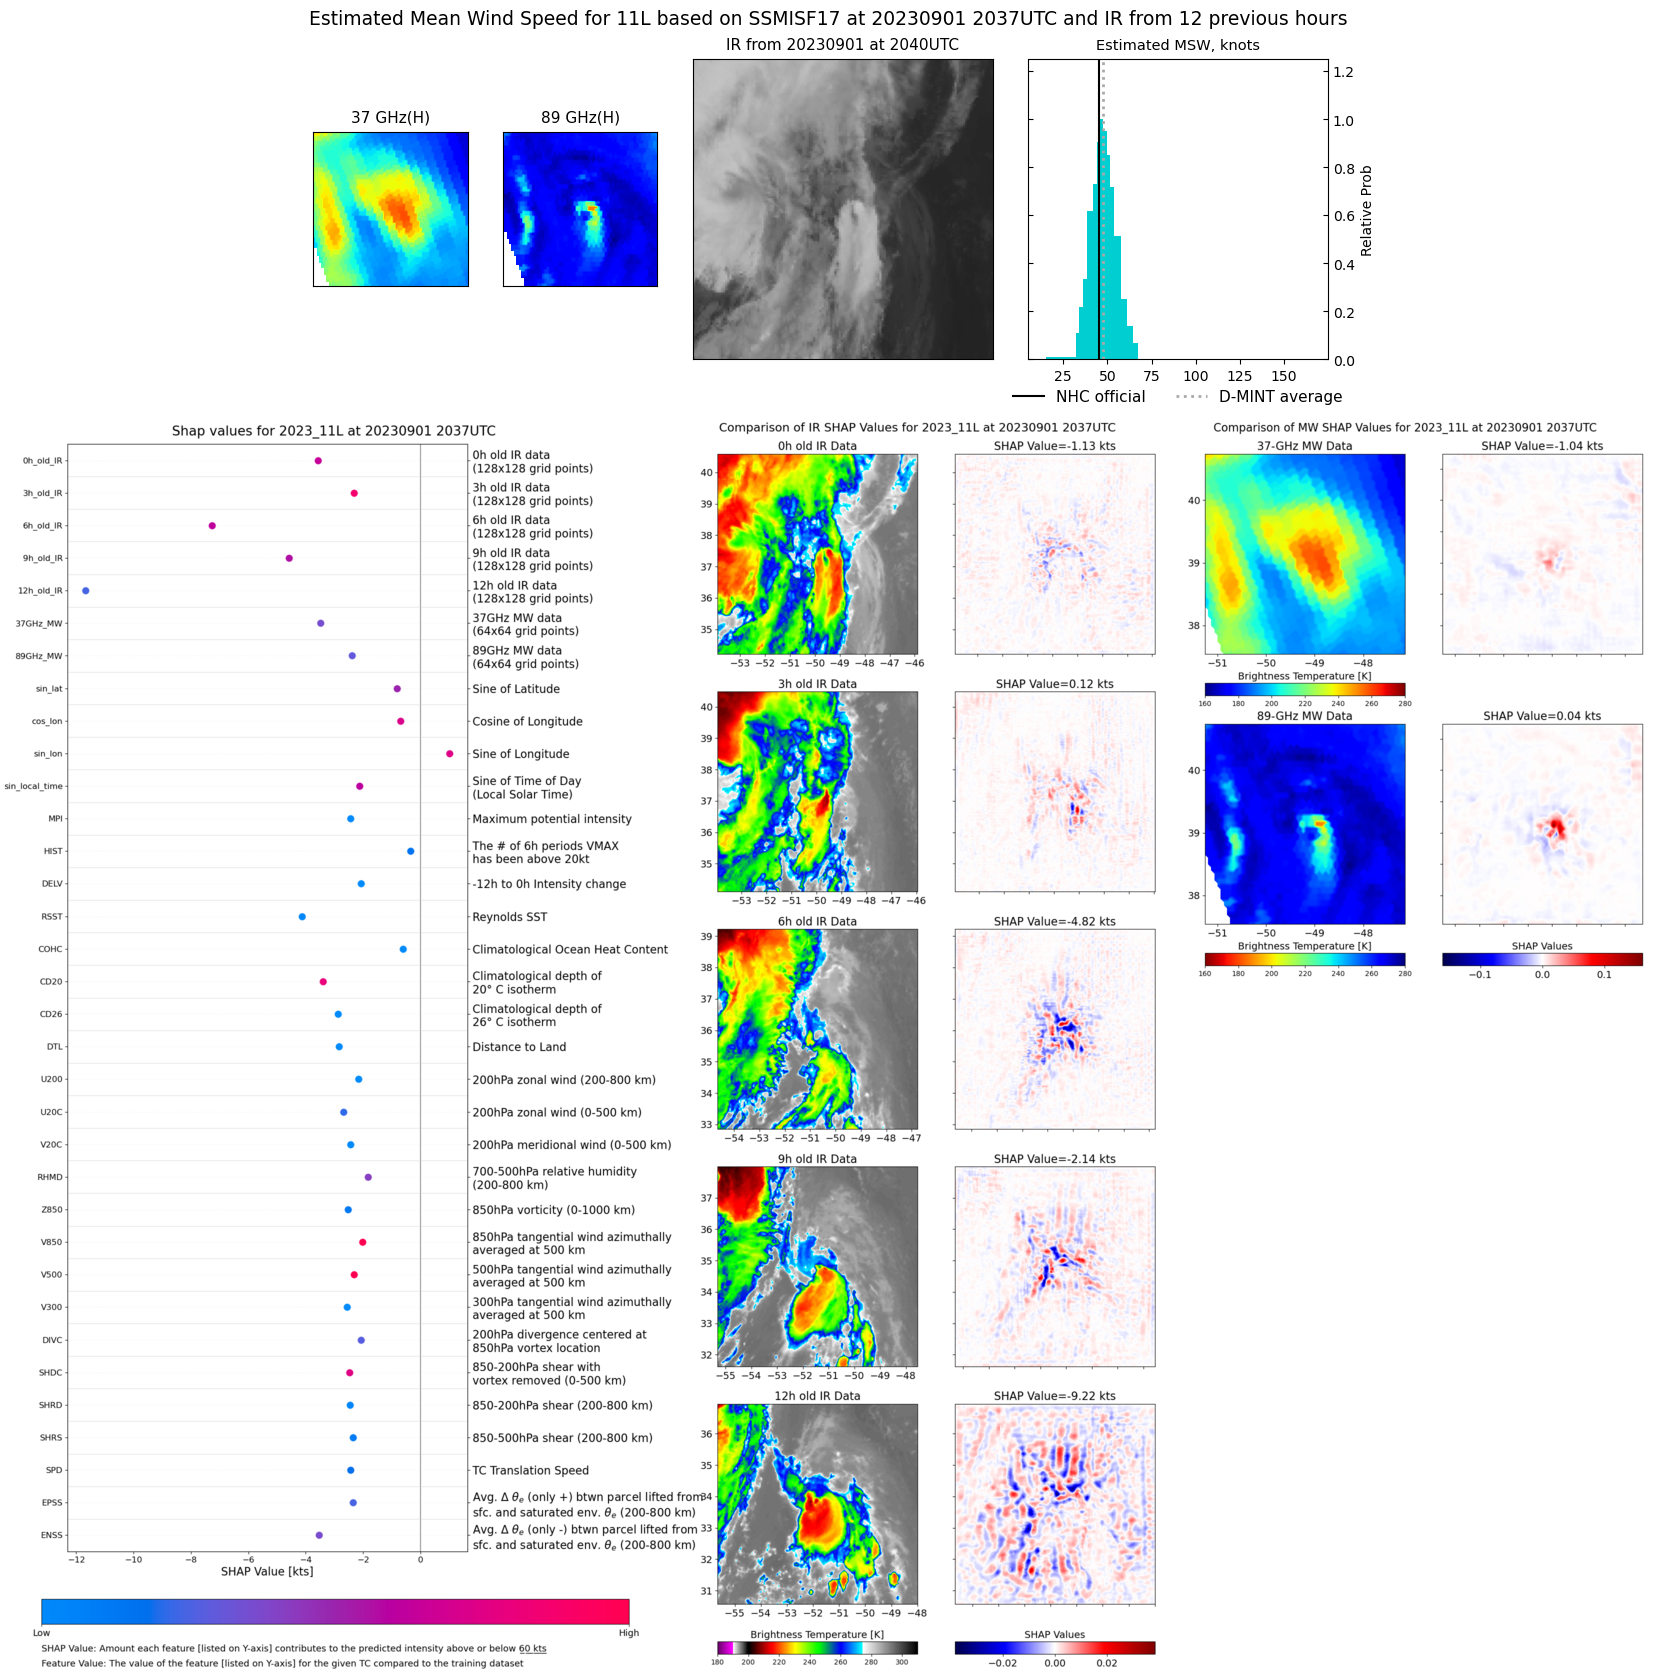 |
| 20230901 | 1846 UTC | SSMISF18 | 992 hPa | 43 kts | 39 kts | 48 kts | 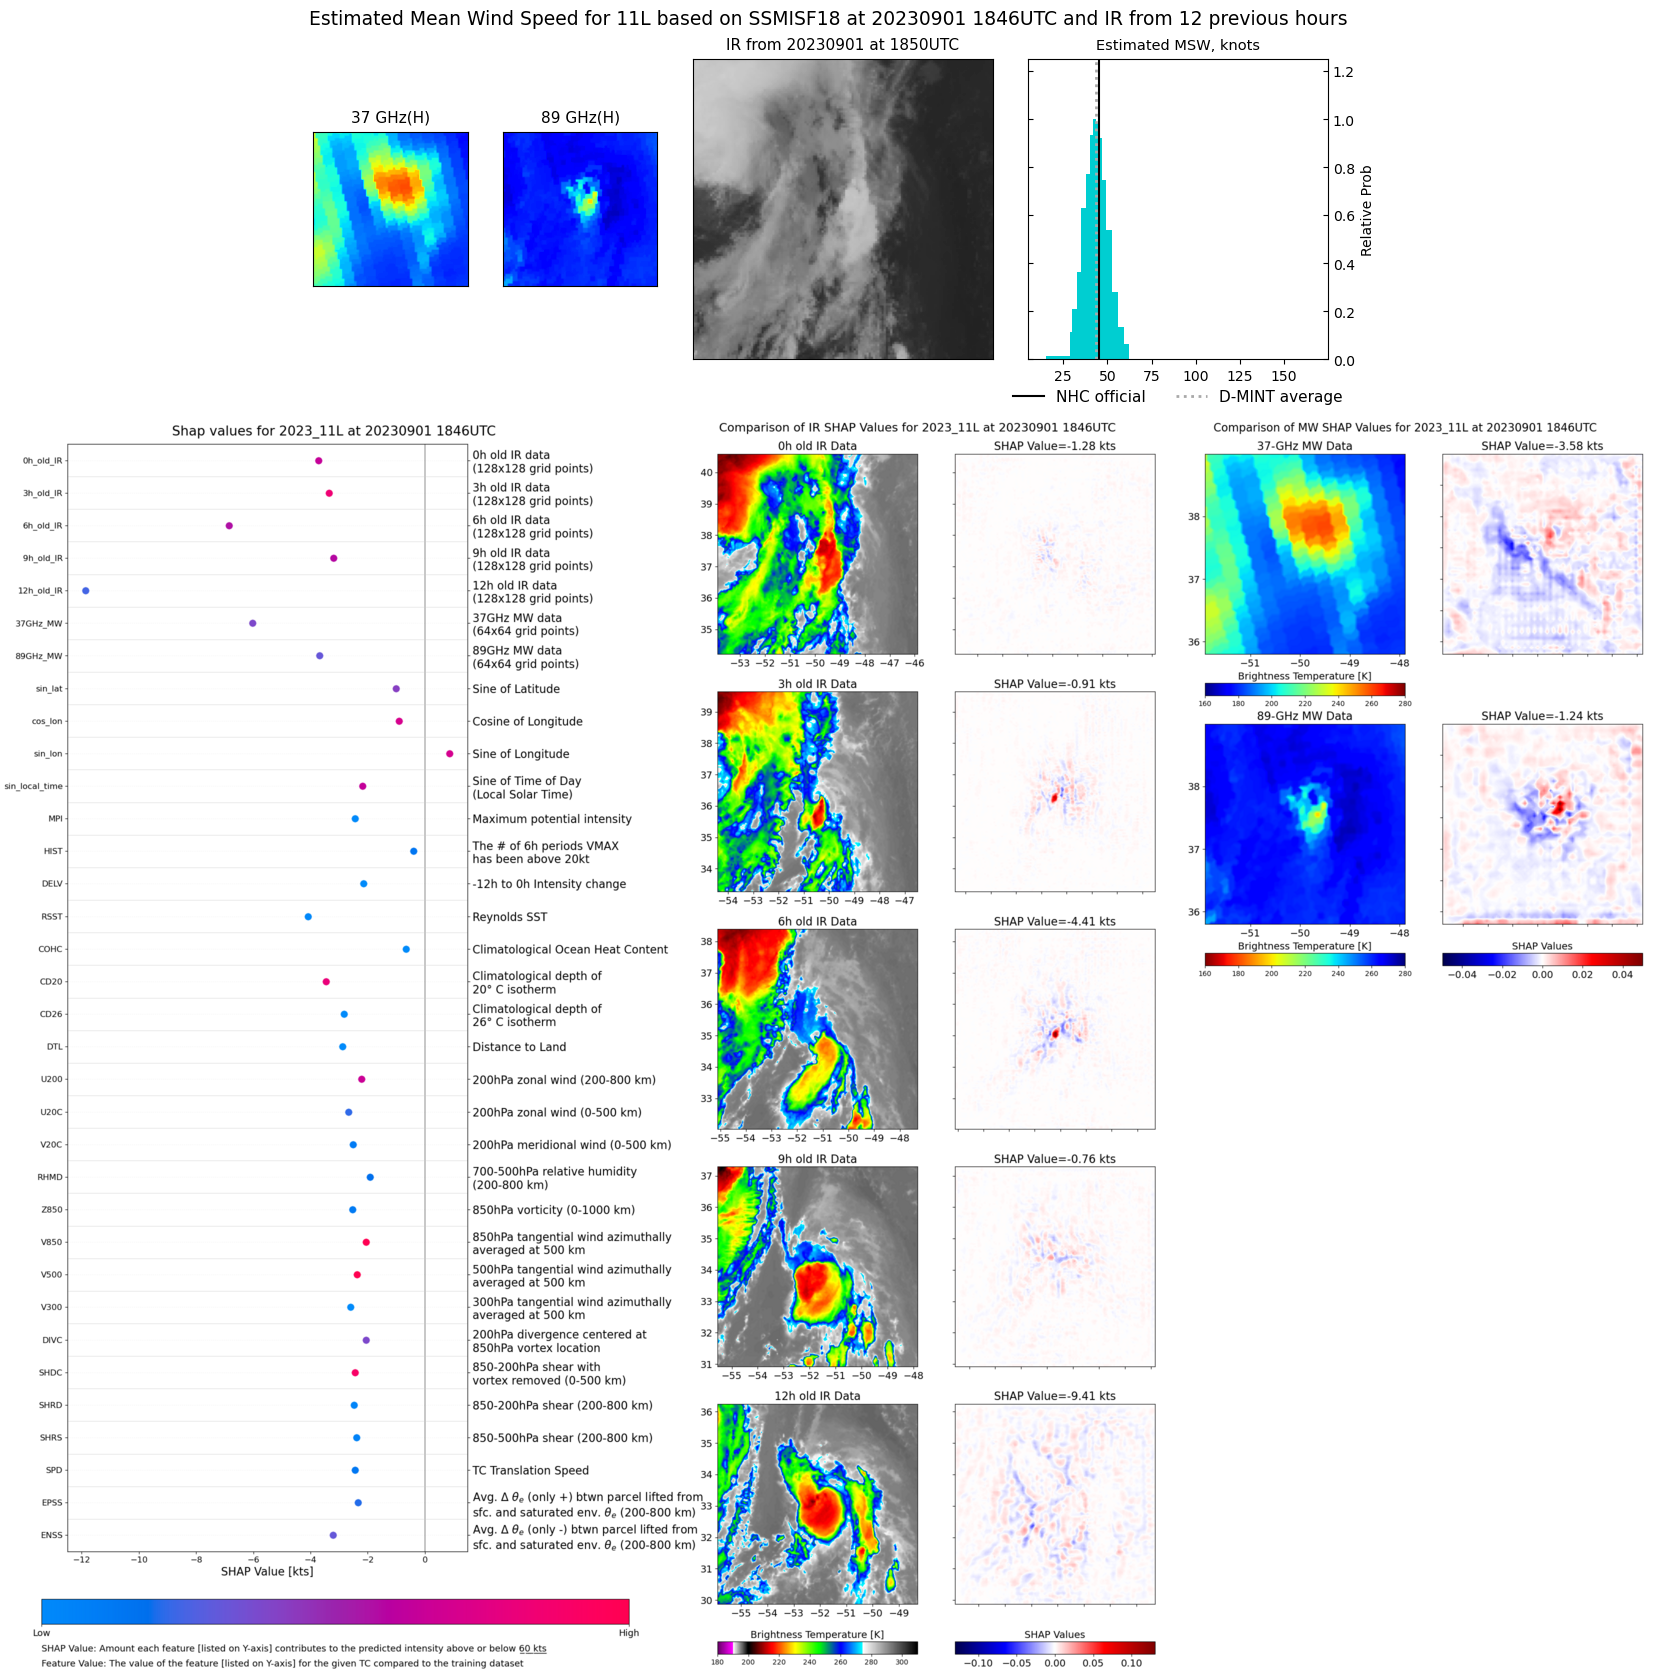 |
| 20230901 | 1642 UTC | AMSR2 | 996 hPa | 37 kts | 33 kts | 41 kts | 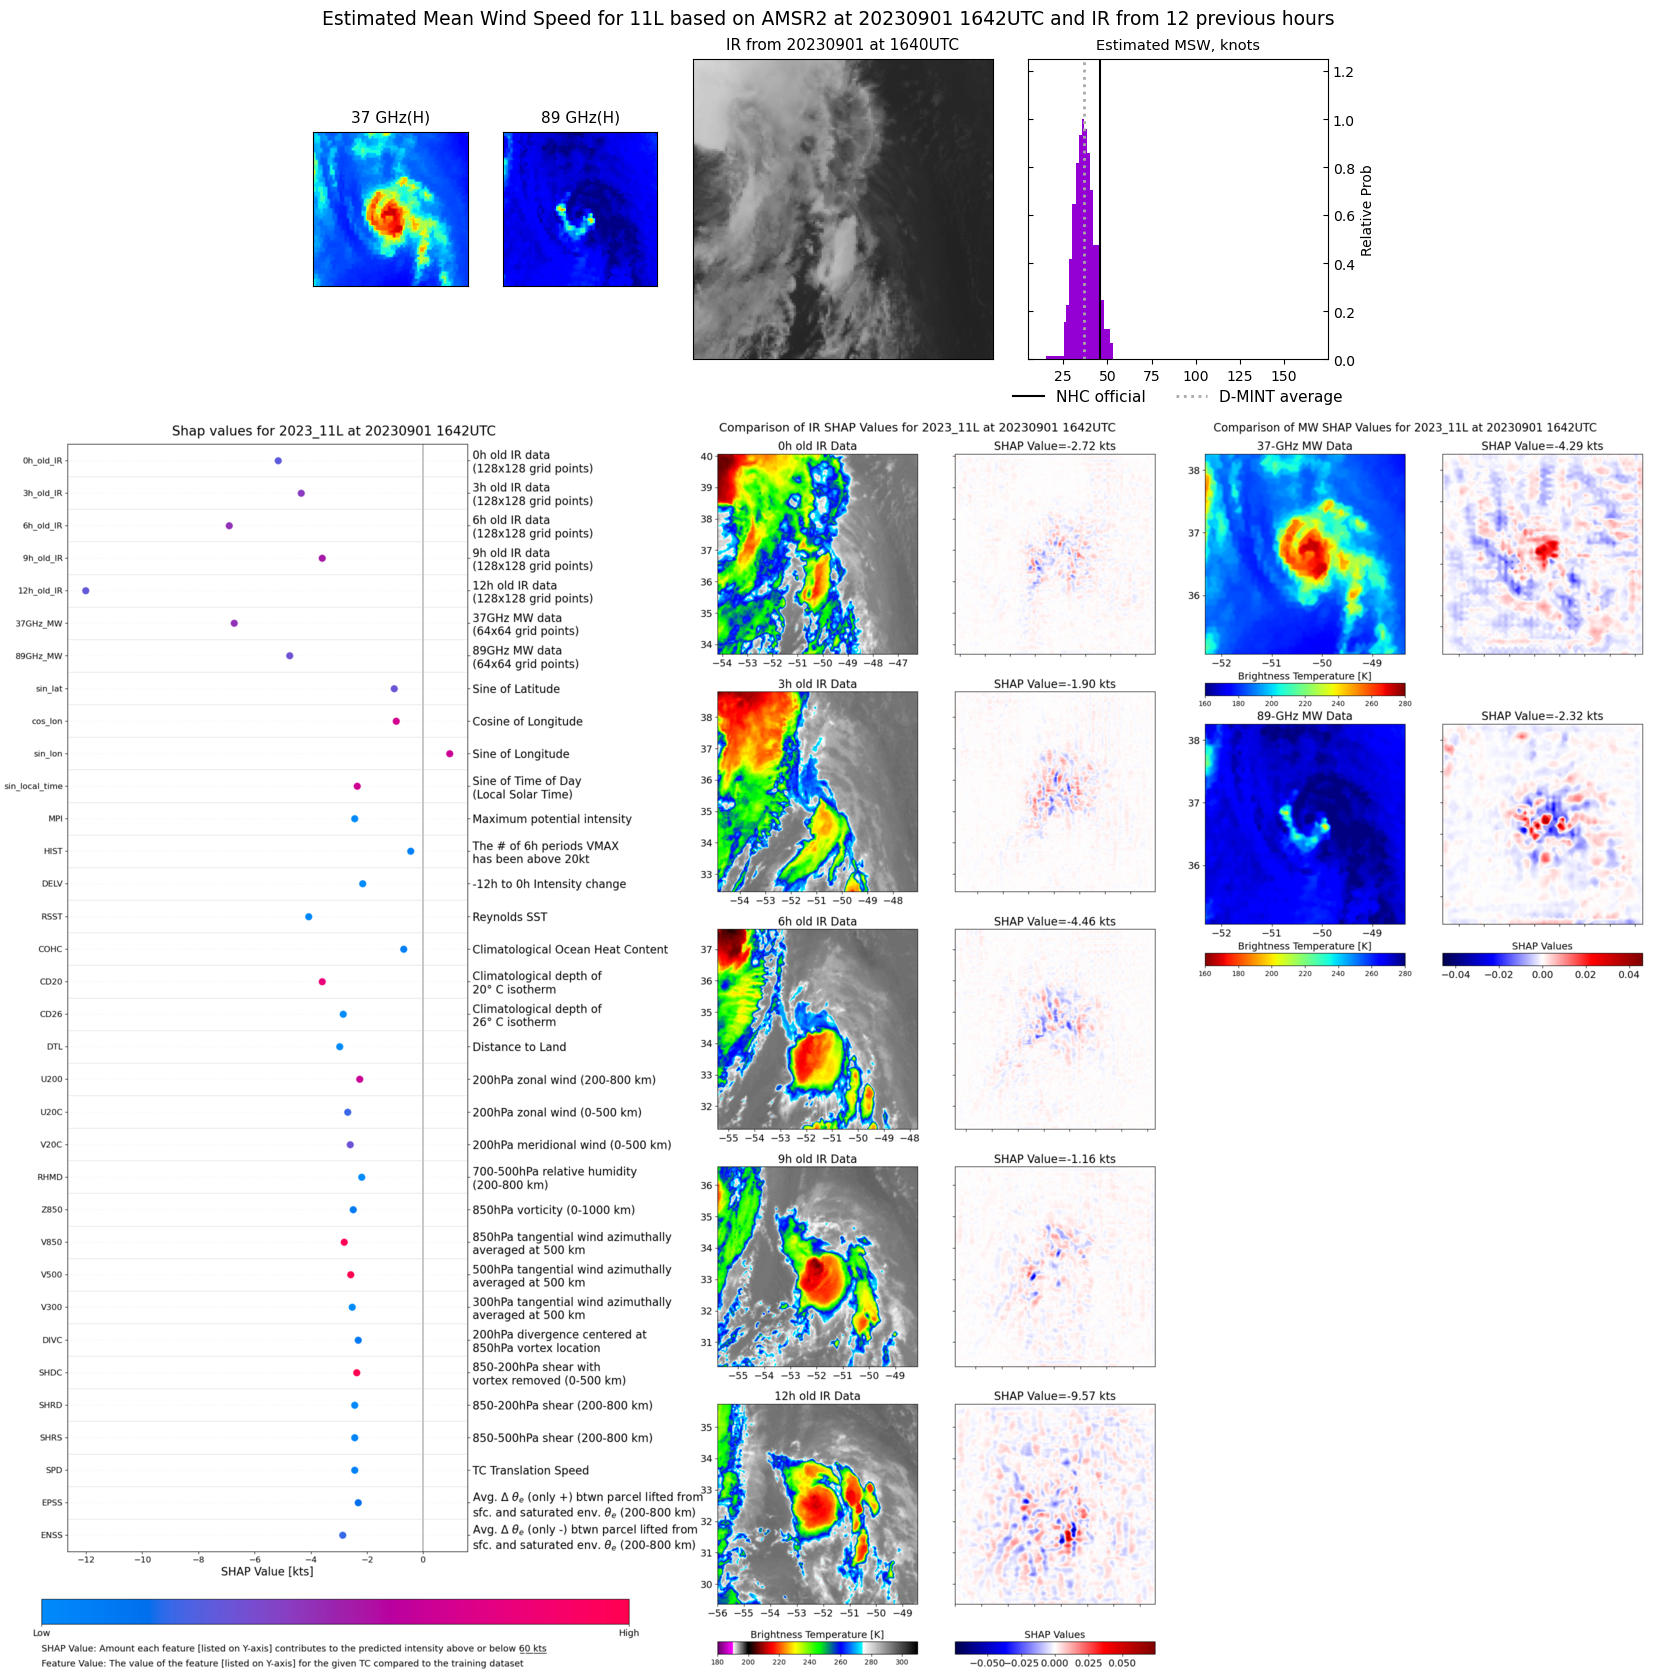 |
| 20230901 | 0724 UTC | SSMISF18 | 1007 hPa | 46 kts | 41 kts | 52 kts | 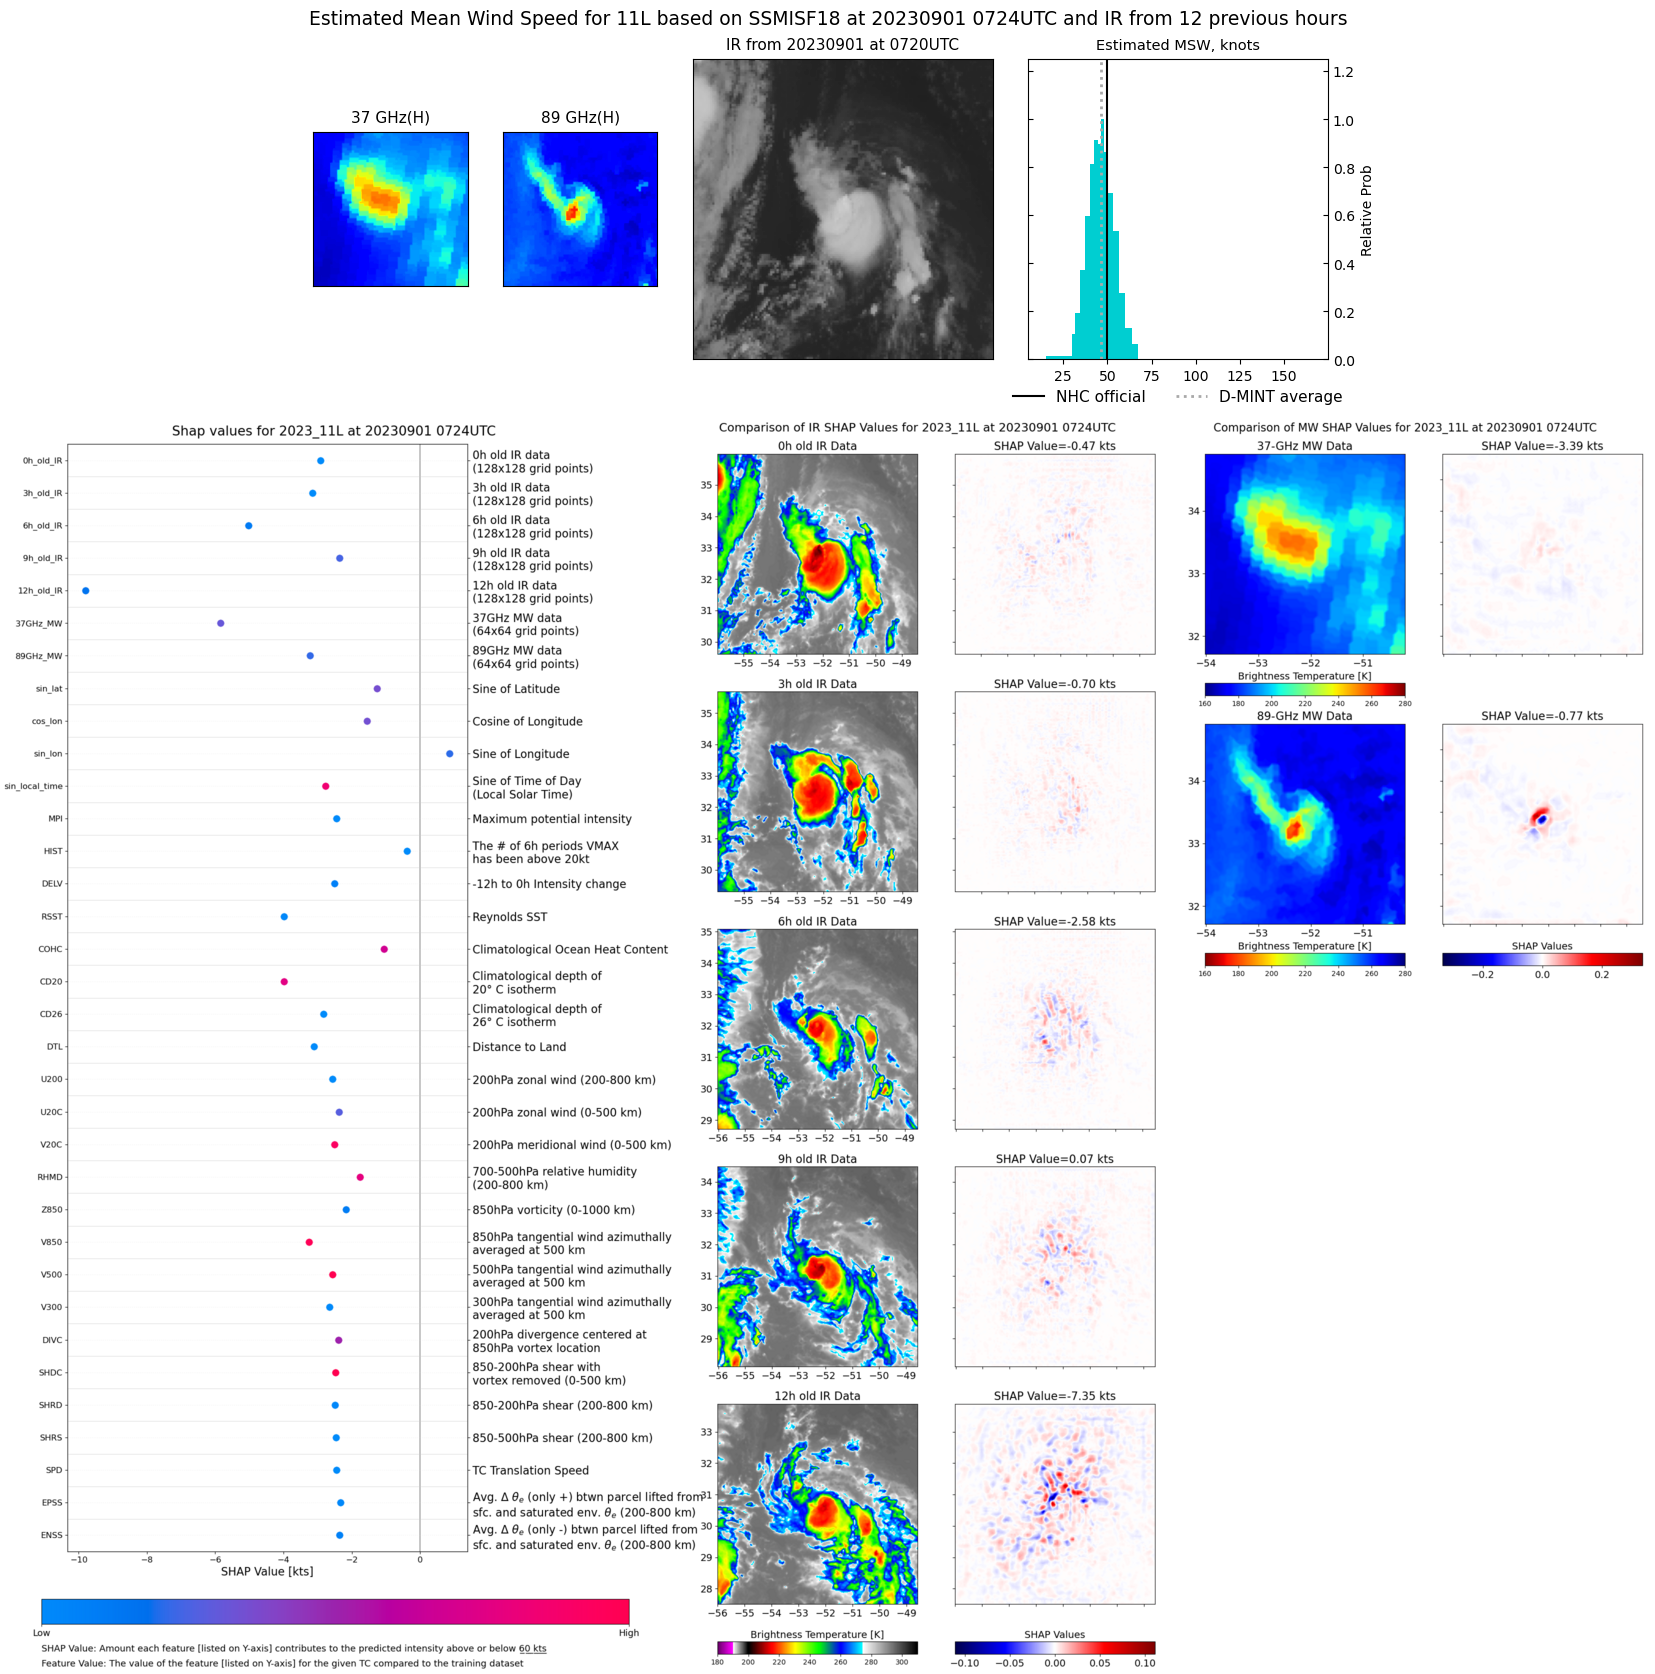 |
| 20230901 | 0540 UTC | AMSR2 | 1005 hPa | 48 kts | 43 kts | 53 kts | 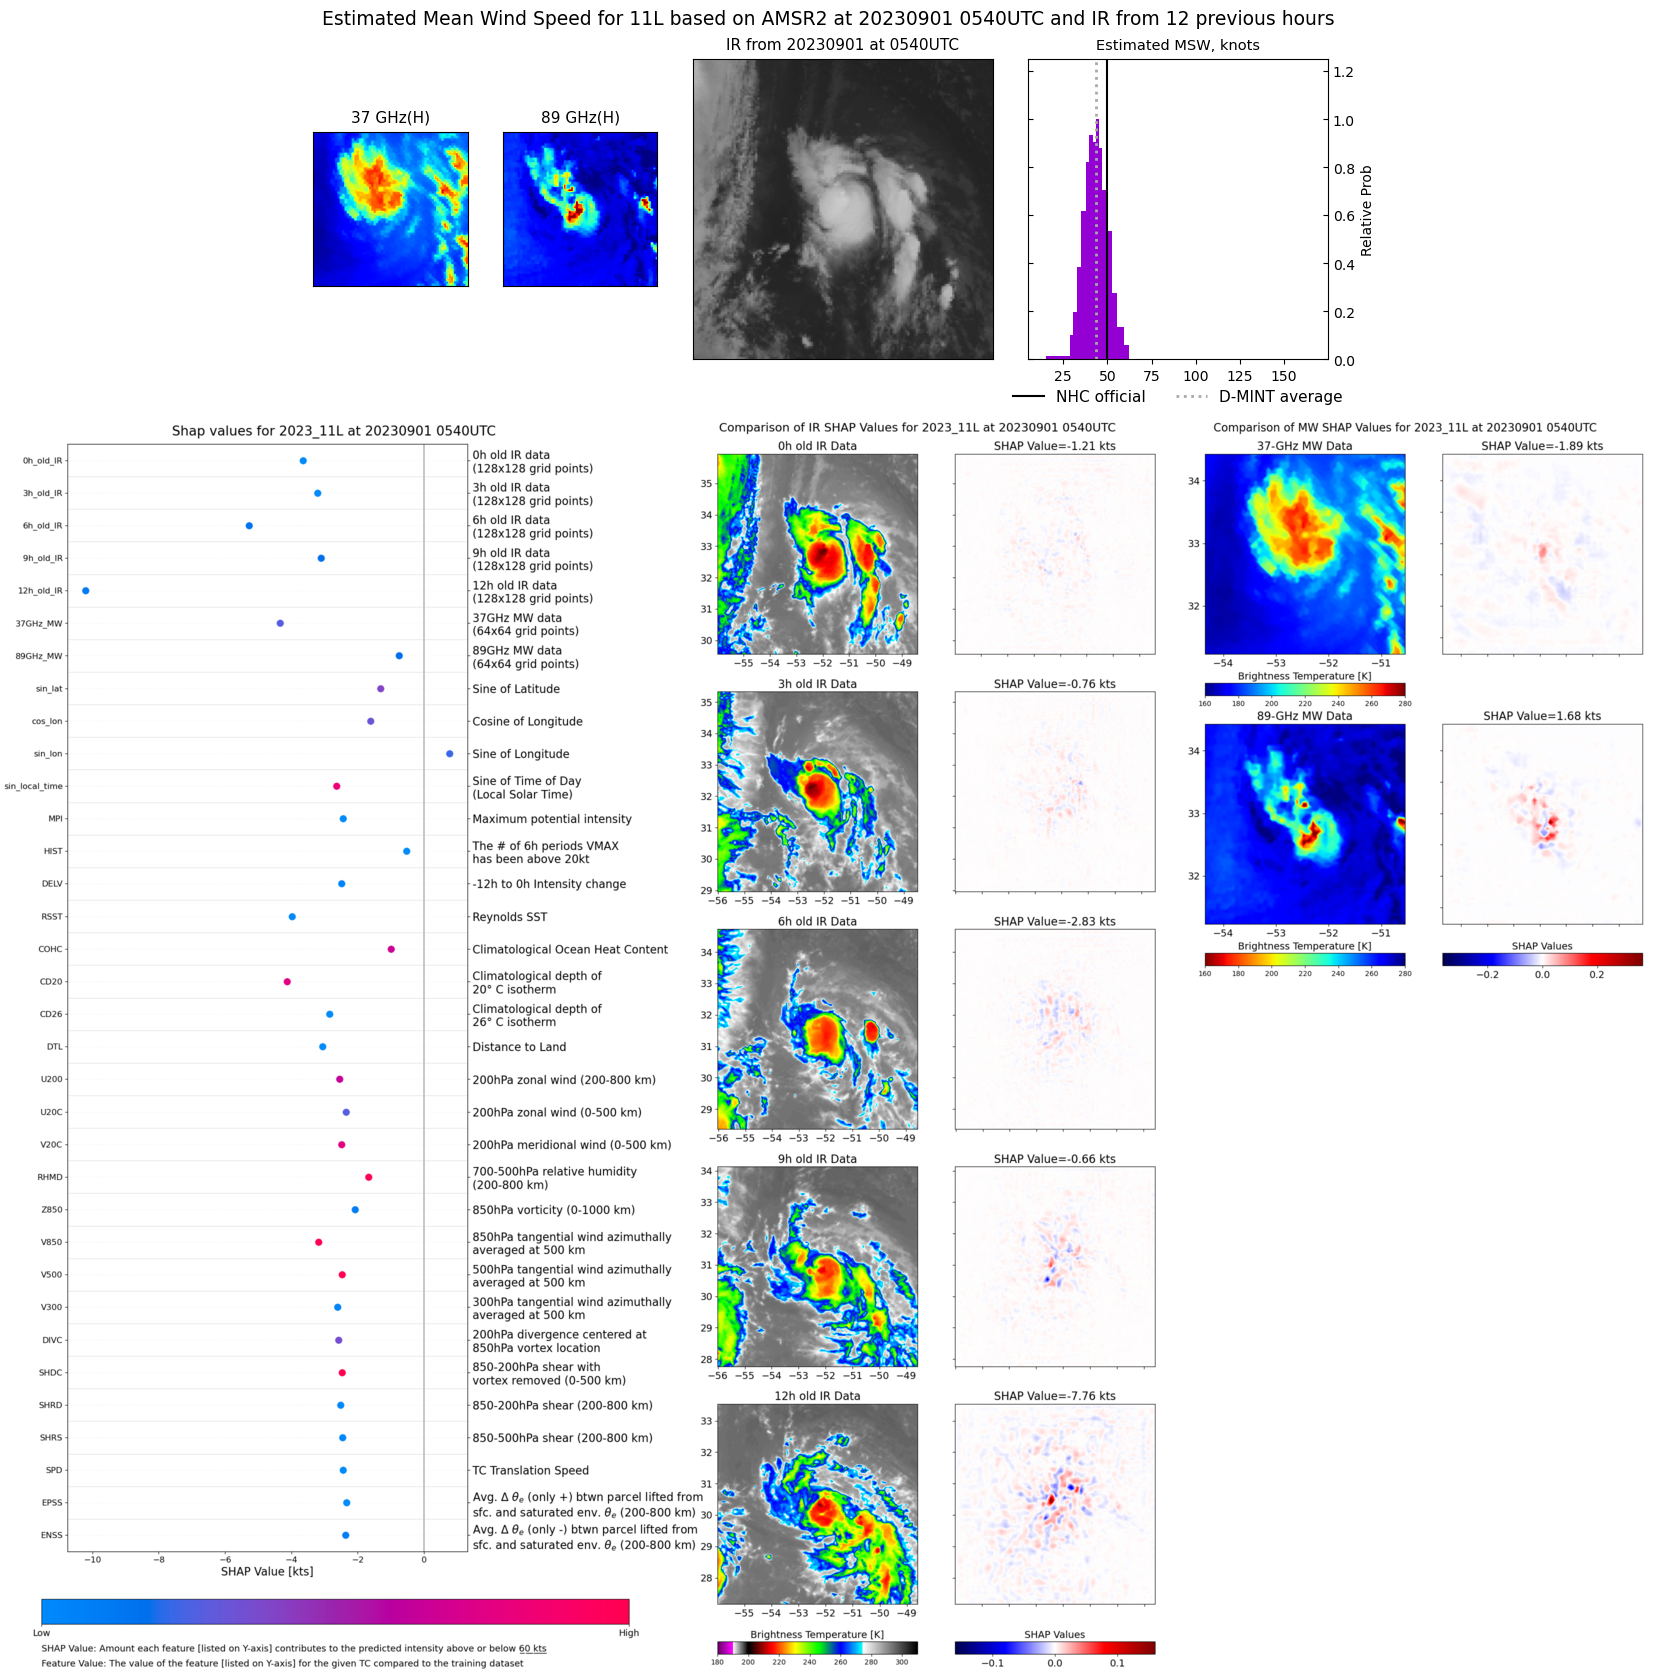 |
| 20230831 | 1858 UTC | SSMISF18 | 1001 hPa | 41 kts | 36 kts | 45 kts | 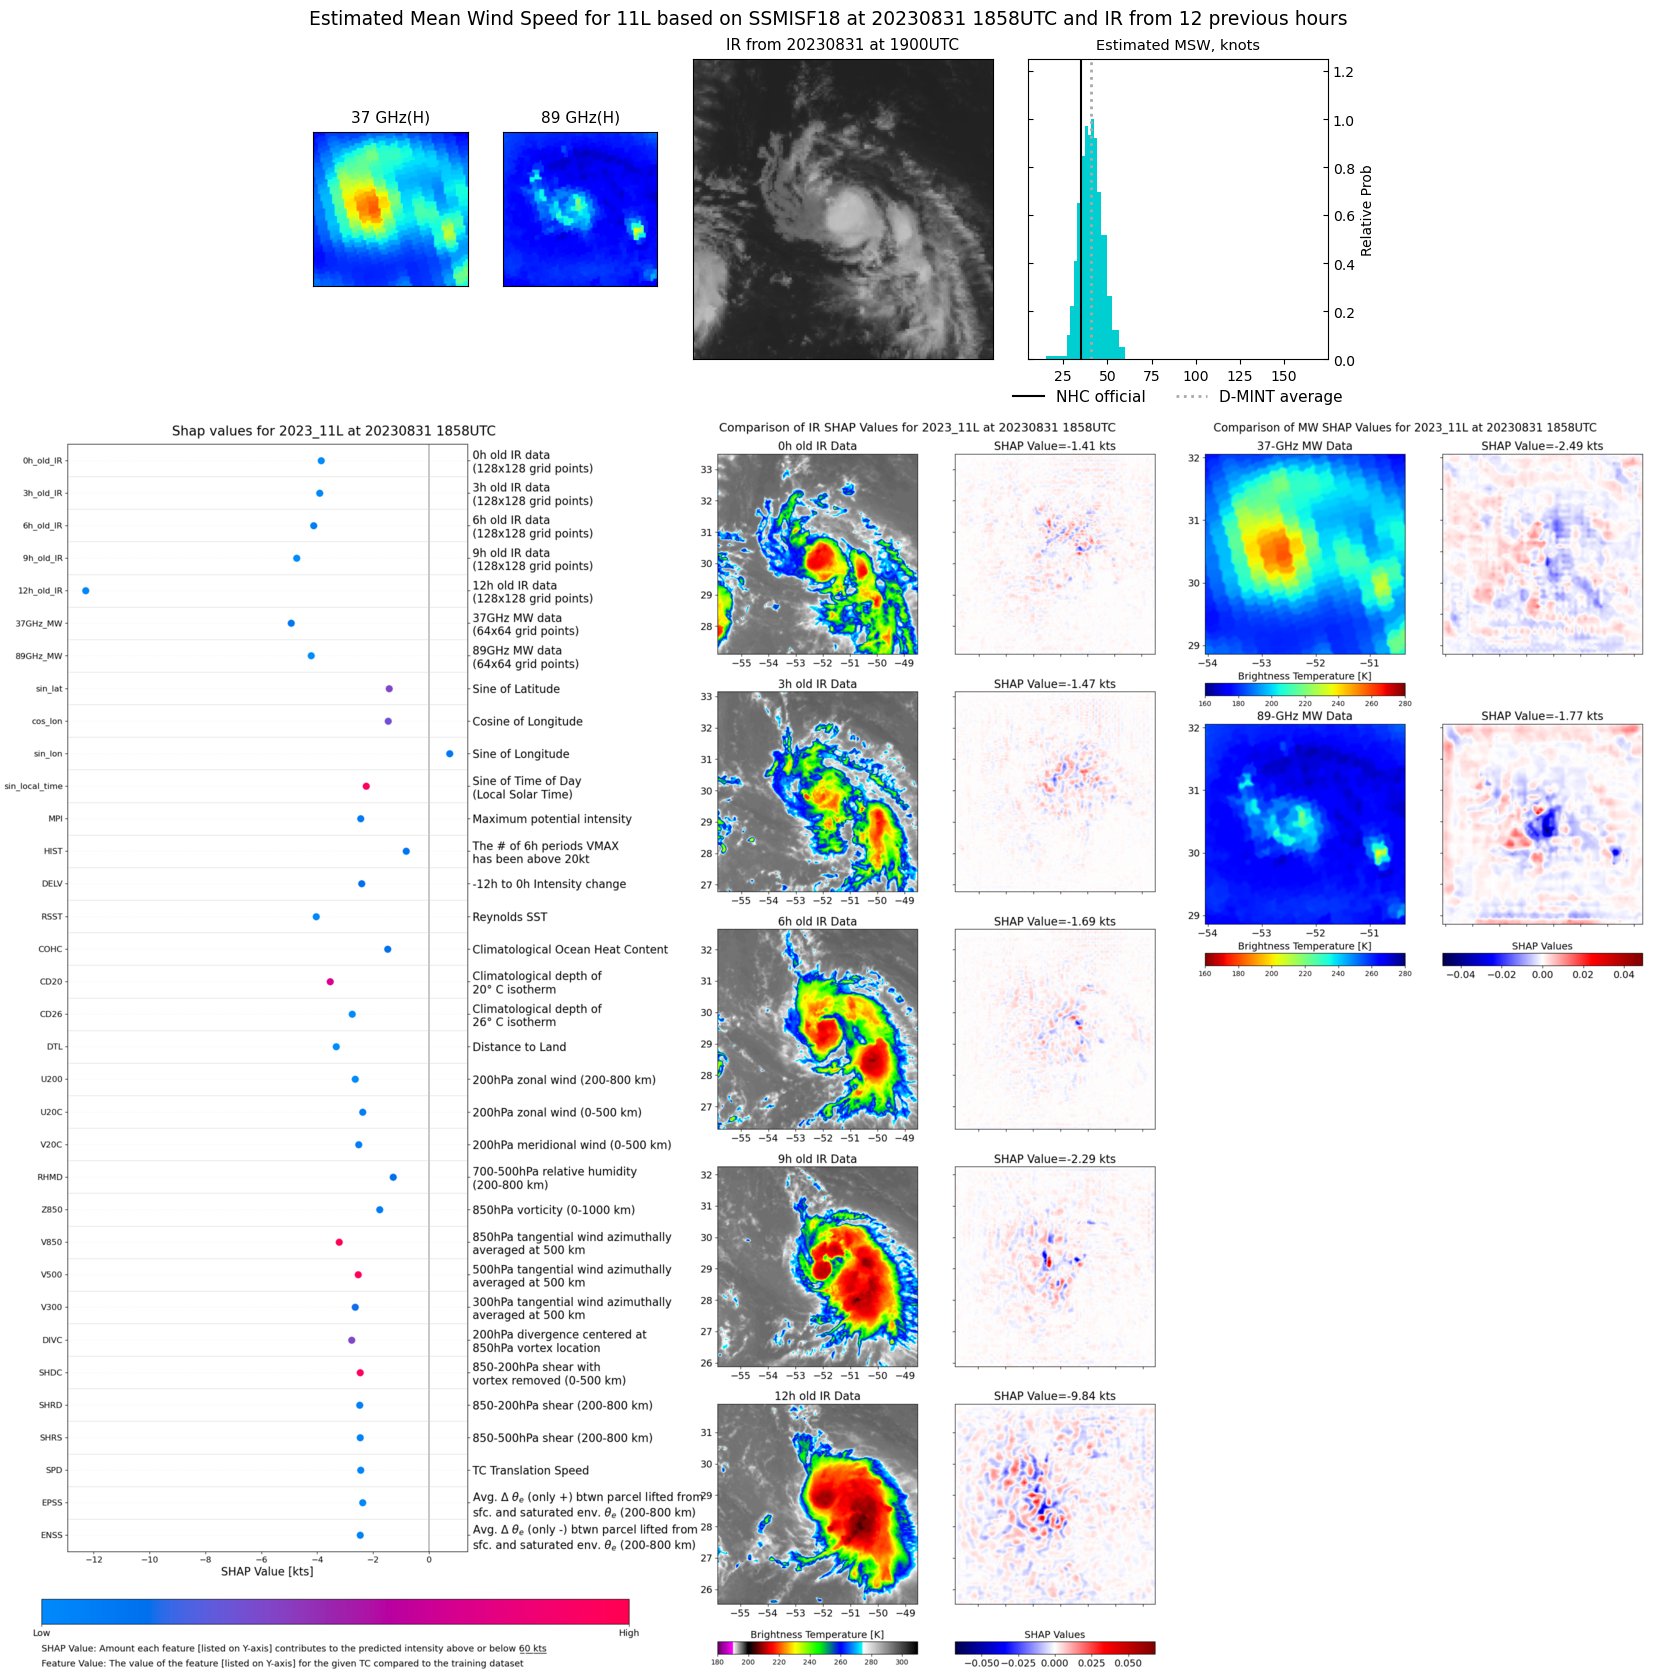 |
| 20230831 | 1406 UTC | GMI | 1005 hPa | 38 kts | 34 kts | 42 kts | 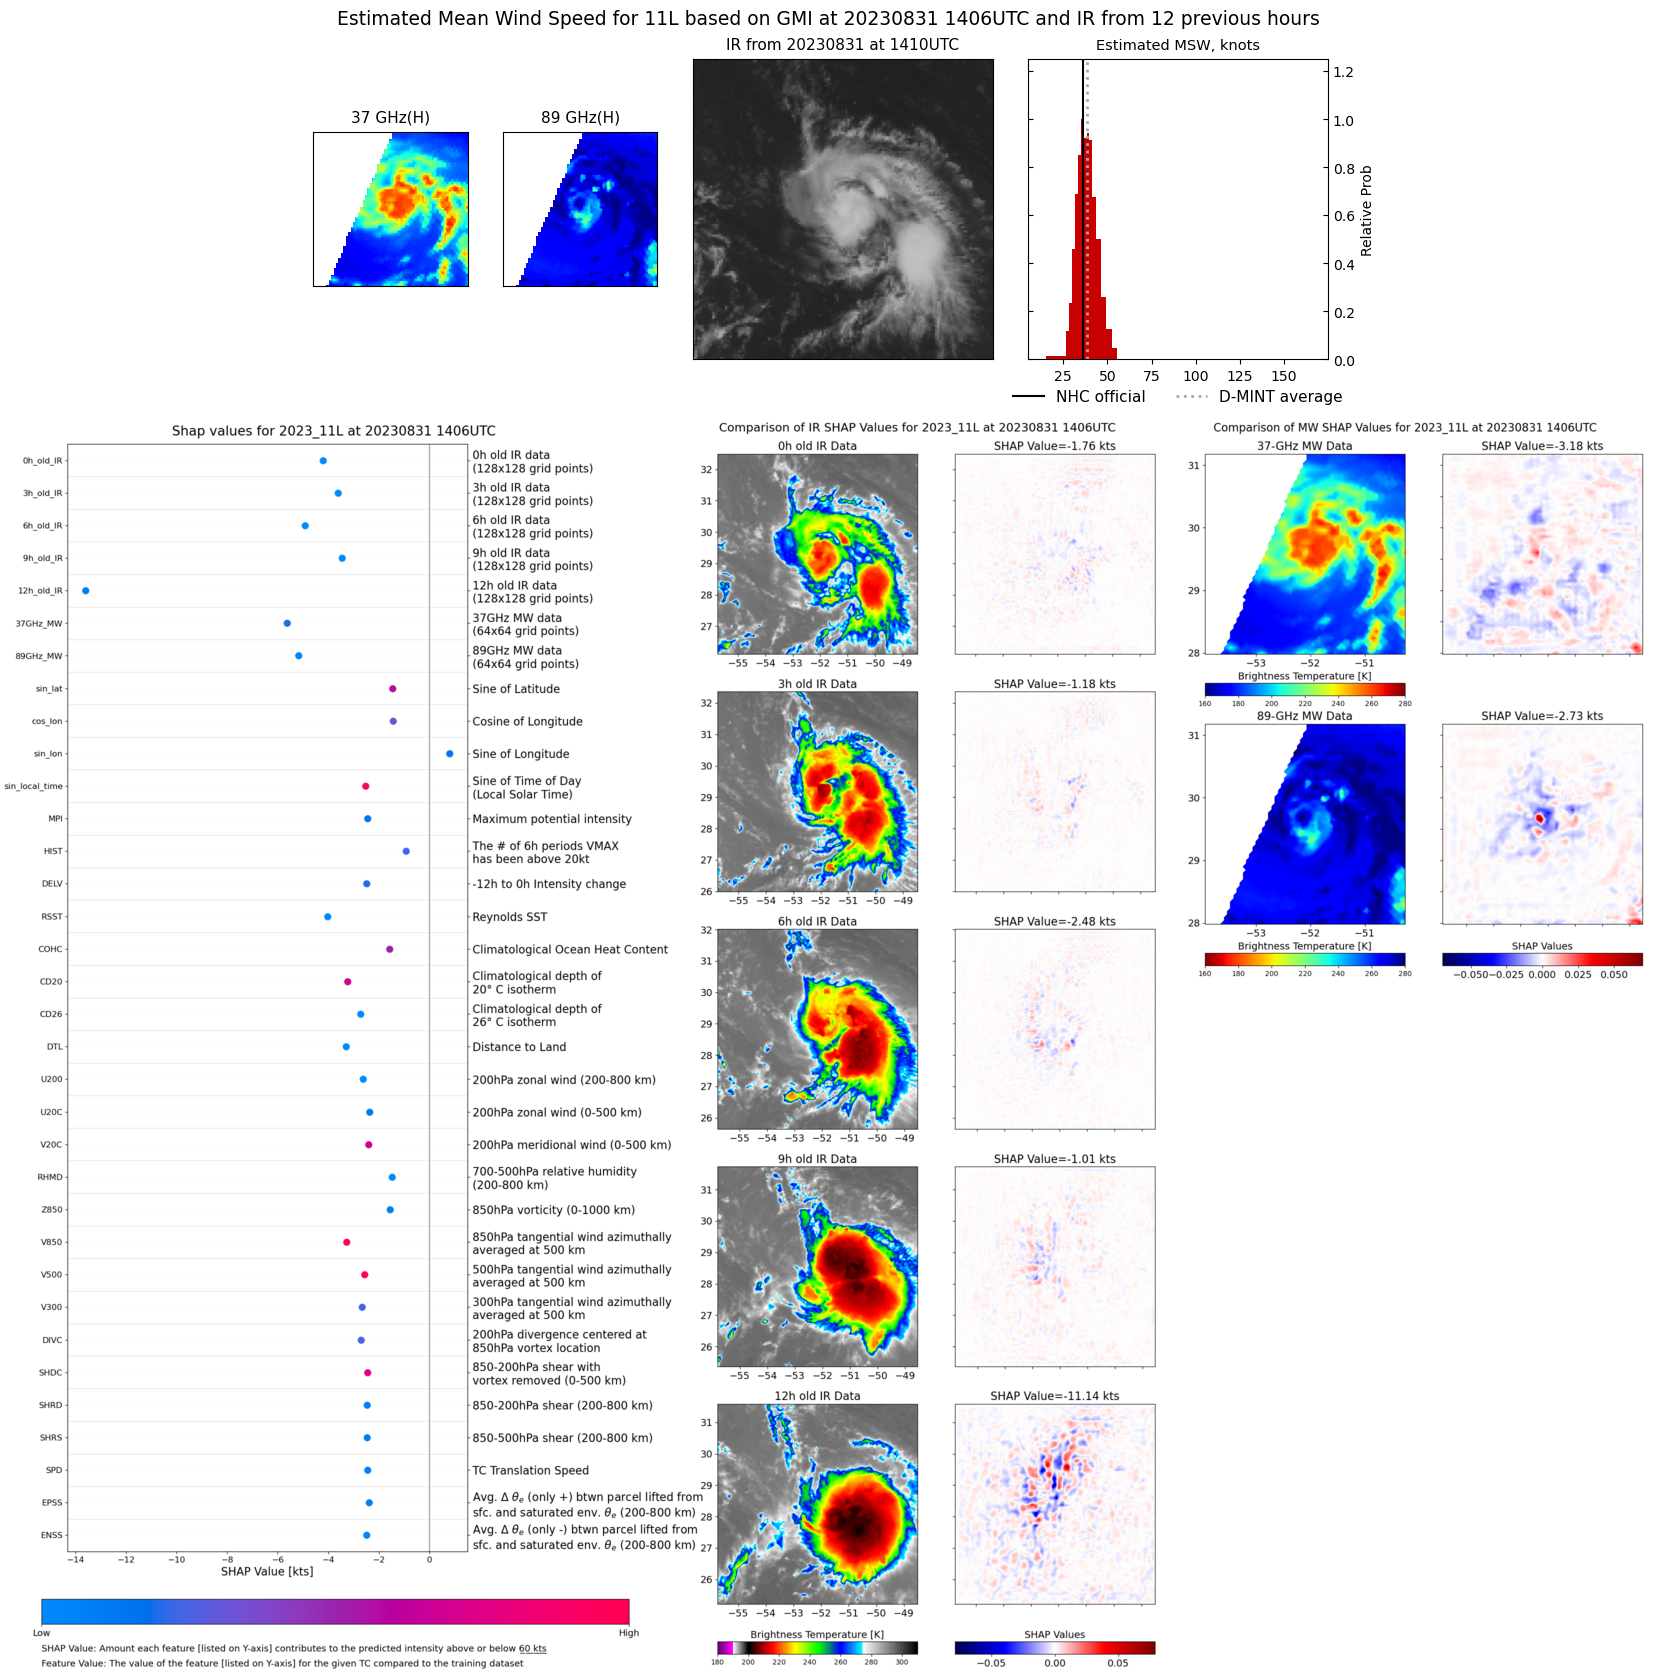 |
| 20230831 | 0739 UTC | SSMISF18 | 1009 hPa | 35 kts | 32 kts | 39 kts |  |
| 20230831 | 0458 UTC | AMSR2 | 1010 hPa | 34 kts | 31 kts | 37 kts | 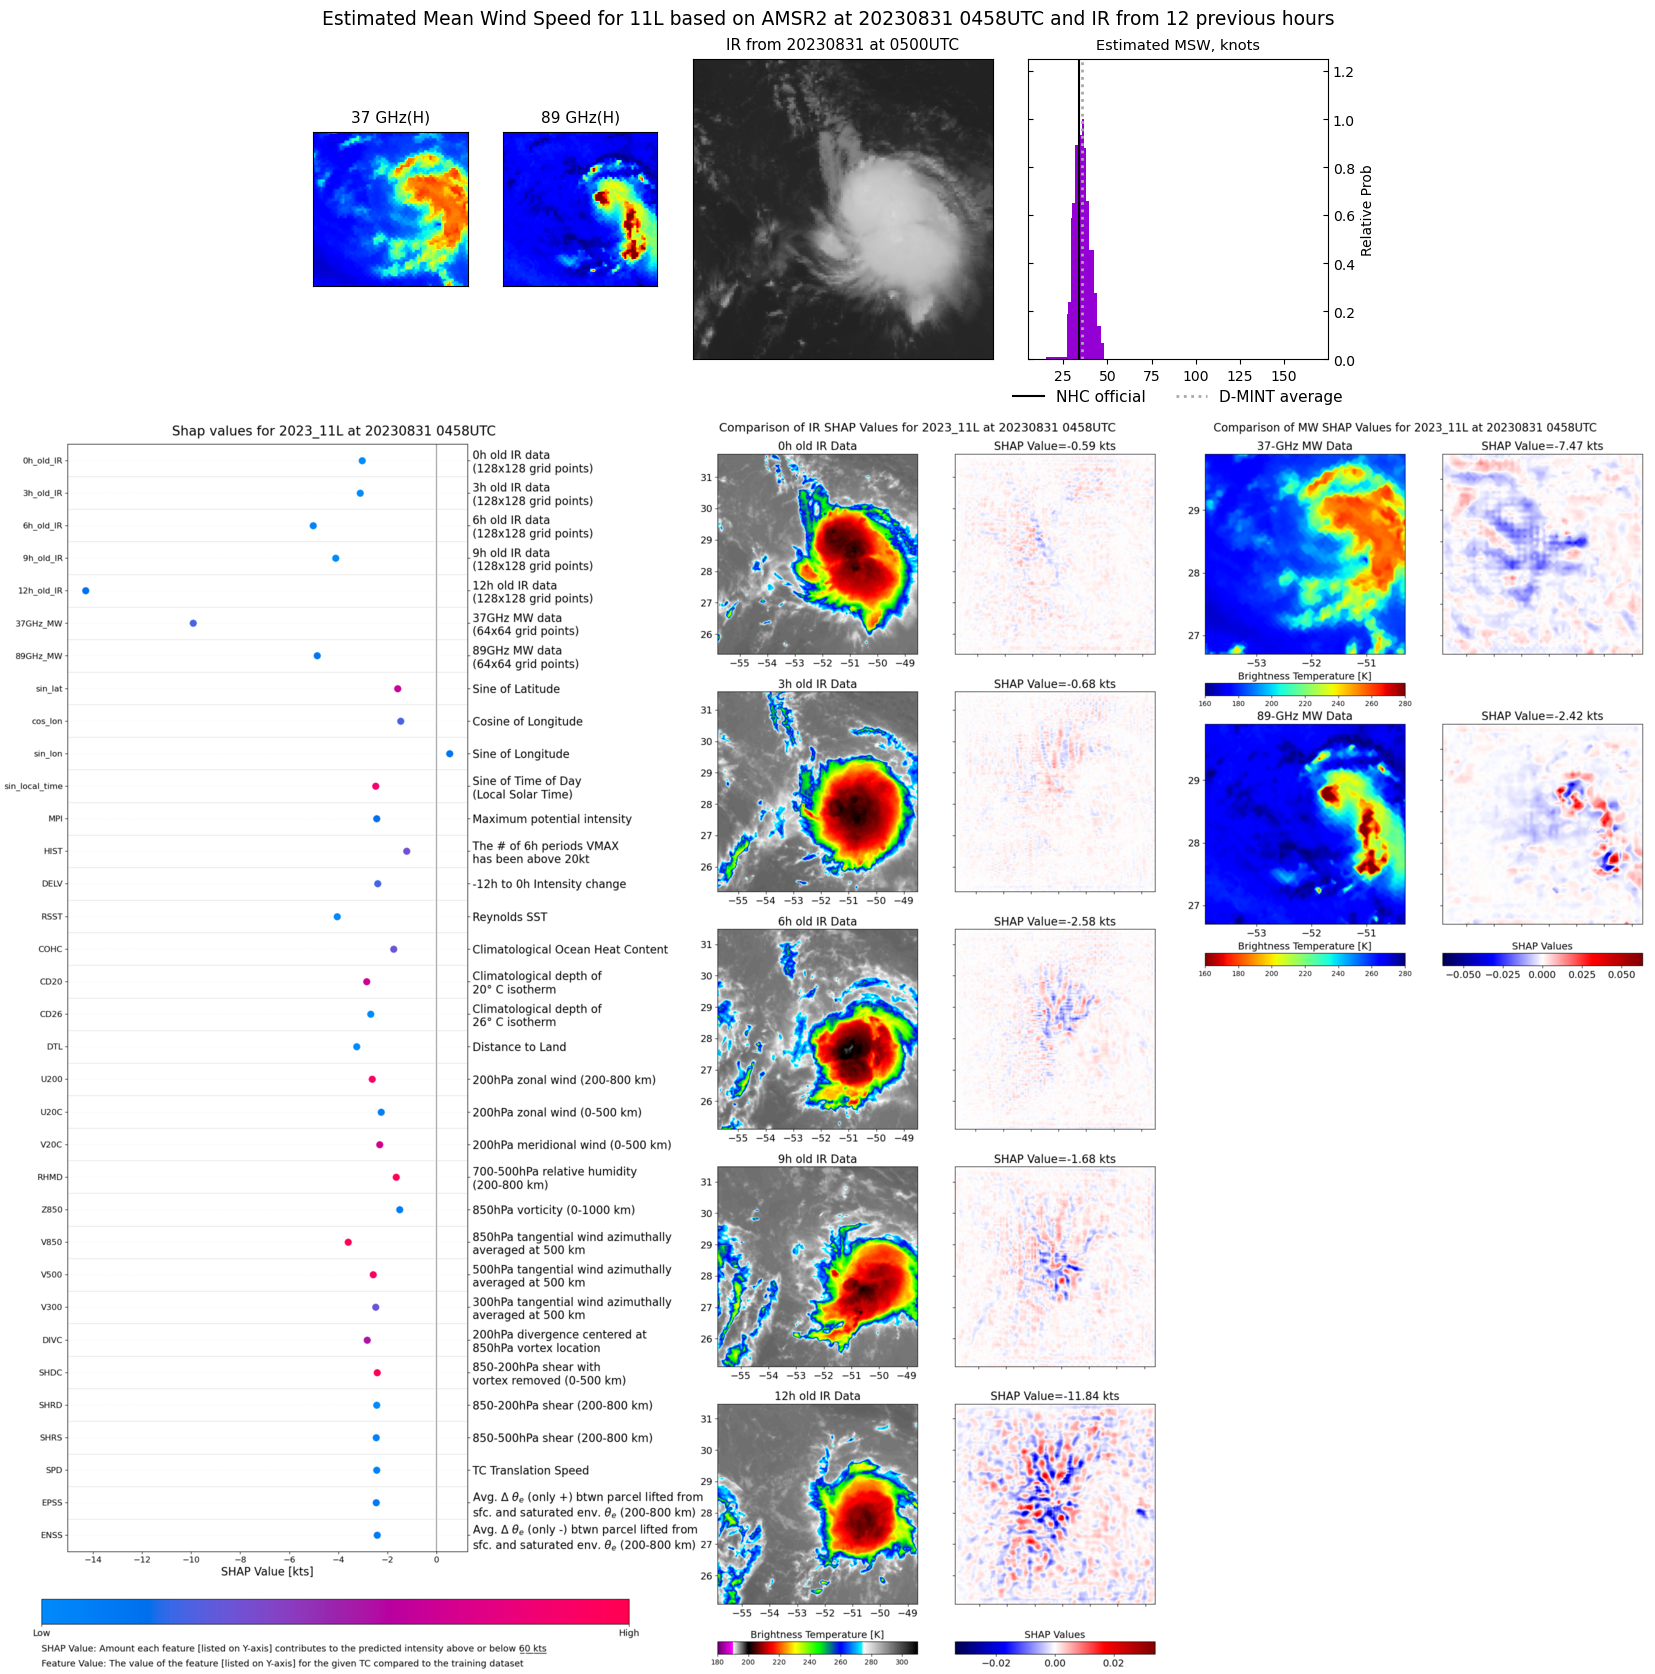 |
| 20230831 | 0046 UTC | GMI | 1013 hPa | 33 kts | 31 kts | 36 kts | 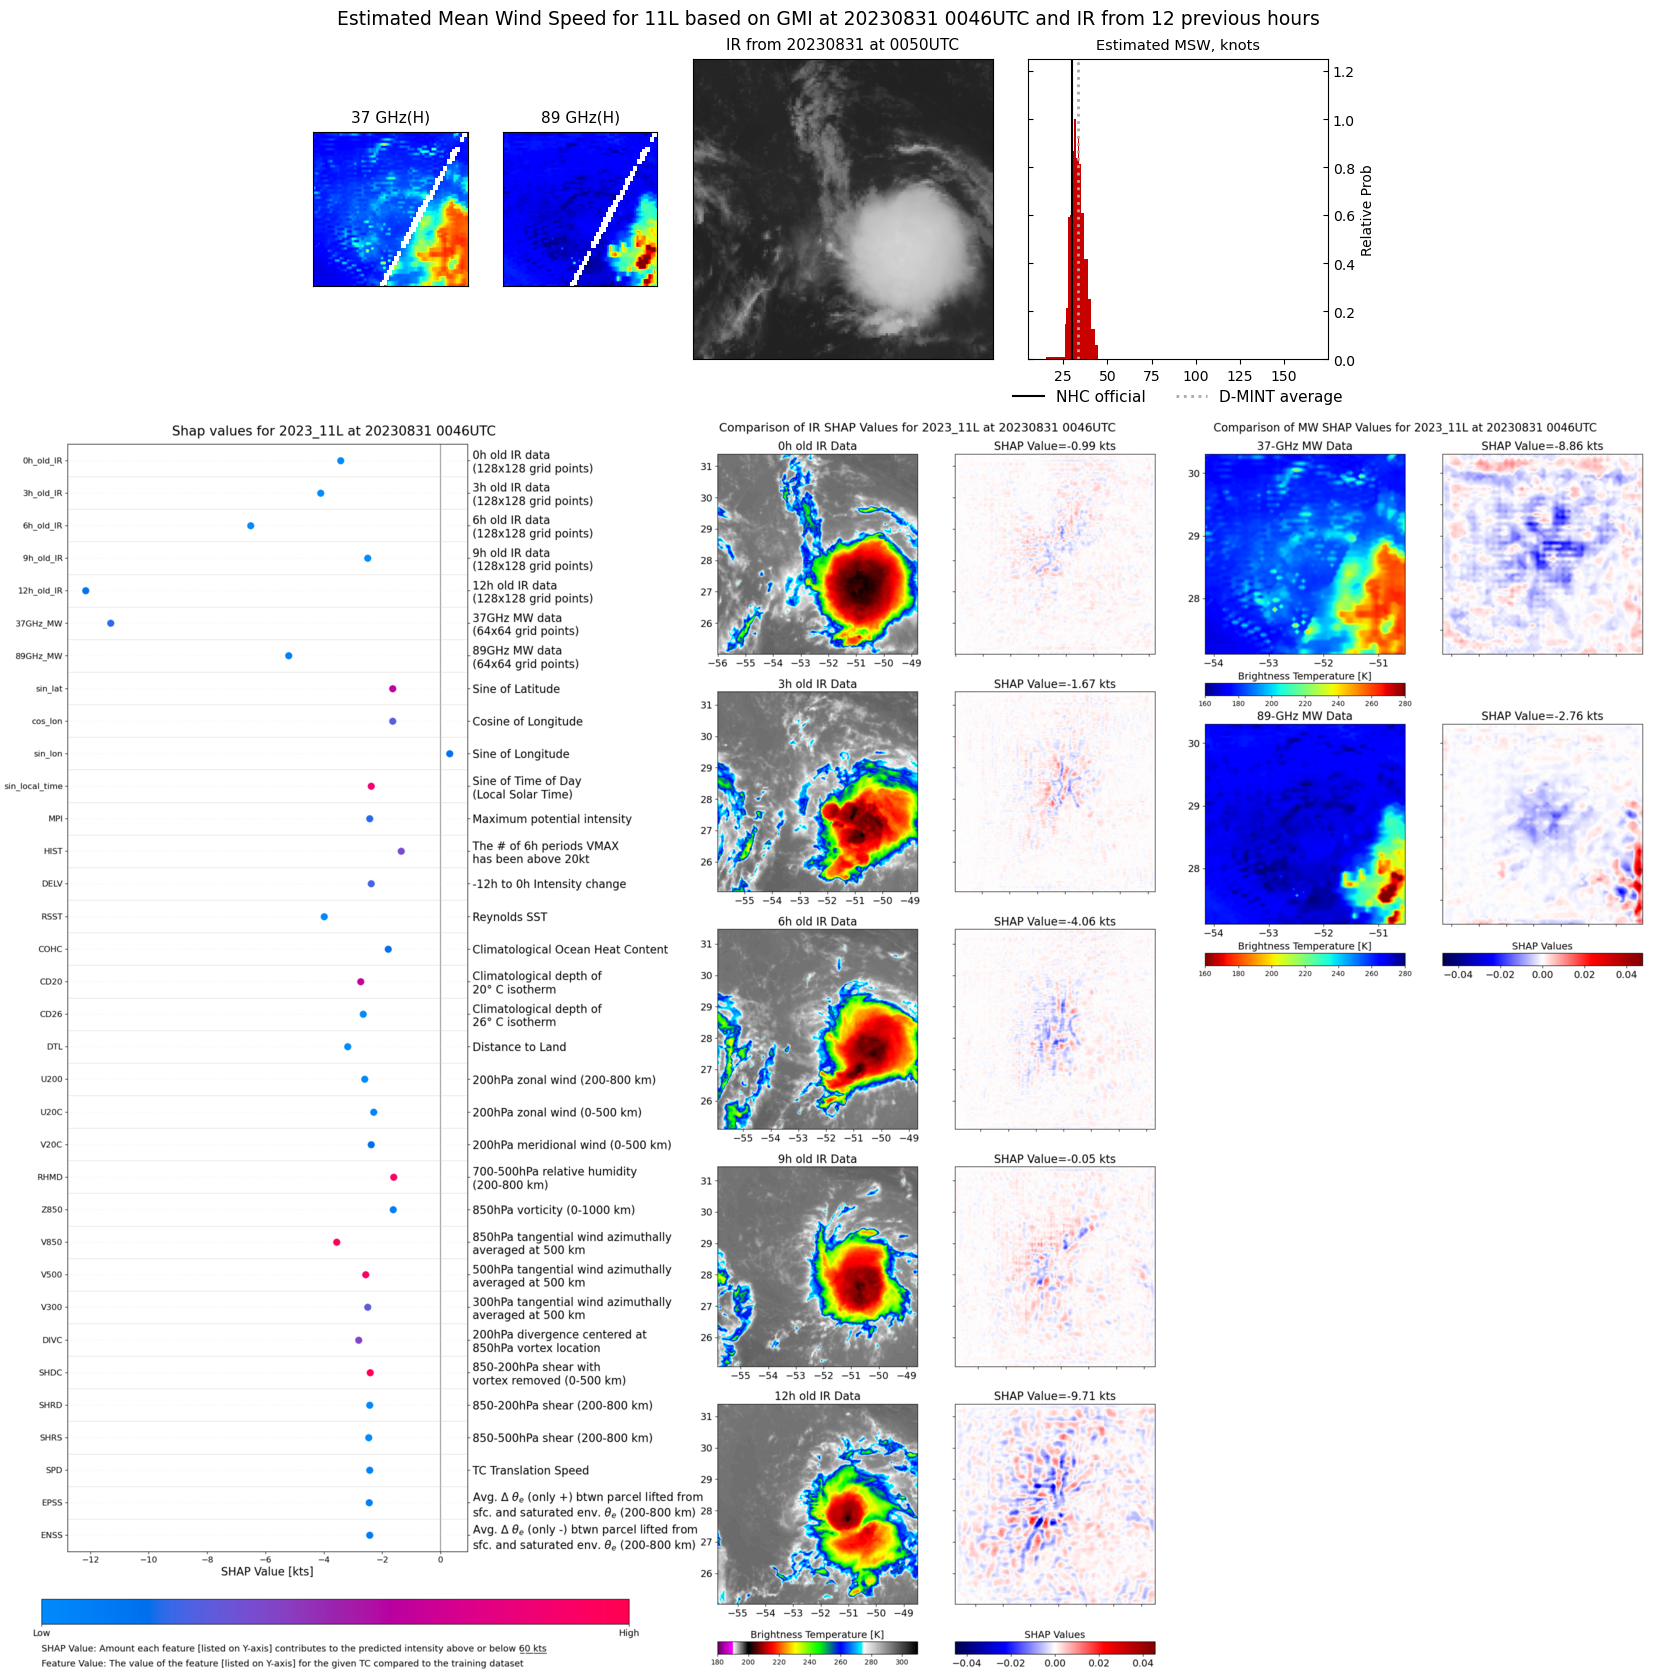 |
| 20230830 | 1911 UTC | SSMISF18 | 1013 hPa | 32 kts | 29 kts | 36 kts | 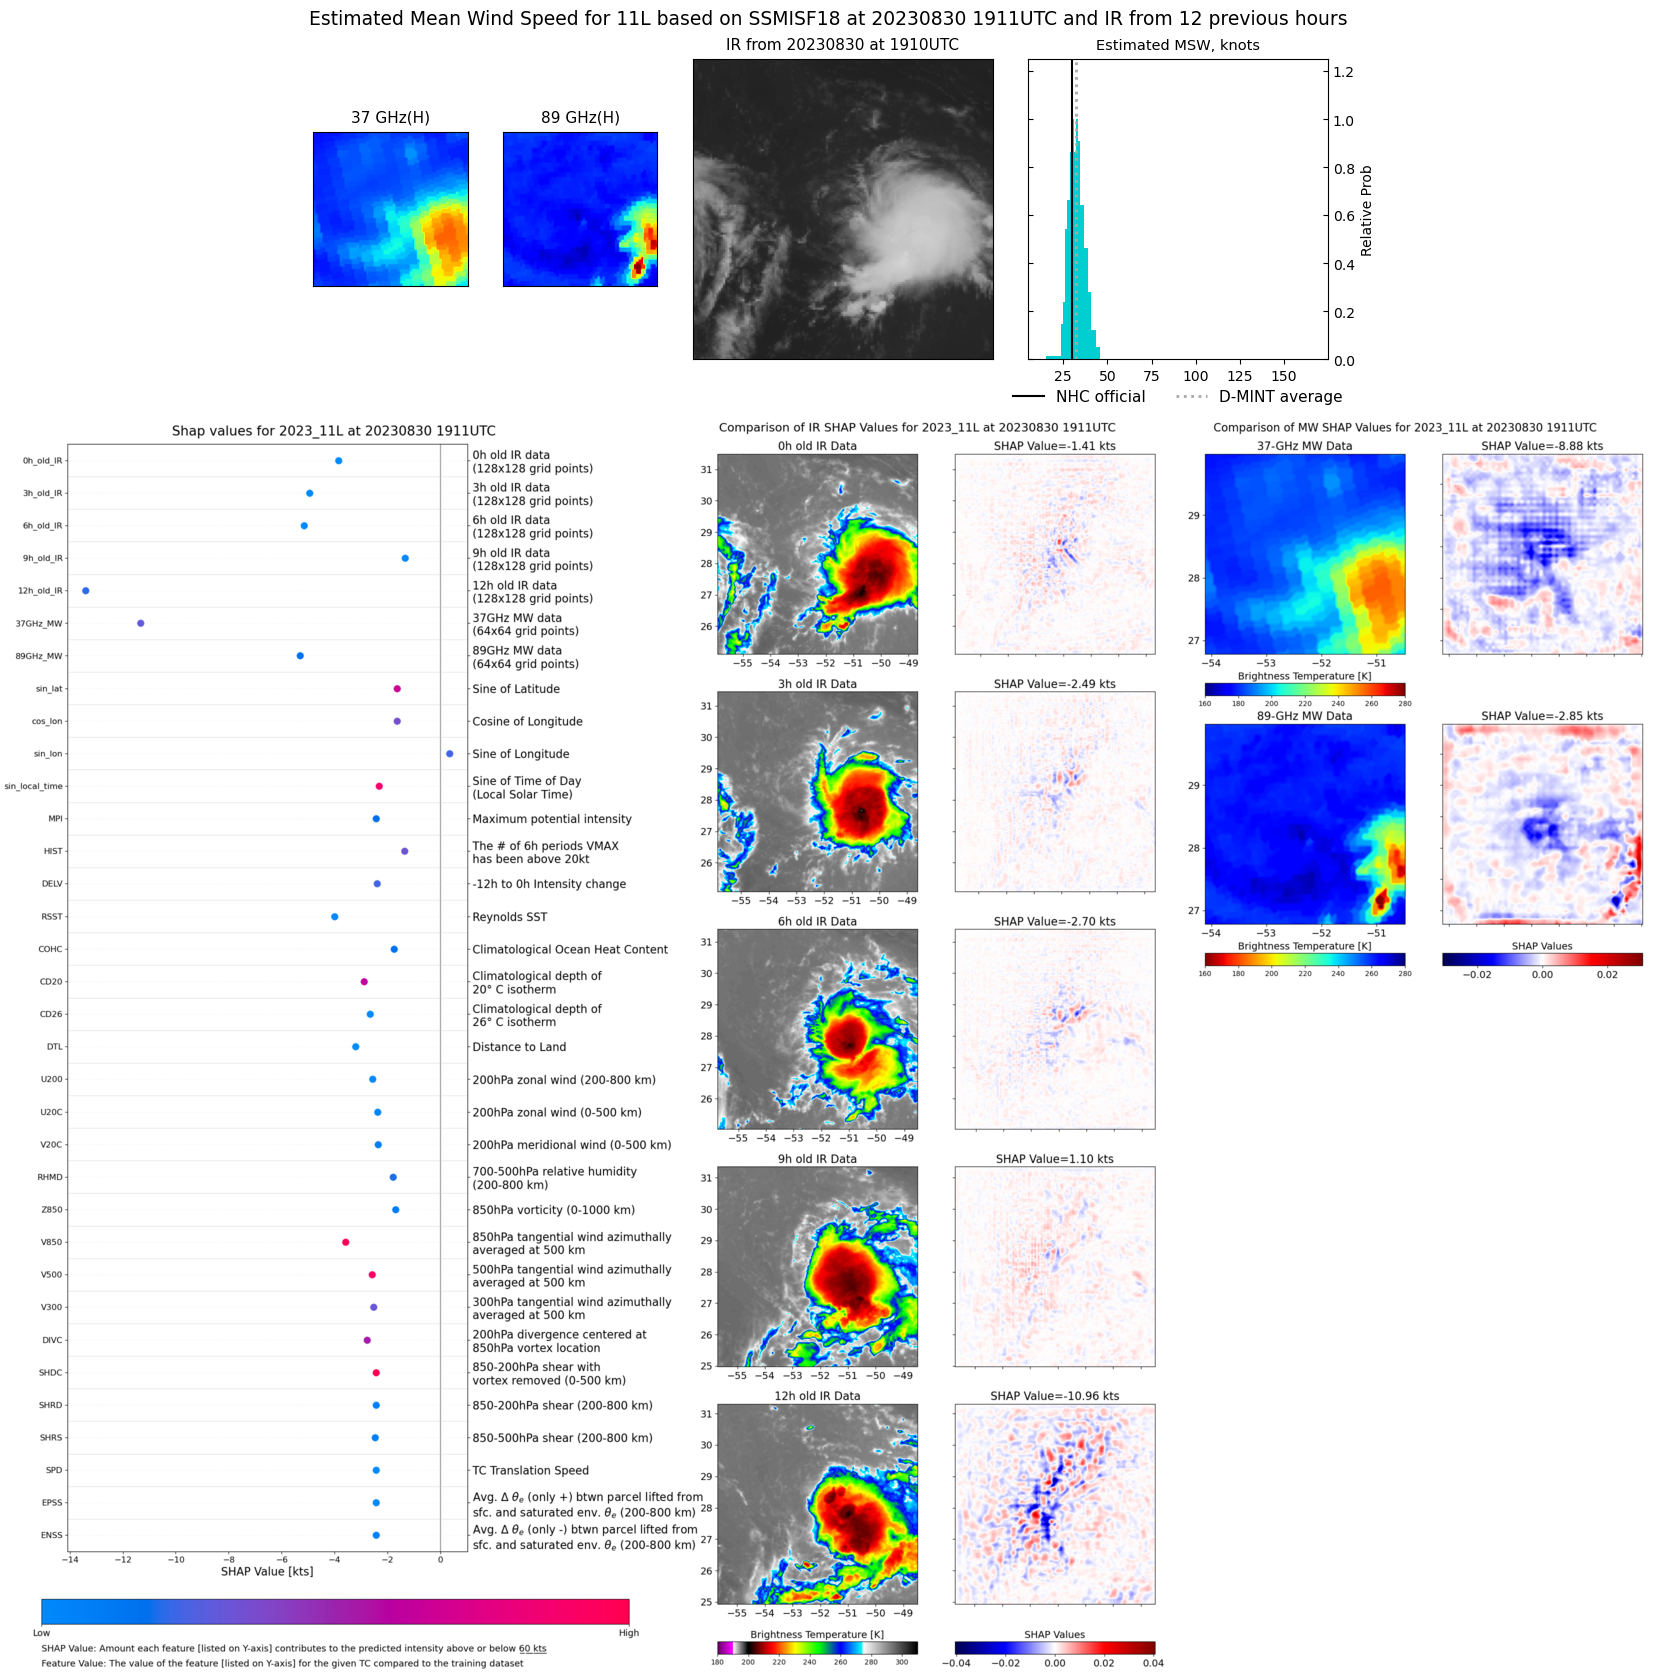 |
| 20230830 | 1652 UTC | AMSR2 | 1012 hPa | 34 kts | 31 kts | 37 kts | 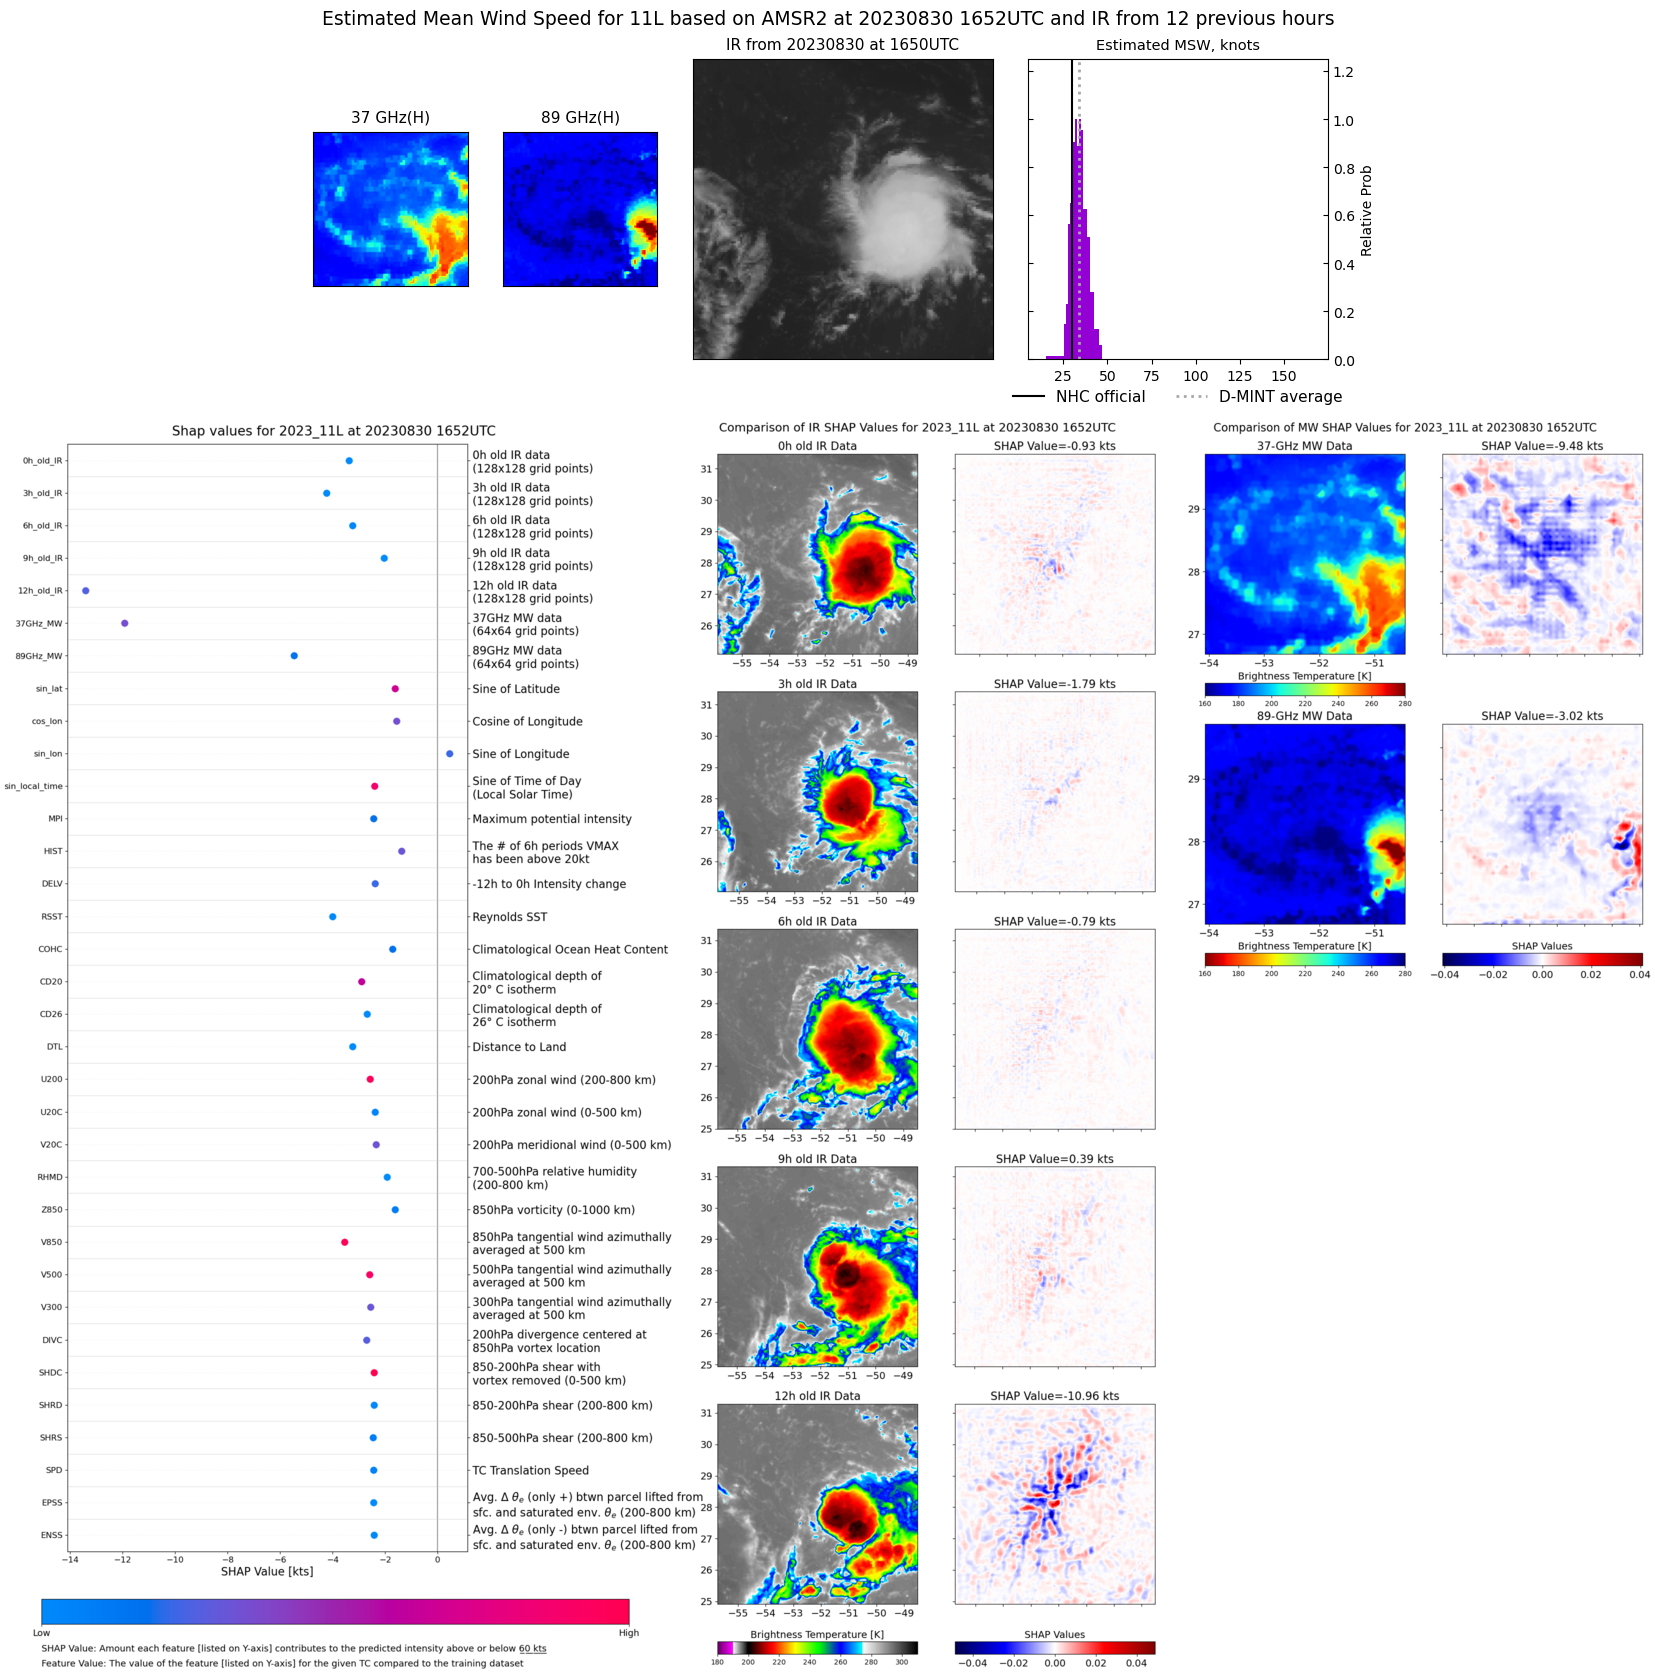 |
| 20230830 | 0942 UTC | SSMISF17 | 1013 hPa | 29 kts | 27 kts | 32 kts | 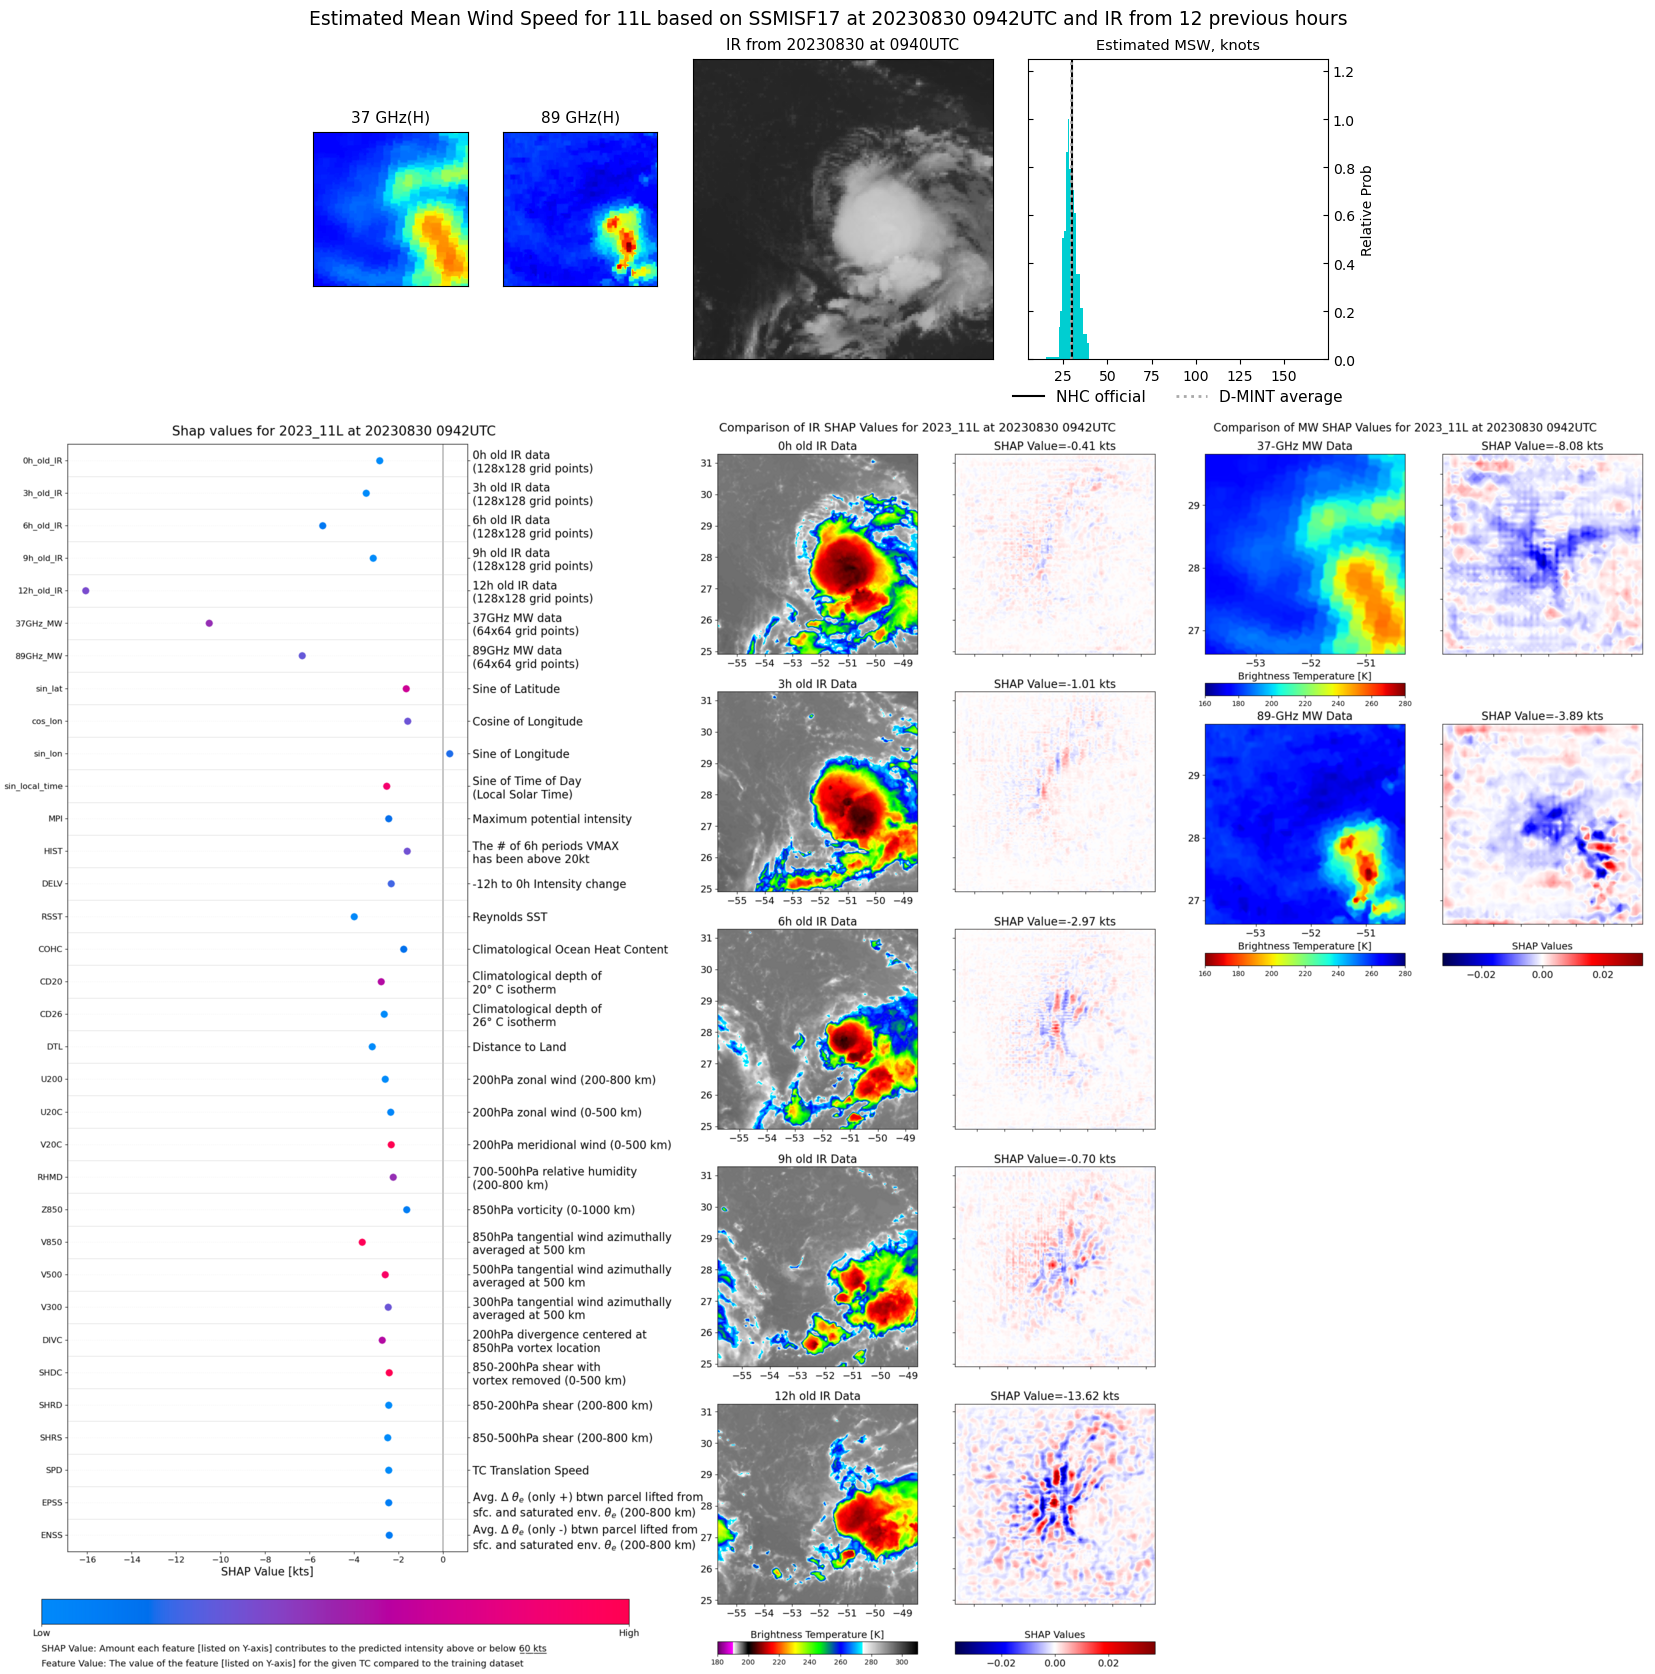 |
| 20230830 | 0752 UTC | SSMISF18 | 1013 hPa | 31 kts | 28 kts | 34 kts | 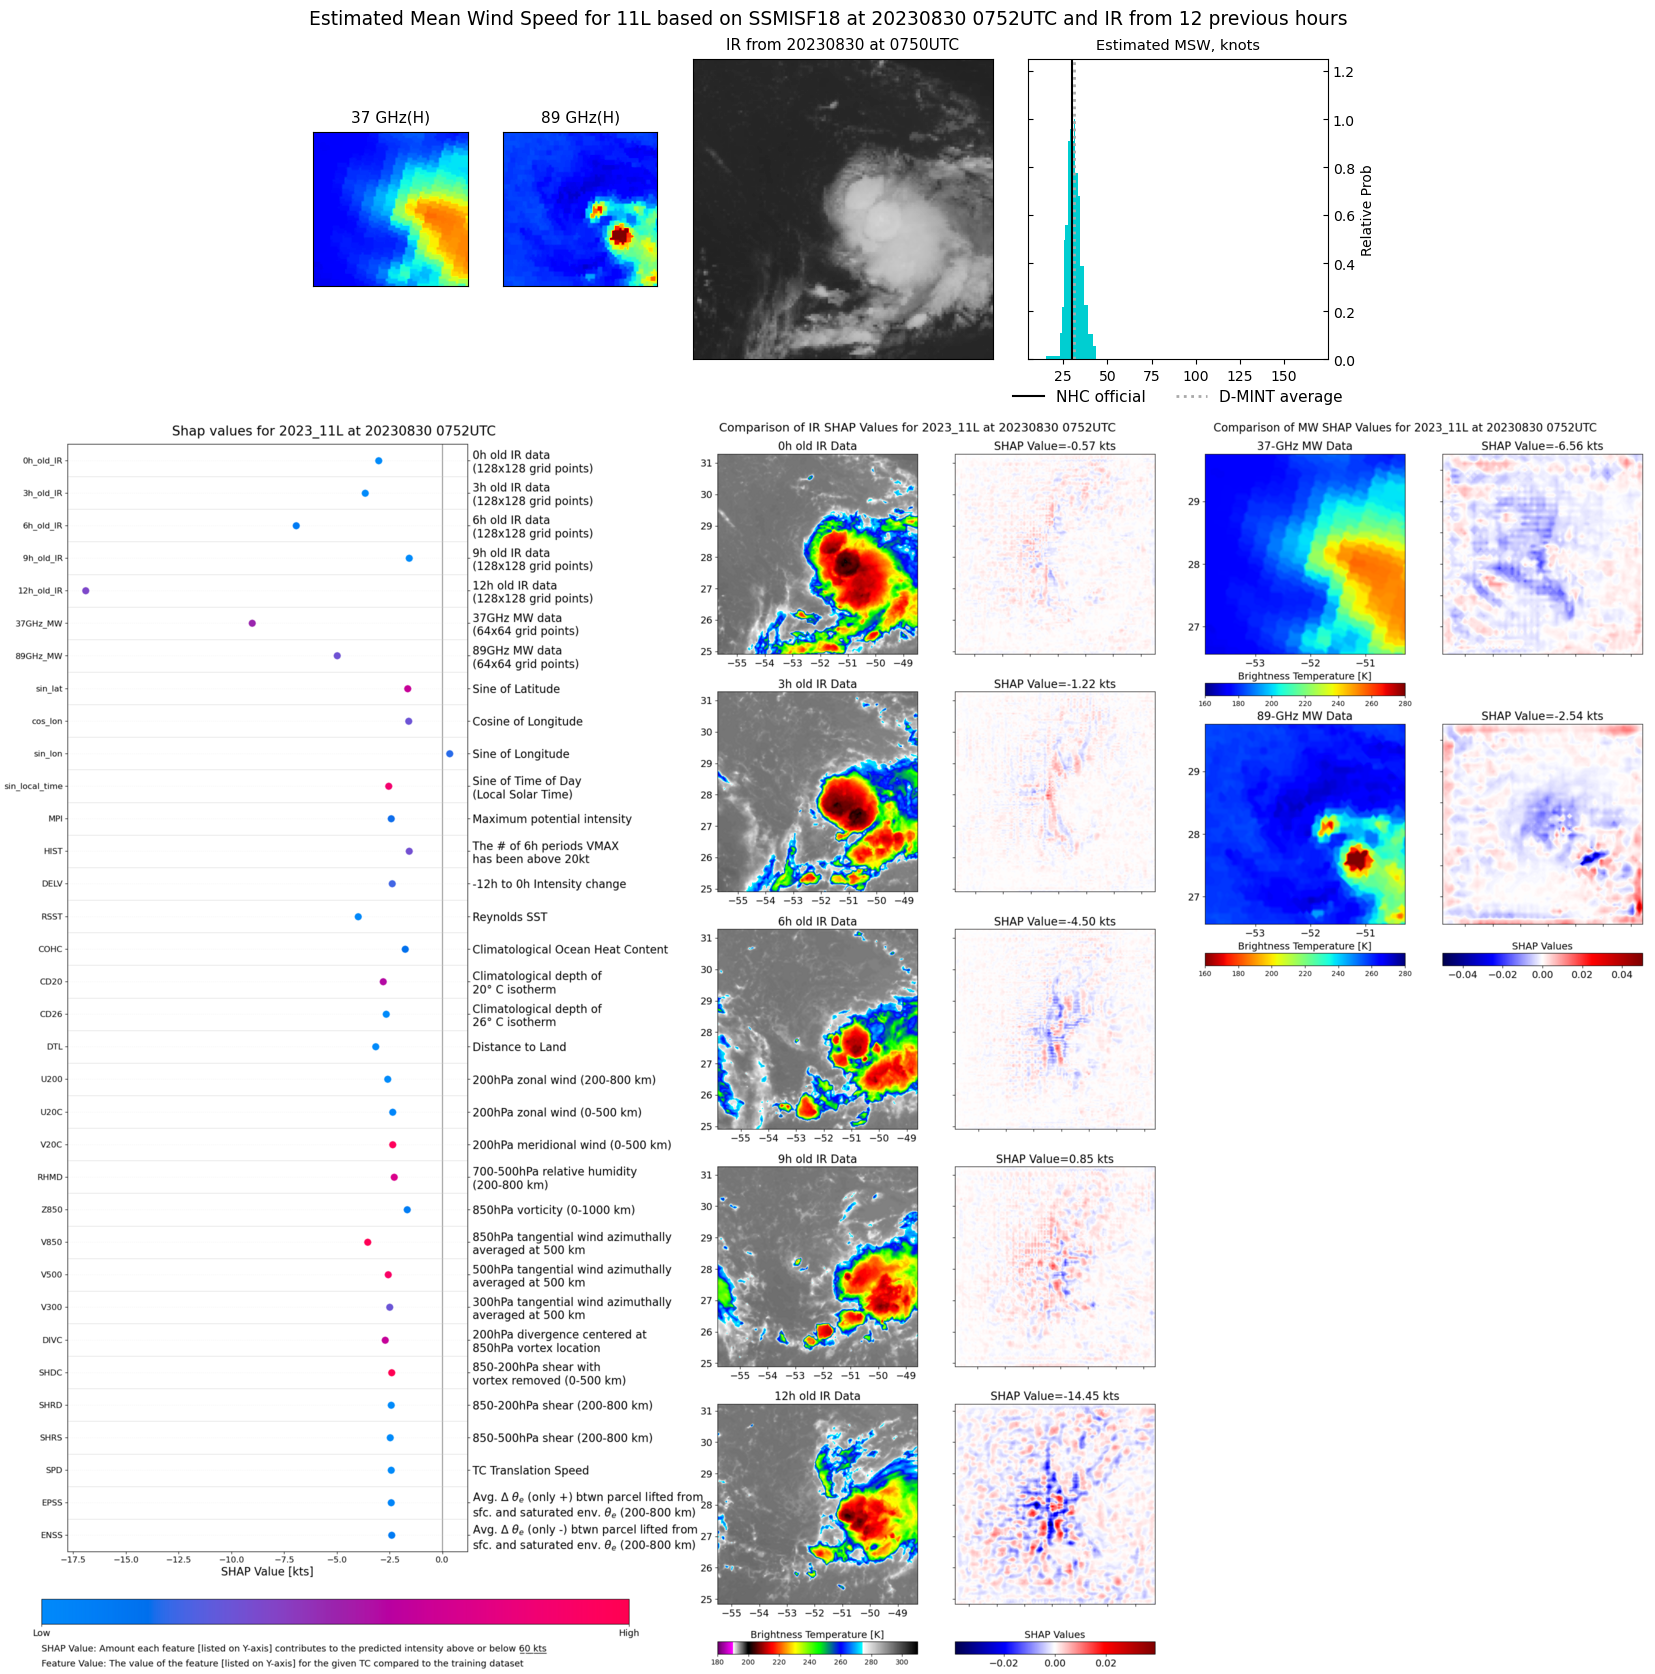 |
| 20230829 | 2114 UTC | SSMISF17 | 1013 hPa | 33 kts | 30 kts | 36 kts | 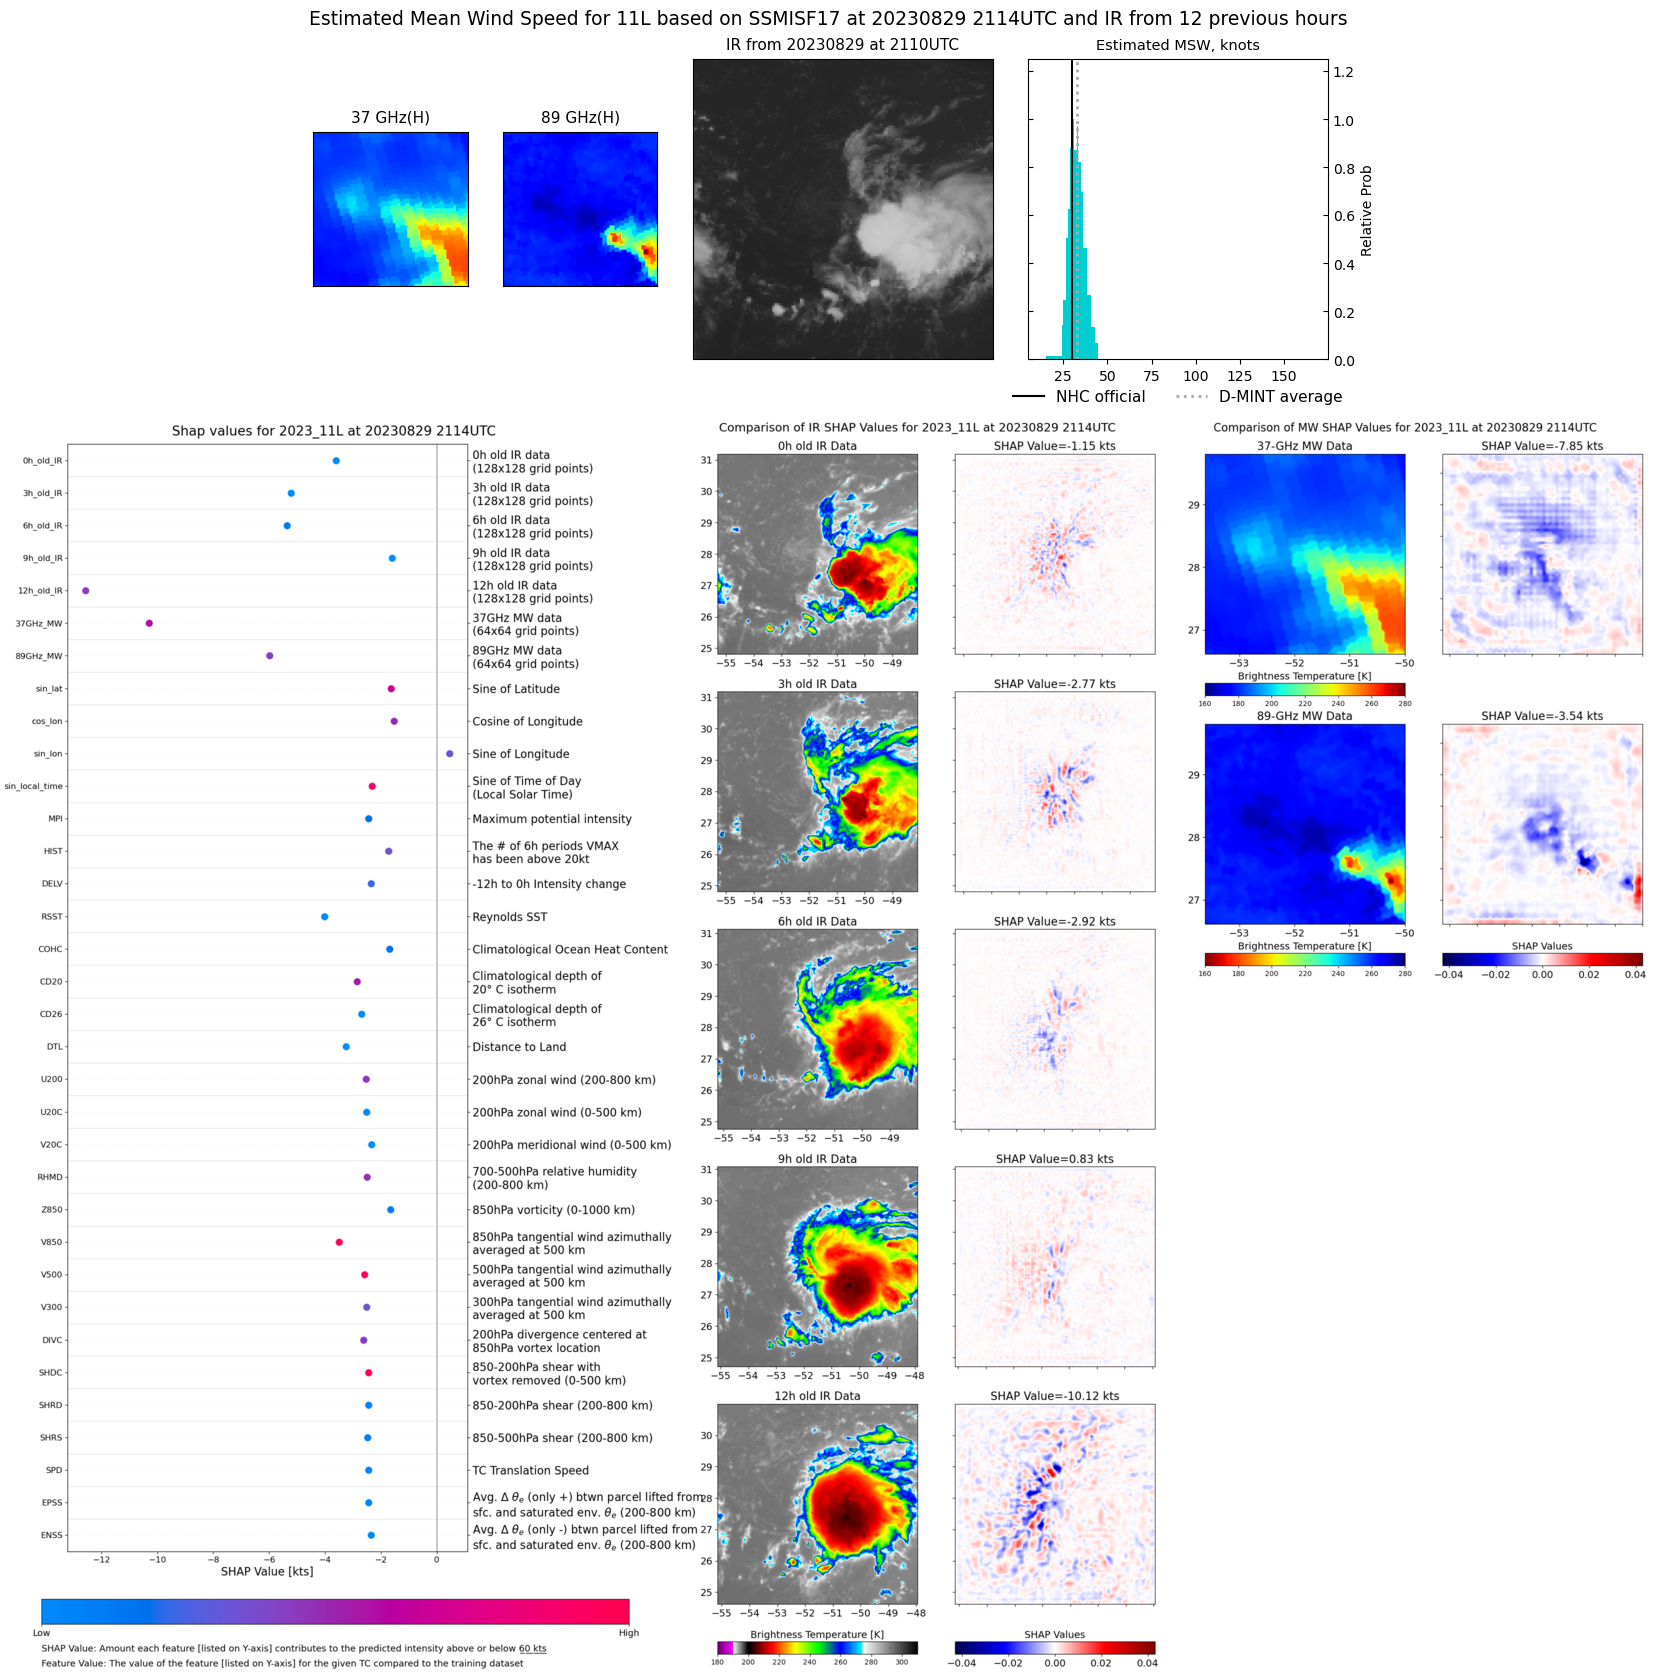 |
| 20230829 | 1924 UTC | SSMISF18 | 1013 hPa | 33 kts | 30 kts | 36 kts | 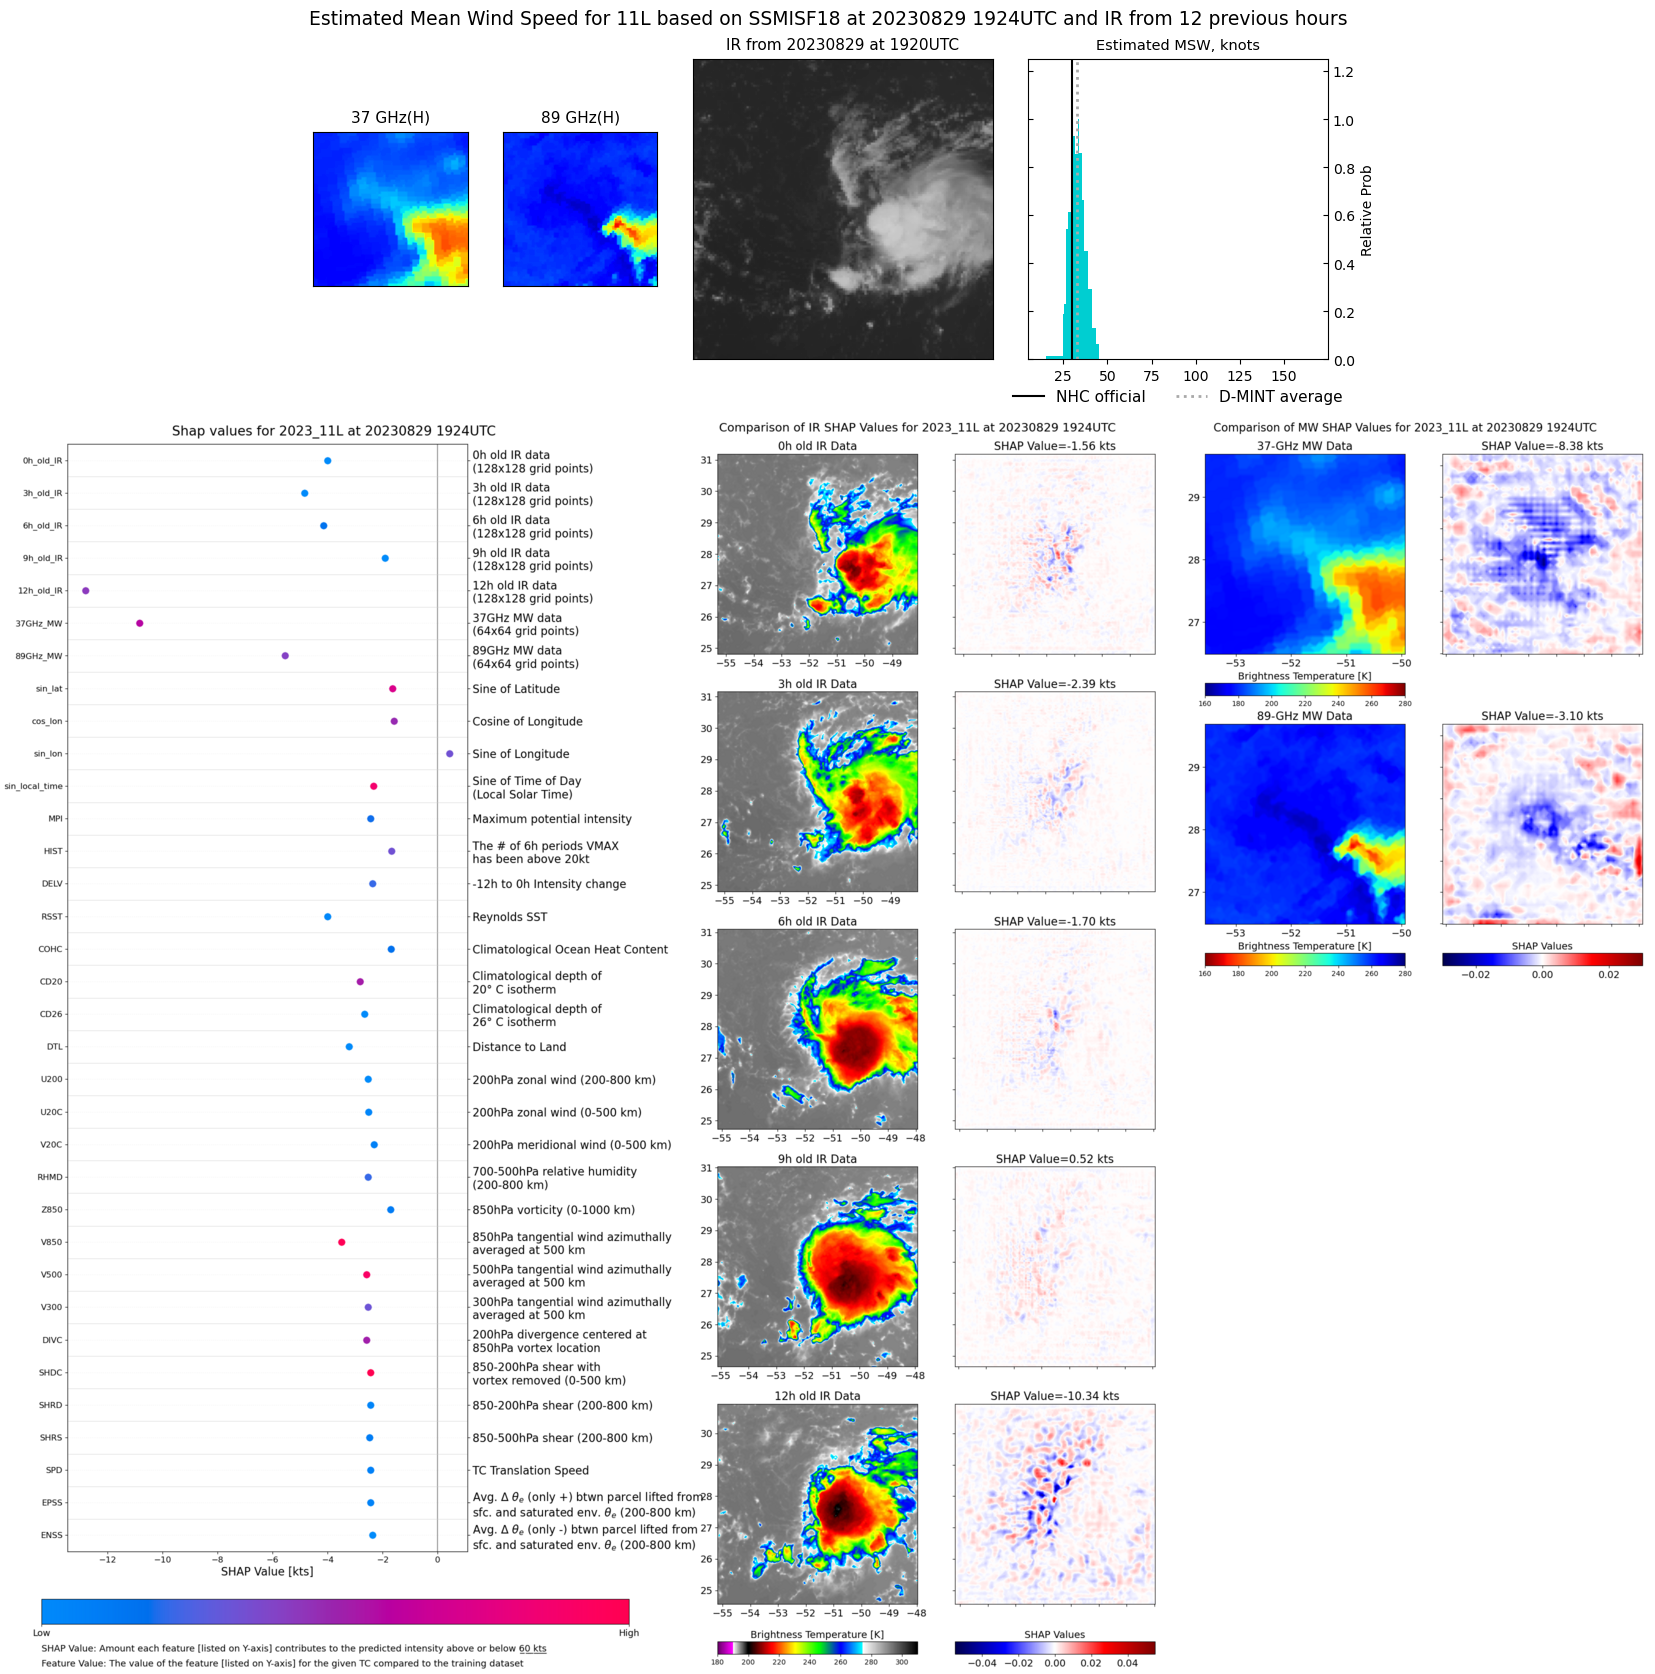 |
| 20230829 | 1610 UTC | AMSR2 | 1013 hPa | 32 kts | 29 kts | 35 kts | 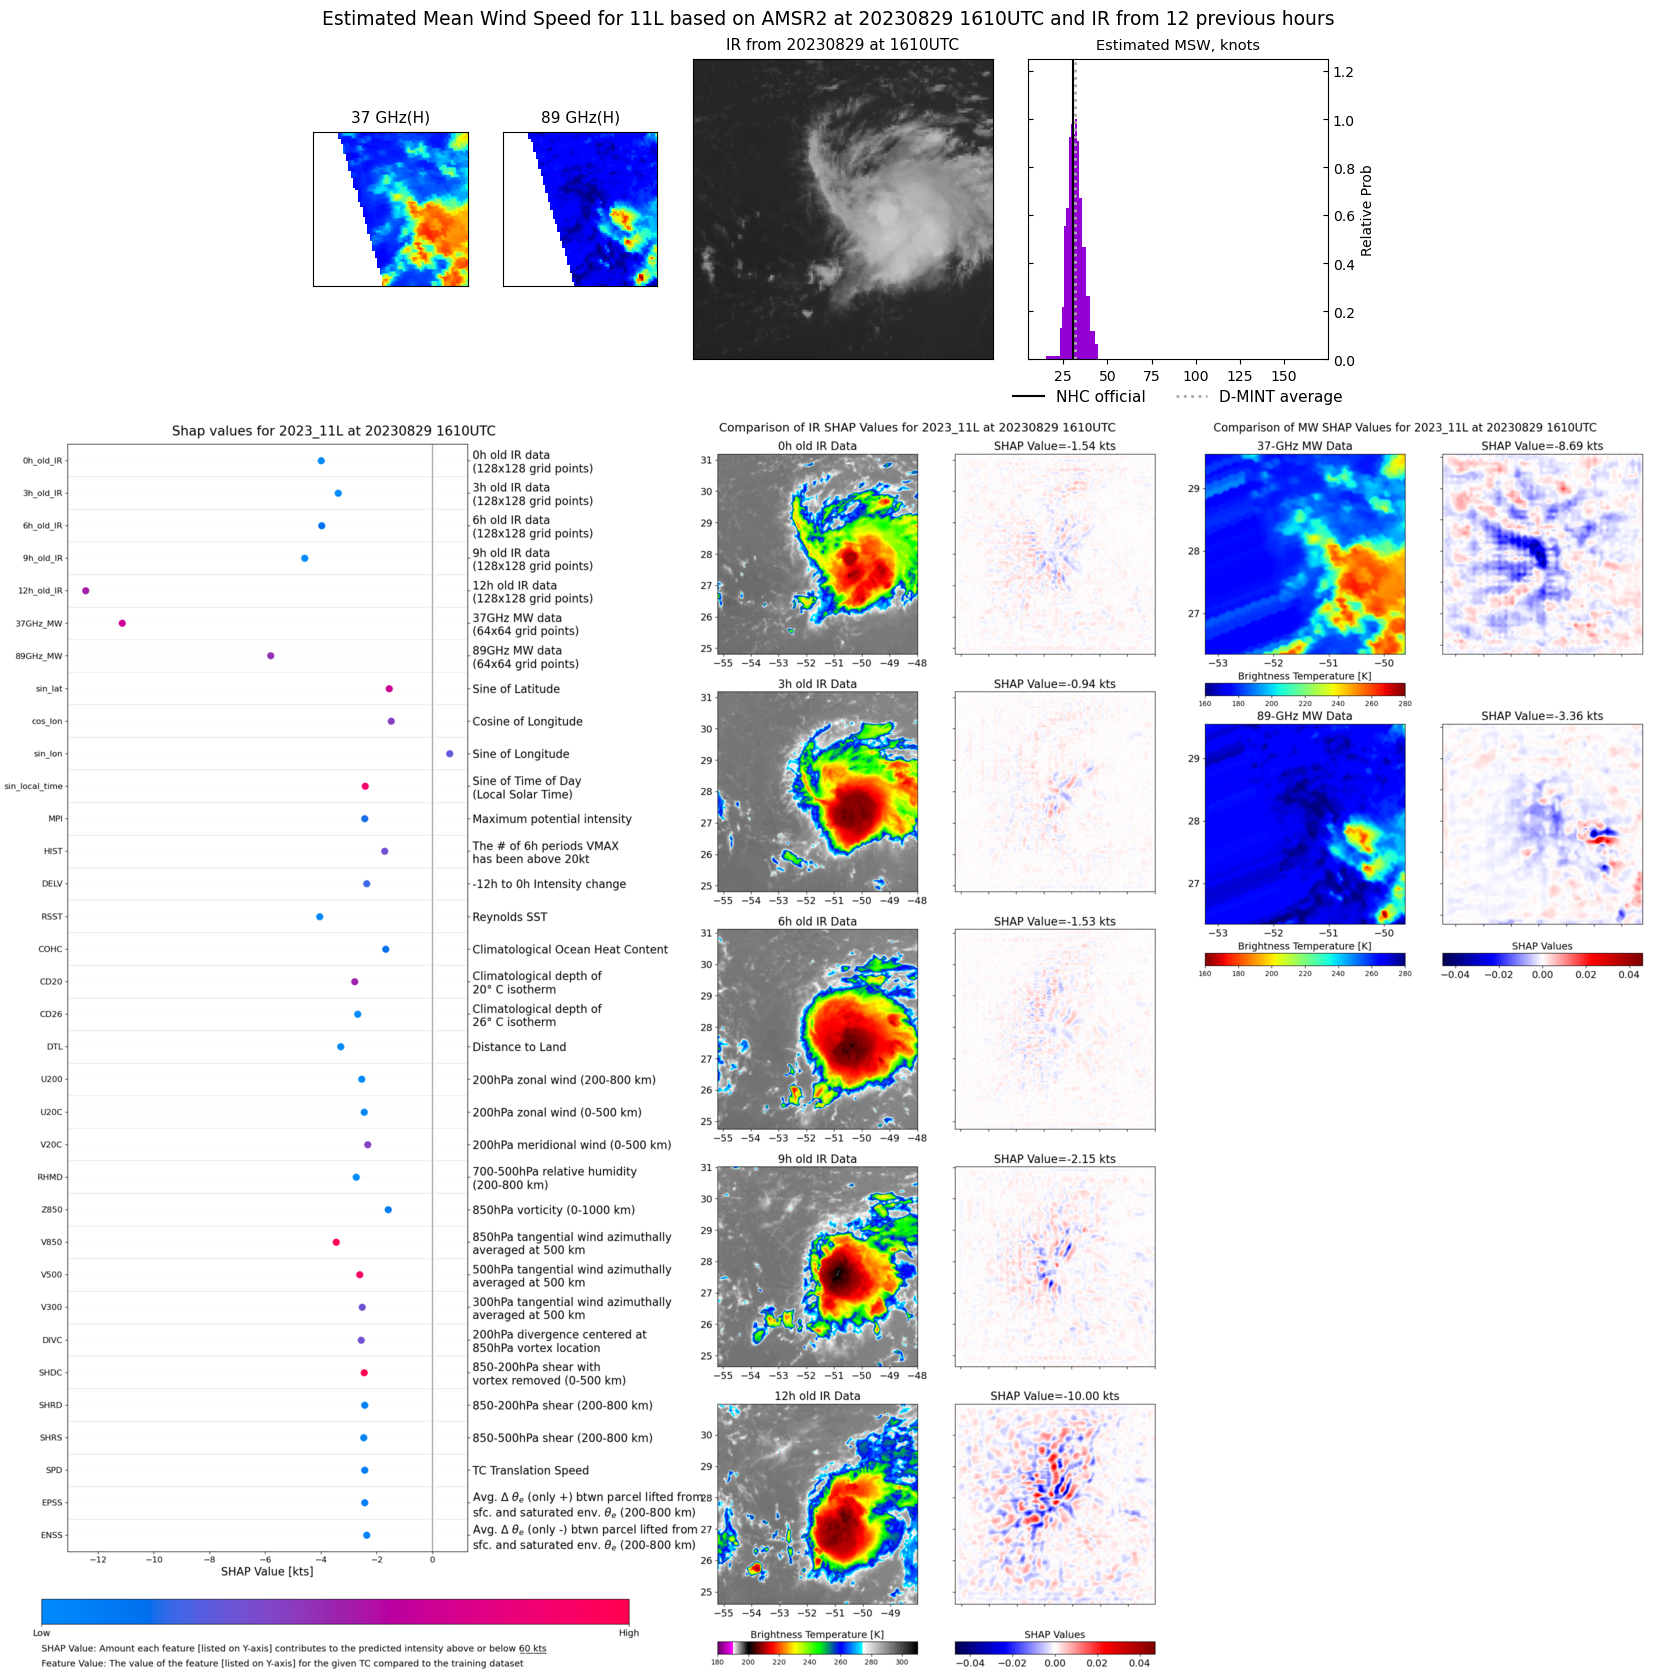 |