|
||

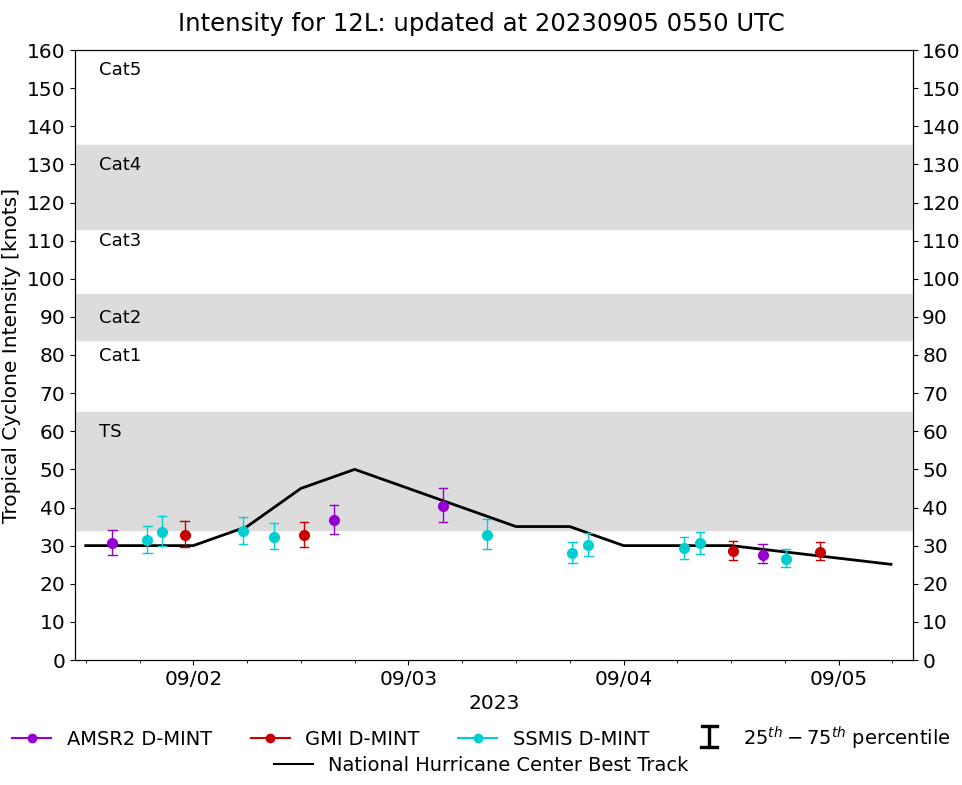 |
D-MINT HISTORY FILE for 2023_12L
| Date | Time | MW Sensor | MSLP | Vmax (30th-70th percentile average) | Vmax 25th percentile | Vmax 75th percentile | Image |
| 20230904 | 2156 UTC | GMI | 1012 hPa | 28 kts | 26 kts | 31 kts | 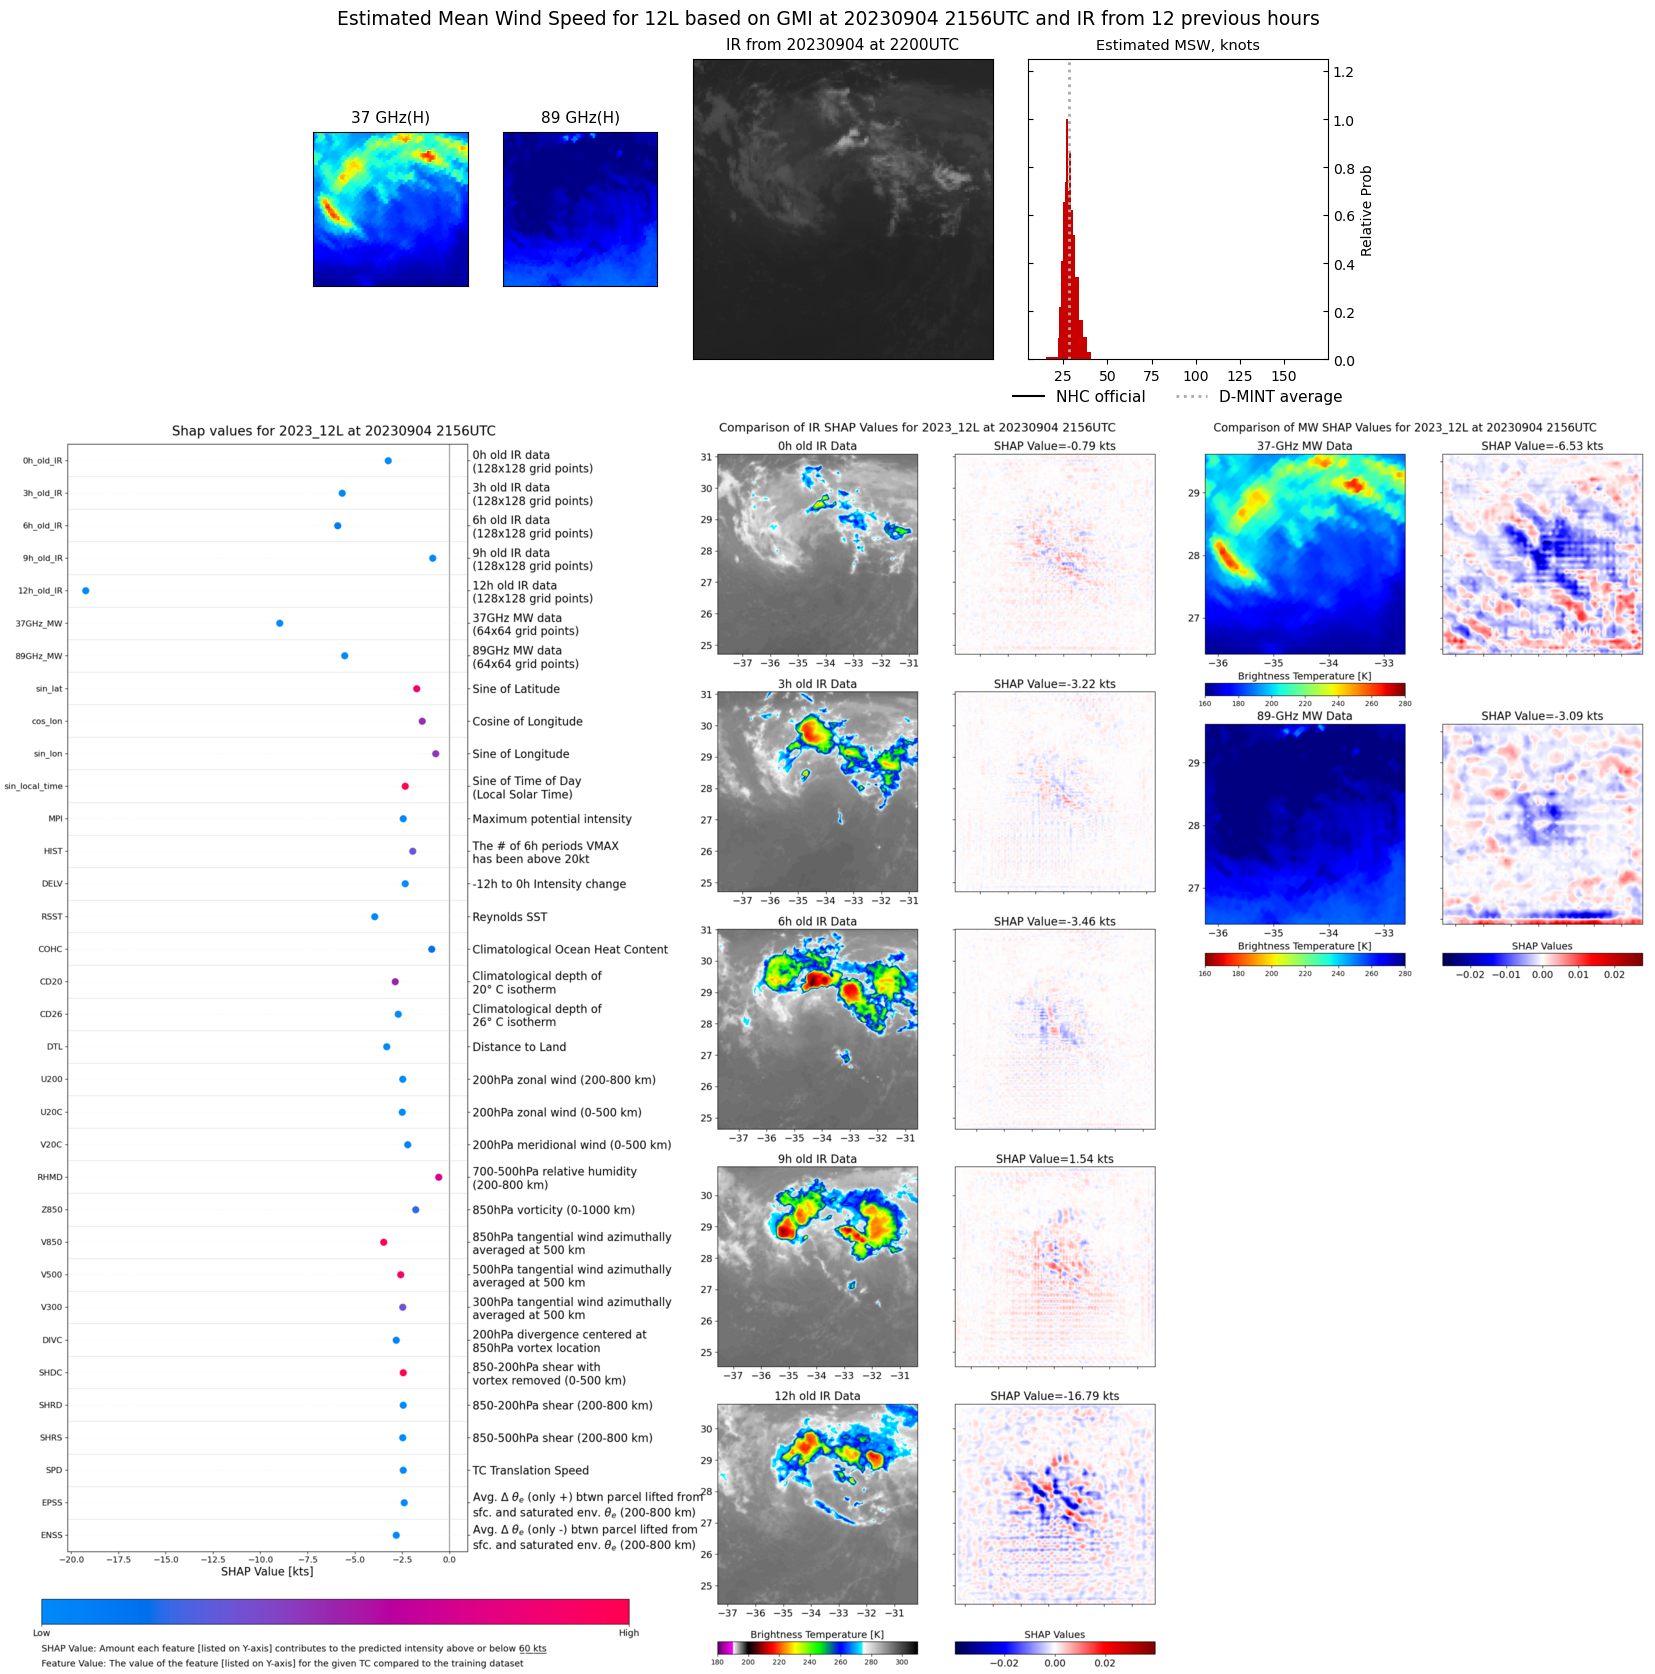 |
| 20230904 | 1804 UTC | SSMISF18 | 1012 hPa | 26 kts | 24 kts | 29 kts | 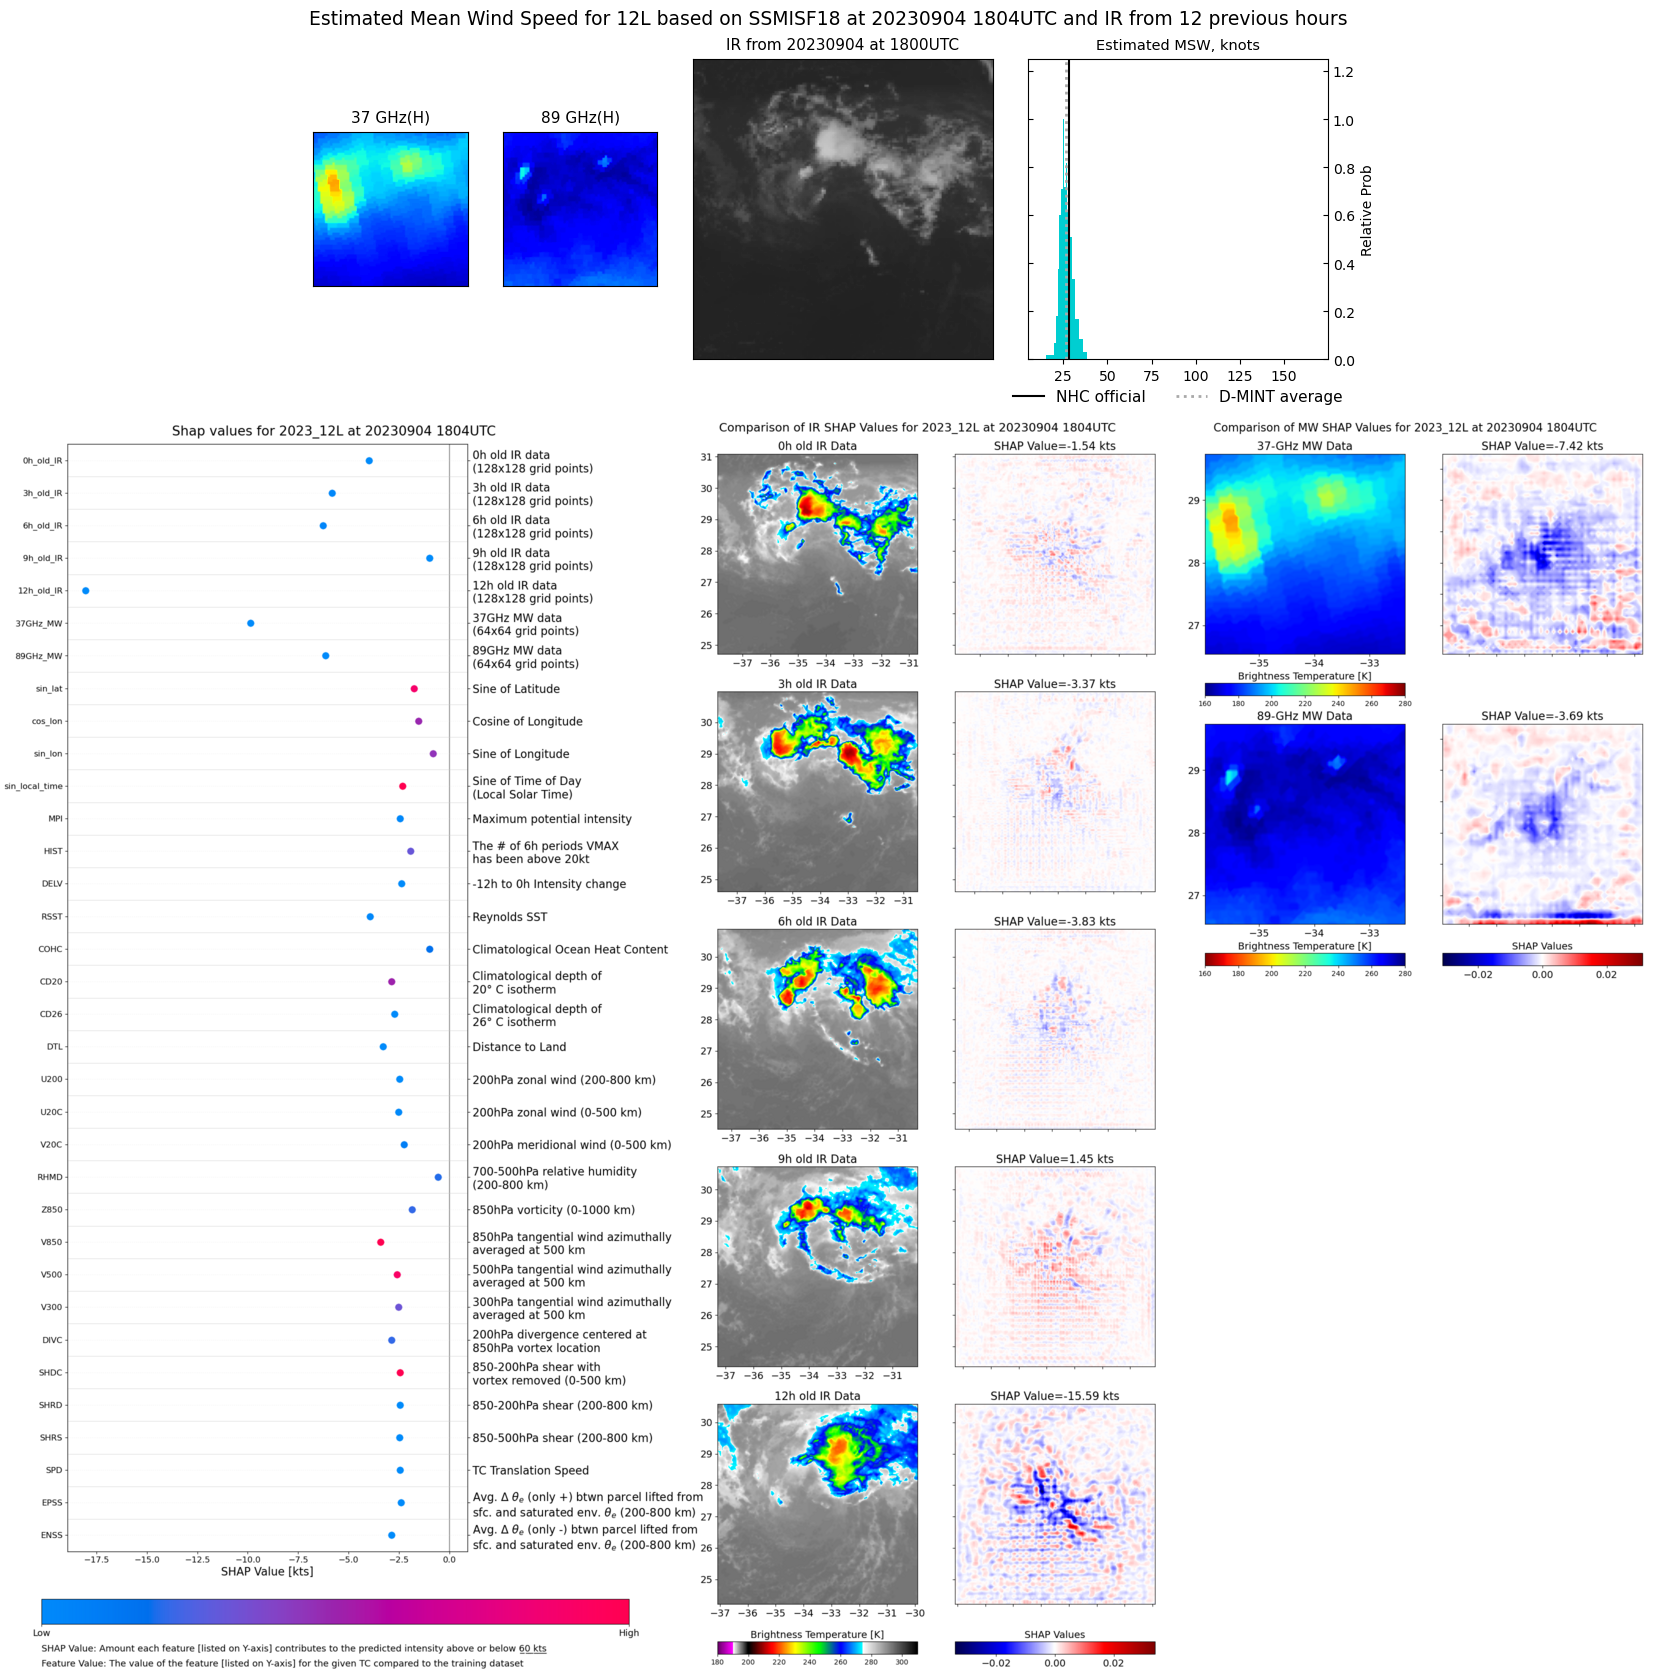 |
| 20230904 | 1531 UTC | AMSR2 | 1010 hPa | 28 kts | 25 kts | 30 kts |  |
| 20230904 | 1211 UTC | GMI | 1011 hPa | 29 kts | 26 kts | 31 kts | 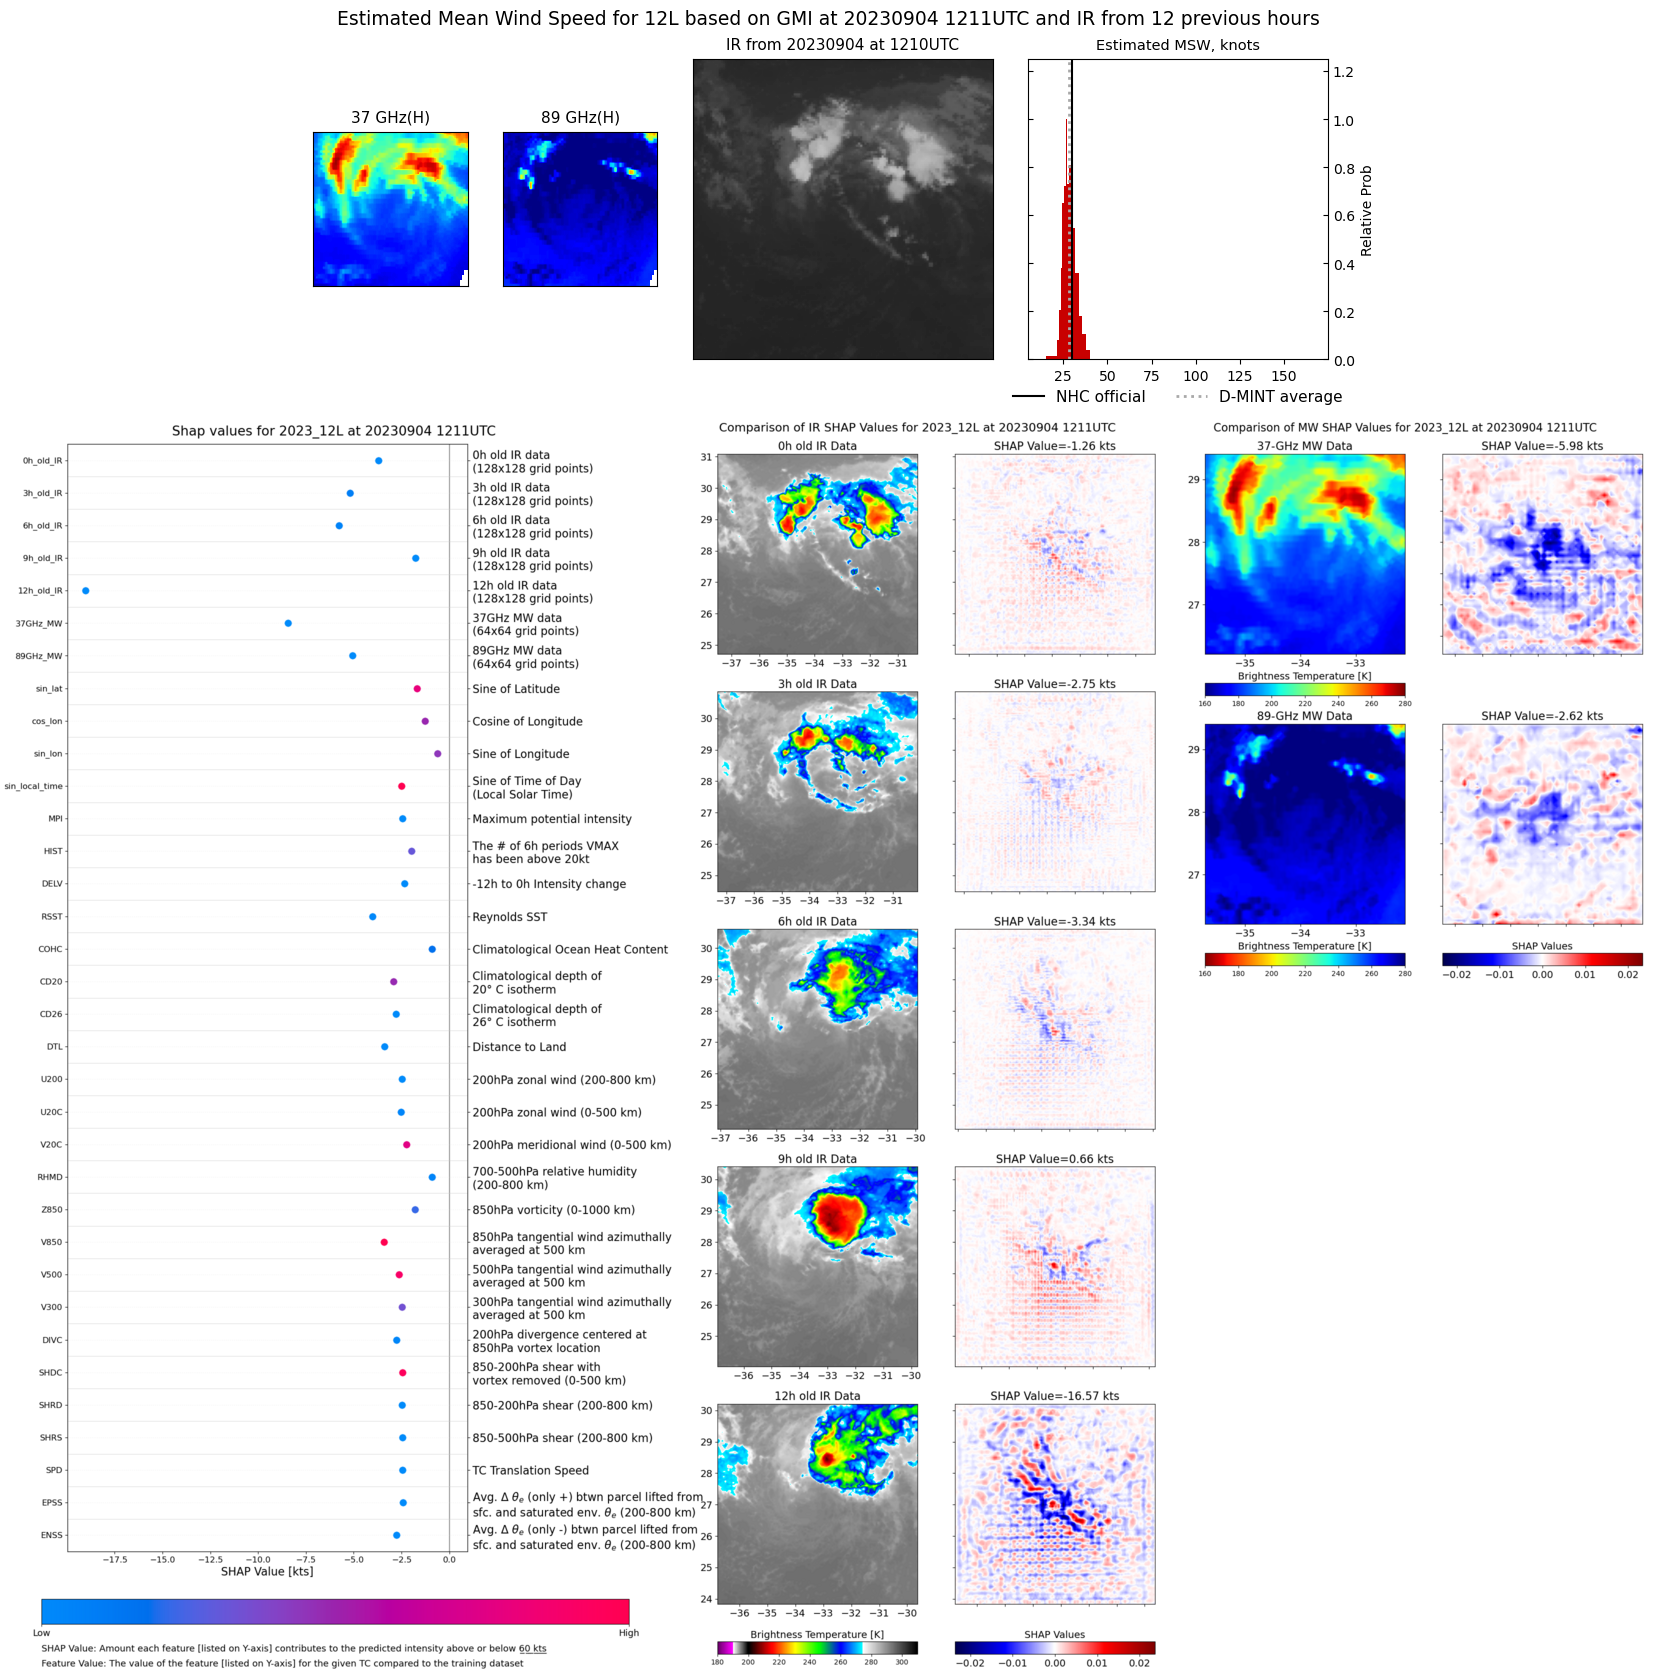 |
| 20230904 | 0833 UTC | SSMISF17 | 1009 hPa | 31 kts | 28 kts | 34 kts | 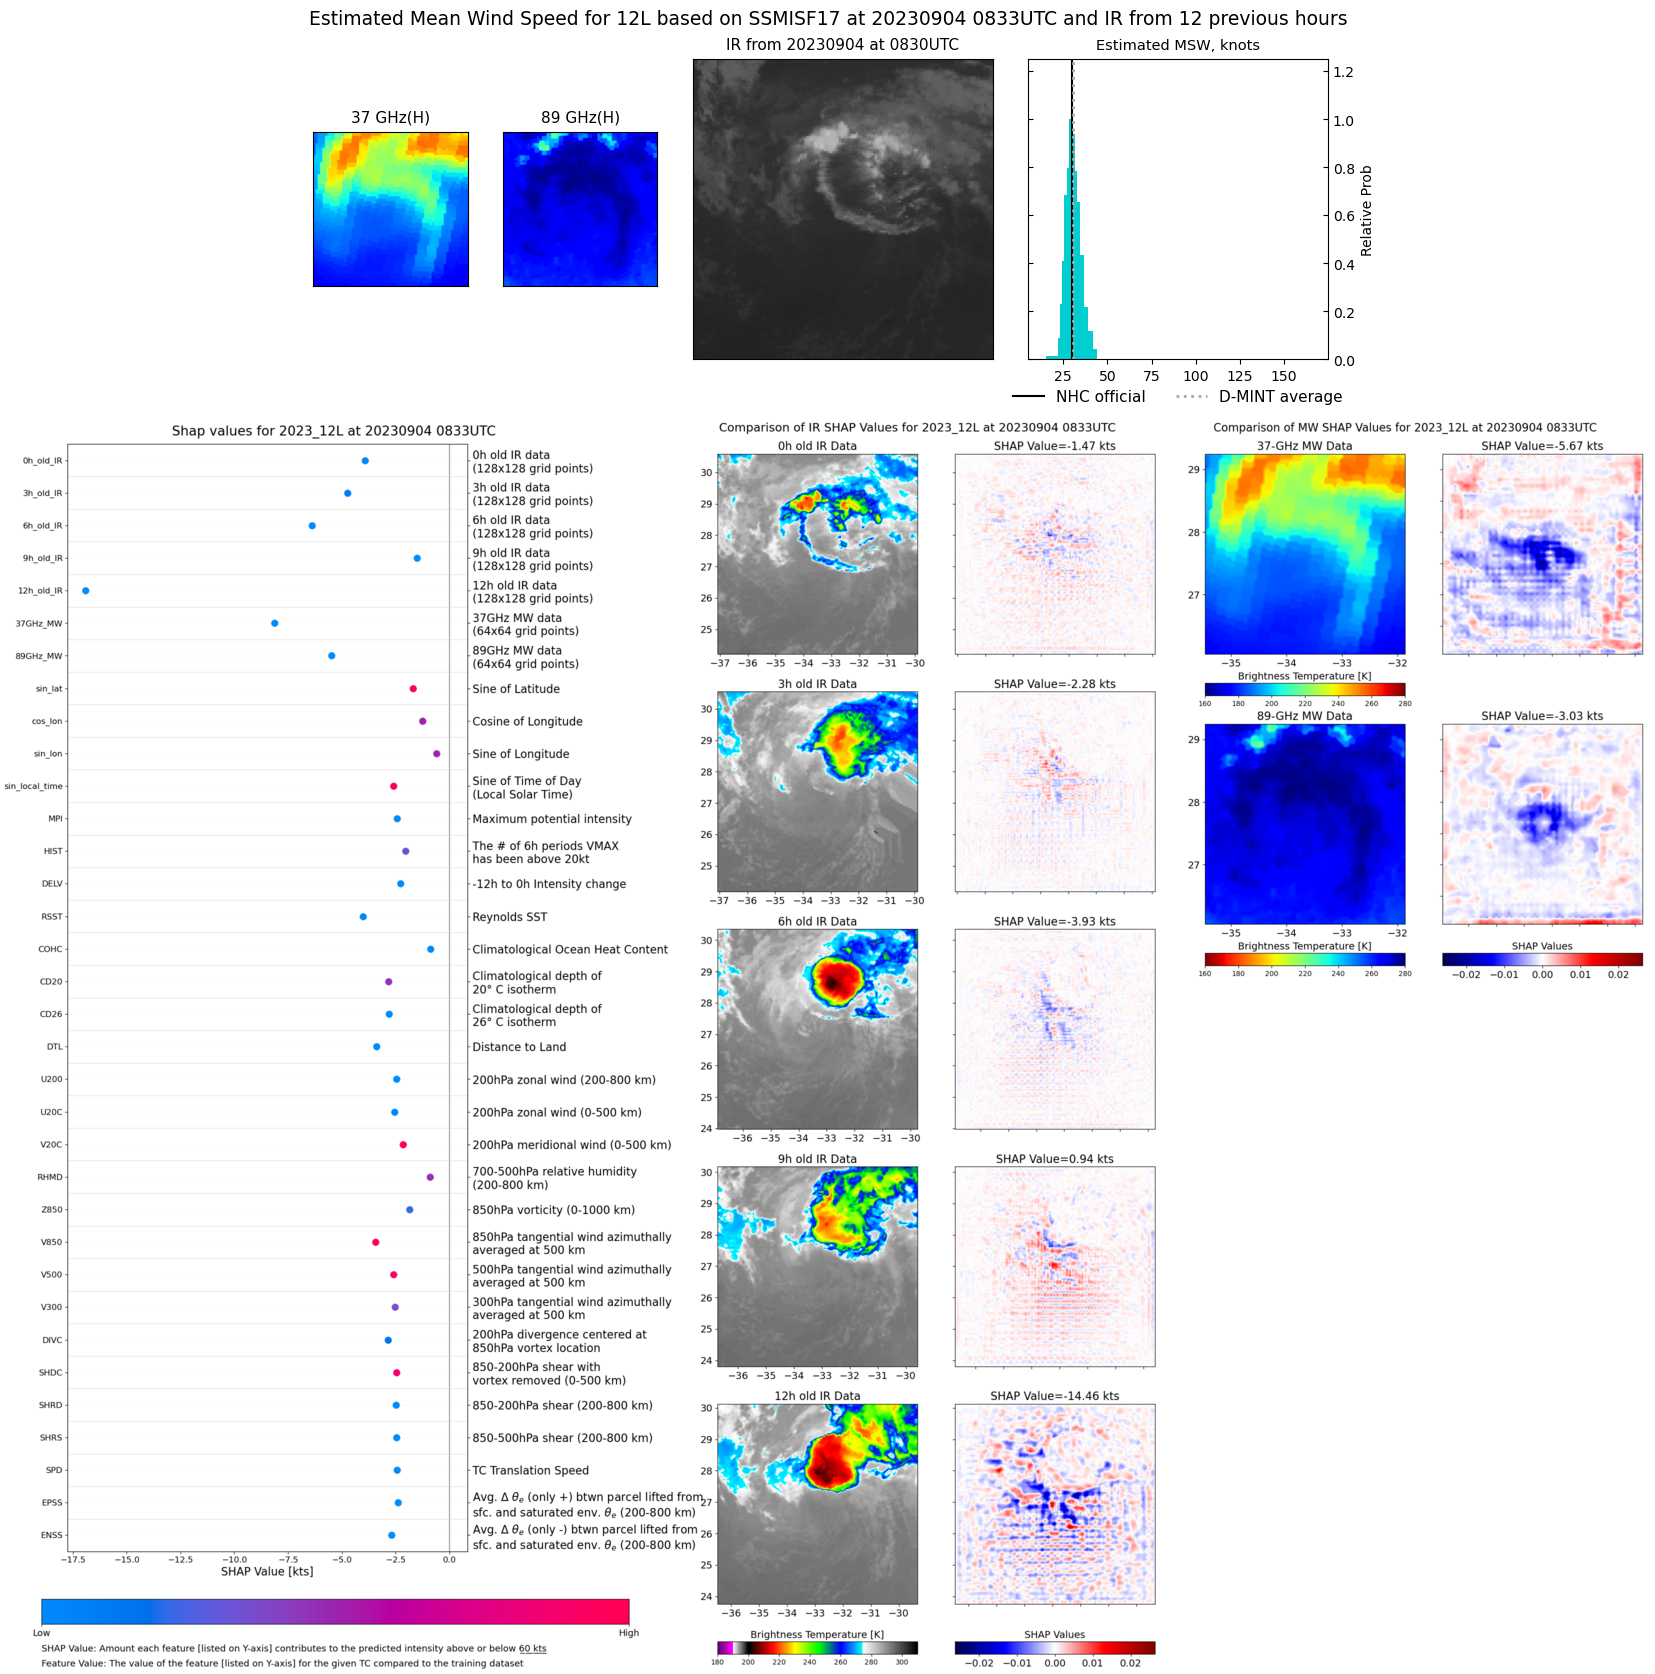 |
| 20230904 | 0646 UTC | SSMISF18 | 1008 hPa | 29 kts | 27 kts | 32 kts | 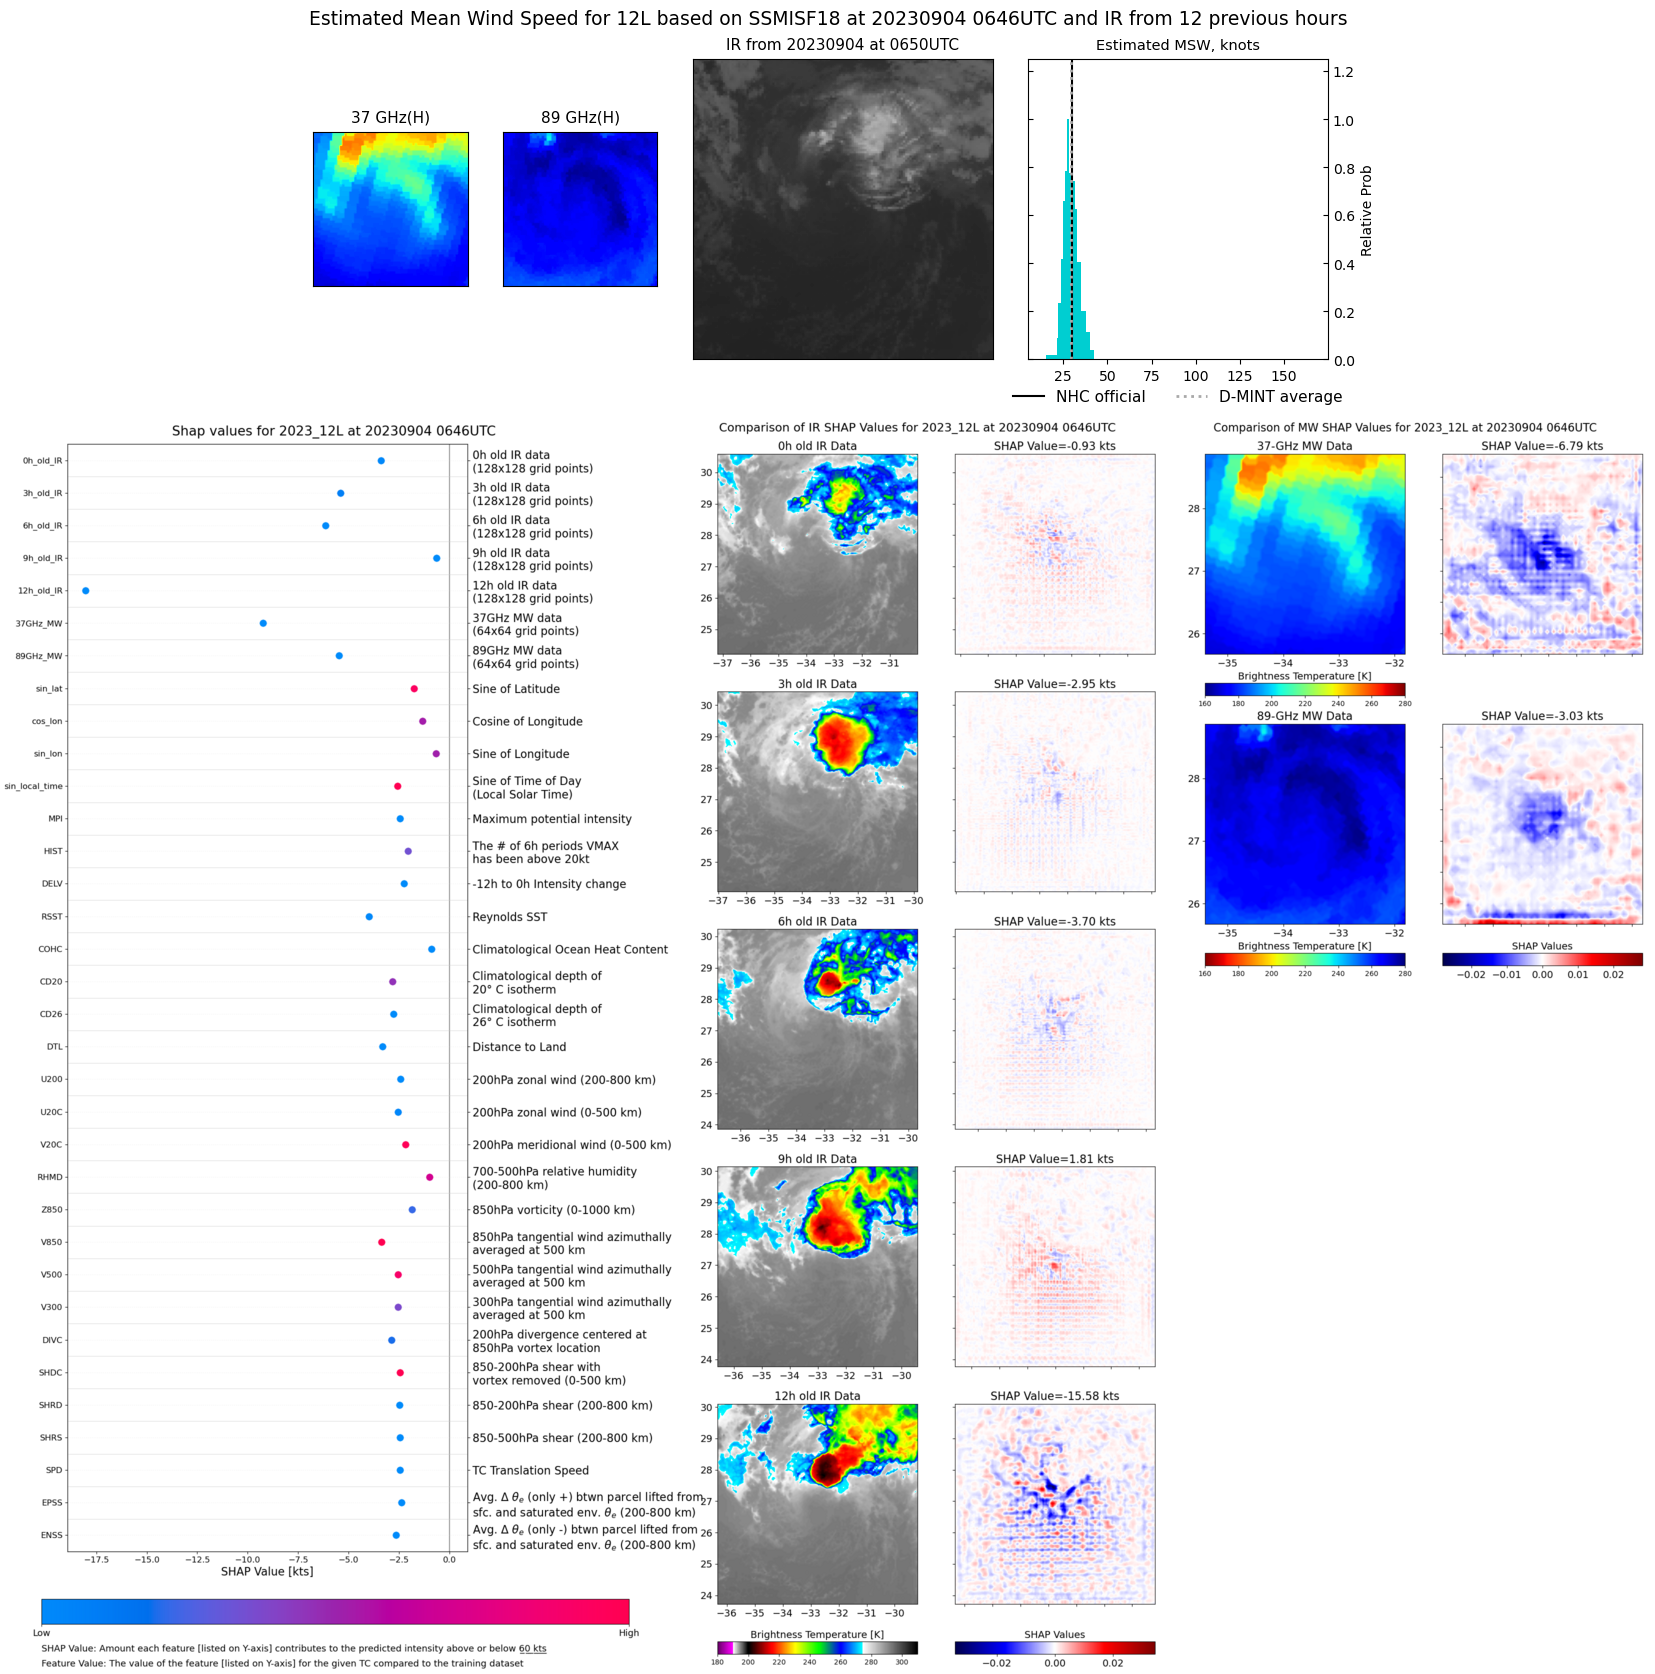 |
| 20230903 | 2005 UTC | SSMISF17 | 1009 hPa | 30 kts | 27 kts | 33 kts |  |
| 20230903 | 1818 UTC | SSMISF18 | 1008 hPa | 28 kts | 25 kts | 31 kts | 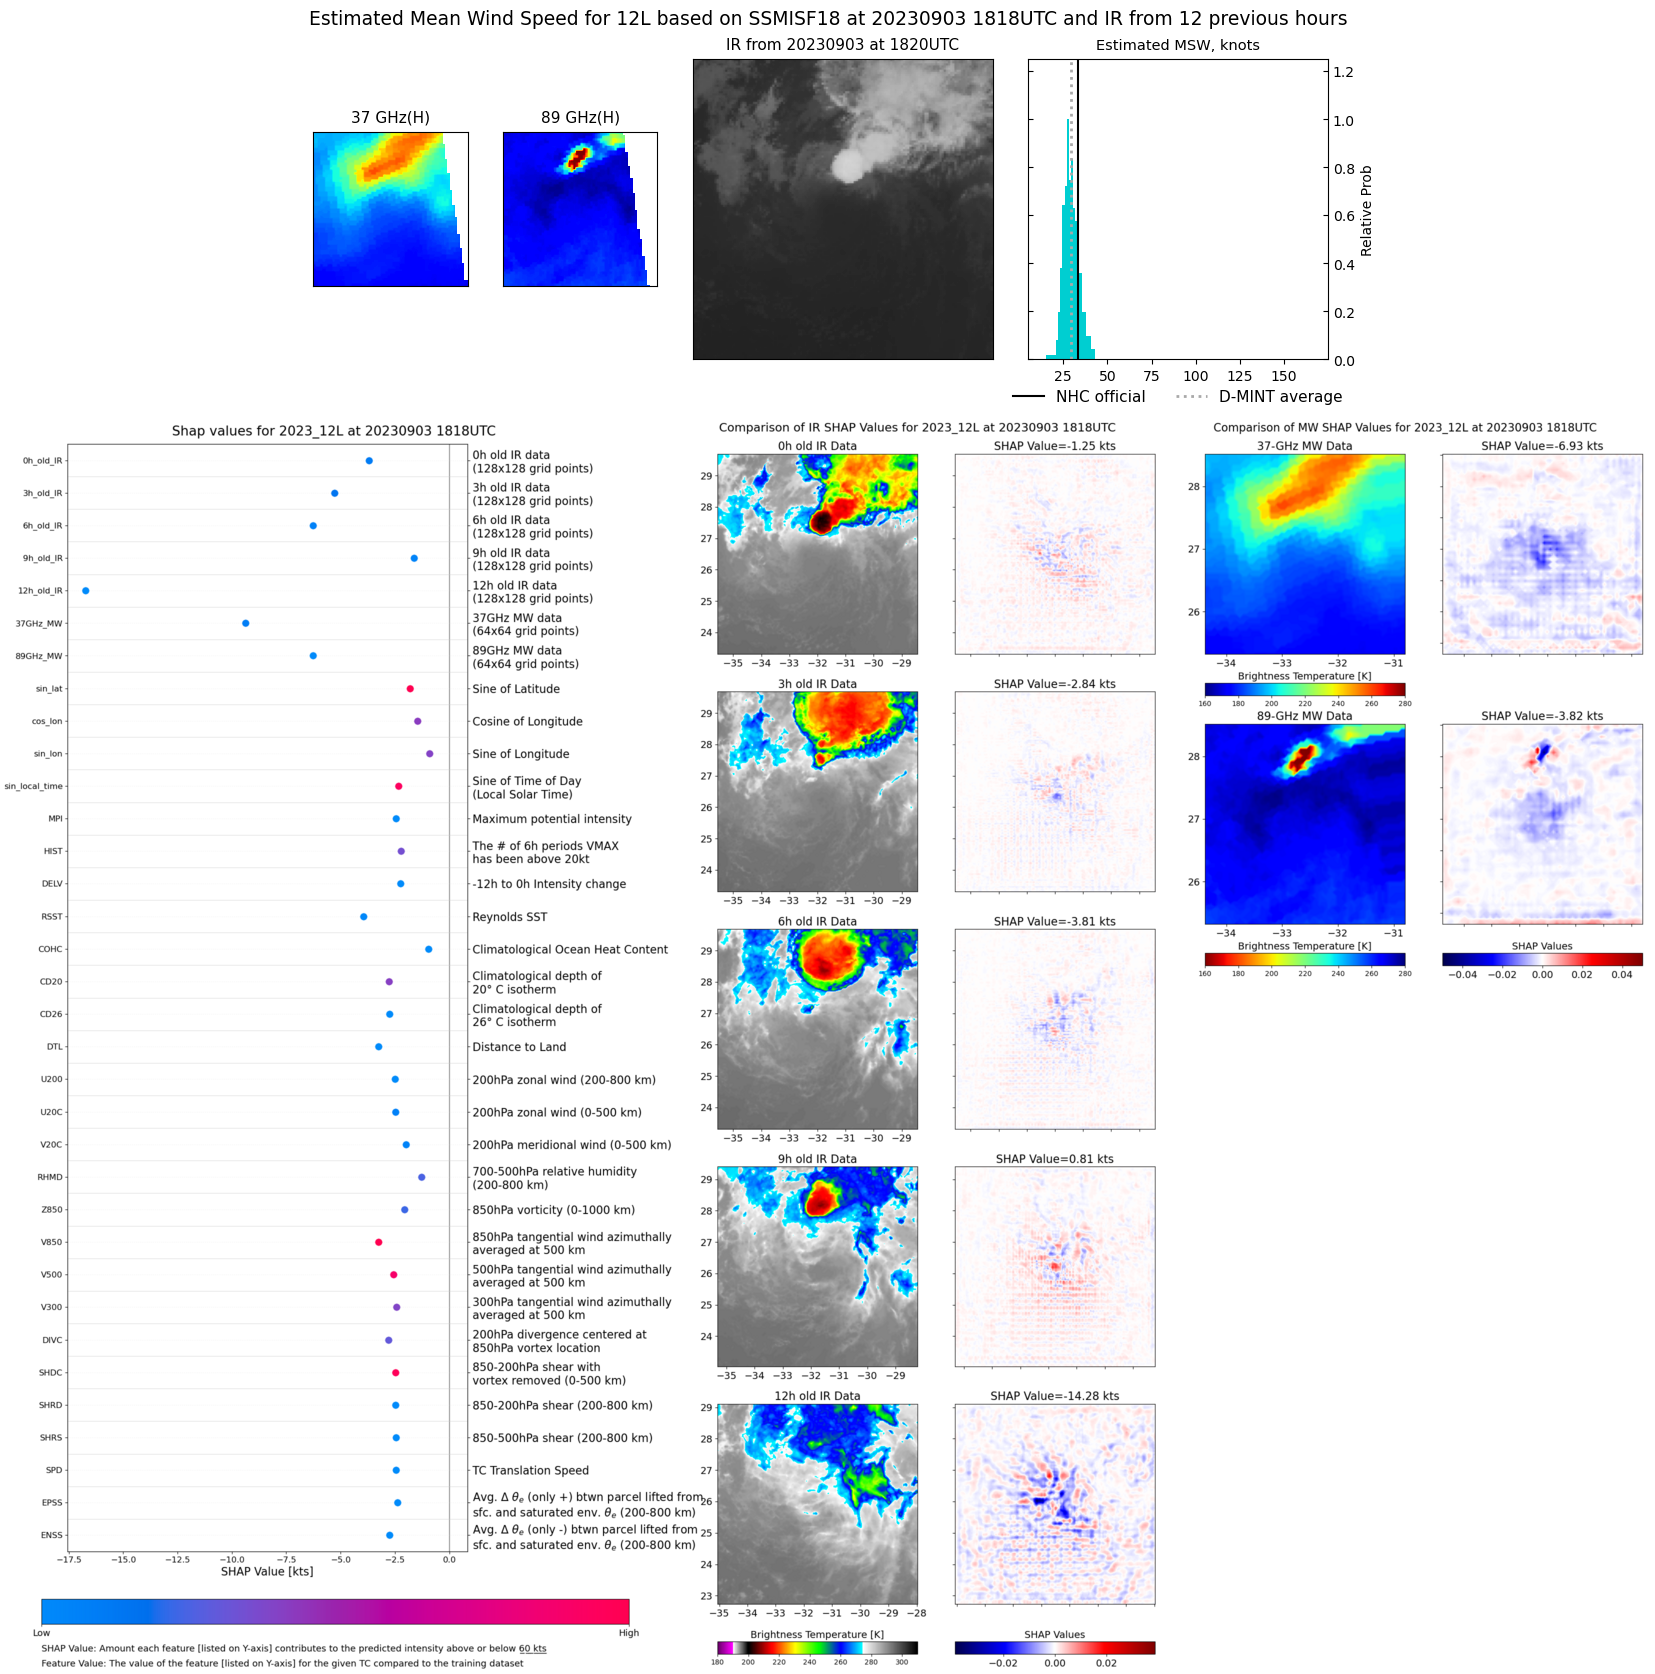 |
| 20230903 | 0847 UTC | SSMISF17 | 1005 hPa | 33 kts | 29 kts | 37 kts | 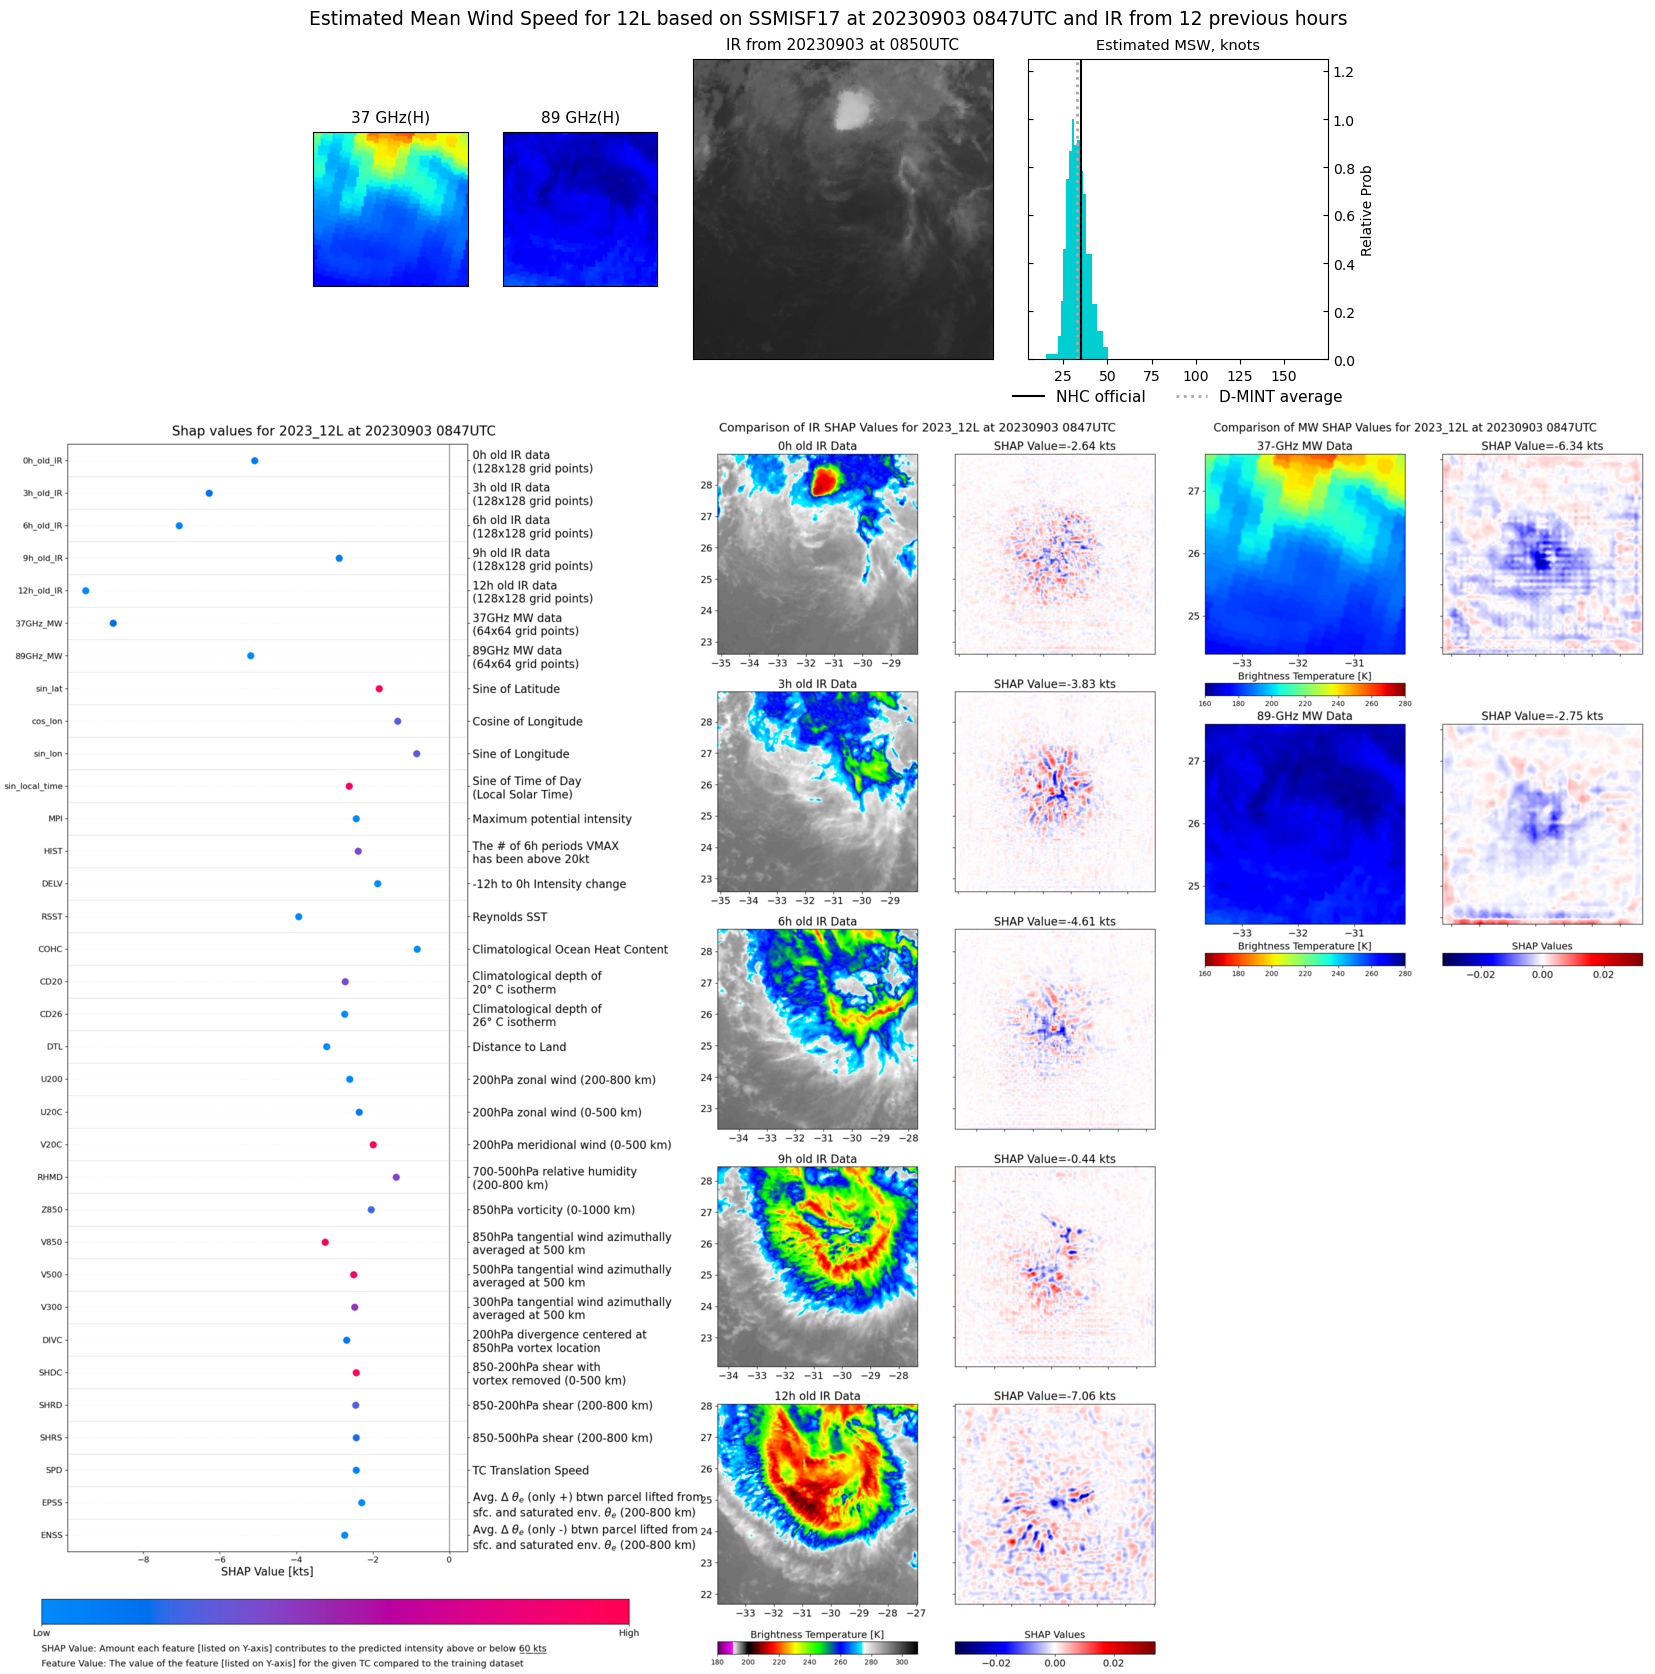 |
| 20230903 | 0351 UTC | AMSR2 | 1001 hPa | 40 kts | 36 kts | 45 kts | 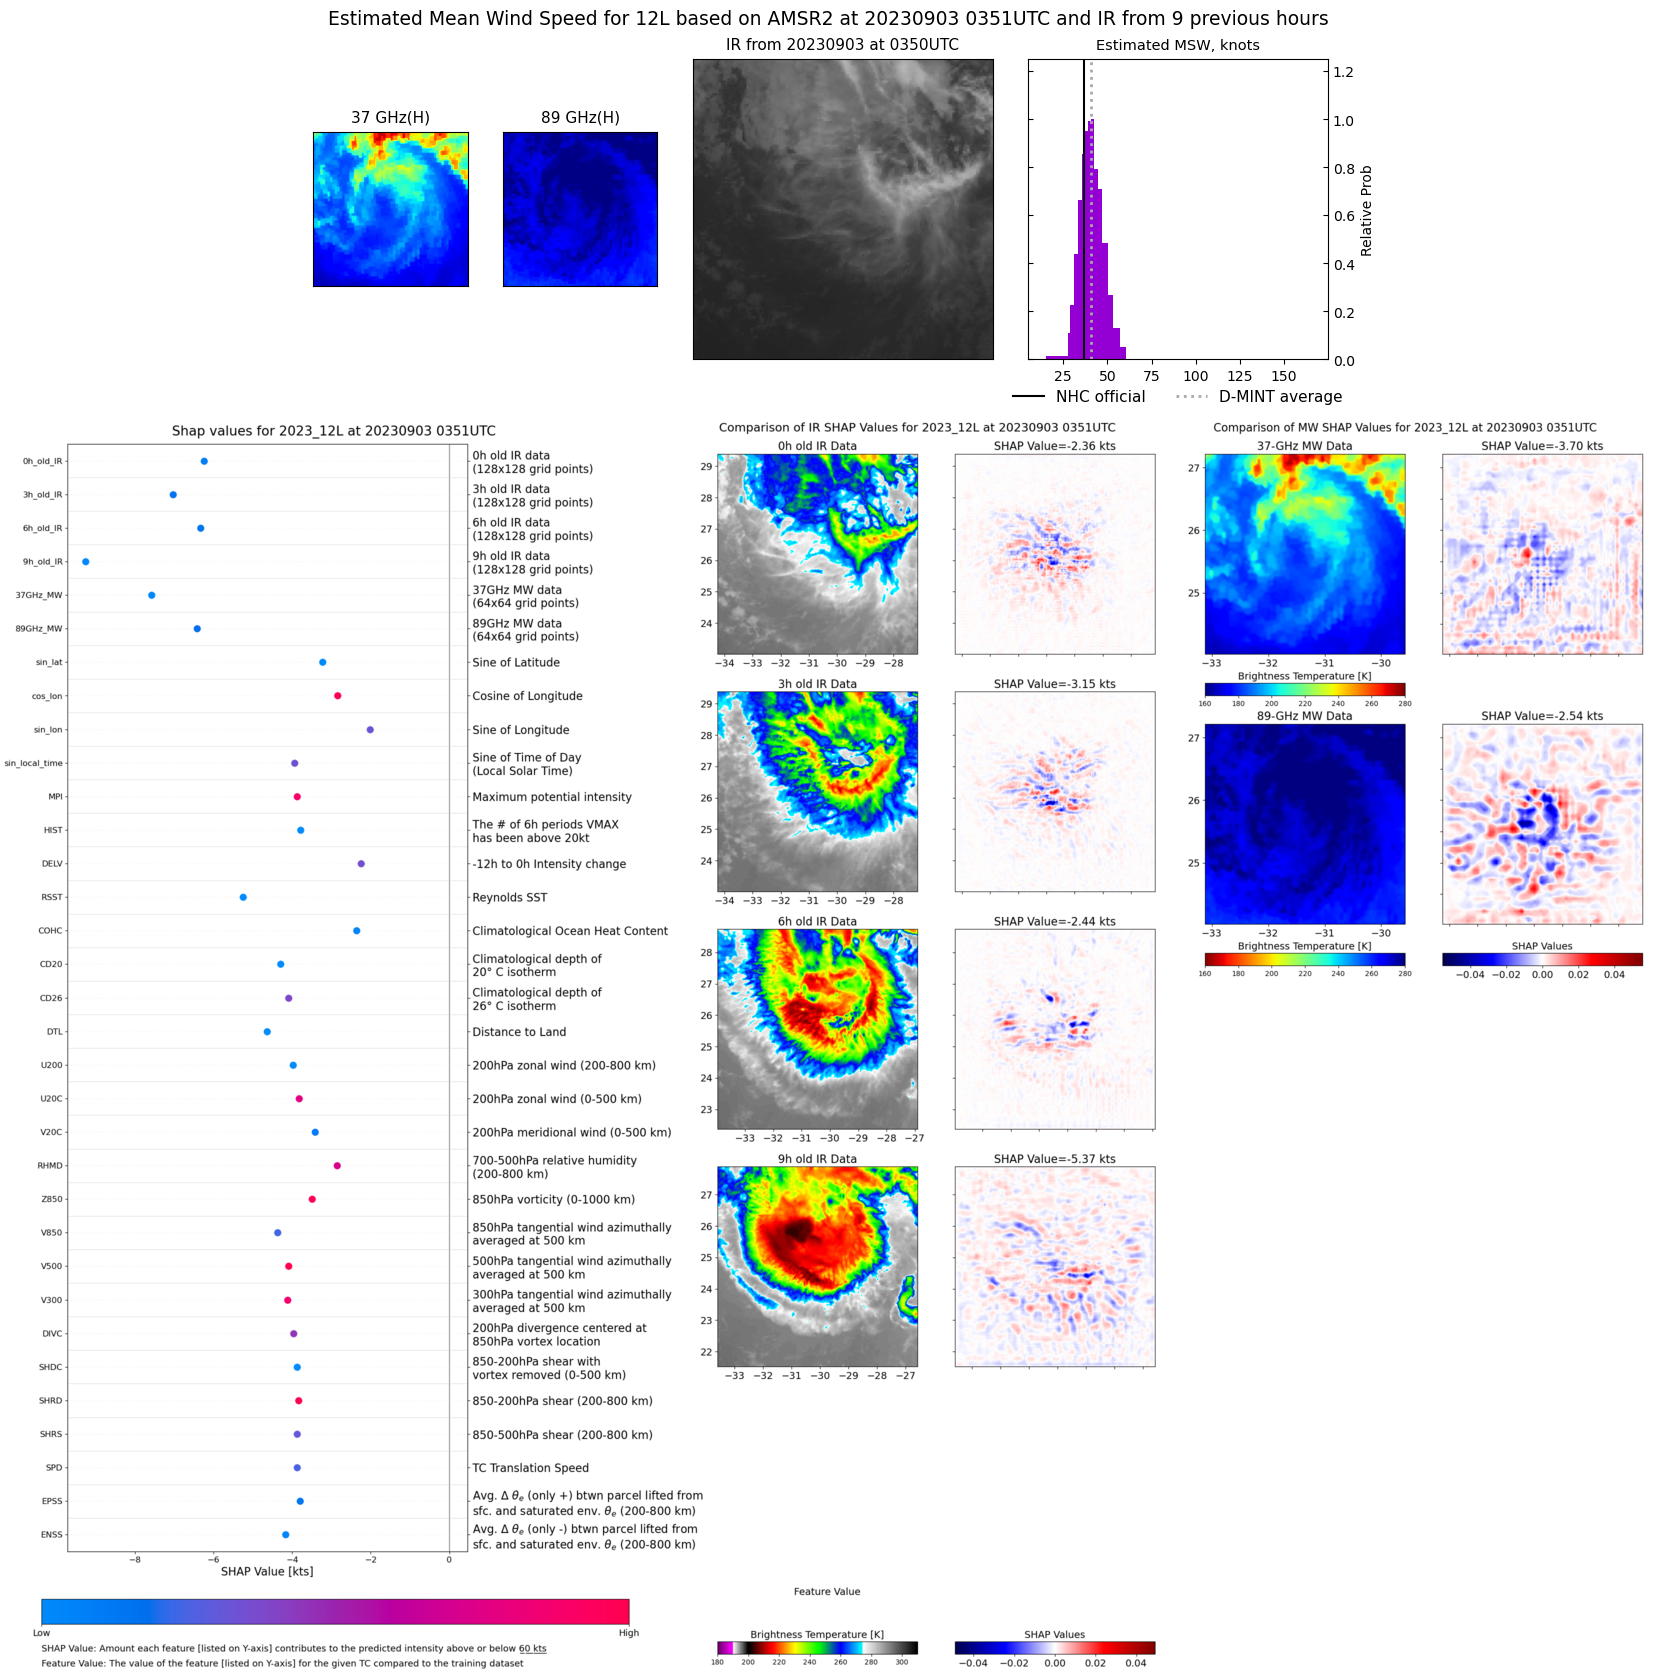 |
| 20230902 | 1543 UTC | AMSR2 | 1007 hPa | 37 kts | 33 kts | 41 kts | 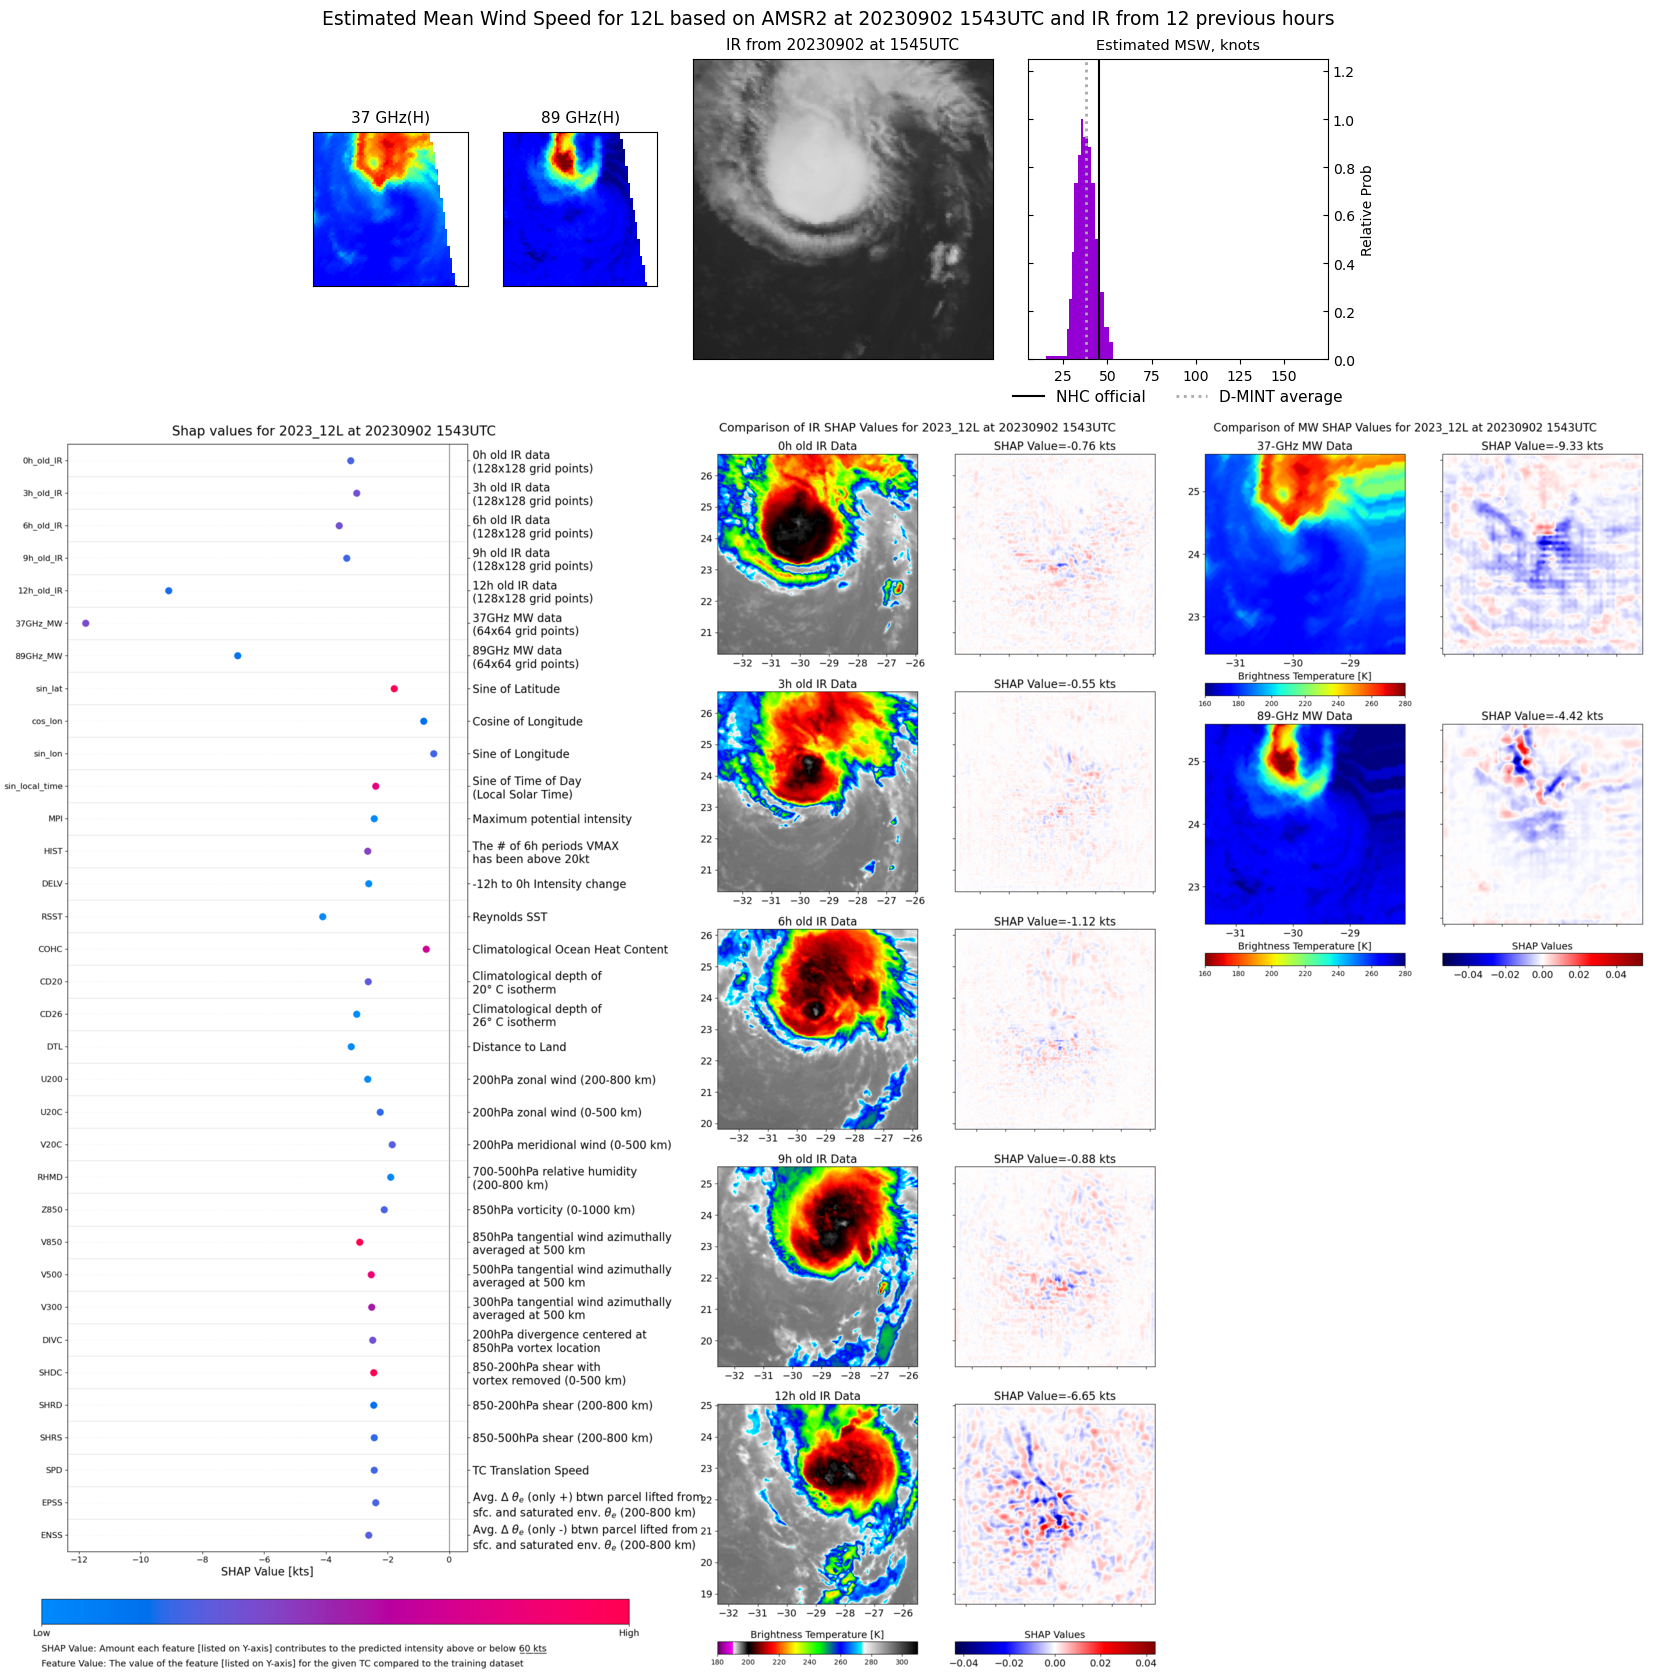 |
| 20230902 | 1221 UTC | GMI | 1006 hPa | 33 kts | 30 kts | 36 kts | 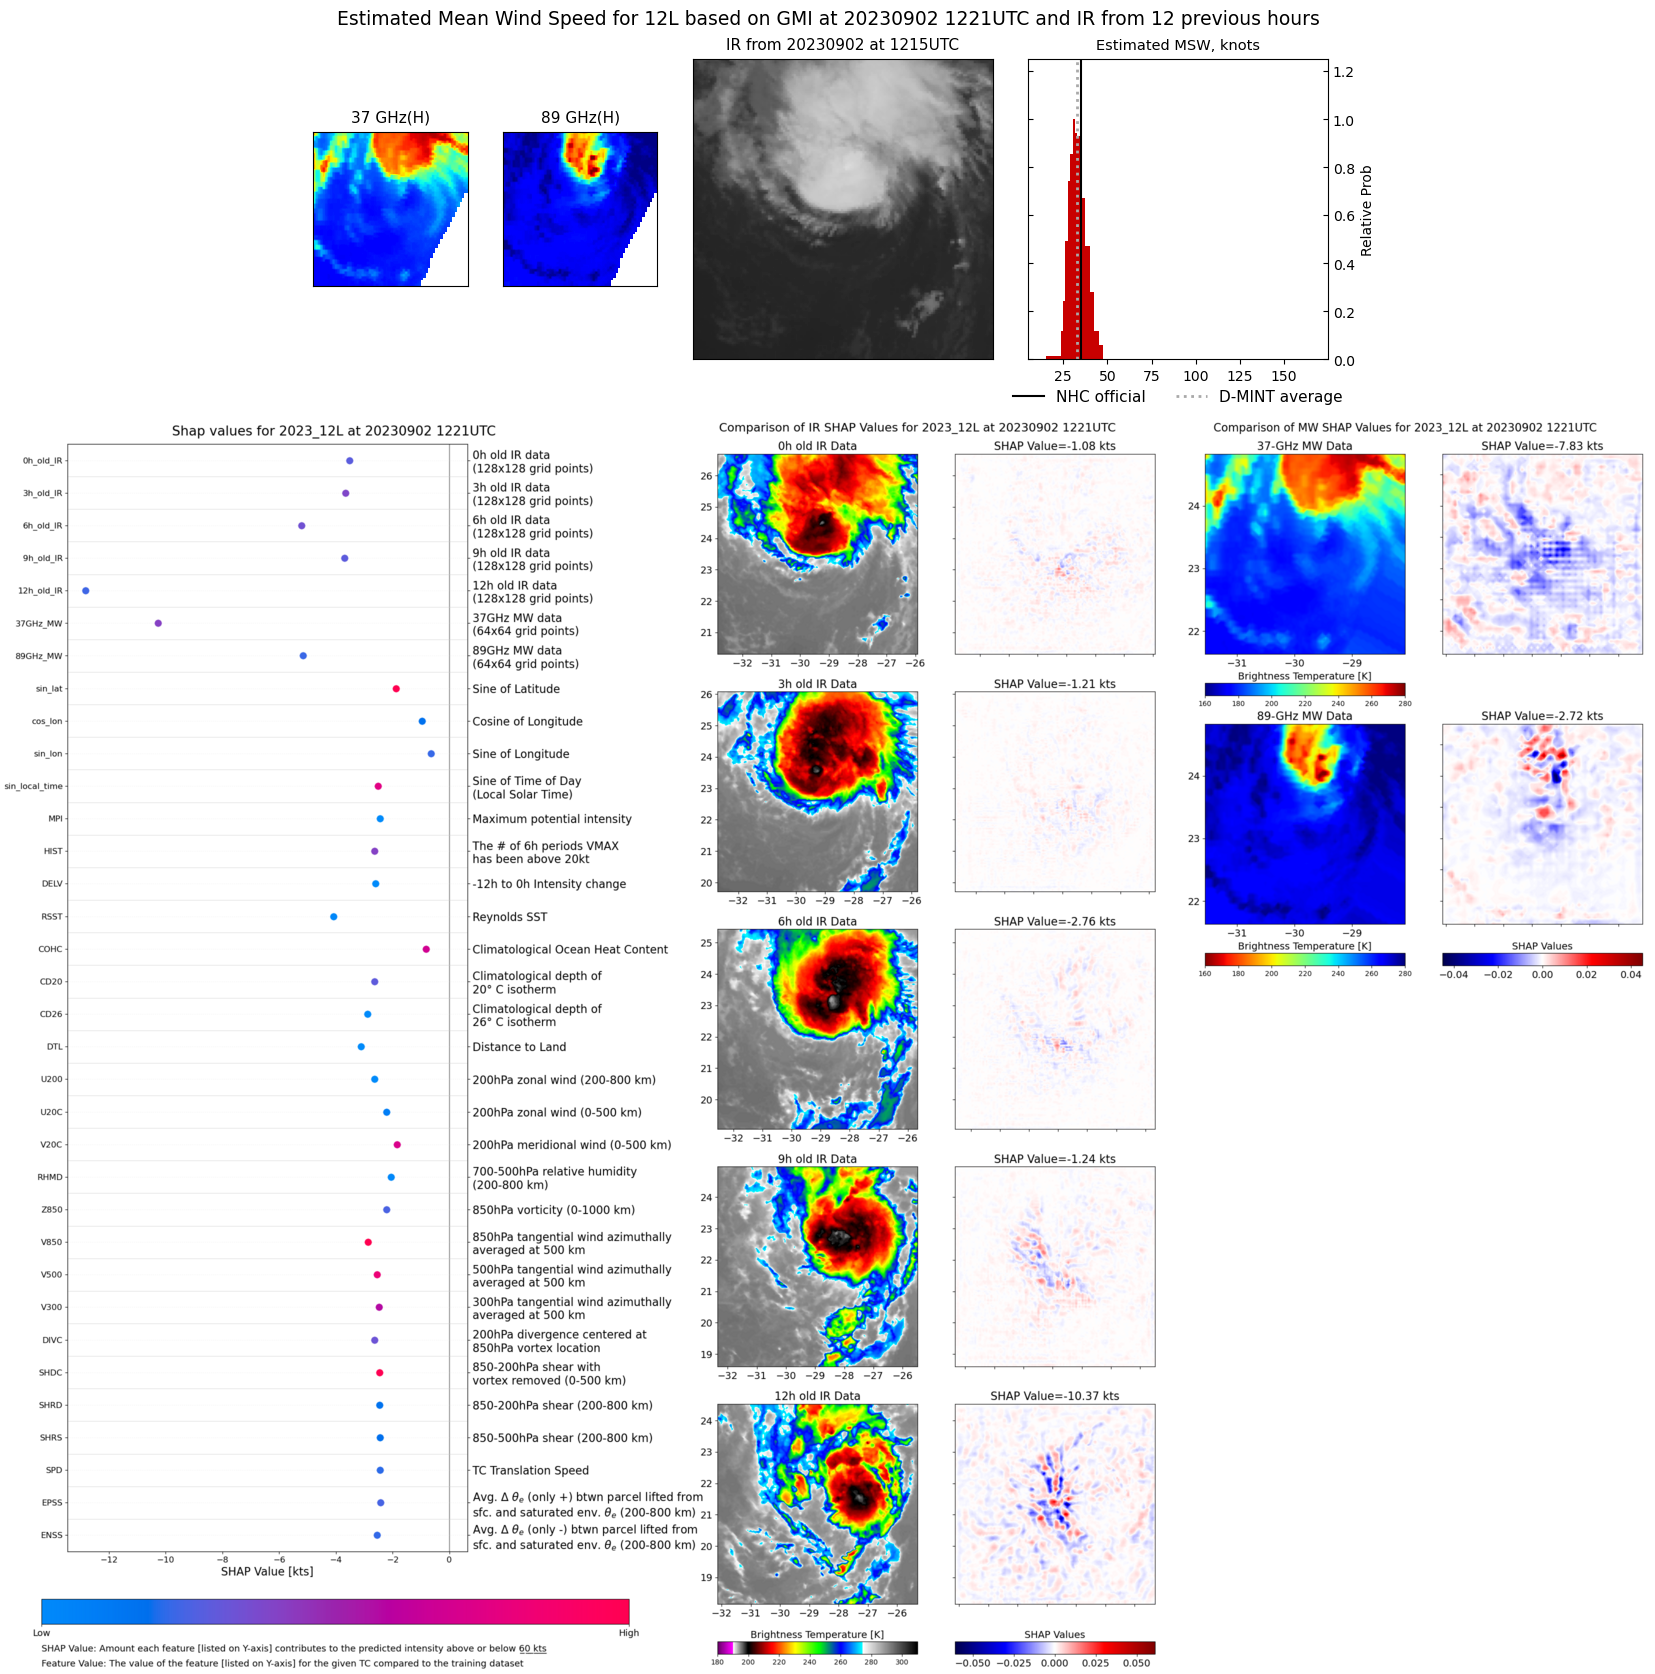 |
| 20230902 | 0902 UTC | SSMISF17 | 1006 hPa | 32 kts | 29 kts | 36 kts | 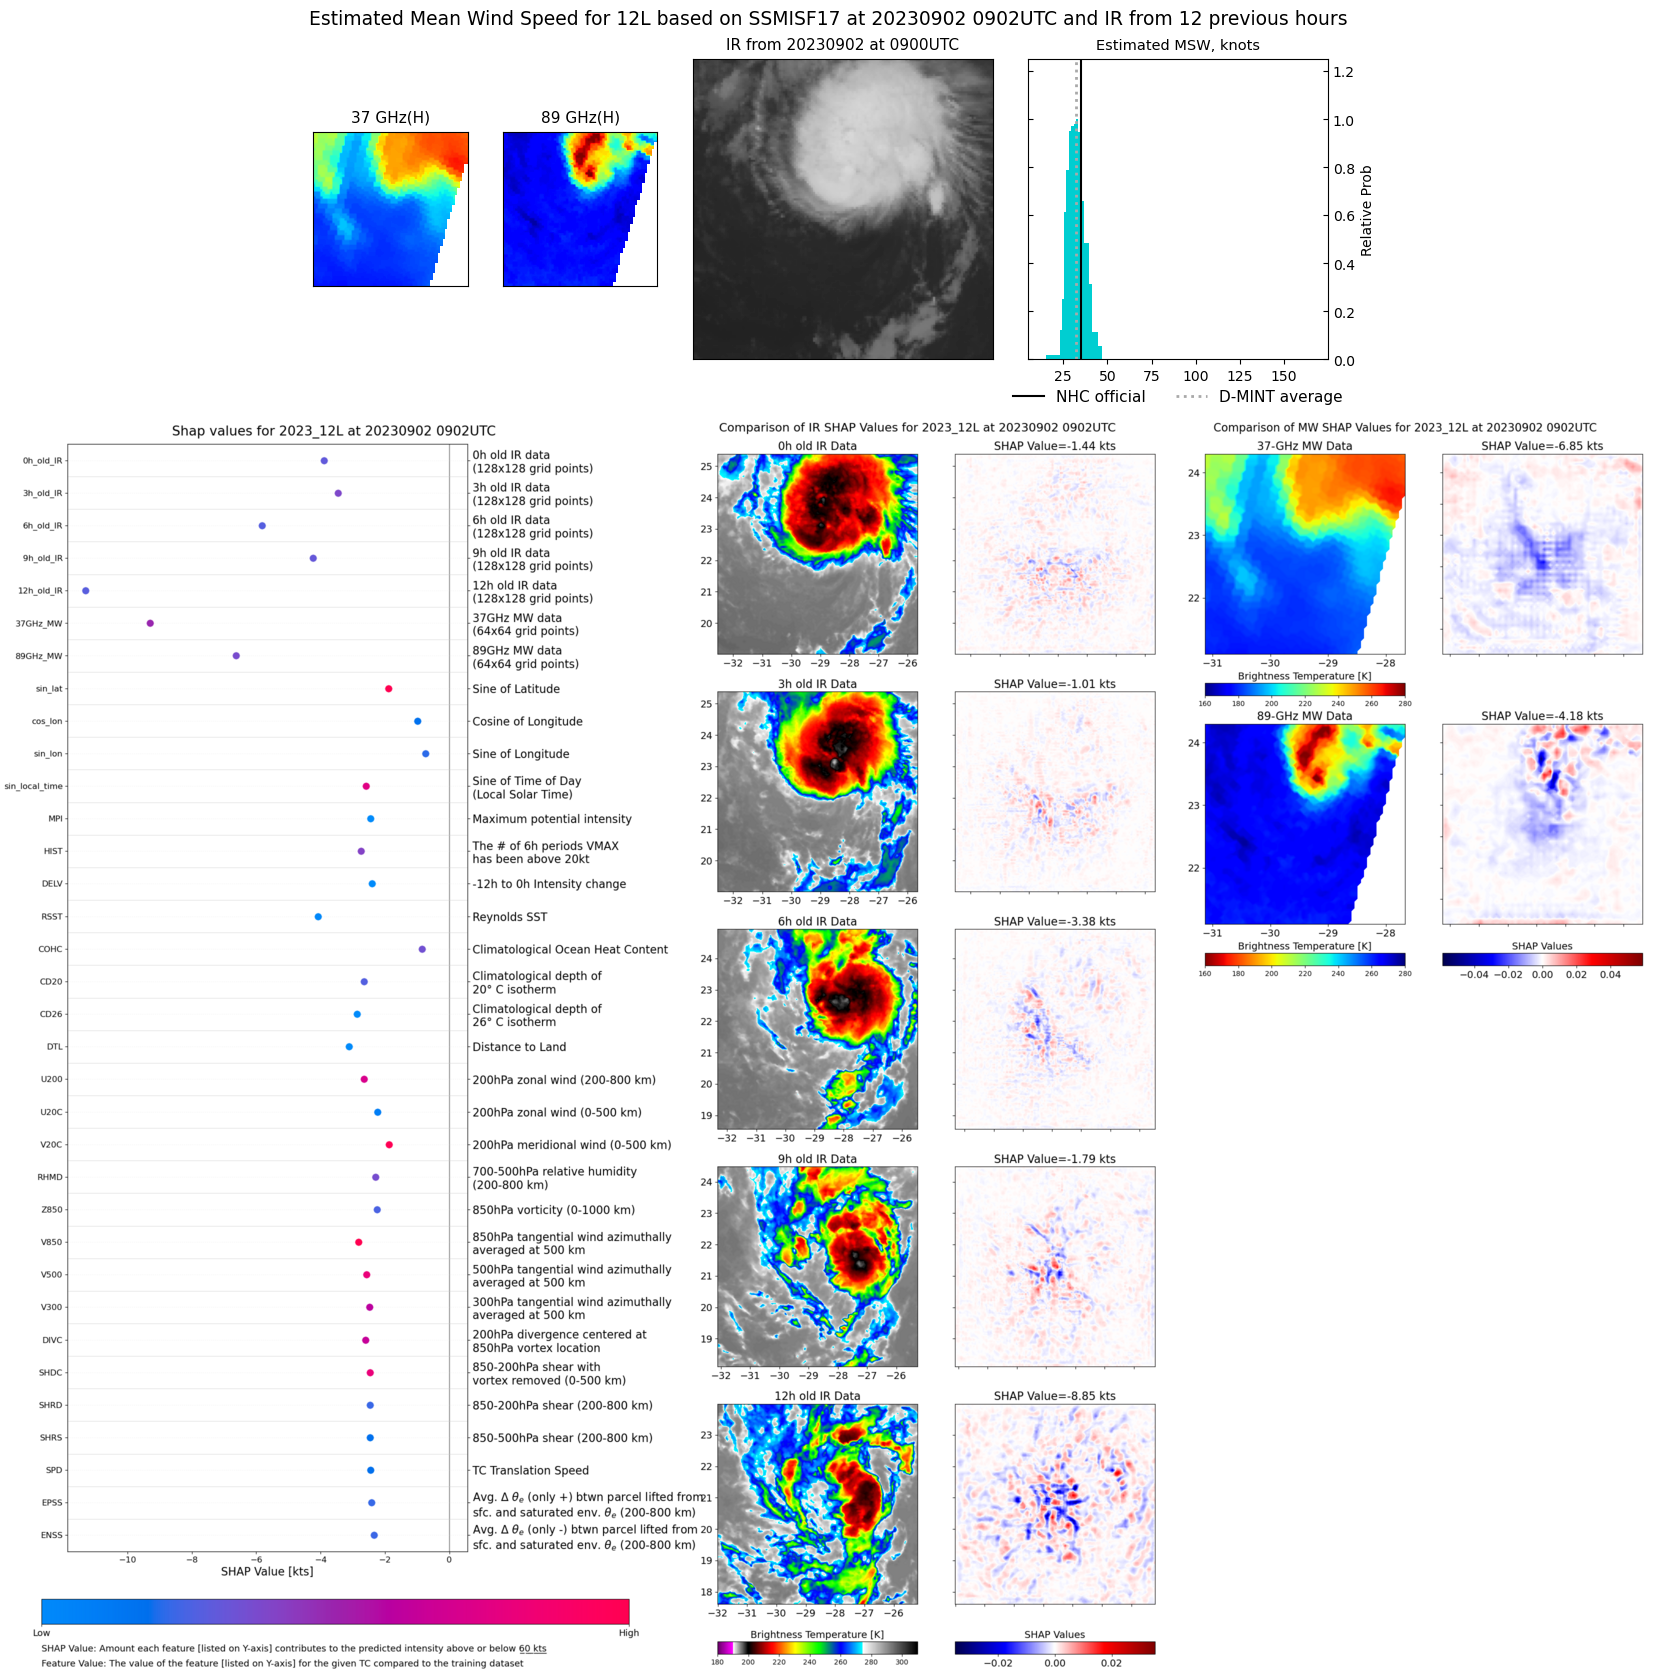 |
| 20230902 | 0533 UTC | SSMISF18 | 1006 hPa | 34 kts | 30 kts | 38 kts | 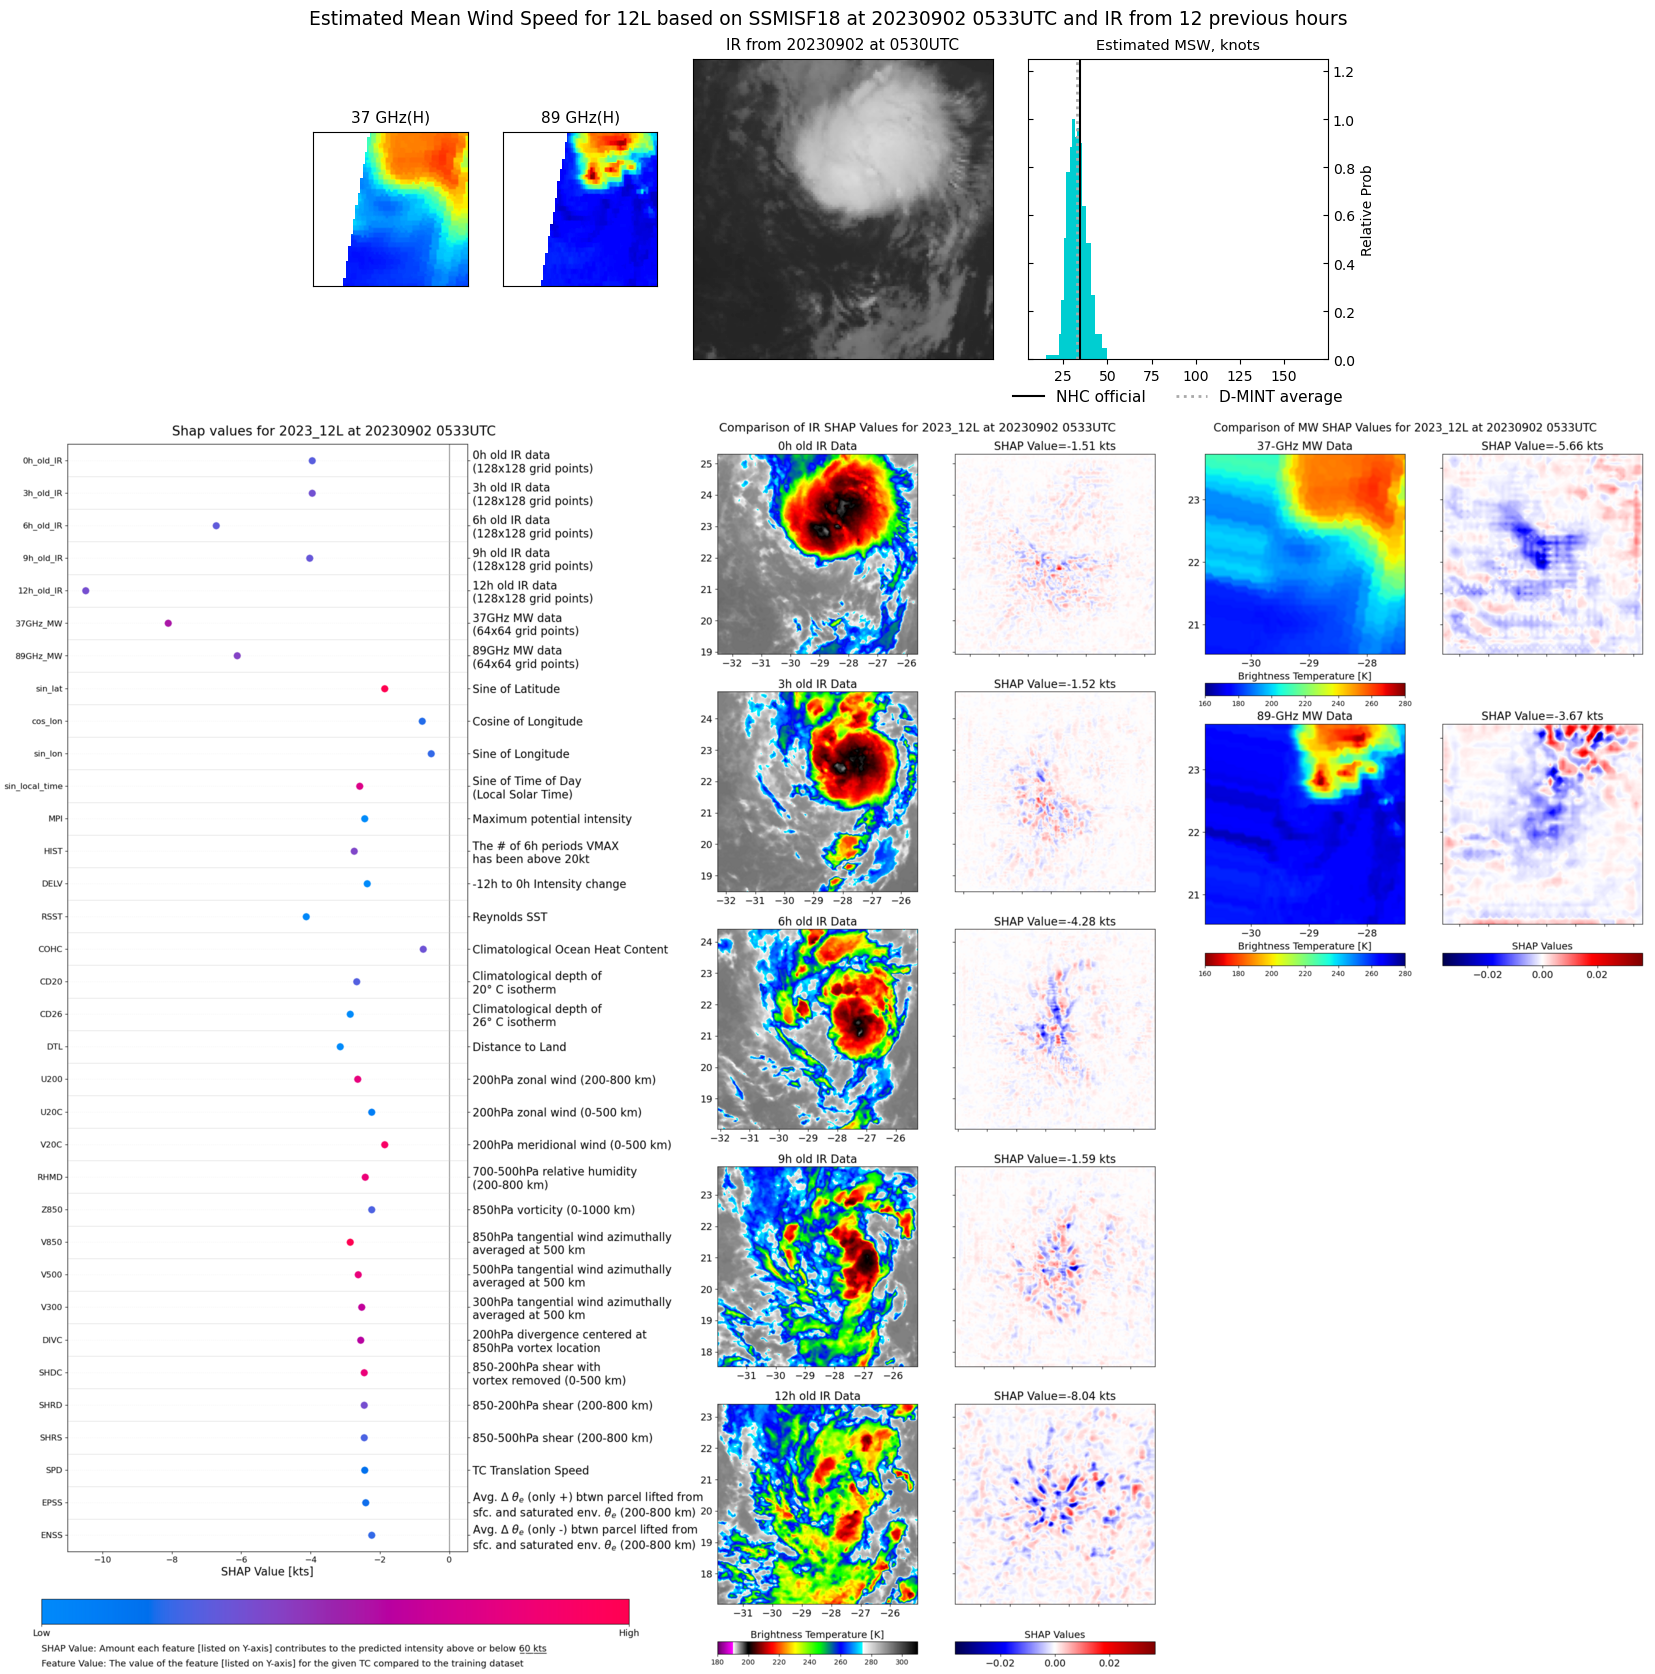 |
| 20230901 | 2301 UTC | GMI | 1006 hPa | 33 kts | 30 kts | 37 kts | 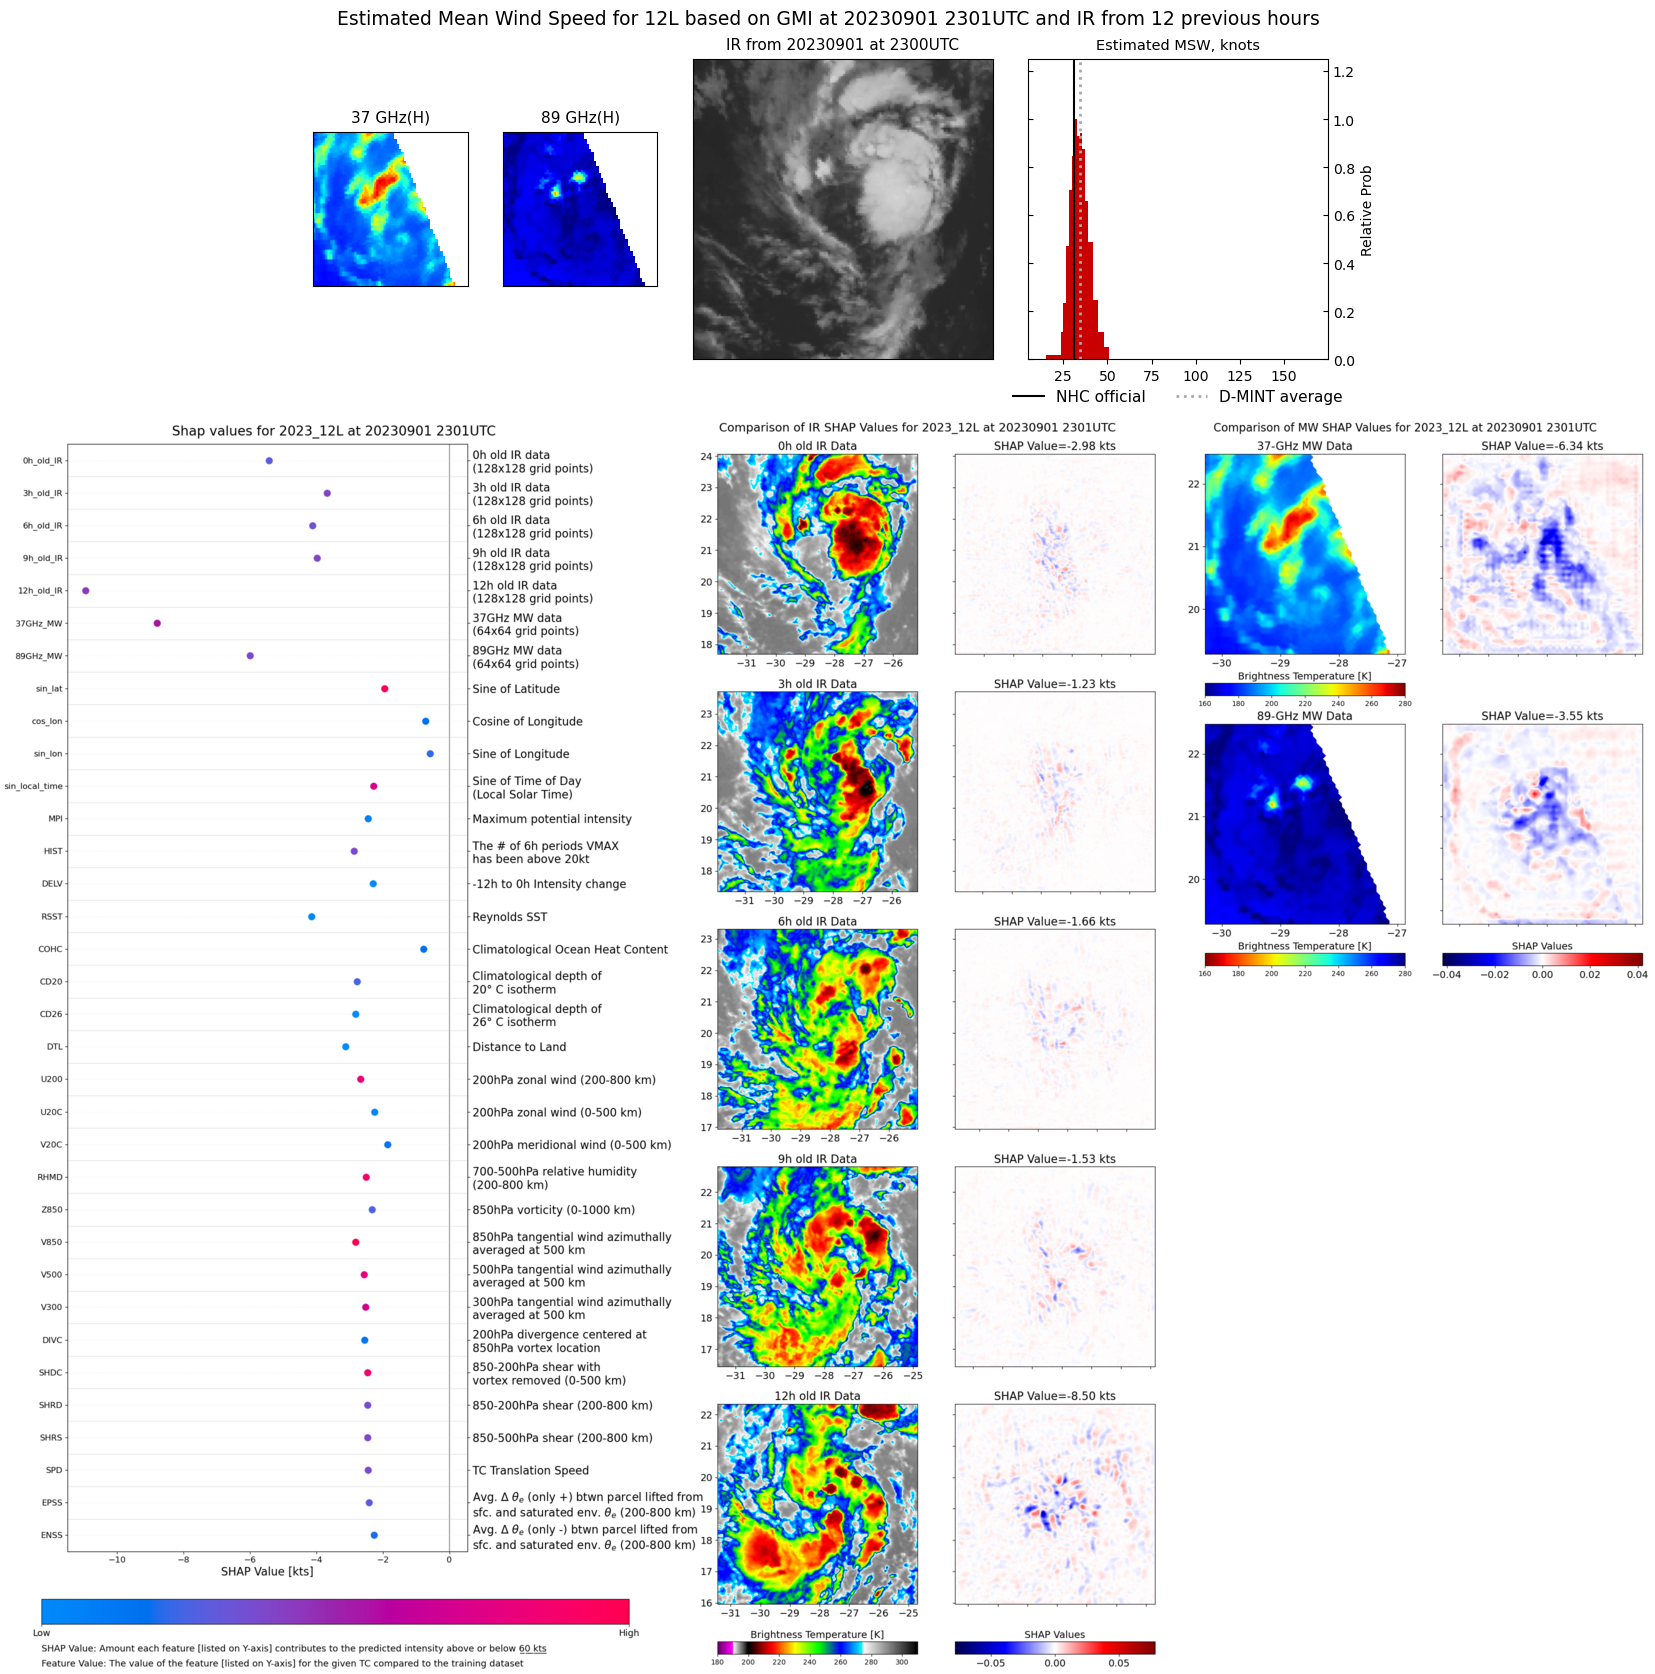 |
| 20230901 | 2031 UTC | SSMISF17 | 1006 hPa | 34 kts | 30 kts | 38 kts | 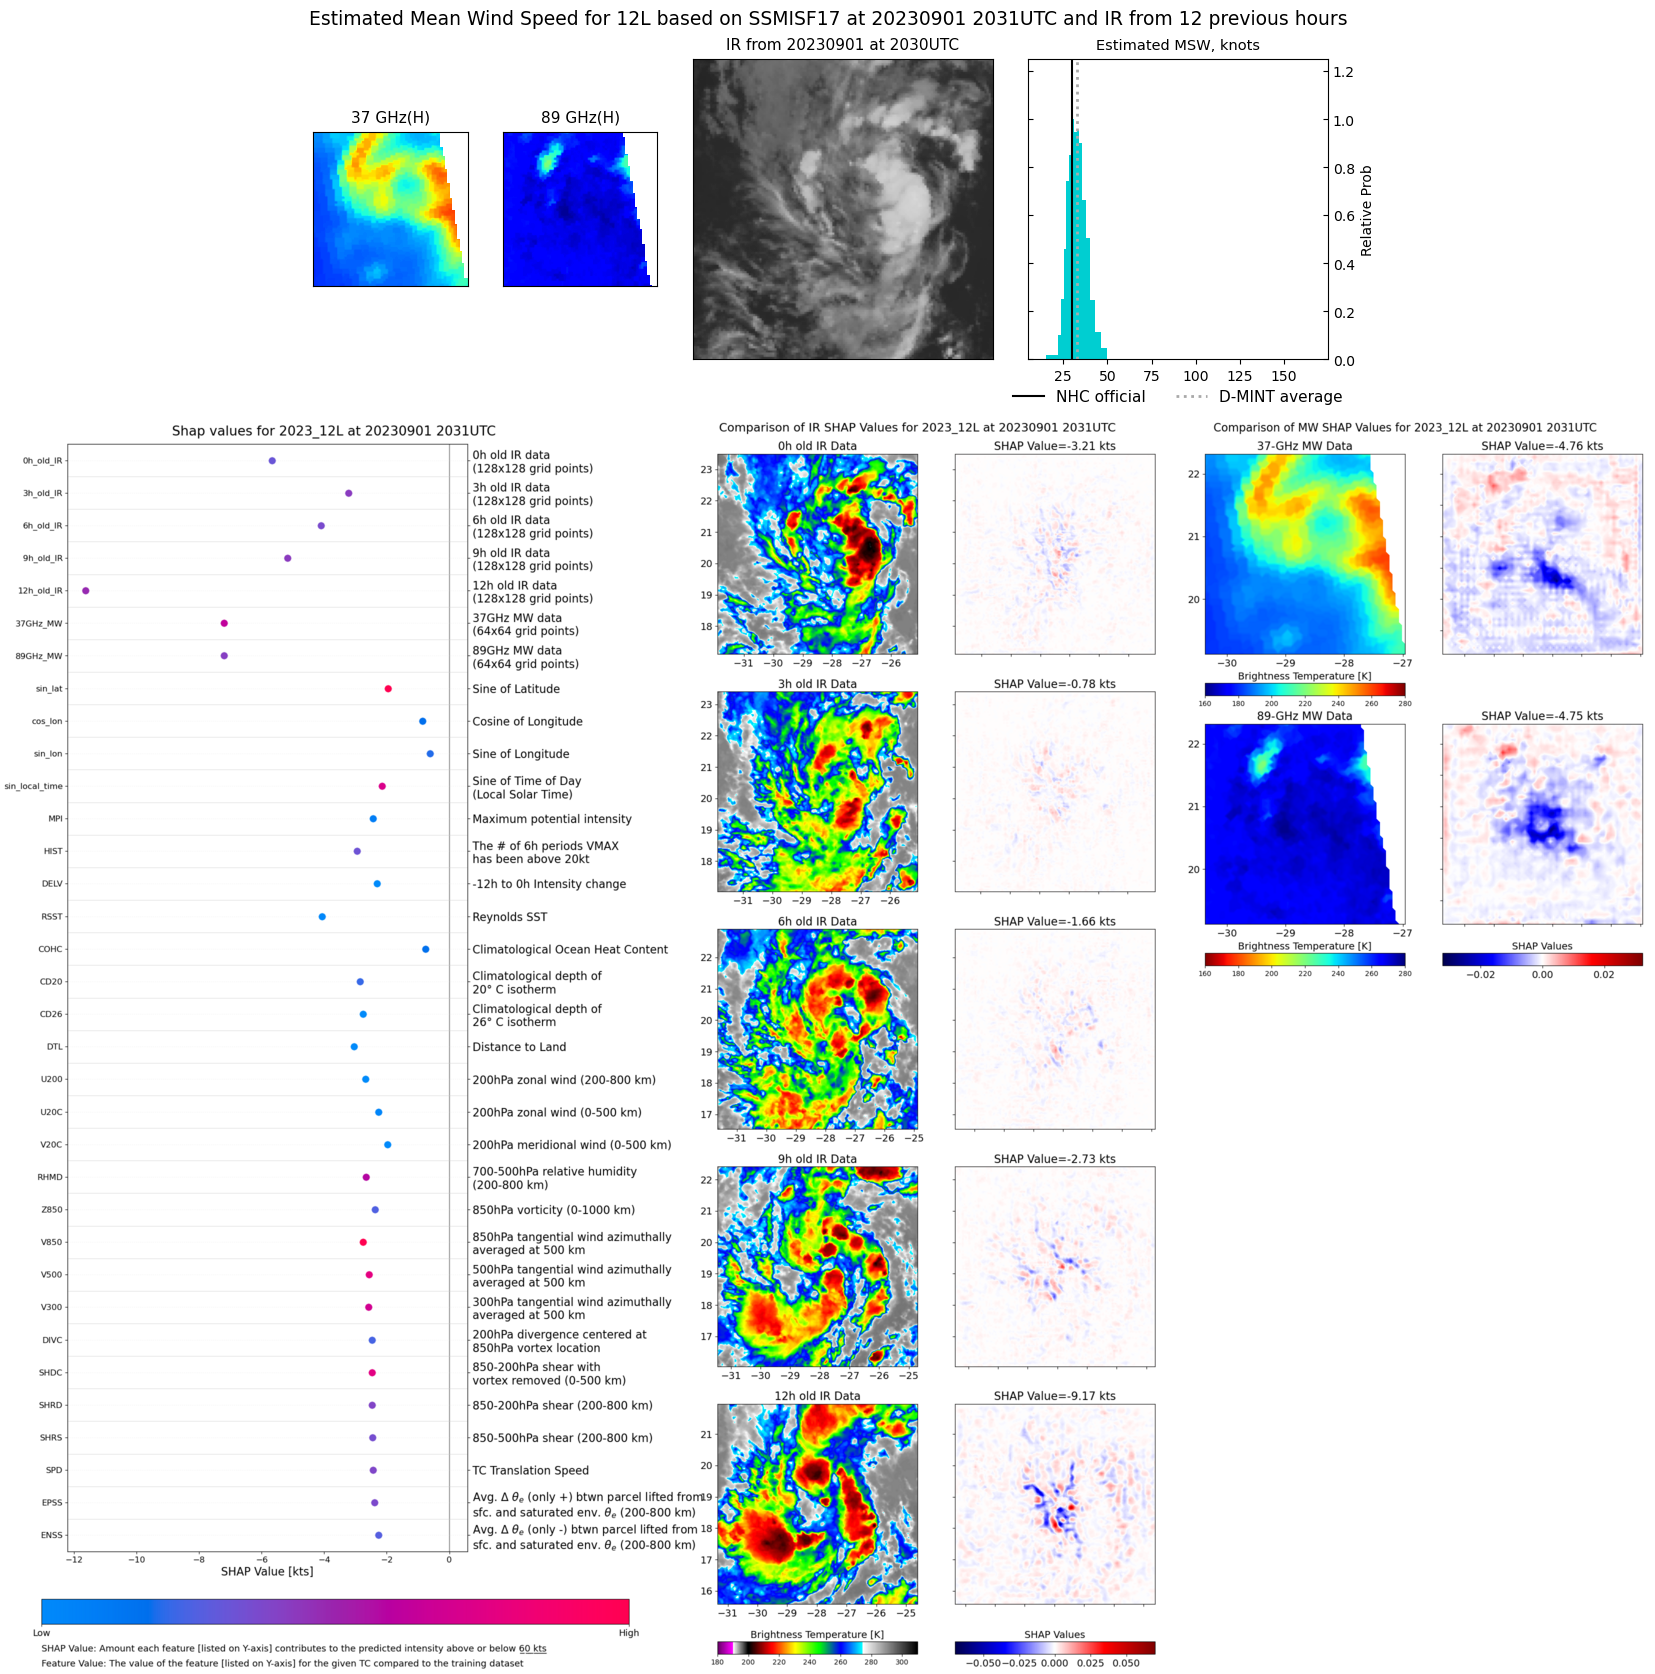 |
| 20230901 | 1853 UTC | SSMISF16 | 1008 hPa | 31 kts | 28 kts | 35 kts | 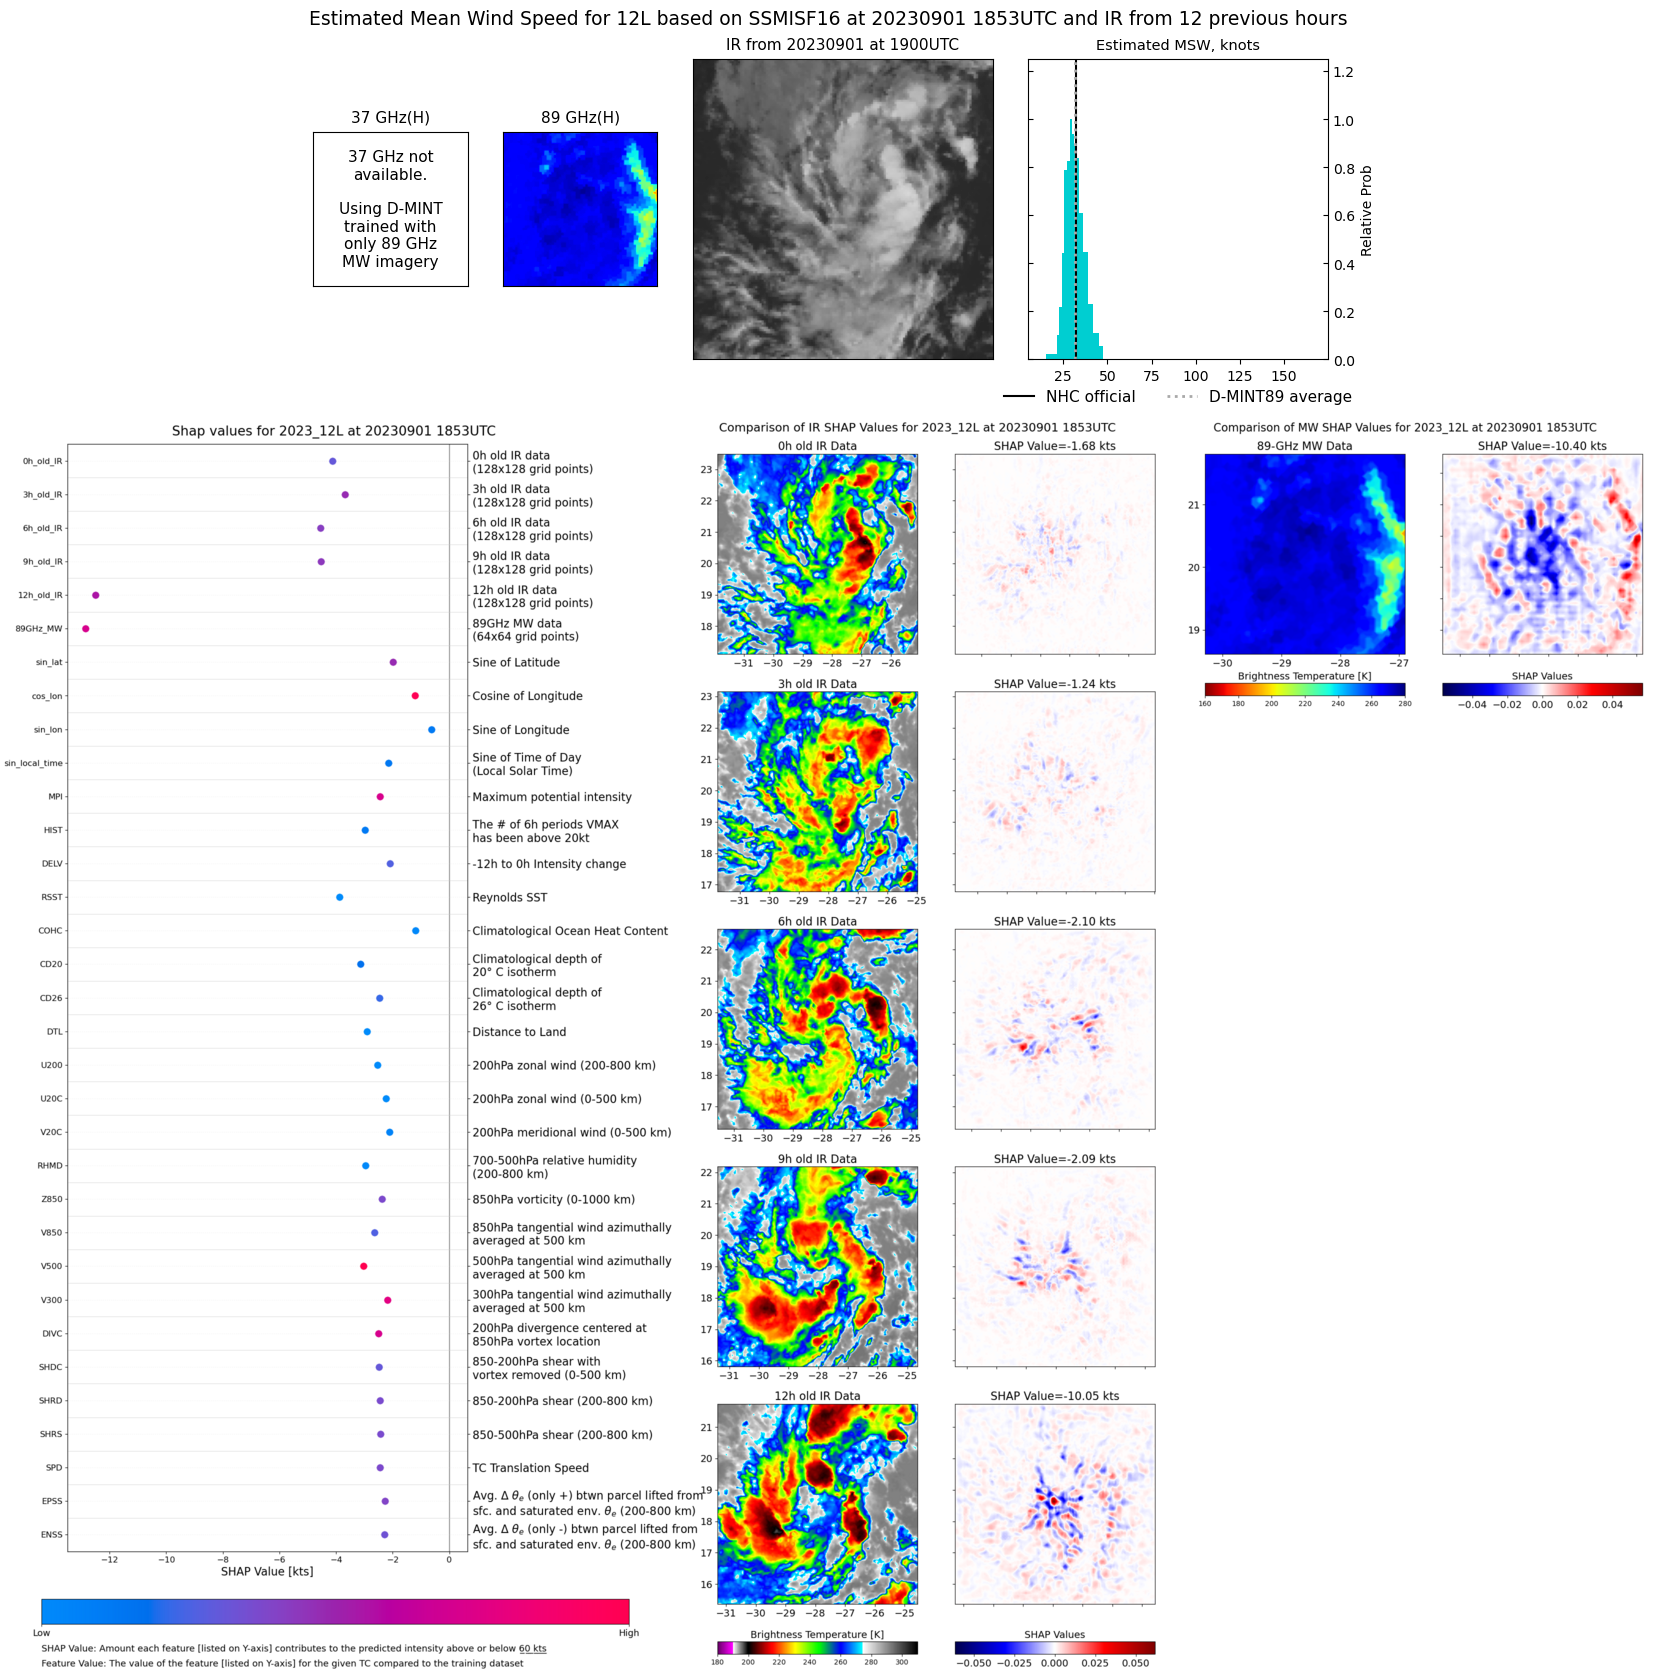 |
| 20230901 | 1458 UTC | AMSR2 | 1008 hPa | 31 kts | 28 kts | 34 kts | 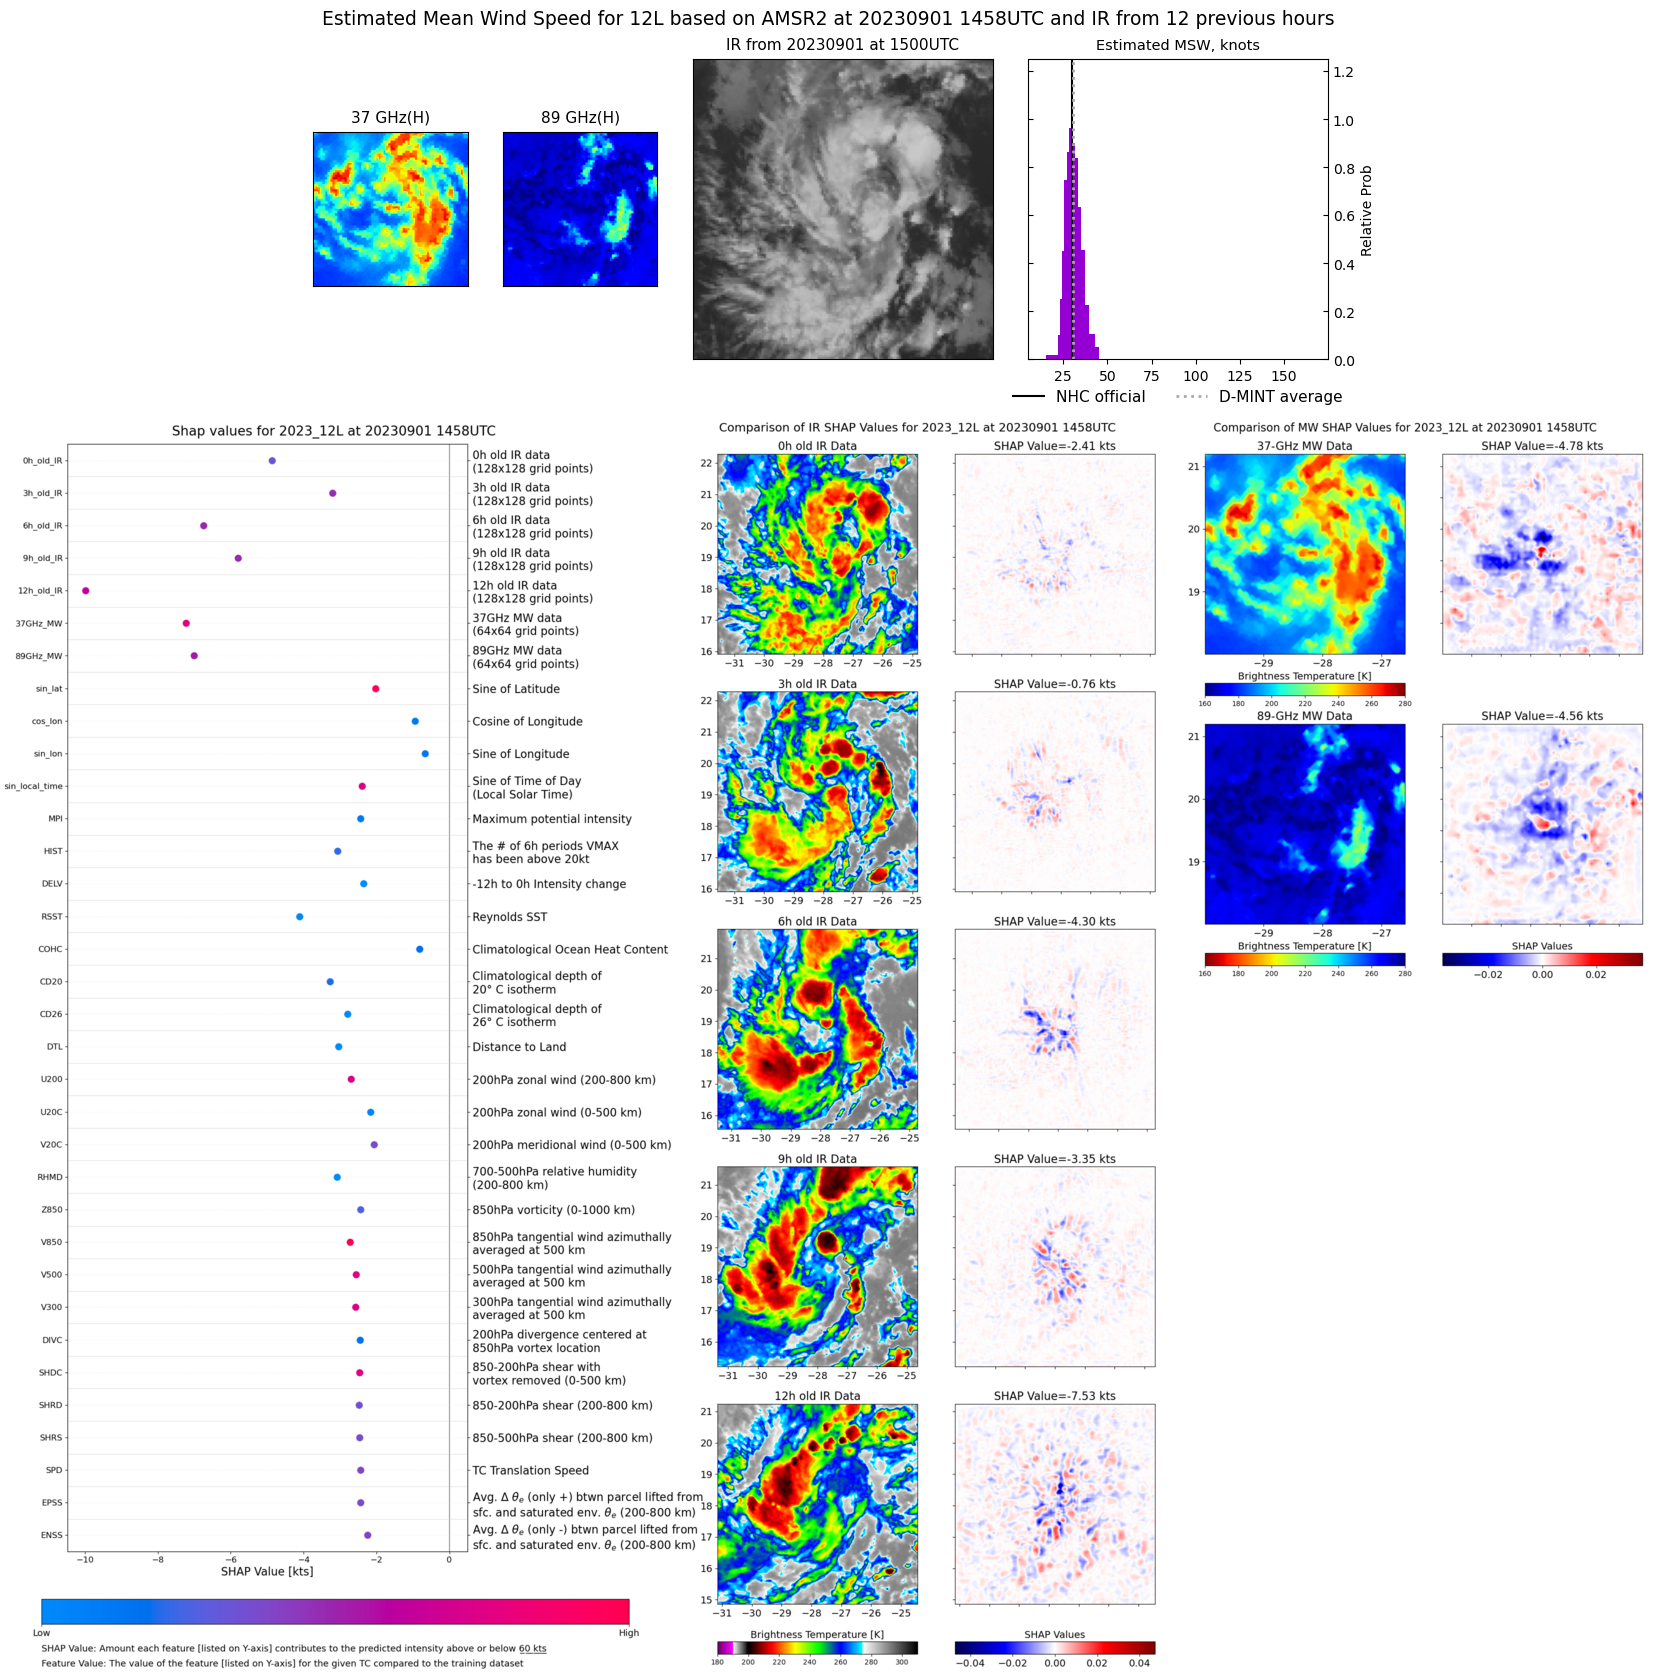 |