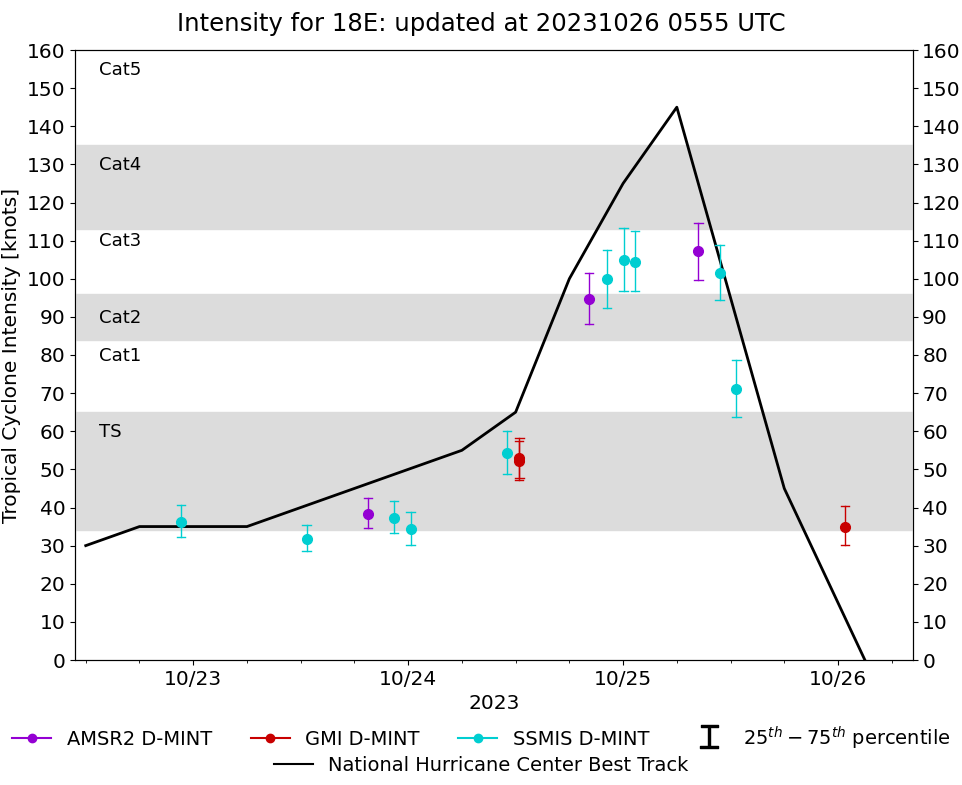
|
Storm: 18E
D-MINT HISTORY FILE for 2023_18E
| Date | Time | MW Sensor | MSLP | Vmax
(30th-70th percentile average) | Vmax
25th percentile | Vmax
75th percentile | Image |
| 20231026 | 0046 UTC | GMI | 1001 hPa | 35 kts | 30 kts | 40 kts | 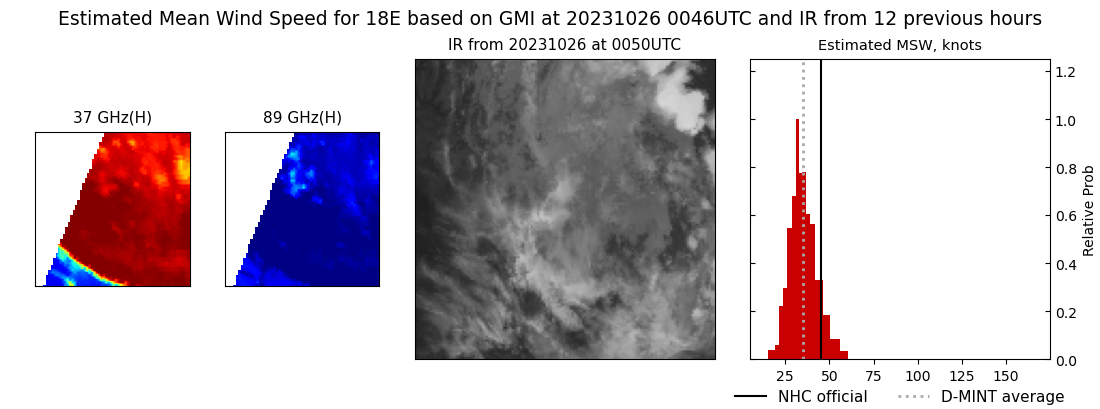 |
| 20231025 | 1239 UTC | SSMISF16 | 984 hPa | 71 kts | 64 kts | 79 kts | 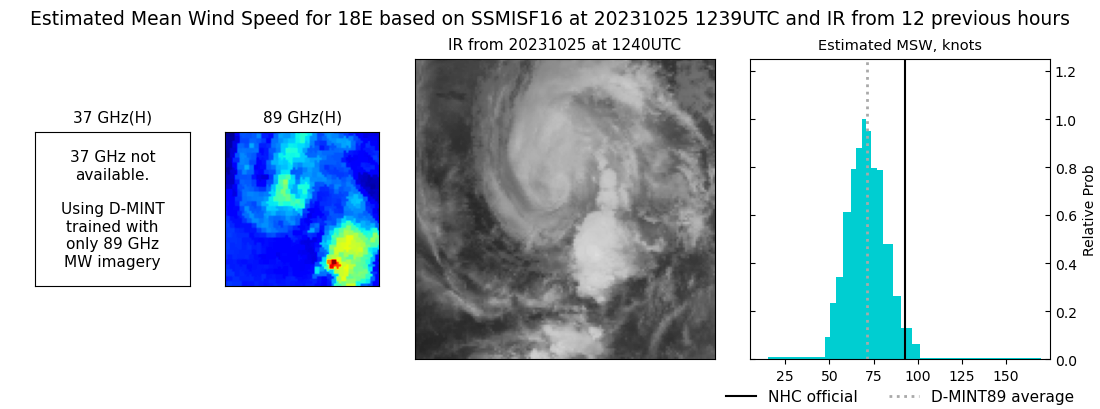 |
| 20231025 | 1046 UTC | SSMISF18 | 958 hPa | 101 kts | 94 kts | 109 kts | 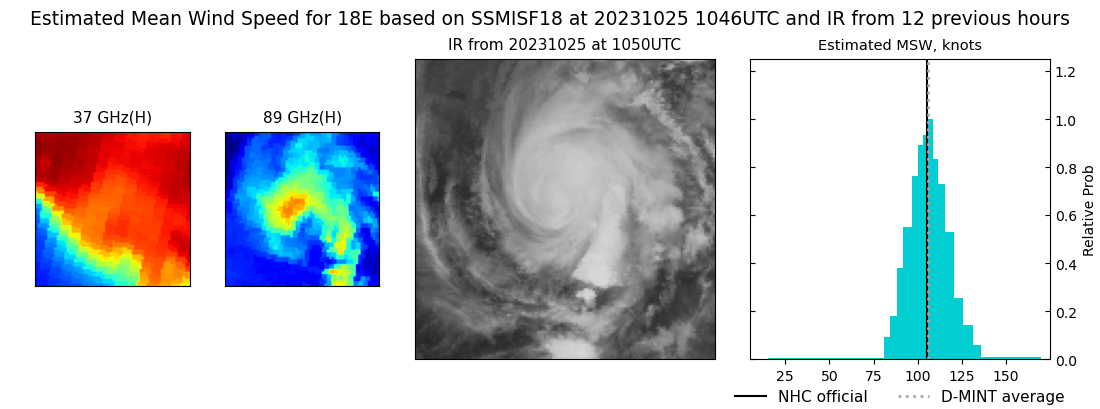 |
| 20231025 | 0825 UTC | AMSR2 | 951 hPa | 107 kts | 100 kts | 115 kts | 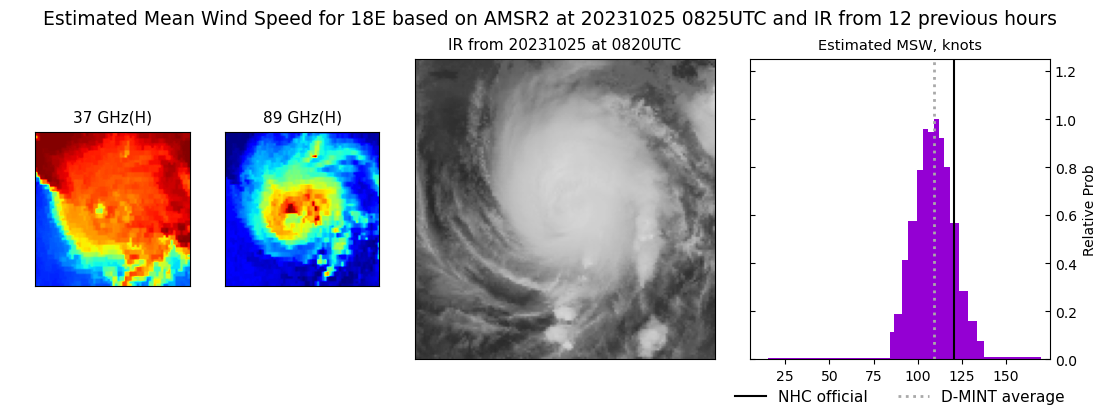 |
| 20231025 | 0119 UTC | SSMISF17 | 962 hPa | 105 kts | 97 kts | 112 kts | 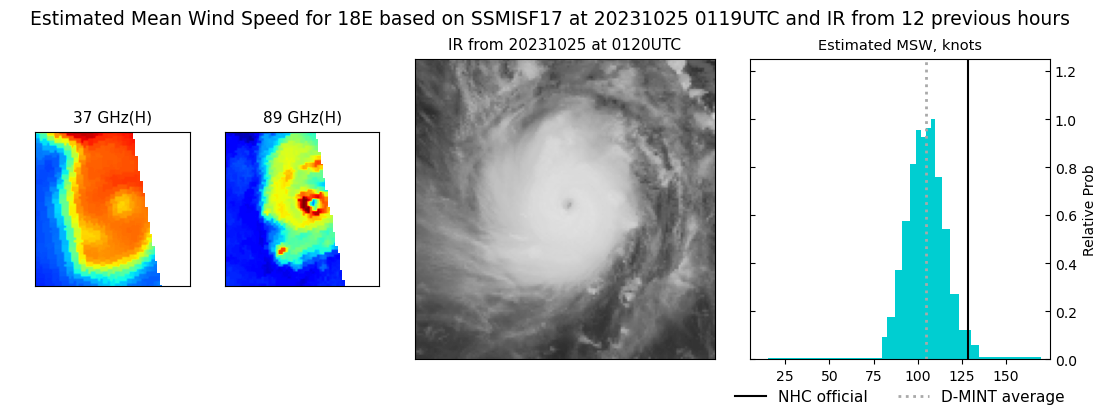 |
| 20231025 | 0004 UTC | SSMISF16 | 955 hPa | 105 kts | 97 kts | 113 kts |  |
| 20231024 | 2212 UTC | SSMISF18 | 966 hPa | 100 kts | 92 kts | 108 kts | 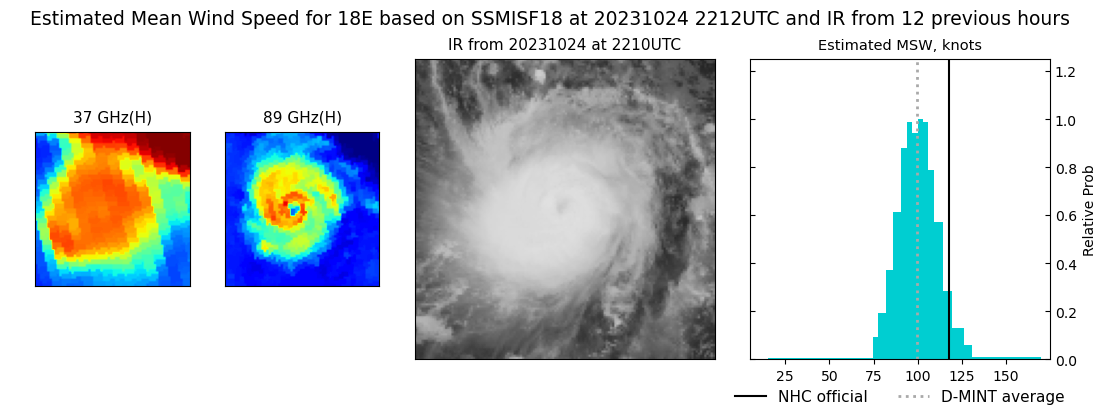 |
| 20231024 | 2012 UTC | AMSR2 | 974 hPa | 95 kts | 88 kts | 102 kts | 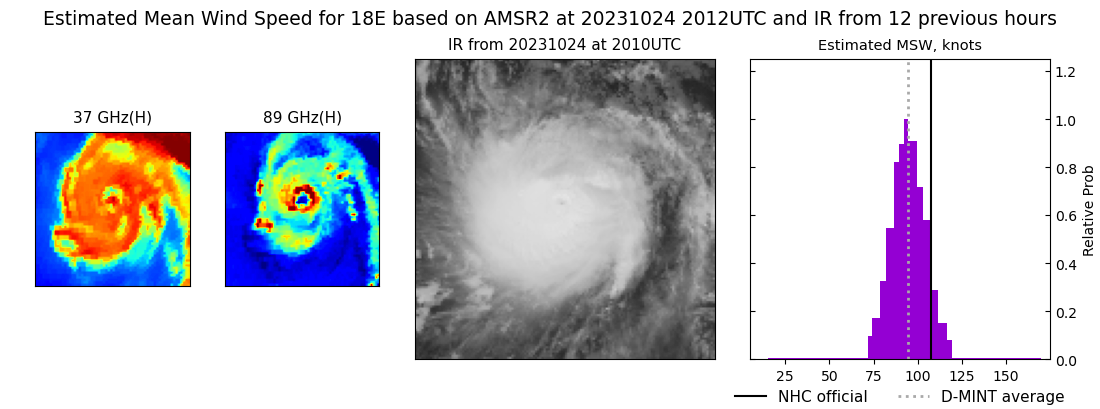 |
| 20231024 | 1225 UTC | GMI | 994 hPa | 53 kts | 48 kts | 58 kts | 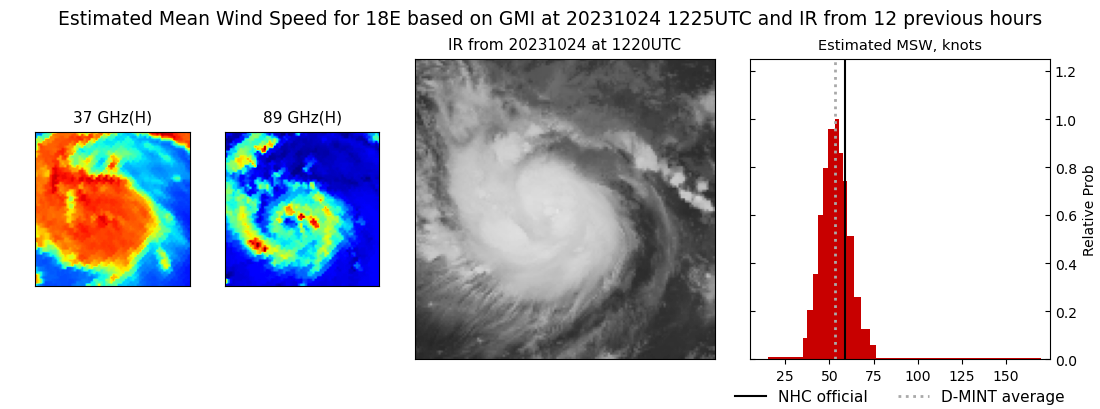 |
| 20231024 | 1221 UTC | GMI | 995 hPa | 52 kts | 47 kts | 58 kts | 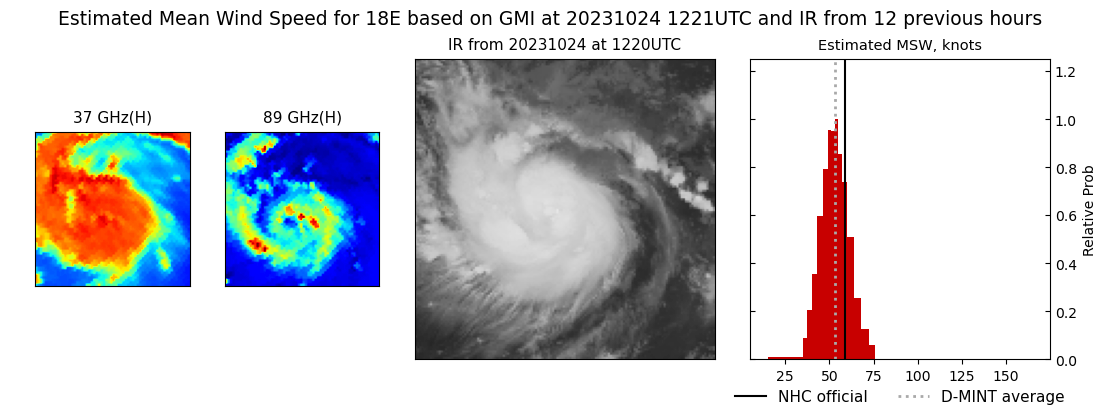 |
| 20231024 | 1101 UTC | SSMISF18 | 1000 hPa | 54 kts | 49 kts | 60 kts | 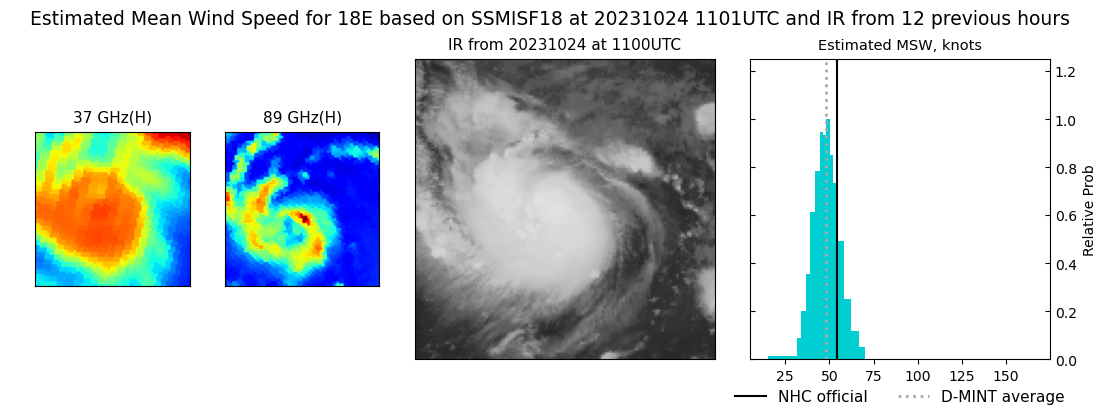 |
| 20231024 | 0017 UTC | SSMISF16 | 1003 hPa | 34 kts | 30 kts | 39 kts | 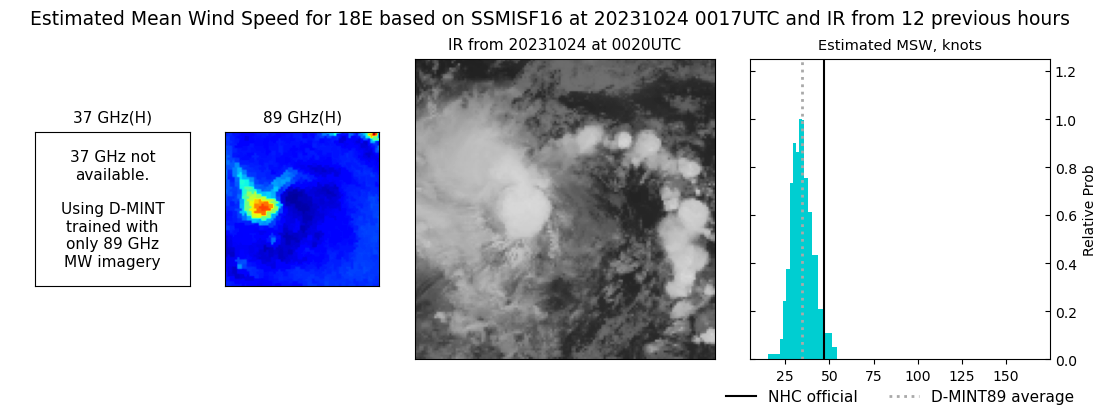 |
| 20231023 | 2224 UTC | SSMISF18 | 1002 hPa | 37 kts | 33 kts | 42 kts | 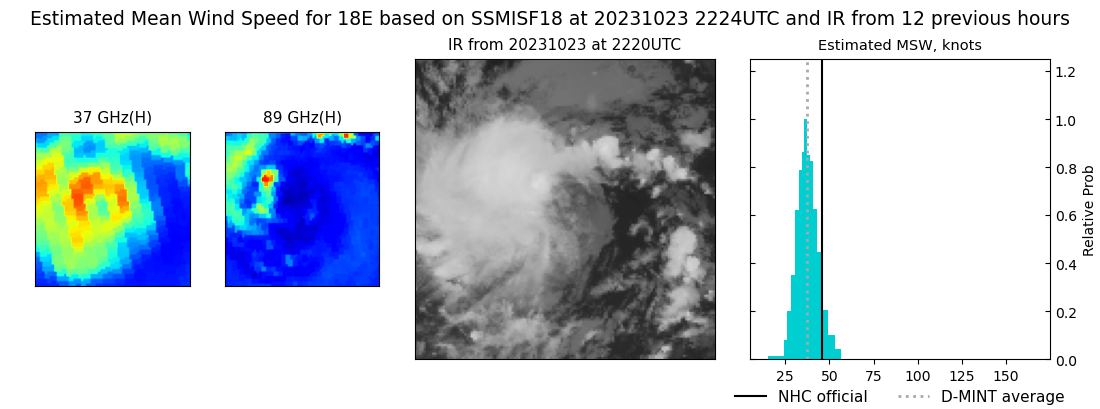 |
| 20231023 | 1930 UTC | AMSR2 | 1002 hPa | 38 kts | 35 kts | 42 kts | 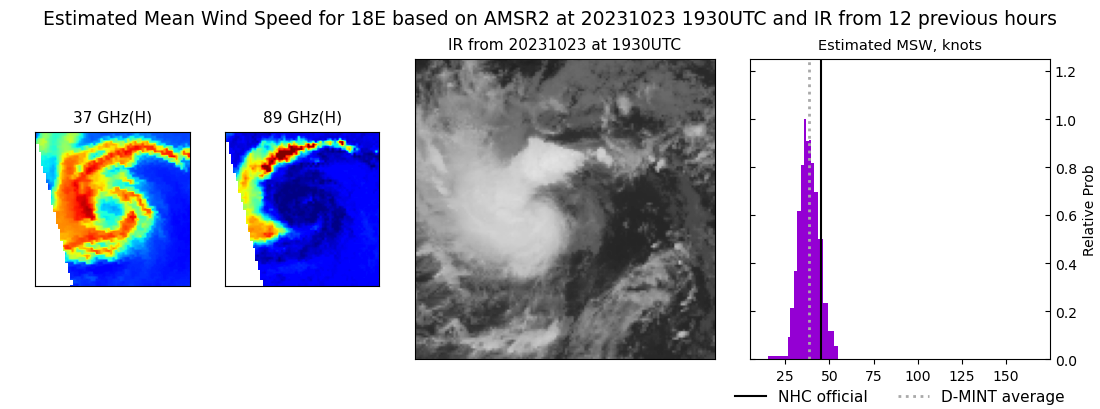 |
| 20231023 | 1240 UTC | SSMISF17 | 1004 hPa | 32 kts | 29 kts | 35 kts | 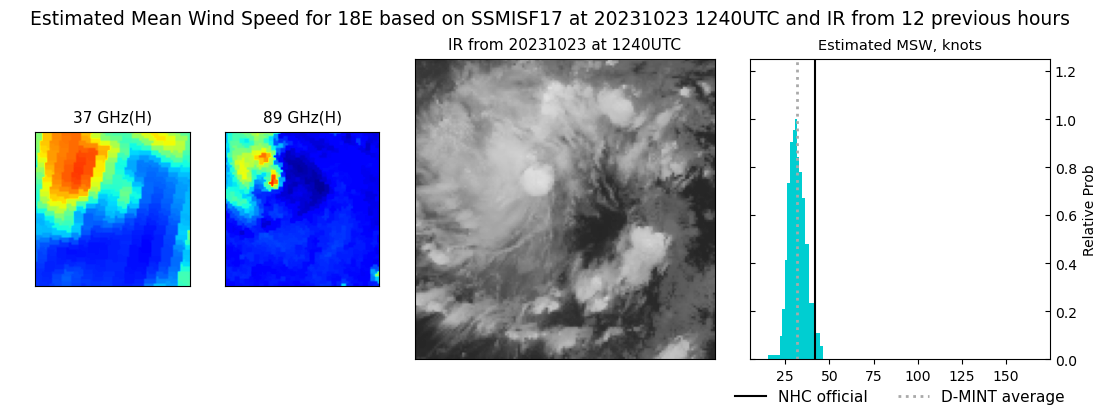 |
| 20231022 | 2237 UTC | SSMISF18 | 1006 hPa | 36 kts | 32 kts | 41 kts |  |
|
