|
Storm: 19L
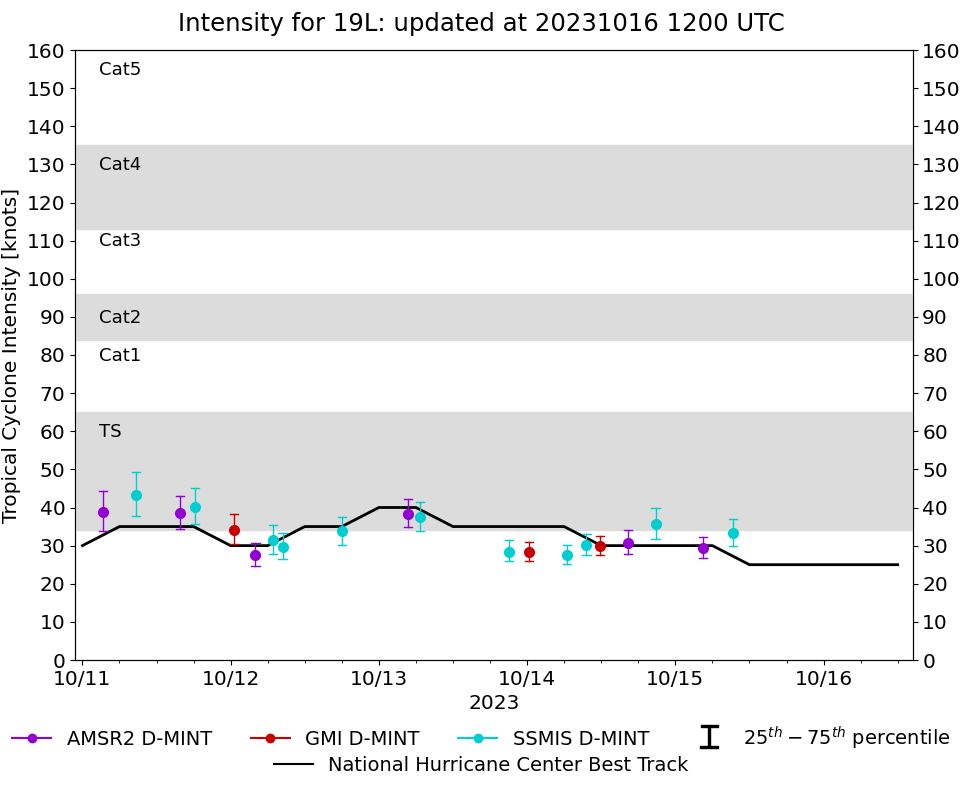
D-MINT HISTORY FILE for 2023_19L
| Date | Time | MW Sensor | MSLP | Vmax
(30th-70th percentile average) | Vmax
25th percentile | Vmax
75th percentile | Image |
| 20231015 | 0923 UTC | SSMISF17 | 1007 hPa | 33 kts | 30 kts | 37 kts | 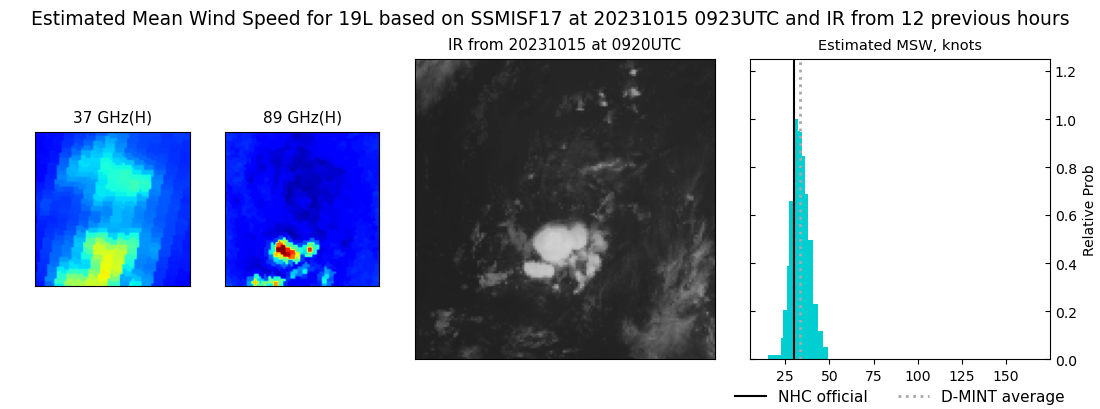 |
| 20231015 | 0430 UTC | AMSR2 | 1011 hPa | 29 kts | 27 kts | 32 kts | 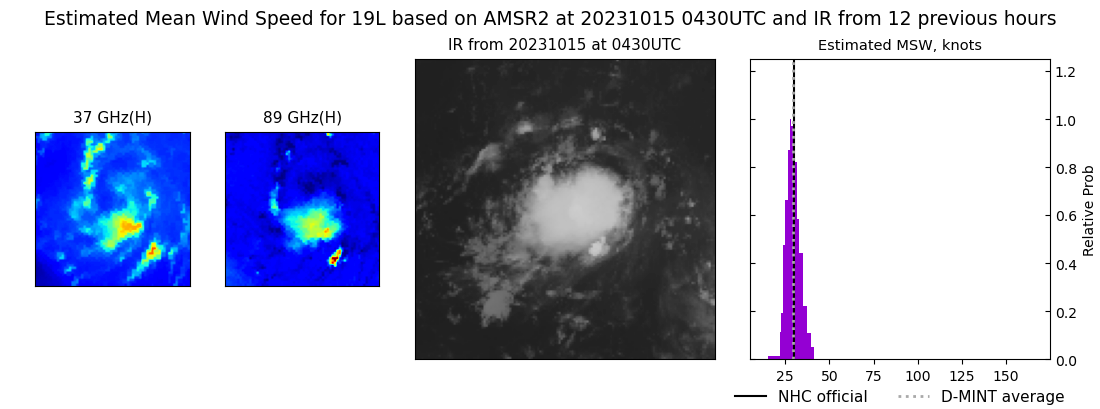 |
| 20231014 | 2049 UTC | SSMISF17 | 1007 hPa | 36 kts | 32 kts | 40 kts | 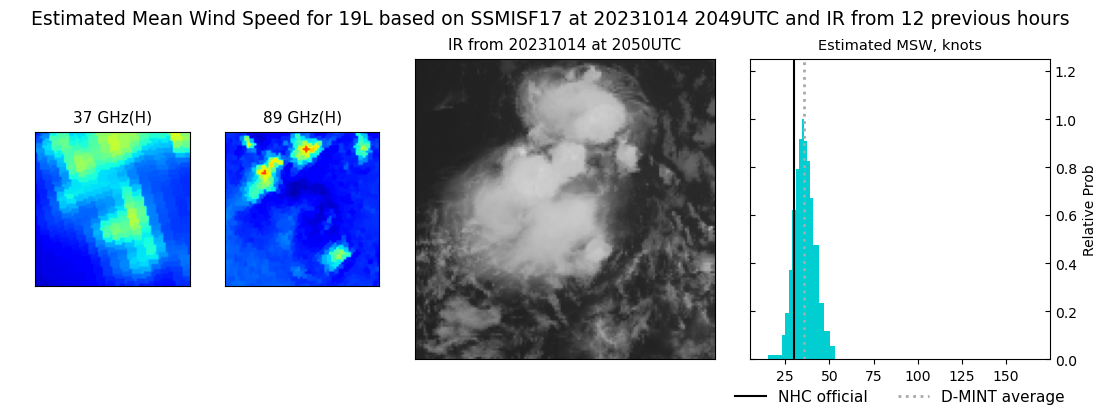 |
| 20231014 | 1618 UTC | AMSR2 | 1008 hPa | 31 kts | 28 kts | 34 kts | 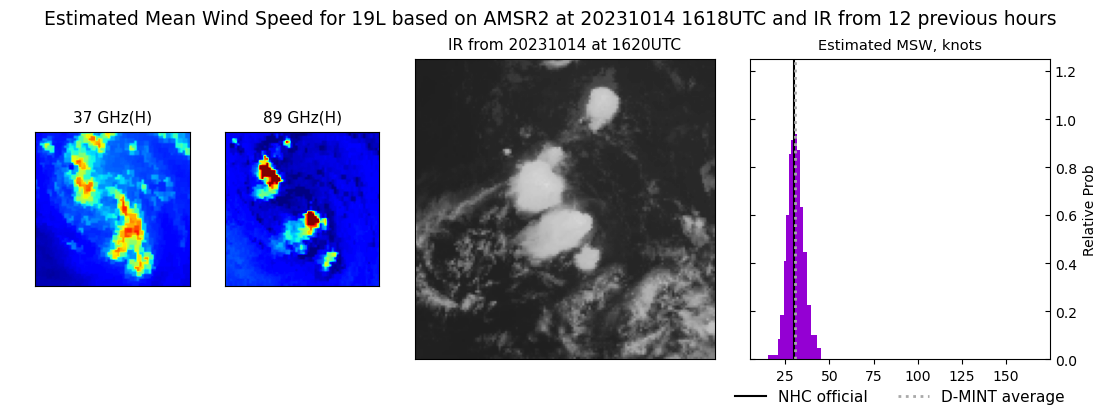 |
| 20231014 | 1151 UTC | GMI | 1007 hPa | 30 kts | 27 kts | 32 kts | 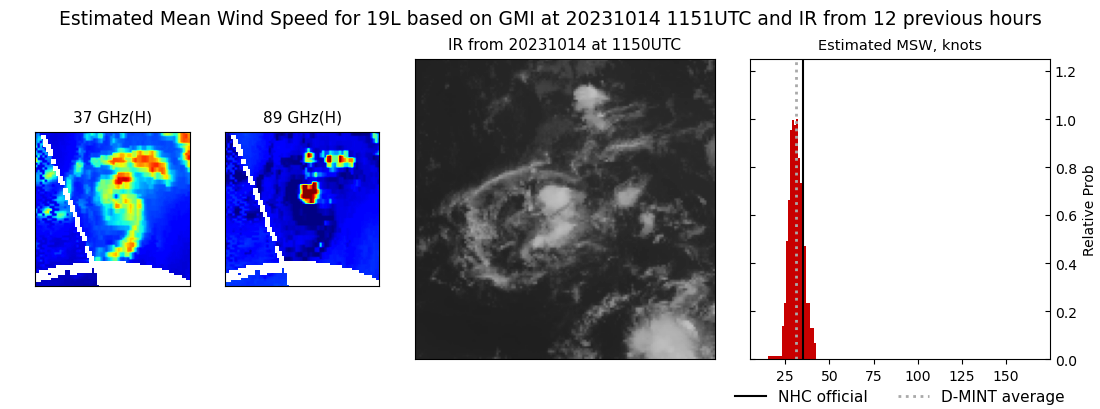 |
| 20231014 | 0937 UTC | SSMISF17 | 1006 hPa | 30 kts | 27 kts | 33 kts | 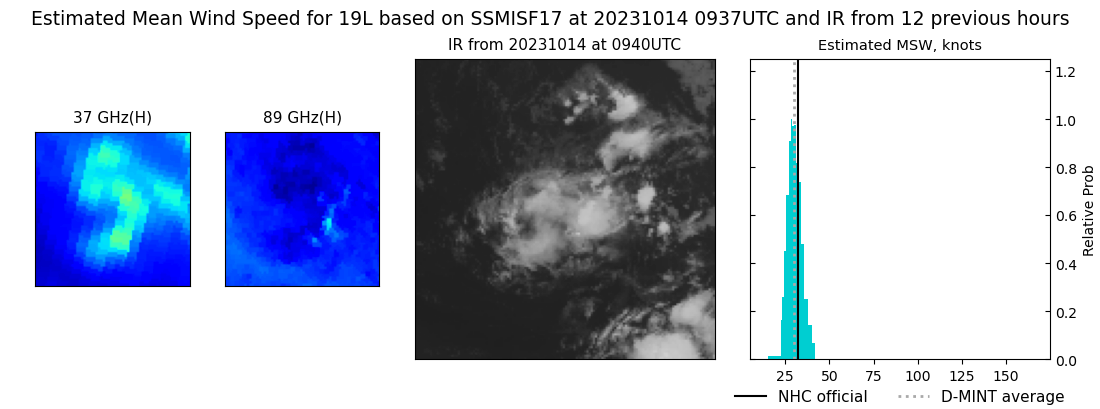 |
| 20231014 | 0628 UTC | SSMISF18 | 1007 hPa | 28 kts | 25 kts | 30 kts | 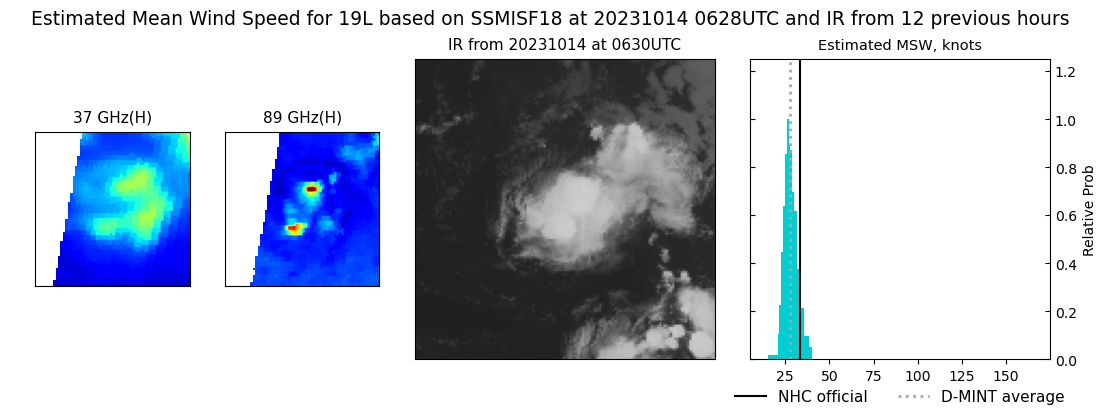 |
| 20231014 | 0021 UTC | GMI | 1007 hPa | 28 kts | 26 kts | 31 kts | 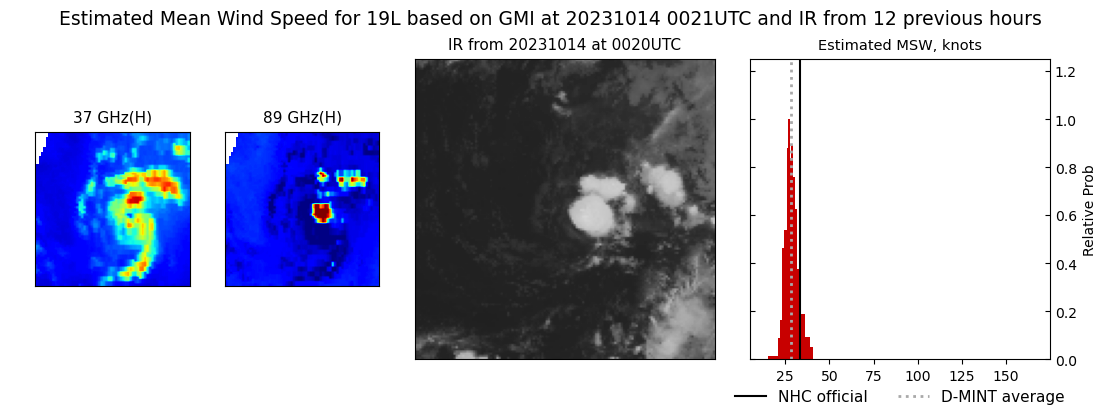 |
| 20231013 | 2102 UTC | SSMISF17 | 1007 hPa | 28 kts | 26 kts | 31 kts | 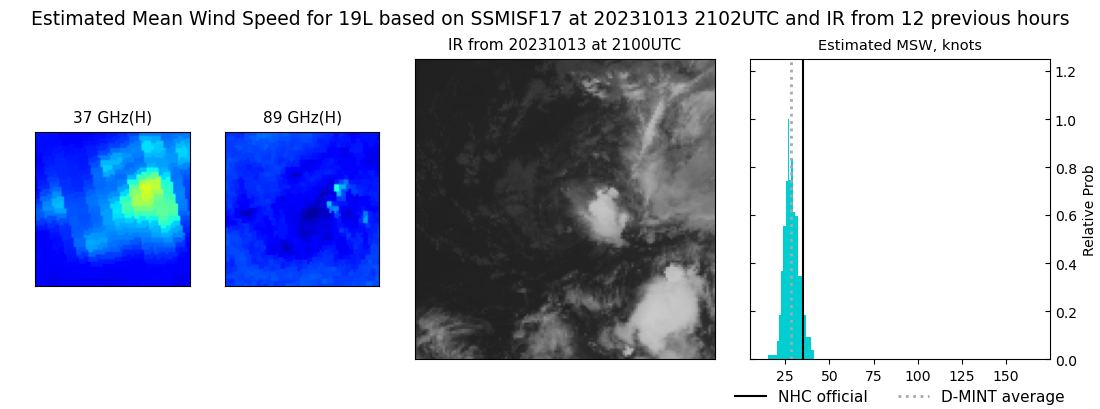 |
| 20231013 | 0639 UTC | SSMISF18 | 1004 hPa | 38 kts | 34 kts | 42 kts | 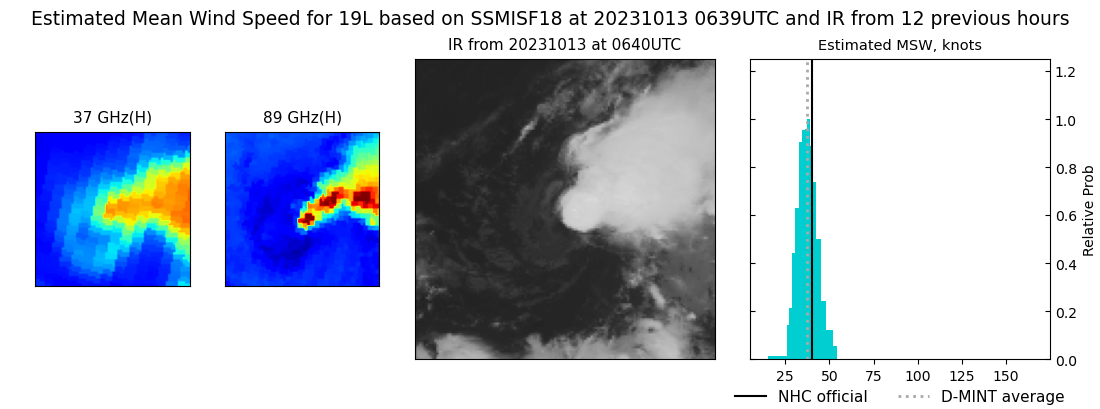 |
| 20231013 | 0444 UTC | AMSR2 | 1006 hPa | 38 kts | 35 kts | 42 kts | 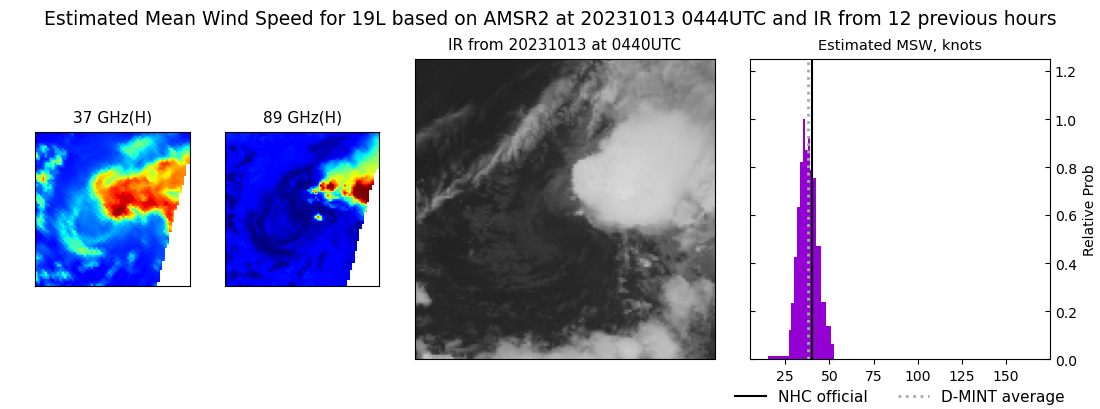 |
| 20231012 | 1804 UTC | SSMISF18 | 1007 hPa | 34 kts | 30 kts | 37 kts | 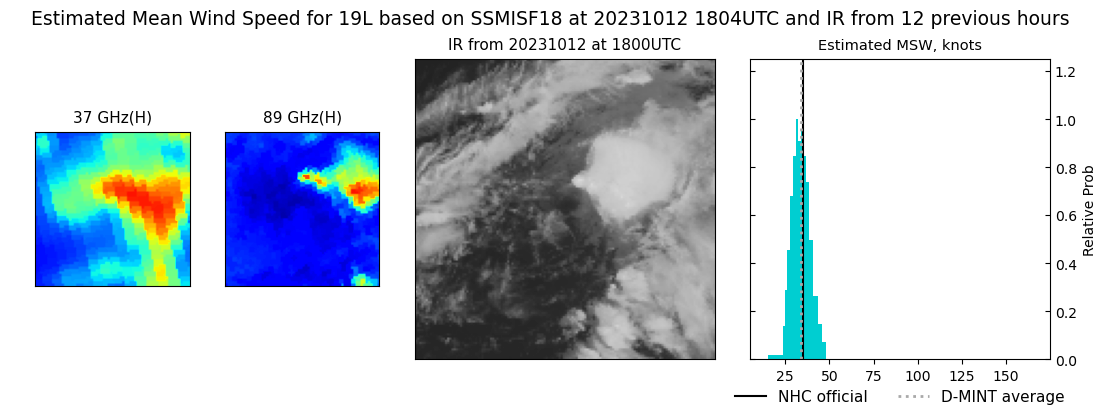 |
| 20231012 | 0825 UTC | SSMISF17 | 1007 hPa | 30 kts | 27 kts | 33 kts | 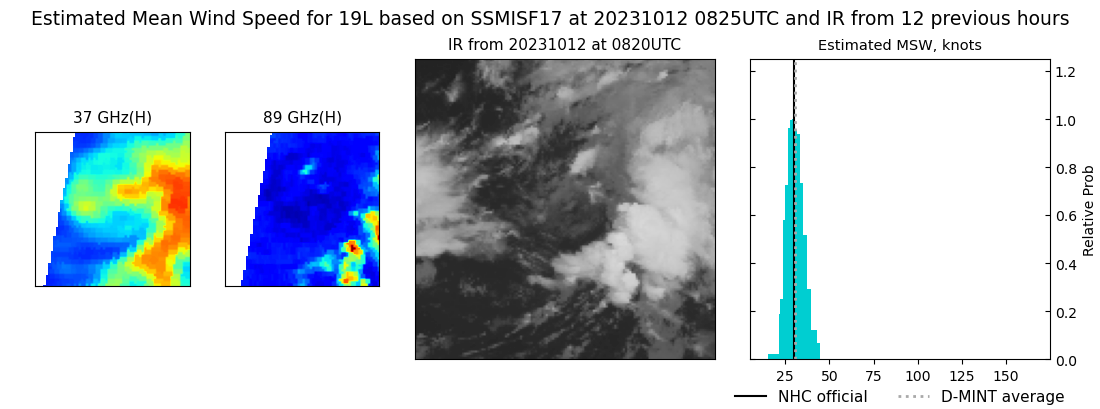 |
| 20231012 | 0654 UTC | SSMISF18 | 1007 hPa | 31 kts | 28 kts | 35 kts | 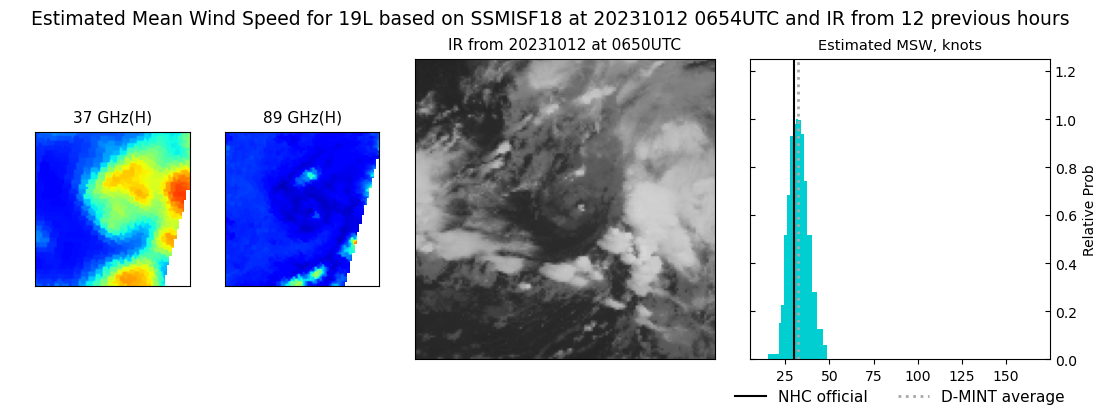 |
| 20231012 | 0400 UTC | AMSR2 | 1008 hPa | 28 kts | 25 kts | 31 kts | 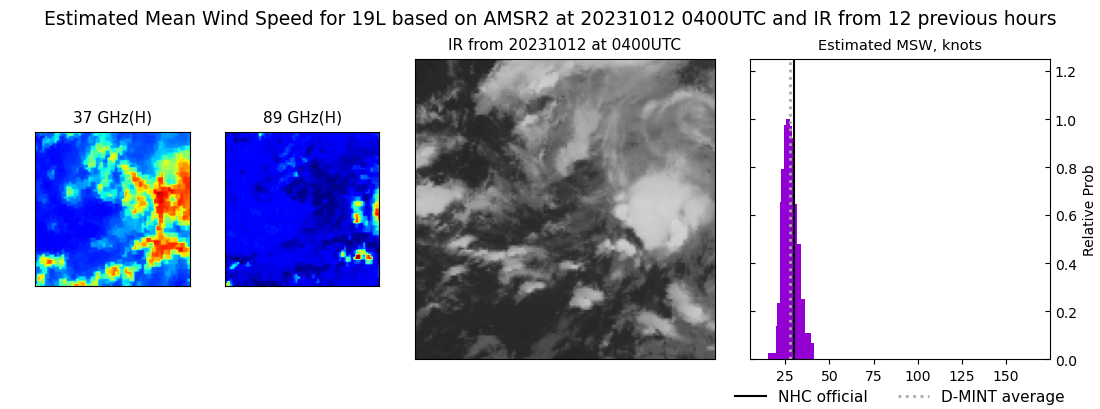 |
| 20231012 | 0031 UTC | GMI | 1005 hPa | 34 kts | 30 kts | 38 kts | 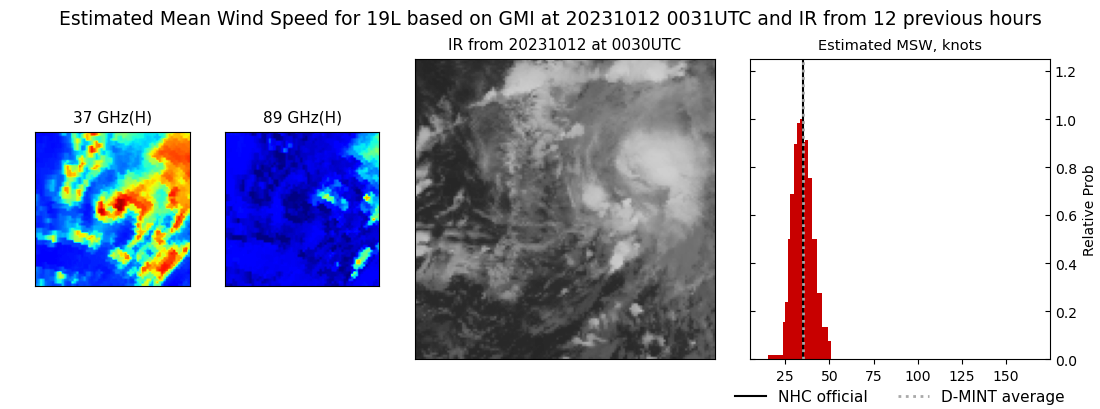 |
| 20231011 | 1816 UTC | SSMISF18 | 1003 hPa | 40 kts | 36 kts | 45 kts | 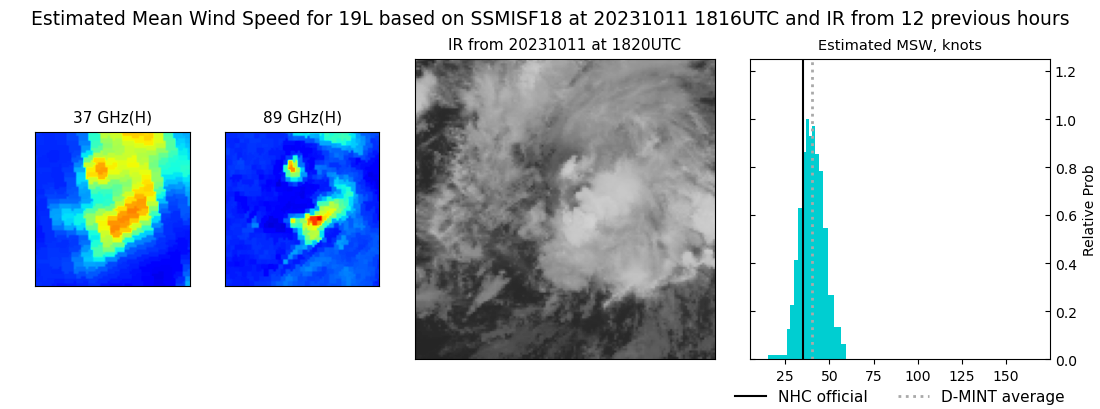 |
| 20231011 | 1545 UTC | AMSR2 | 1006 hPa | 39 kts | 34 kts | 43 kts | 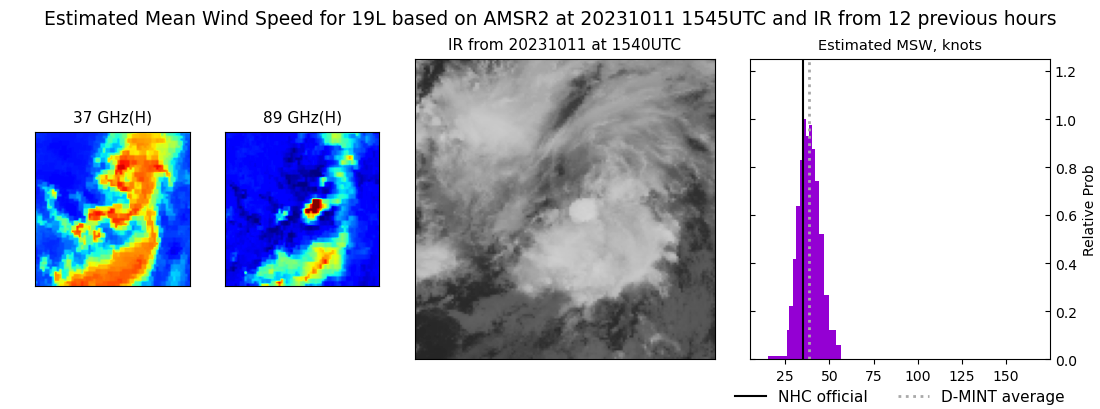 |
| 20231011 | 0838 UTC | SSMISF17 | 1004 hPa | 43 kts | 38 kts | 49 kts | 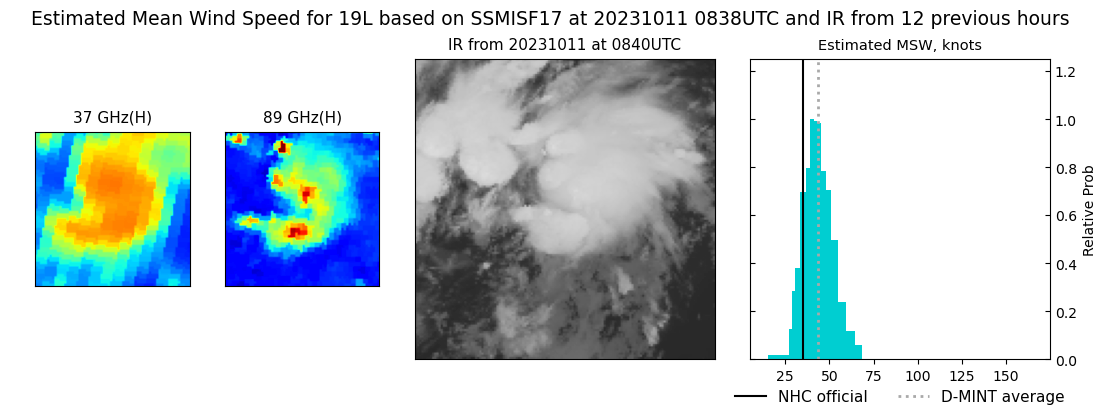 |
| 20231011 | 0319 UTC | AMSR2 | NaN hPa | 39 kts | 34 kts | 44 kts |  |
|
