|
||
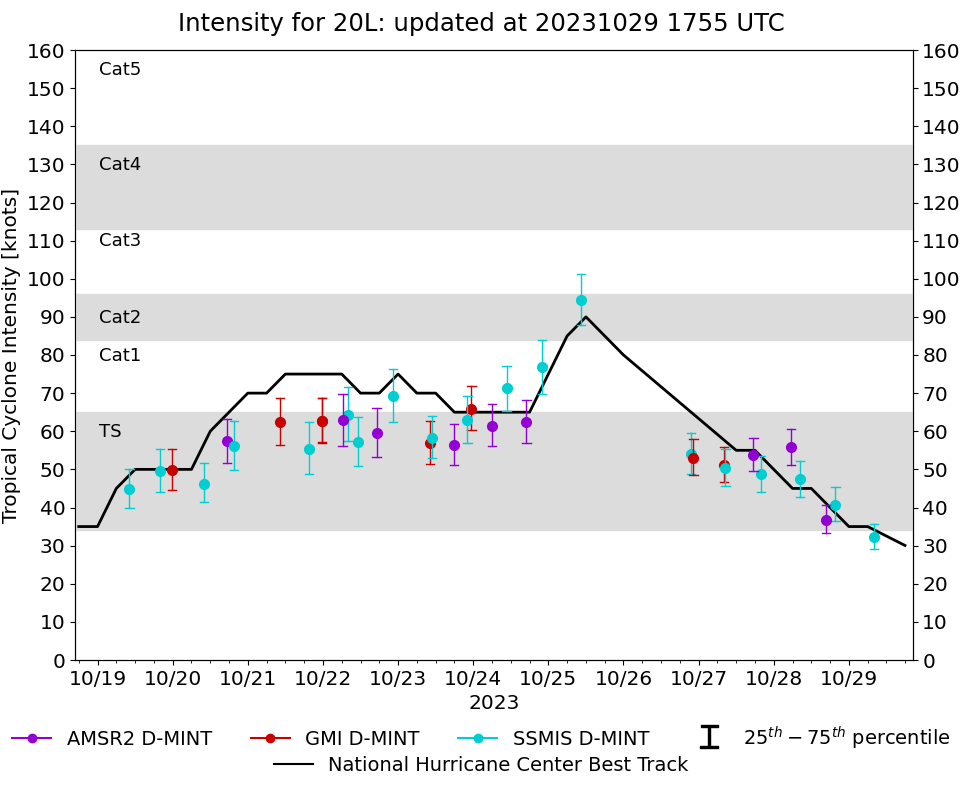 |
D-MINT HISTORY FILE for 2023_20L
| Date | Time | MW Sensor | MSLP | Vmax (30th-70th percentile average) | Vmax 25th percentile | Vmax 75th percentile | Image |
| 20231029 | 0806 UTC | SSMISF18 | 1004 hPa | 32 kts | 29 kts | 36 kts | 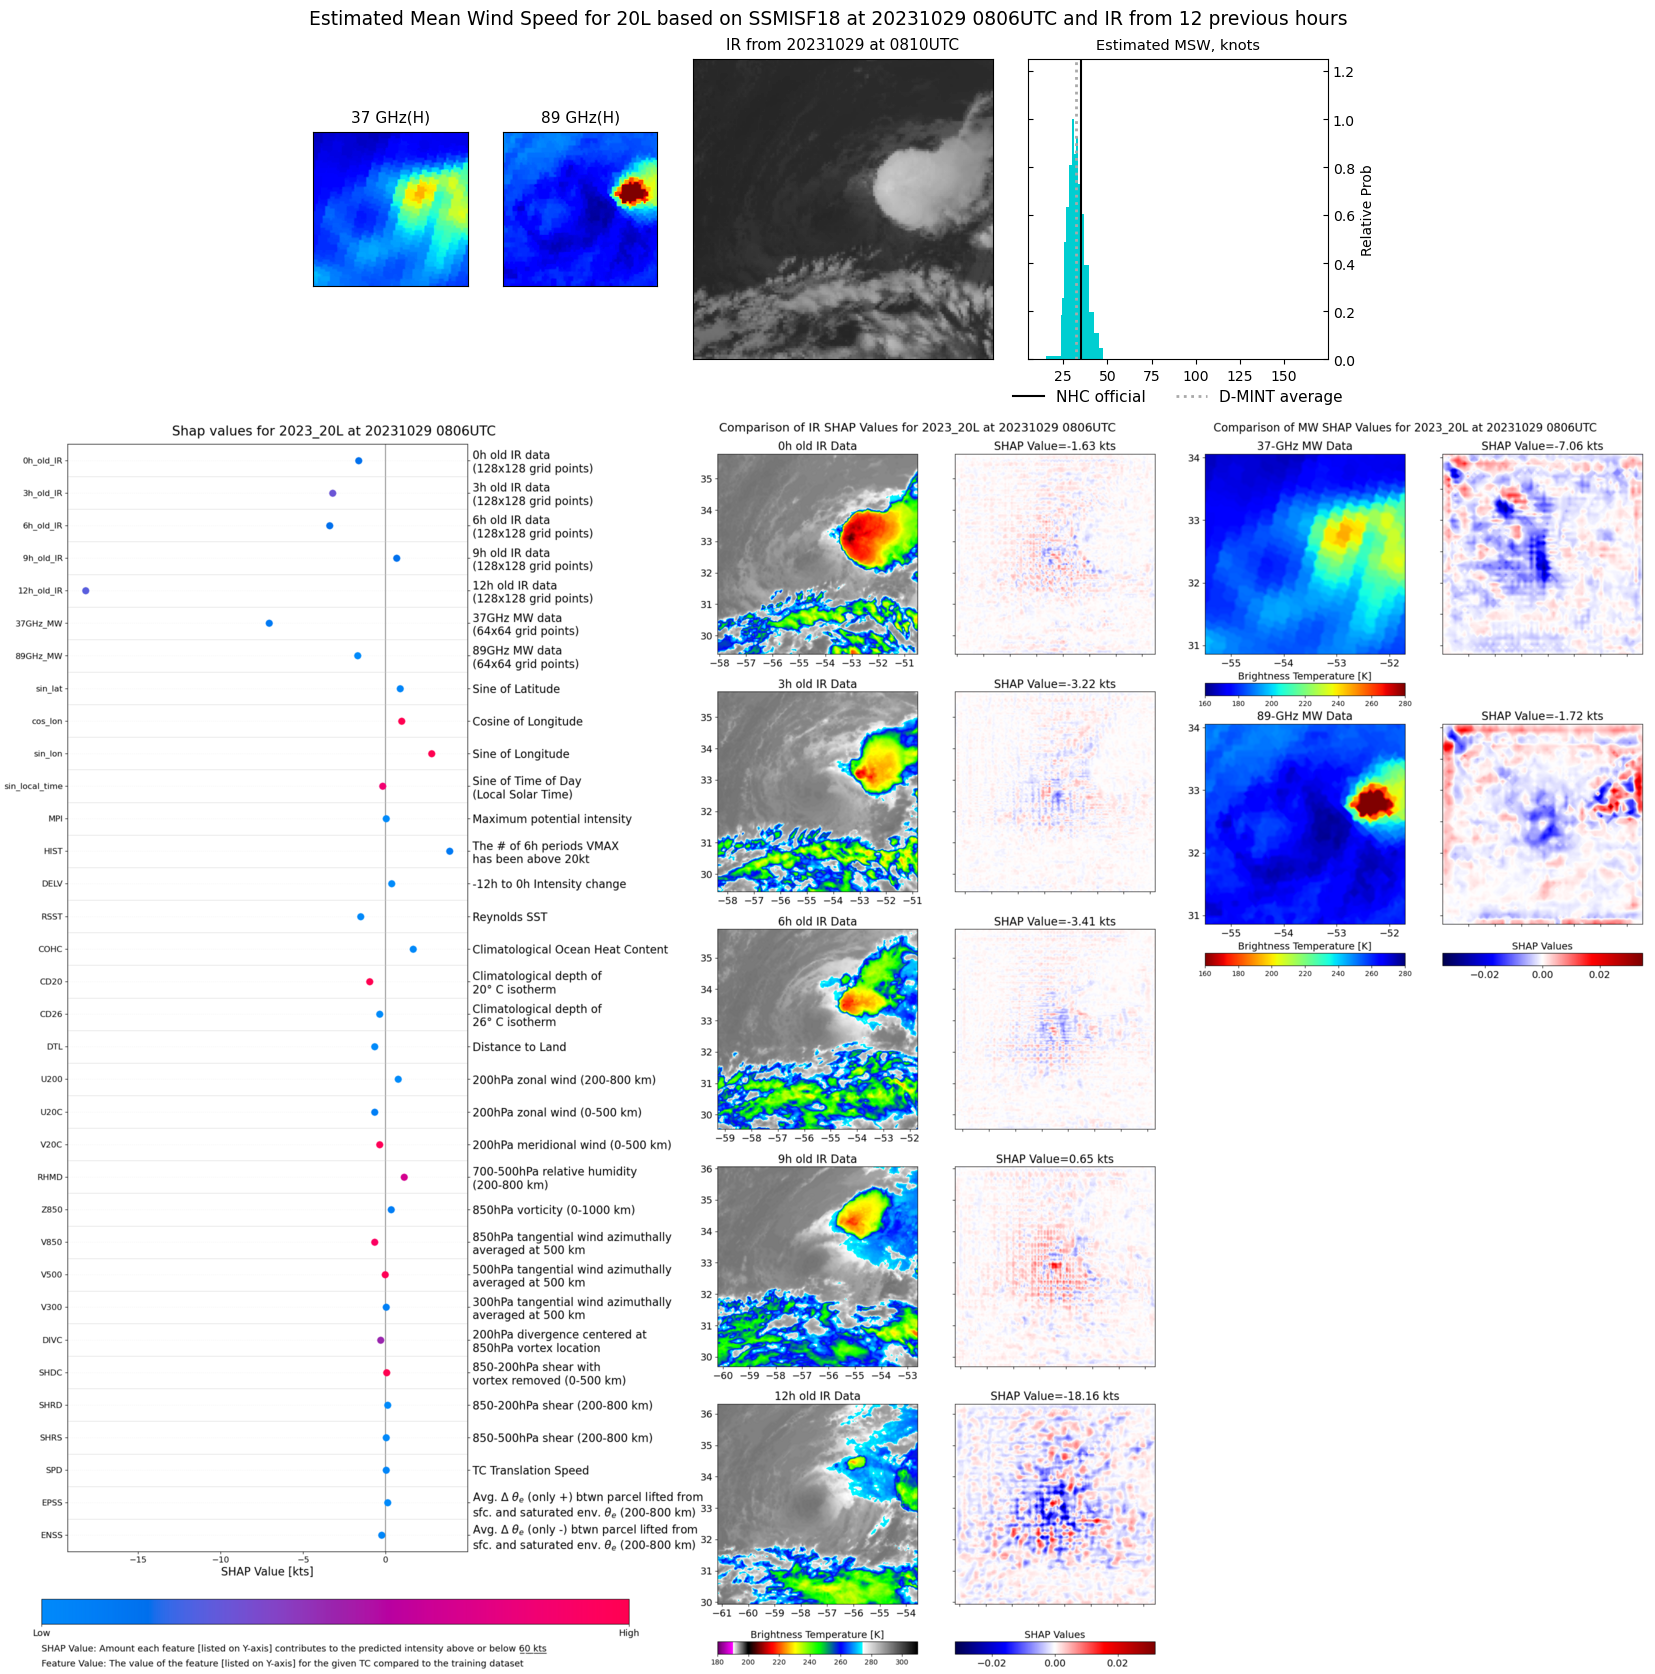 |
| 20231028 | 1941 UTC | SSMISF18 | 1001 hPa | 41 kts | 36 kts | 45 kts | 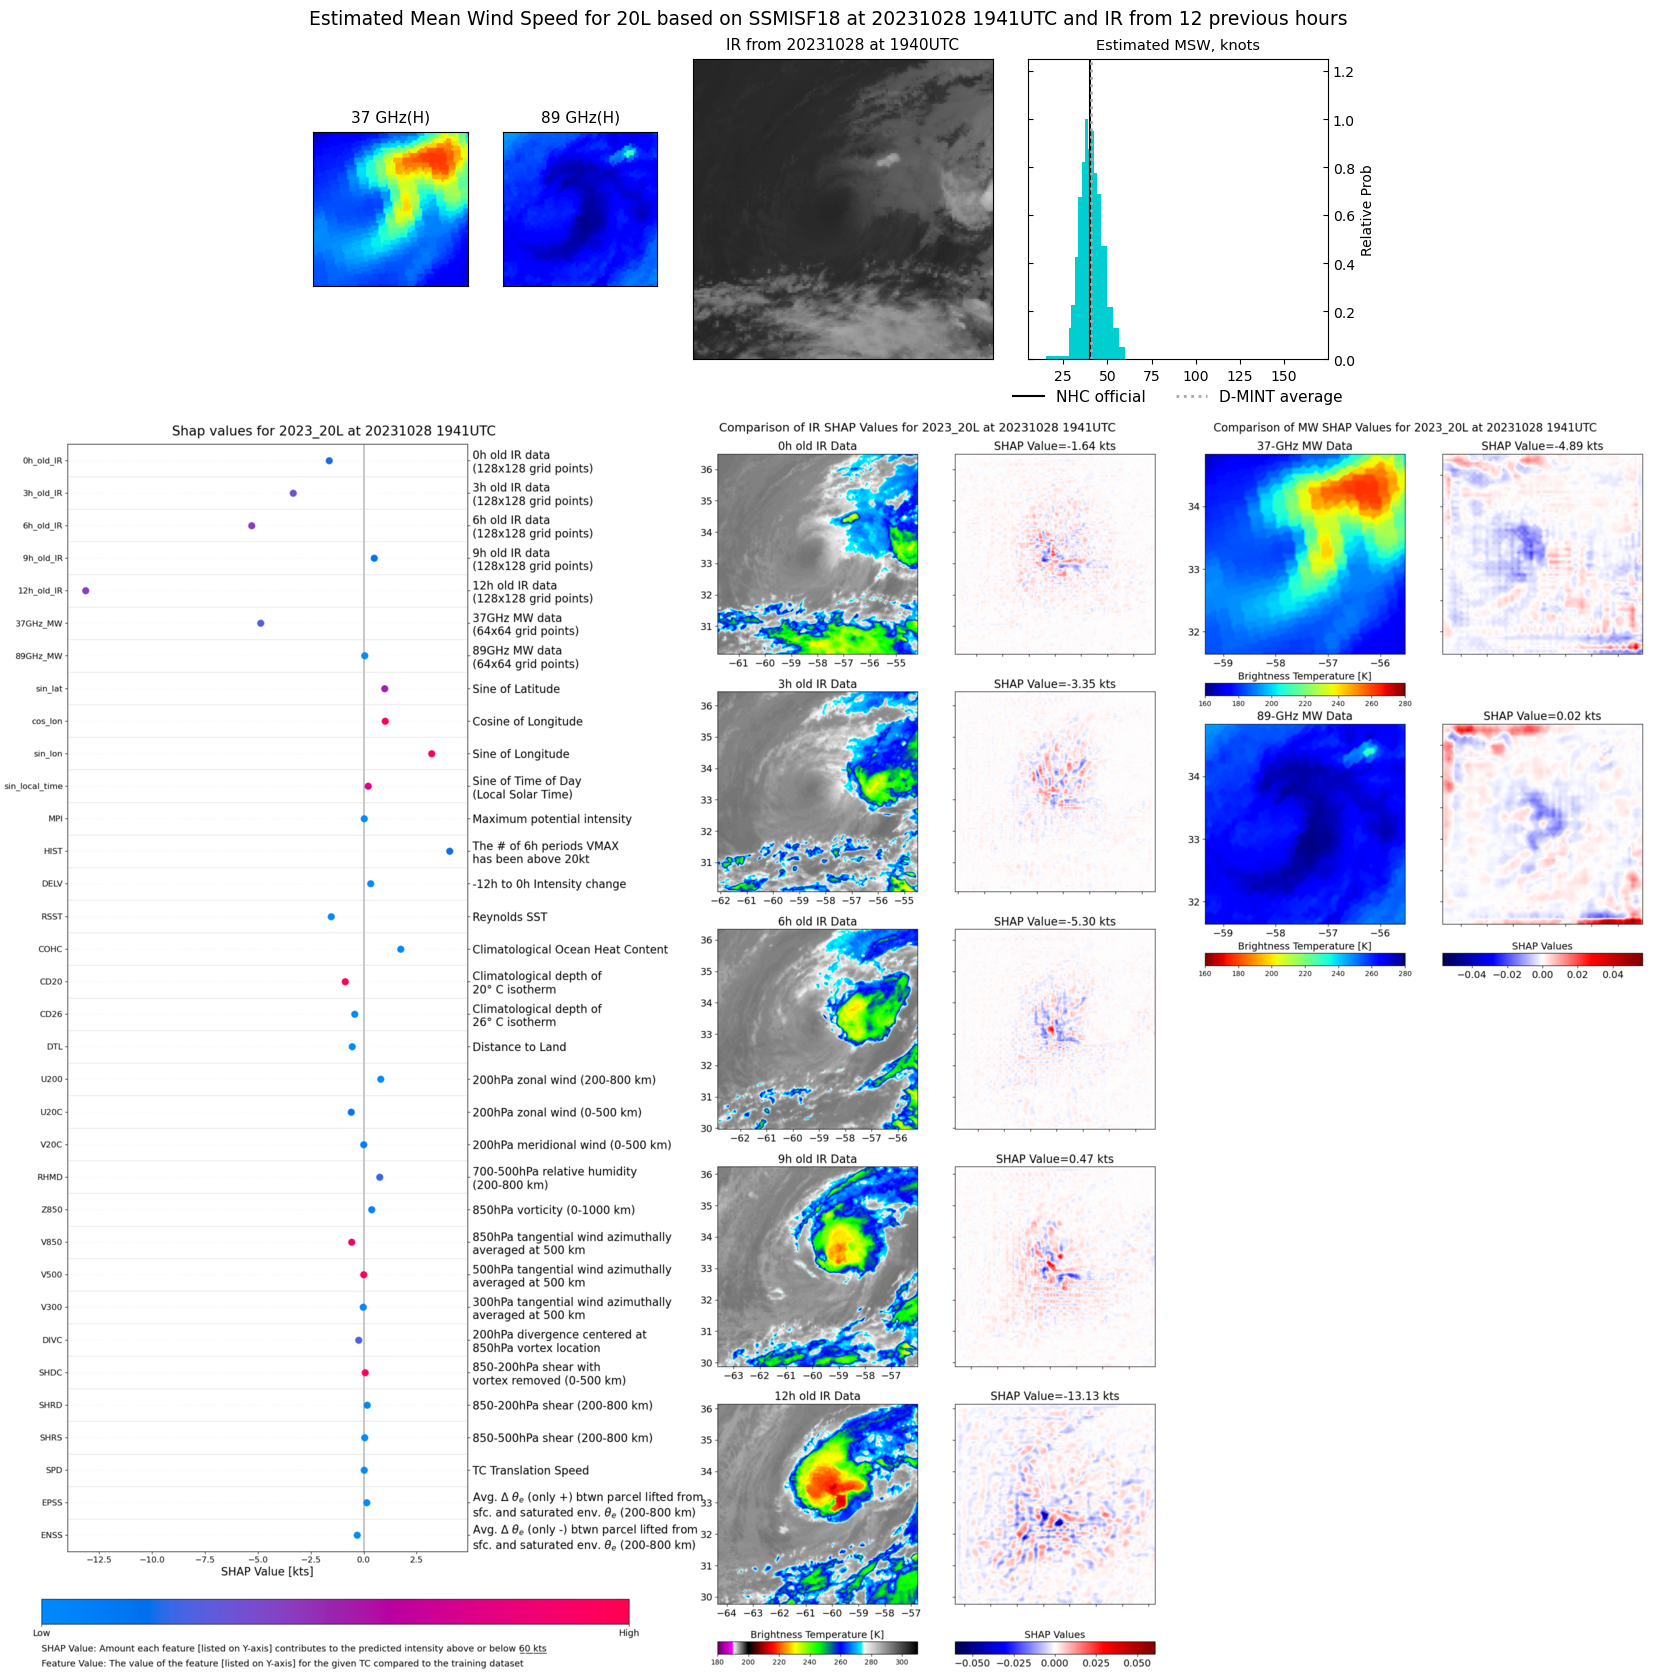 |
| 20231028 | 1636 UTC | AMSR2 | 1001 hPa | 37 kts | 33 kts | 41 kts | 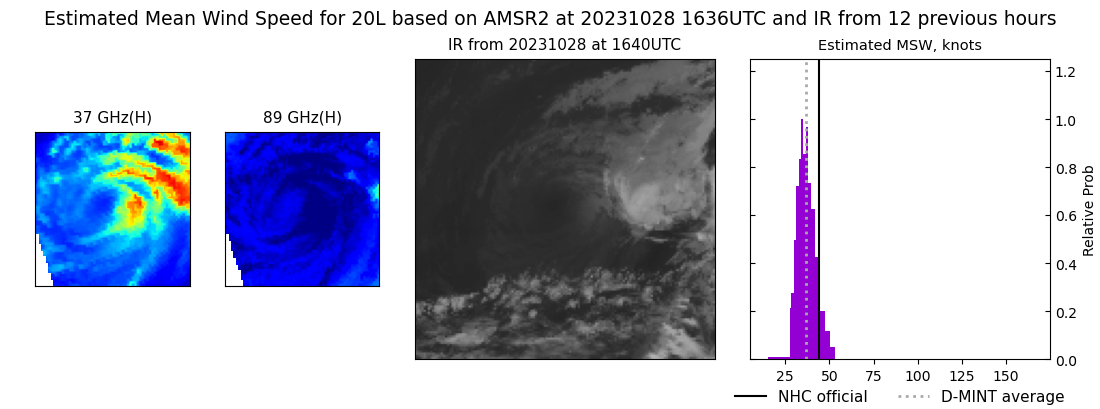 |
| 20231028 | 0820 UTC | SSMISF18 | 996 hPa | 48 kts | 43 kts | 52 kts | 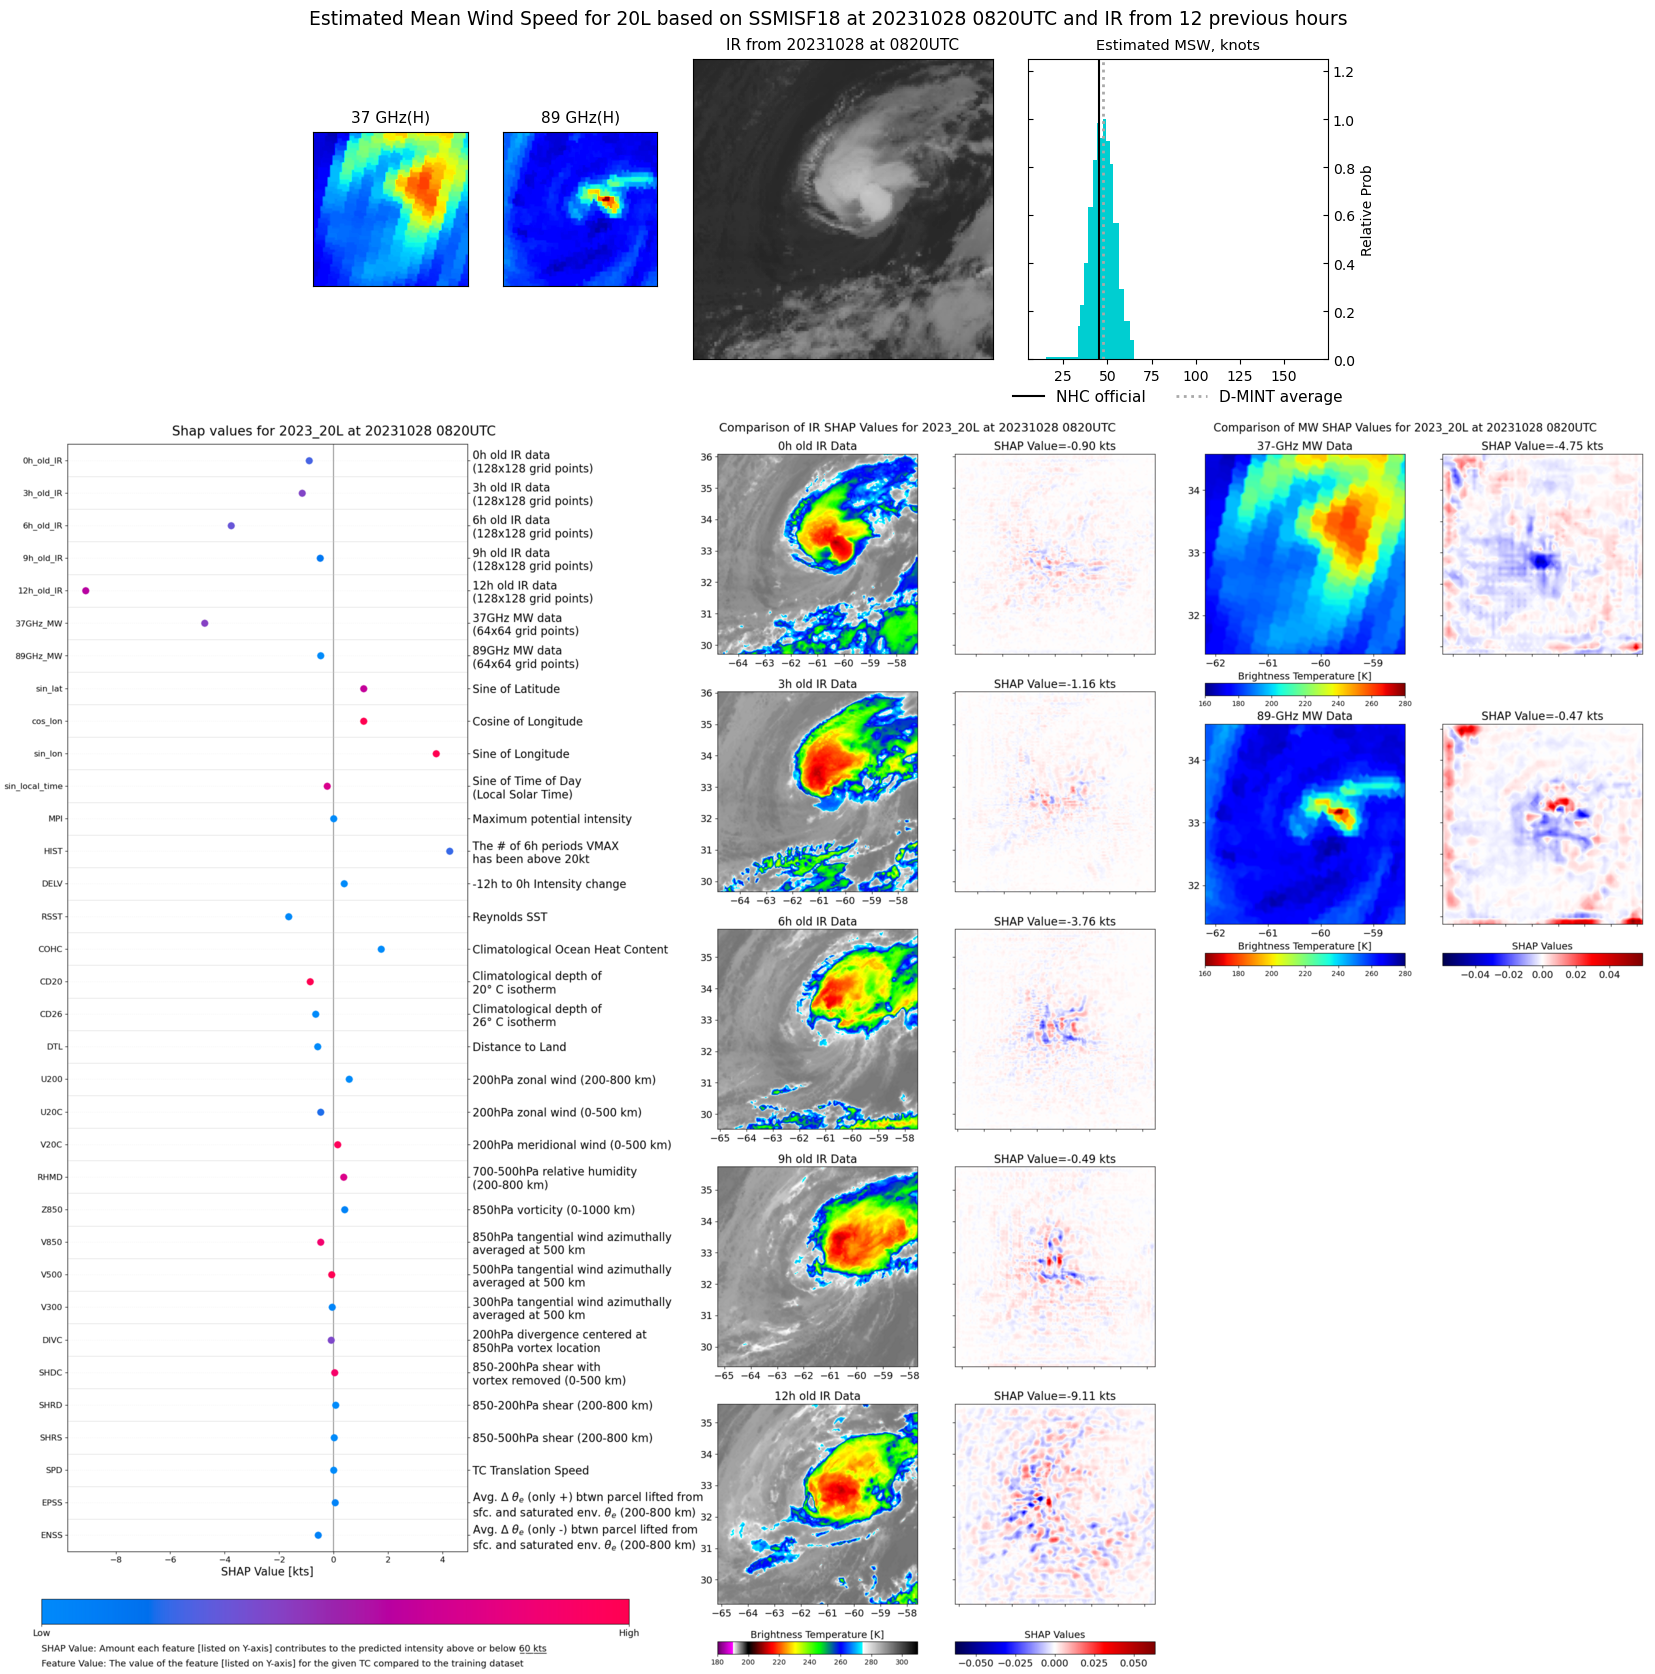 |
| 20231028 | 0535 UTC | AMSR2 | 998 hPa | 56 kts | 51 kts | 61 kts | 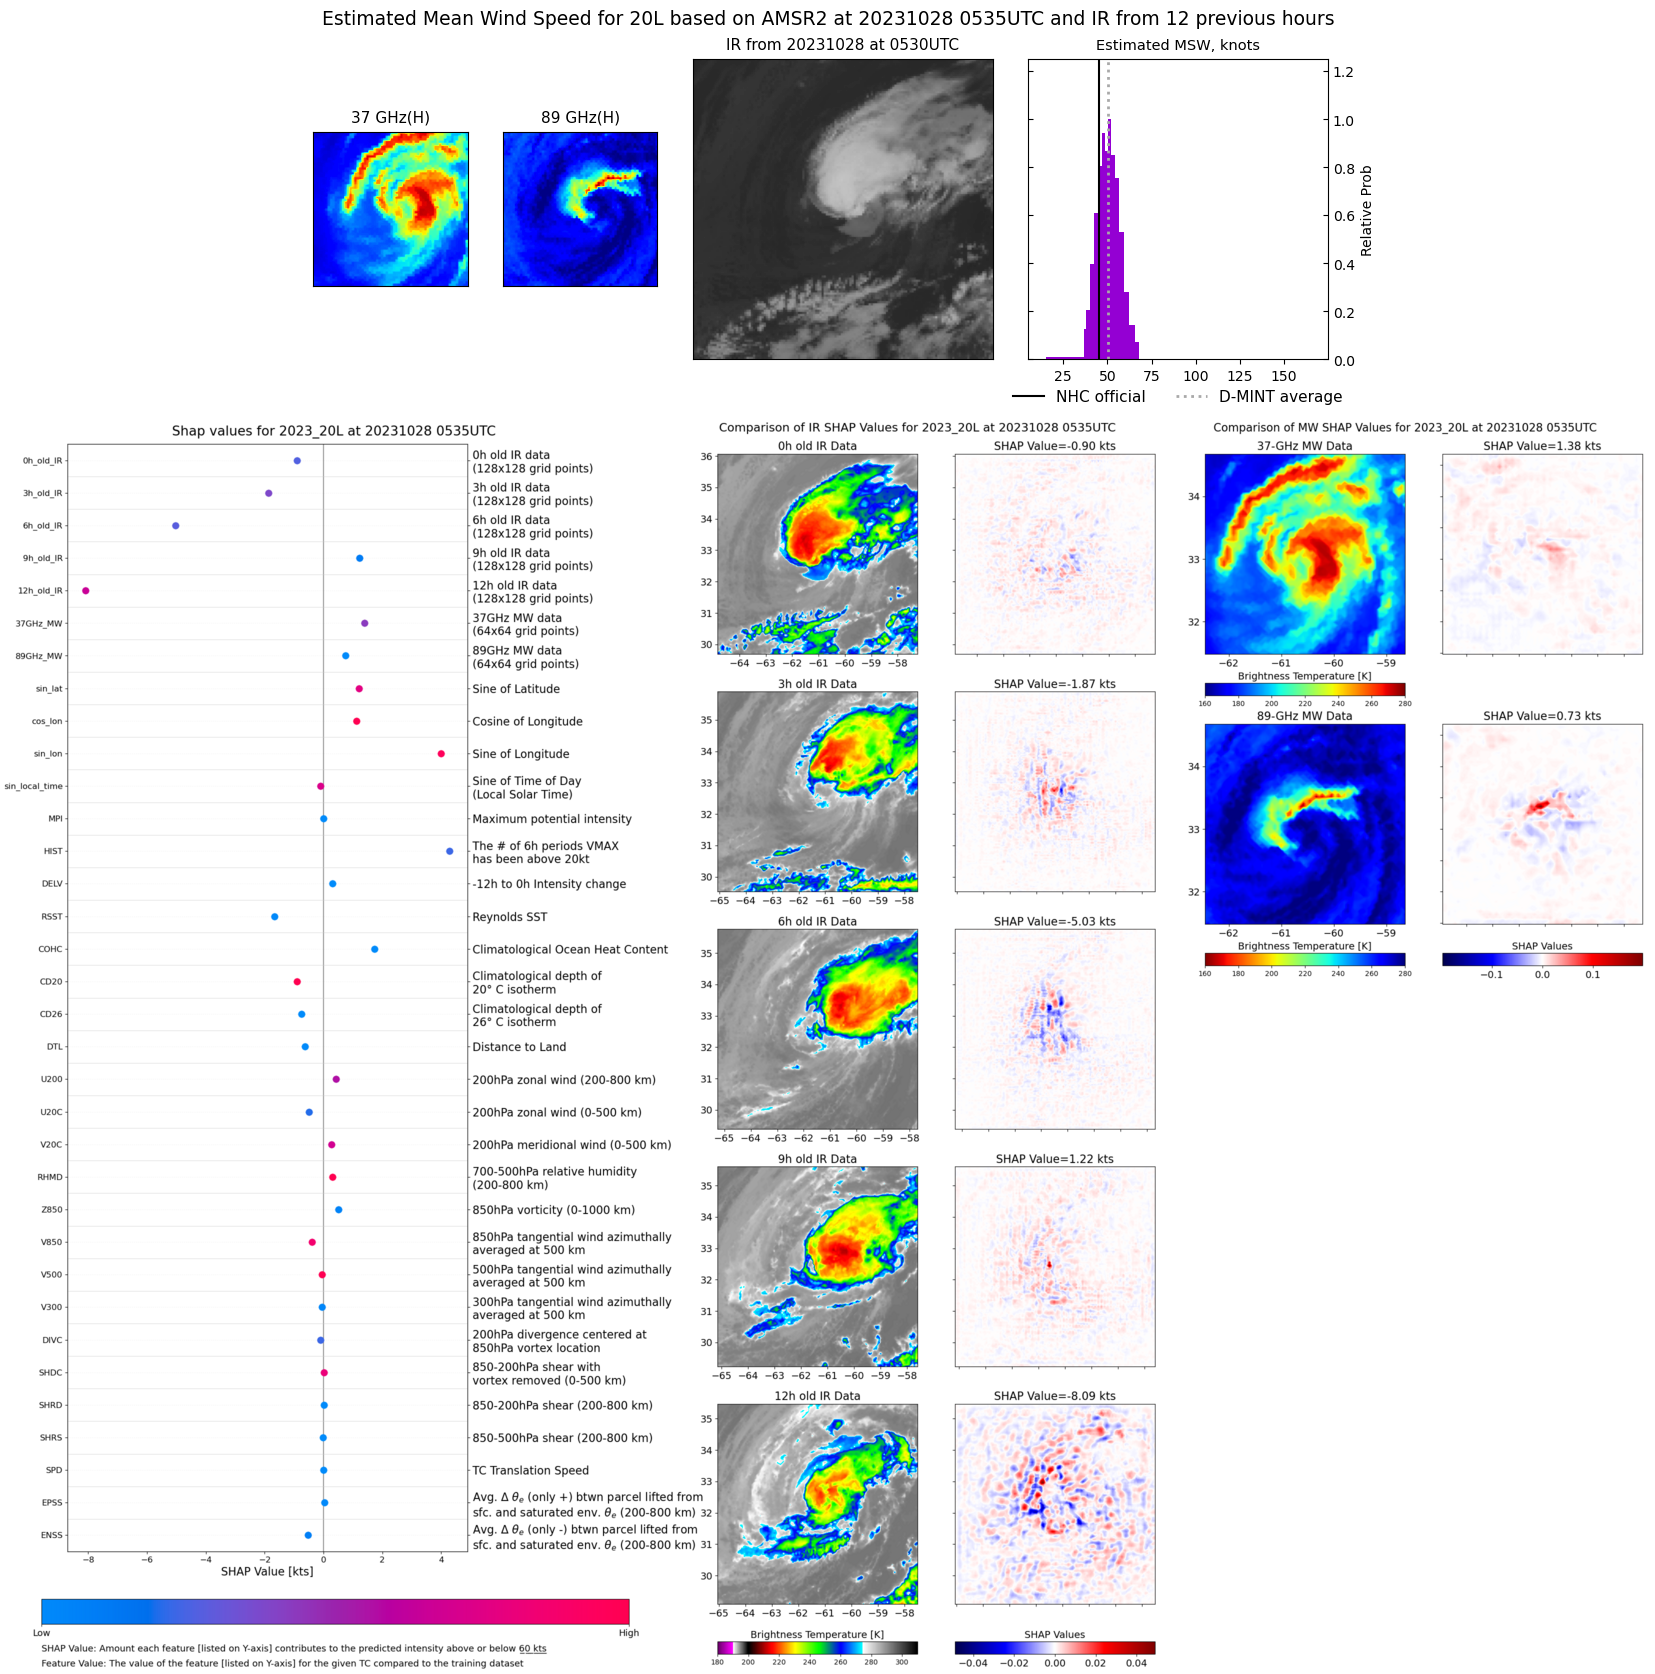 |
| 20231027 | 1955 UTC | SSMISF18 | 995 hPa | 49 kts | 44 kts | 53 kts | 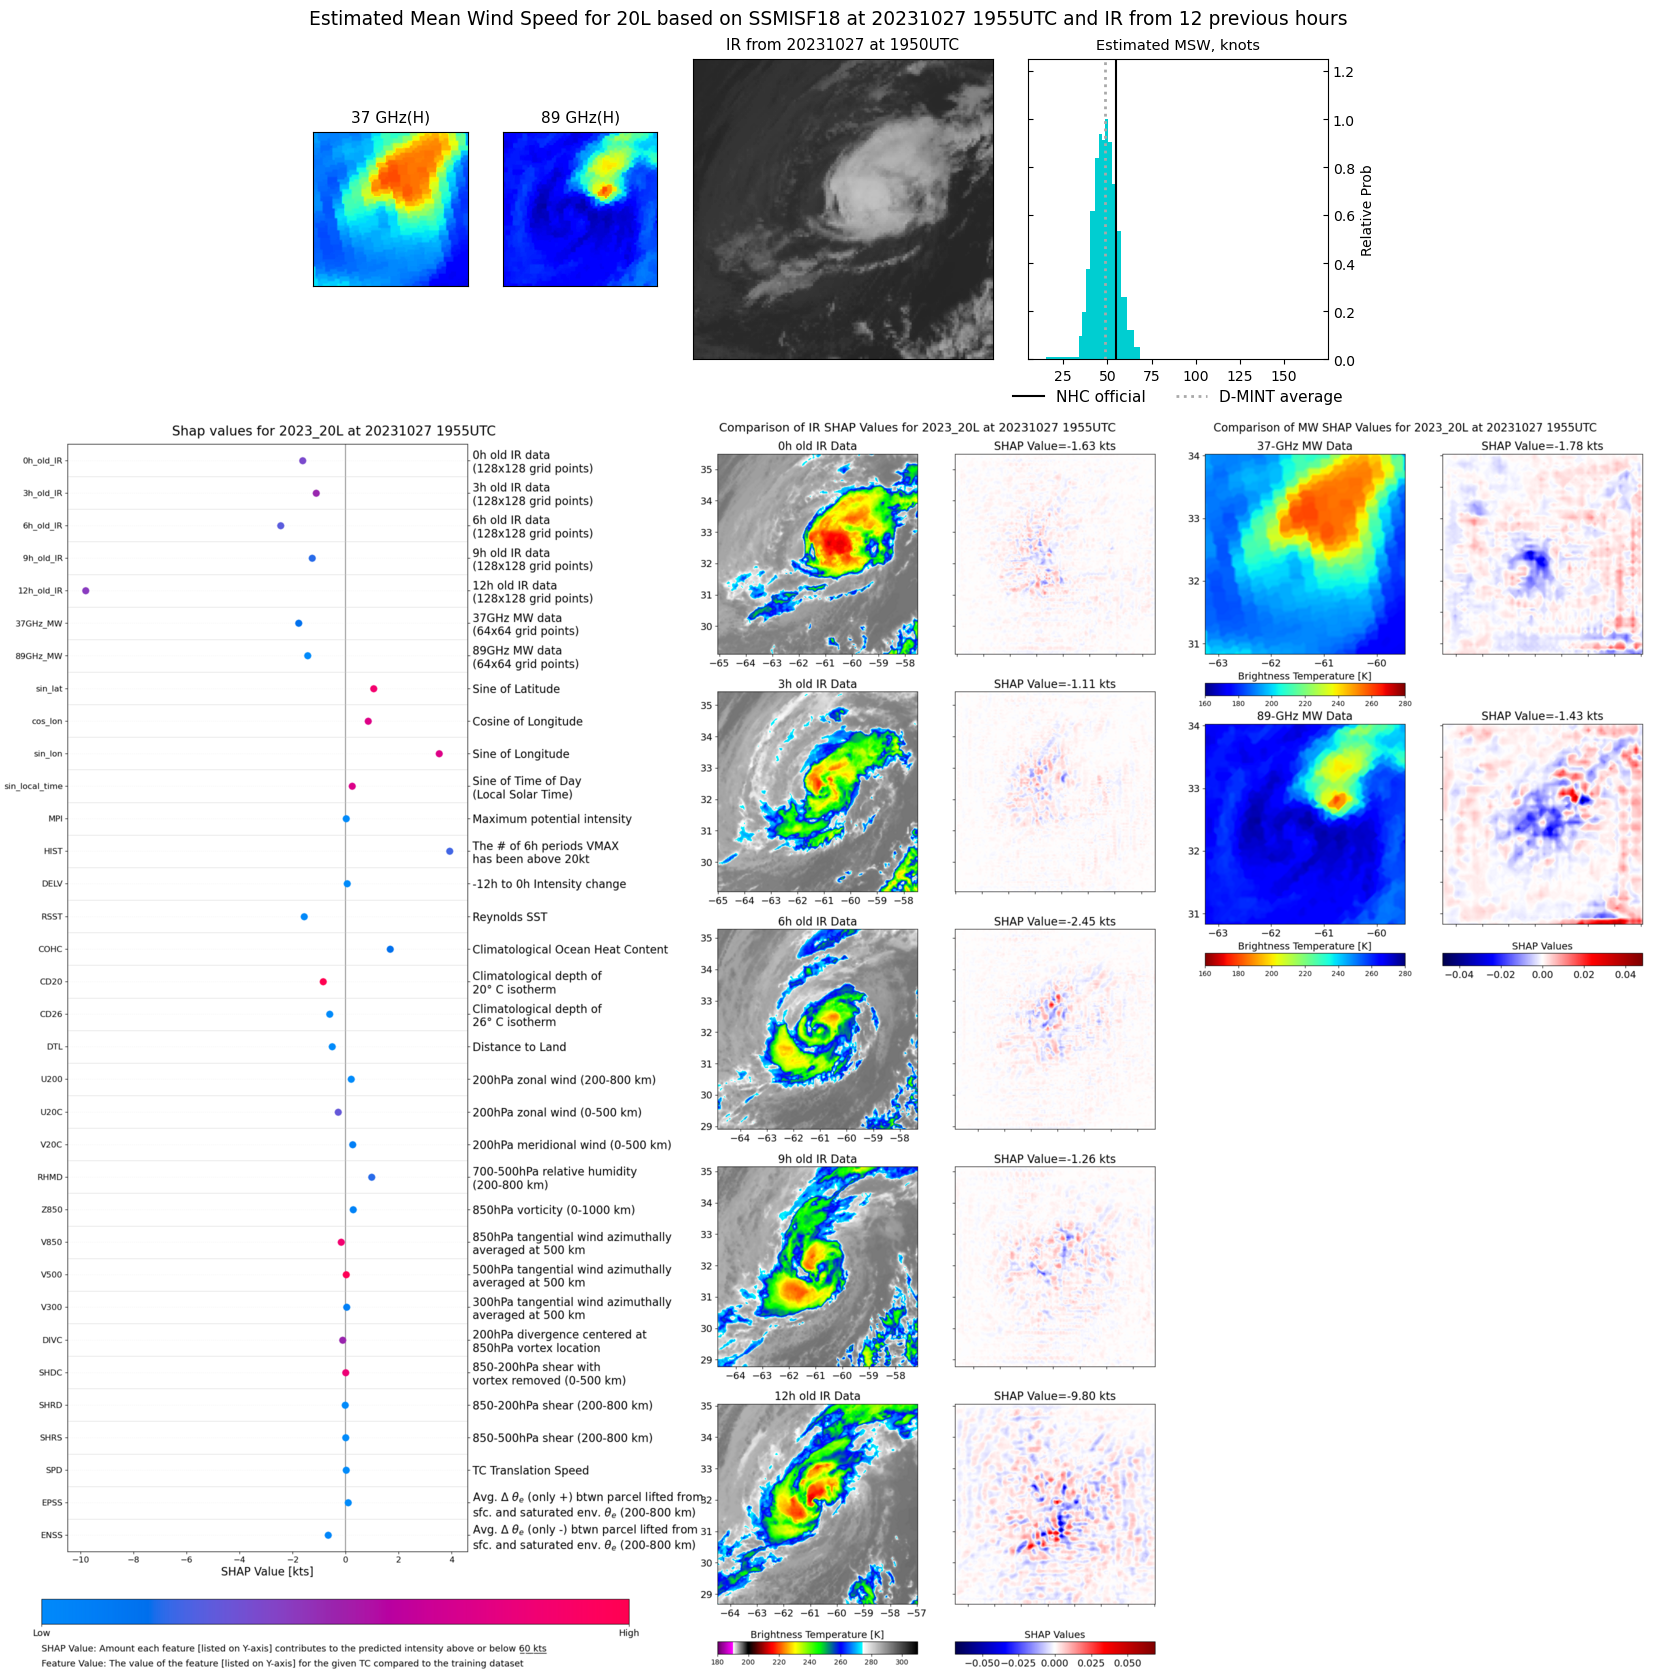 |
| 20231027 | 1730 UTC | AMSR2 | 989 hPa | 54 kts | 49 kts | 58 kts | 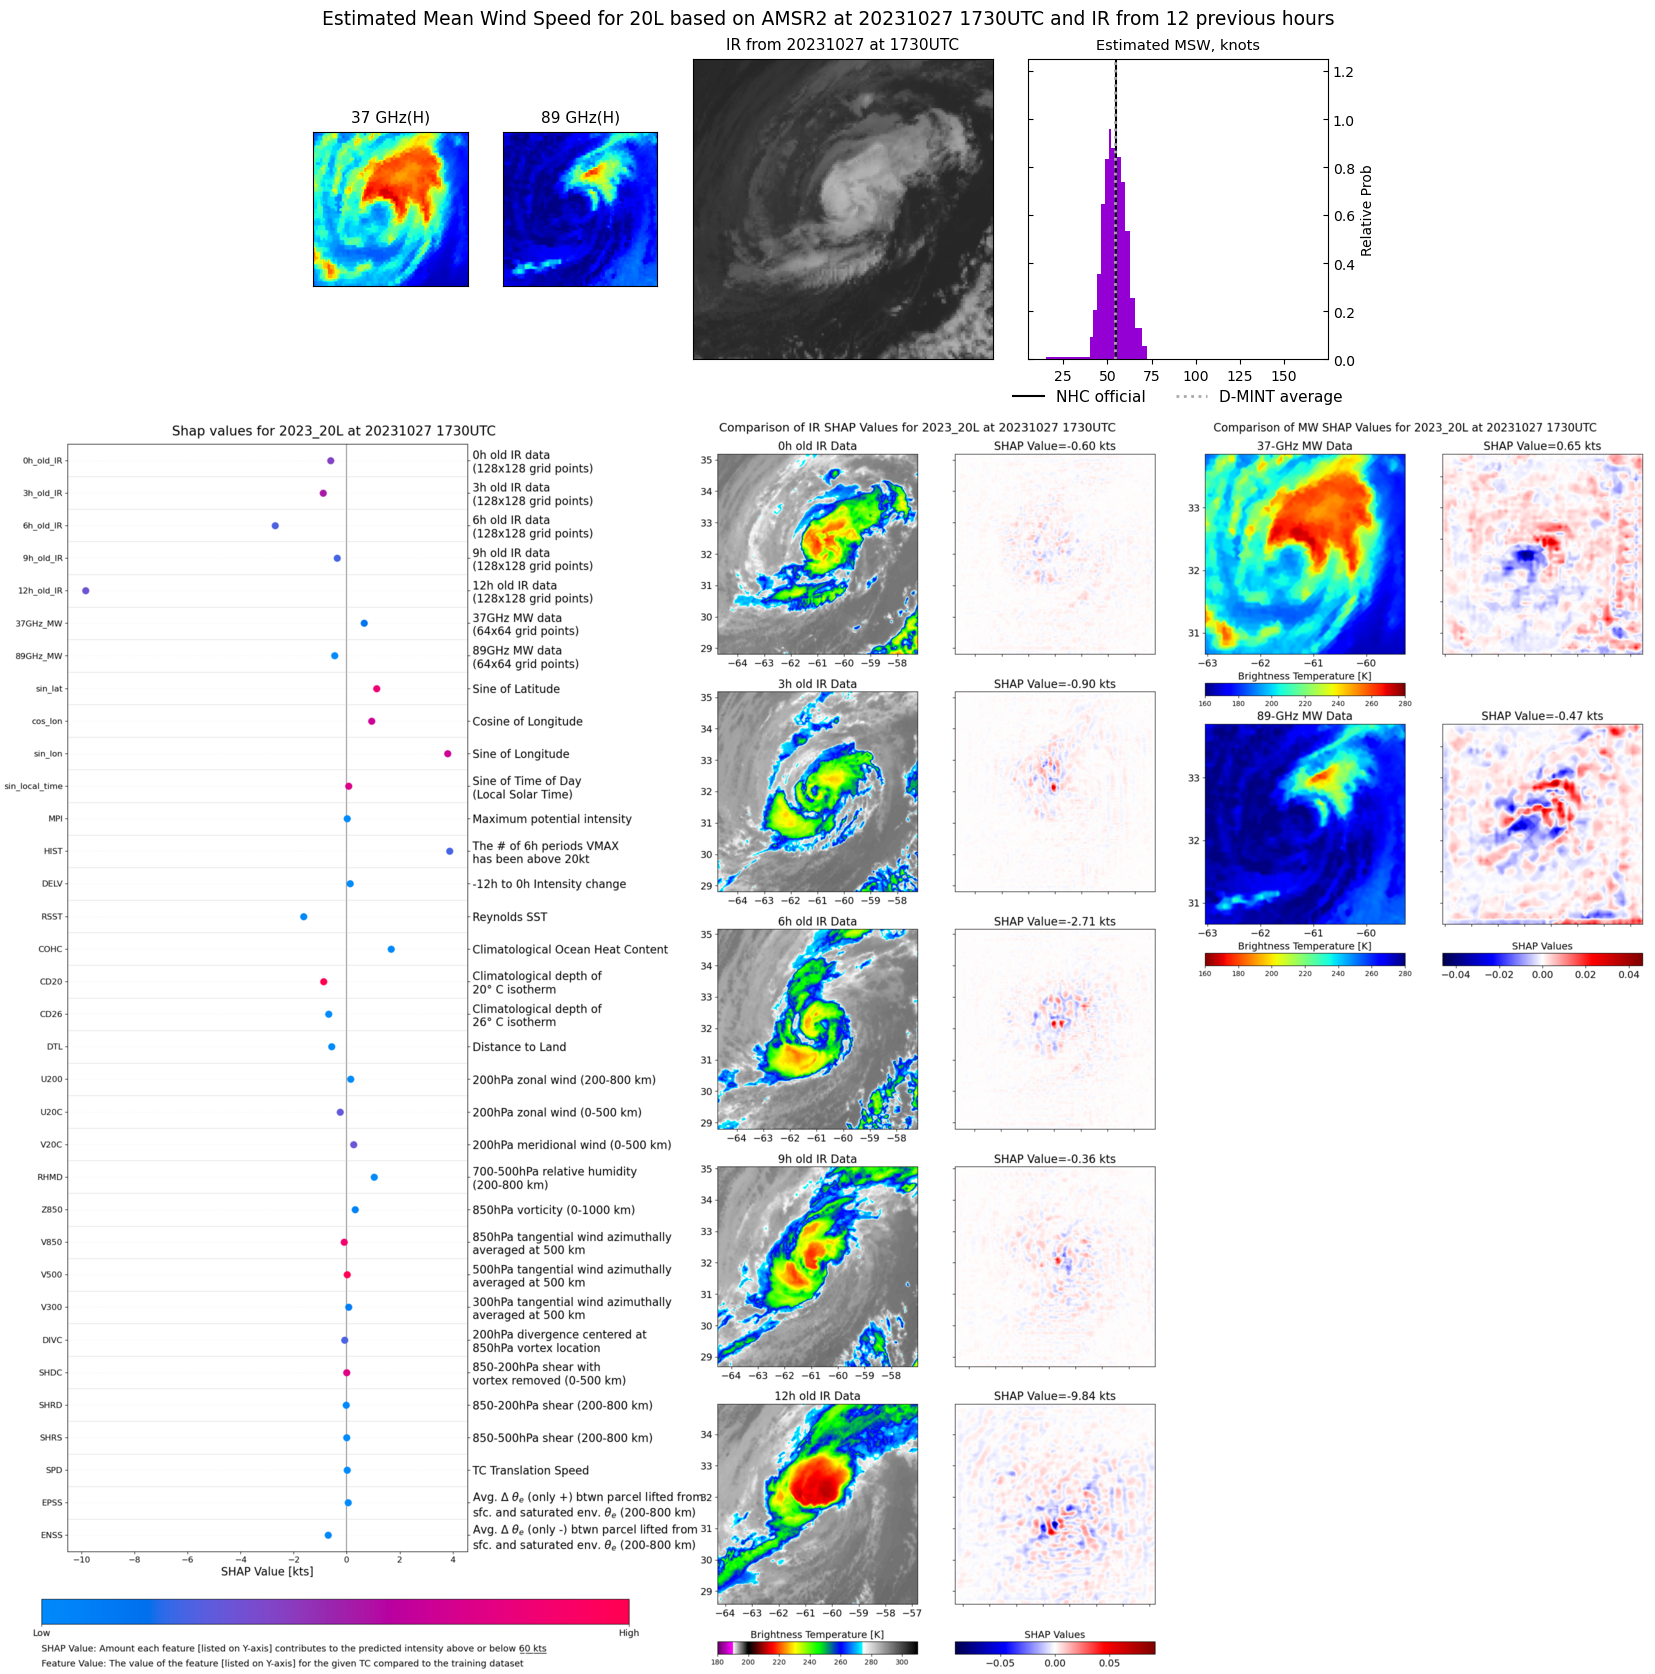 |
| 20231027 | 0833 UTC | SSMISF18 | 987 hPa | 50 kts | 46 kts | 55 kts | 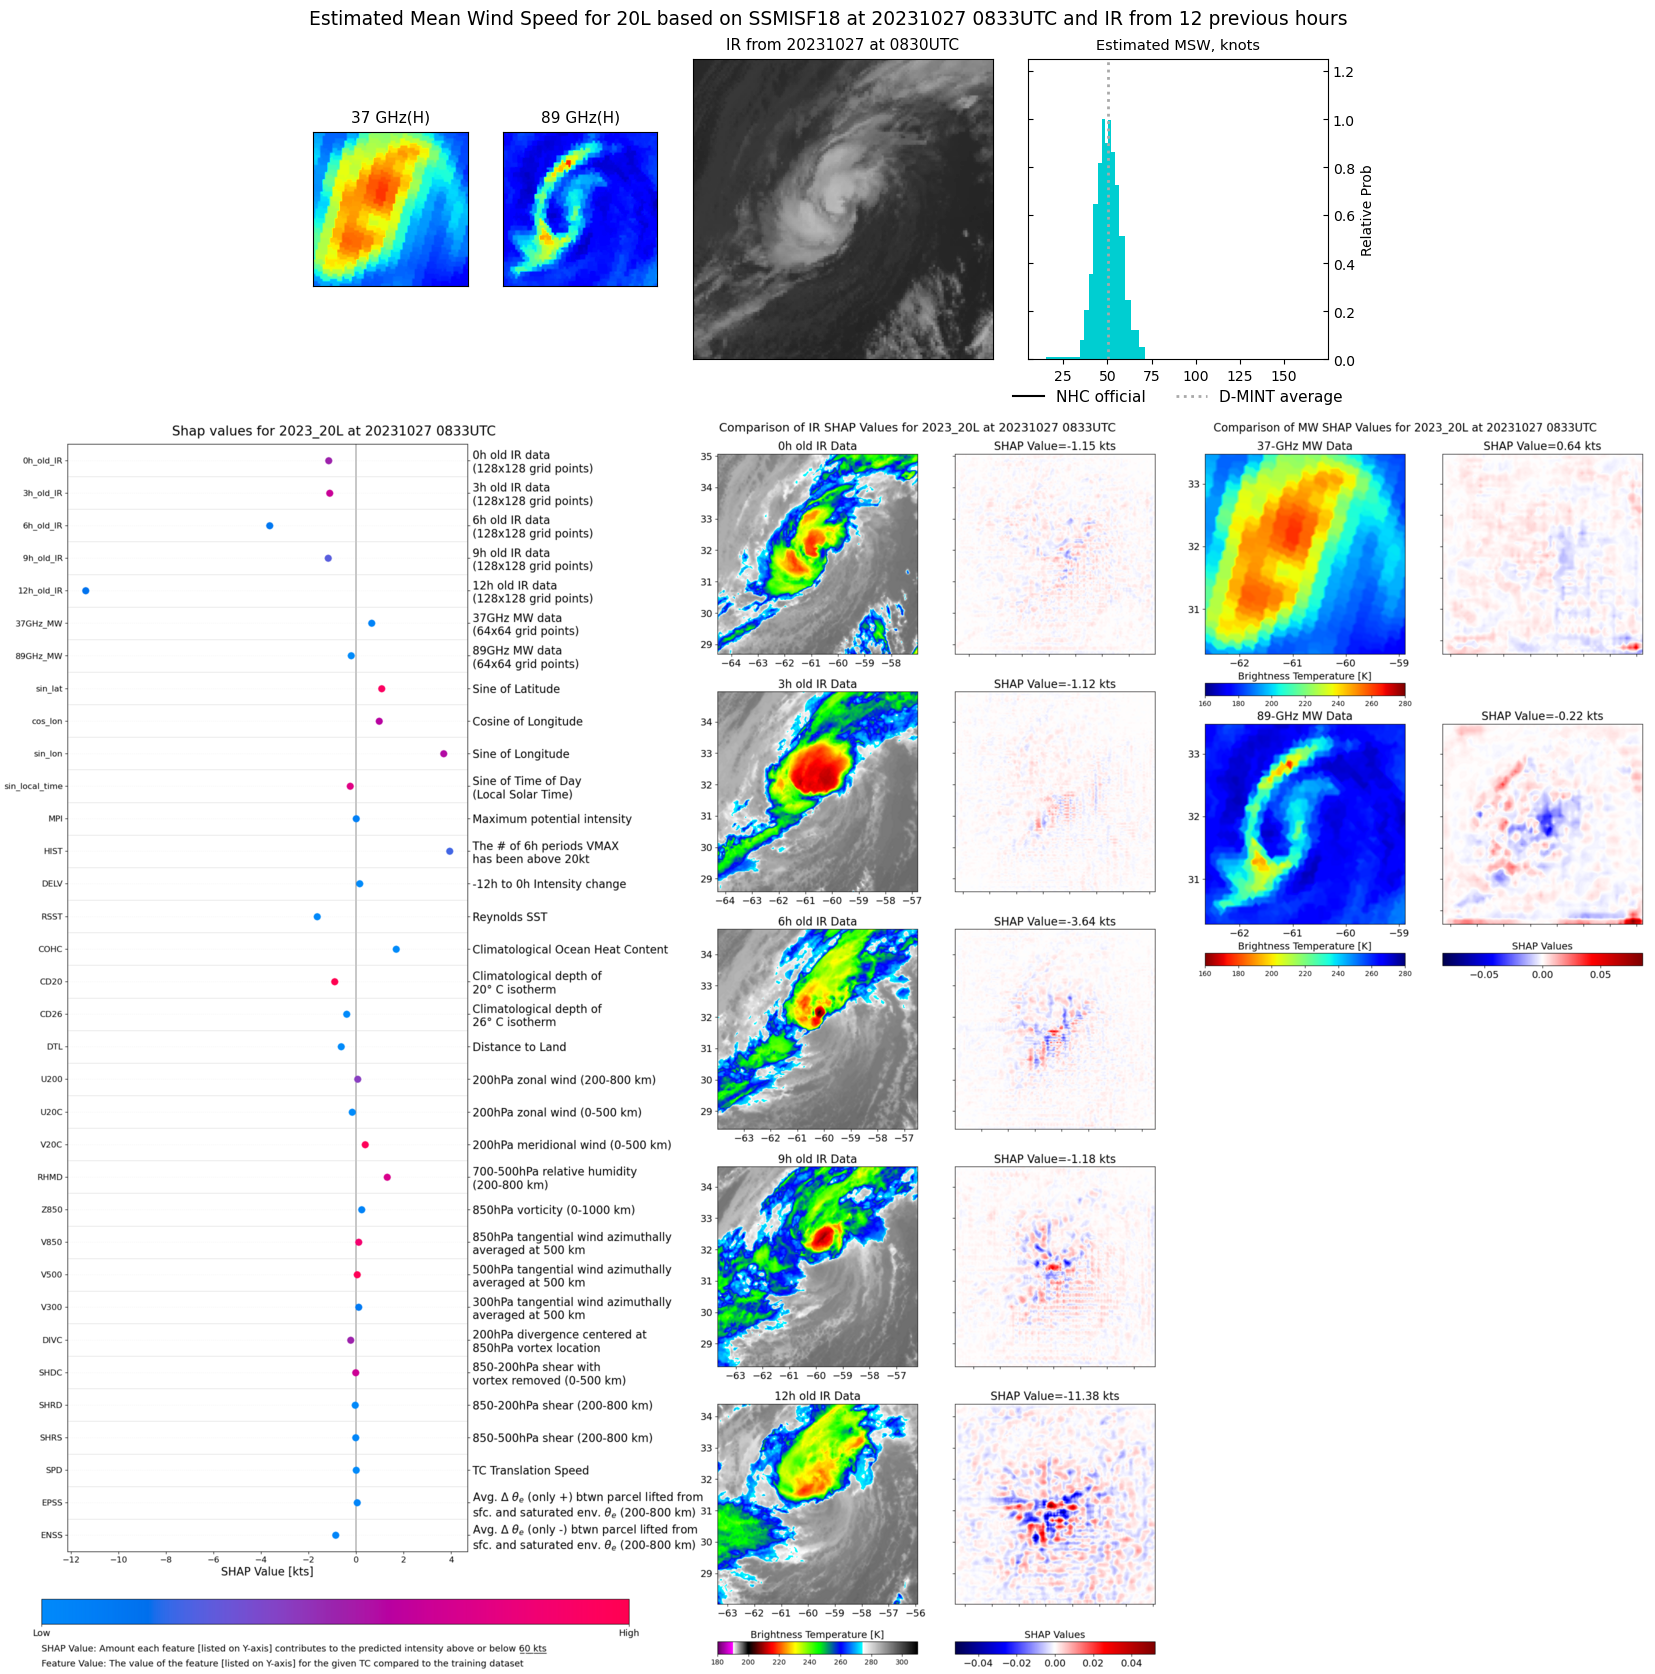 |
| 20231027 | 0806 UTC | GMI | 988 hPa | 51 kts | 47 kts | 56 kts | 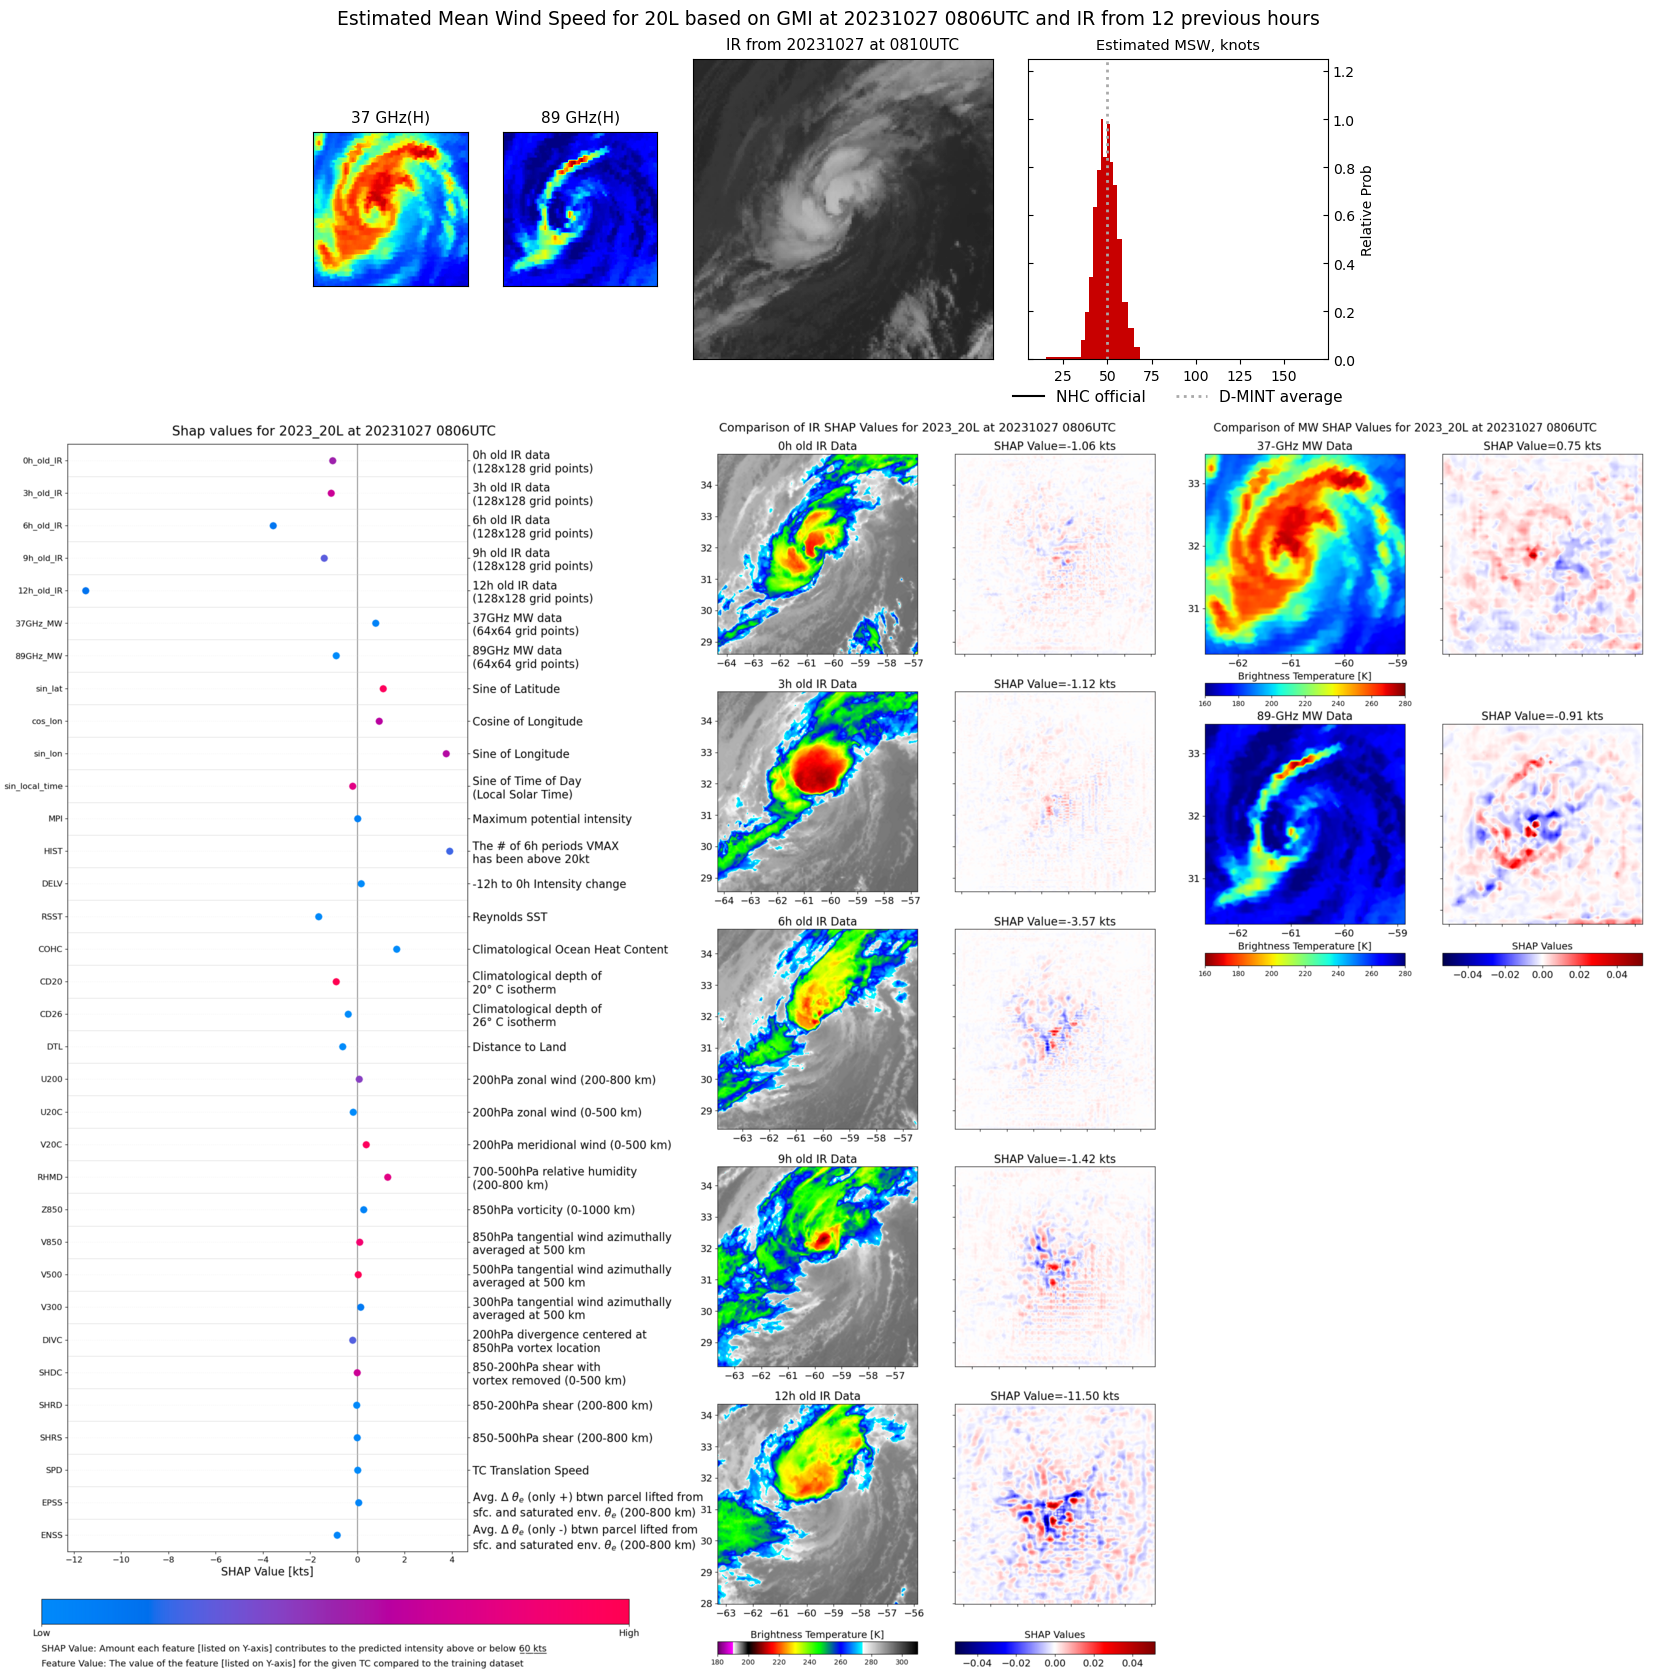 |
| 20231026 | 2221 UTC | GMI | 988 hPa | 53 kts | 49 kts | 58 kts | 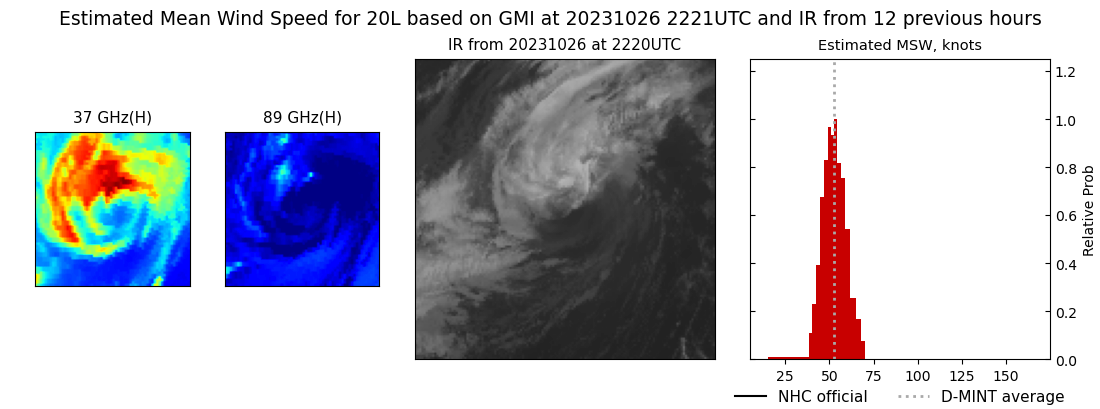 |
| 20231026 | 2132 UTC | SSMISF17 | 987 hPa | 54 kts | 49 kts | 60 kts | 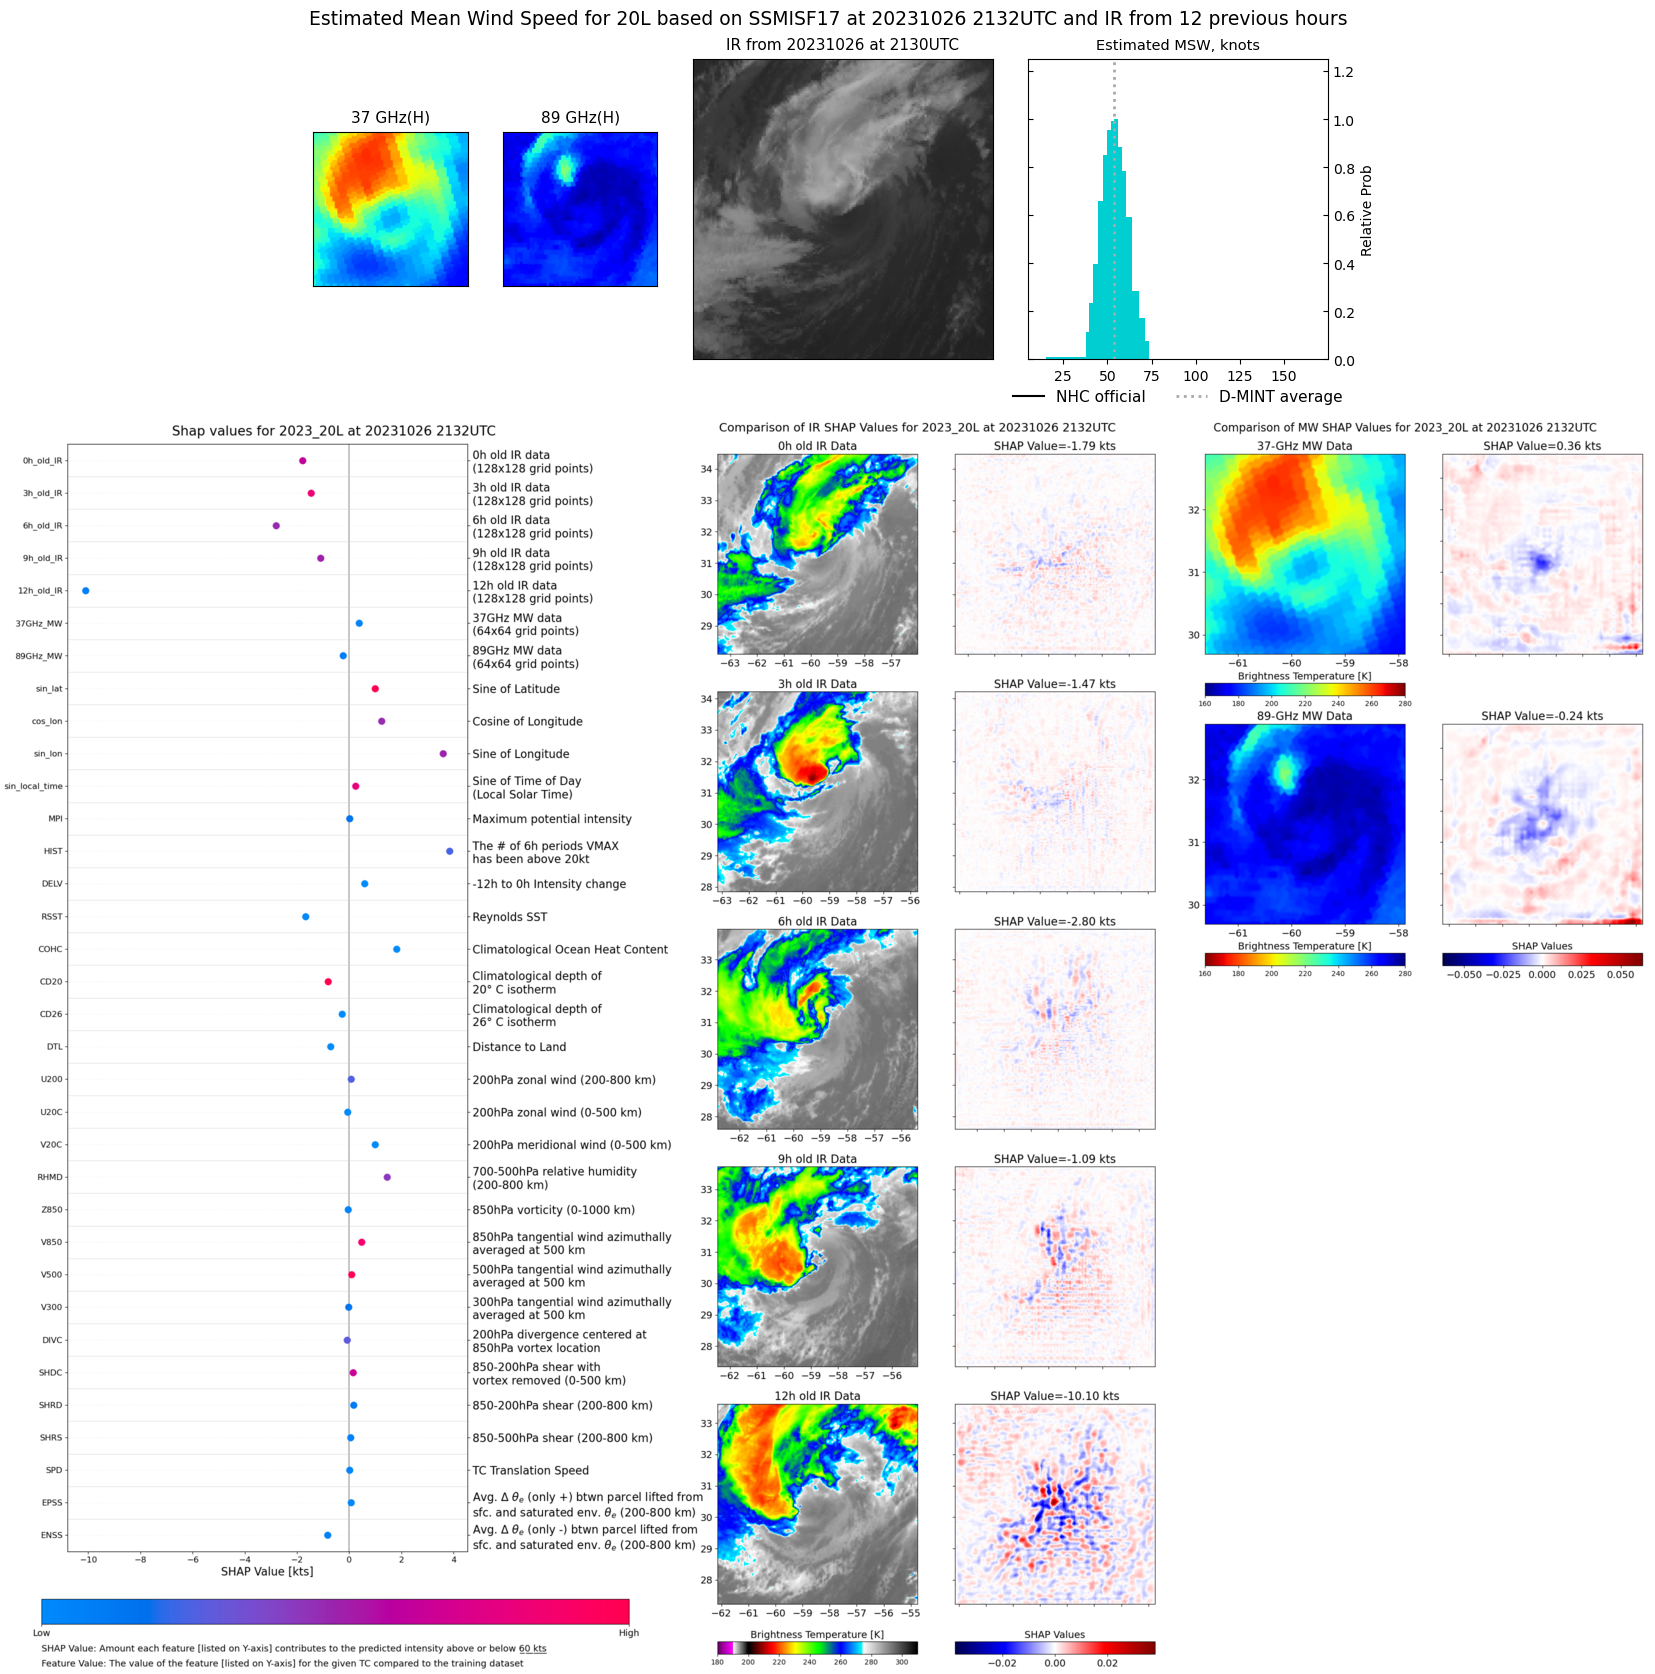 |
| 20231025 | 1027 UTC | SSMISF17 | 962 hPa | 94 kts | 88 kts | 101 kts | 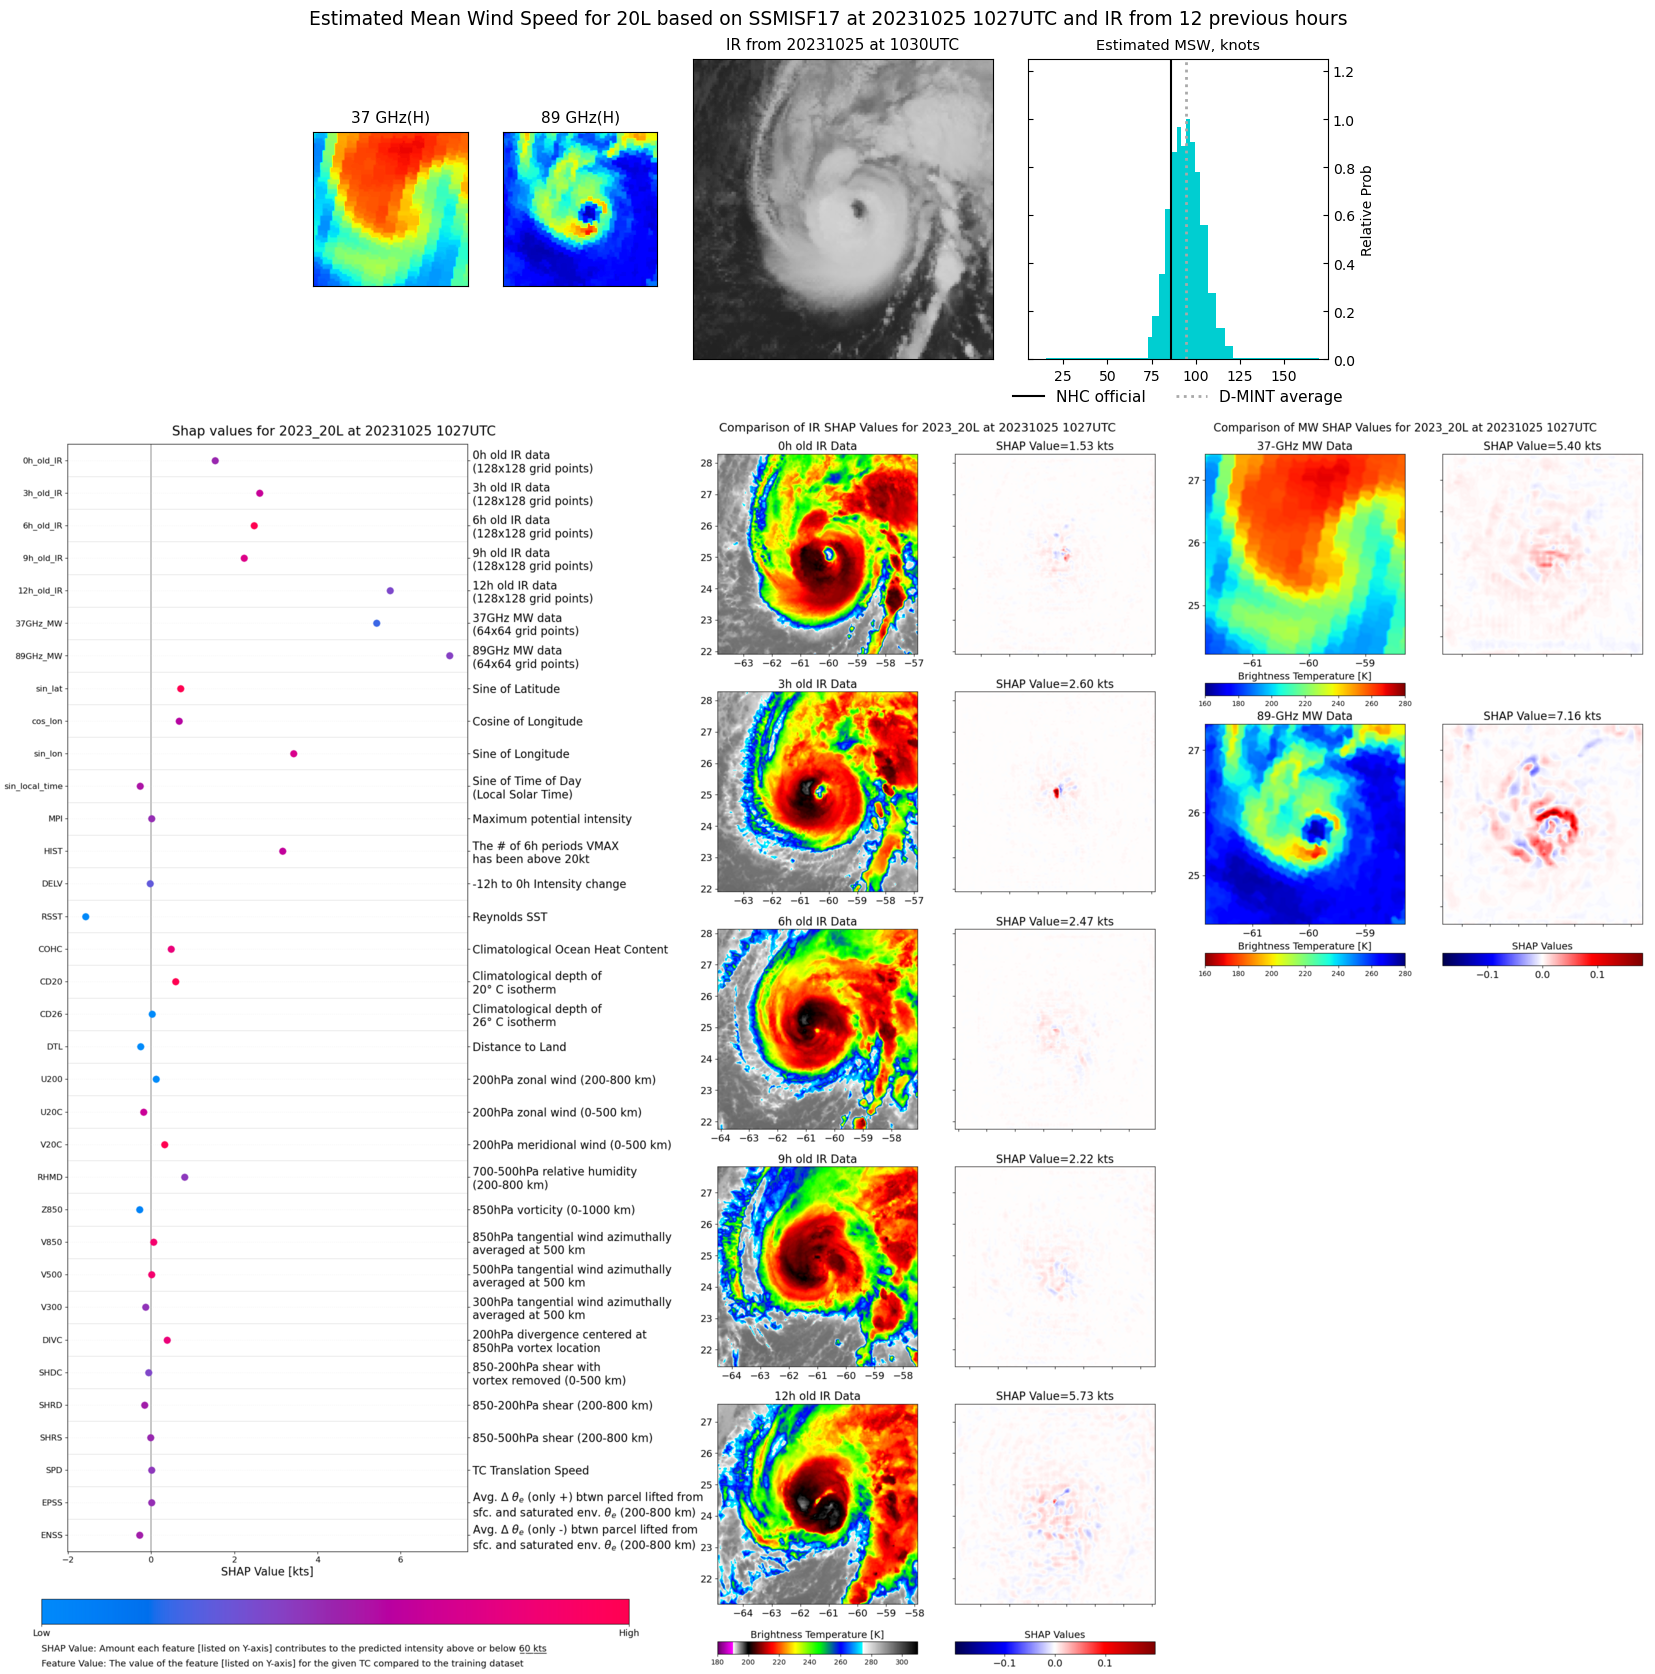 |
| 20231024 | 2157 UTC | SSMISF17 | 980 hPa | 77 kts | 70 kts | 84 kts | 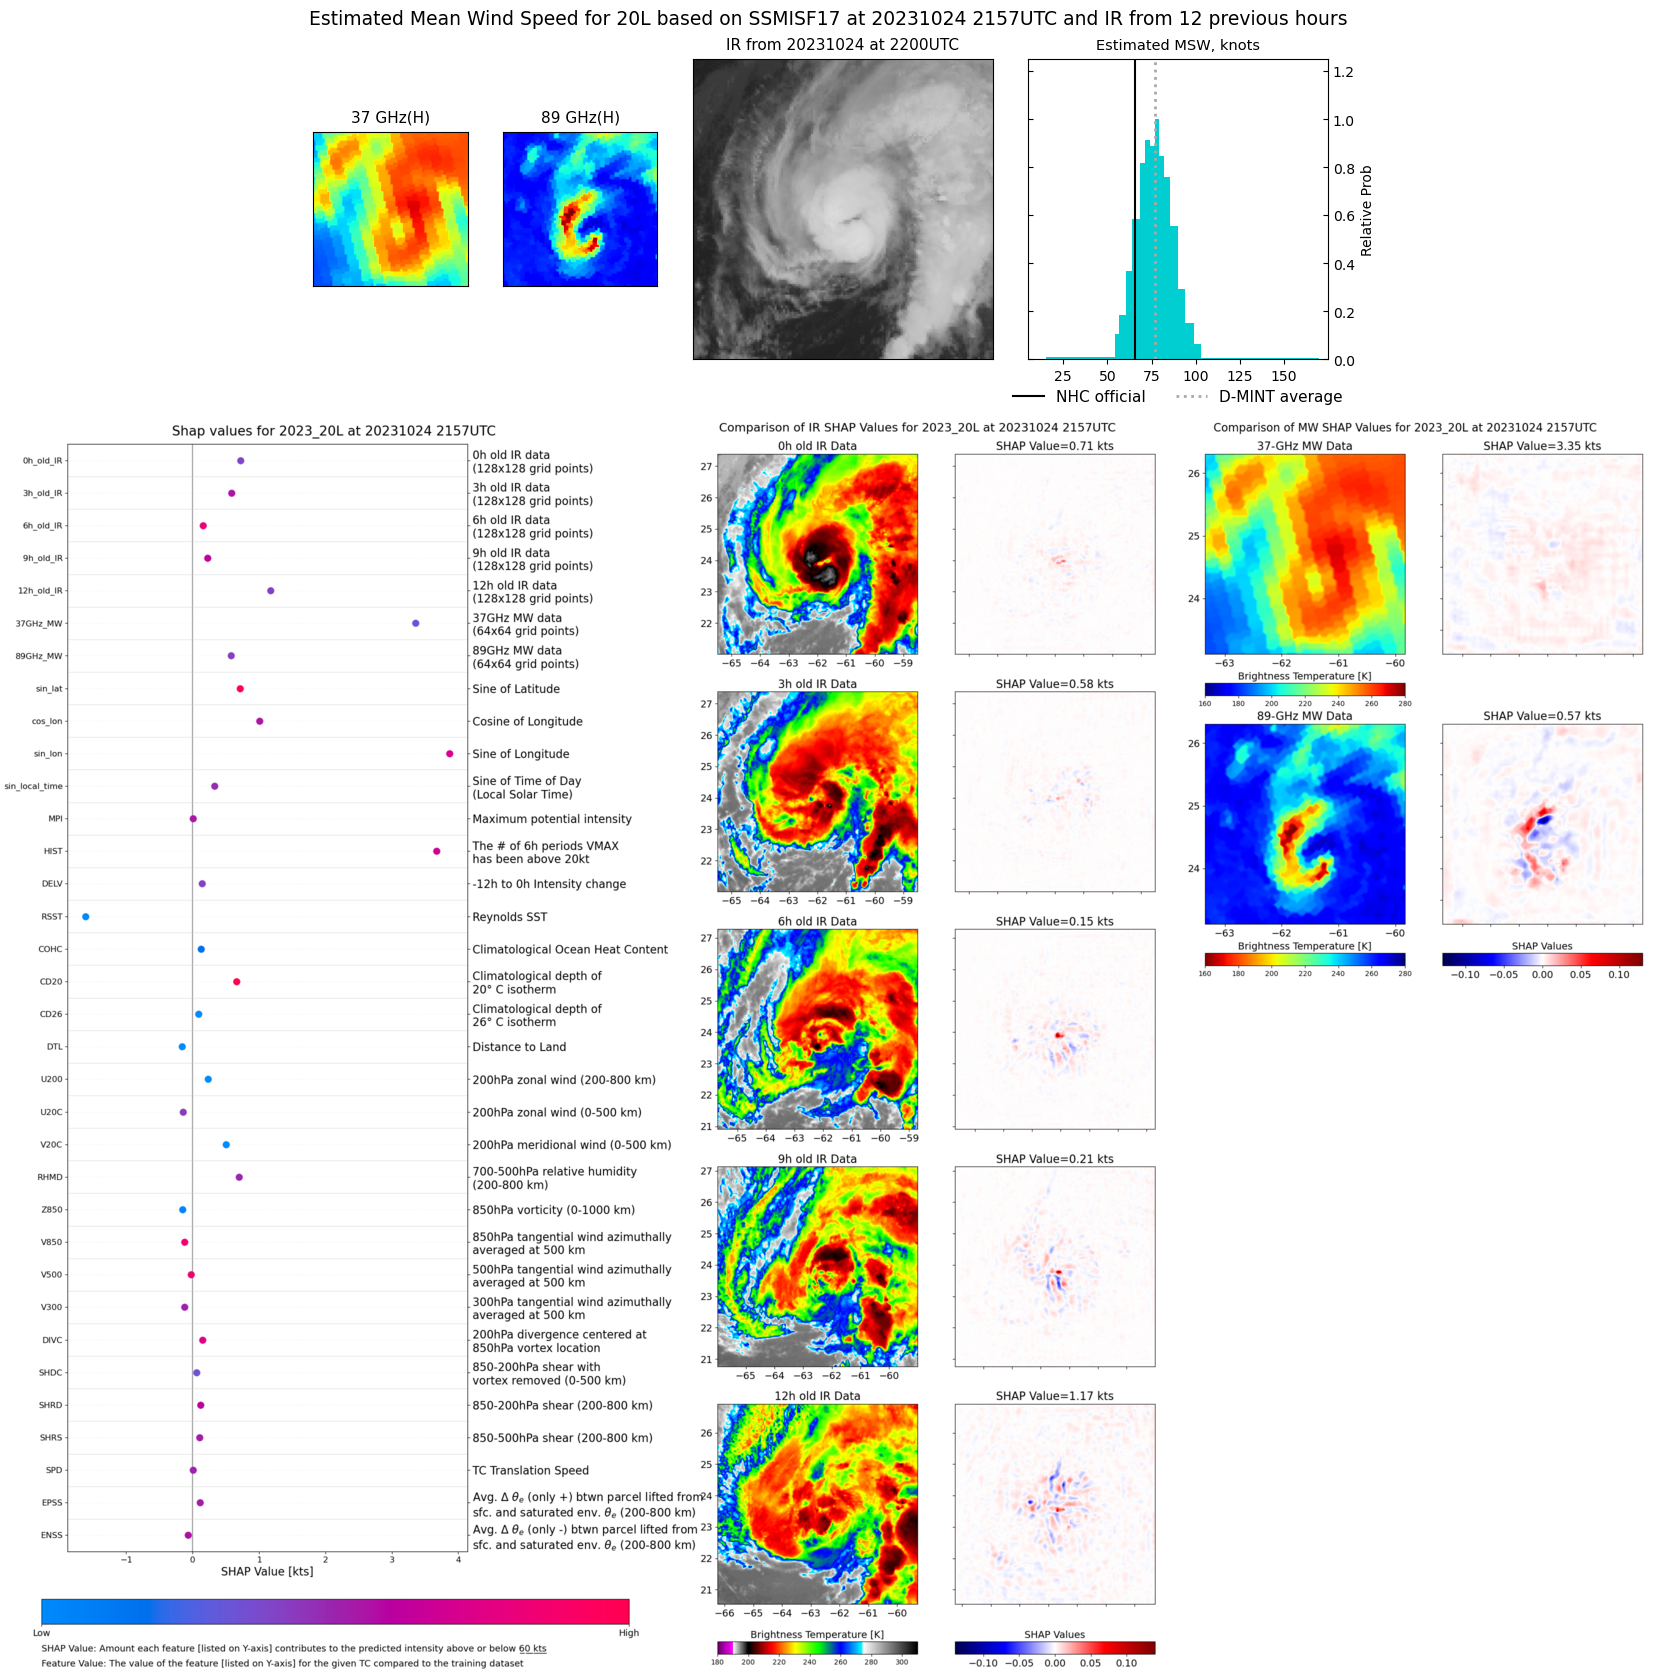 |
| 20231024 | 1658 UTC | AMSR2 | 984 hPa | 62 kts | 57 kts | 68 kts | 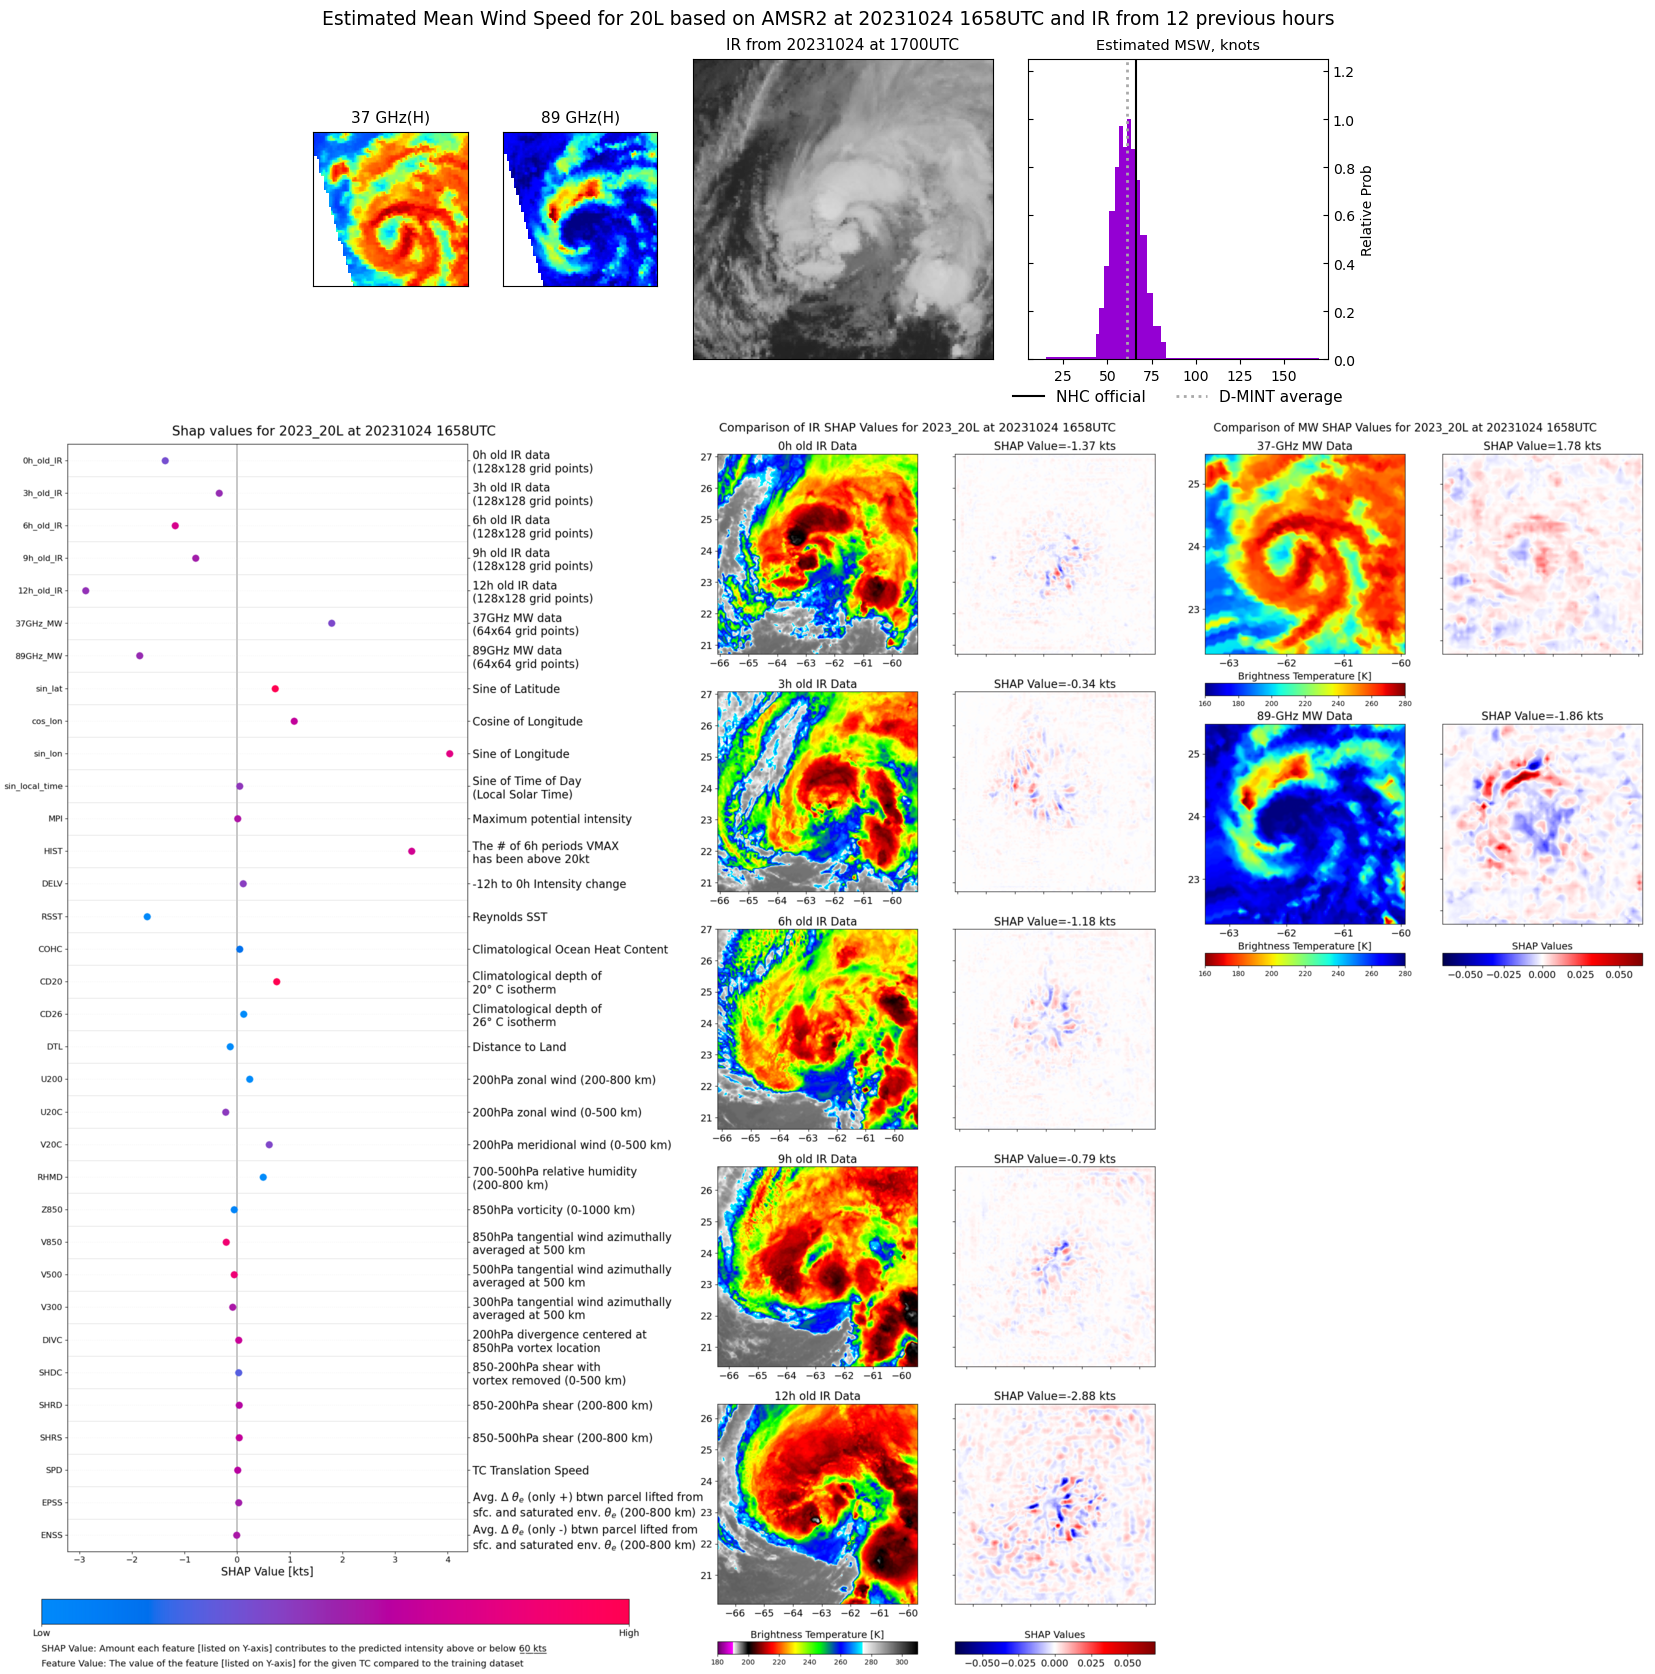 |
| 20231024 | 1041 UTC | SSMISF17 | 985 hPa | 71 kts | 65 kts | 77 kts | 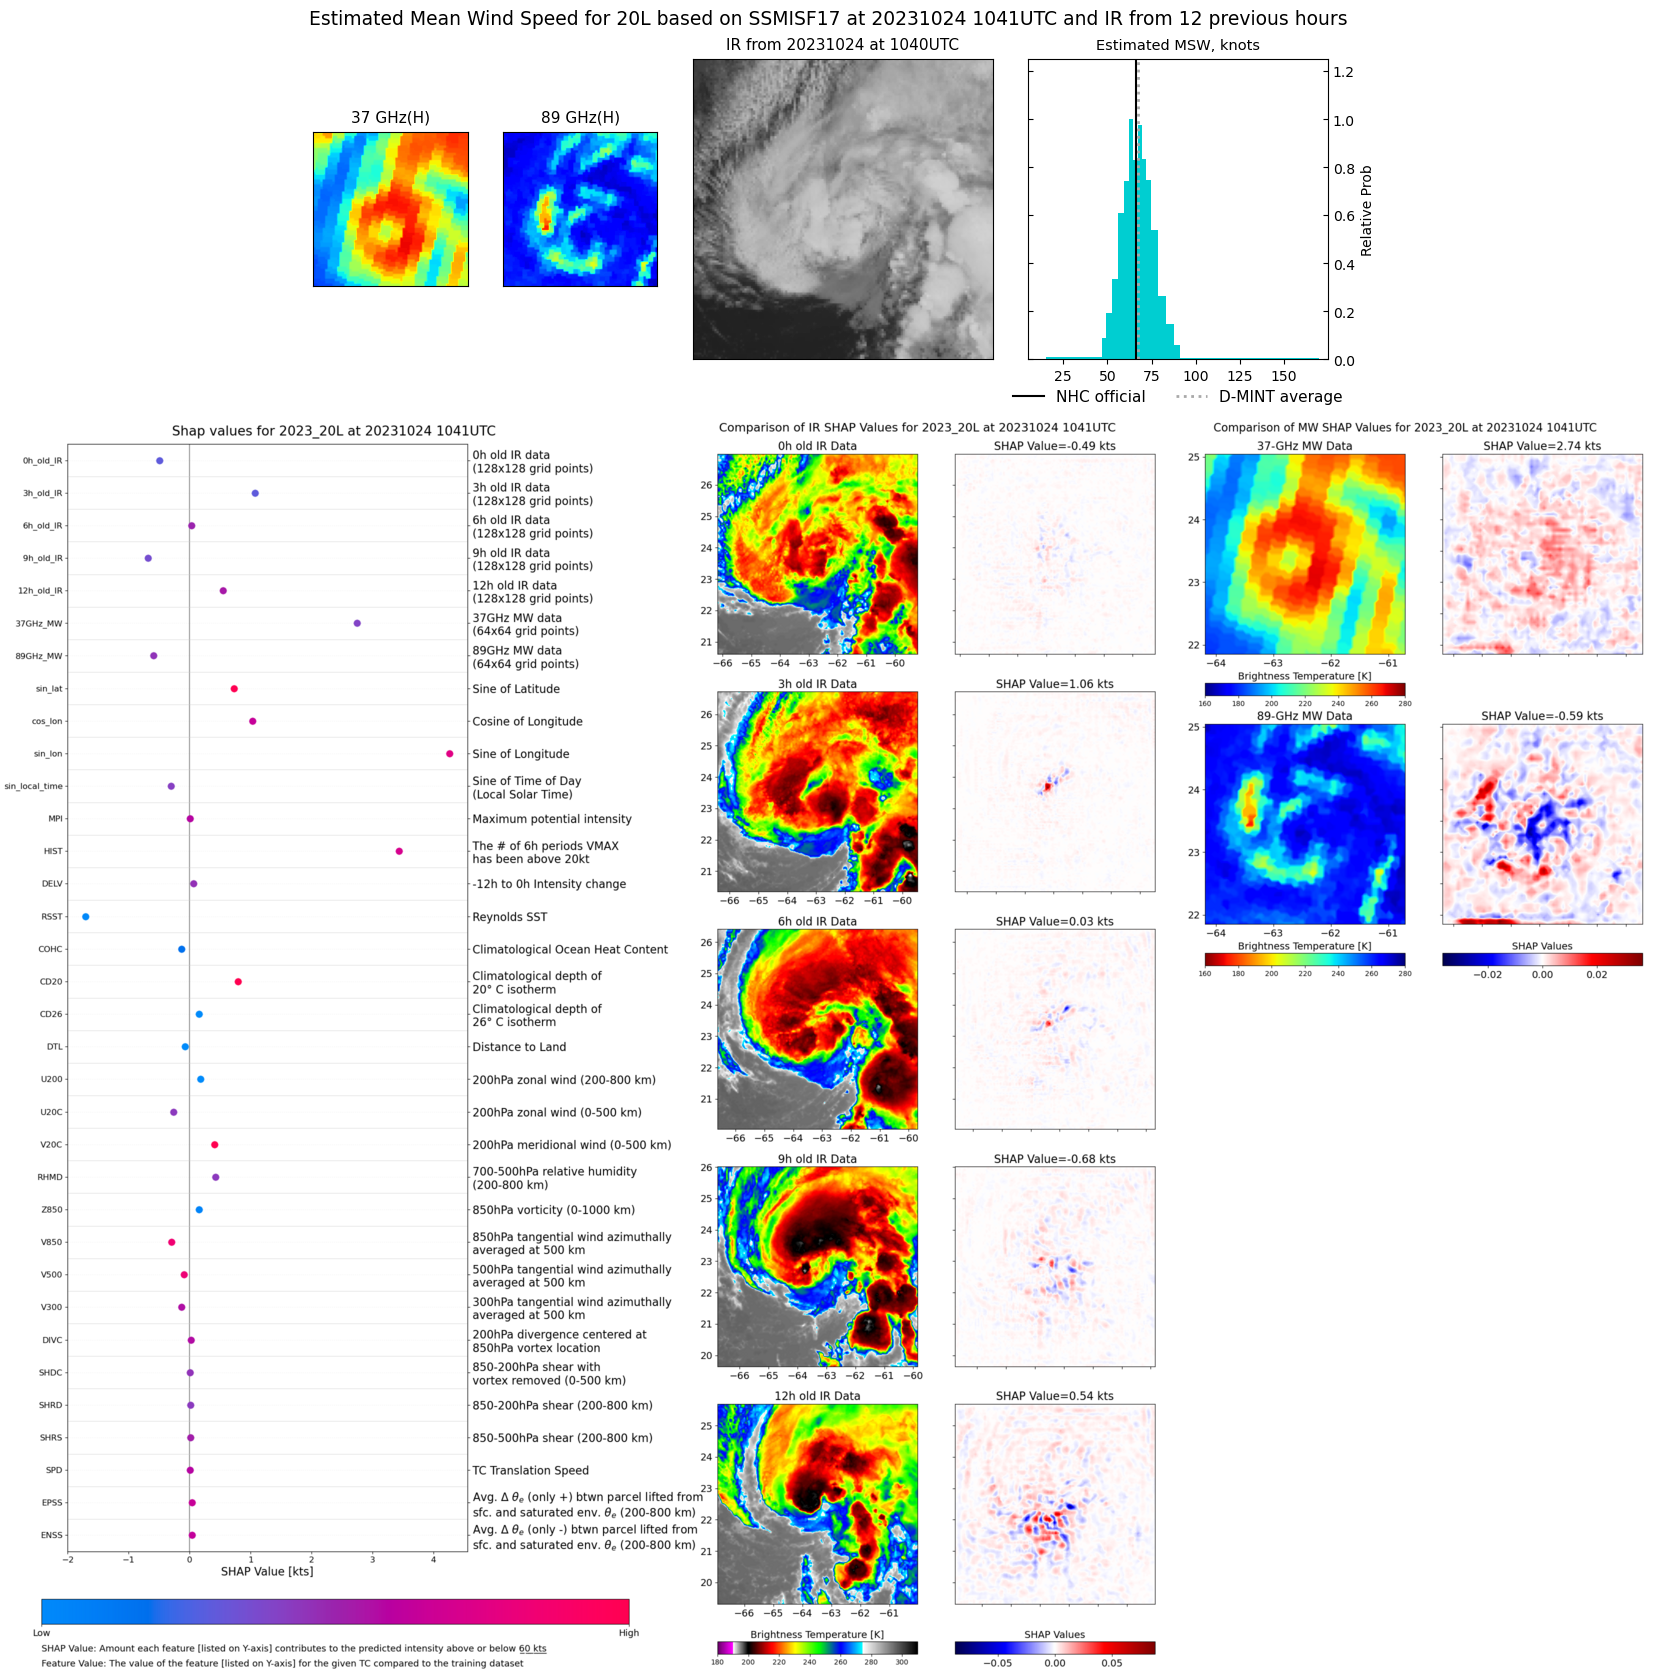 |
| 20231024 | 0601 UTC | AMSR2 | 989 hPa | 61 kts | 56 kts | 67 kts | 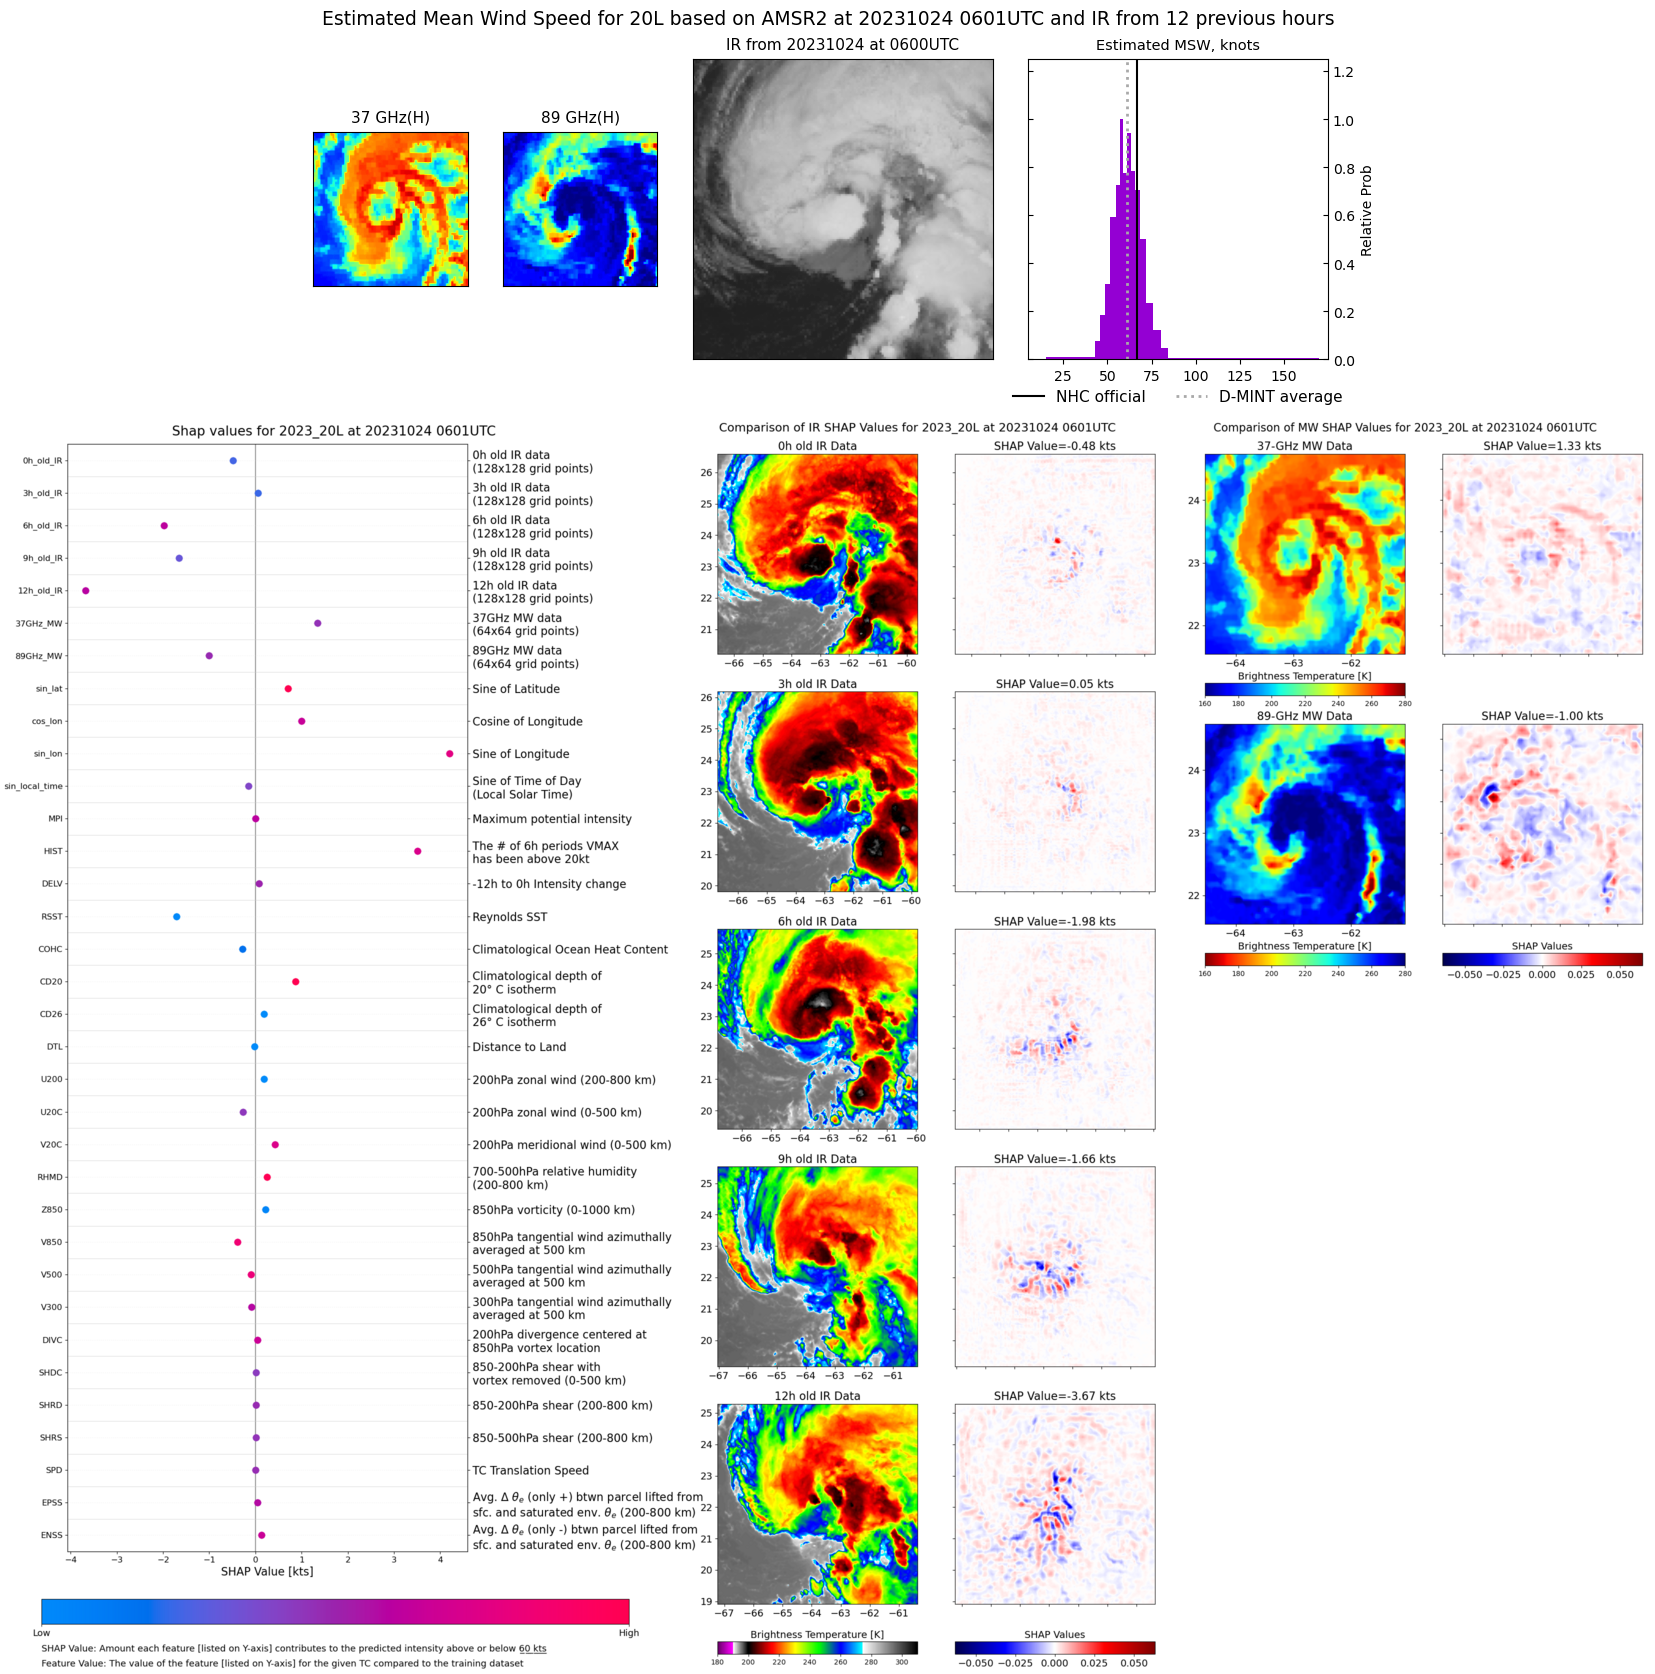 |
| 20231023 | 2327 UTC | GMI | 986 hPa | 66 kts | 60 kts | 72 kts | 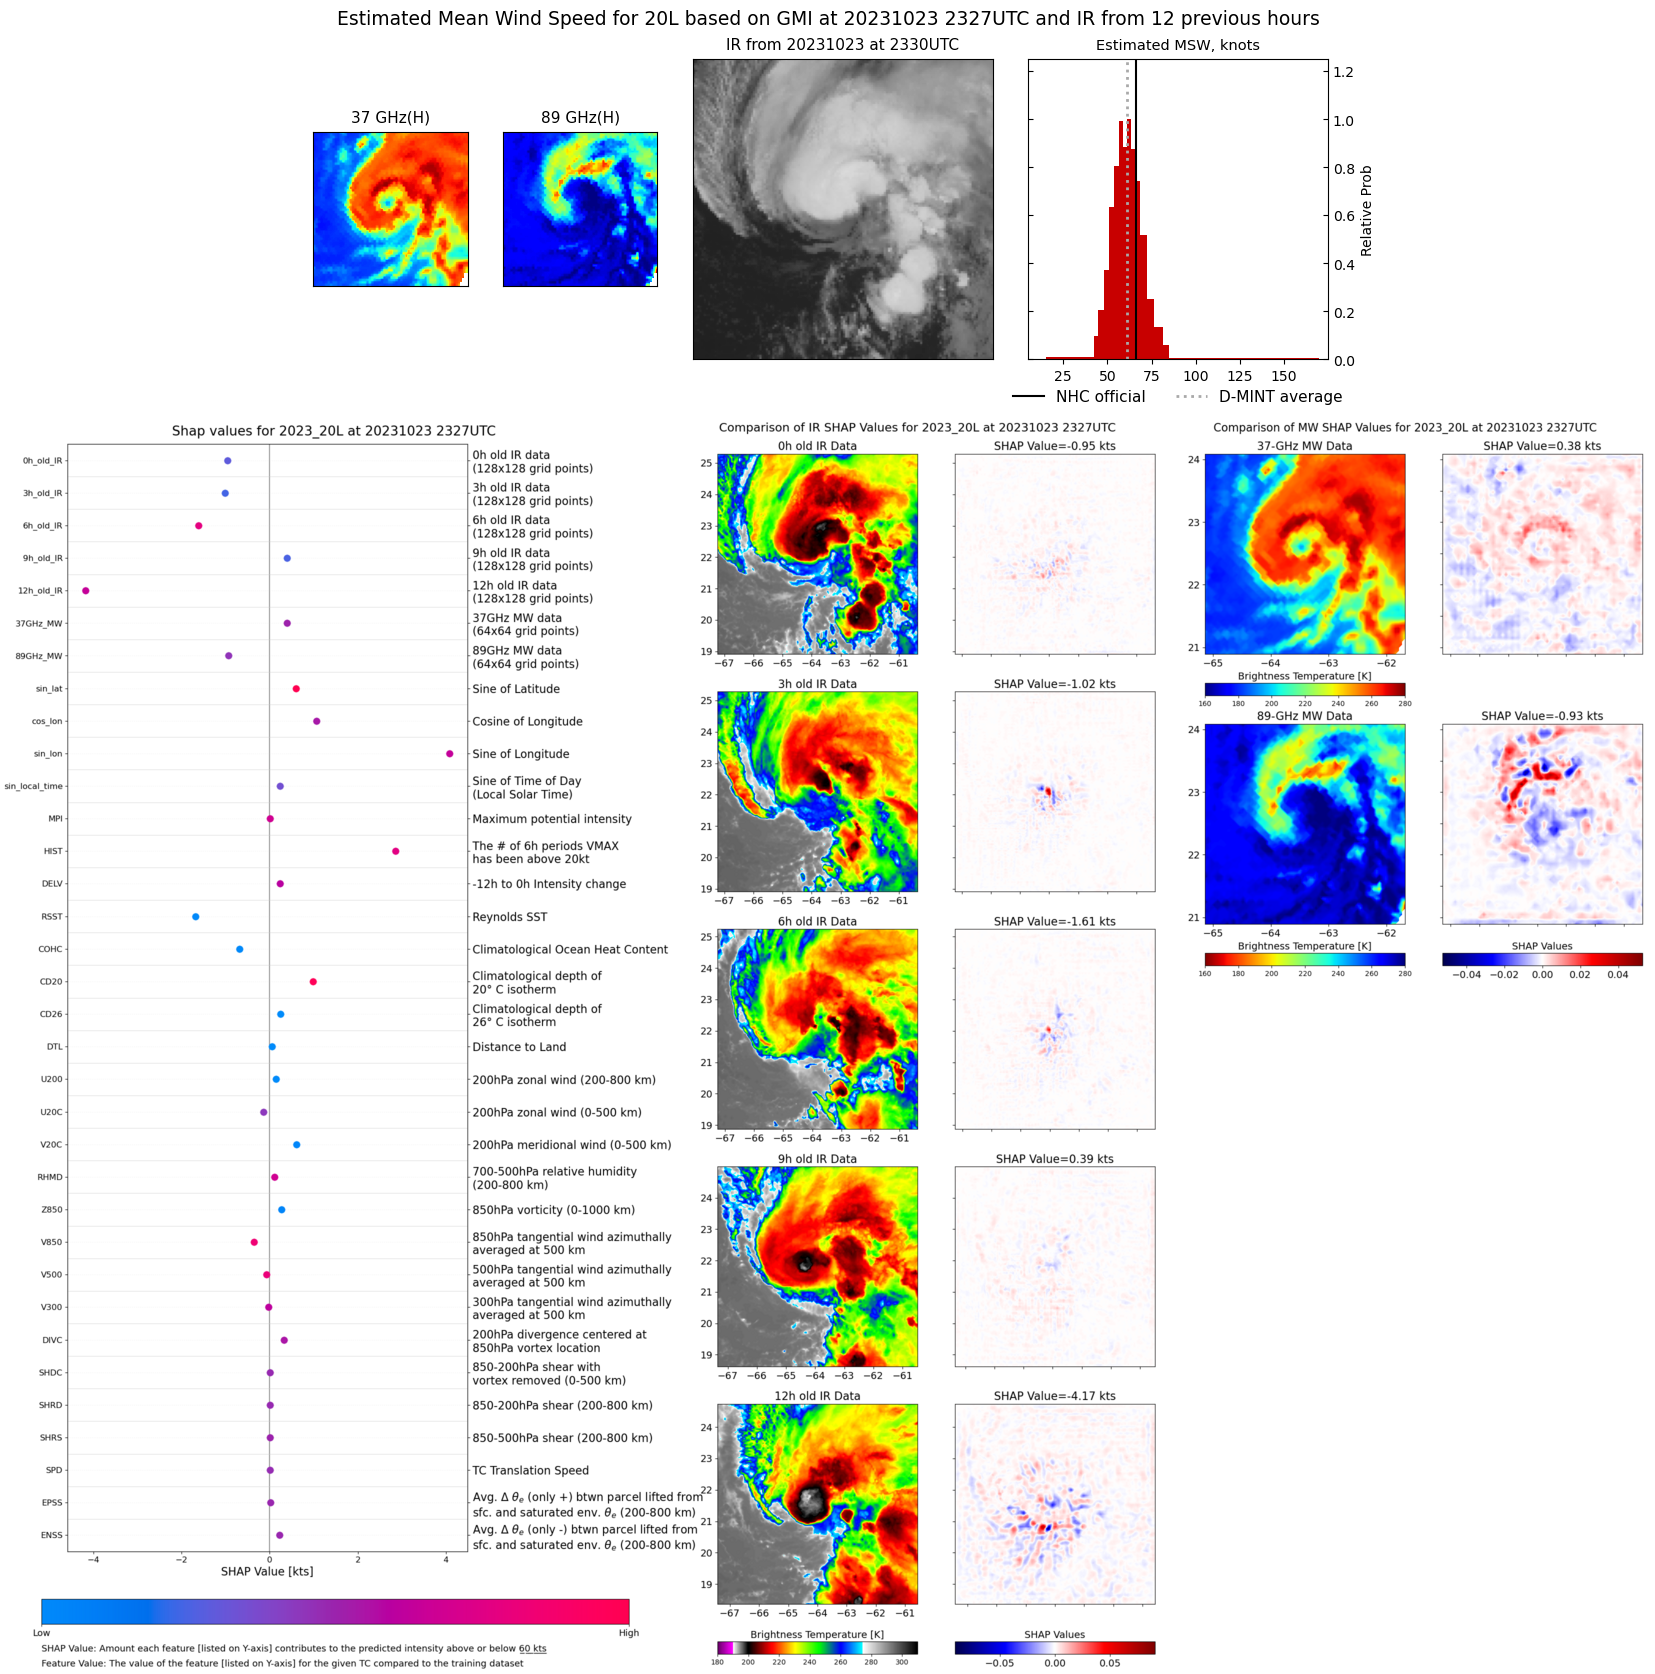 |
| 20231023 | 2210 UTC | SSMISF17 | 987 hPa | 63 kts | 57 kts | 69 kts | 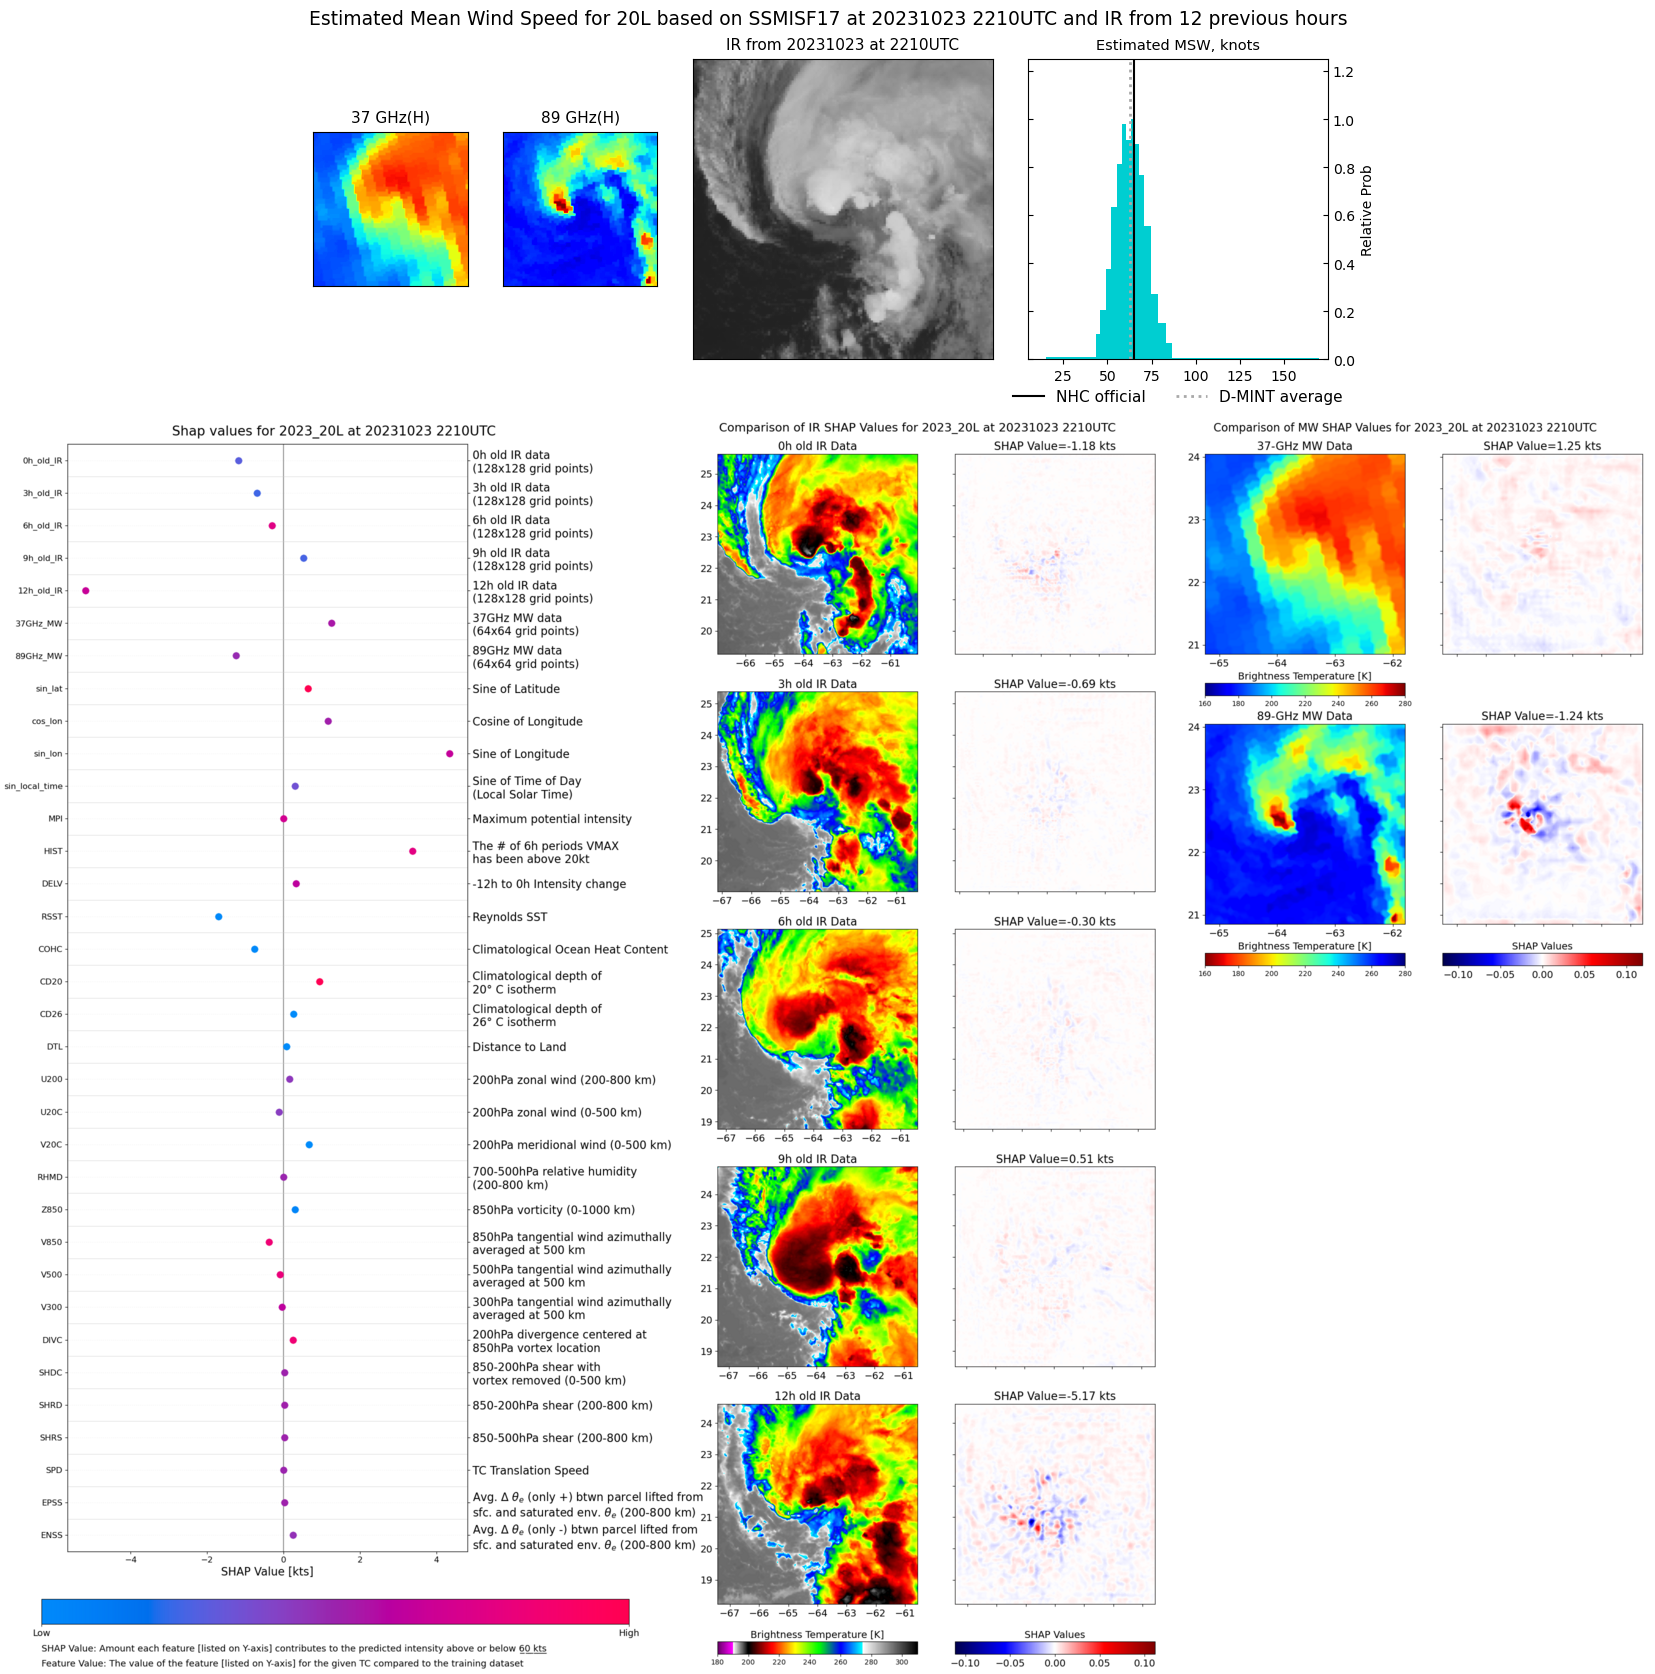 |
| 20231023 | 1752 UTC | AMSR2 | 989 hPa | 56 kts | 51 kts | 62 kts | 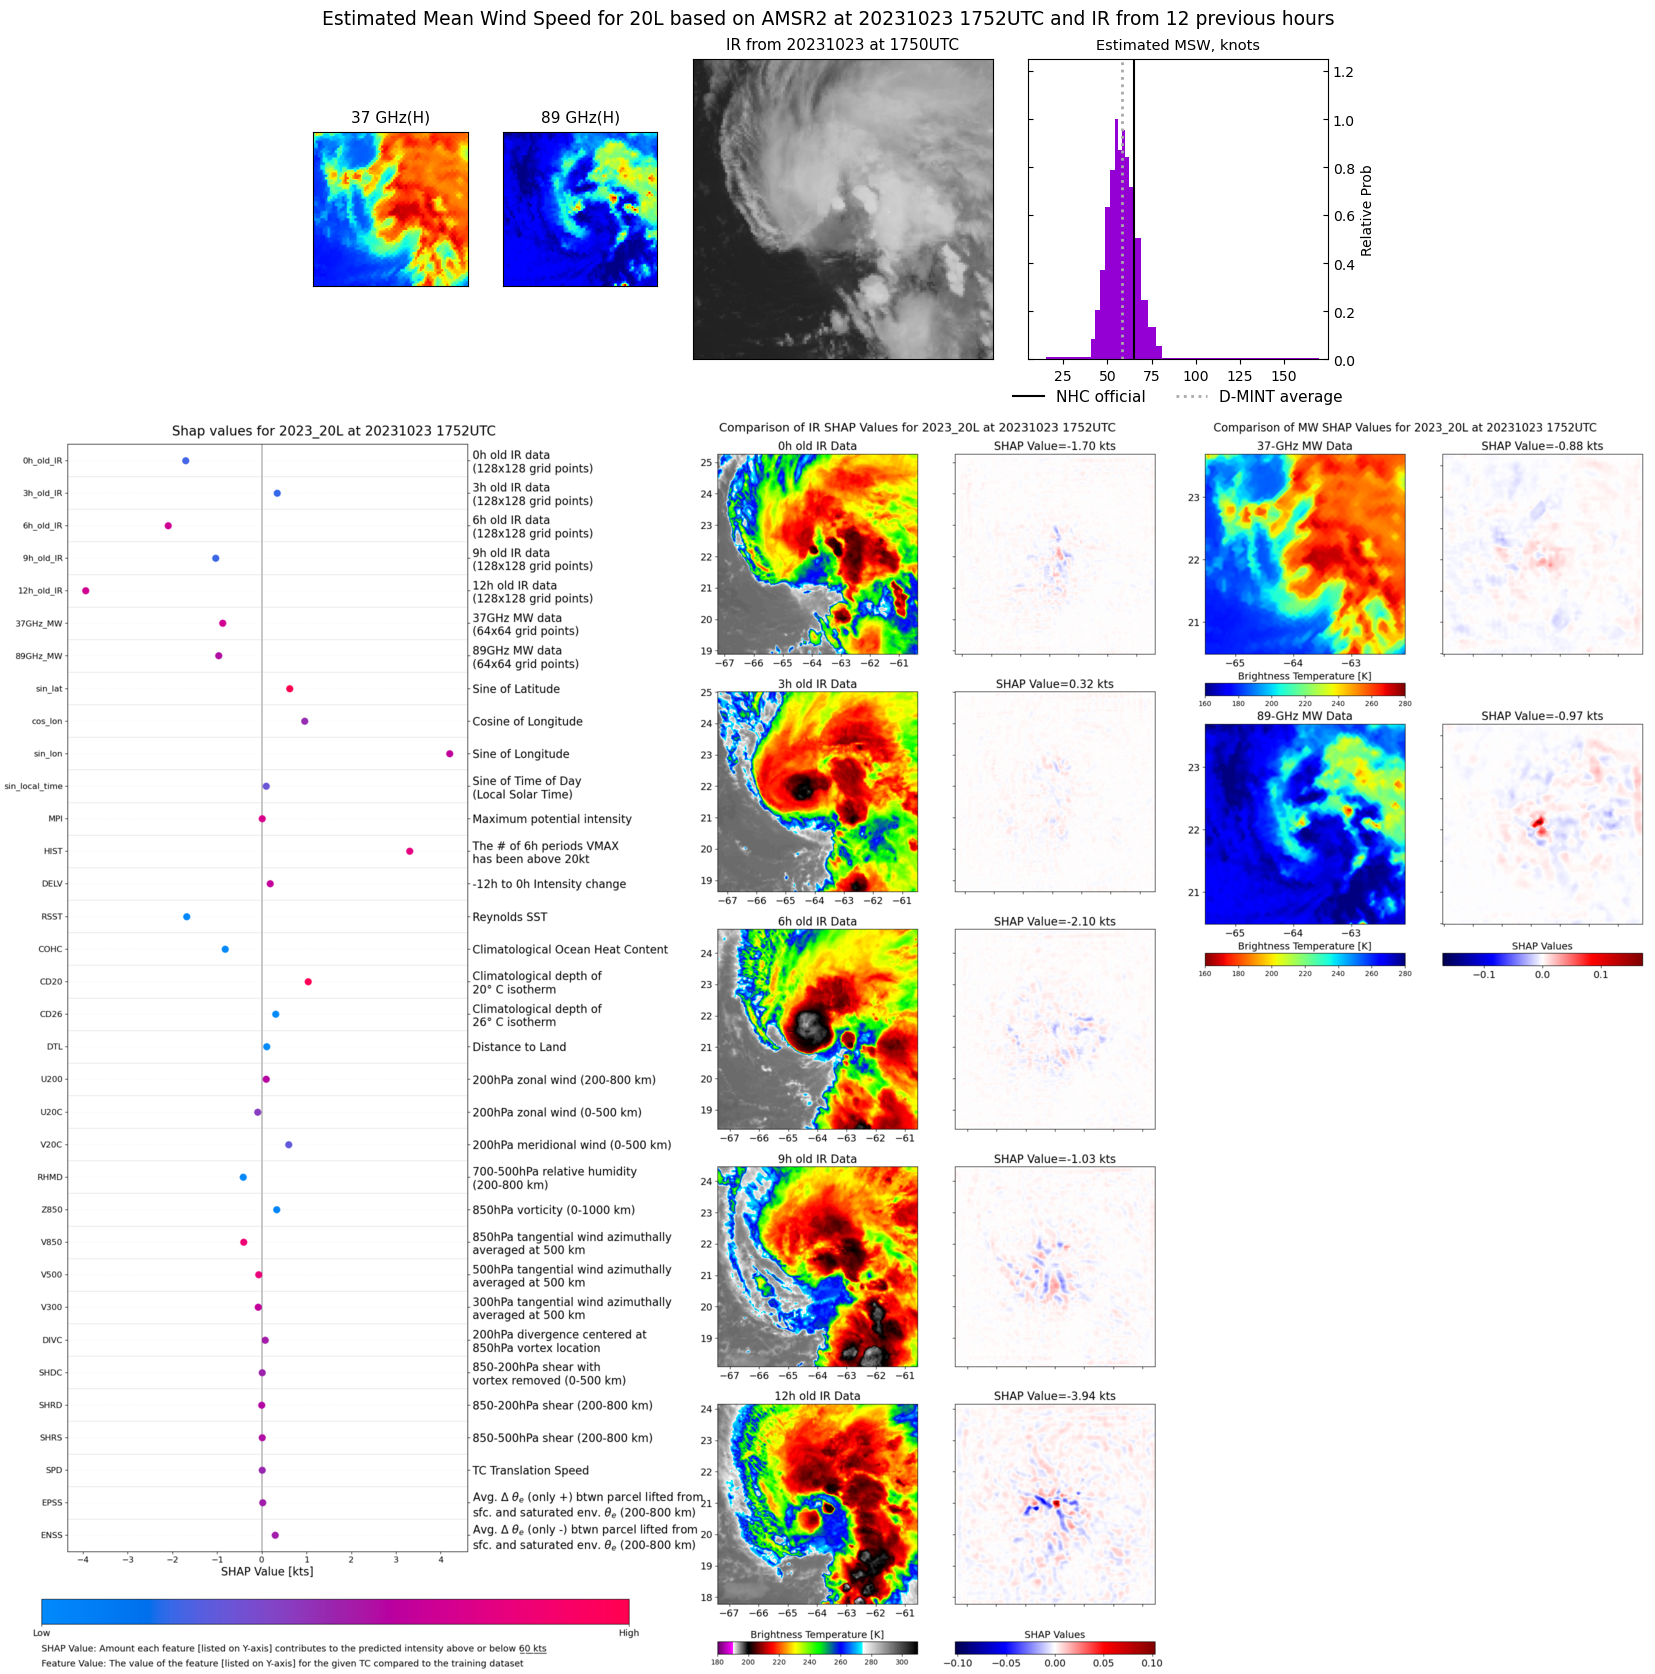 |
| 20231023 | 1055 UTC | SSMISF17 | 995 hPa | 58 kts | 53 kts | 64 kts | 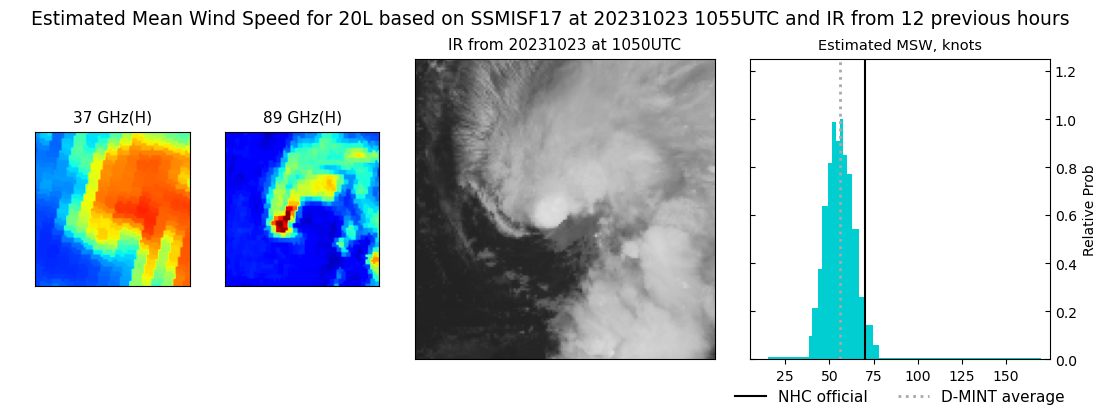 |
| 20231023 | 1007 UTC | GMI | 994 hPa | 57 kts | 51 kts | 63 kts |  |
| 20231022 | 2223 UTC | SSMISF17 | 993 hPa | 69 kts | 62 kts | 76 kts | 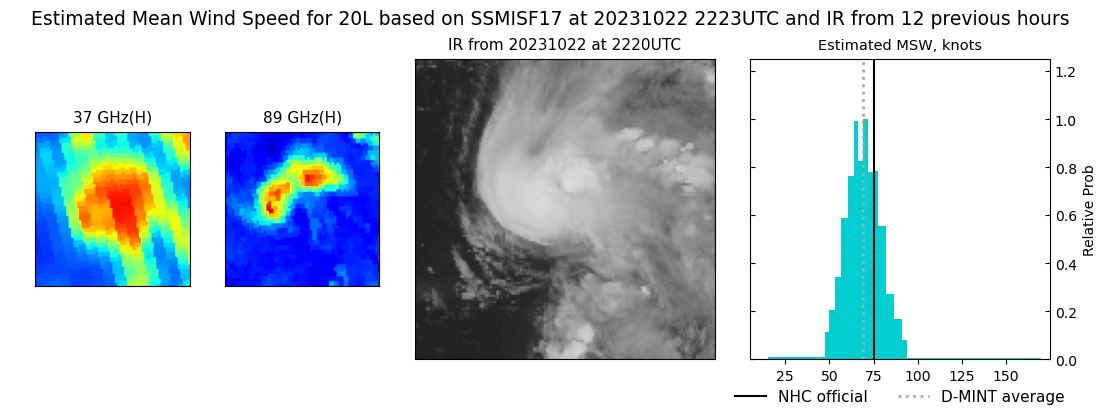 |
| 20231022 | 1709 UTC | AMSR2 | 994 hPa | 59 kts | 53 kts | 66 kts | 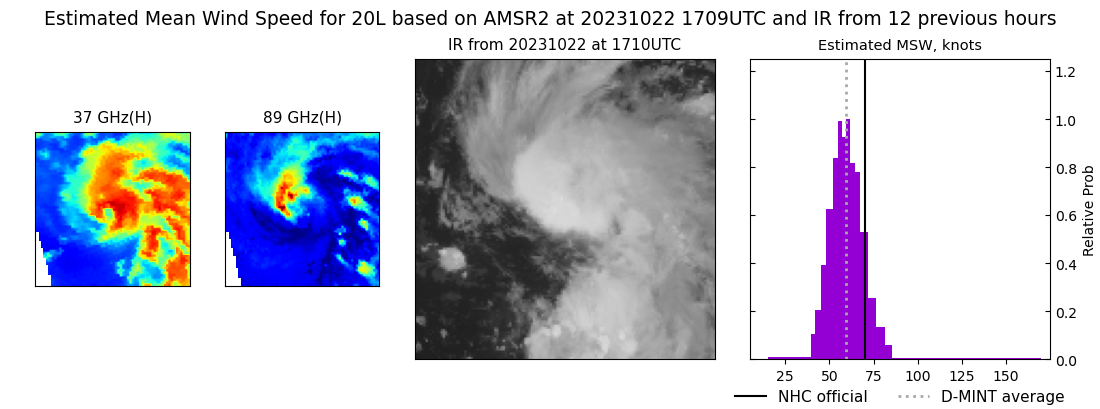 |
| 20231022 | 1111 UTC | SSMISF17 | 994 hPa | 57 kts | 51 kts | 64 kts | 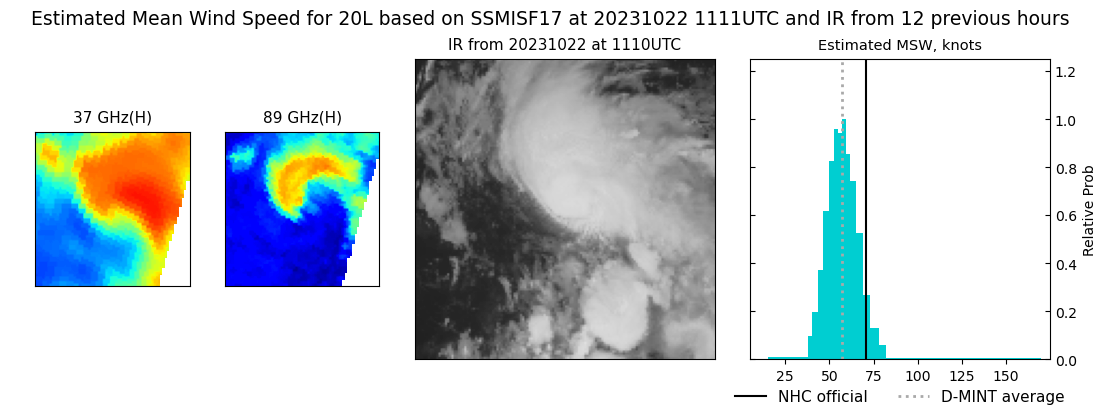 |
| 20231022 | 0802 UTC | SSMISF18 | 985 hPa | 64 kts | 57 kts | 72 kts | 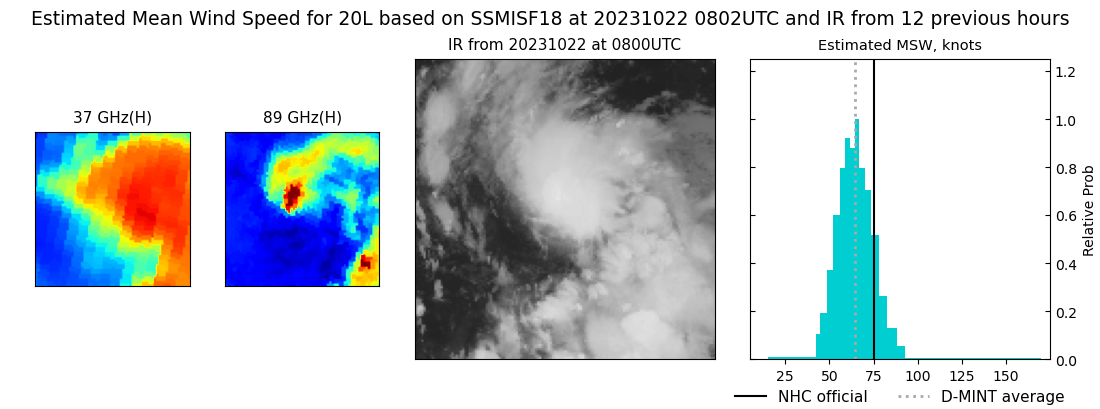 |
| 20231022 | 0615 UTC | AMSR2 | 996 hPa | 63 kts | 56 kts | 70 kts | 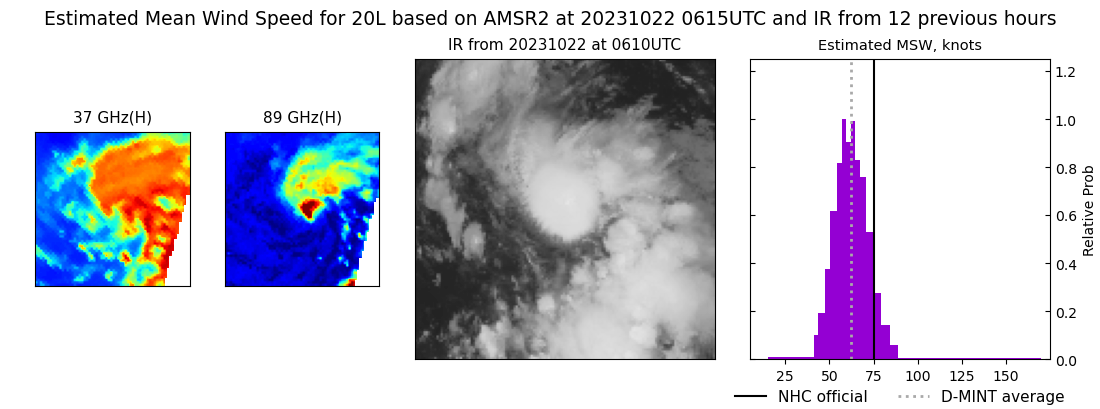 |
| 20231021 | 2340 UTC | GMI | 988 hPa | 63 kts | 57 kts | 69 kts | 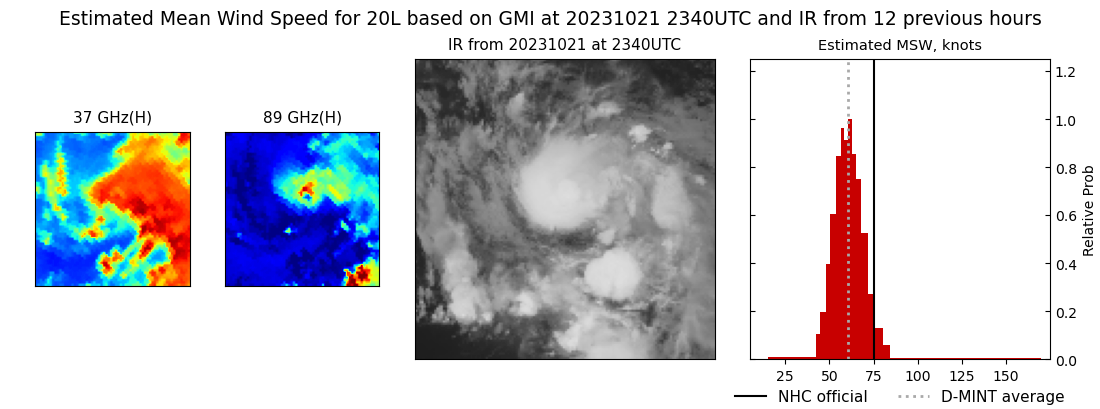 |
| 20231021 | 2337 UTC | GMI | 988 hPa | 63 kts | 57 kts | 69 kts |  |
| 20231021 | 1928 UTC | SSMISF18 | 995 hPa | 55 kts | 49 kts | 62 kts | 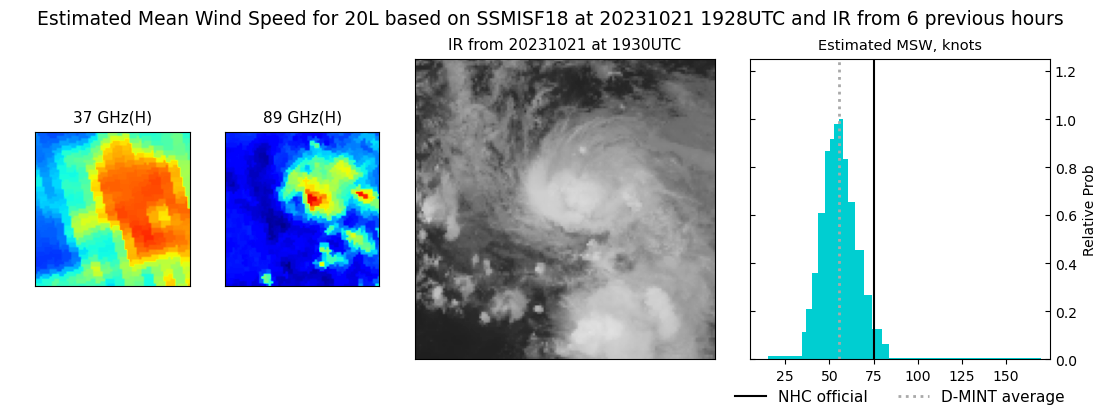 |
| 20231021 | 1022 UTC | GMI | 991 hPa | 62 kts | 56 kts | 69 kts | 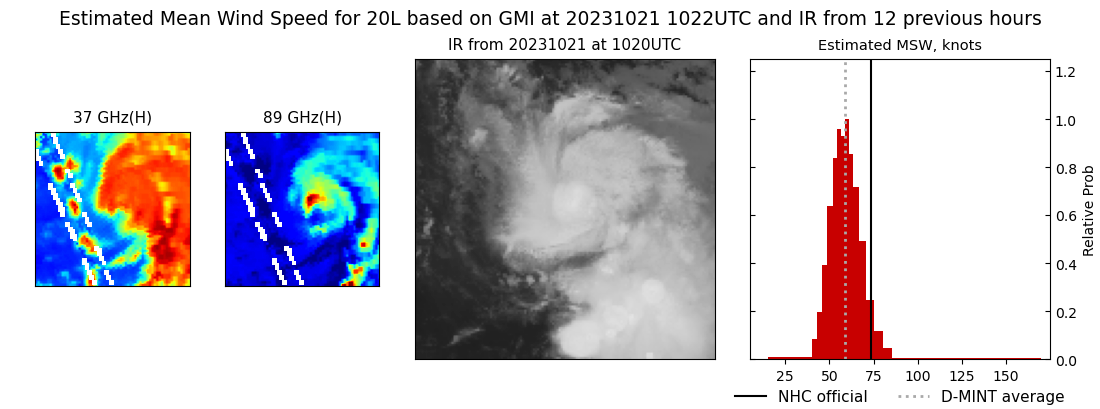 |
| 20231020 | 1941 UTC | SSMISF18 | 995 hPa | 56 kts | 50 kts | 63 kts | 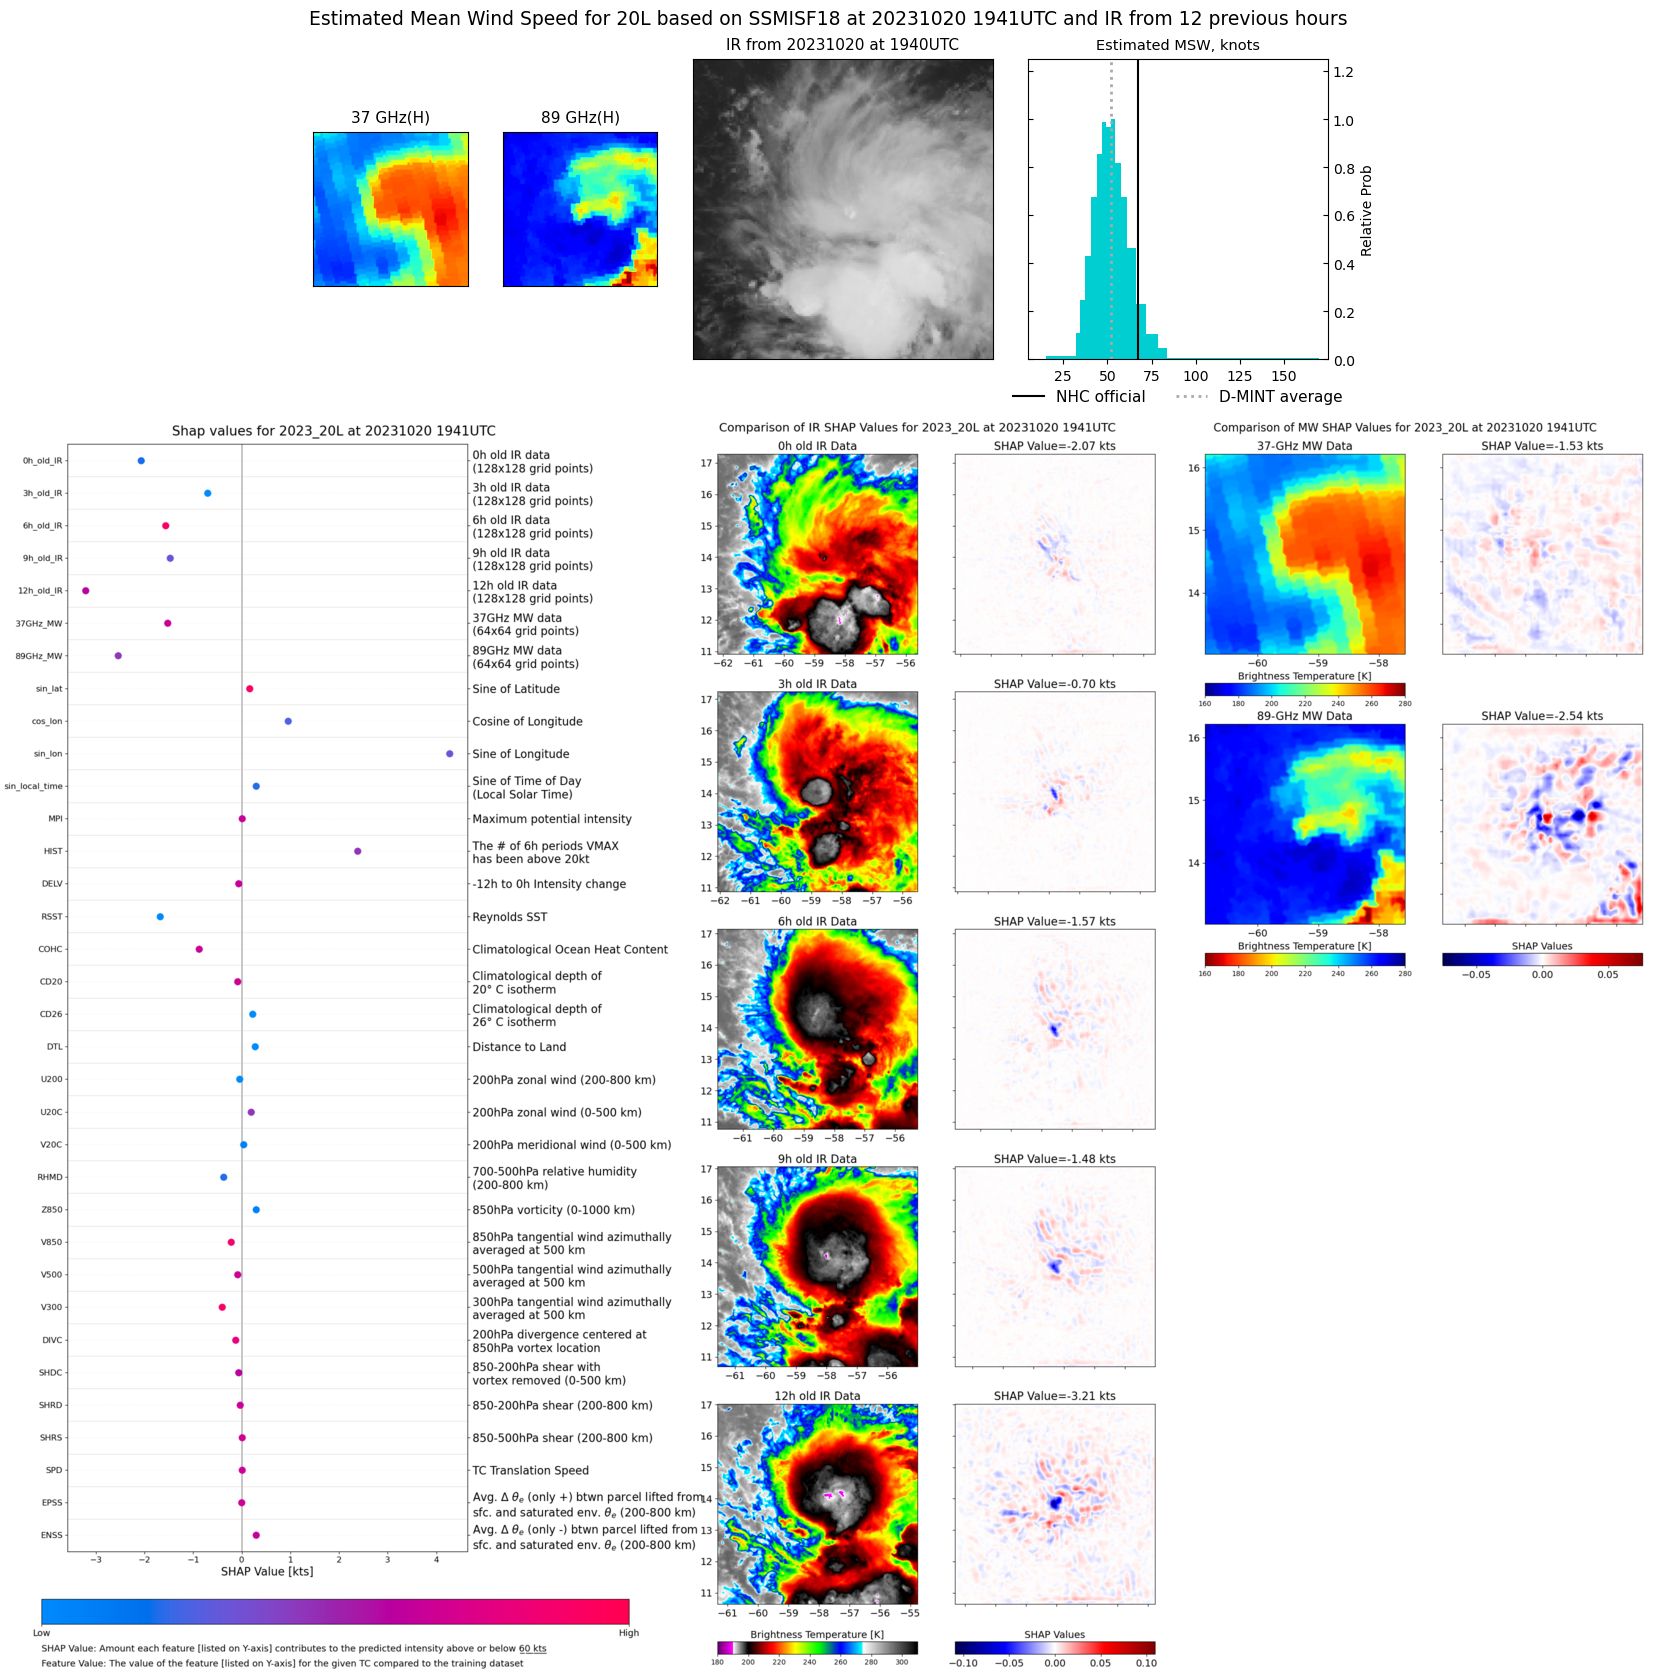 |
| 20231020 | 1719 UTC | AMSR2 | 997 hPa | 57 kts | 52 kts | 63 kts | 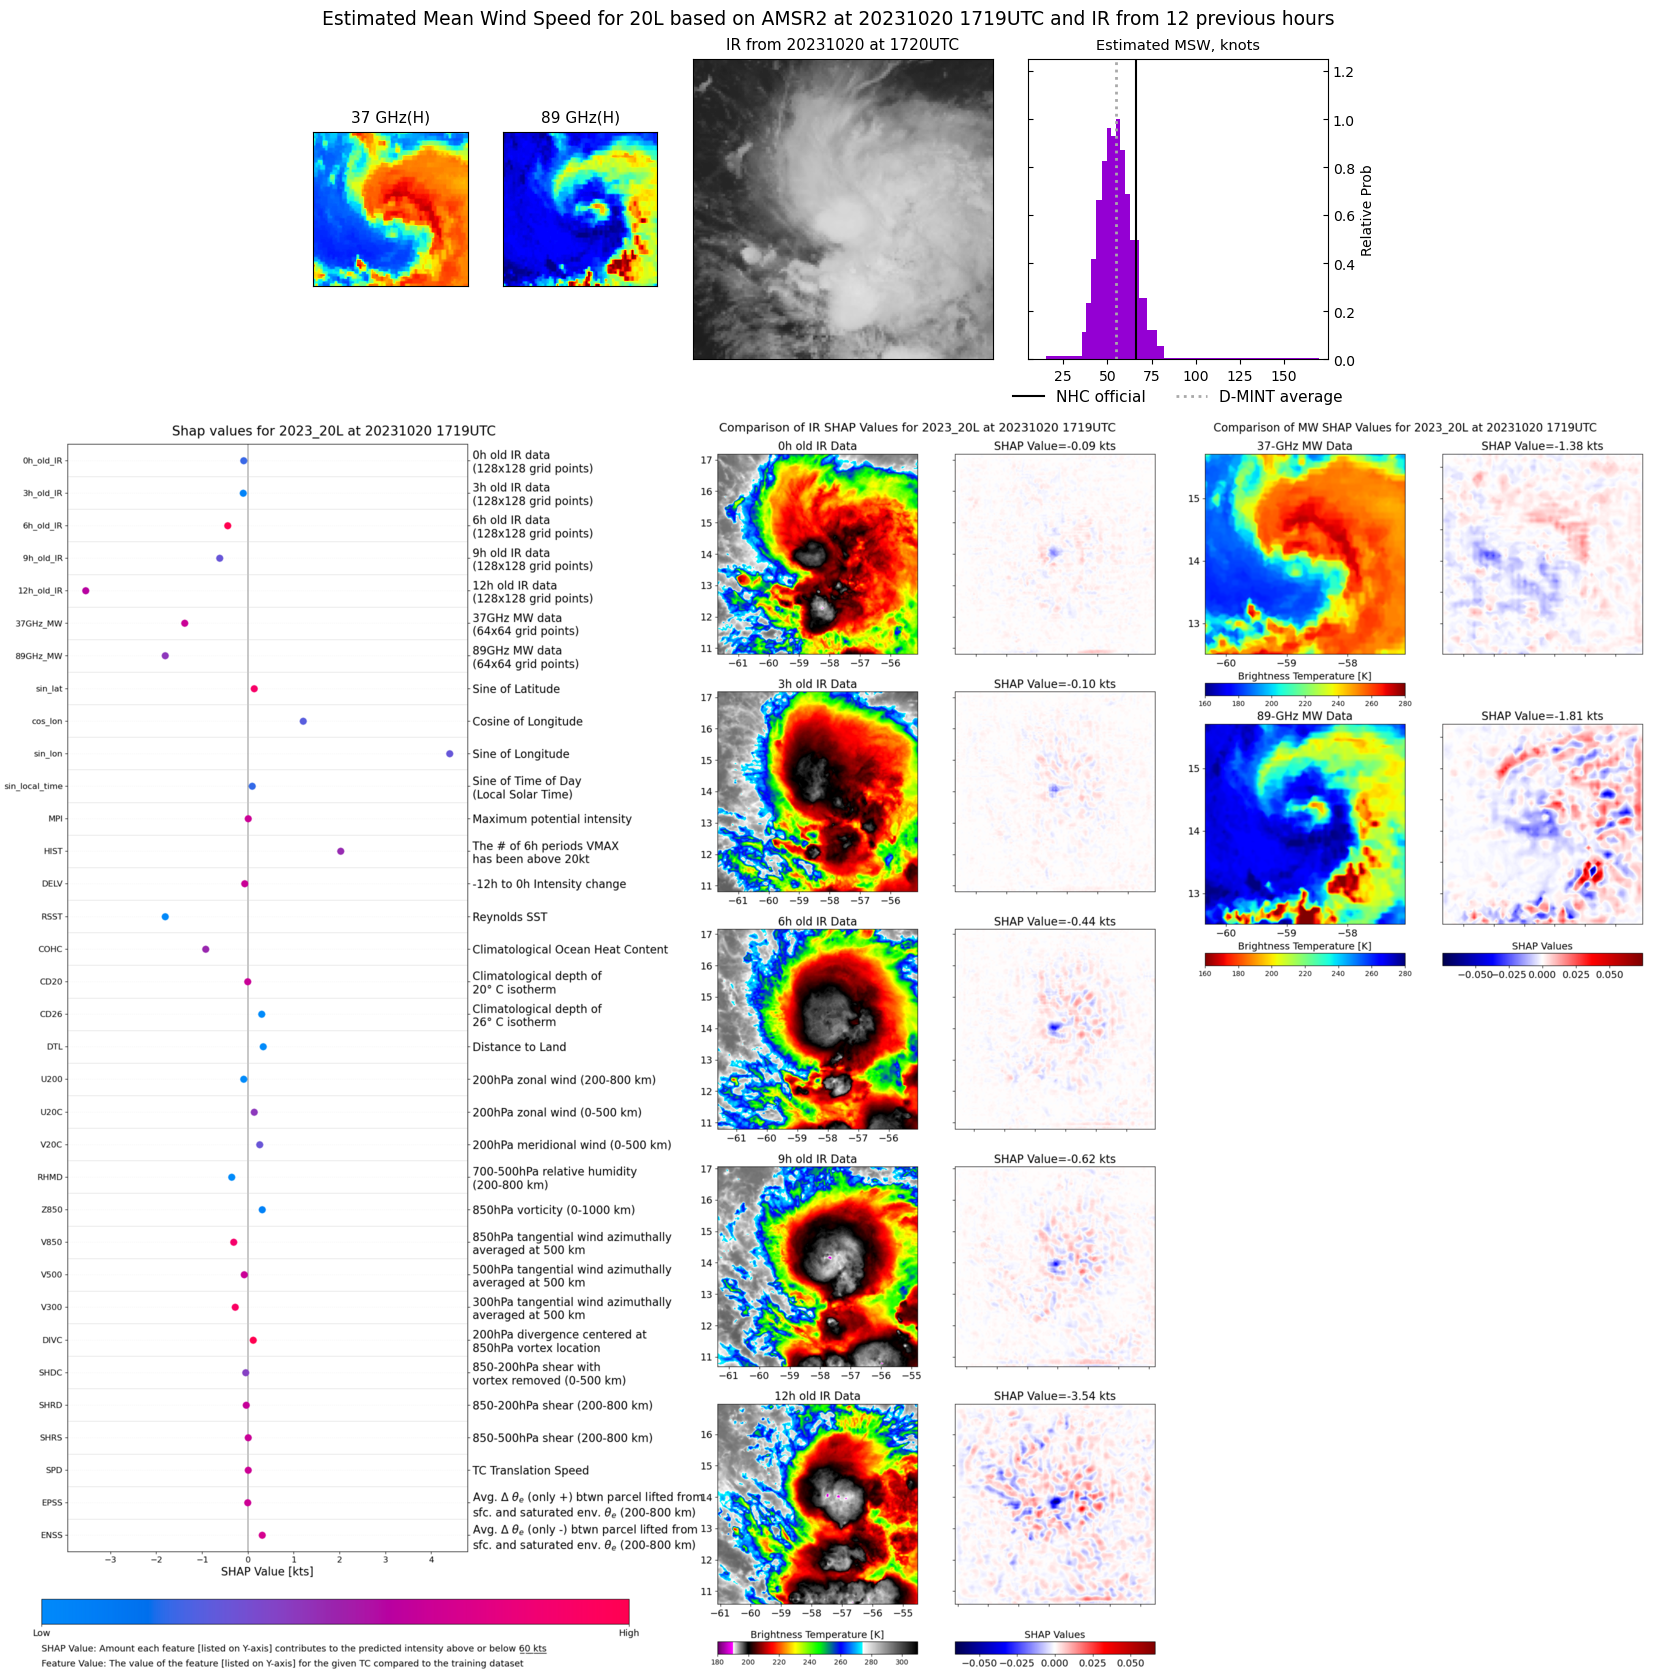 |
| 20231020 | 0958 UTC | SSMISF17 | 1002 hPa | 46 kts | 41 kts | 52 kts |  |
| 20231019 | 2346 UTC | GMI | 999 hPa | 50 kts | 45 kts | 55 kts | 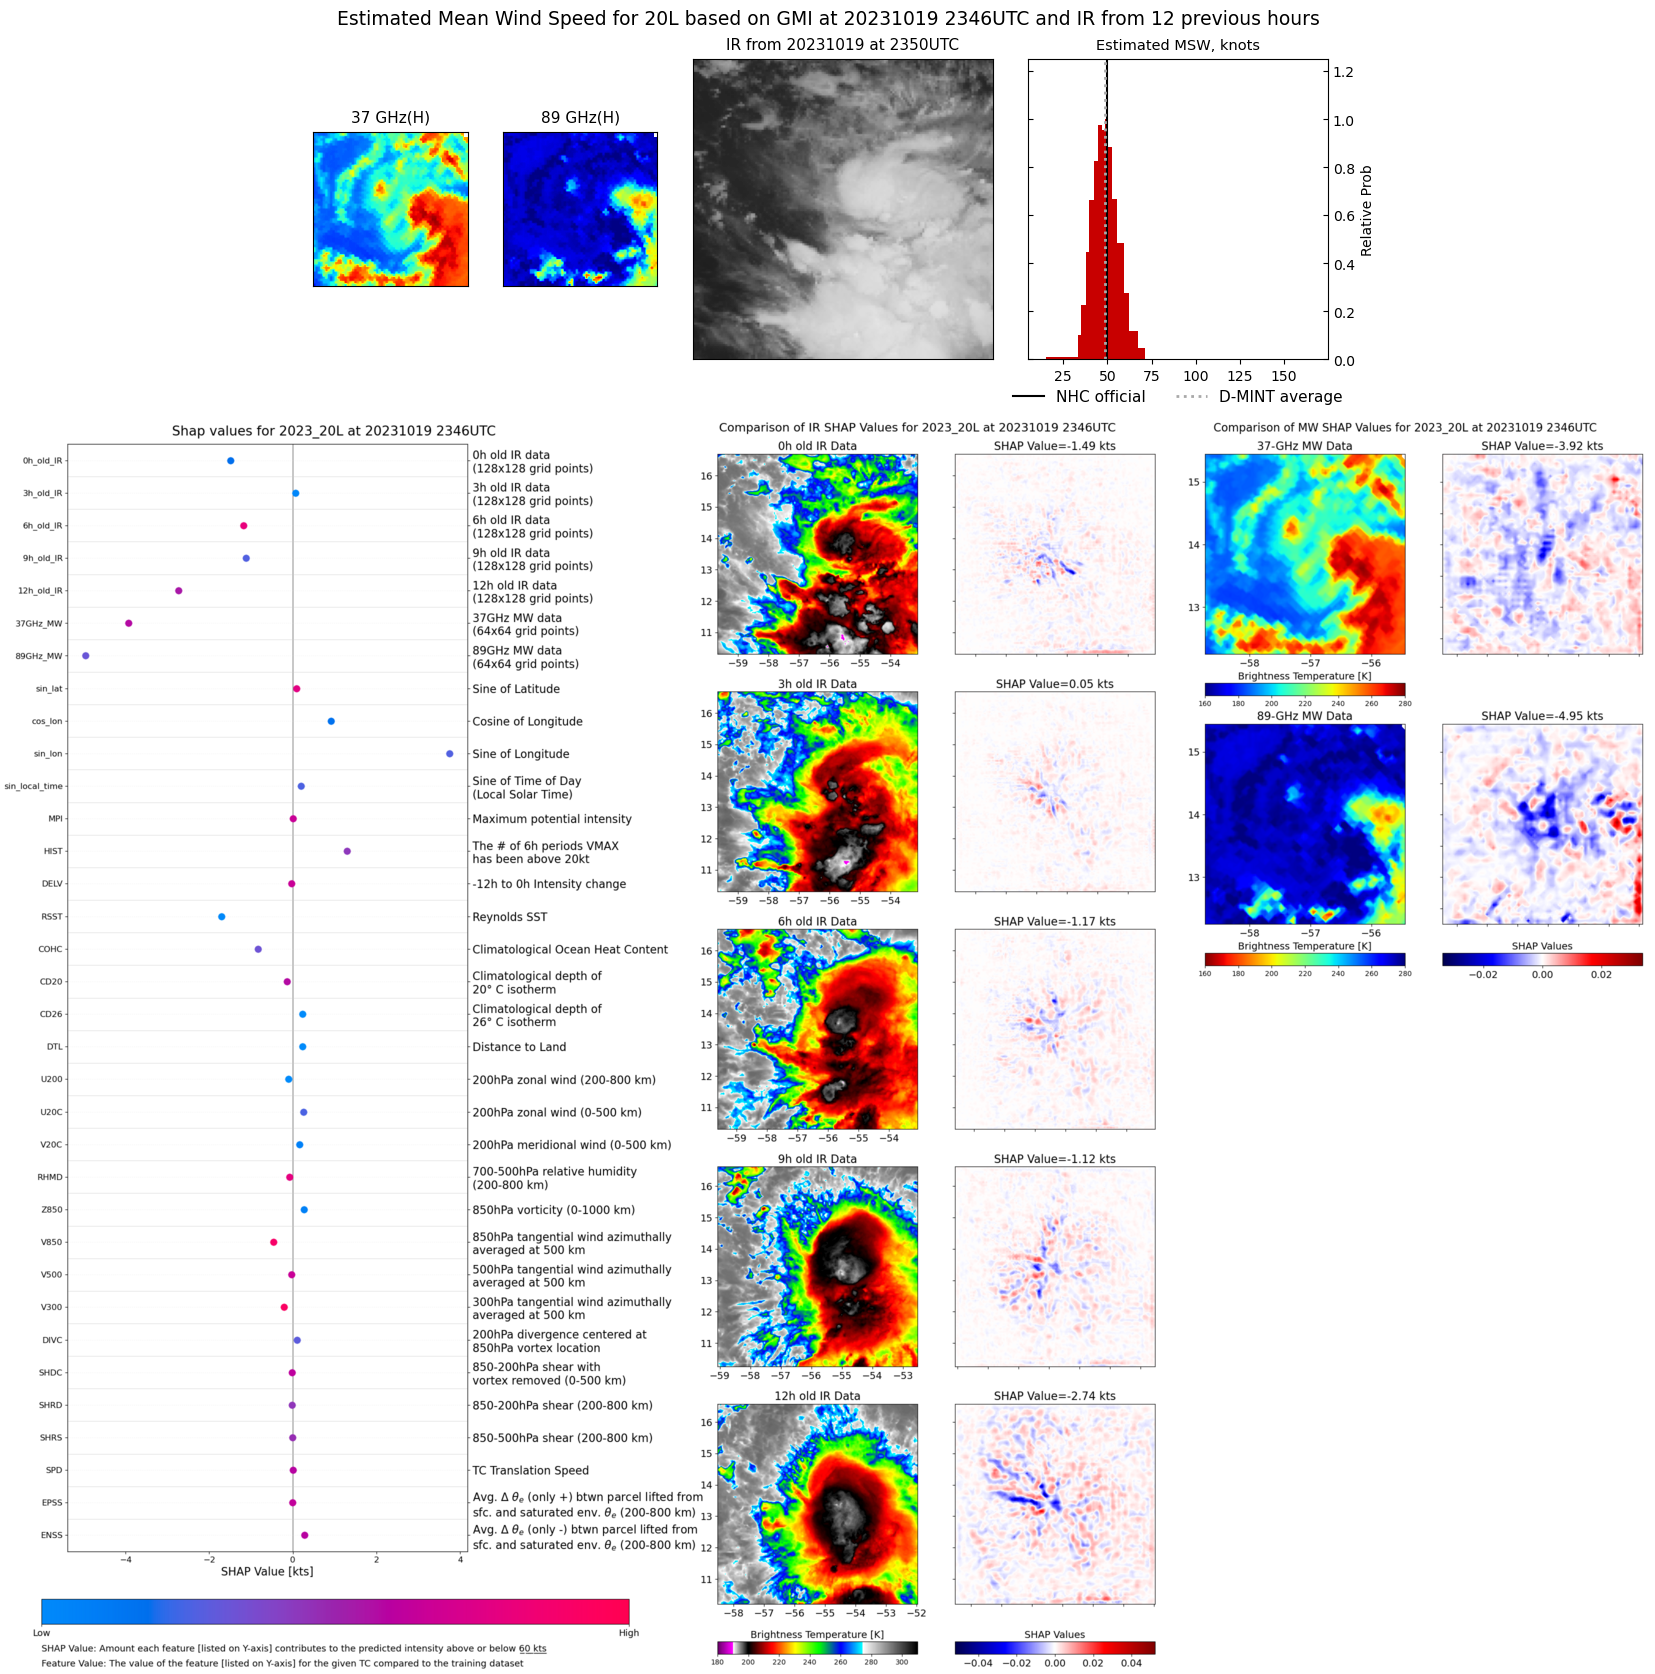 |
| 20231019 | 1954 UTC | SSMISF18 | 1000 hPa | 50 kts | 44 kts | 55 kts | 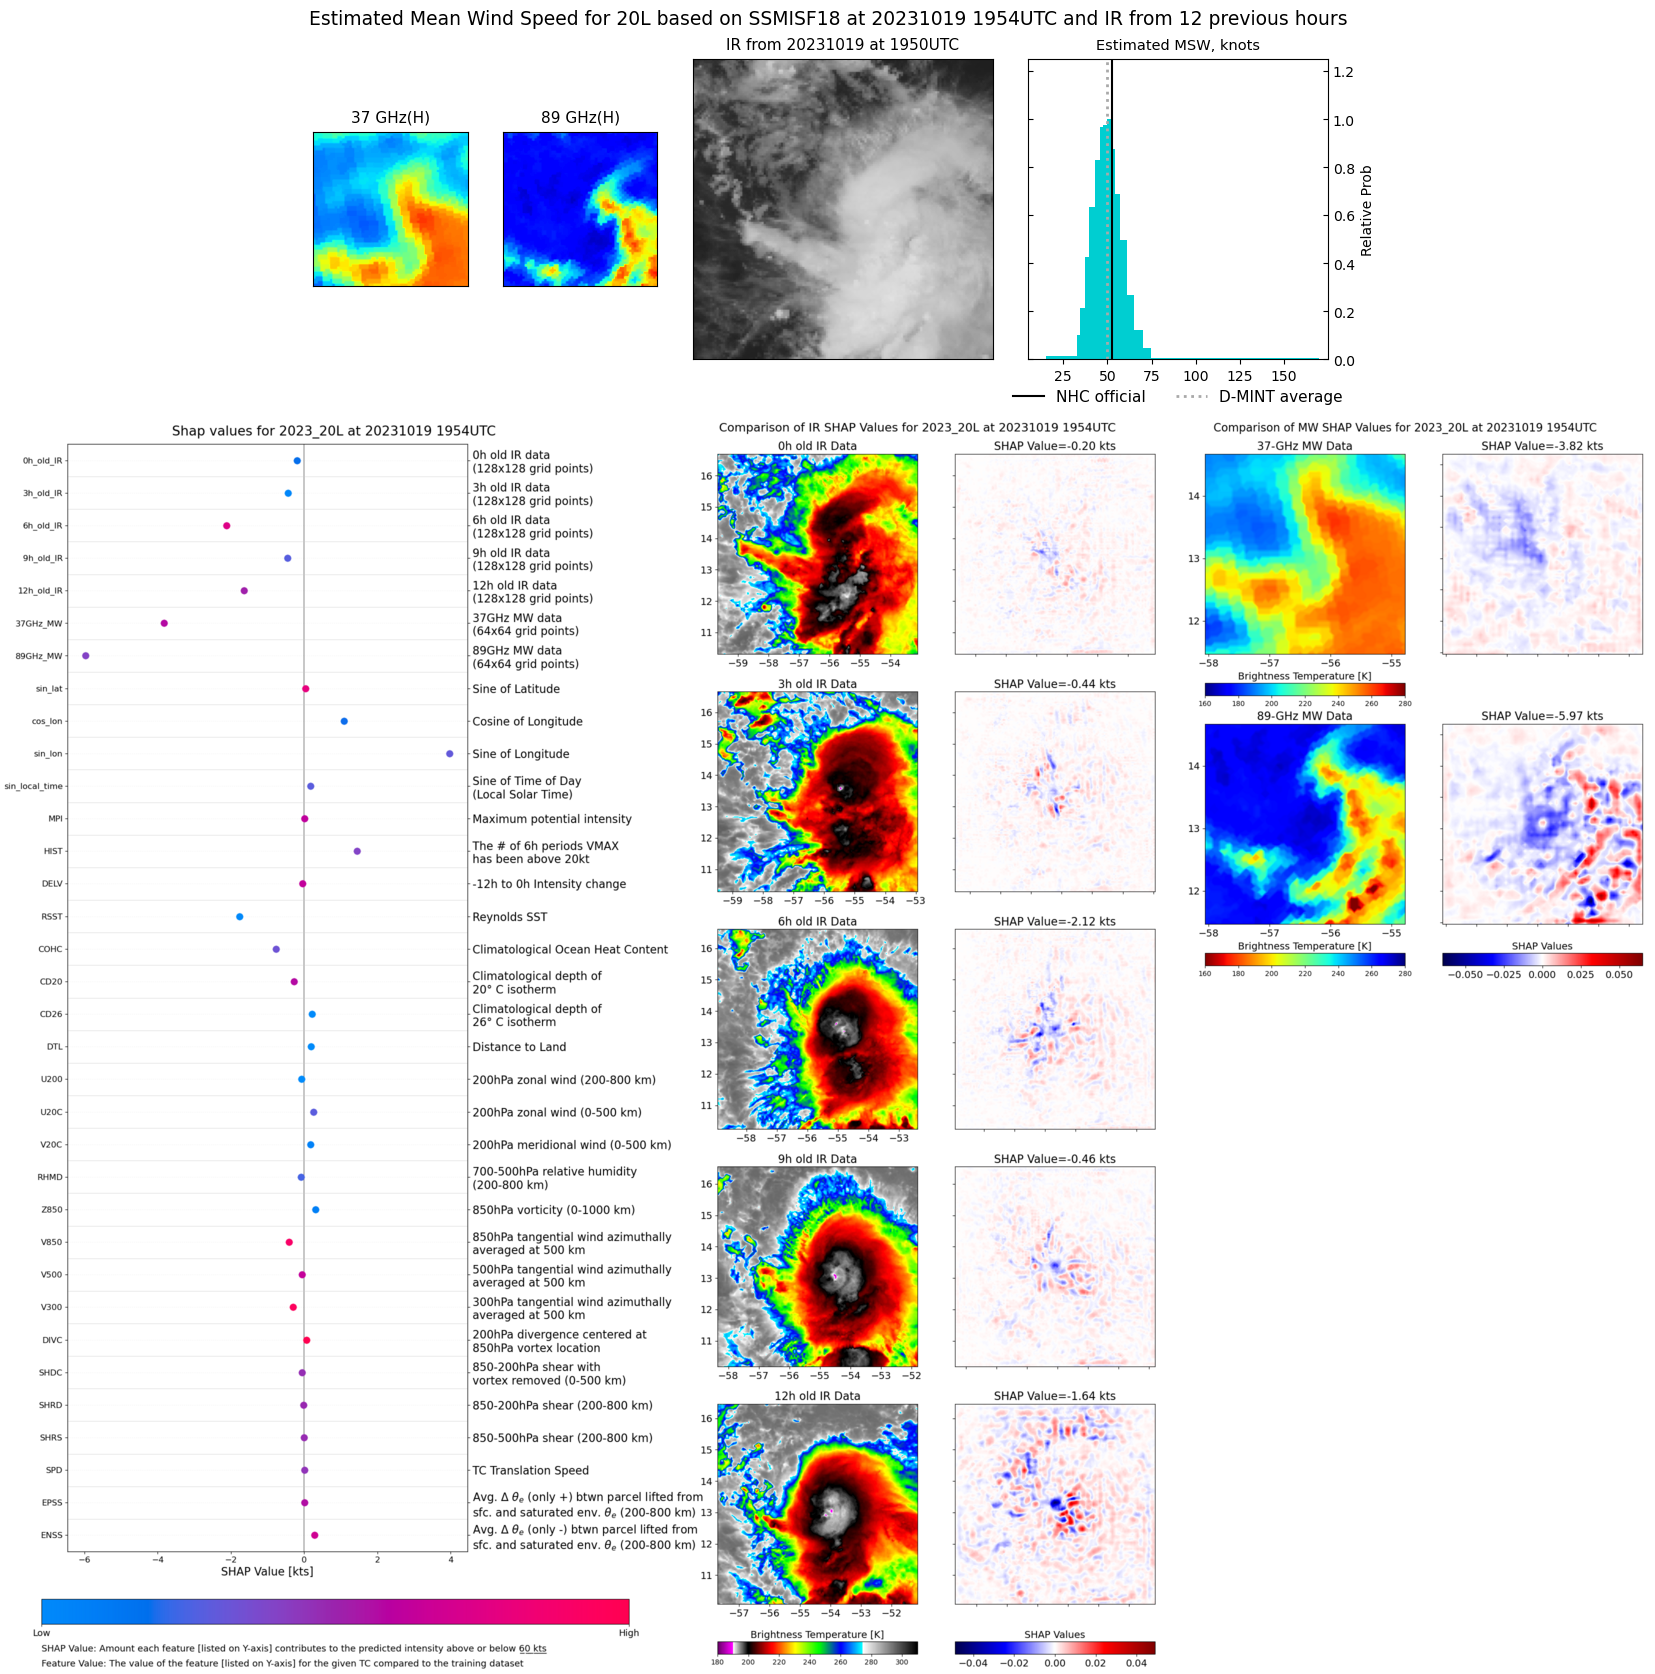 |
| 20231019 | 1011 UTC | SSMISF17 | 1003 hPa | 45 kts | 40 kts | 50 kts | 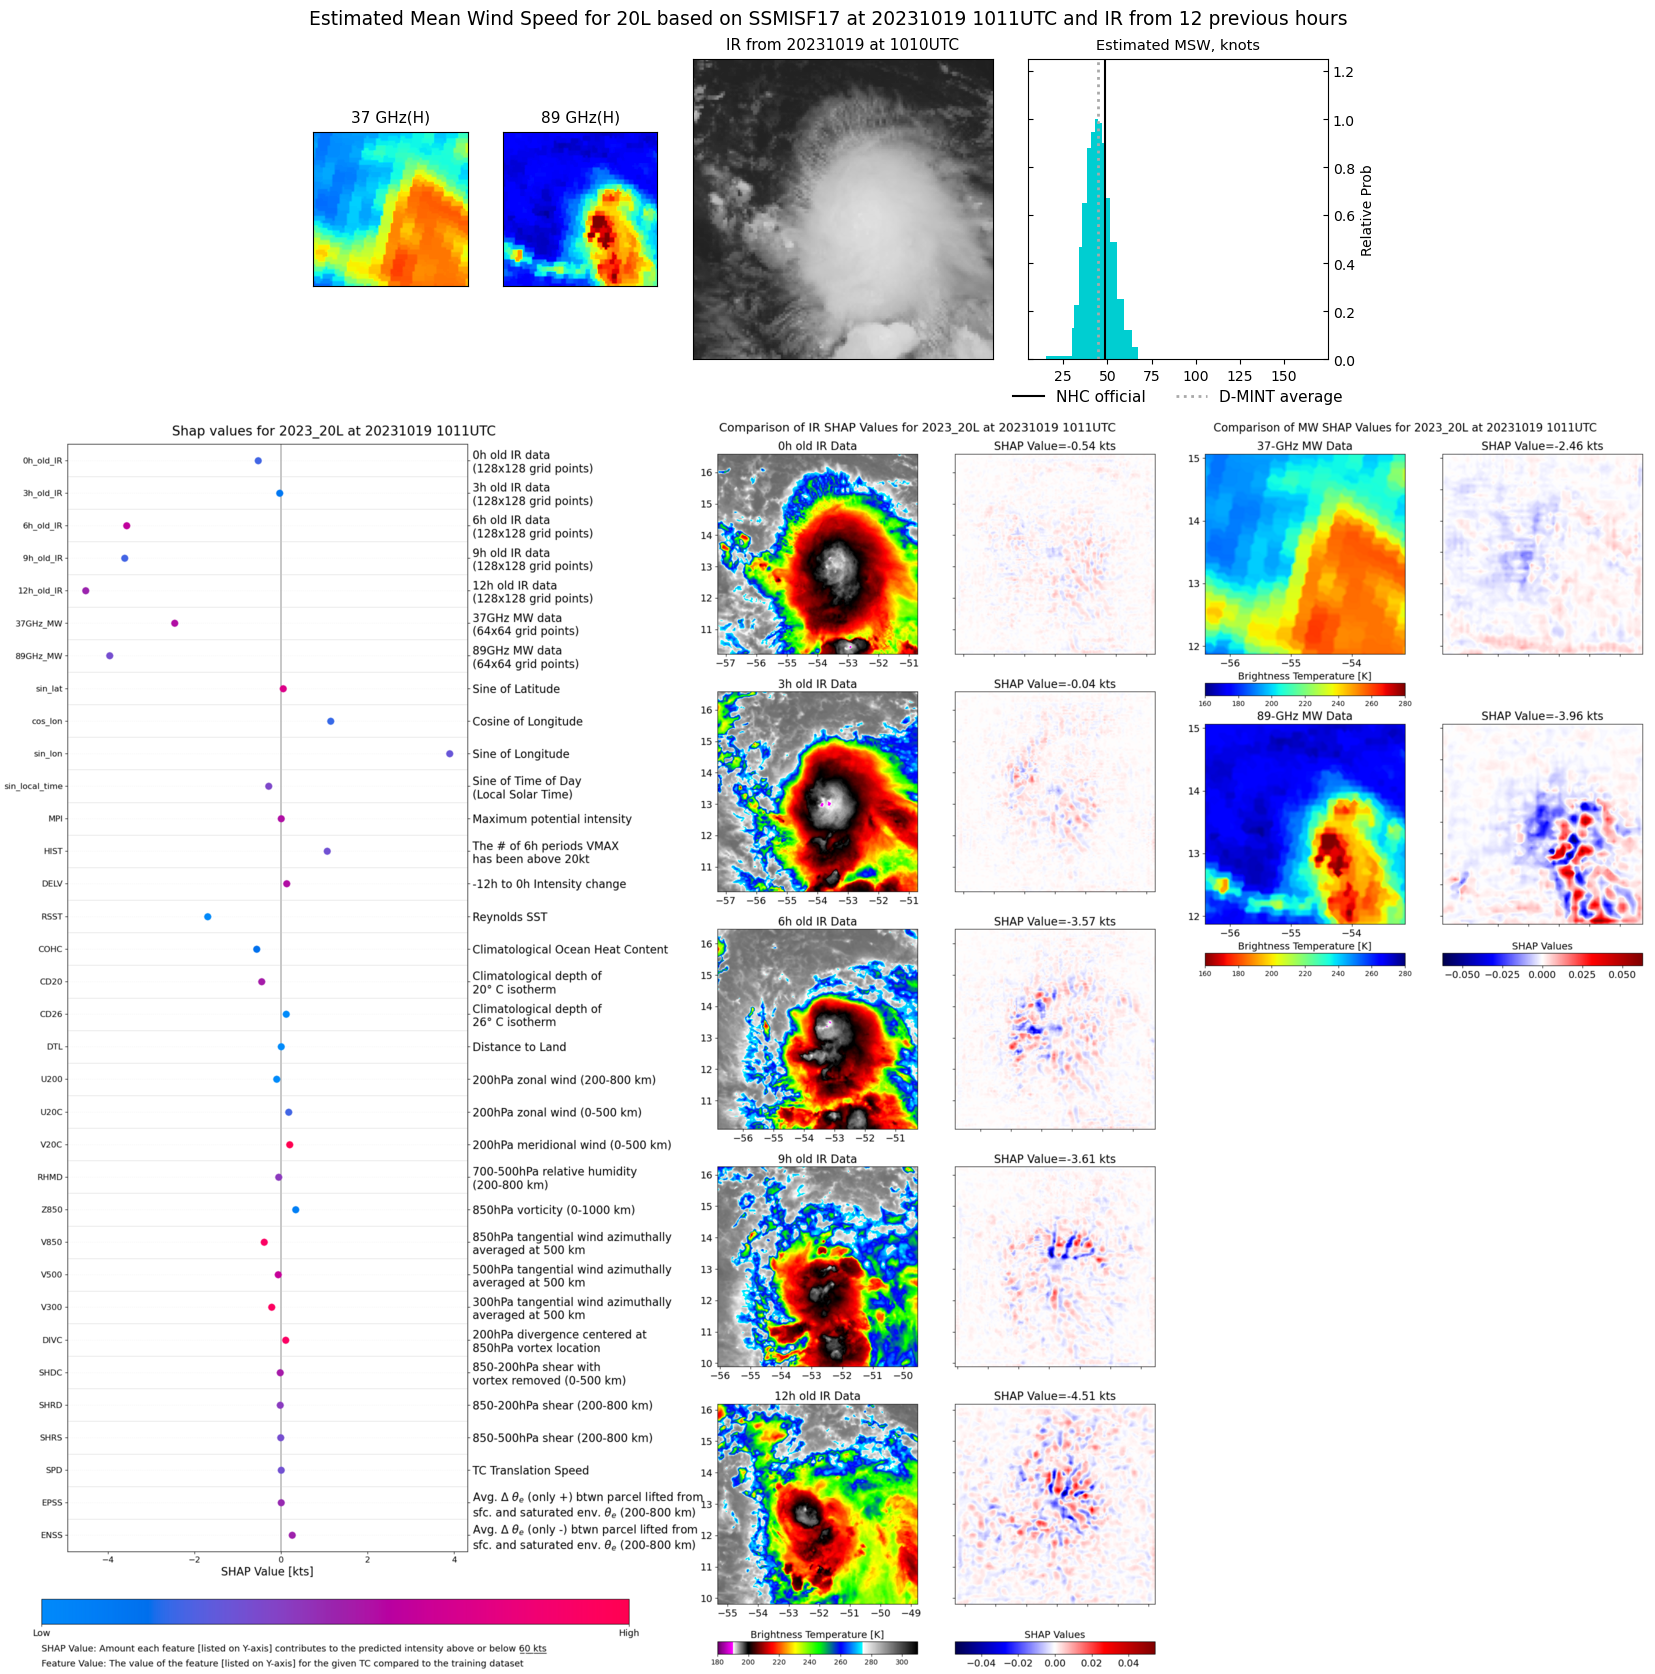 |