|
||

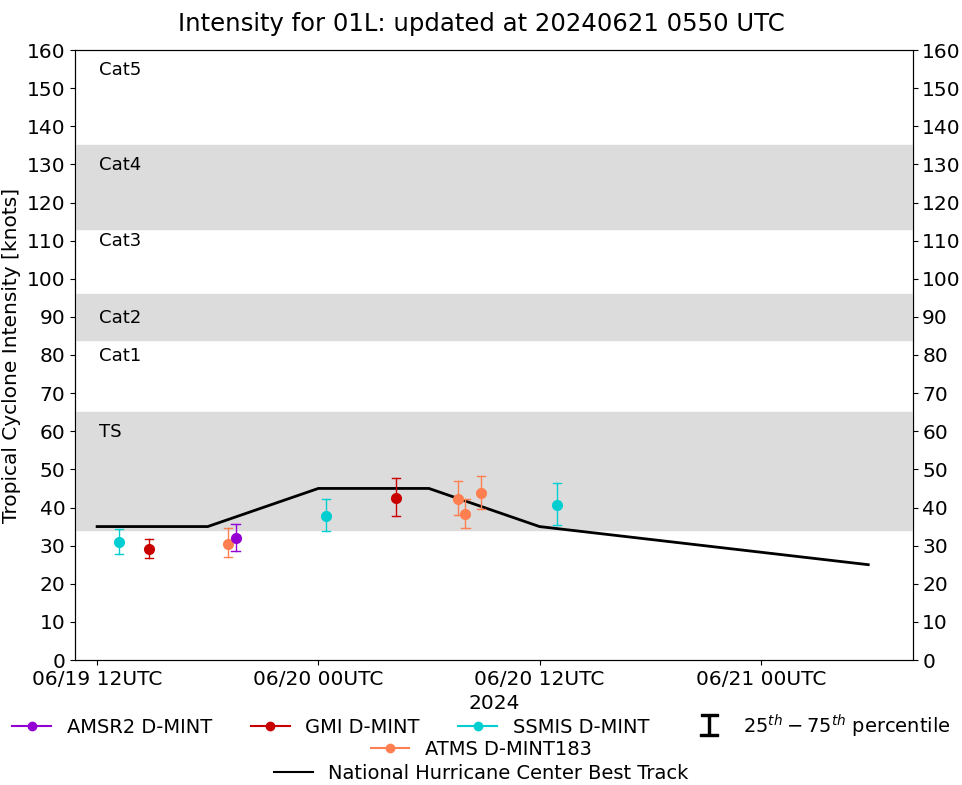 |
D-MINT HISTORY FILE for 2024_01L
| Date | Time | MW Sensor | MSLP | Vmax (30th-70th percentile average) | Vmax 25th percentile | Vmax 75th percentile | Image |
| 20240620 | 1257 UTC | SSMISF17 | 999 hPa | 41 kts | 35 kts | 46 kts | 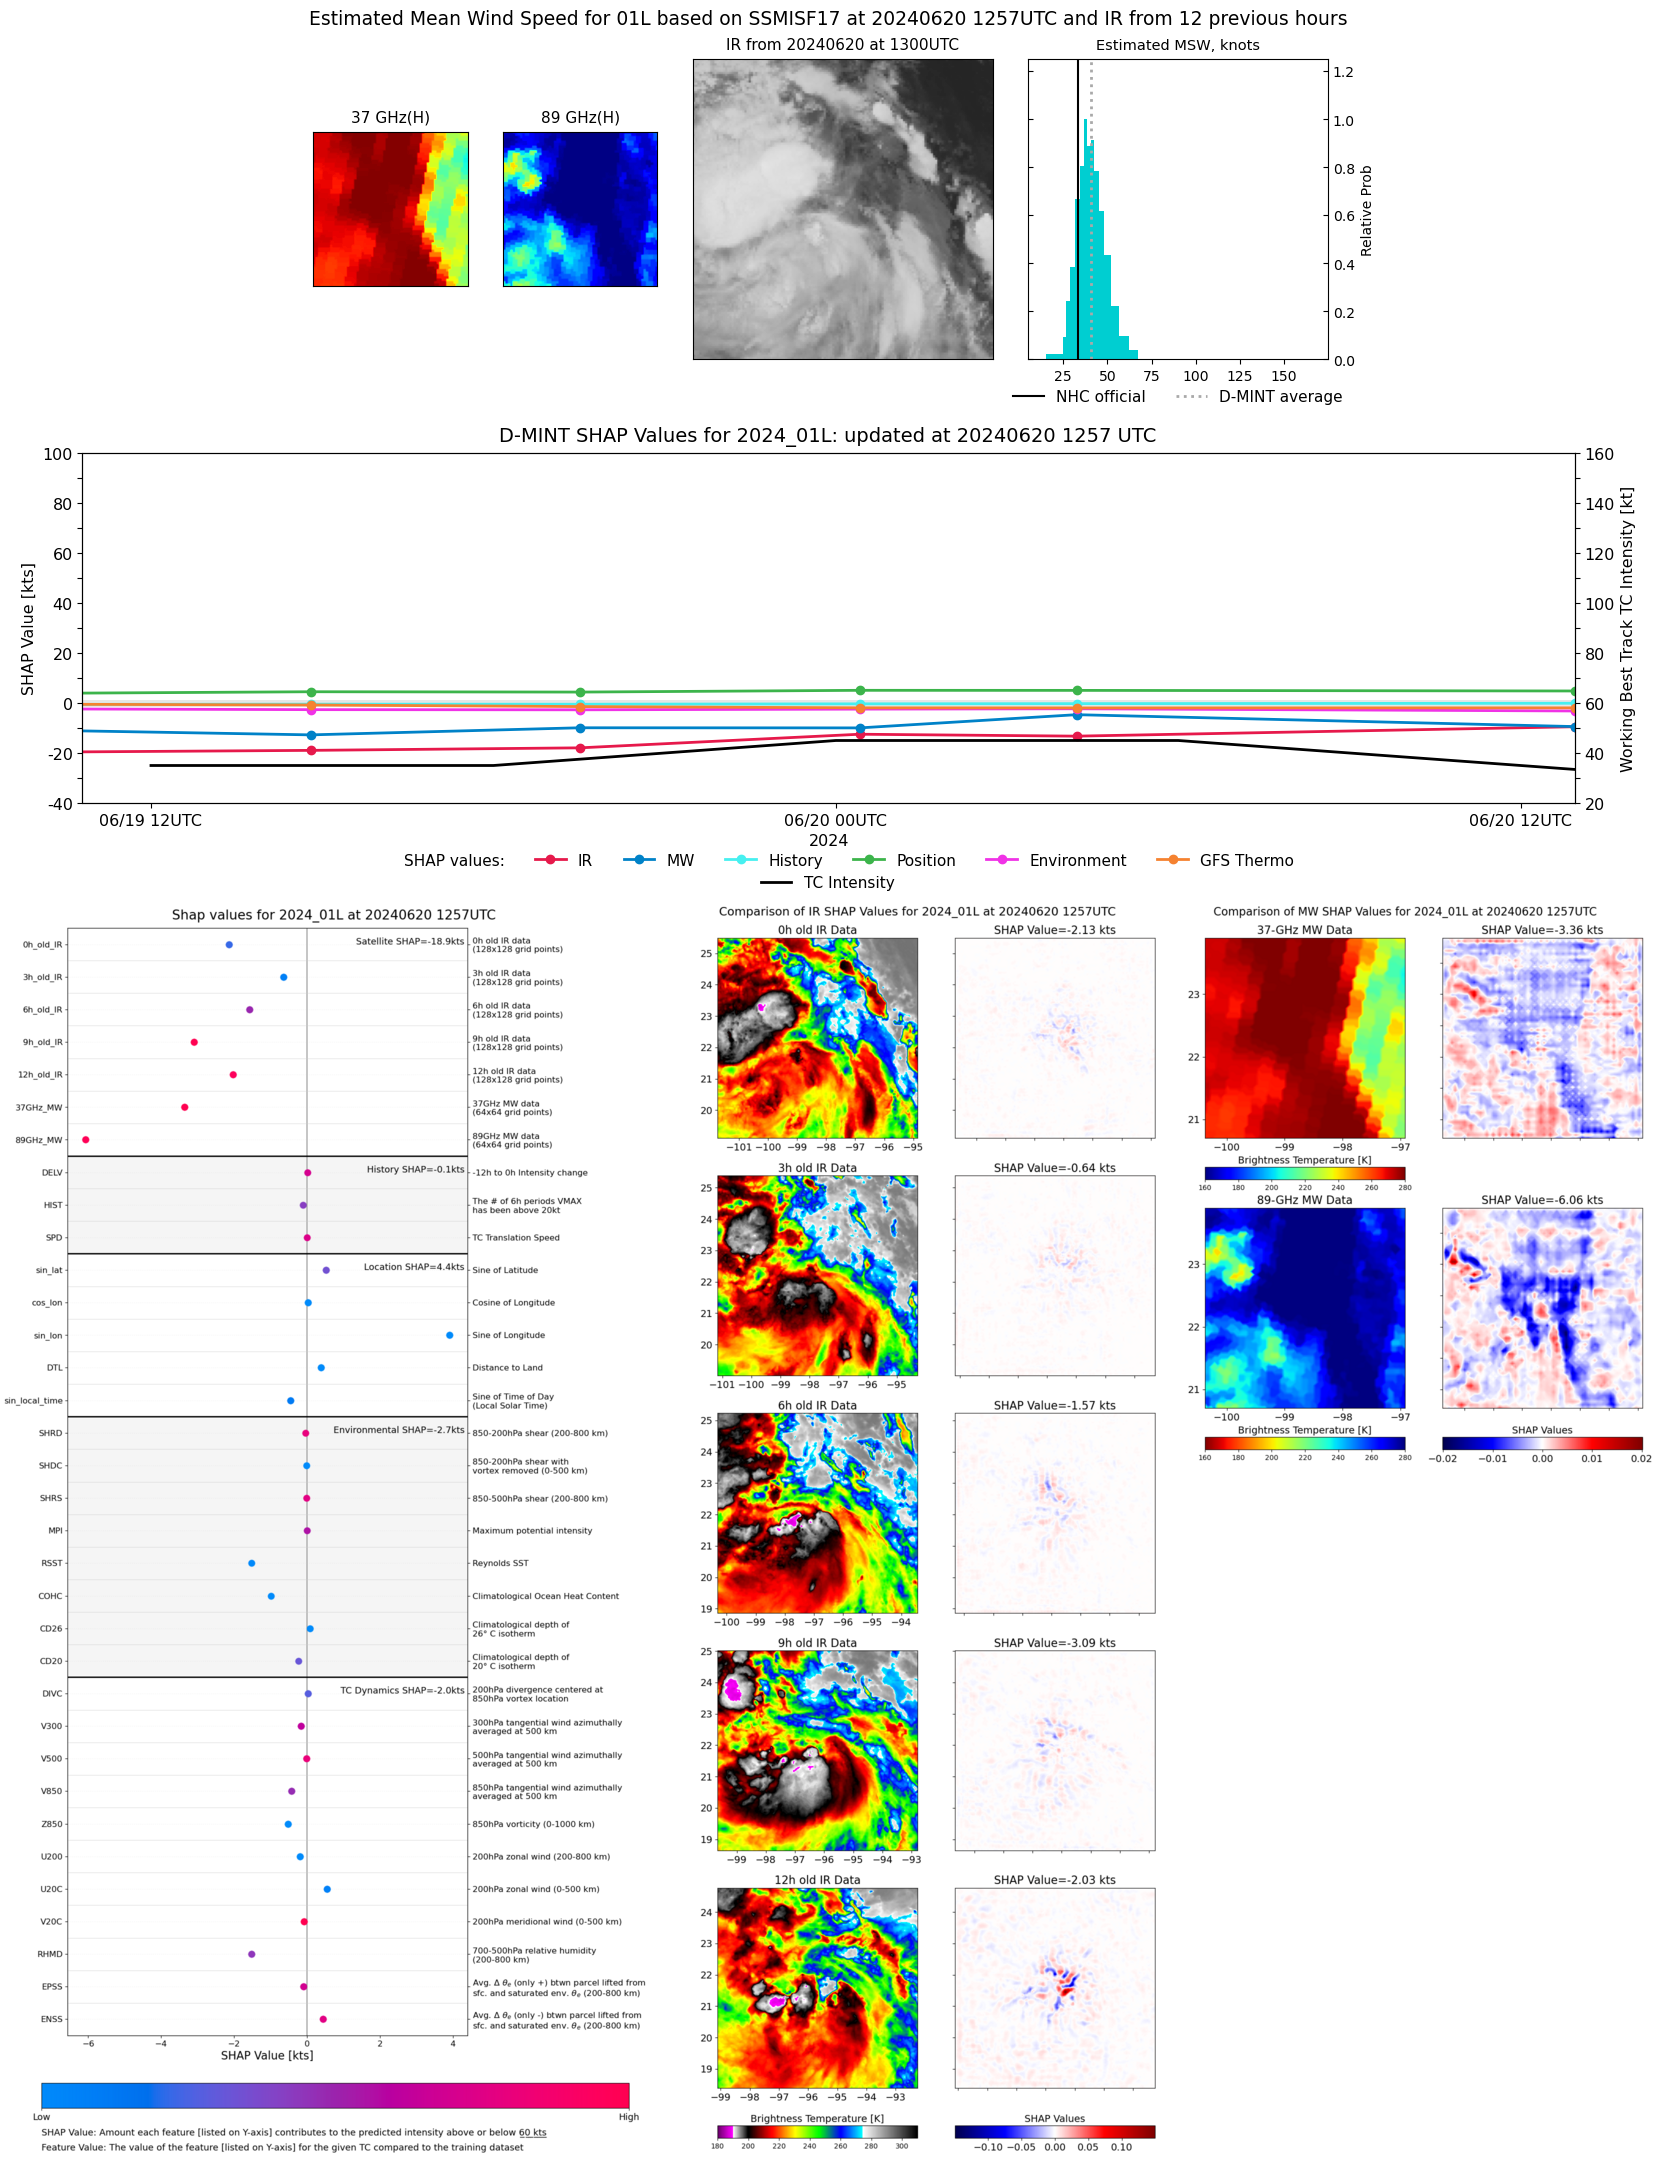 |
| 20240620 | 0849 UTC | ATMS | 991 hPa | 44 kts | 40 kts | 48 kts | 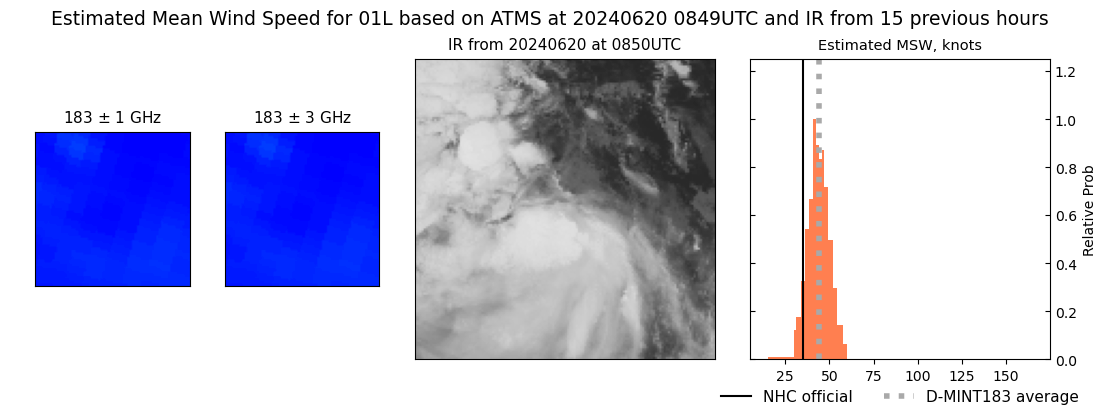 |
| 20240620 | 0759 UTC | ATMS | 1001 hPa | 38 kts | 35 kts | 42 kts | 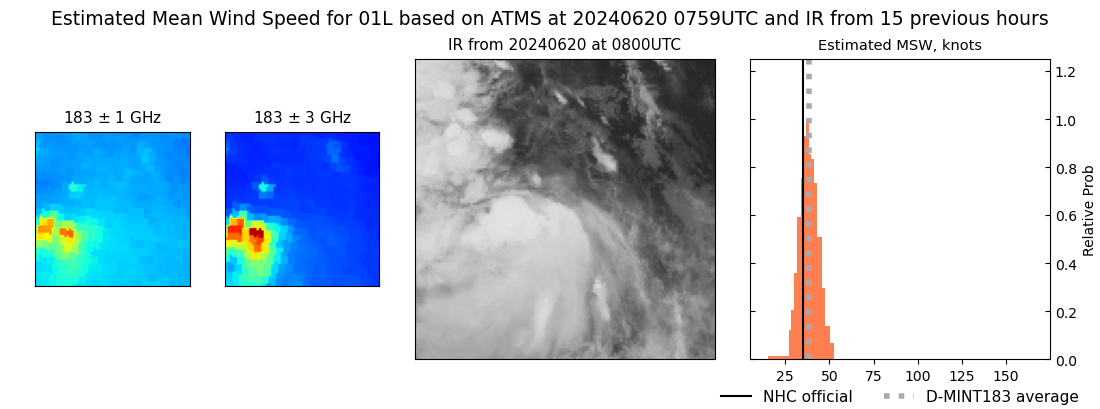 |
| 20240620 | 0734 UTC | ATMS | 996 hPa | 42 kts | 38 kts | 47 kts | 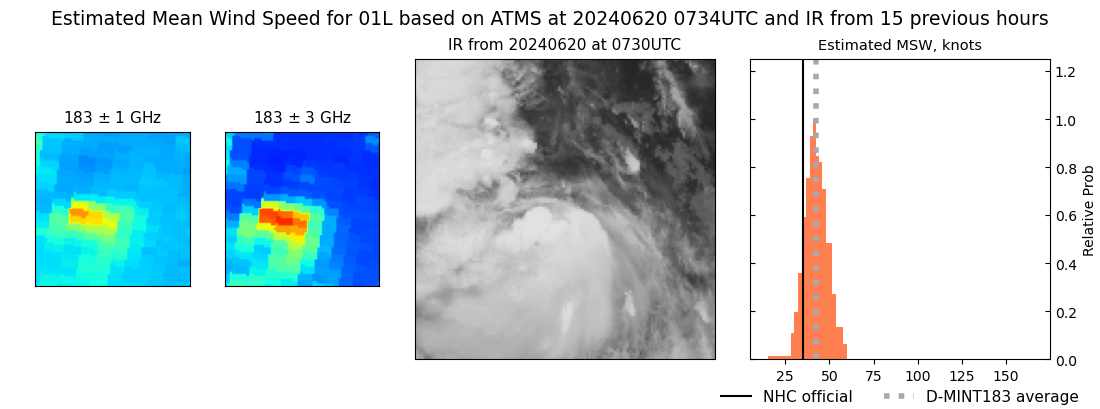 |
| 20240620 | 0413 UTC | GMI | 998 hPa | 43 kts | 38 kts | 48 kts | 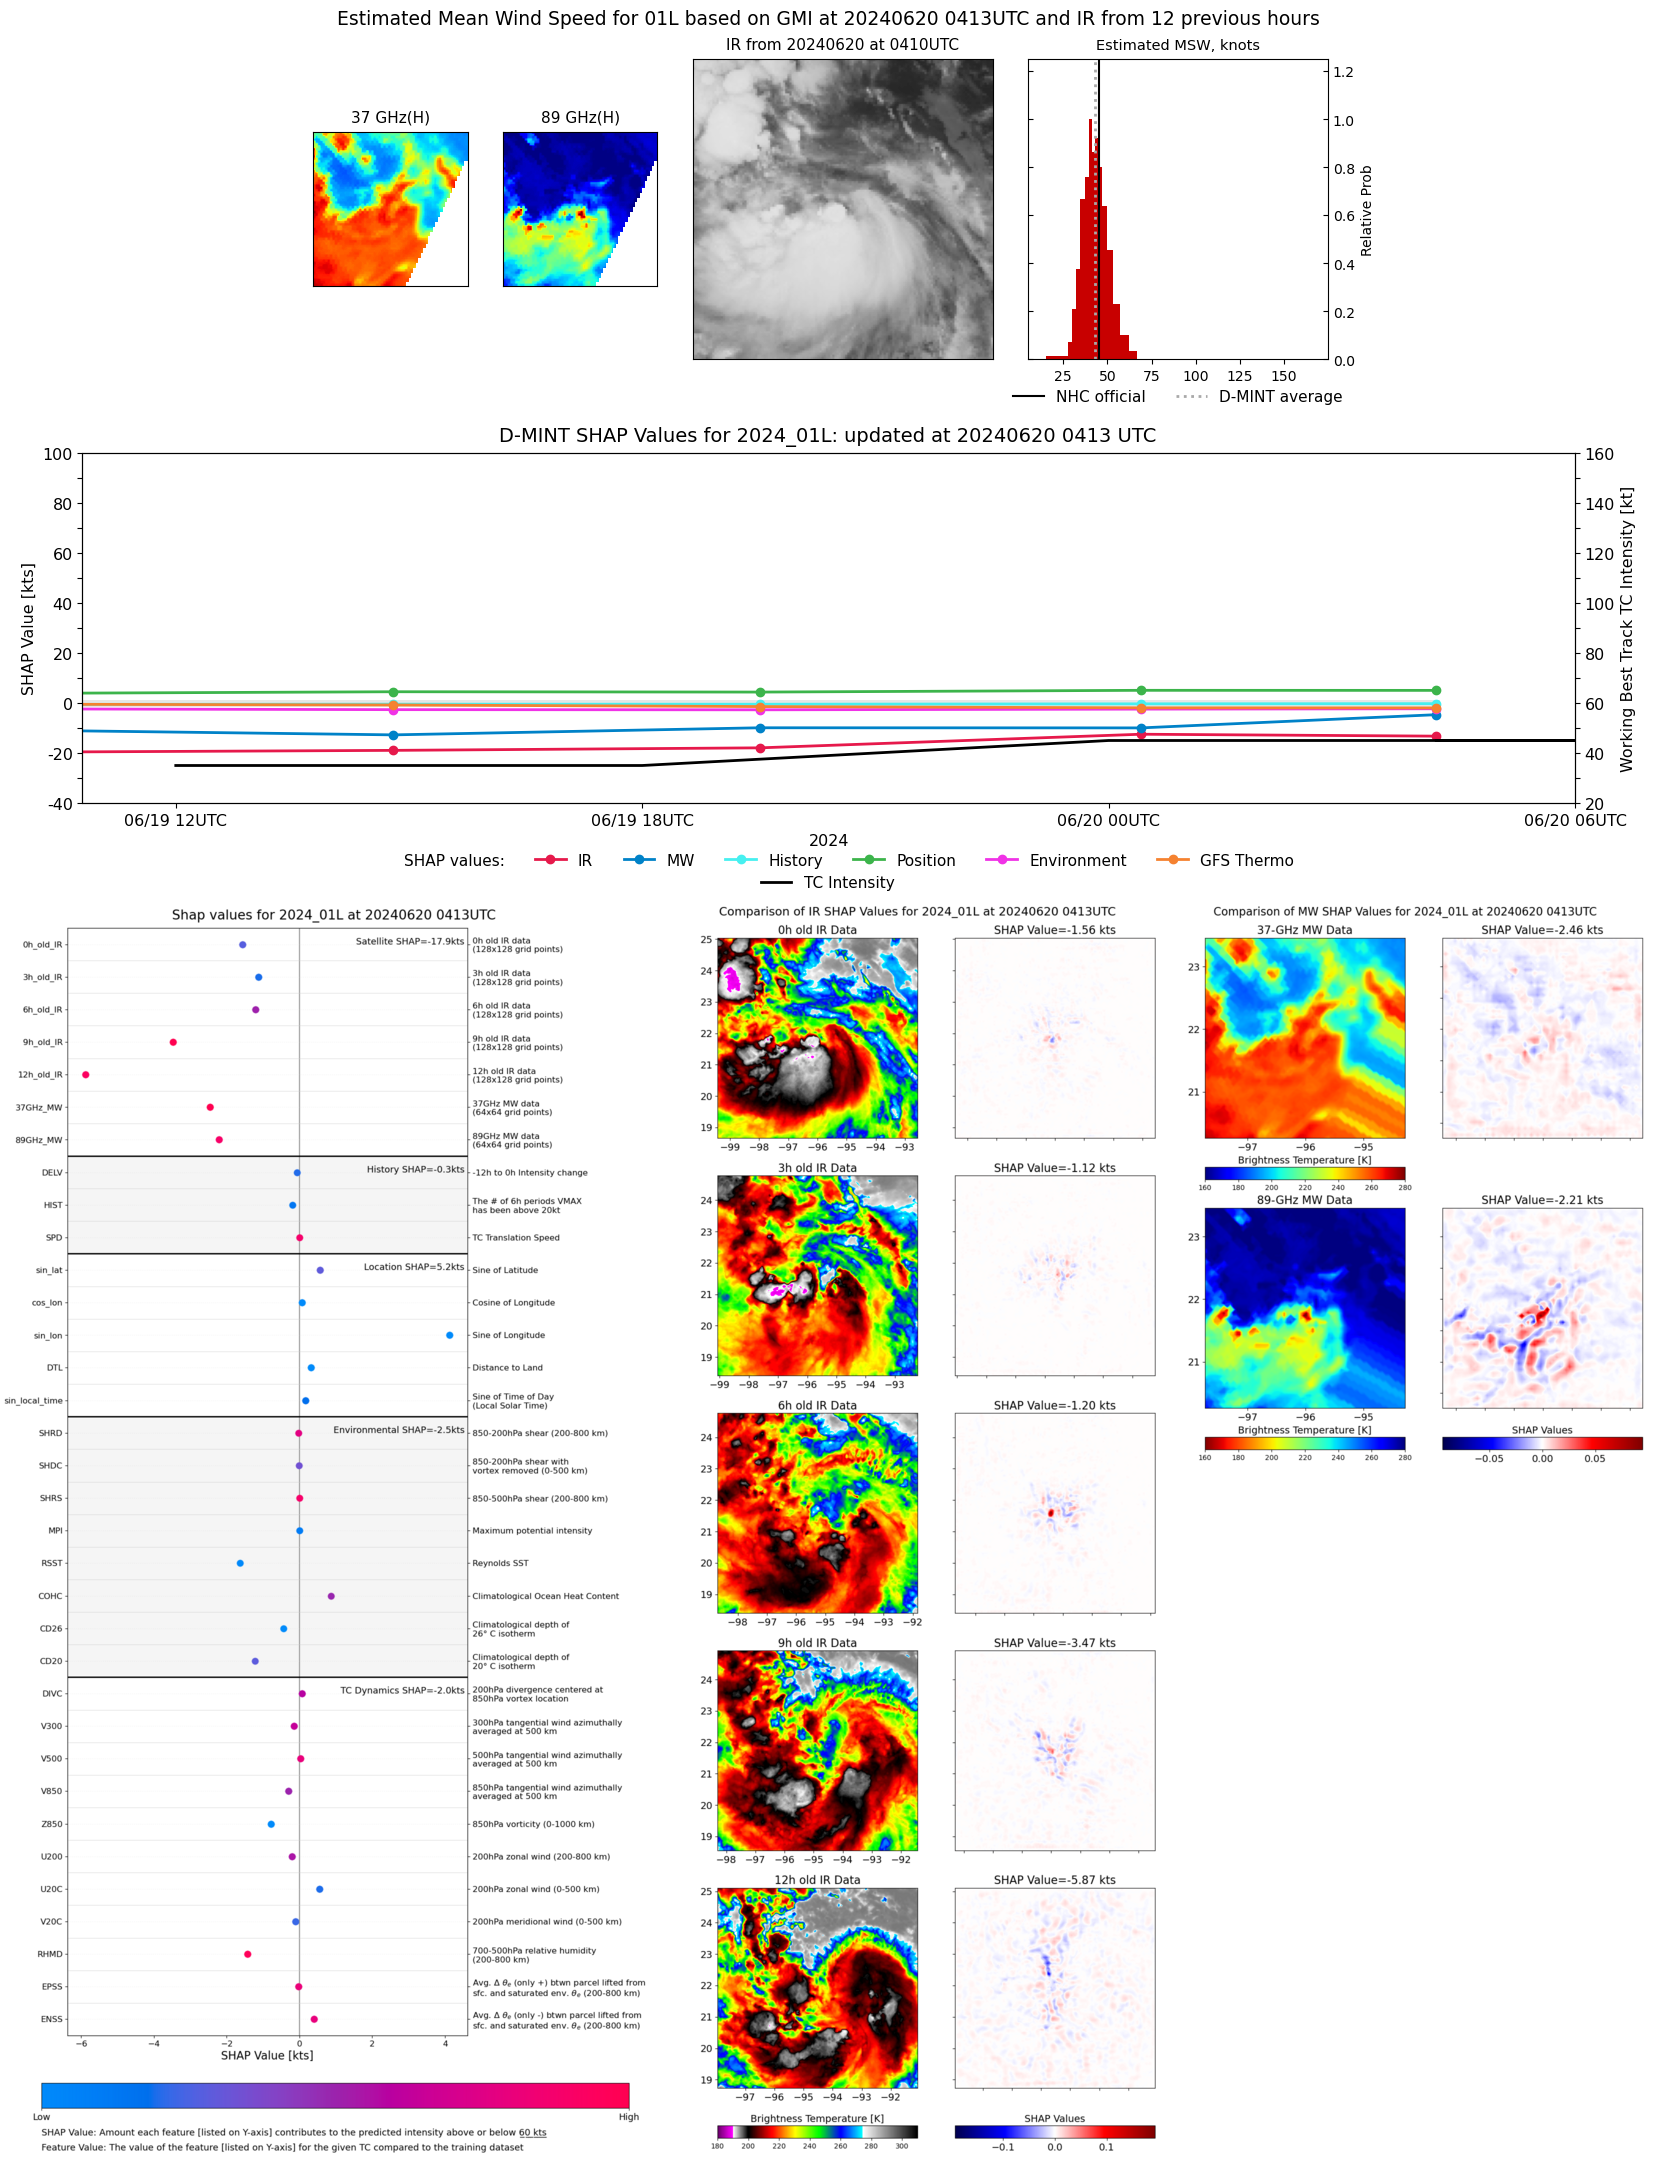 |
| 20240620 | 0025 UTC | SSMISF17 | 998 hPa | 38 kts | 34 kts | 42 kts | 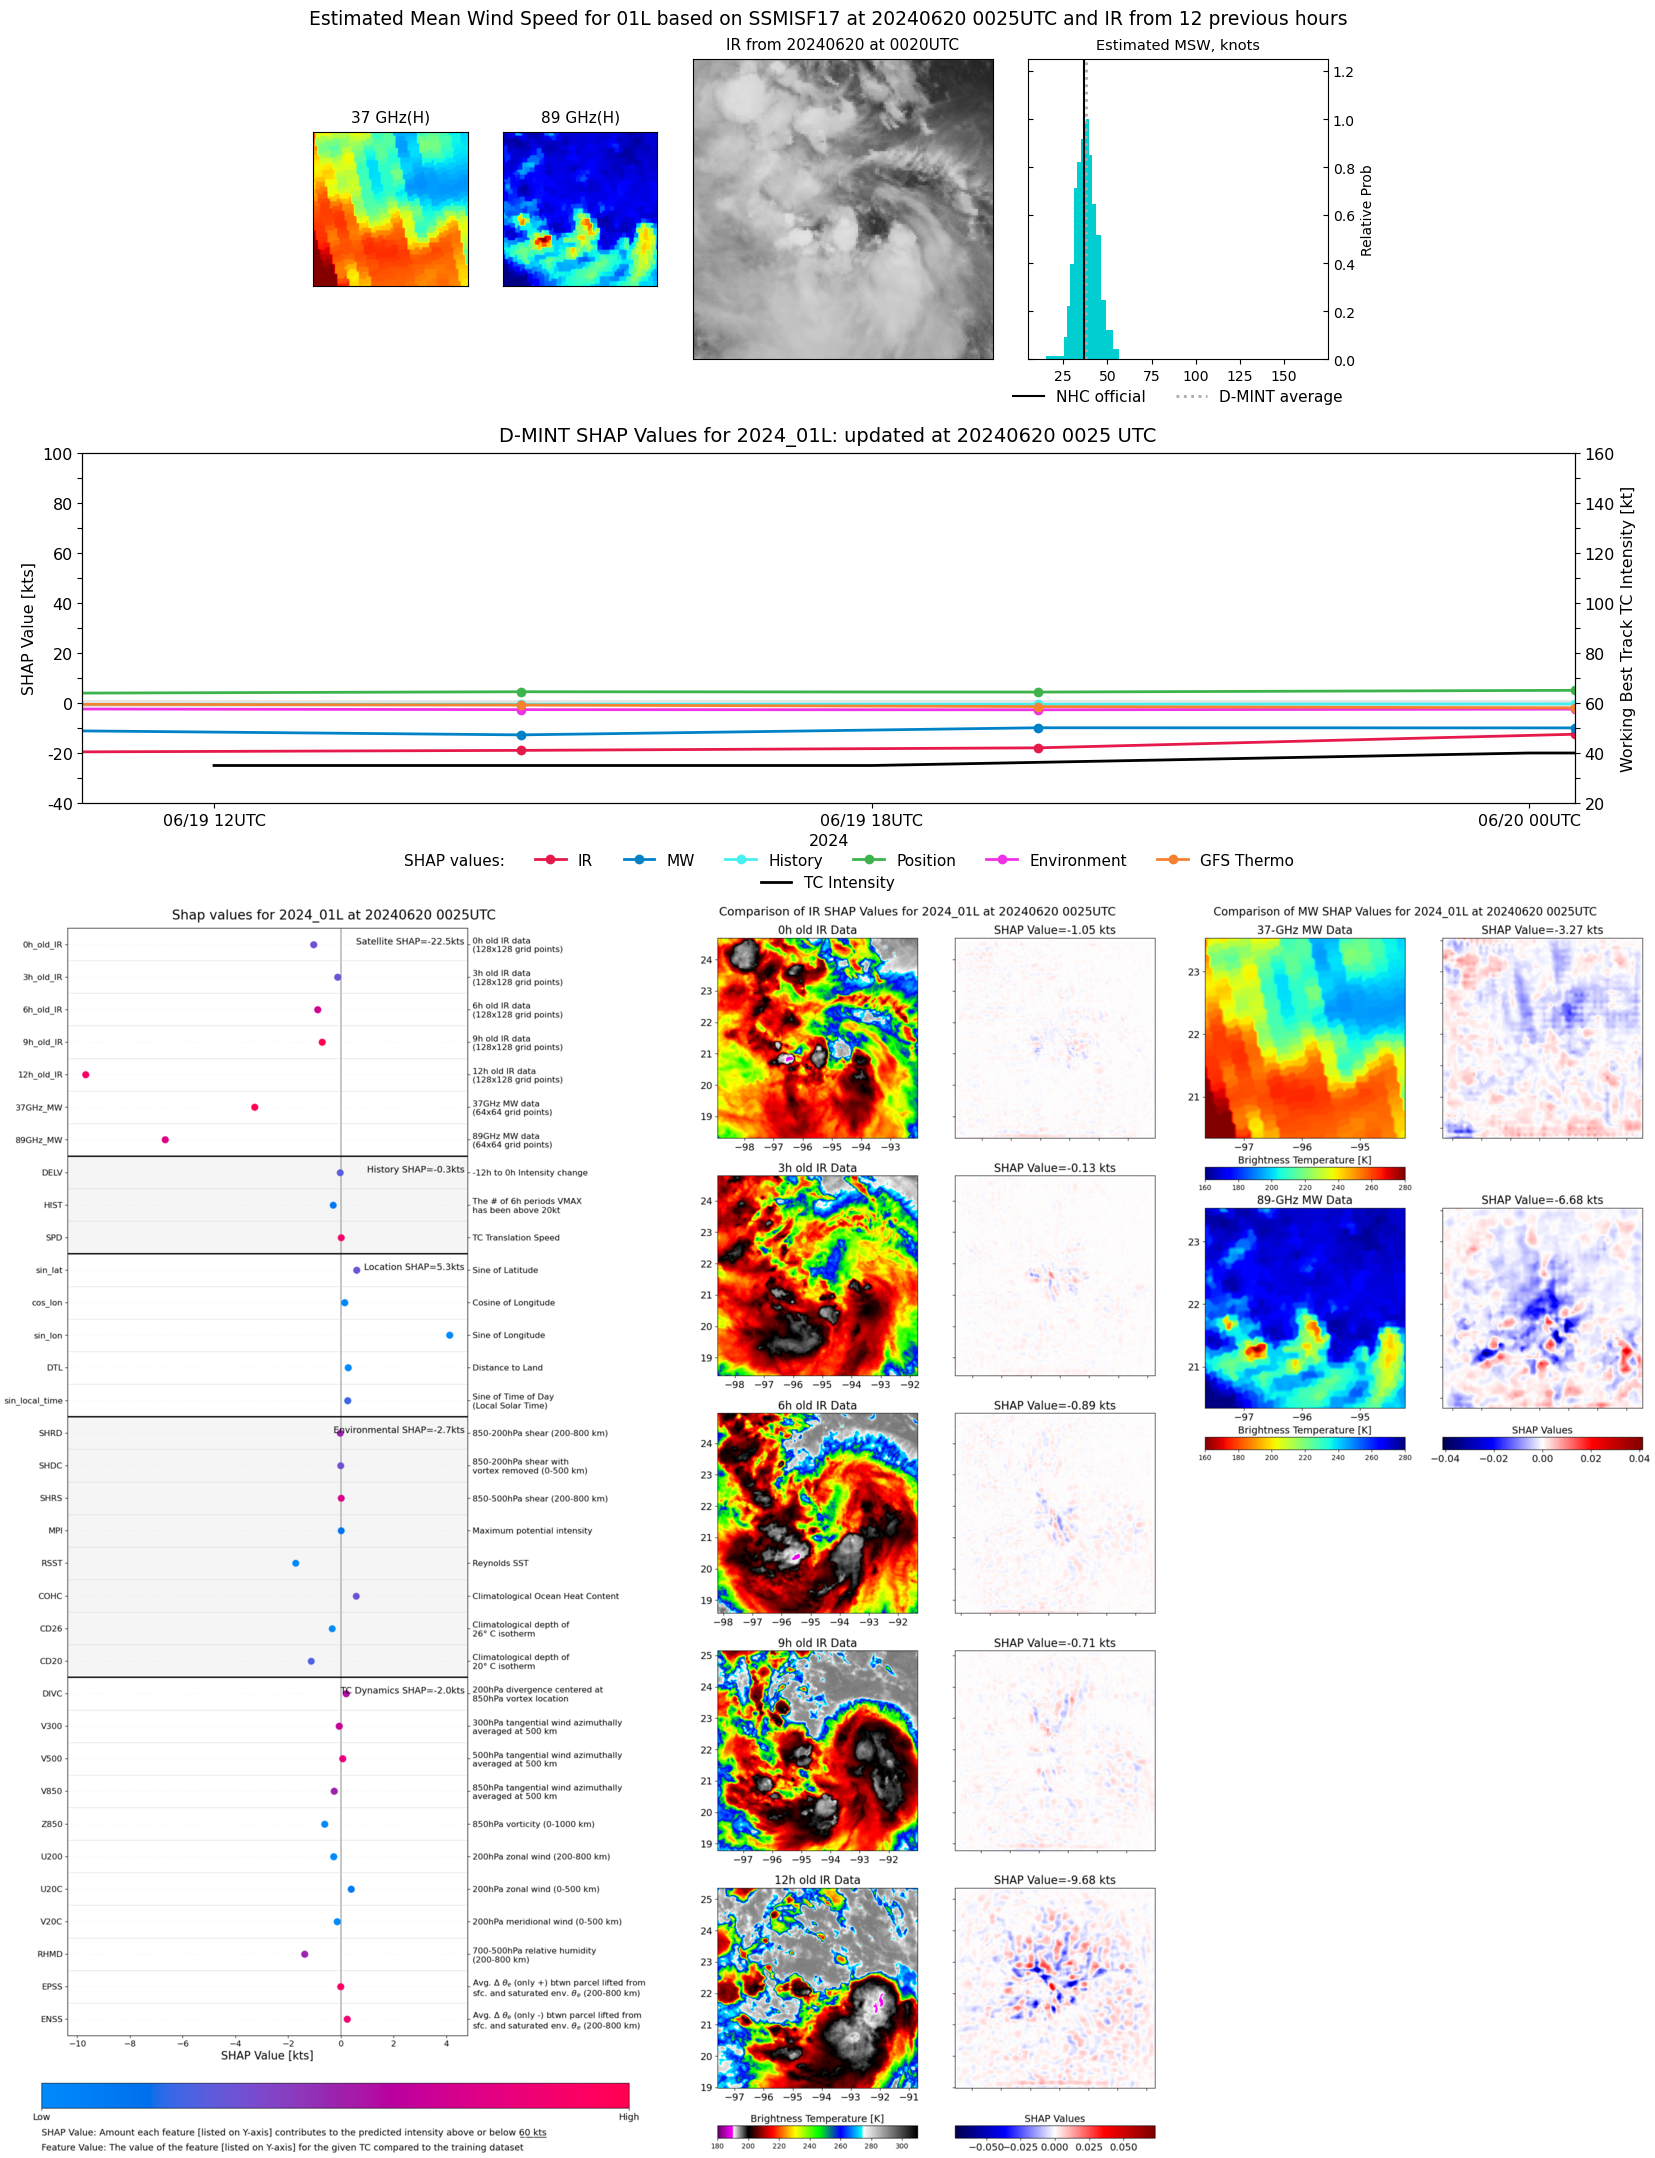 |
| 20240619 | 1931 UTC | AMSR2 | 1000 hPa | 32 kts | 29 kts | 36 kts | 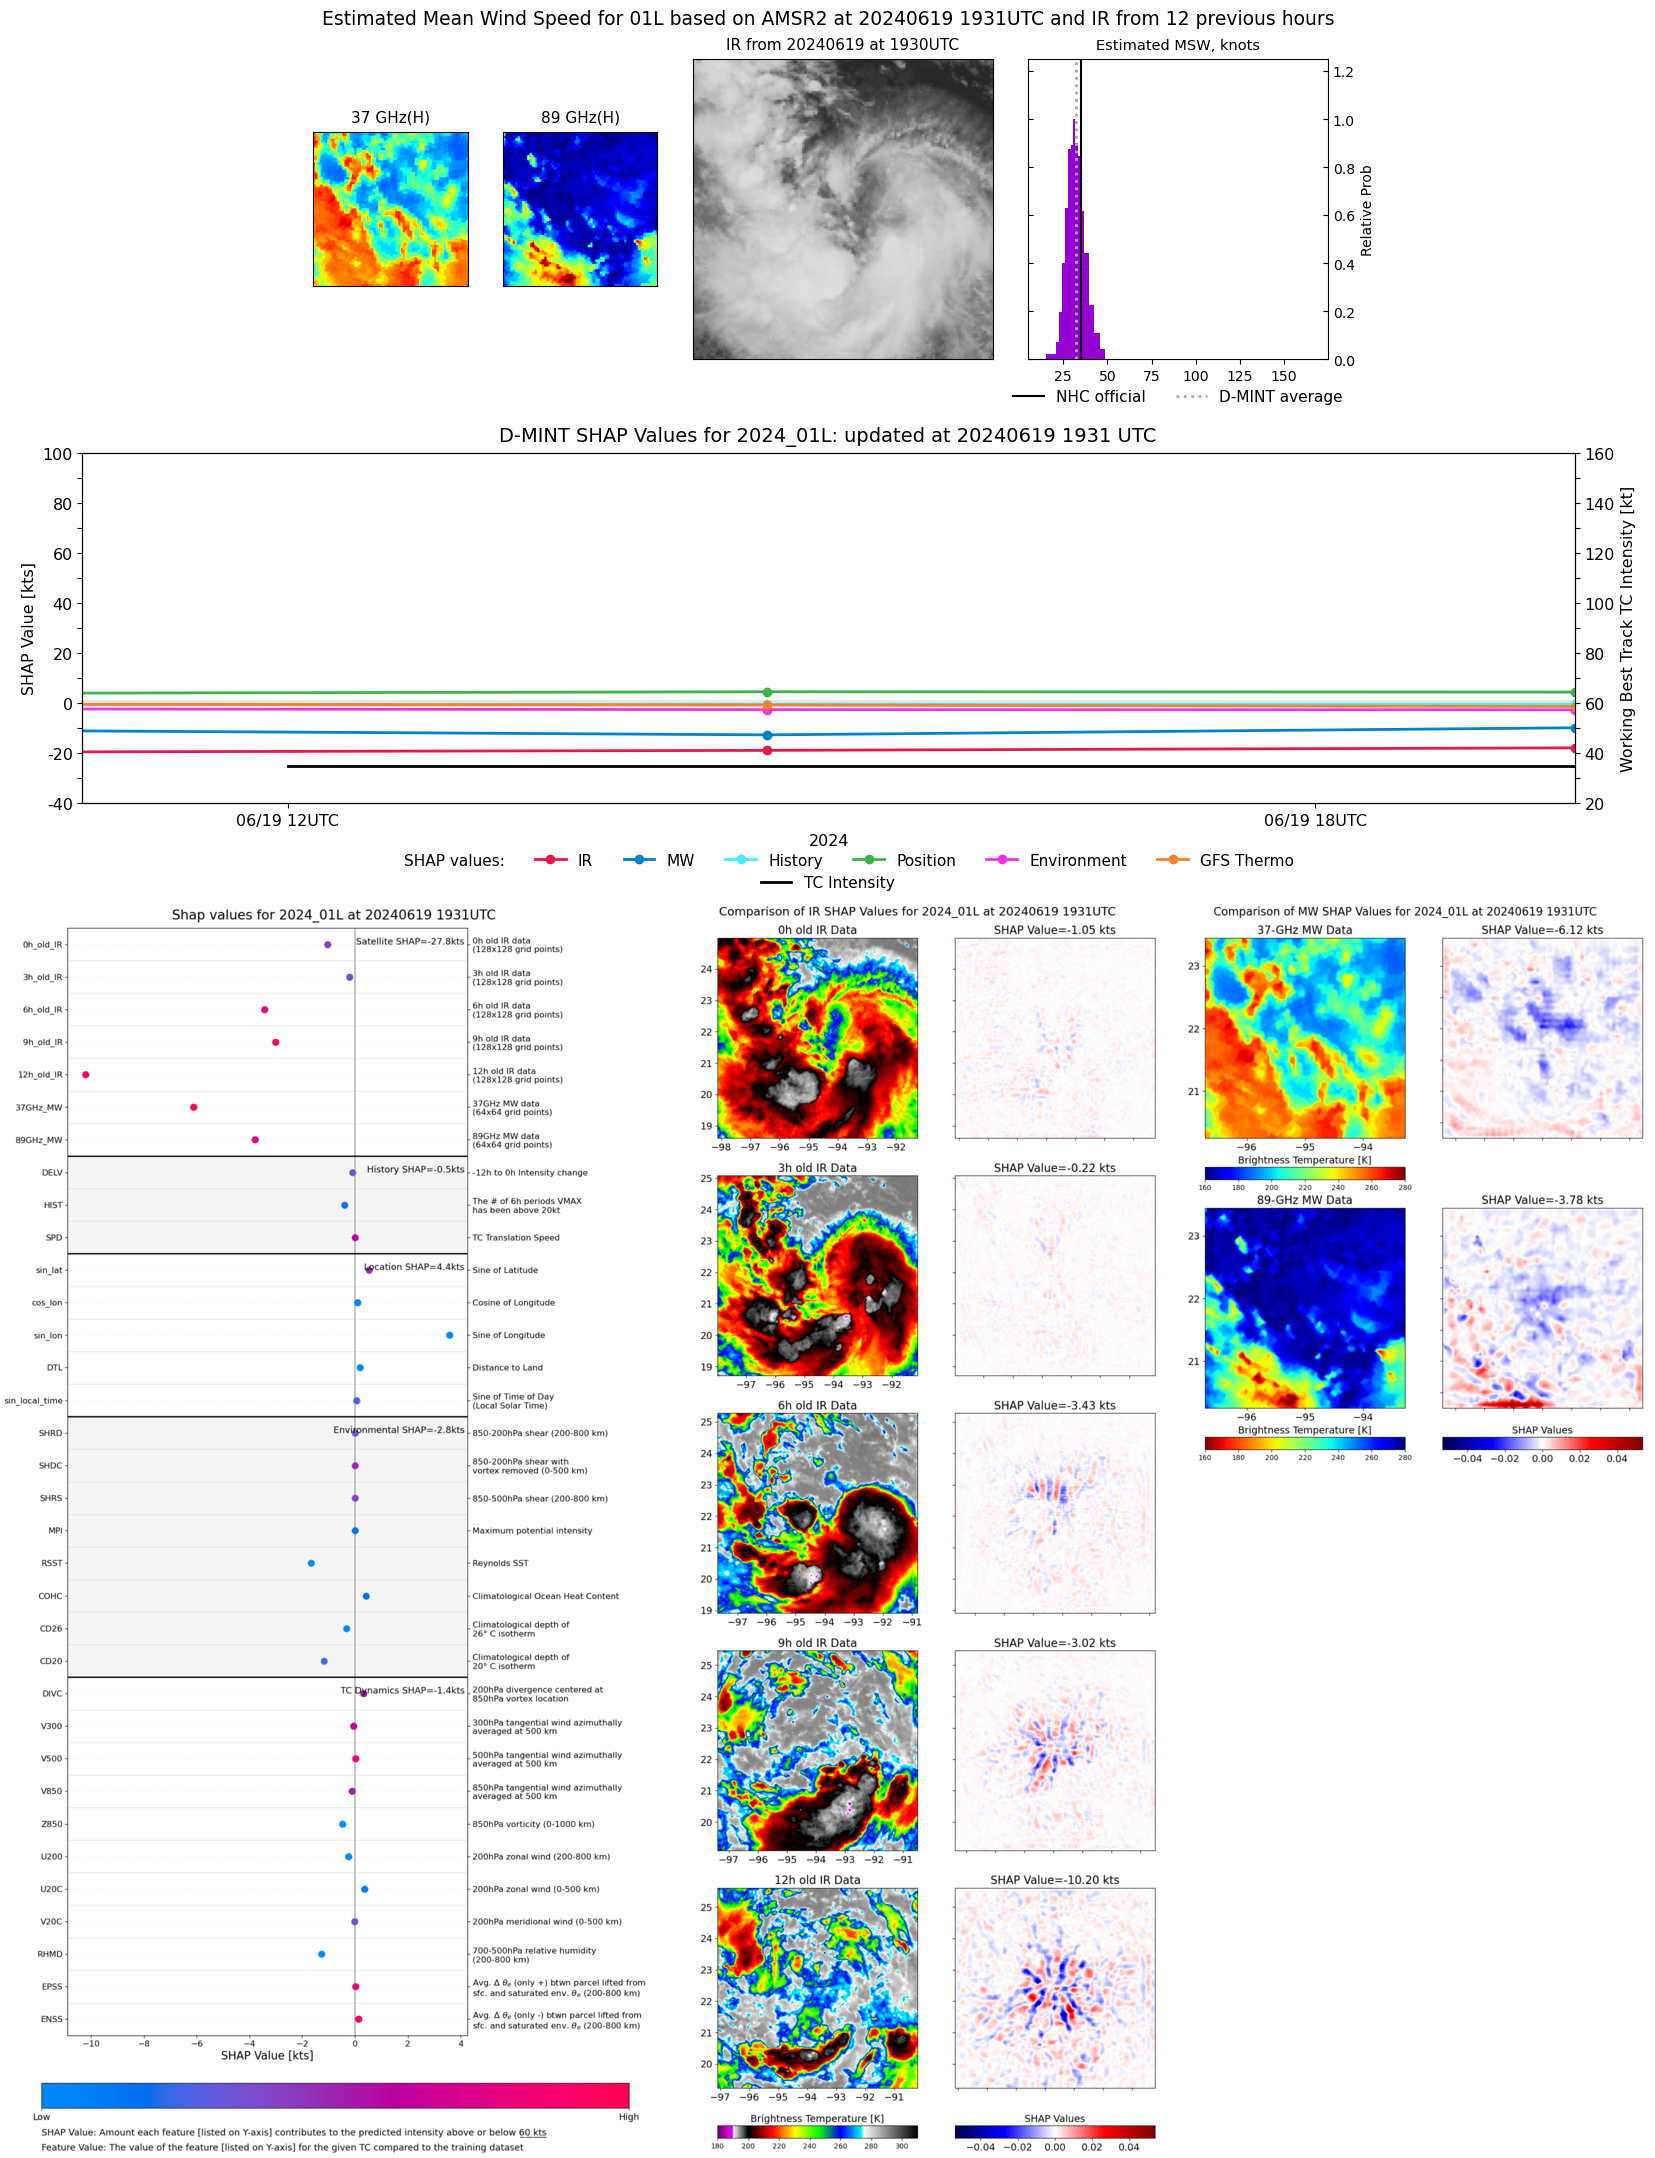 |
| 20240619 | 1905 UTC | ATMS | 1002 hPa | 30 kts | 27 kts | 35 kts | 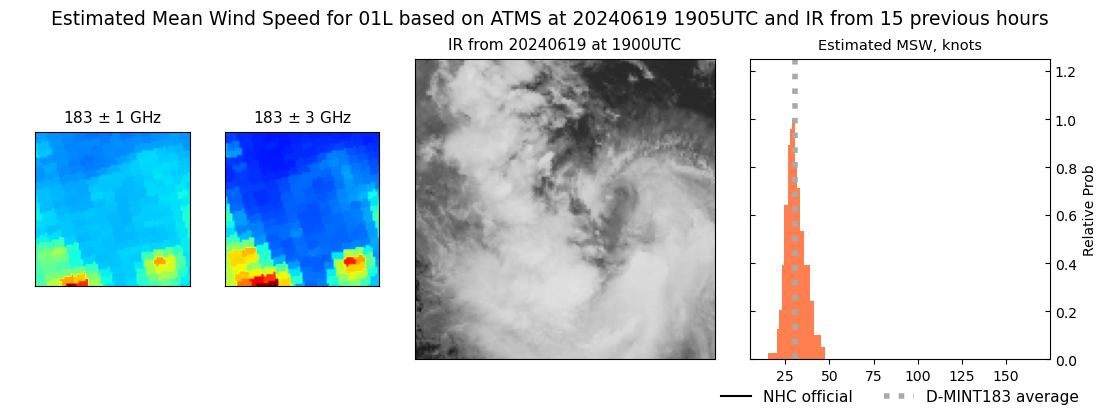 |
| 20240619 | 1448 UTC | GMI | NaN hPa | 29 kts | 27 kts | 32 kts | 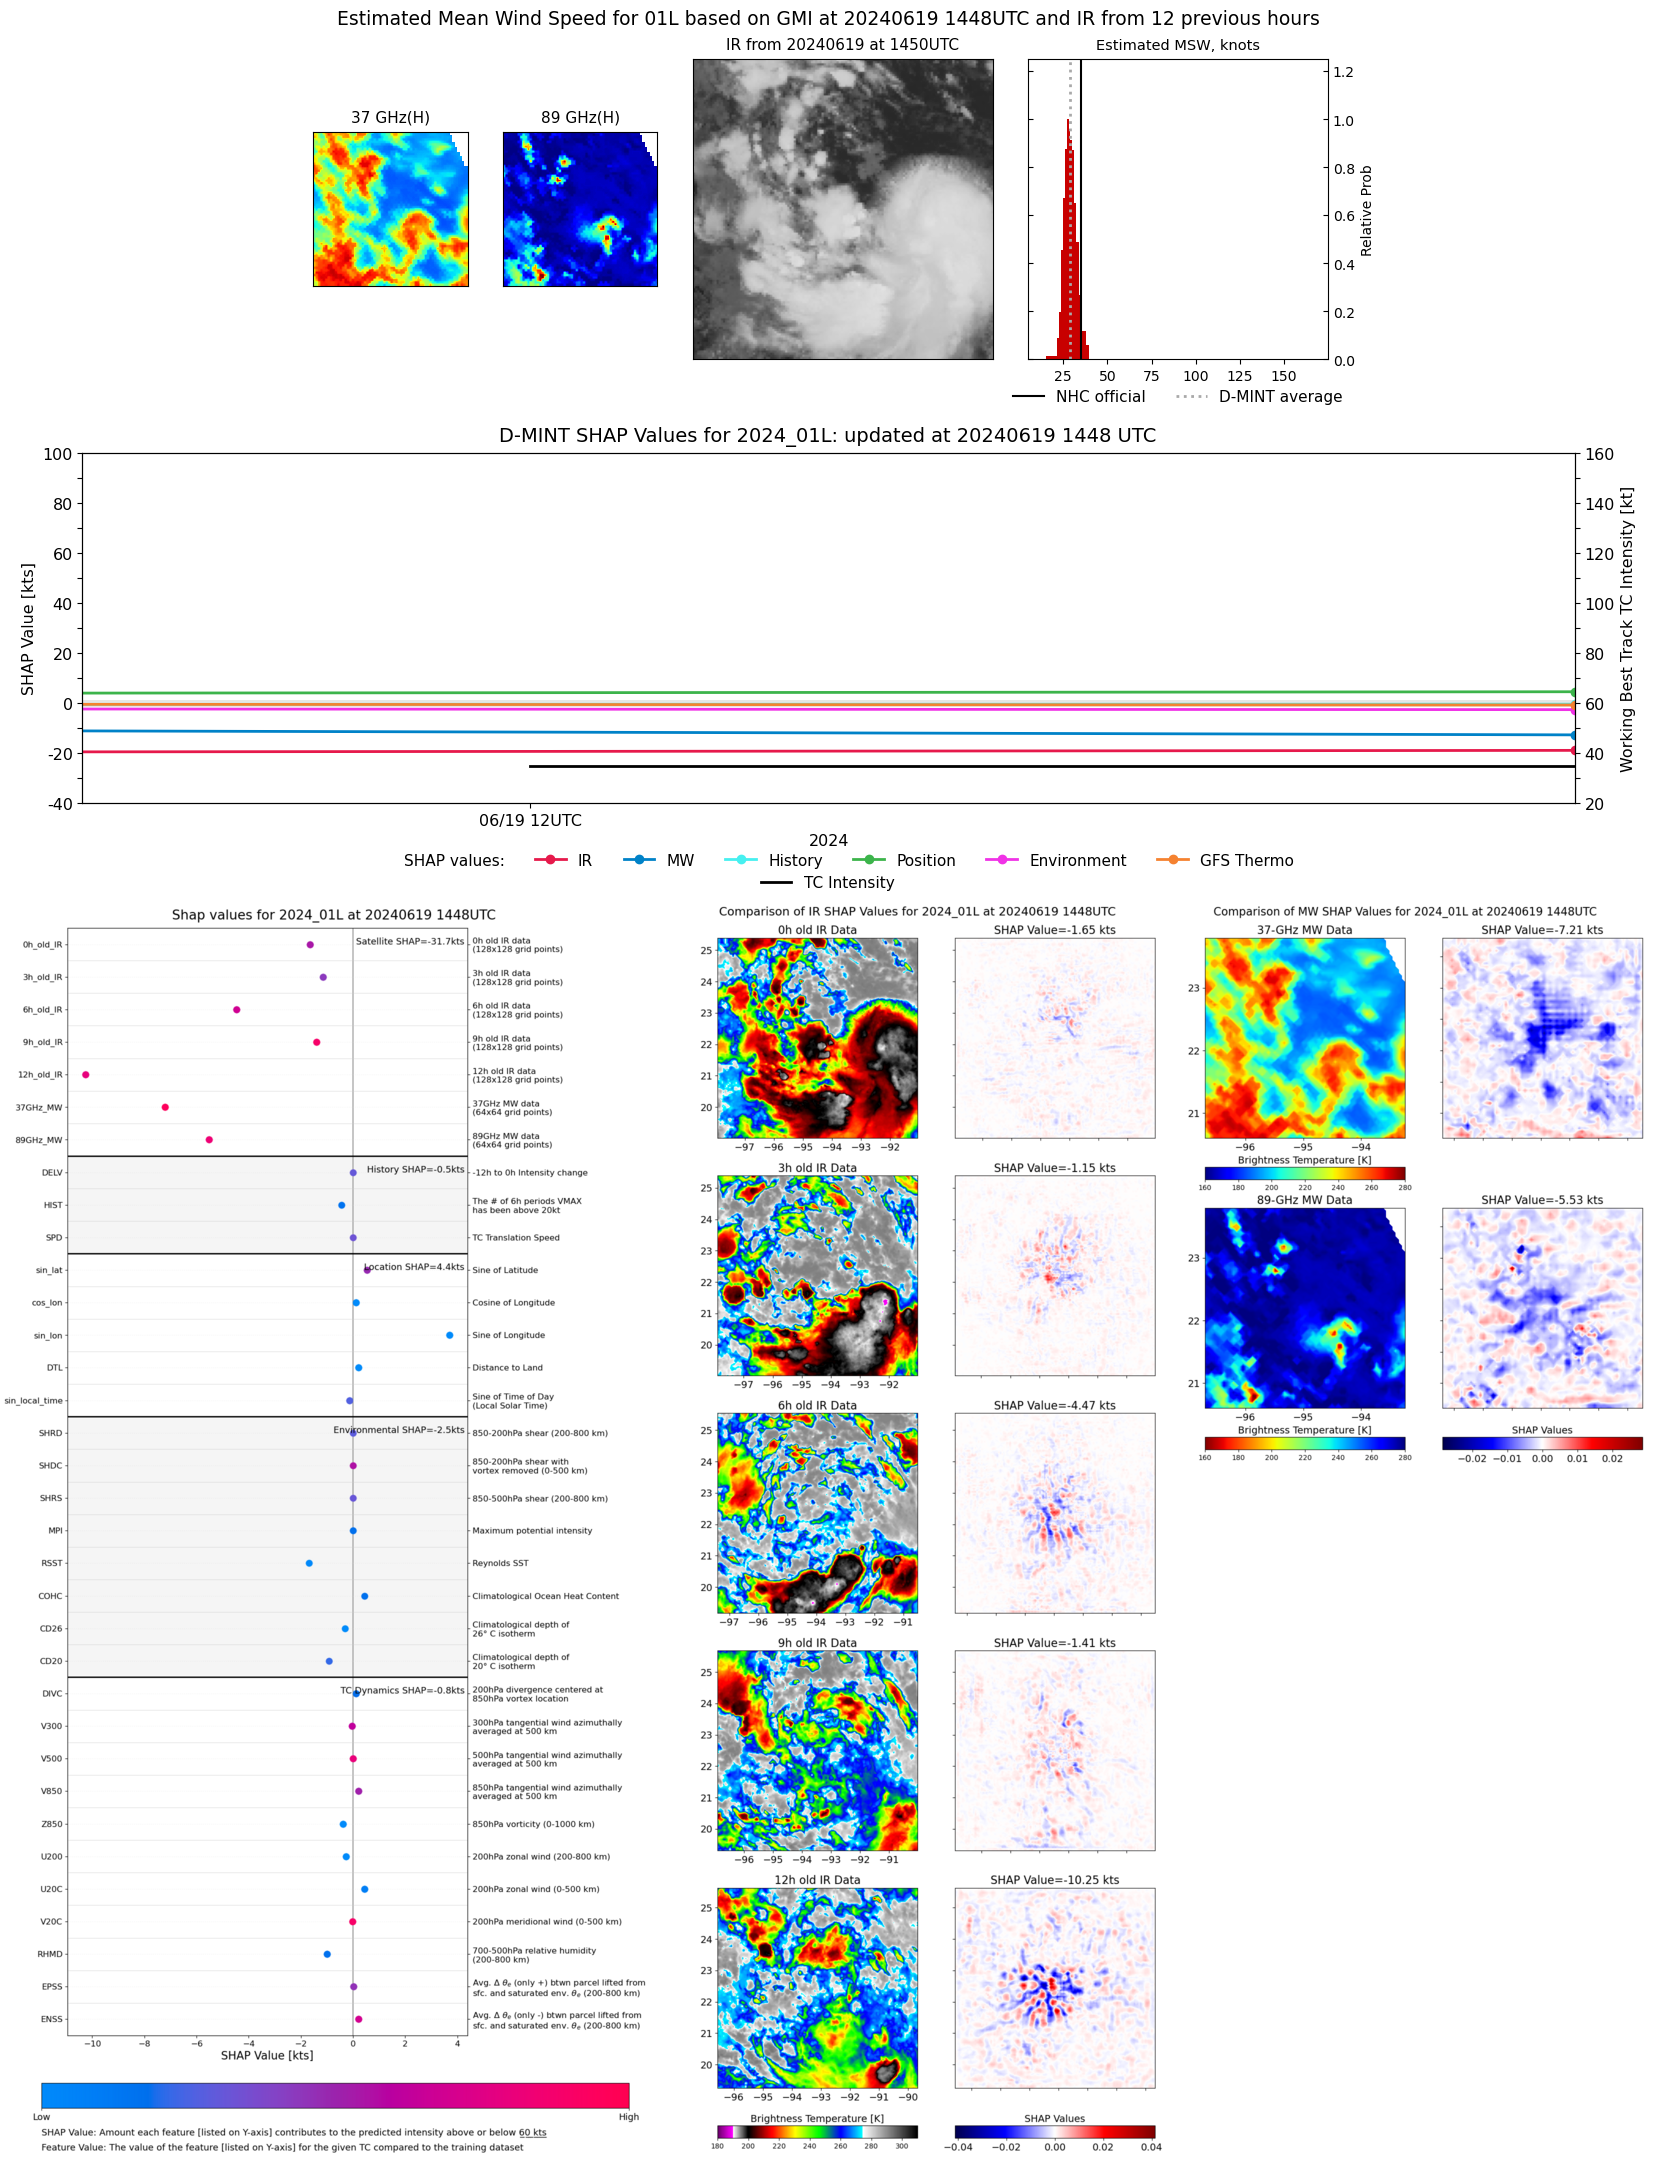 |
| 20240619 | 1311 UTC | SSMISF17 | NaN hPa | 31 kts | 28 kts | 34 kts | 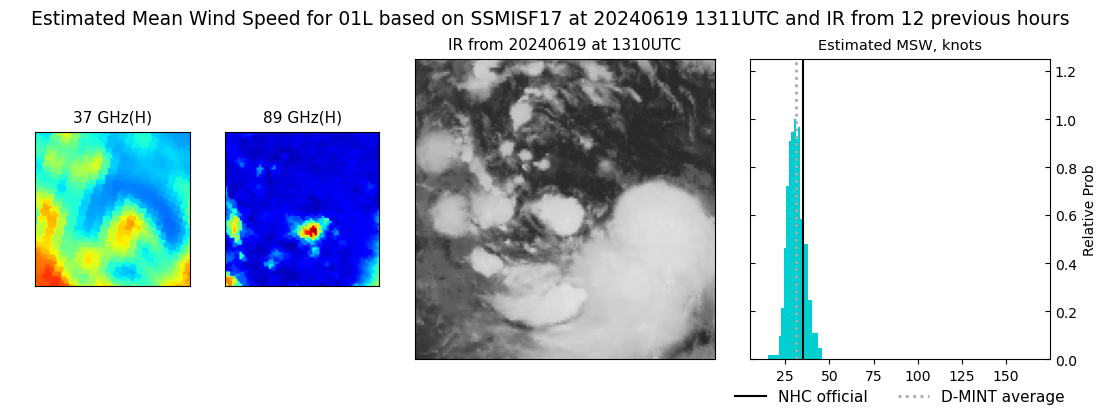 |
| 20240619 | 0958 UTC | SSMISF18 | NaN hPa | 30 kts | 27 kts | 33 kts | 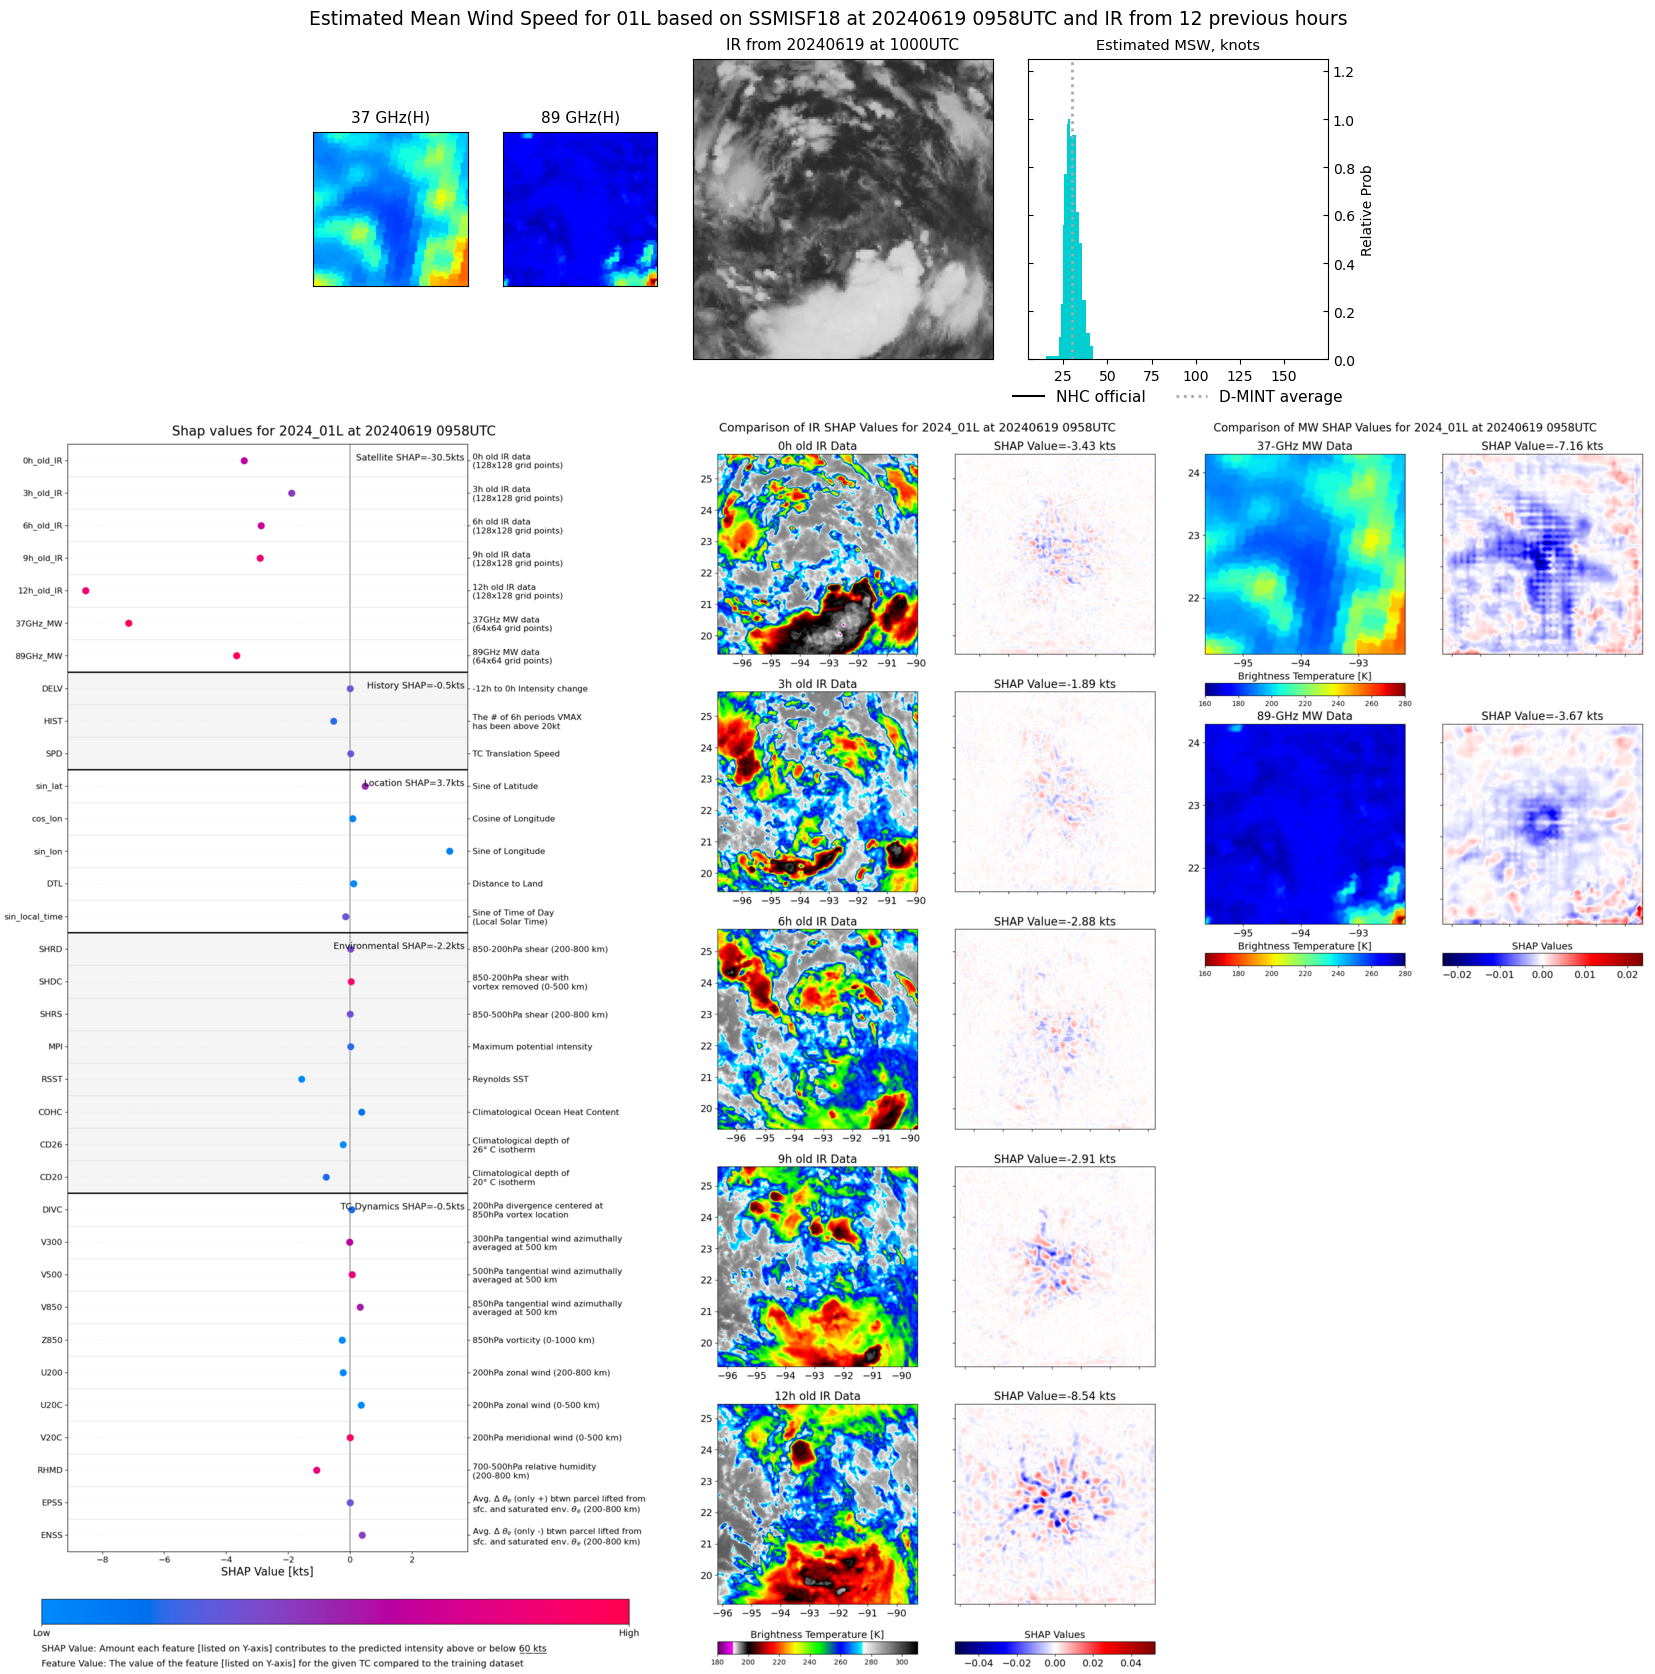 |
| 20240618 | 2127 UTC | SSMISF18 | NaN hPa | 30 kts | 27 kts | 33 kts | 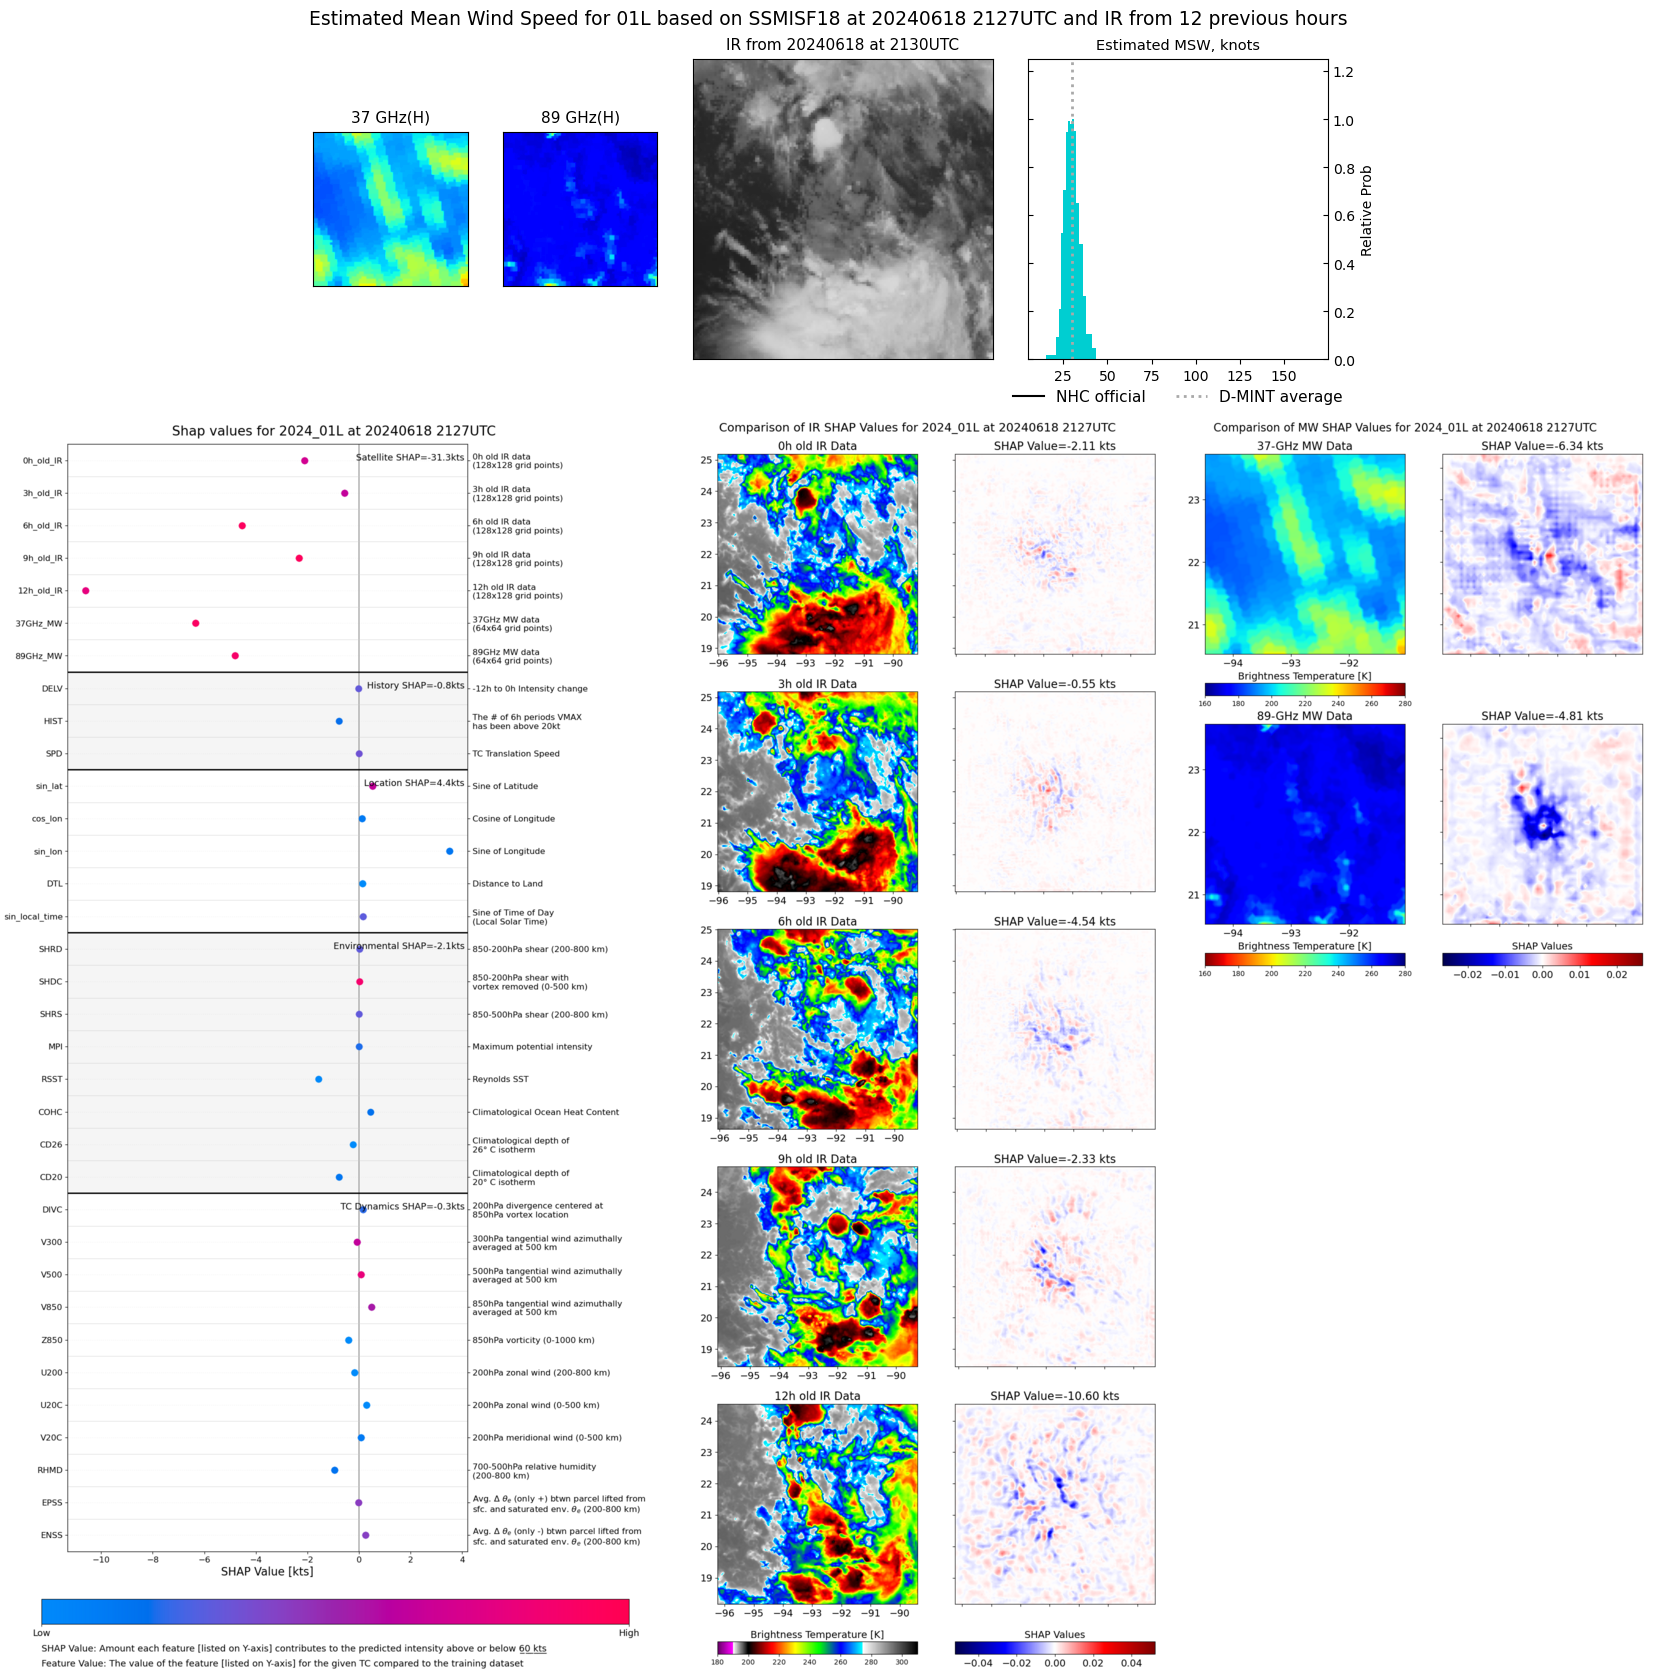 |
| 20240618 | 0753 UTC | AMSR2 | NaN hPa | 27 kts | 25 kts | 29 kts | 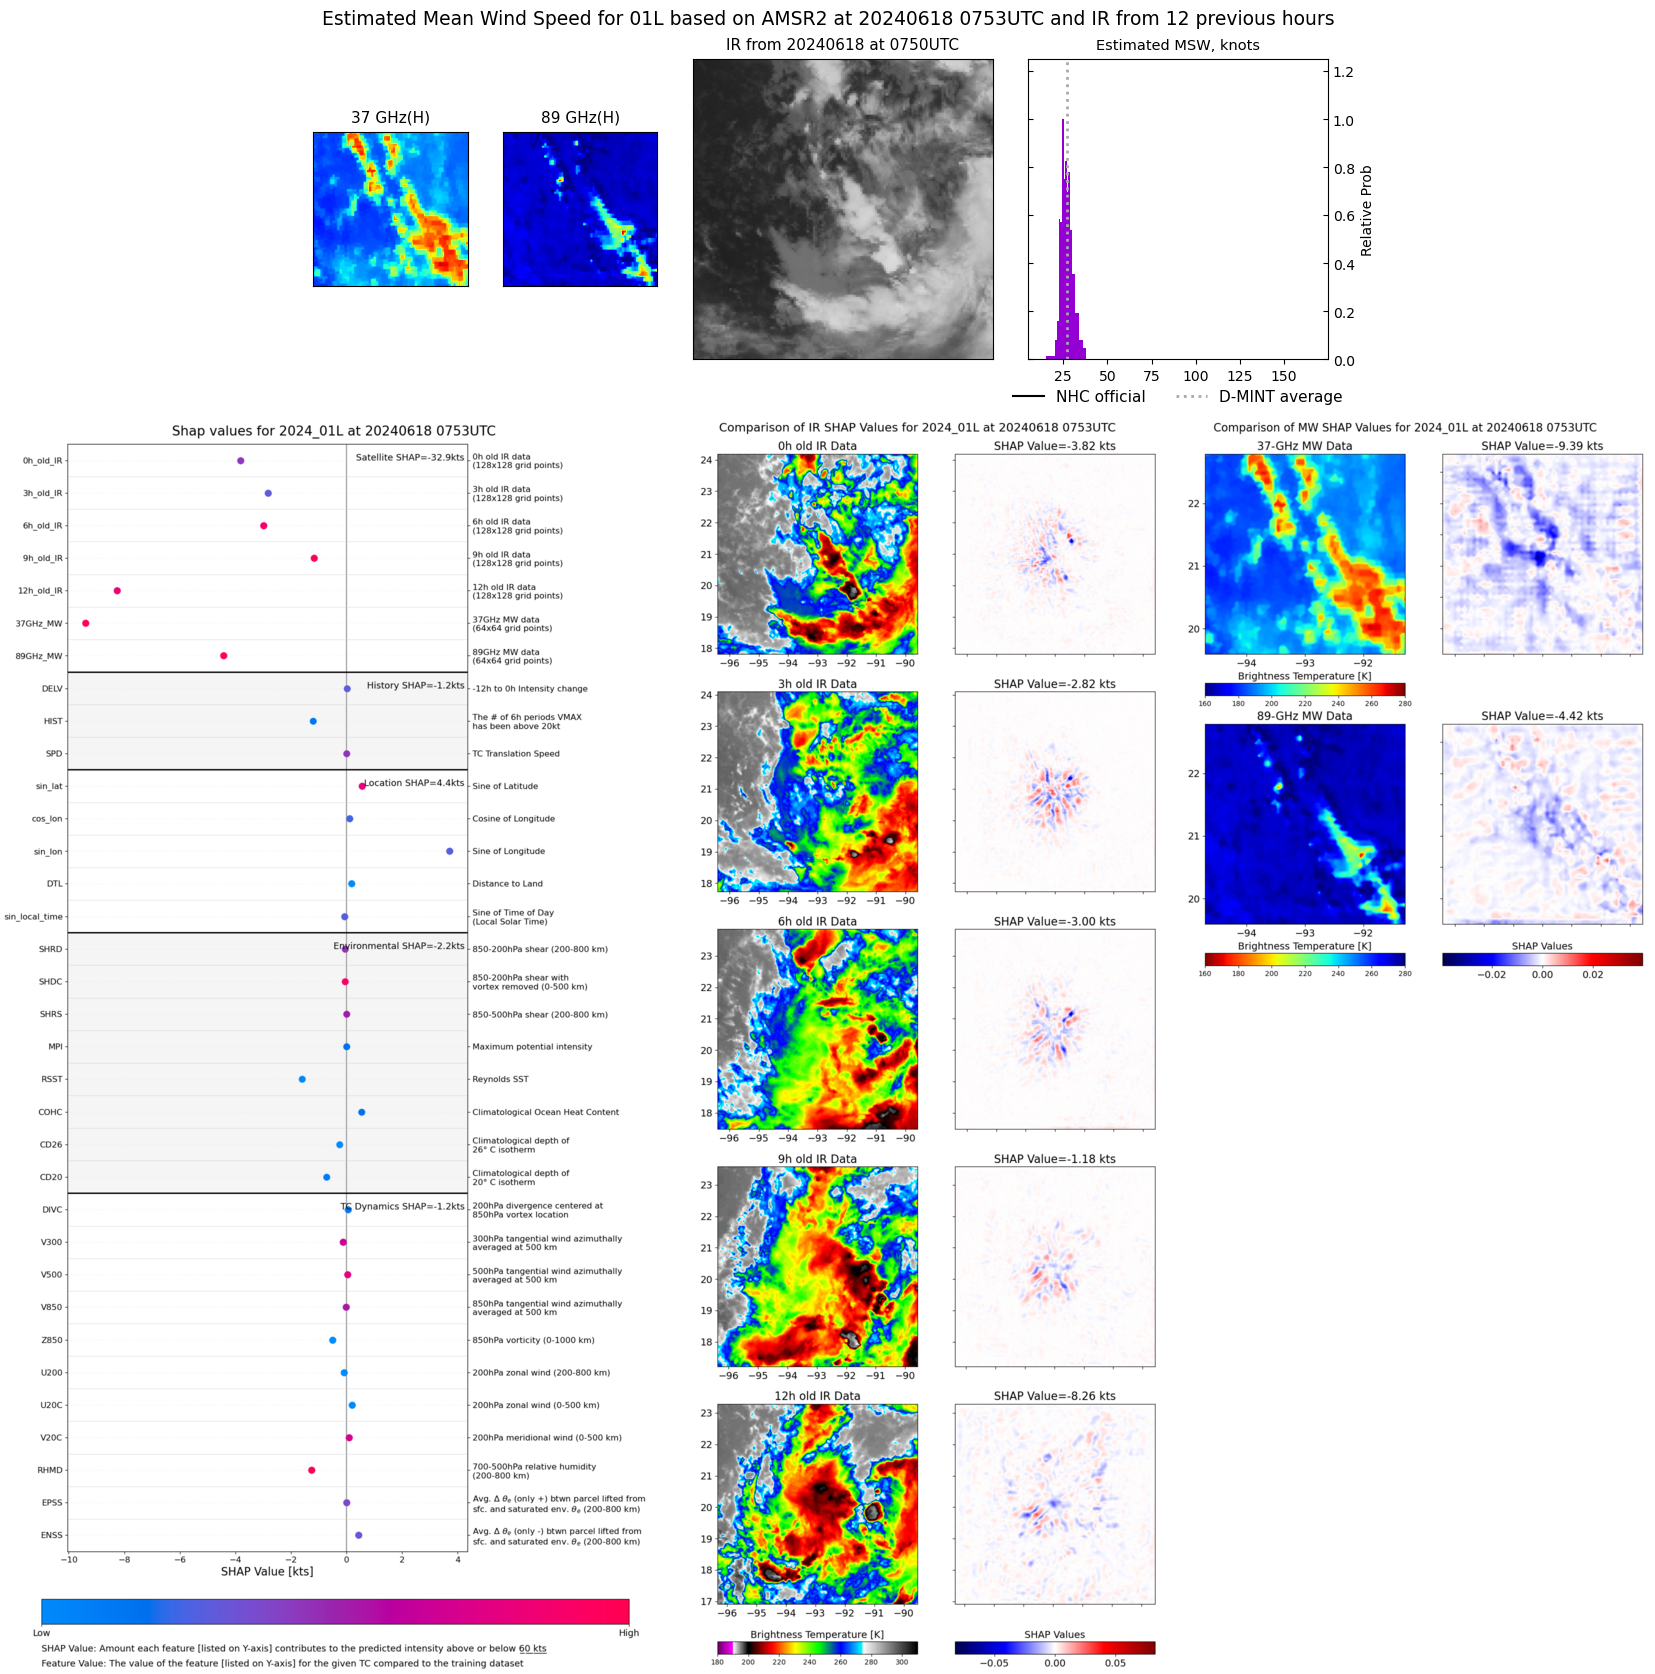 |
| 20240618 | 0409 UTC | GMI | NaN hPa | 29 kts | 26 kts | 32 kts | 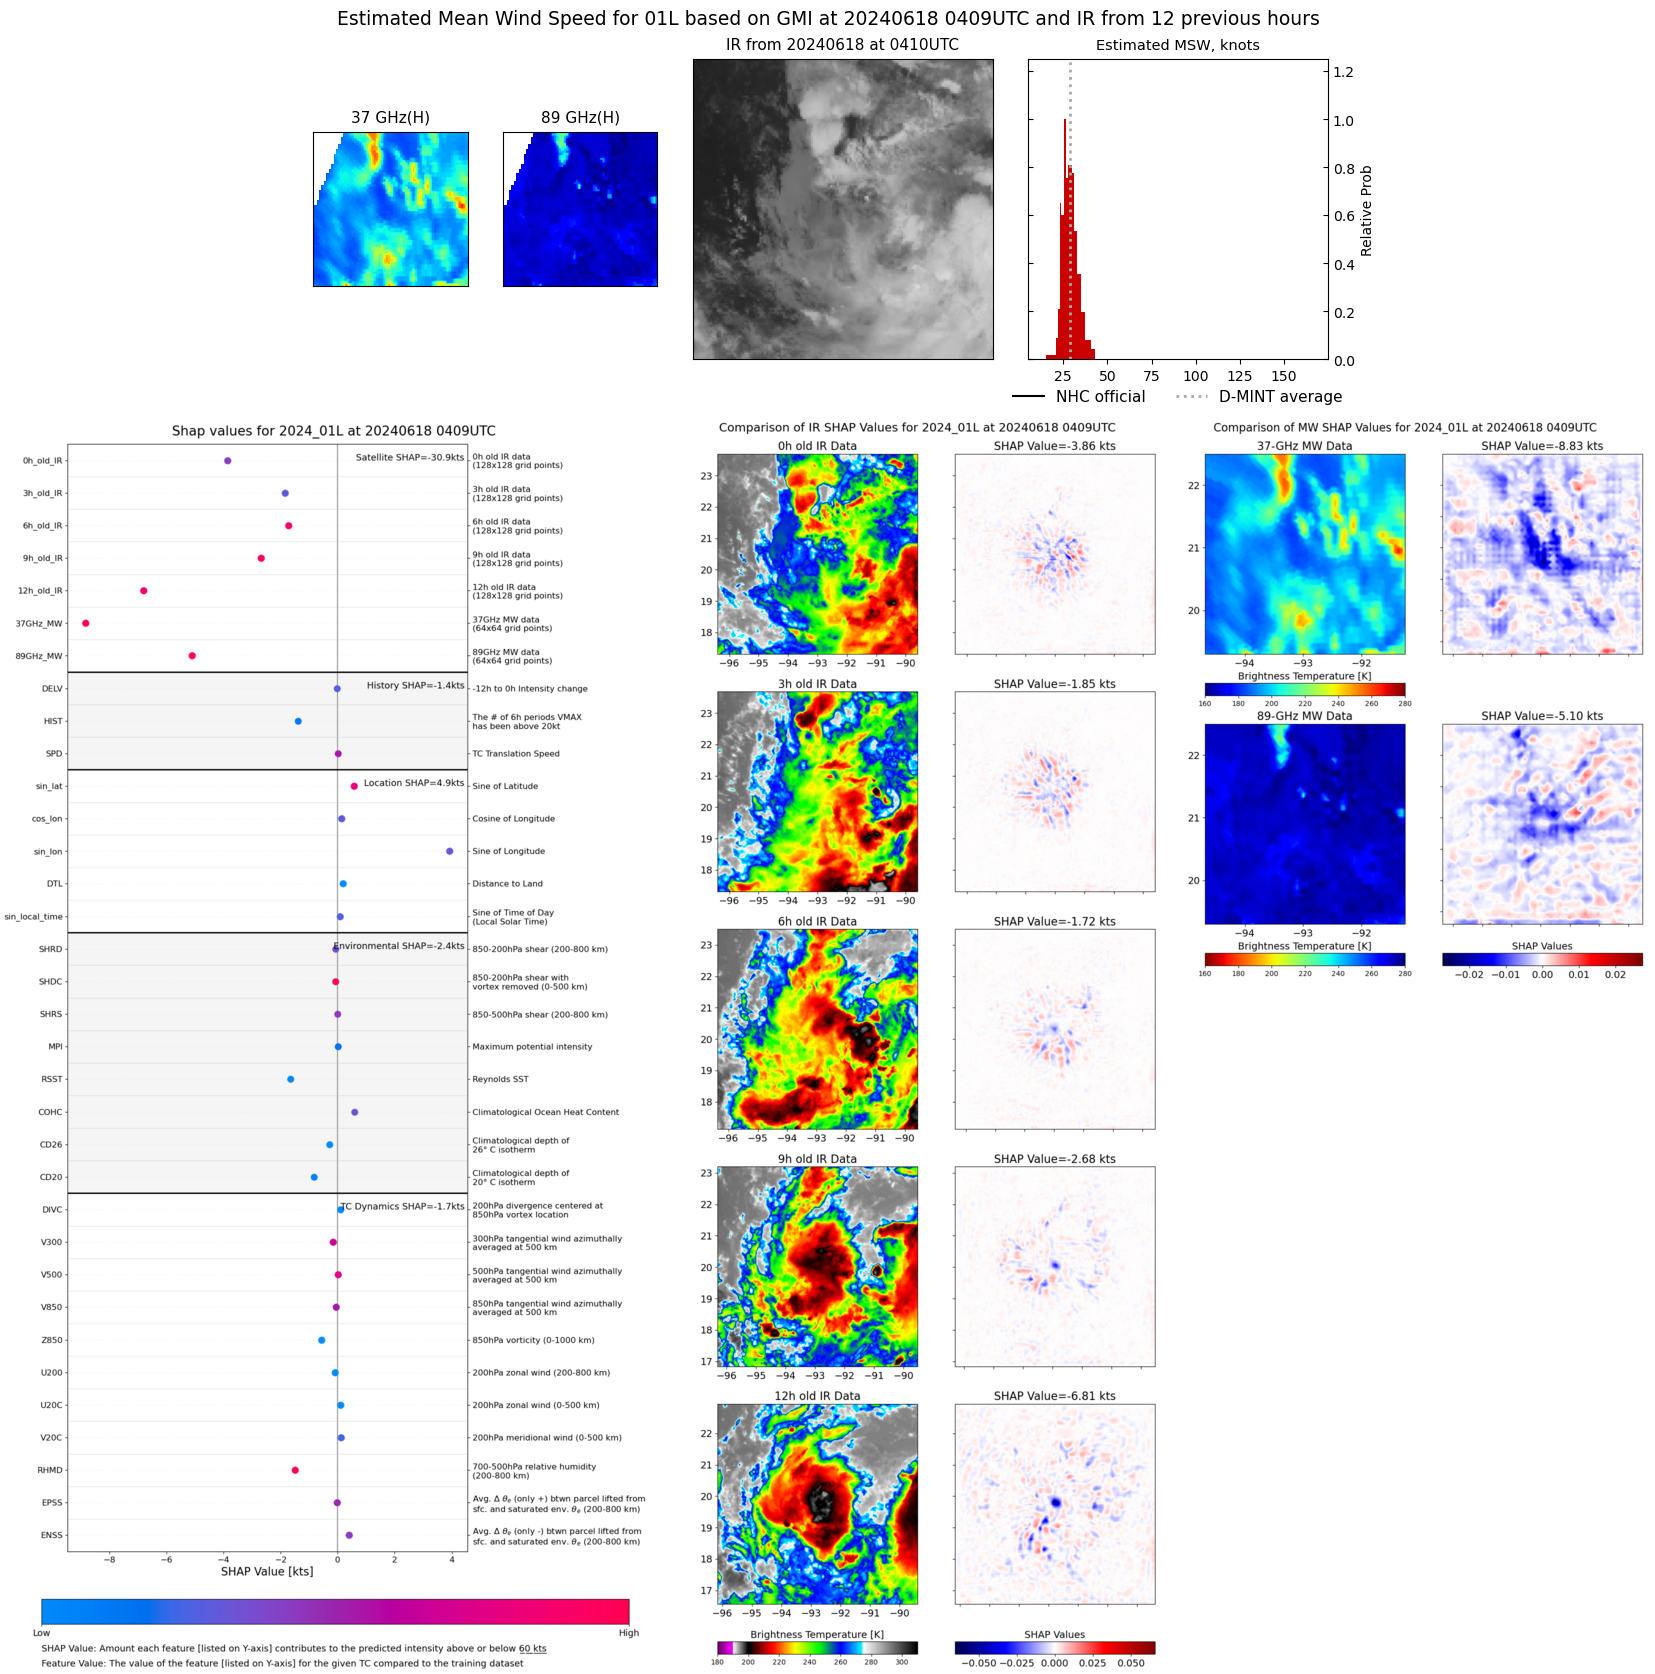 |
| 20240617 | 2344 UTC | SSMISF16 | -2 hPa | 25 kts | 23 kts | 28 kts | 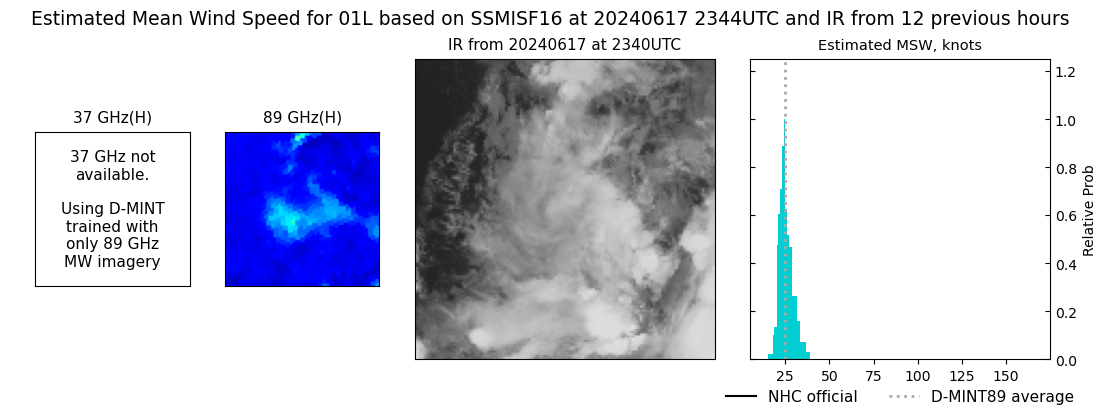 |
| 20240617 | 2140 UTC | SSMISF18 | NaN hPa | 30 kts | 26 kts | 35 kts | 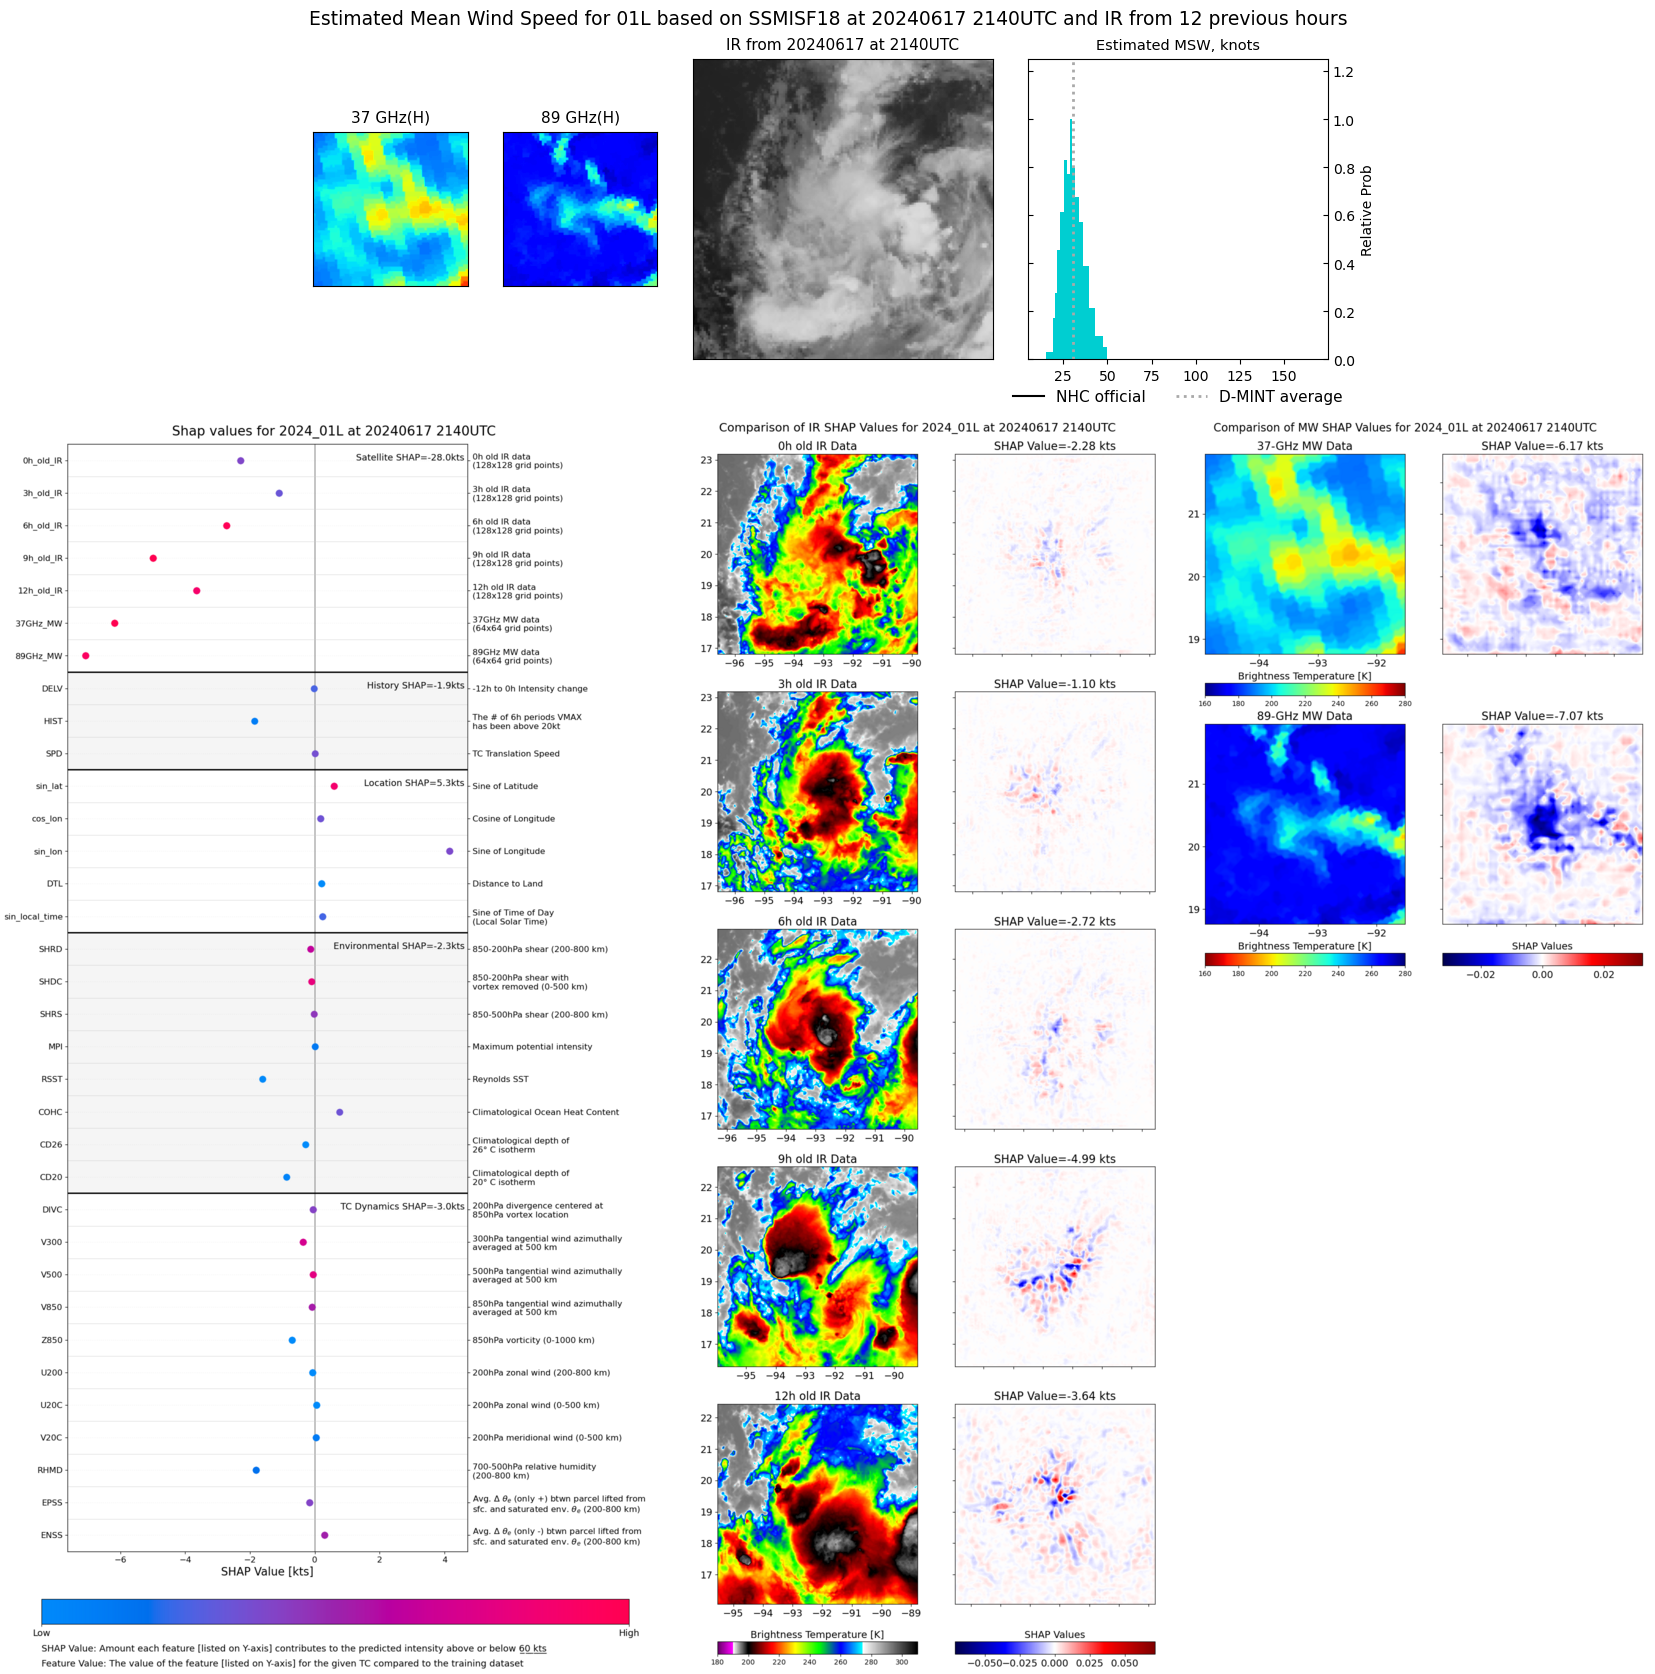 |
| 20240617 | 1230 UTC | SSMISF16 | NaN hPa | 23 kts | 21 kts | 26 kts |  |