|
||
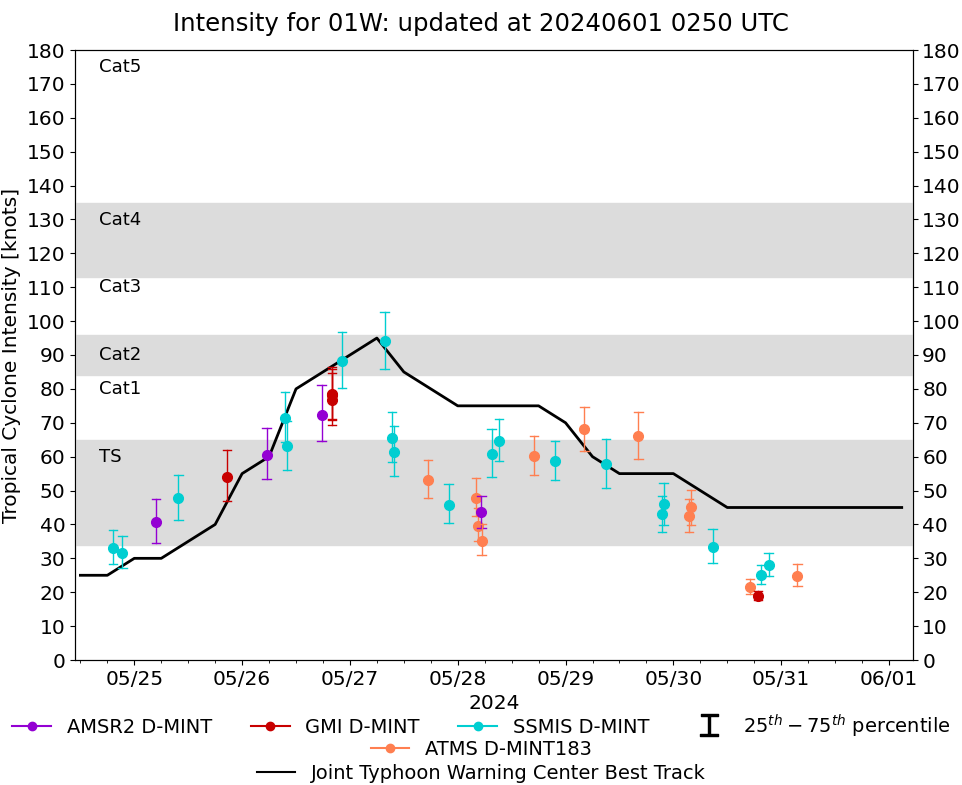 |
D-MINT HISTORY FILE for 2024_01W
| Date | Time | MW Sensor | MSLP | Vmax (30th-70th percentile average) | Vmax 25th percentile | Vmax 75th percentile | Image |
| 20240531 | 0336 UTC | ATMS | 1002 hPa | 25 kts | 22 kts | 28 kts | 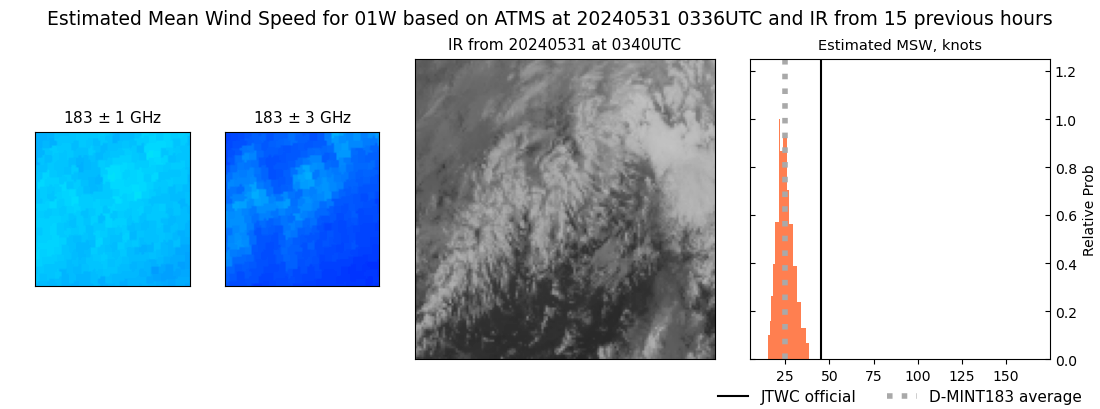 |
| 20240530 | 2111 UTC | SSMISF17 | 1003 hPa | 28 kts | 25 kts | 32 kts | 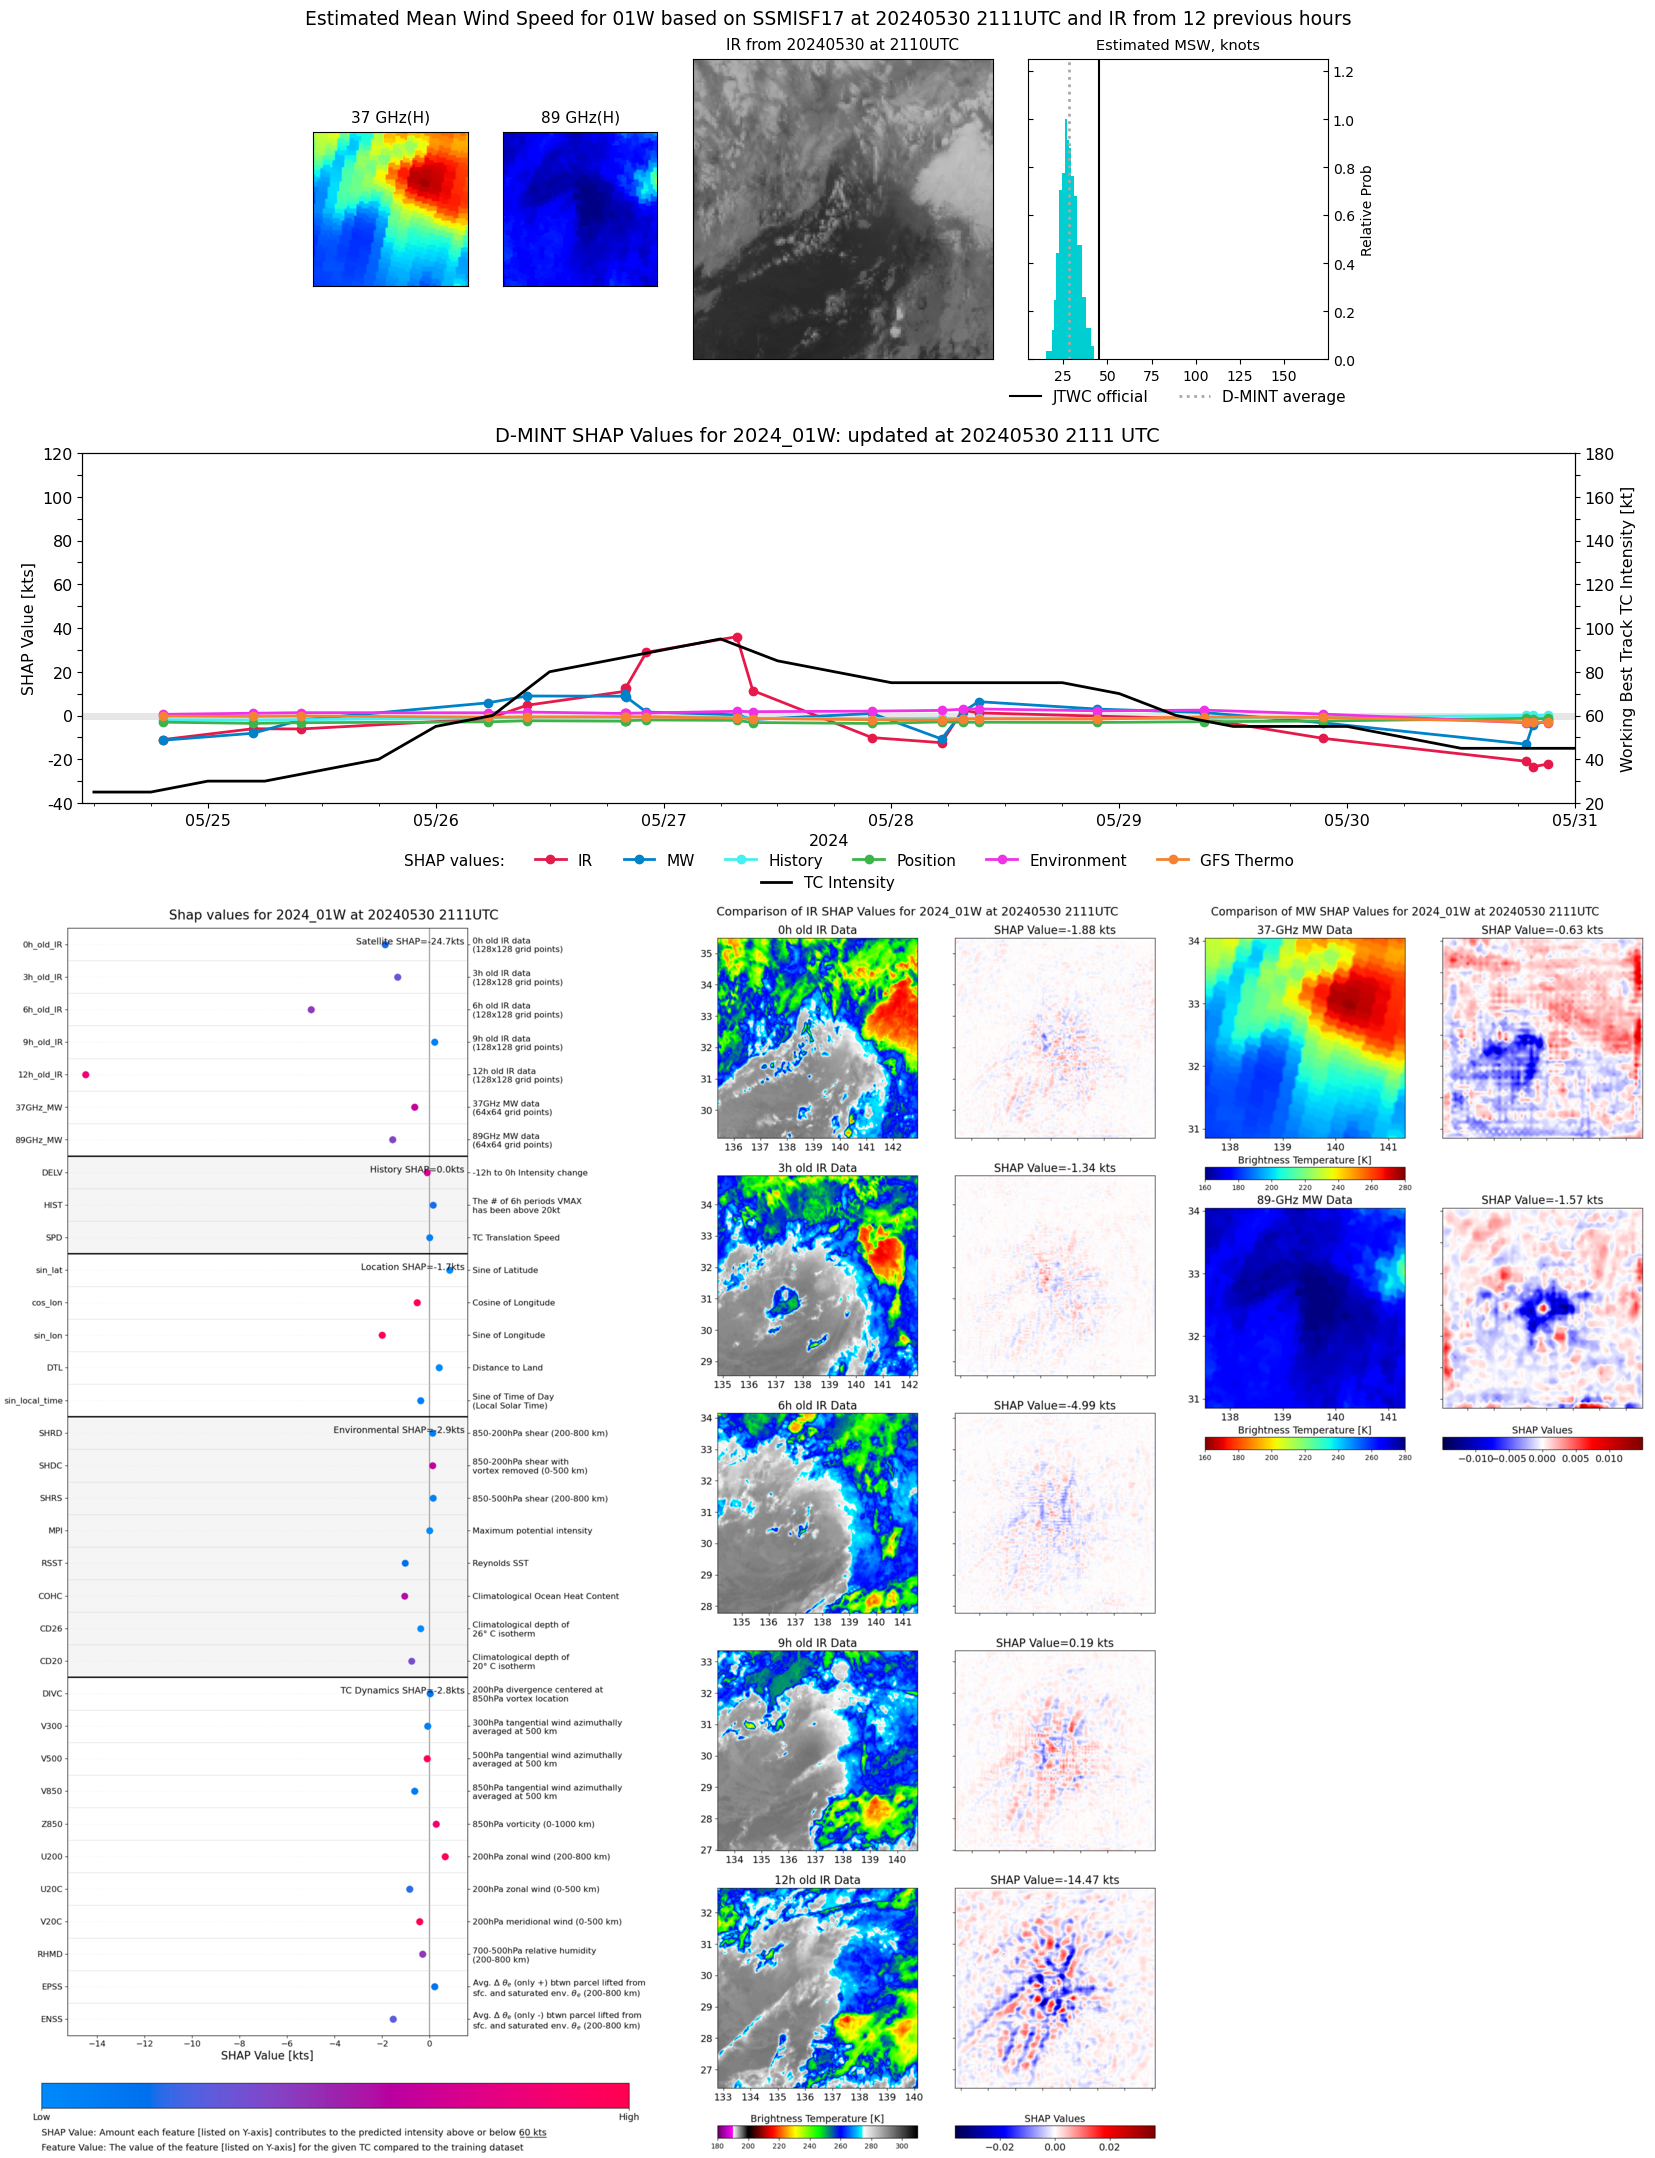 |
| 20240530 | 1933 UTC | SSMISF18 | 1006 hPa | 25 kts | 22 kts | 28 kts | 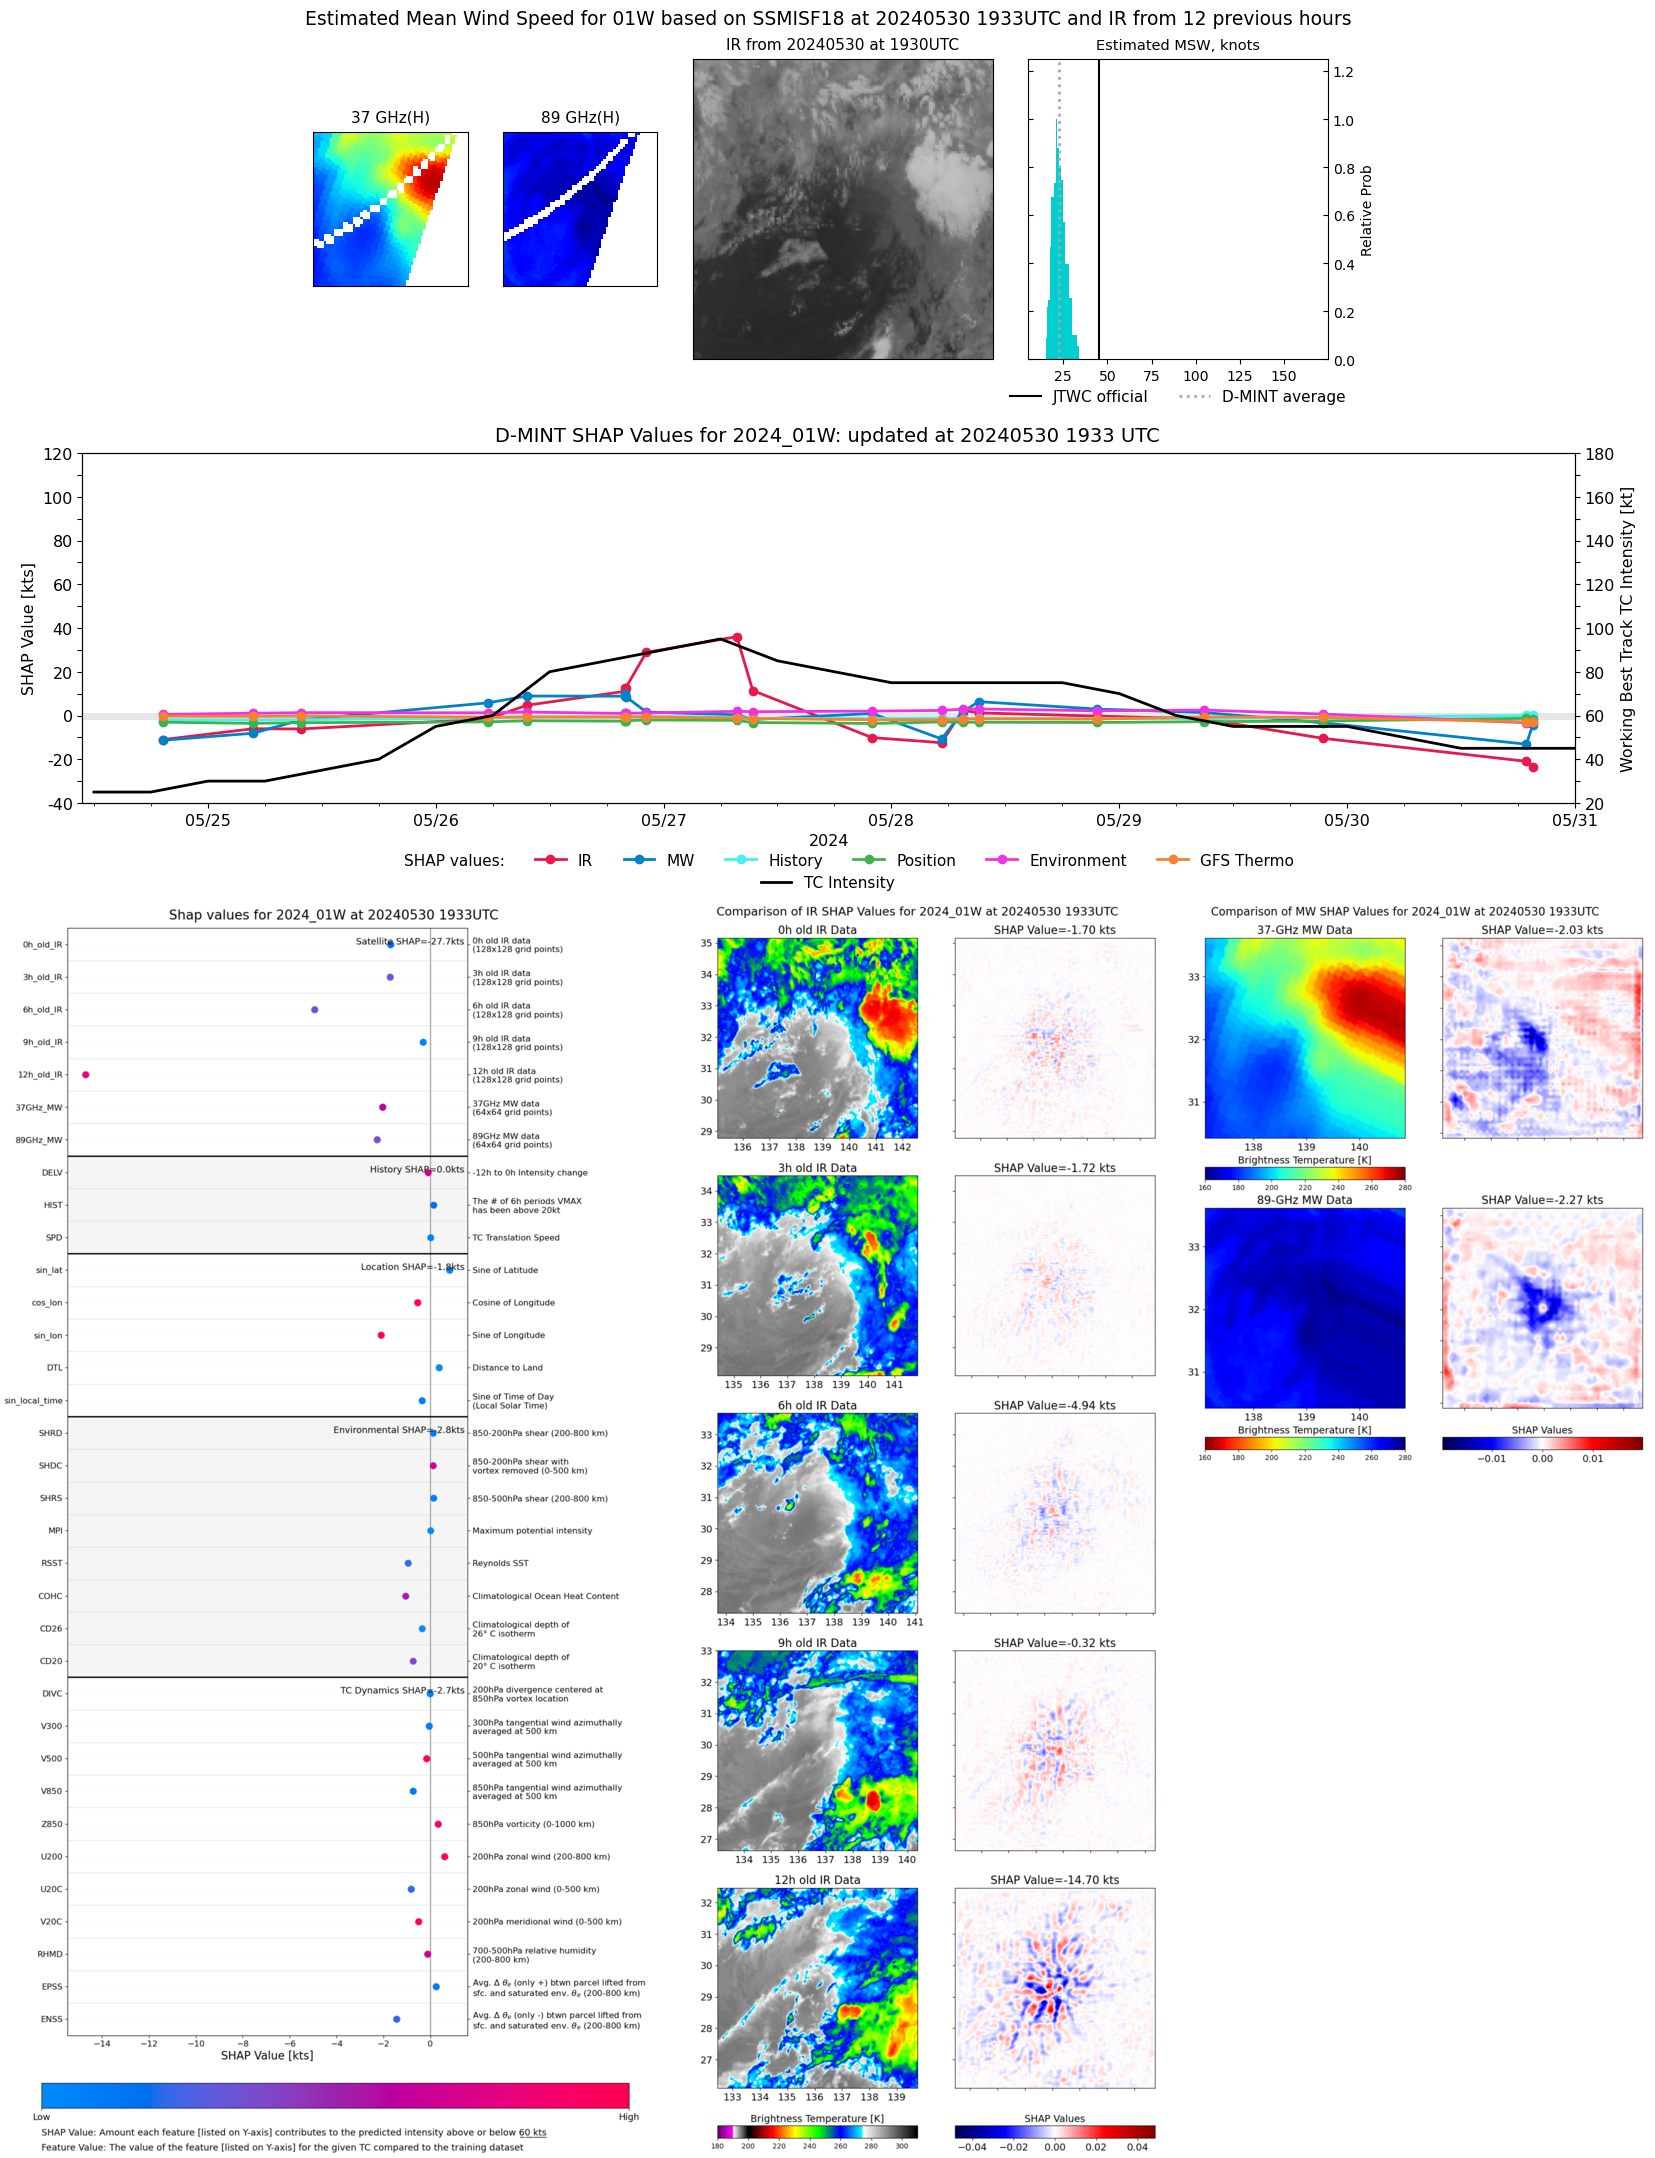 |
| 20240530 | 1853 UTC | GMI | 1007 hPa | 19 kts | 18 kts | 20 kts | 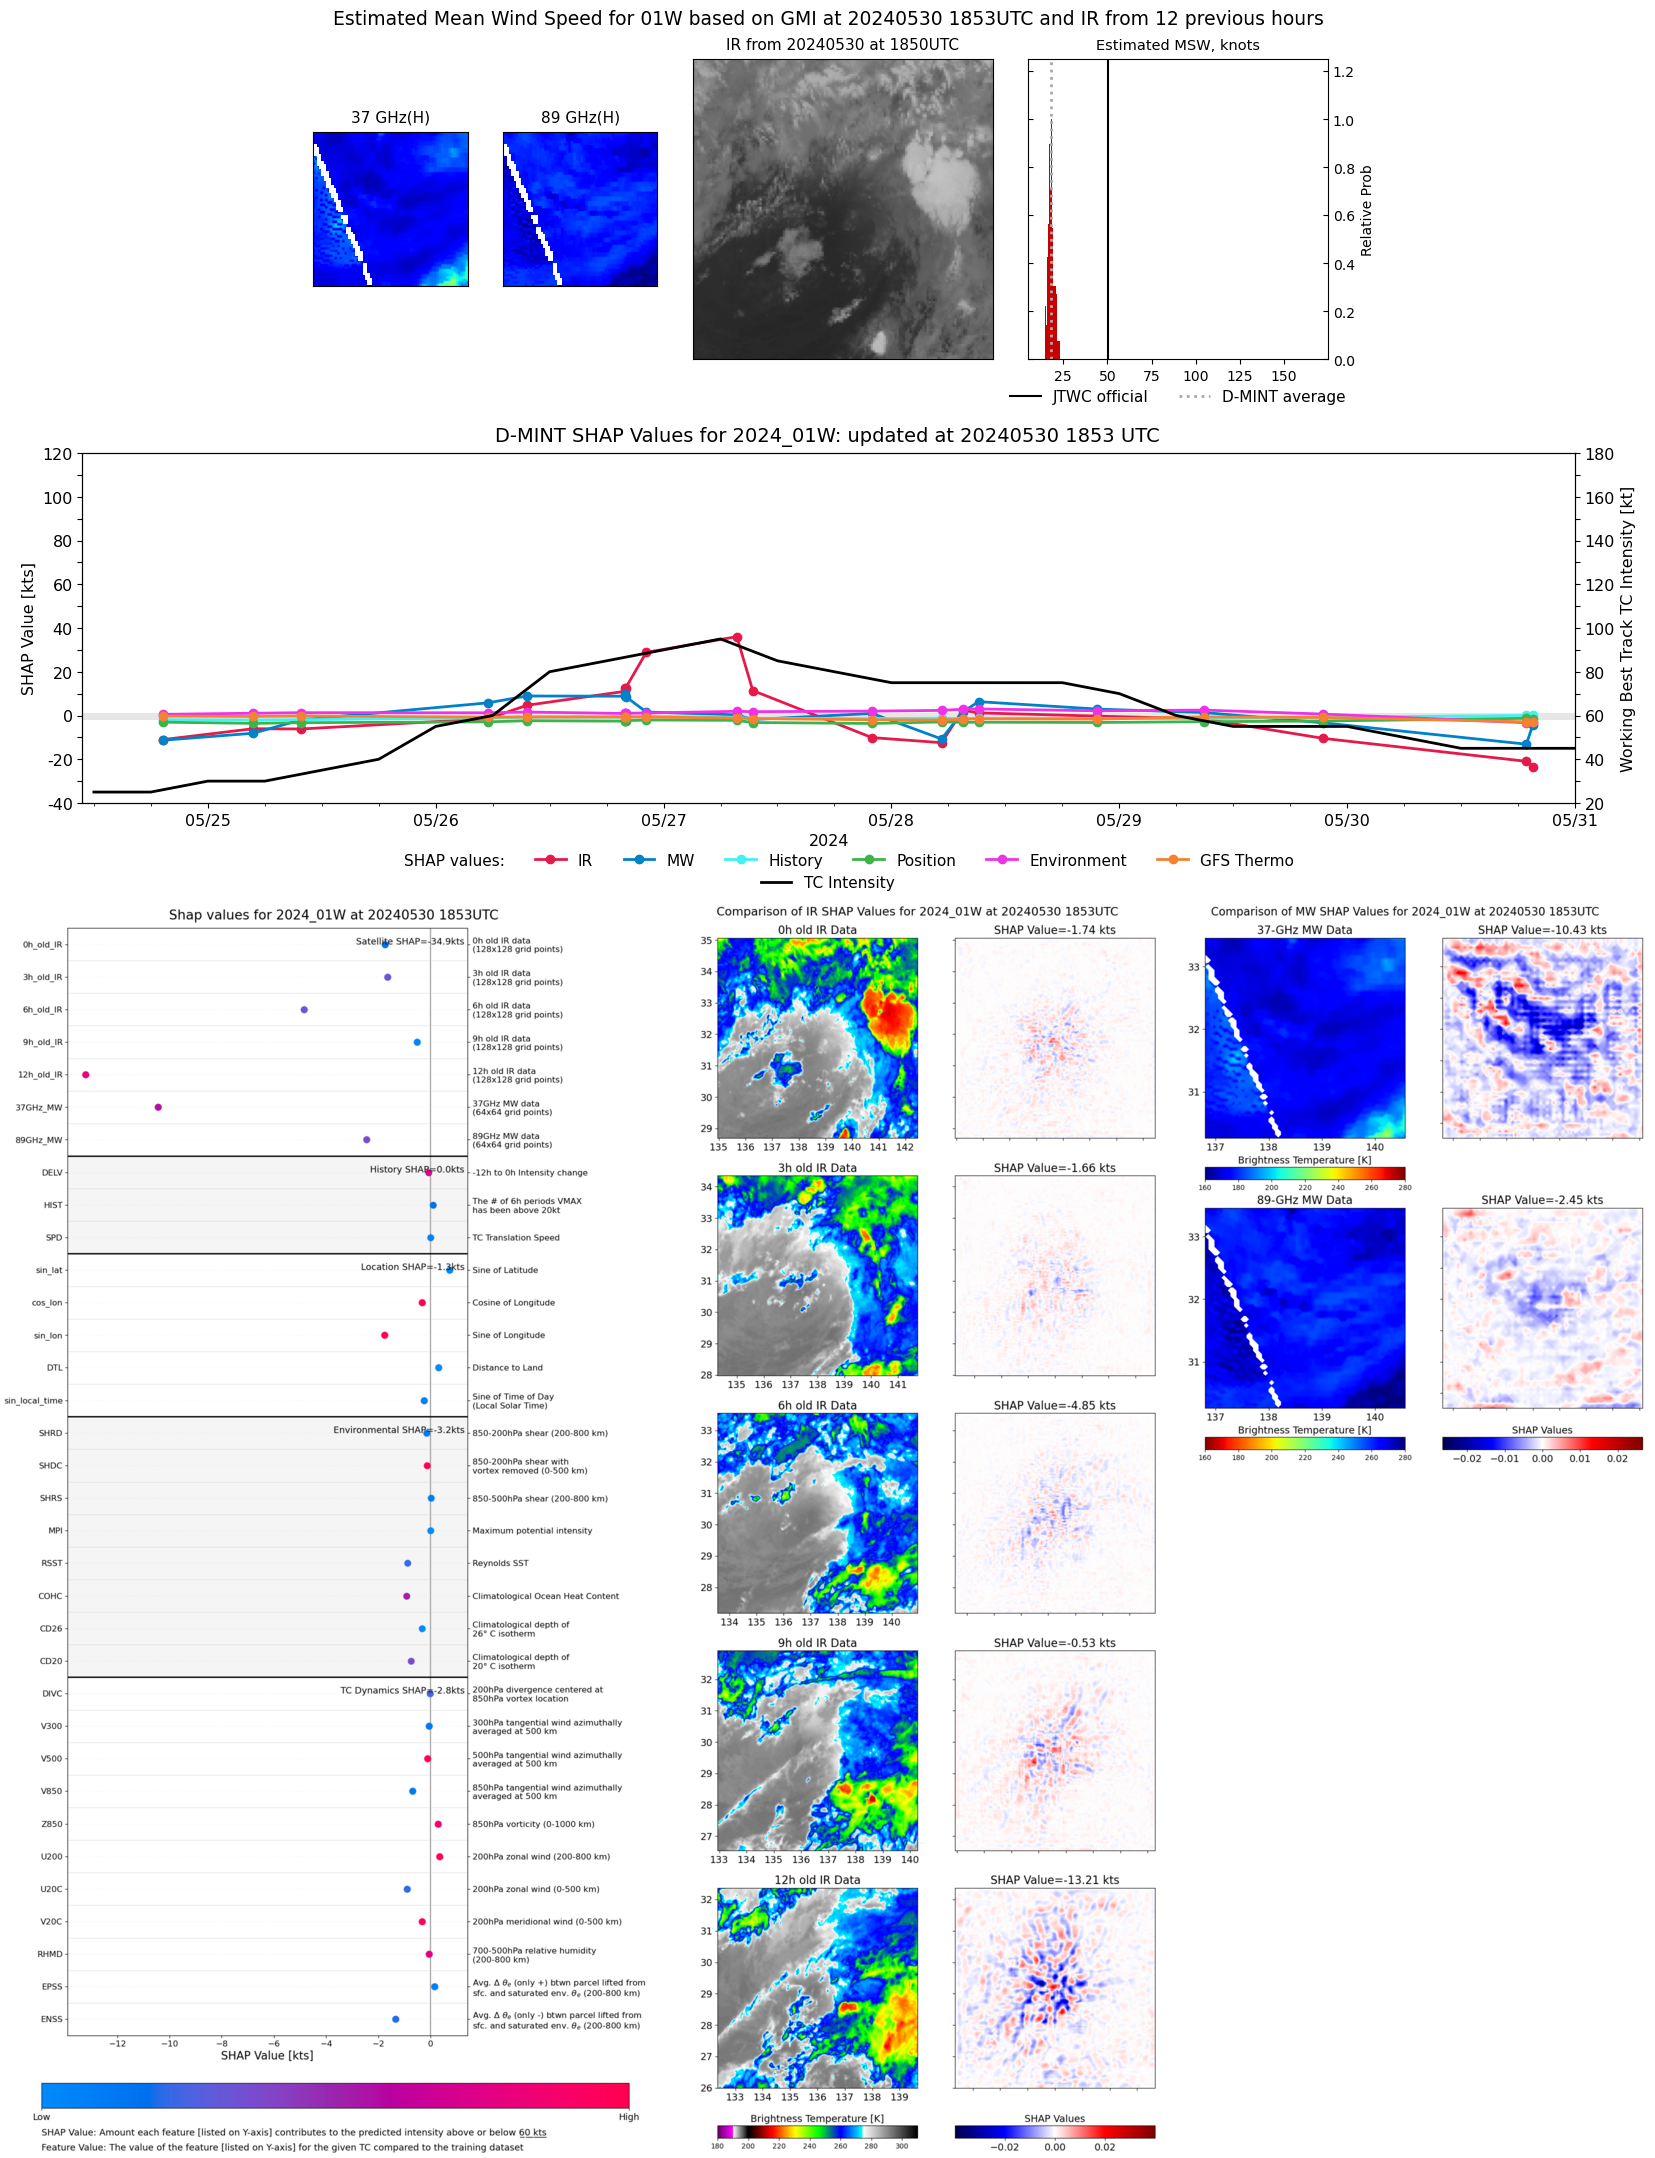 |
| 20240530 | 1707 UTC | ATMS | 1007 hPa | 22 kts | 19 kts | 24 kts | 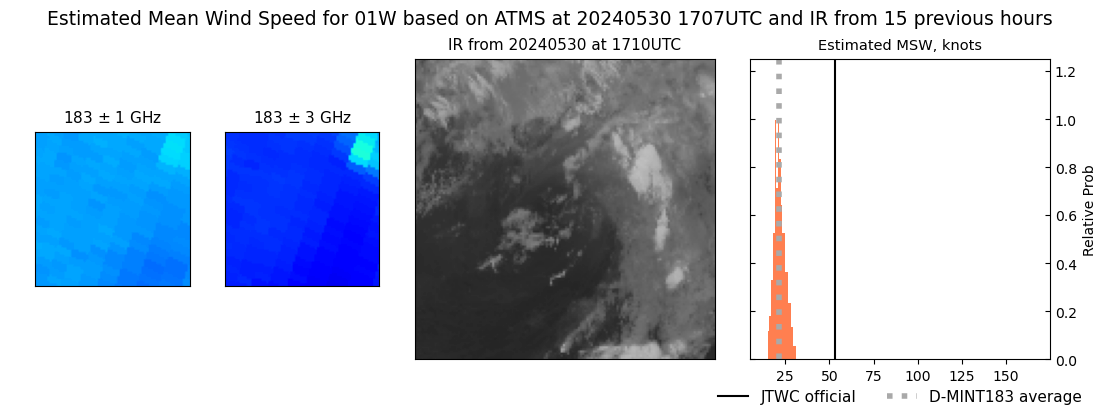 |
| 20240530 | 0845 UTC | SSMISF17 | 1003 hPa | 33 kts | 29 kts | 39 kts |  |
| 20240530 | 0354 UTC | ATMS | 994 hPa | 45 kts | 40 kts | 50 kts |  |
| 20240530 | 0329 UTC | ATMS | 995 hPa | 43 kts | 38 kts | 48 kts | 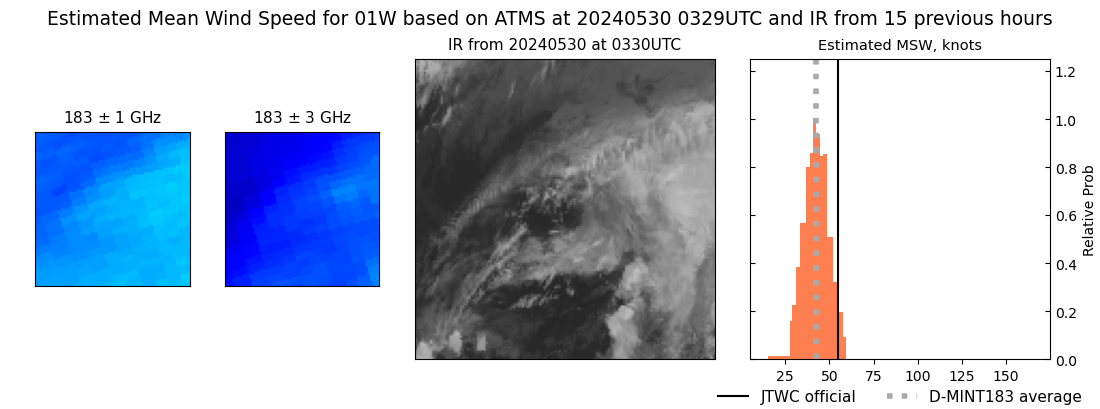 |
| 20240529 | 2150 UTC | SSMISF16 | 991 hPa | 46 kts | 40 kts | 52 kts | 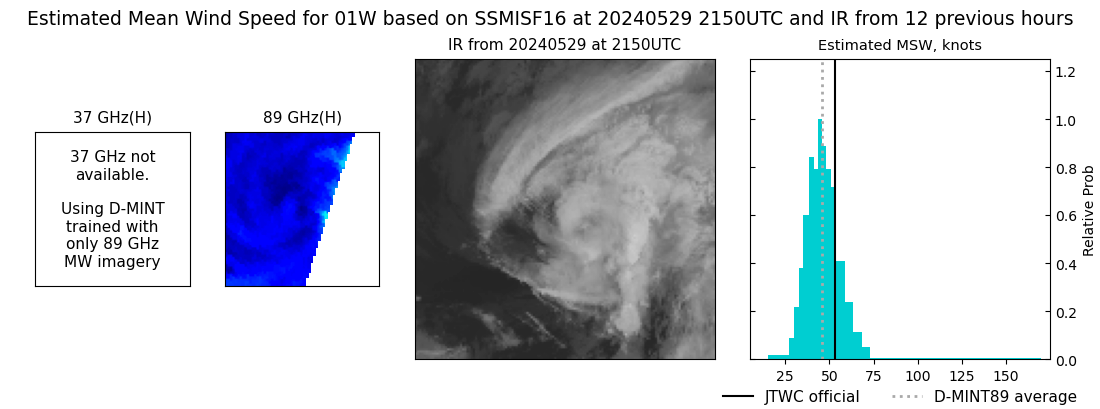 |
| 20240529 | 2126 UTC | SSMISF17 | 985 hPa | 43 kts | 38 kts | 48 kts | 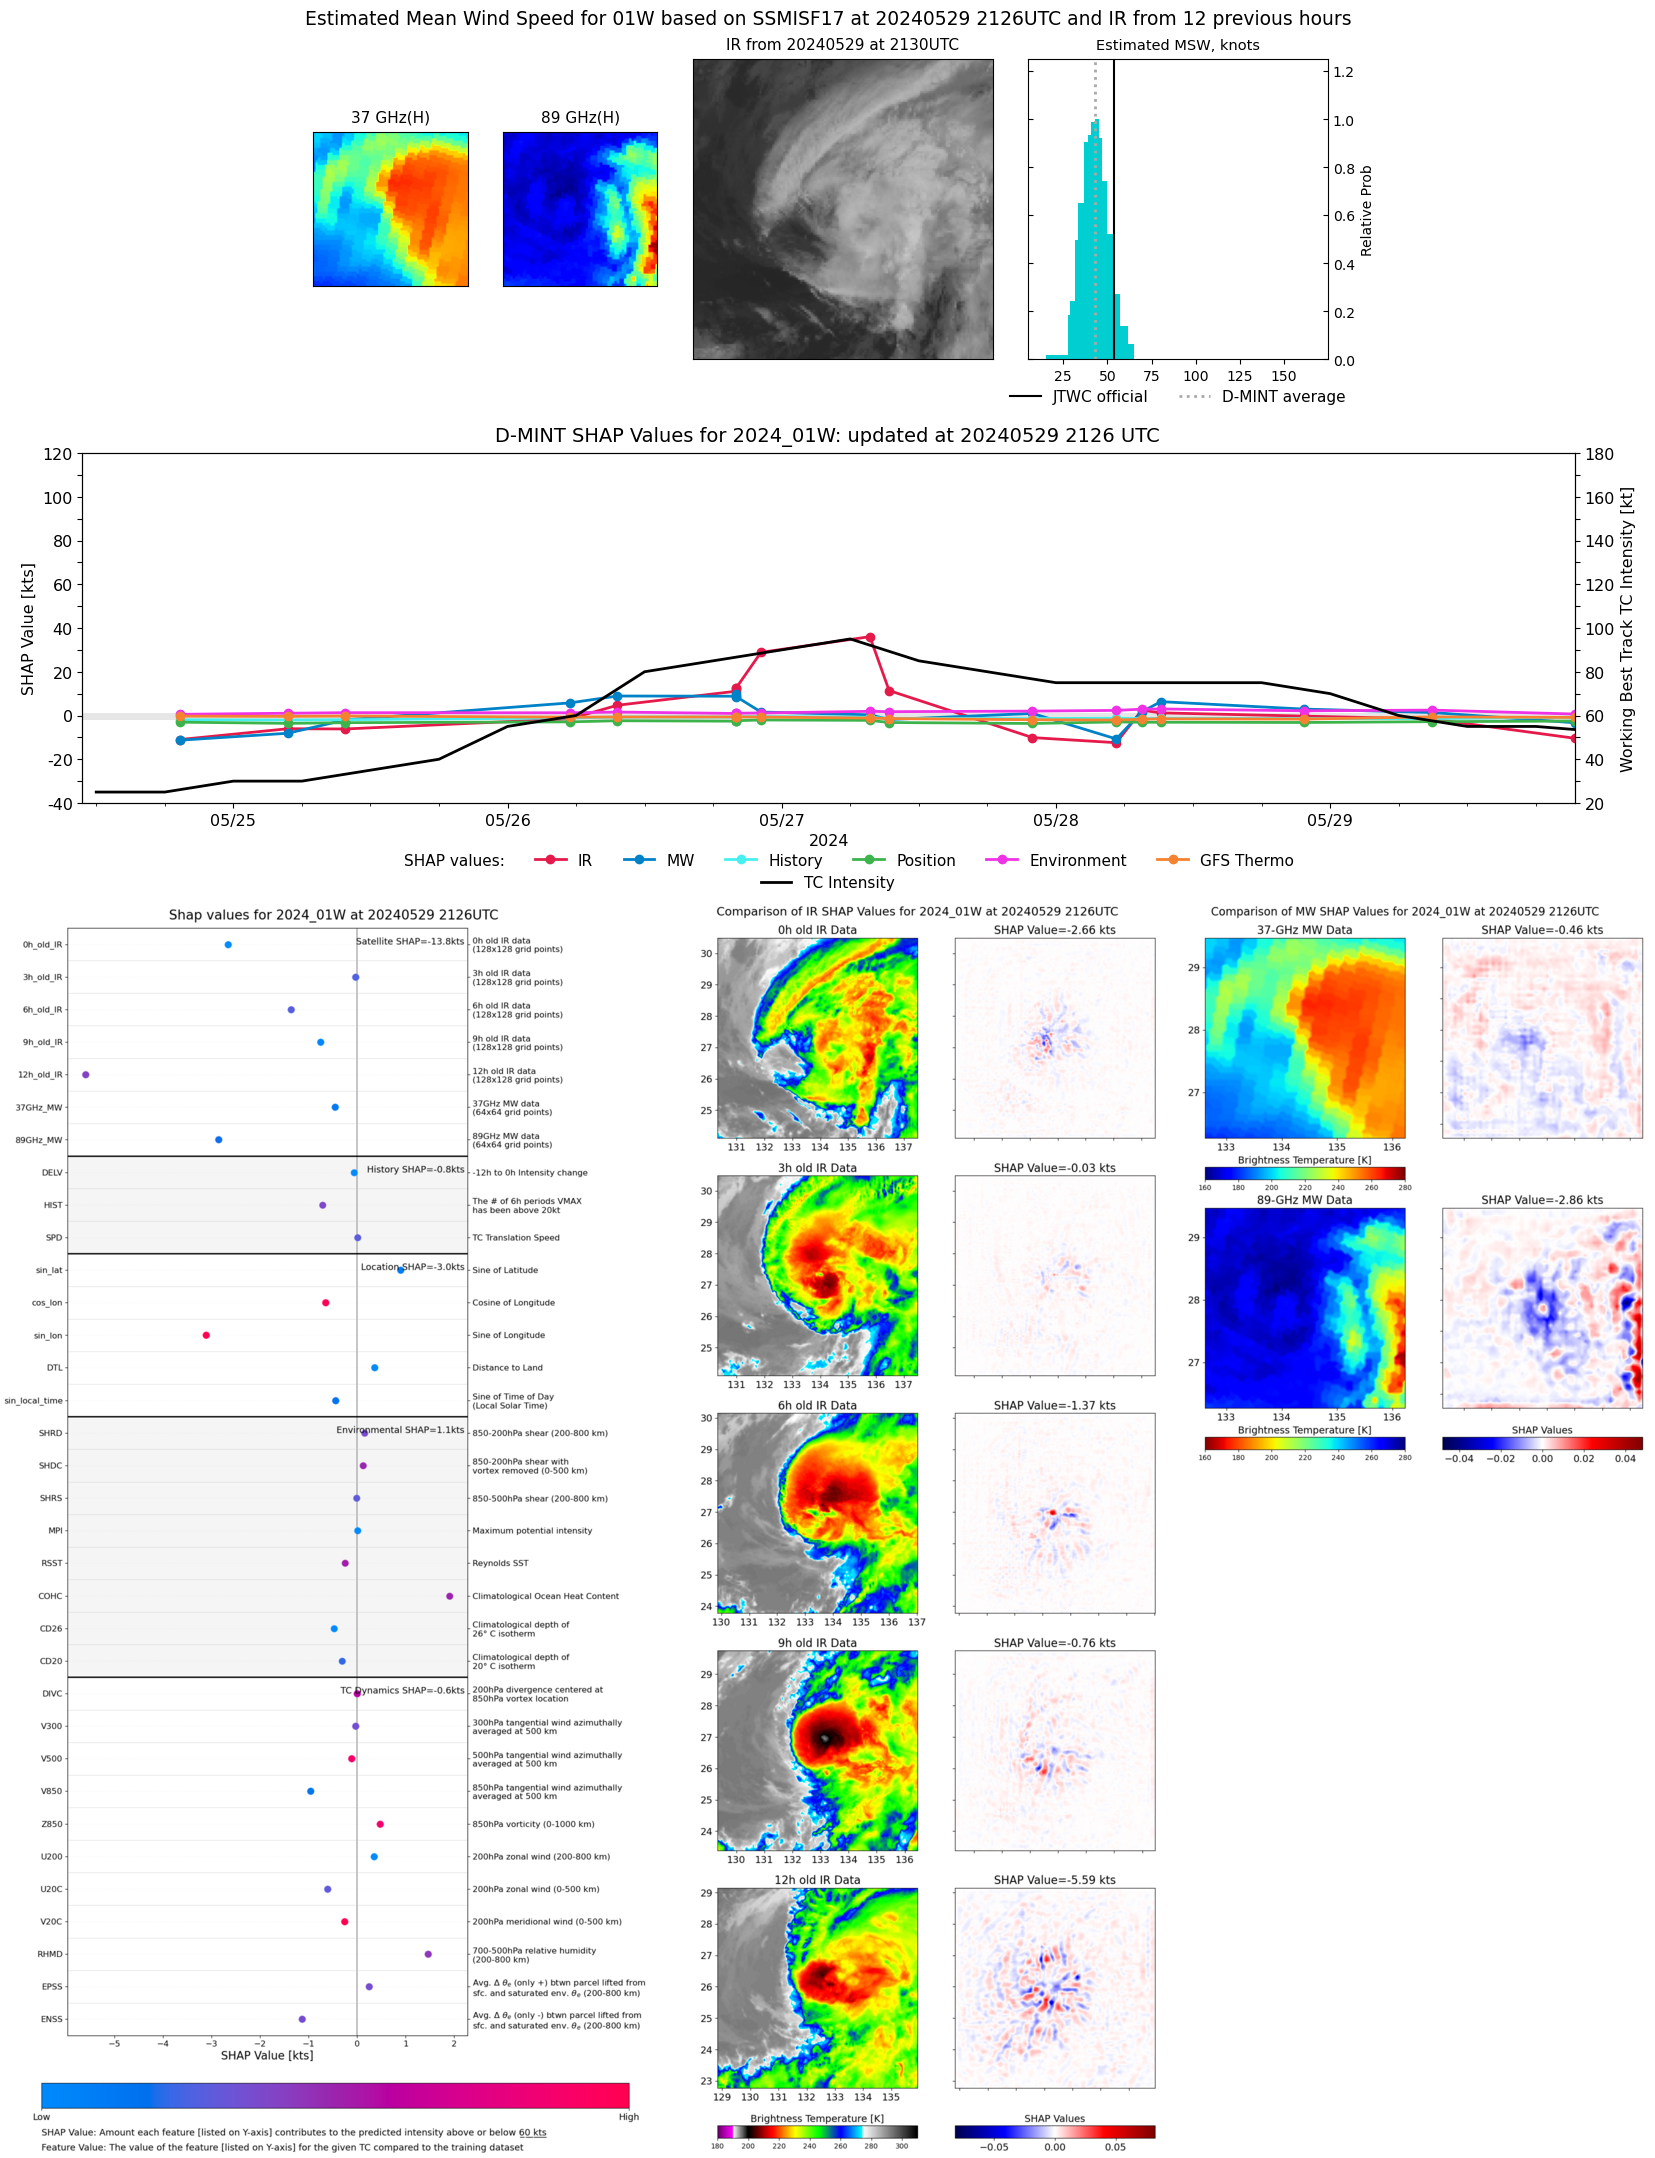 |
| 20240529 | 1613 UTC | ATMS | 981 hPa | 66 kts | 59 kts | 73 kts | 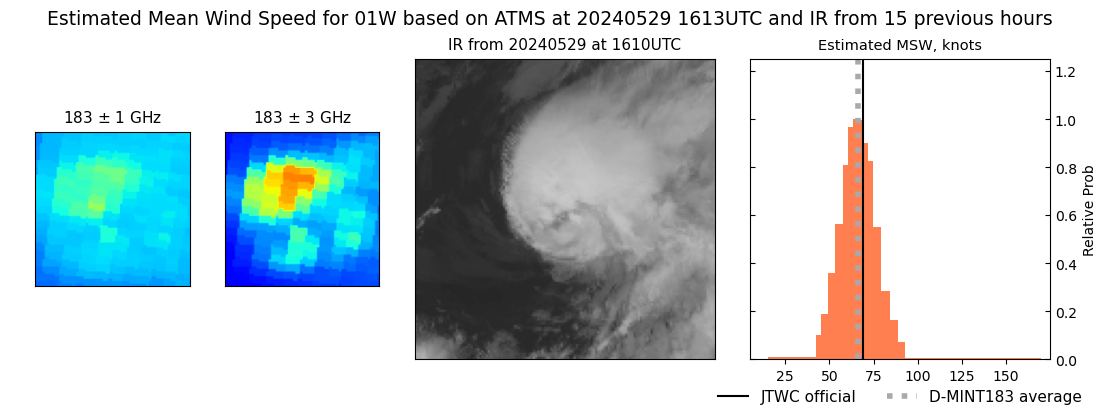 |
| 20240529 | 0857 UTC | SSMISF17 | 979 hPa | 58 kts | 51 kts | 65 kts | 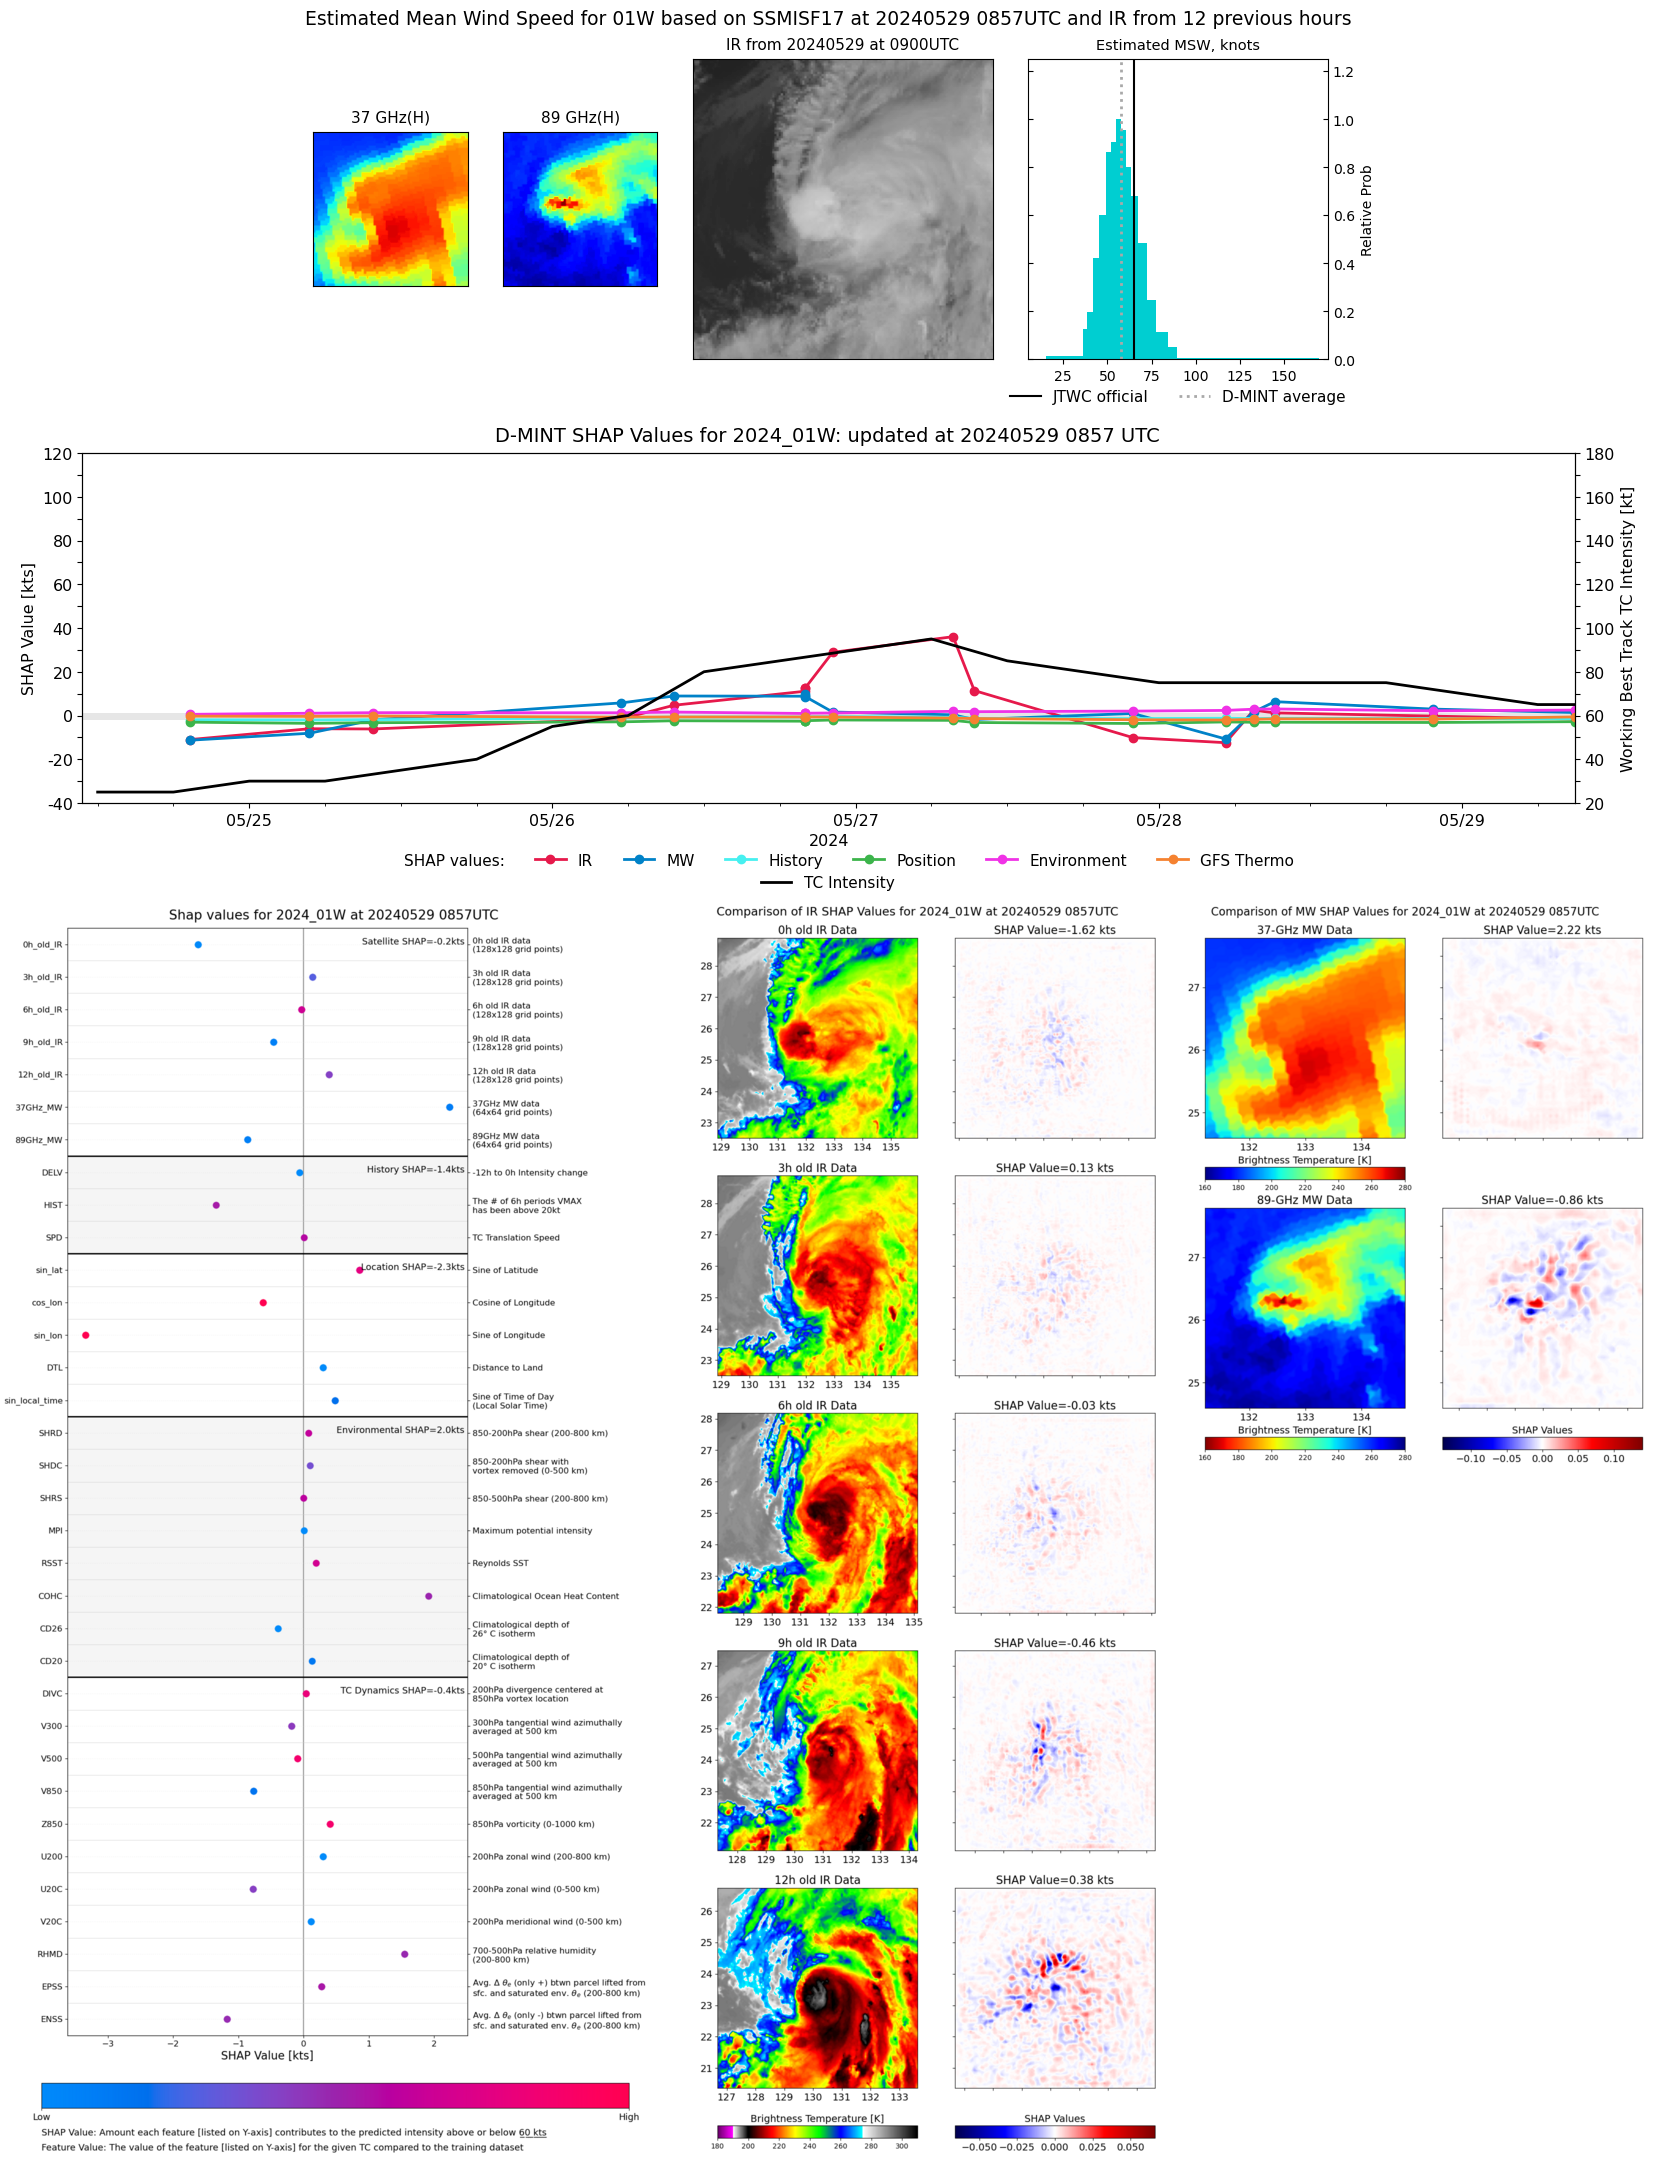 |
| 20240529 | 0412 UTC | ATMS | 976 hPa | 68 kts | 62 kts | 75 kts | 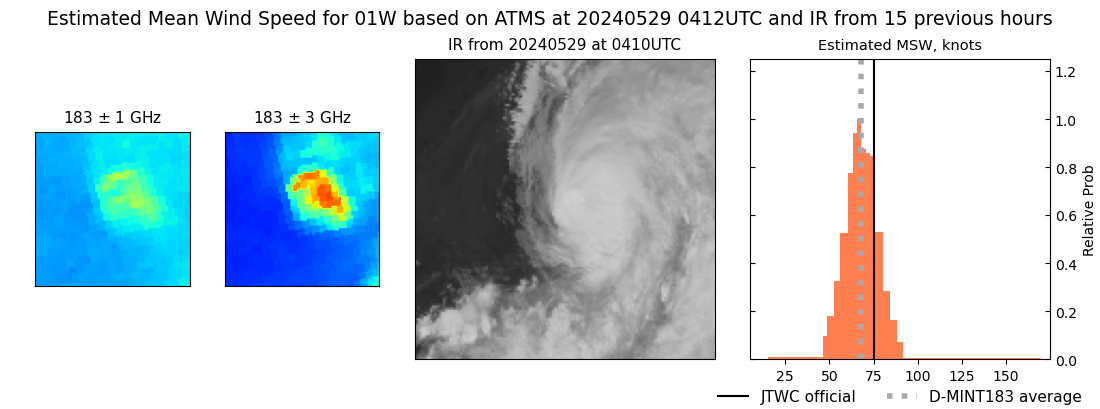 |
| 20240528 | 2141 UTC | SSMISF17 | 979 hPa | 59 kts | 53 kts | 65 kts | 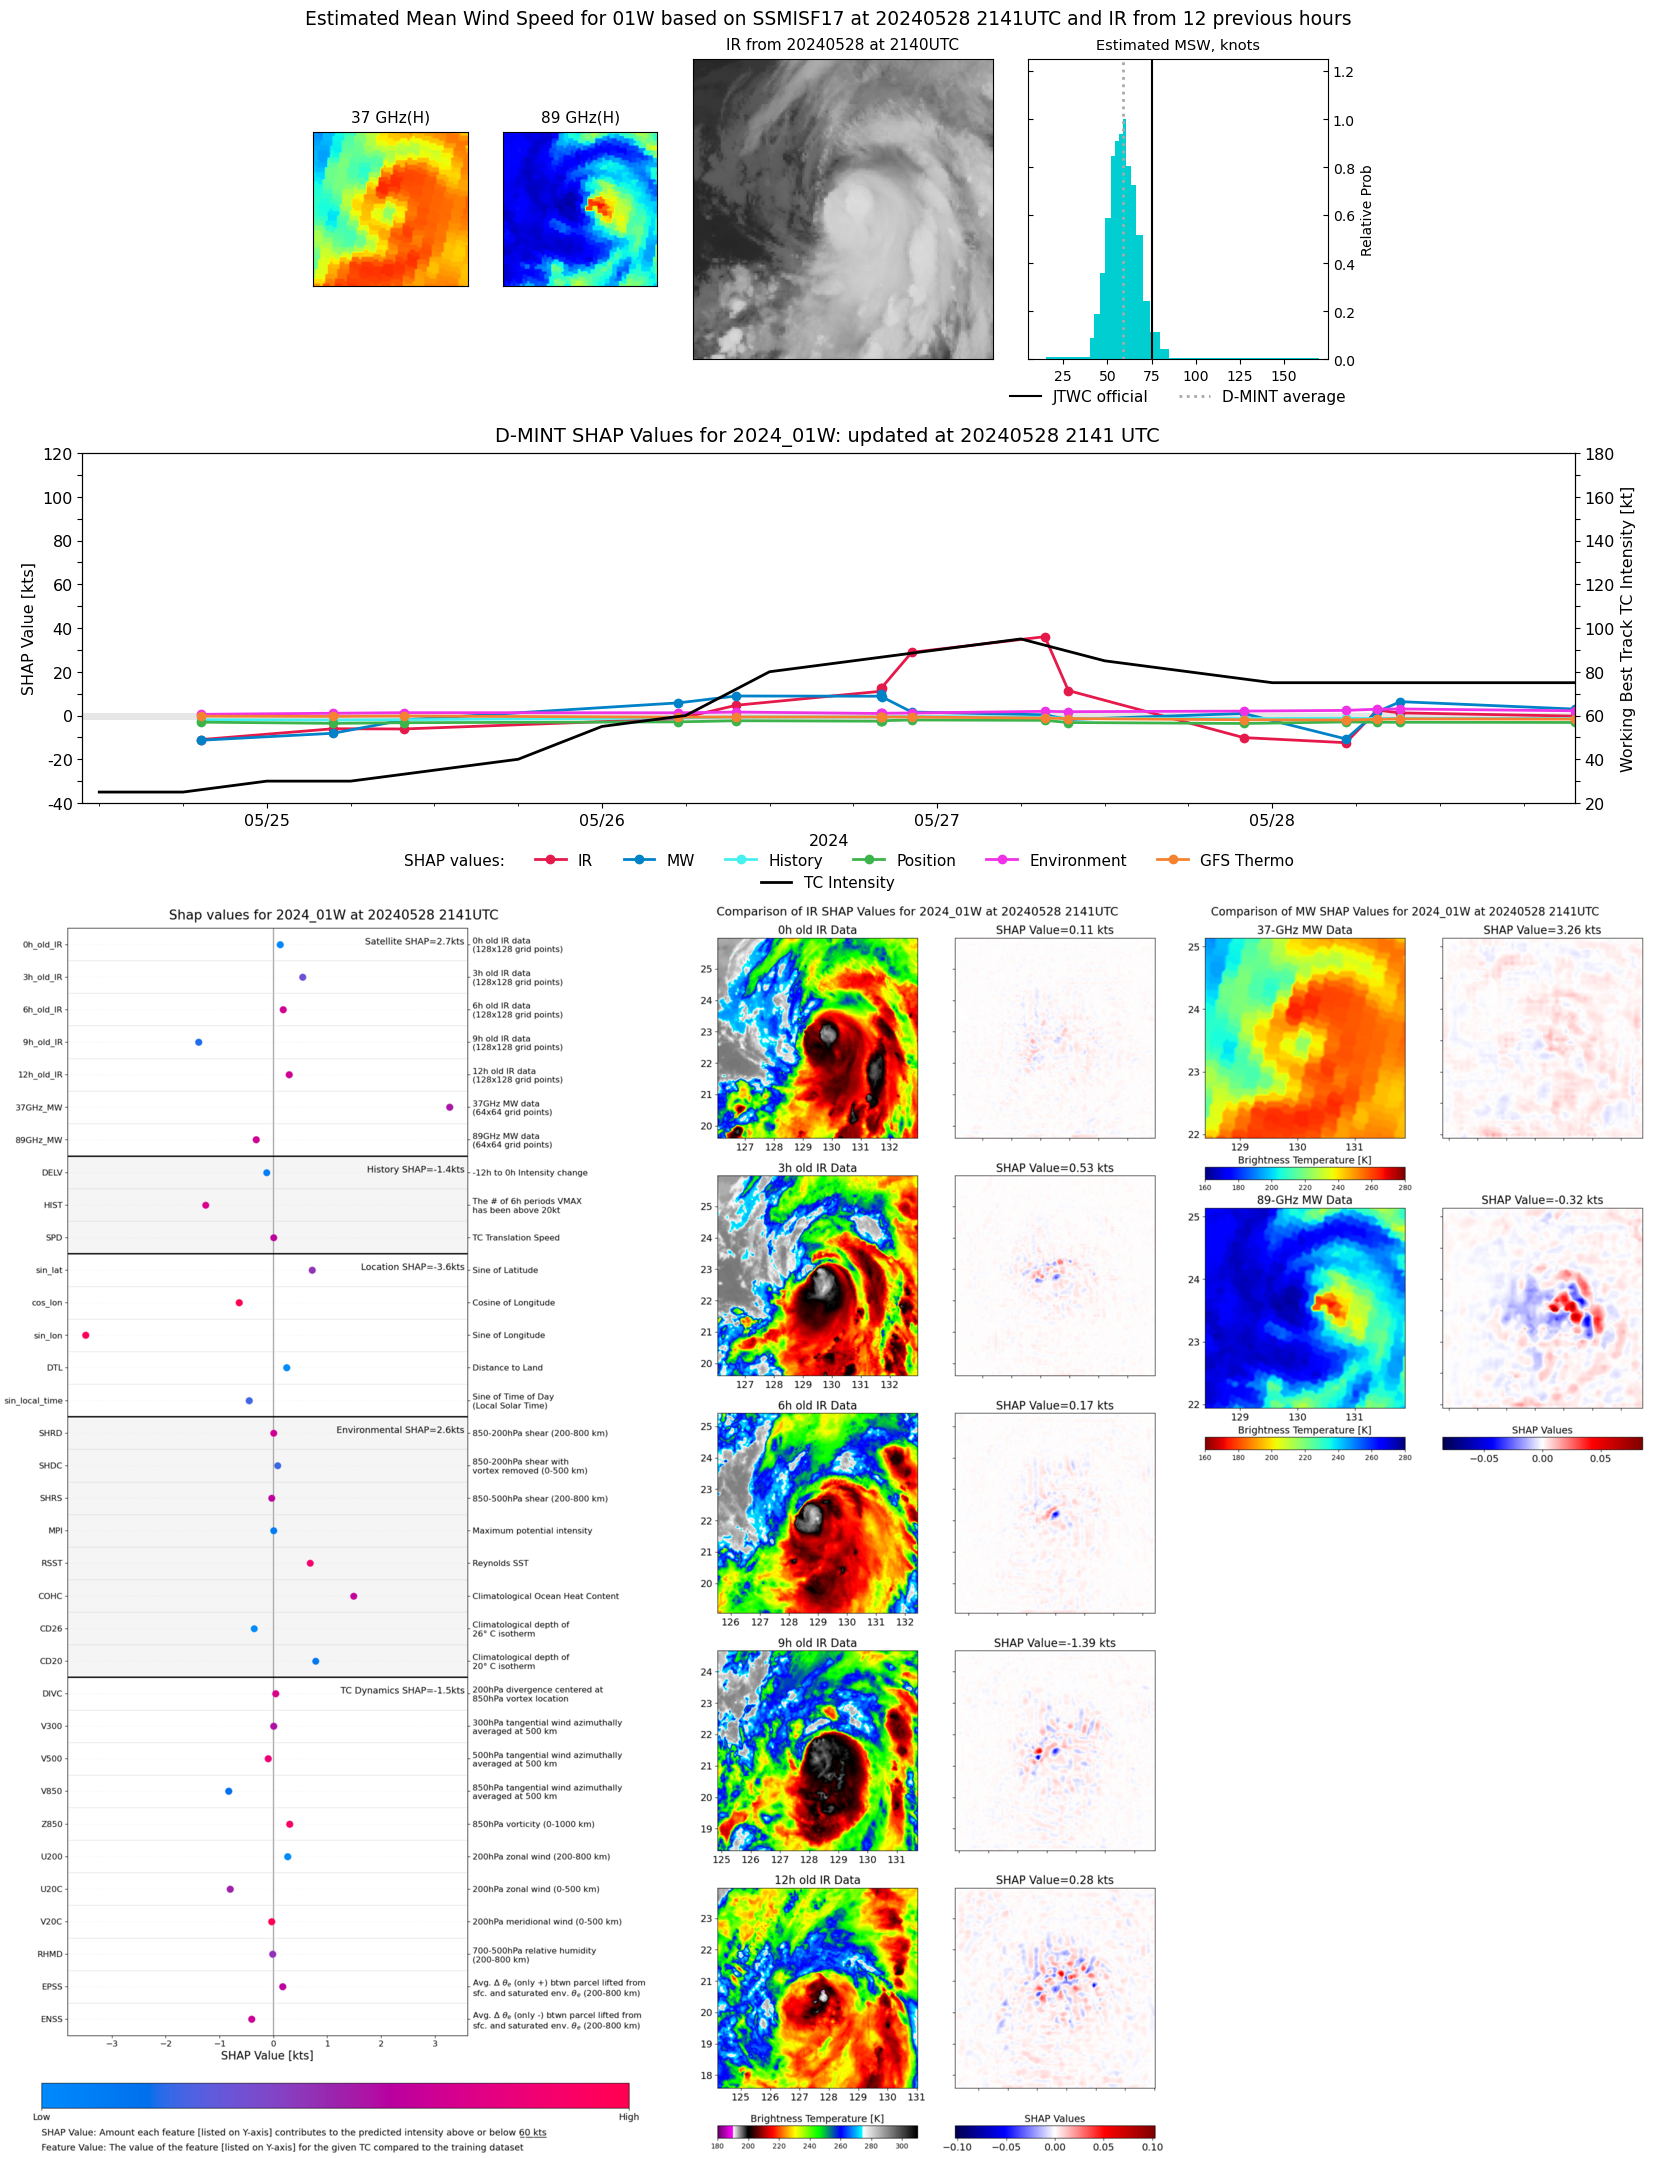 |
| 20240528 | 1659 UTC | ATMS | 977 hPa | 60 kts | 55 kts | 66 kts | 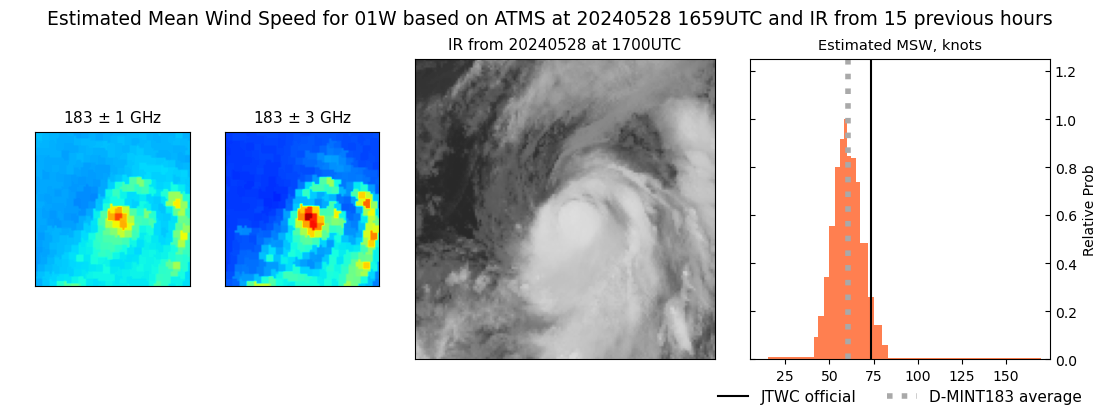 |
| 20240528 | 0911 UTC | SSMISF17 | 980 hPa | 65 kts | 59 kts | 71 kts | 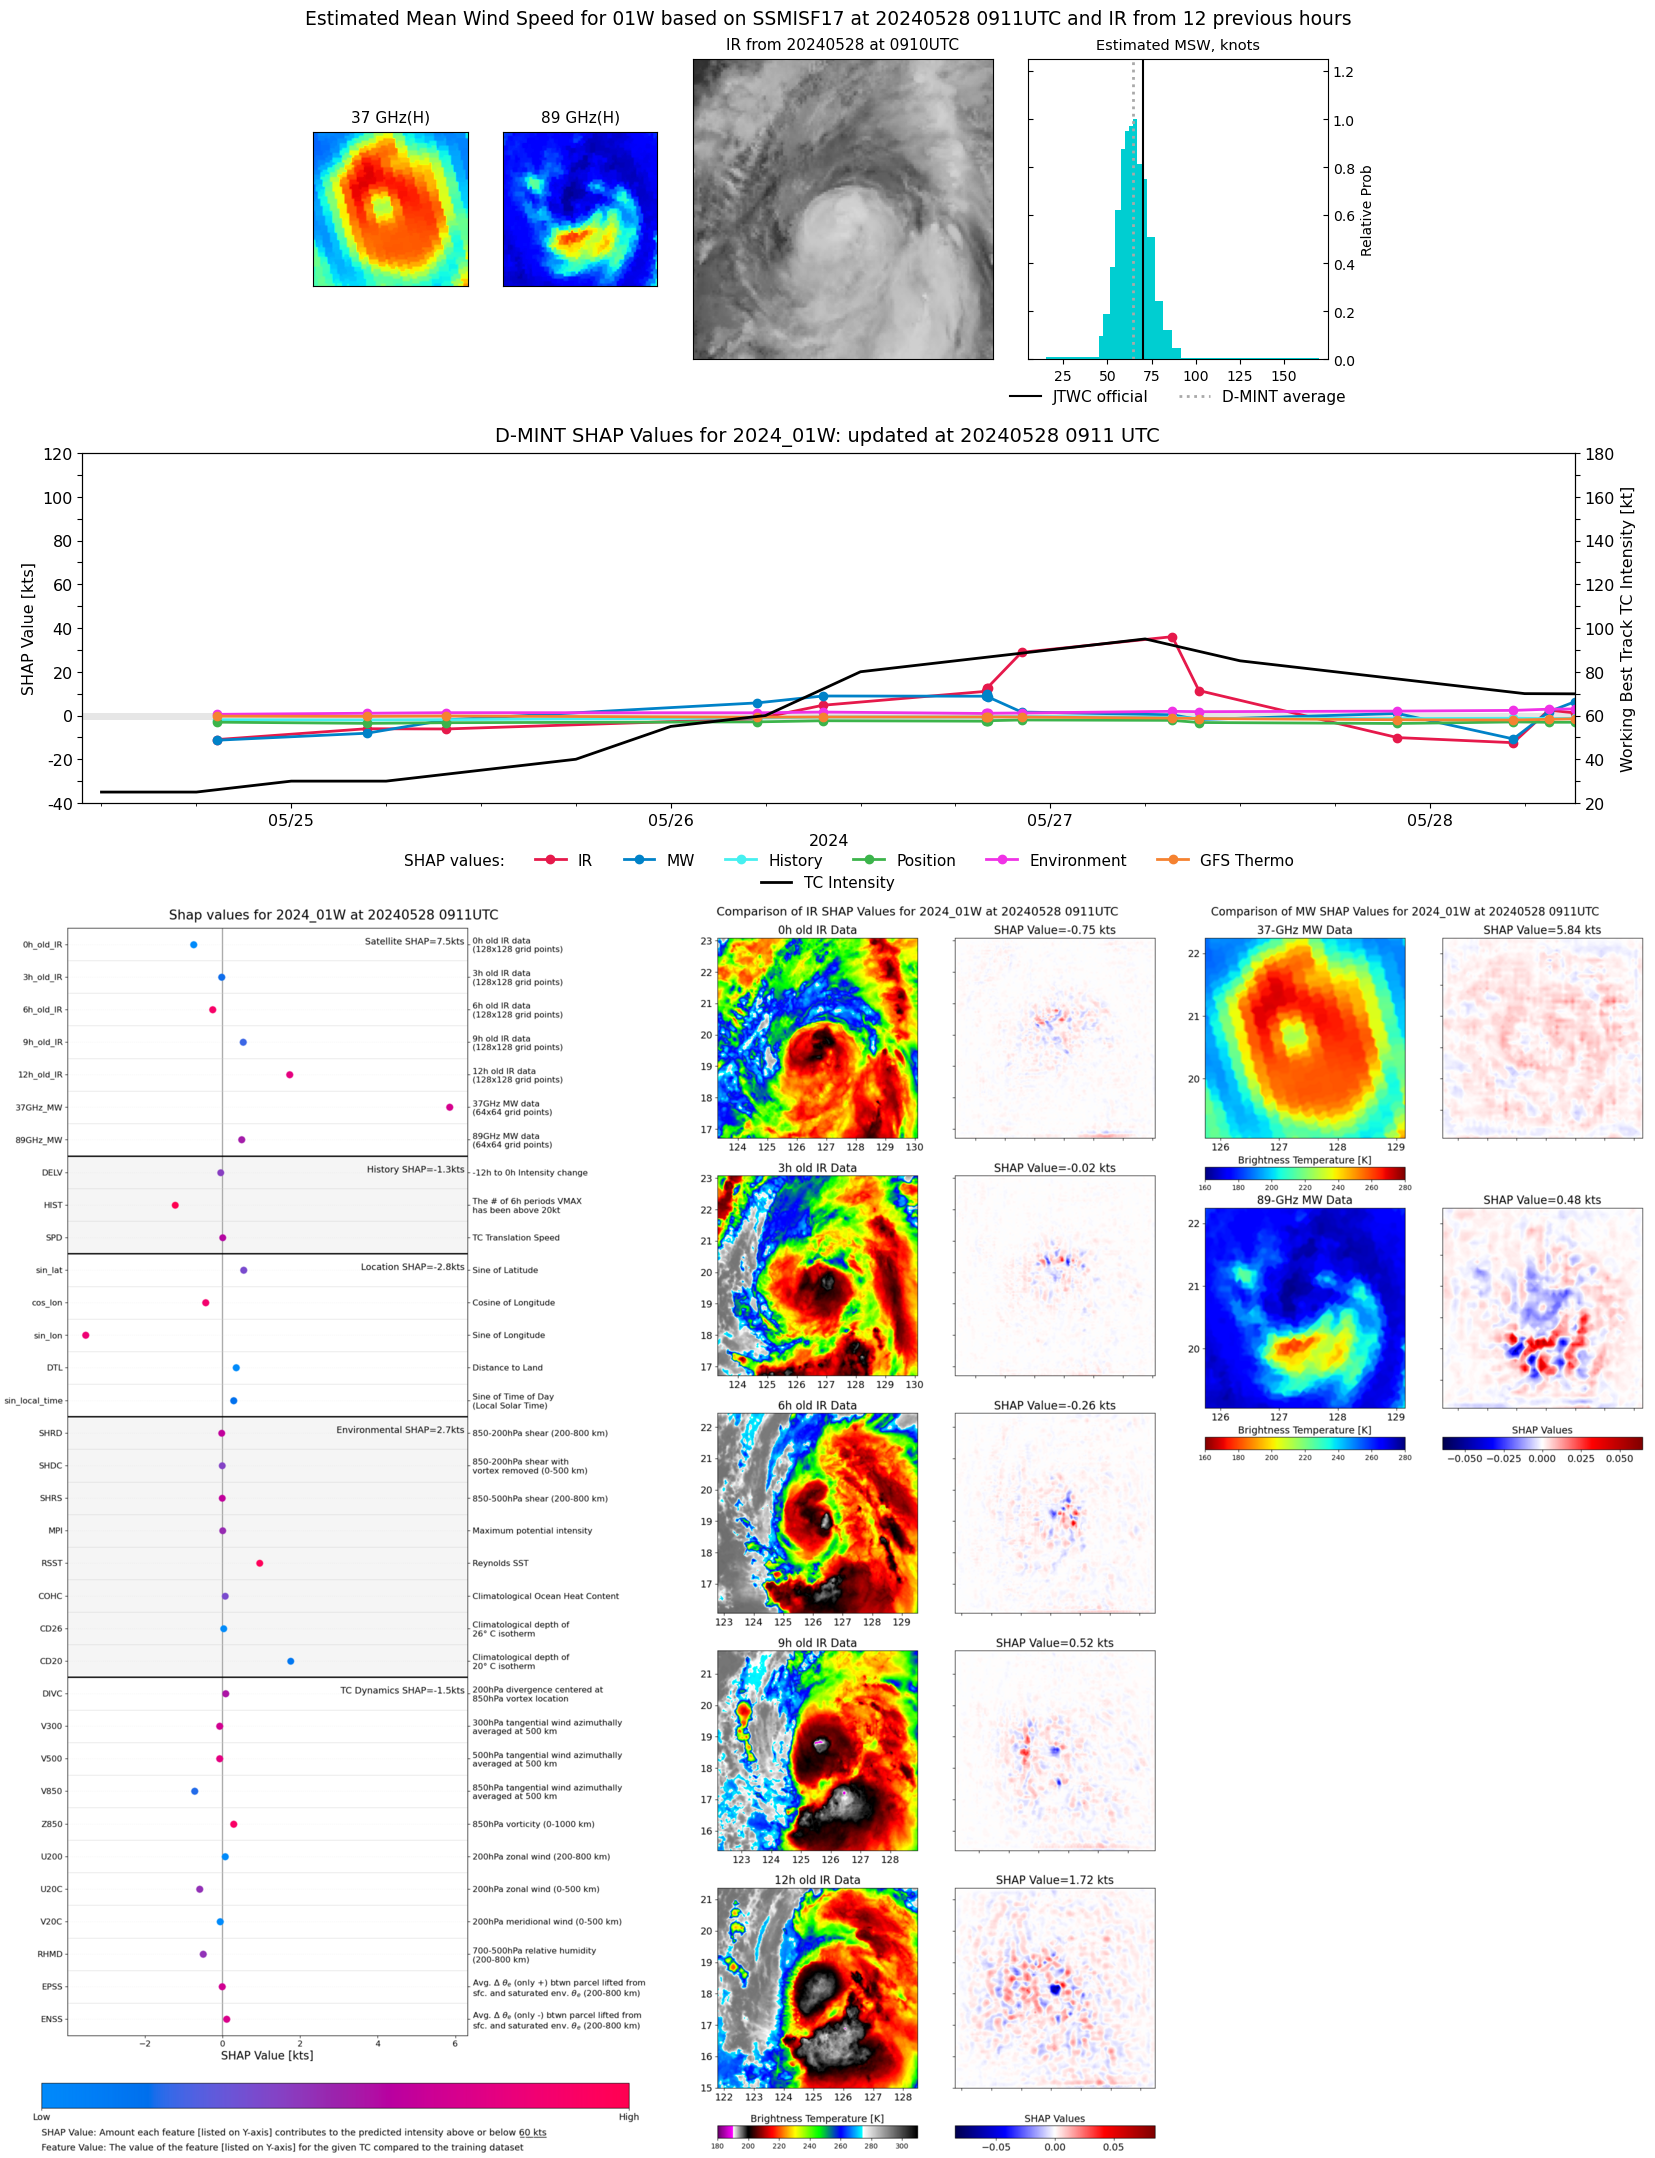 |
| 20240528 | 0731 UTC | SSMISF18 | 977 hPa | 61 kts | 54 kts | 68 kts |  |
| 20240528 | 0518 UTC | ATMS | 992 hPa | 35 kts | 31 kts | 40 kts | 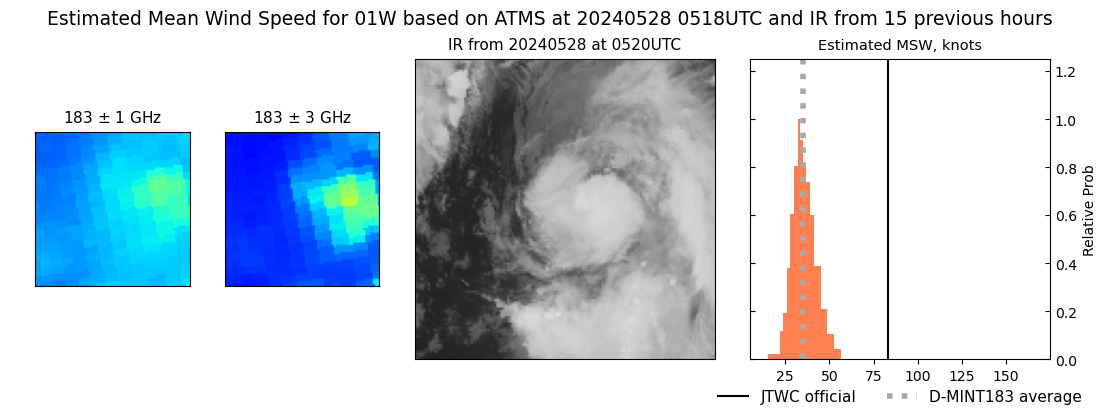 |
| 20240528 | 0517 UTC | AMSR2 | 997 hPa | 44 kts | 39 kts | 48 kts | 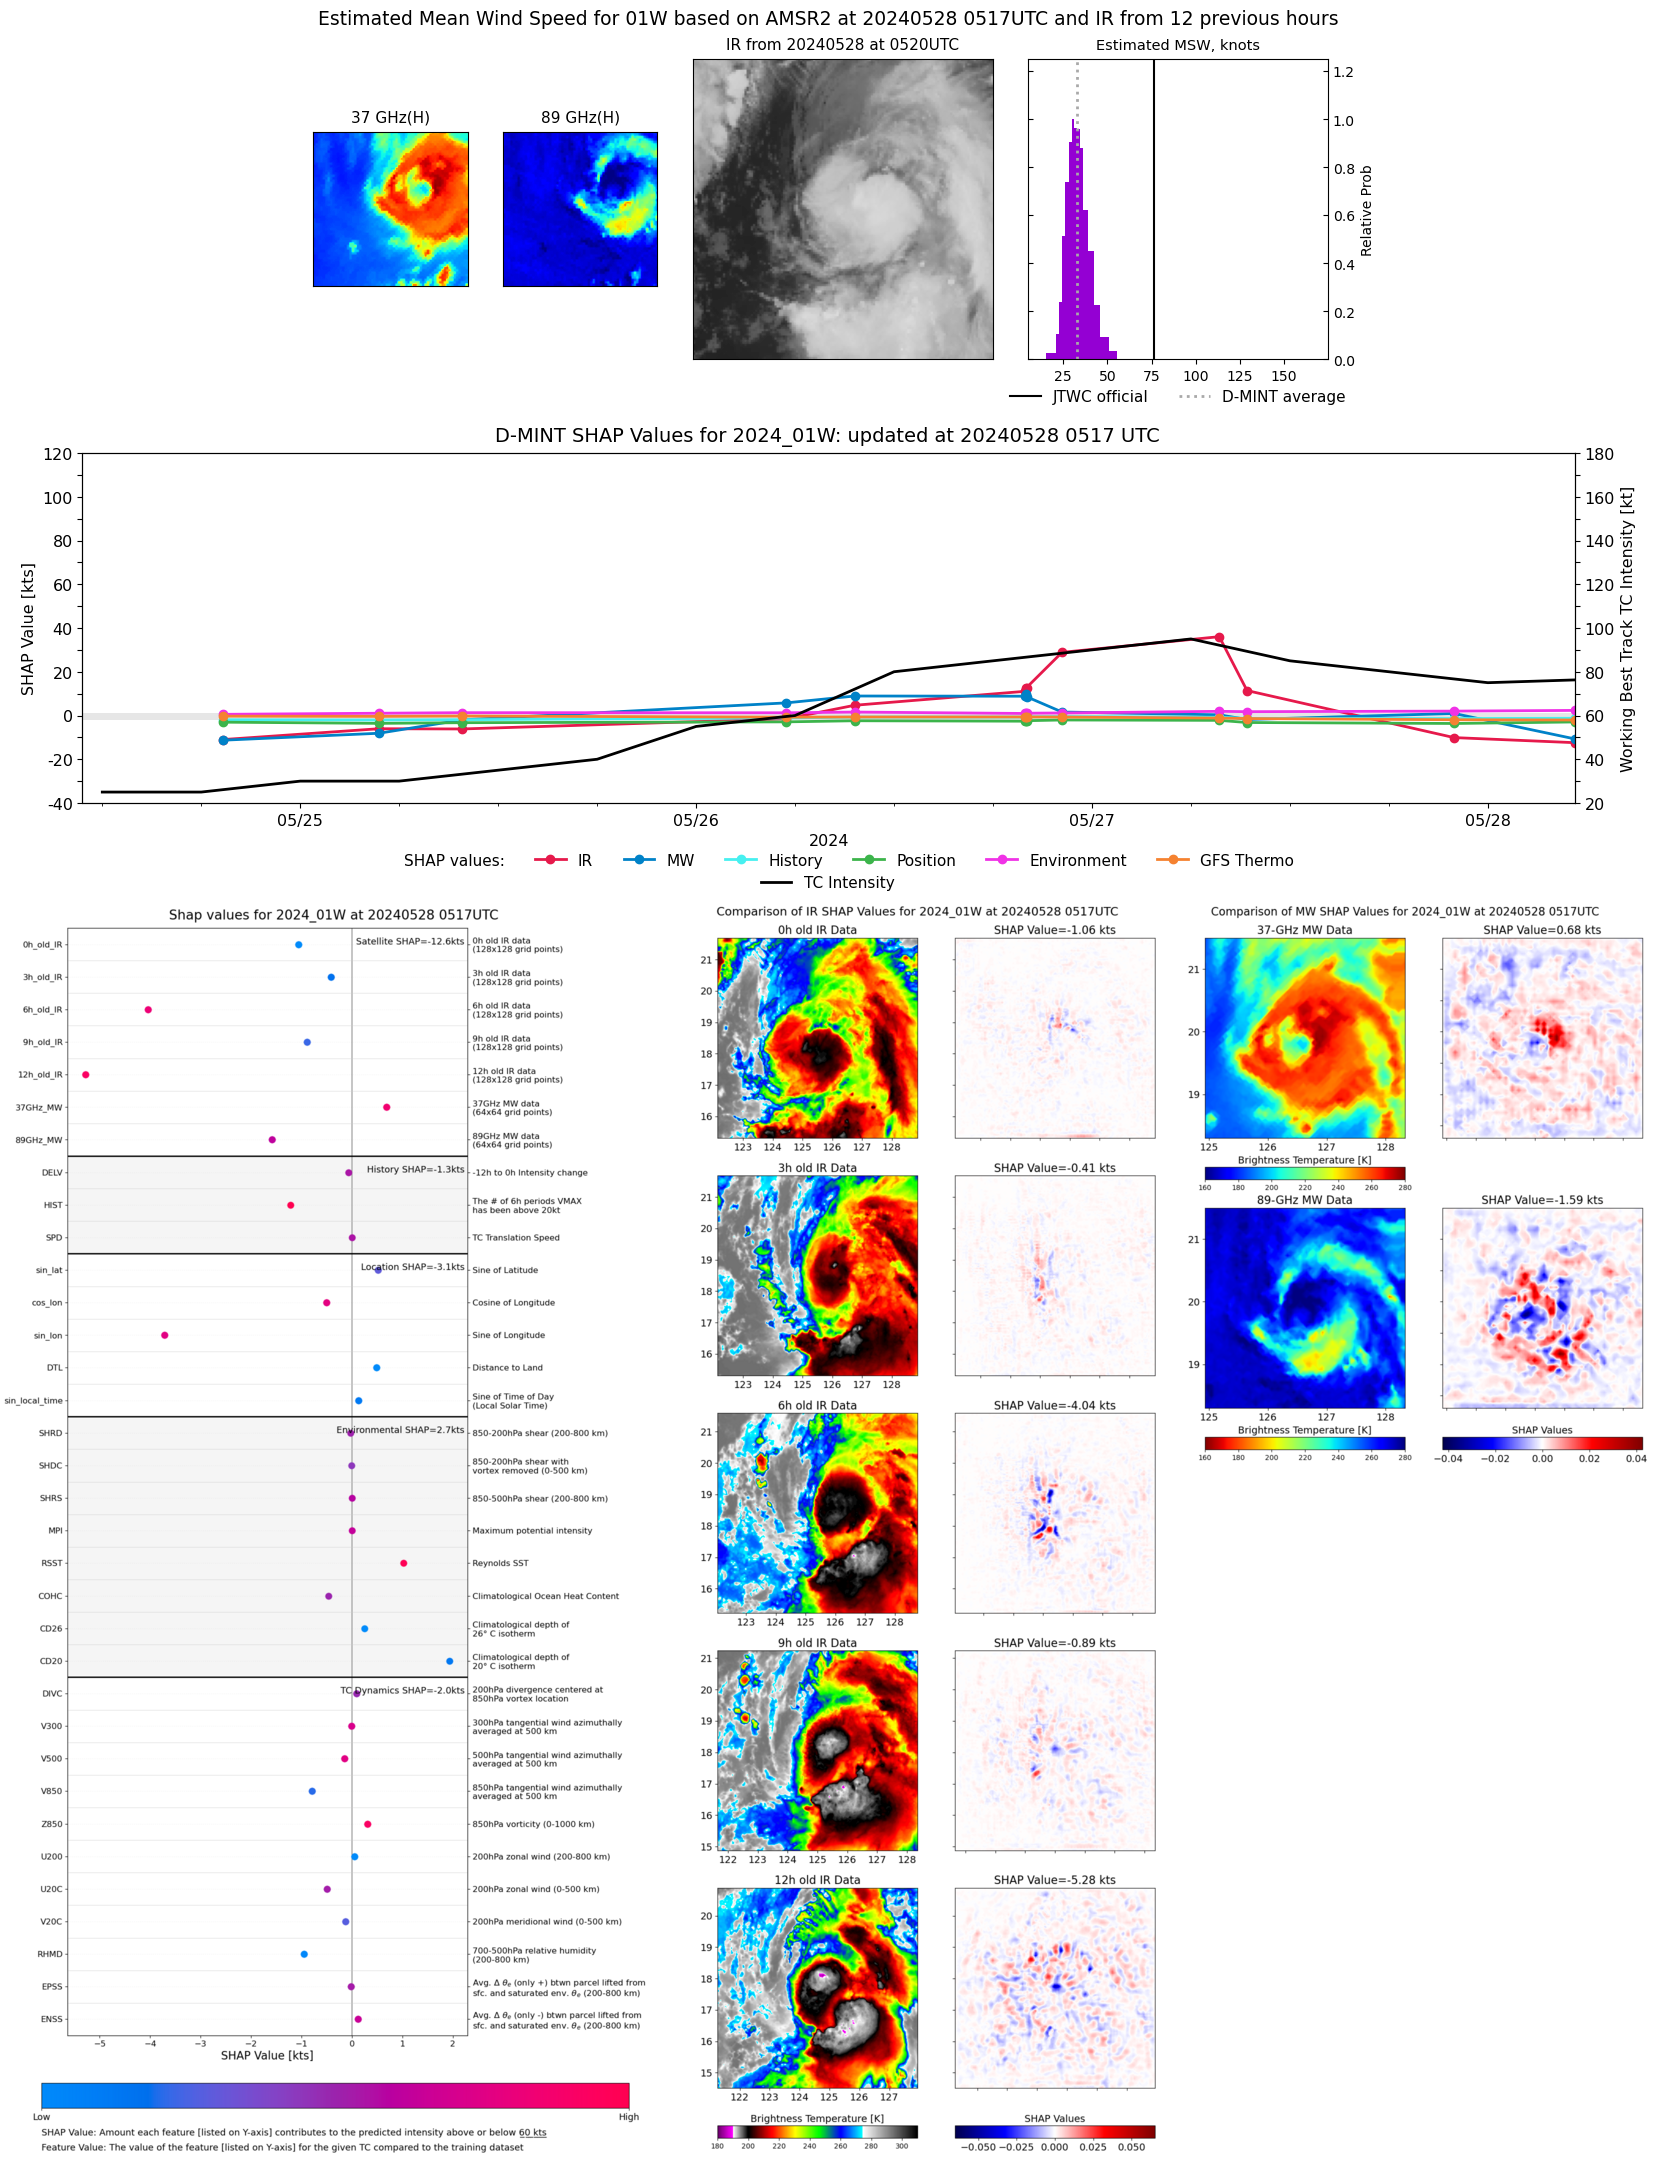 |
| 20240528 | 0430 UTC | ATMS | 994 hPa | 40 kts | 35 kts | 45 kts | 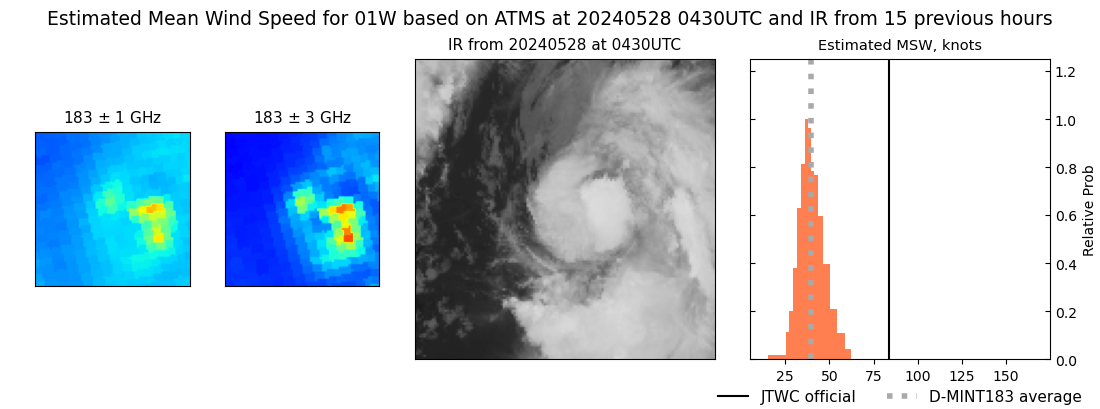 |
| 20240528 | 0405 UTC | ATMS | 983 hPa | 48 kts | 43 kts | 54 kts | 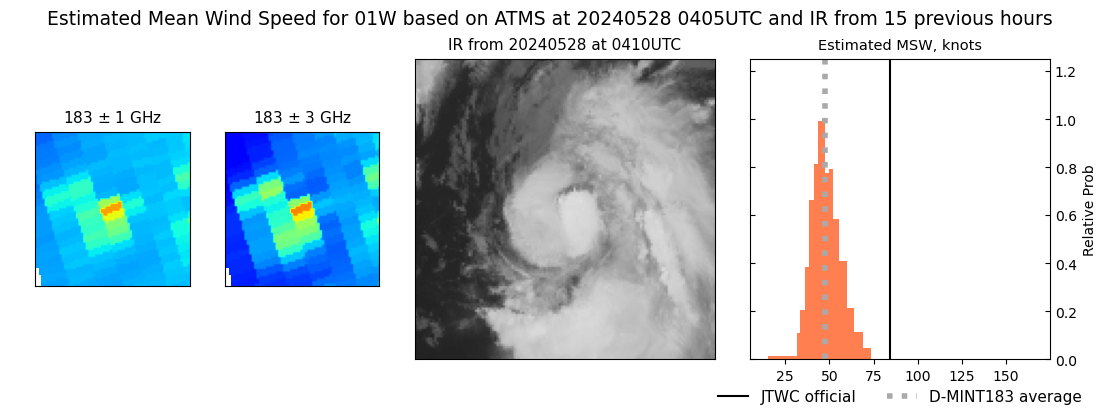 |
| 20240527 | 2157 UTC | SSMISF17 | 990 hPa | 46 kts | 40 kts | 52 kts | 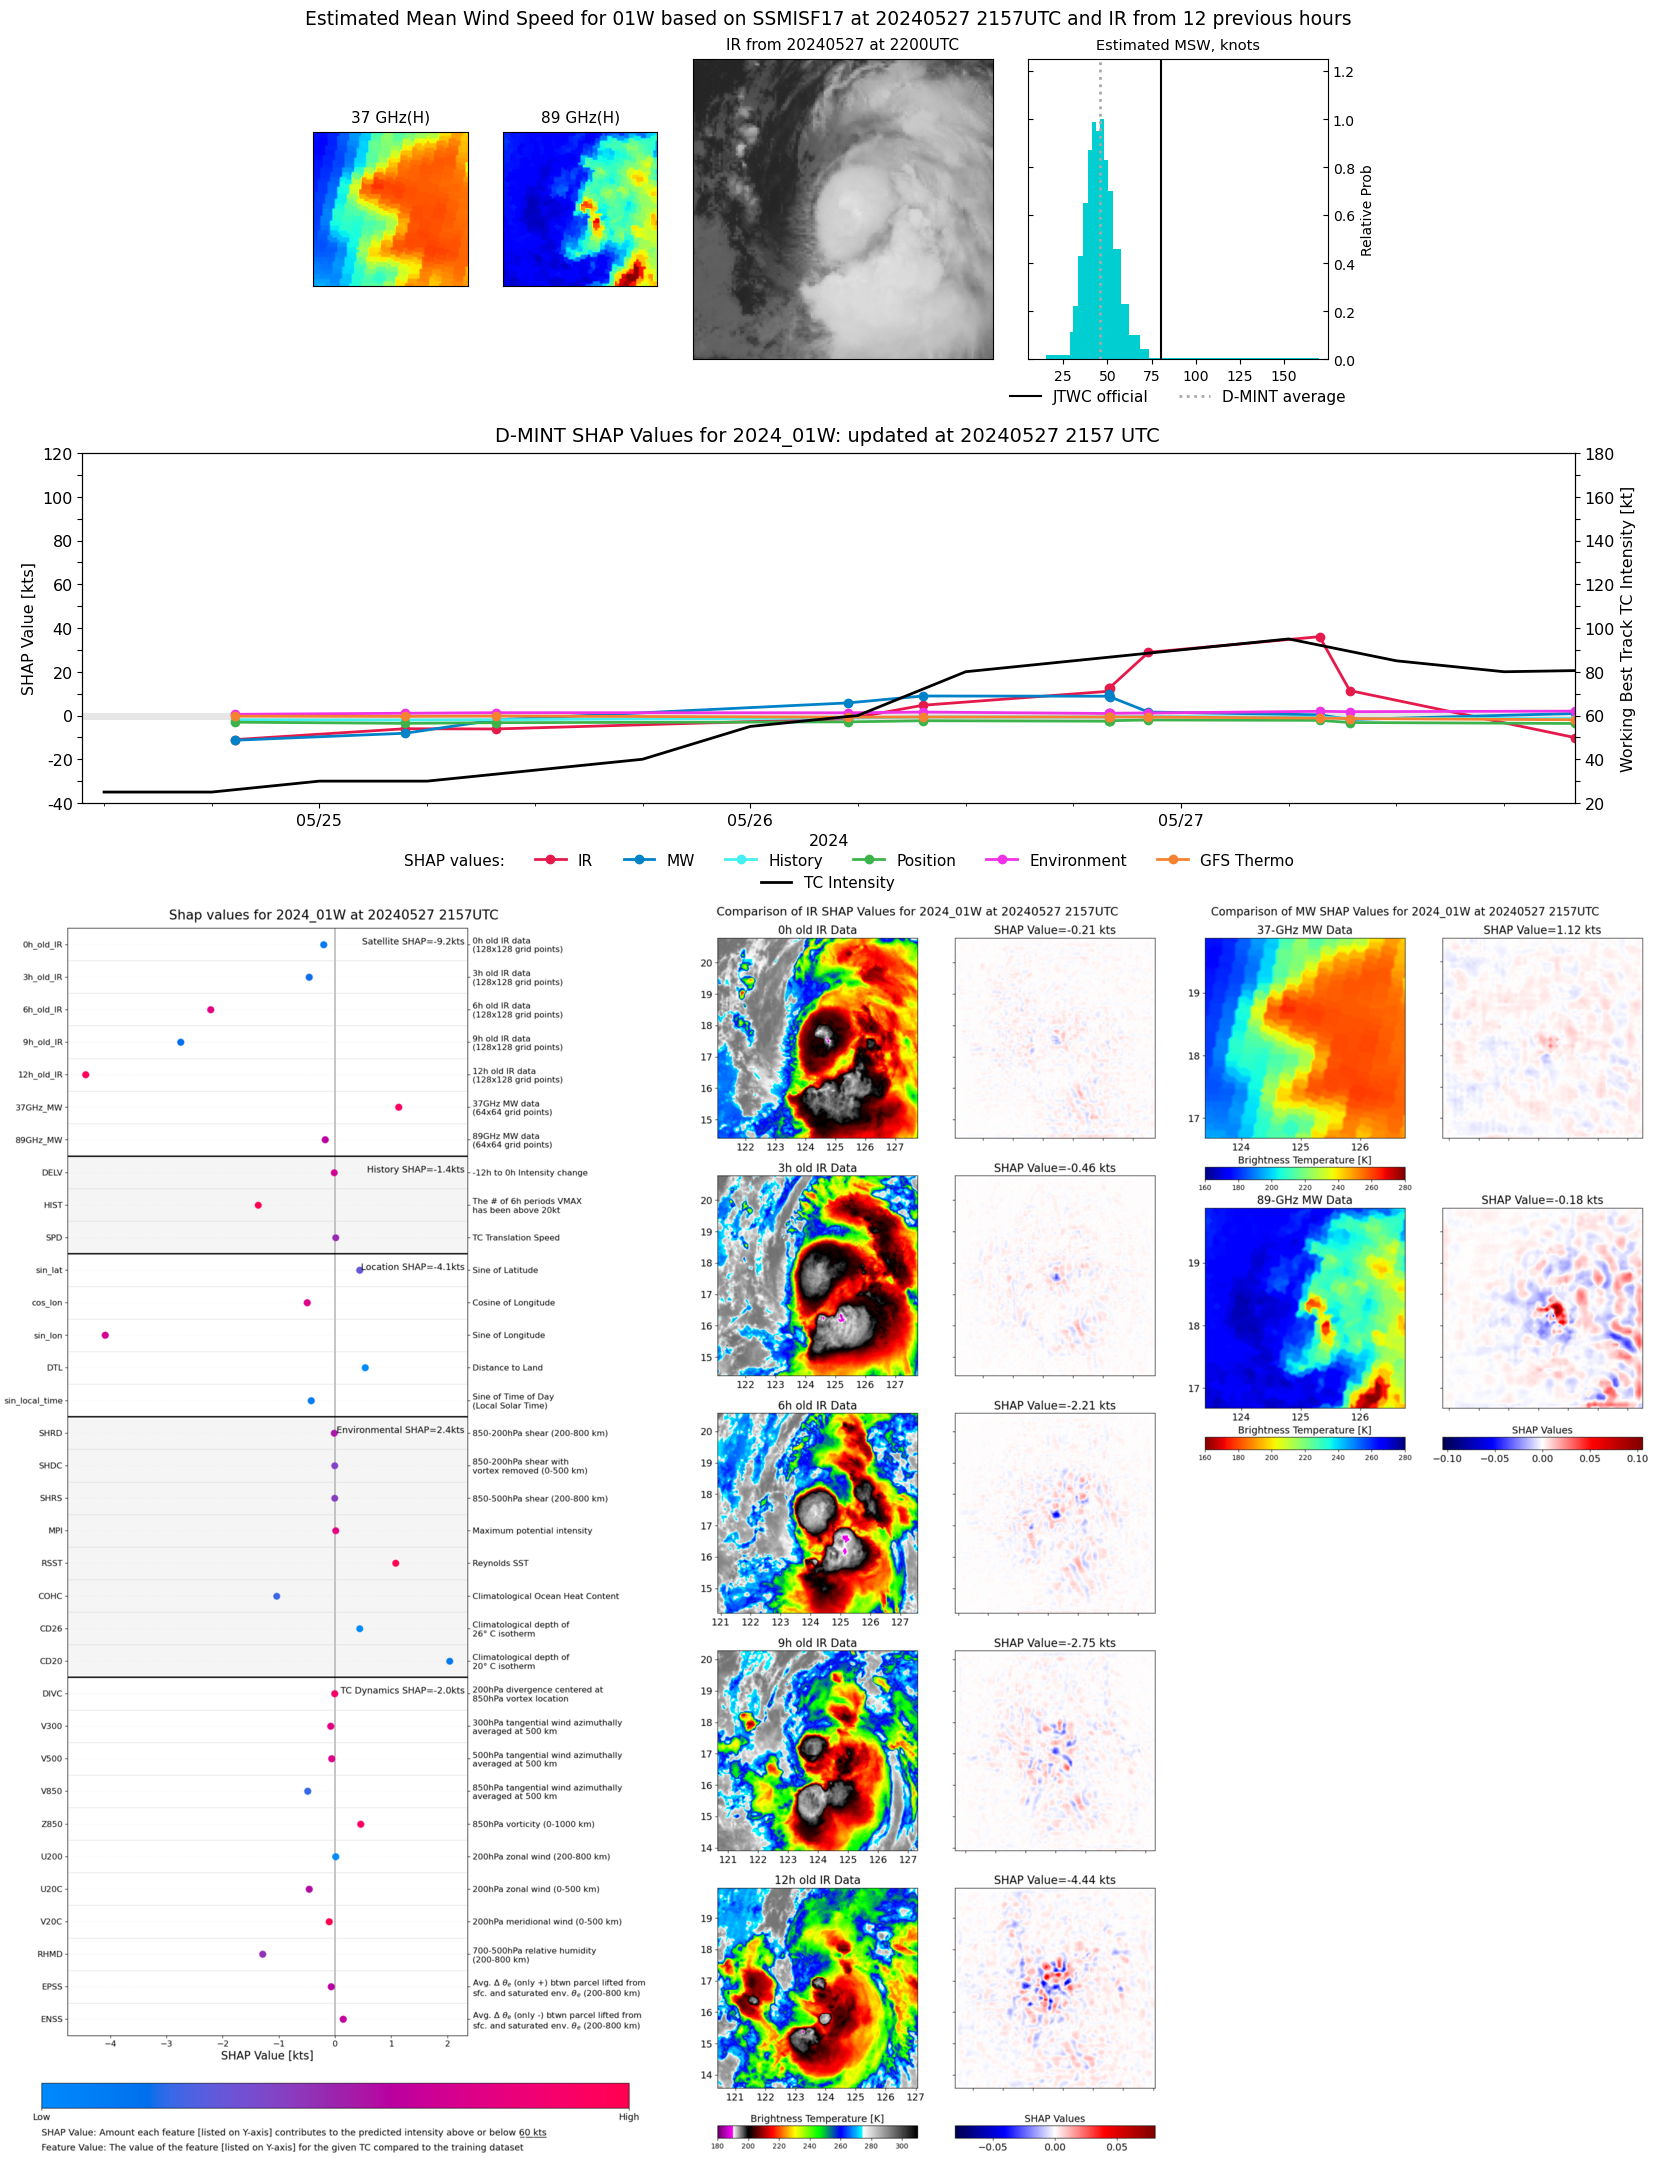 |
| 20240527 | 1720 UTC | ATMS | 989 hPa | 53 kts | 48 kts | 59 kts | 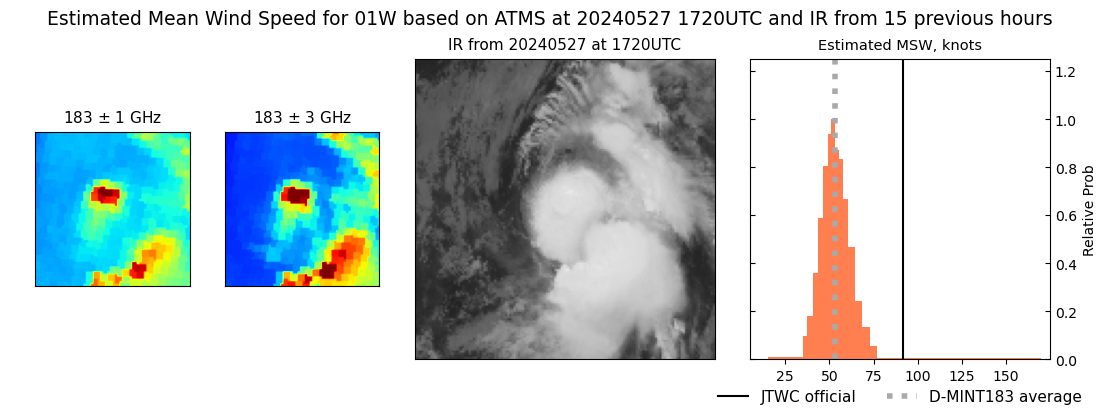 |
| 20240527 | 0945 UTC | SSMISF16 | 979 hPa | 61 kts | 54 kts | 69 kts | 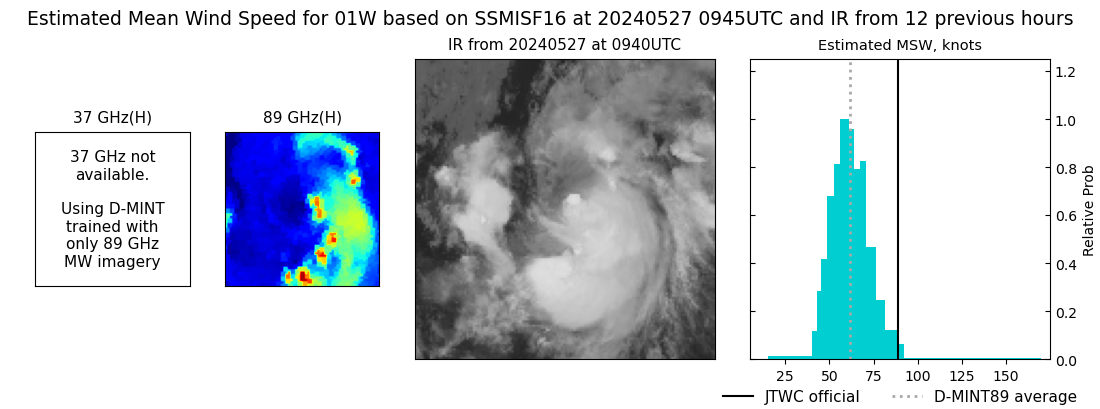 |
| 20240527 | 0924 UTC | SSMISF17 | 972 hPa | 65 kts | 58 kts | 73 kts | 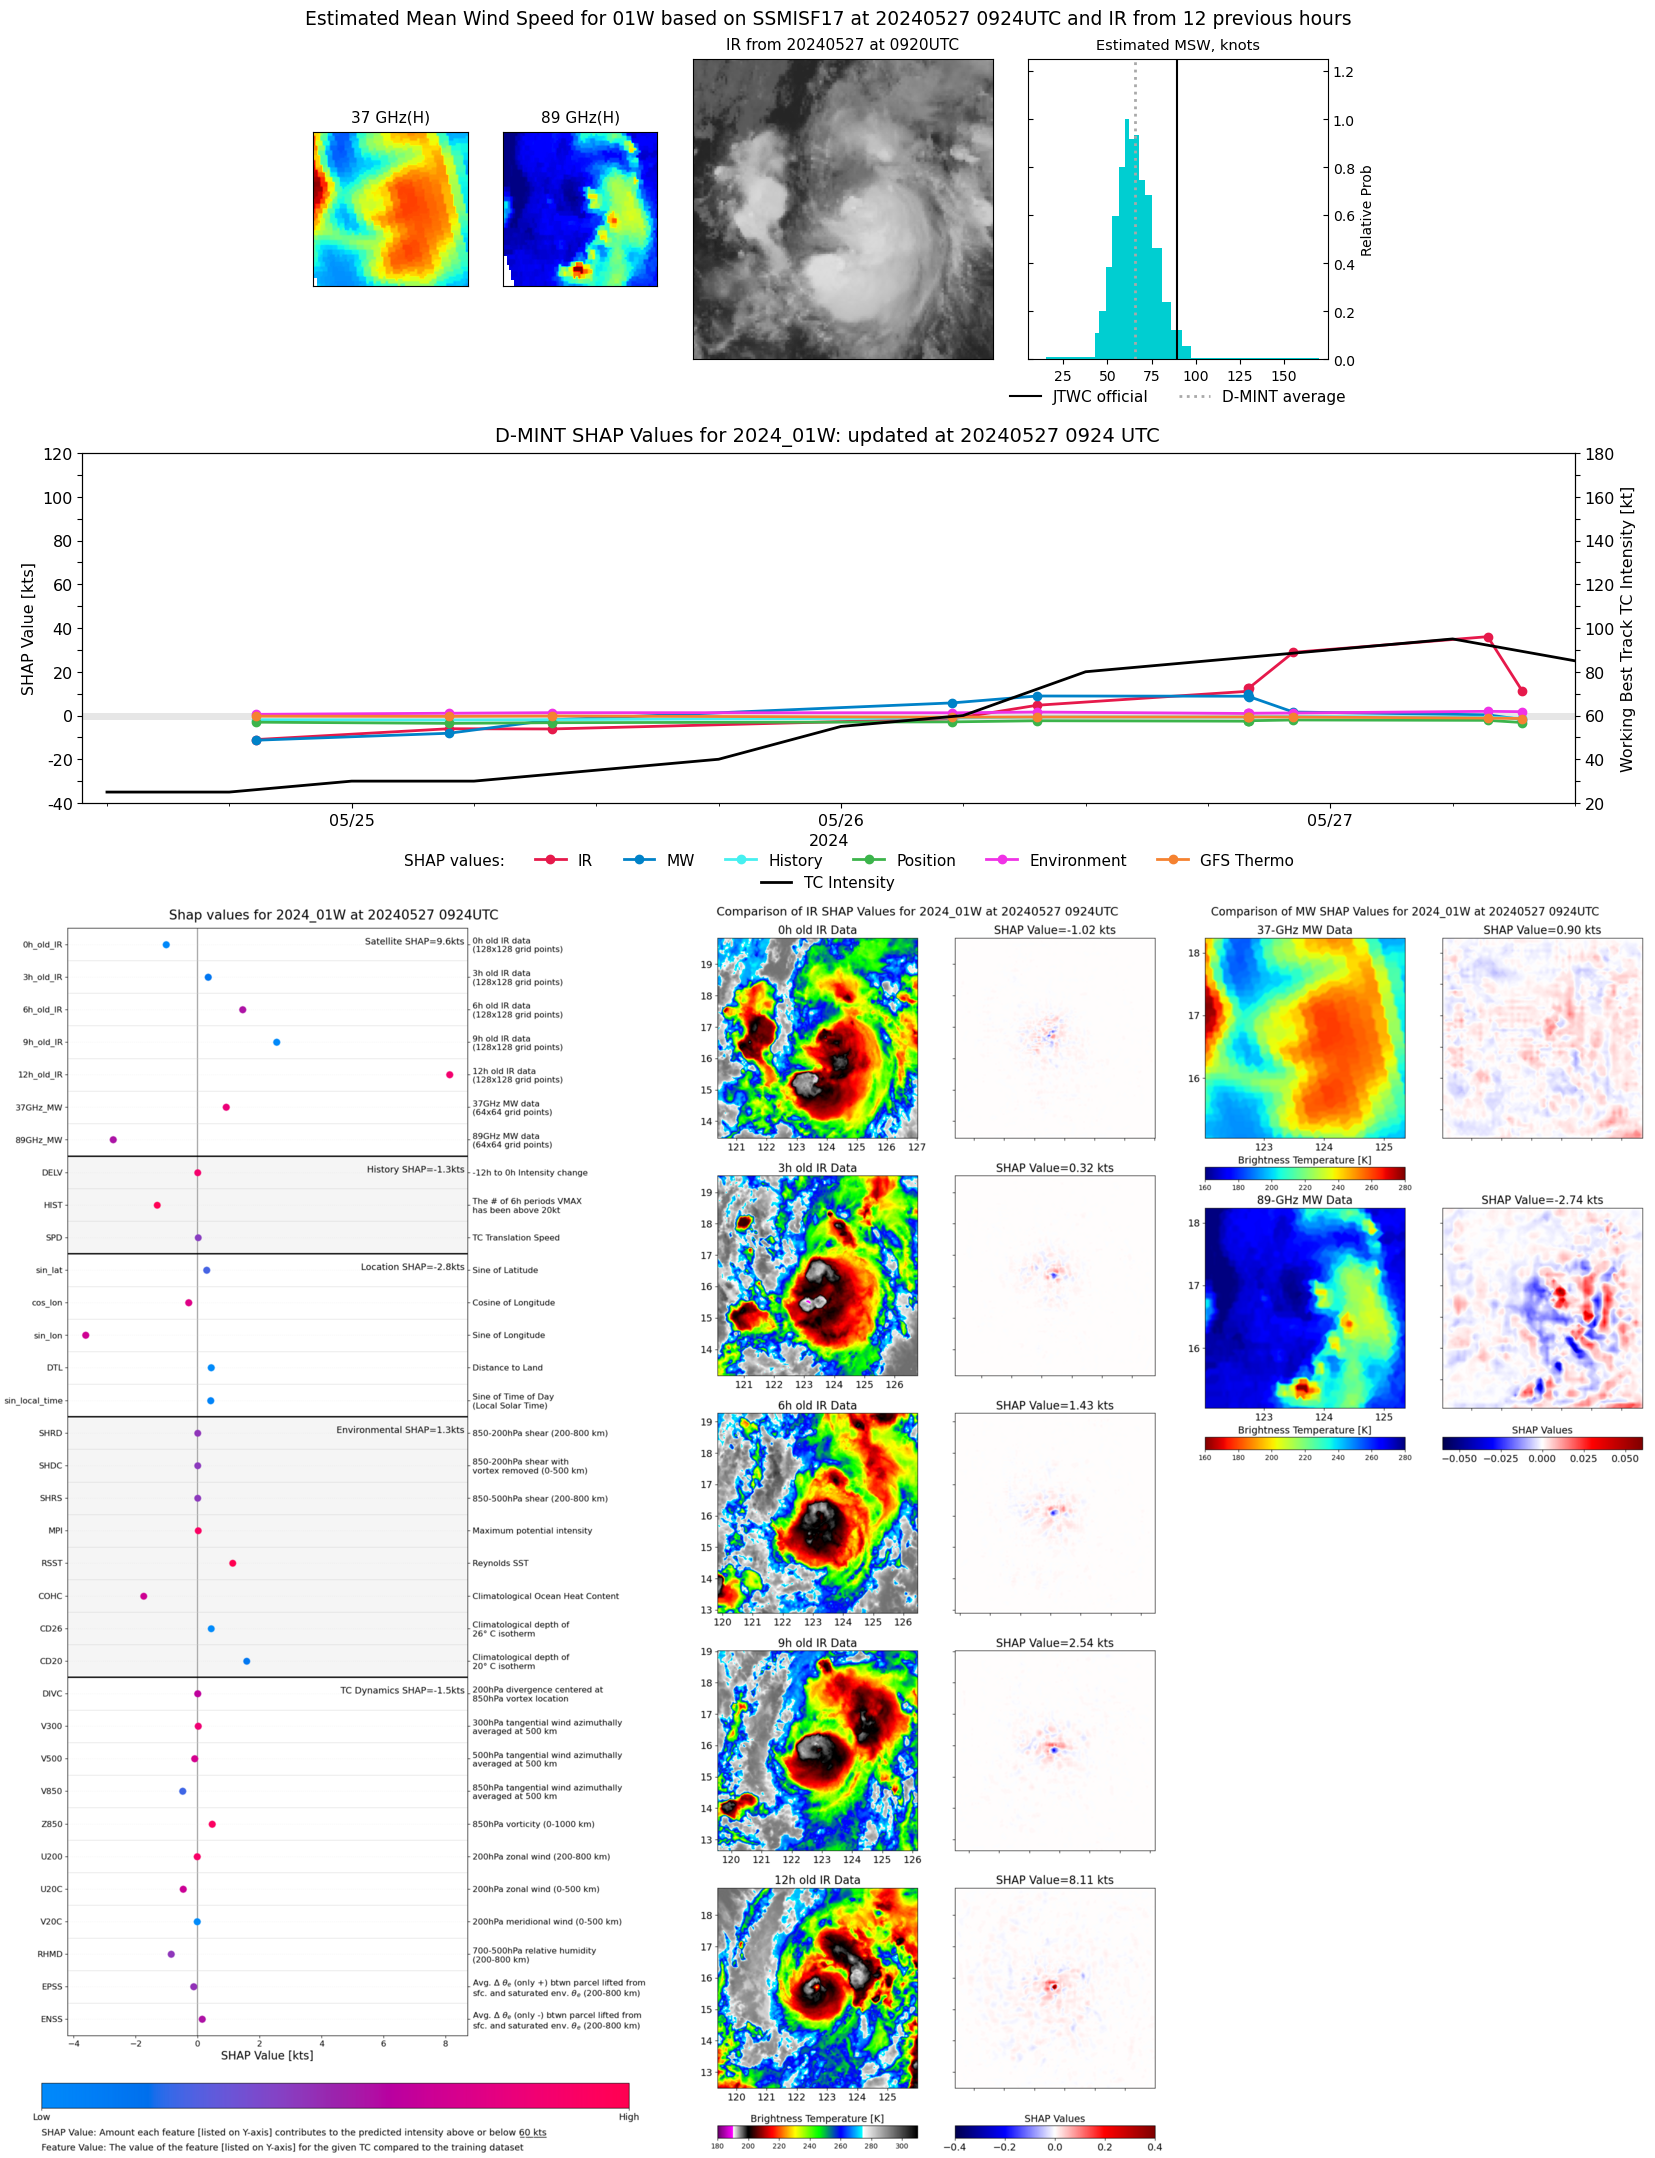 |
| 20240527 | 0743 UTC | SSMISF18 | 952 hPa | 94 kts | 86 kts | 103 kts | 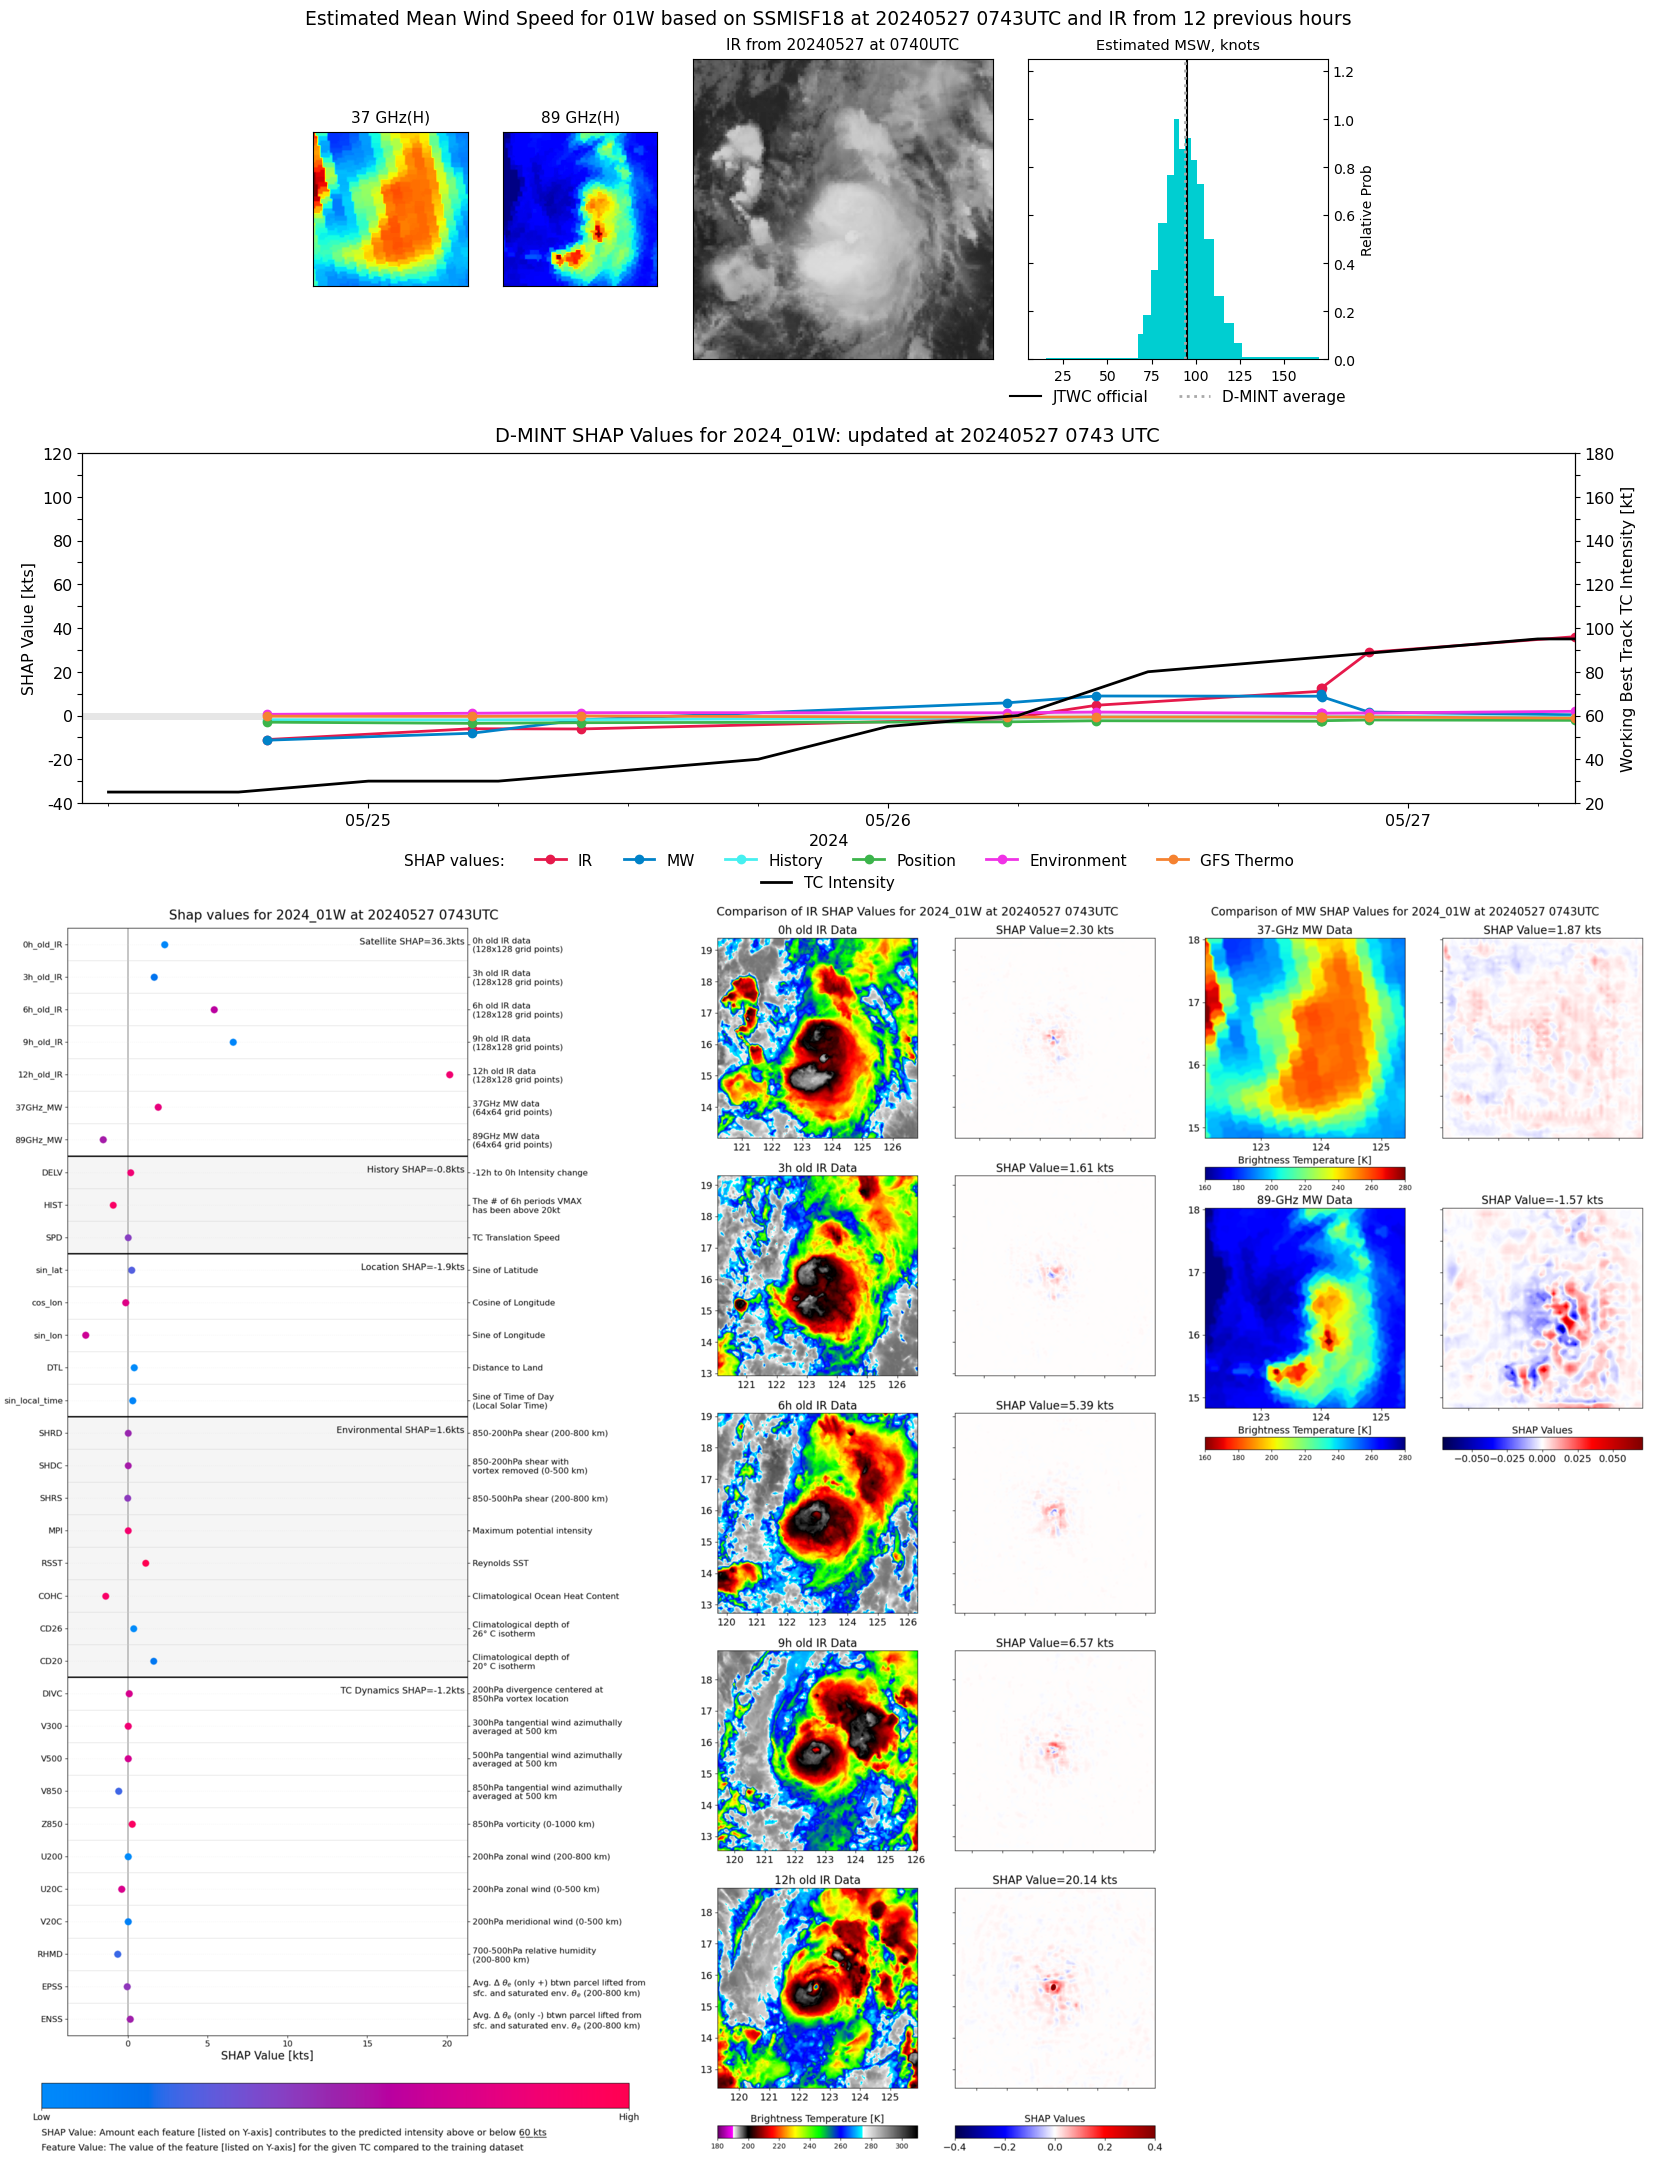 |
| 20240526 | 2211 UTC | SSMISF17 | 958 hPa | 88 kts | 80 kts | 97 kts | 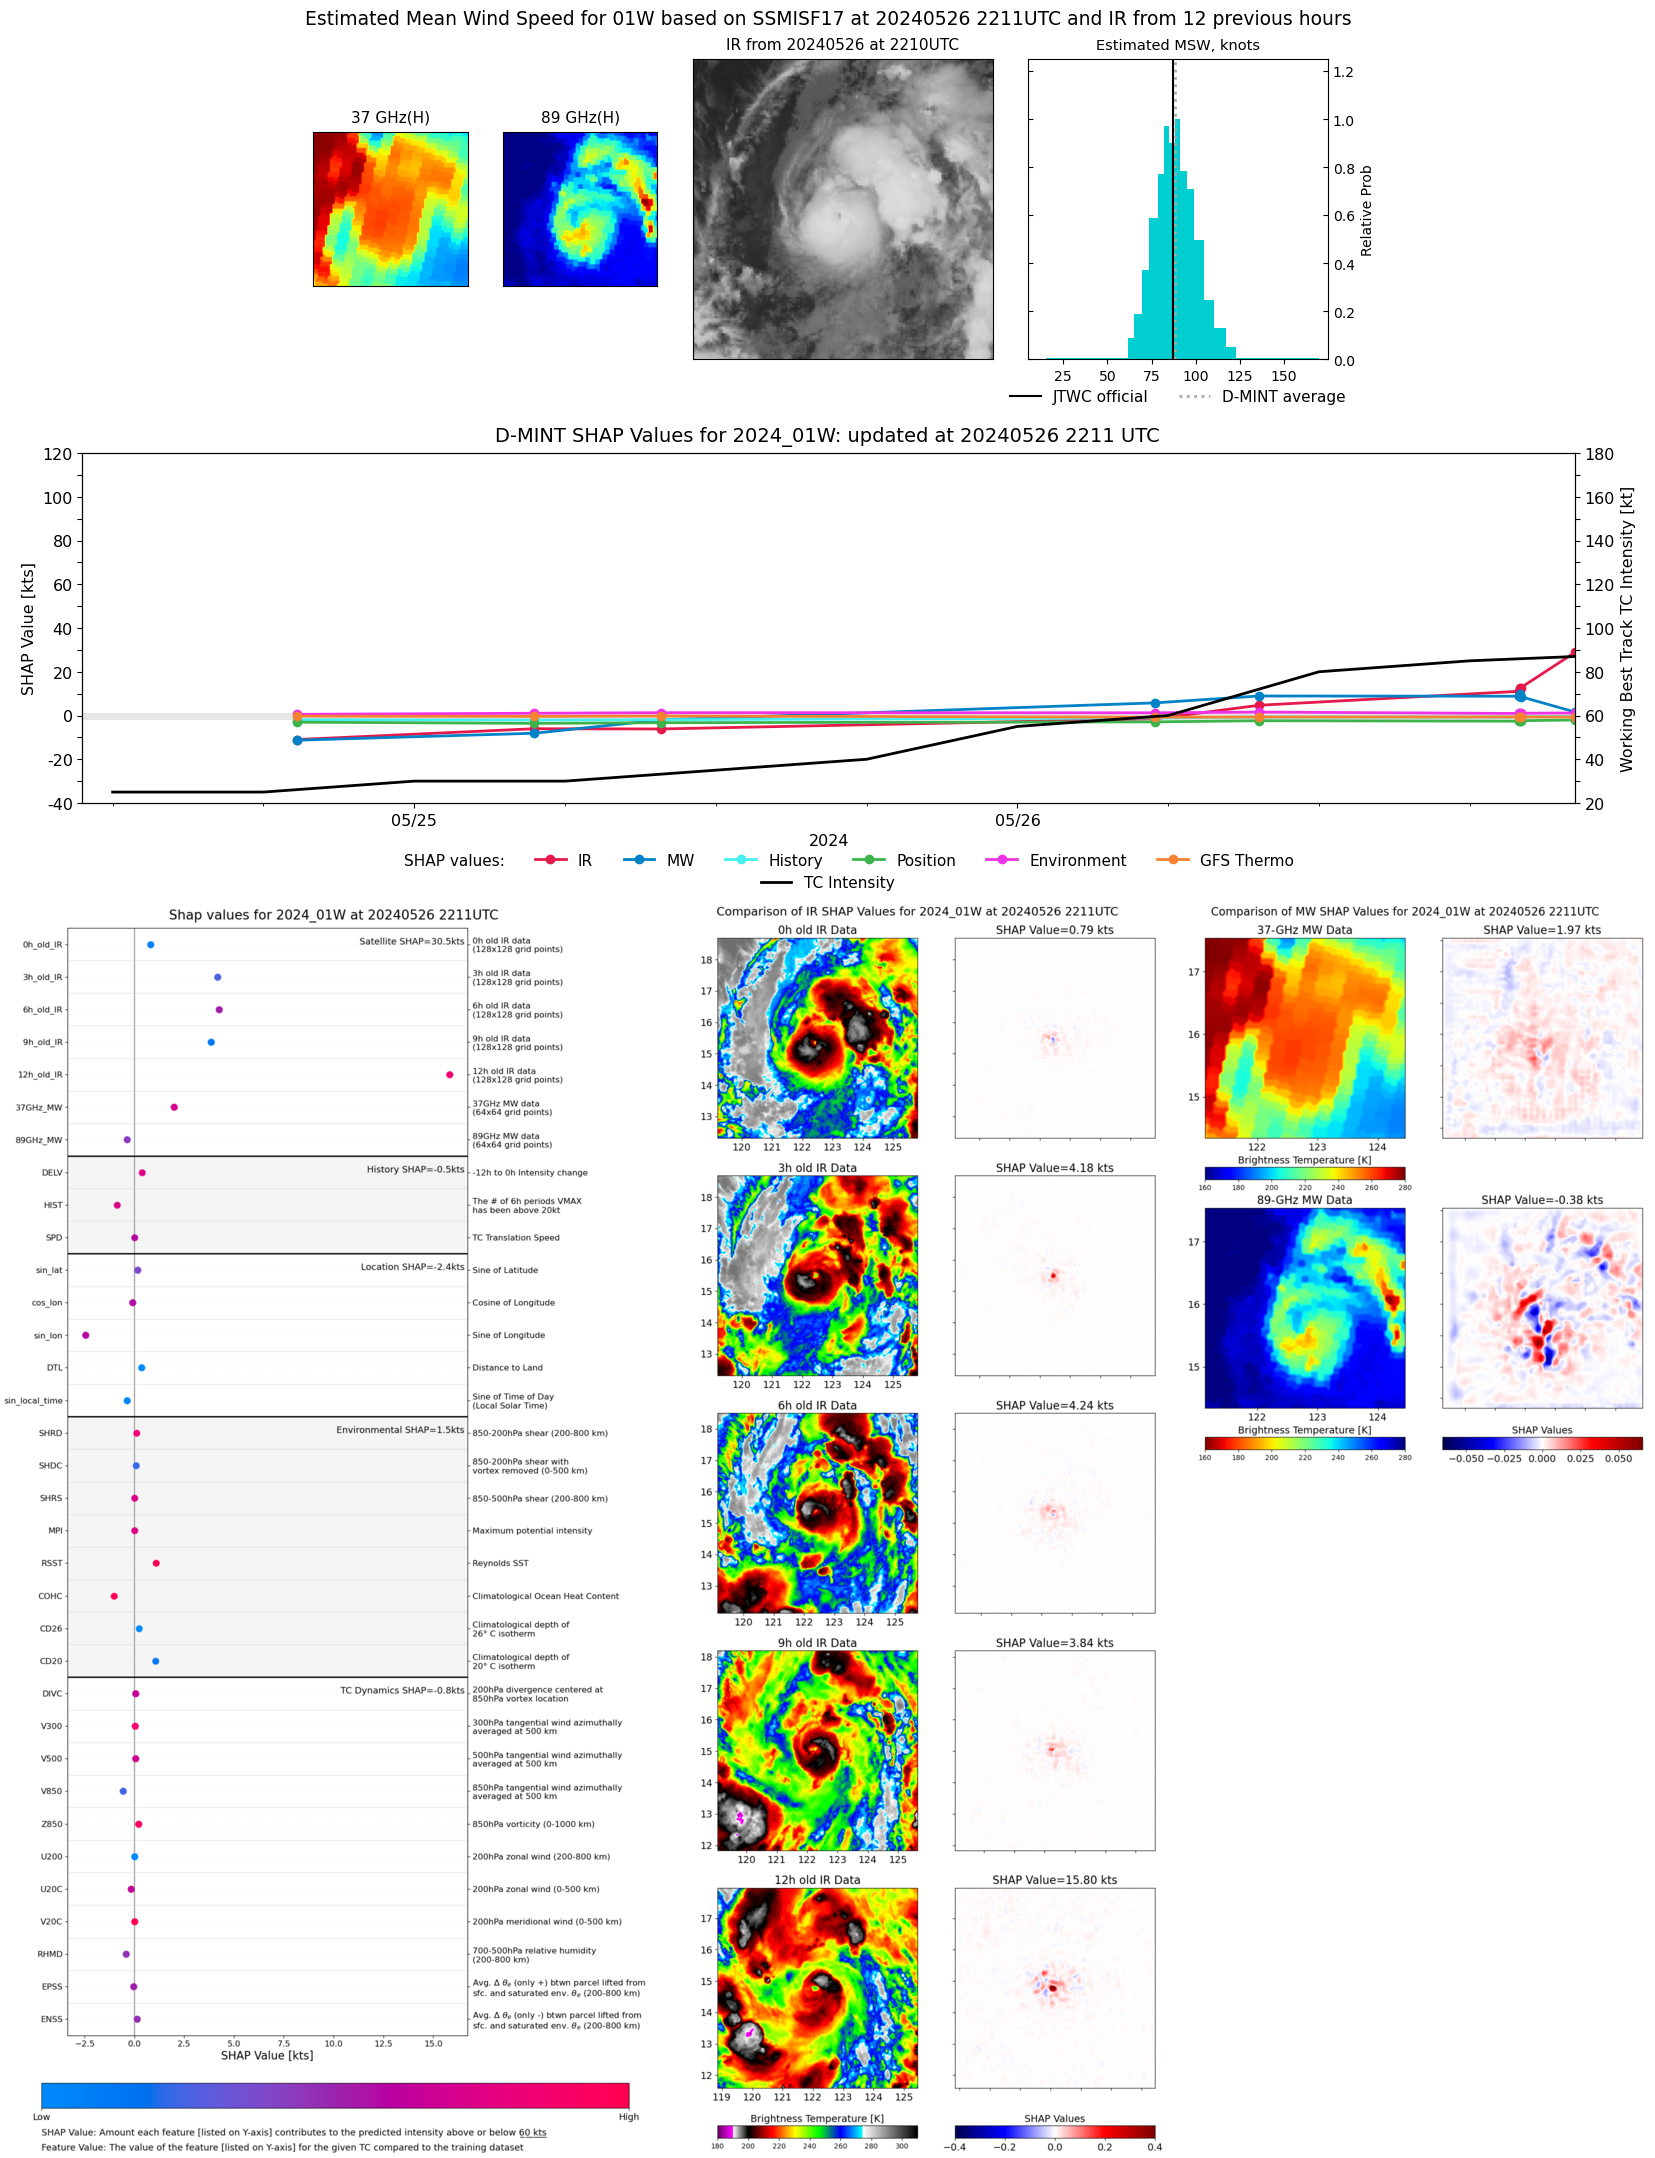 |
| 20240526 | 2002 UTC | GMI | 958 hPa | 79 kts | 71 kts | 87 kts |  |
| 20240526 | 1959 UTC | GMI | 956 hPa | 78 kts | 71 kts | 86 kts | 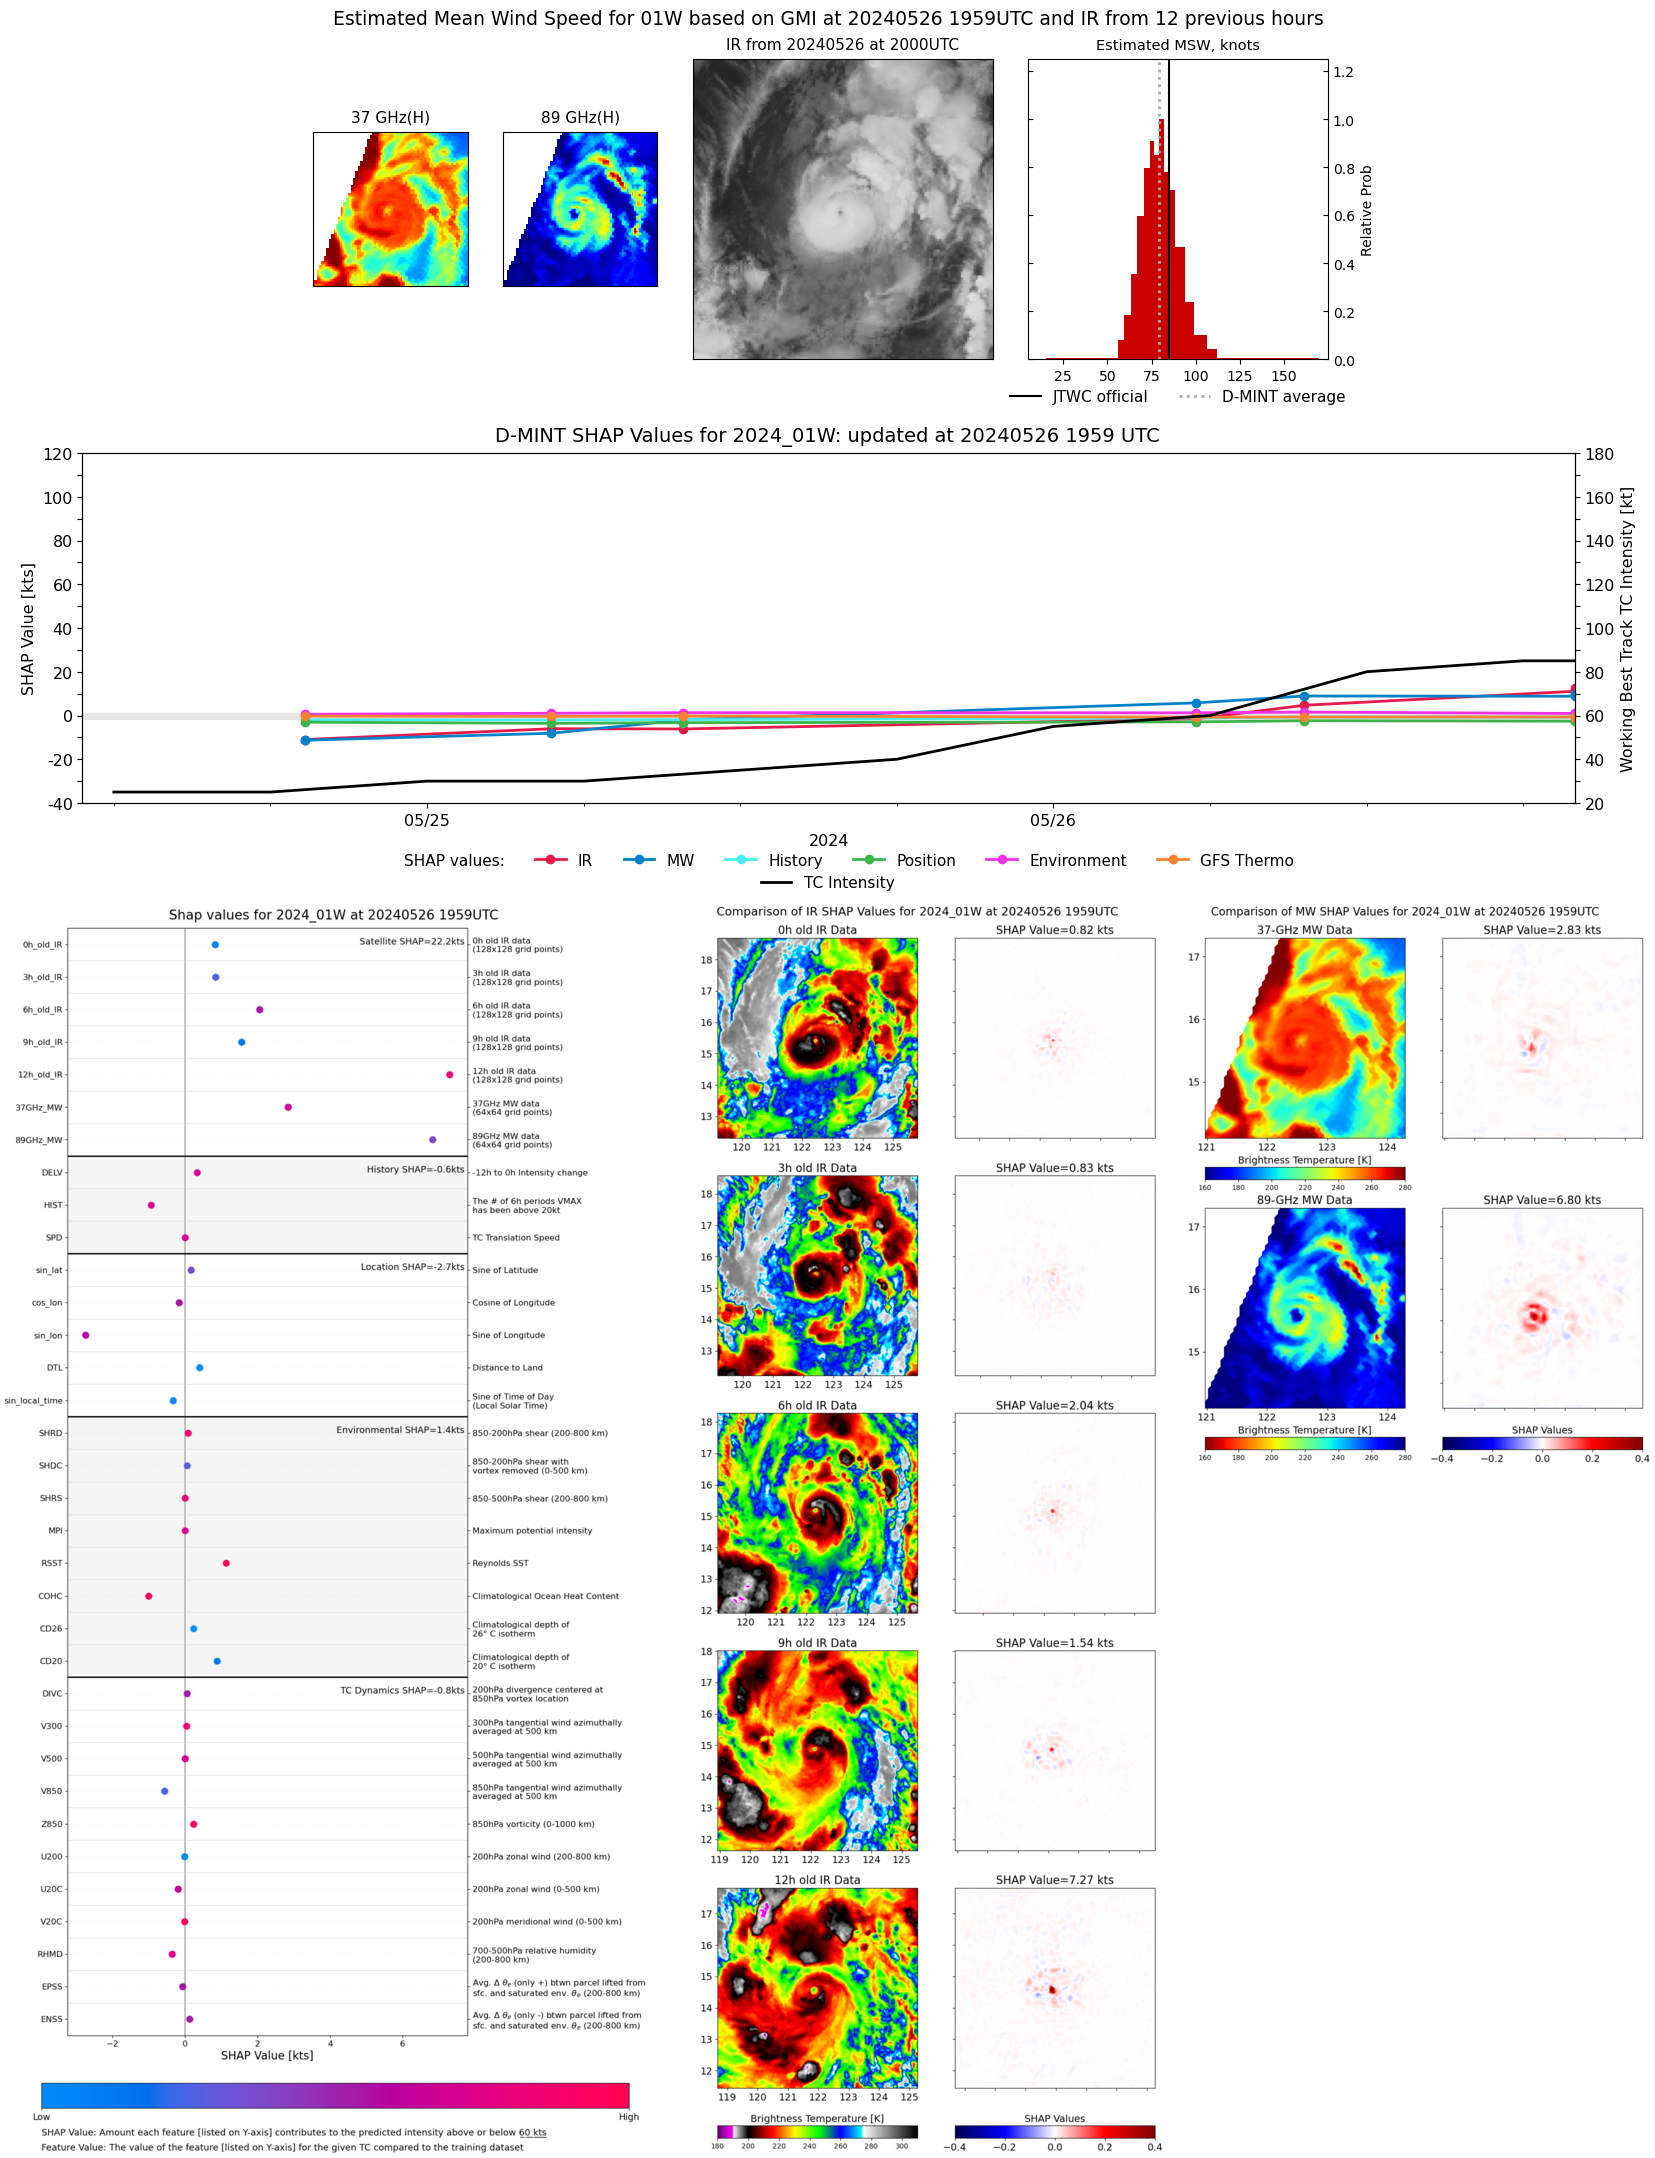 |
| 20240526 | 1958 UTC | GMI | 958 hPa | 77 kts | 69 kts | 85 kts | 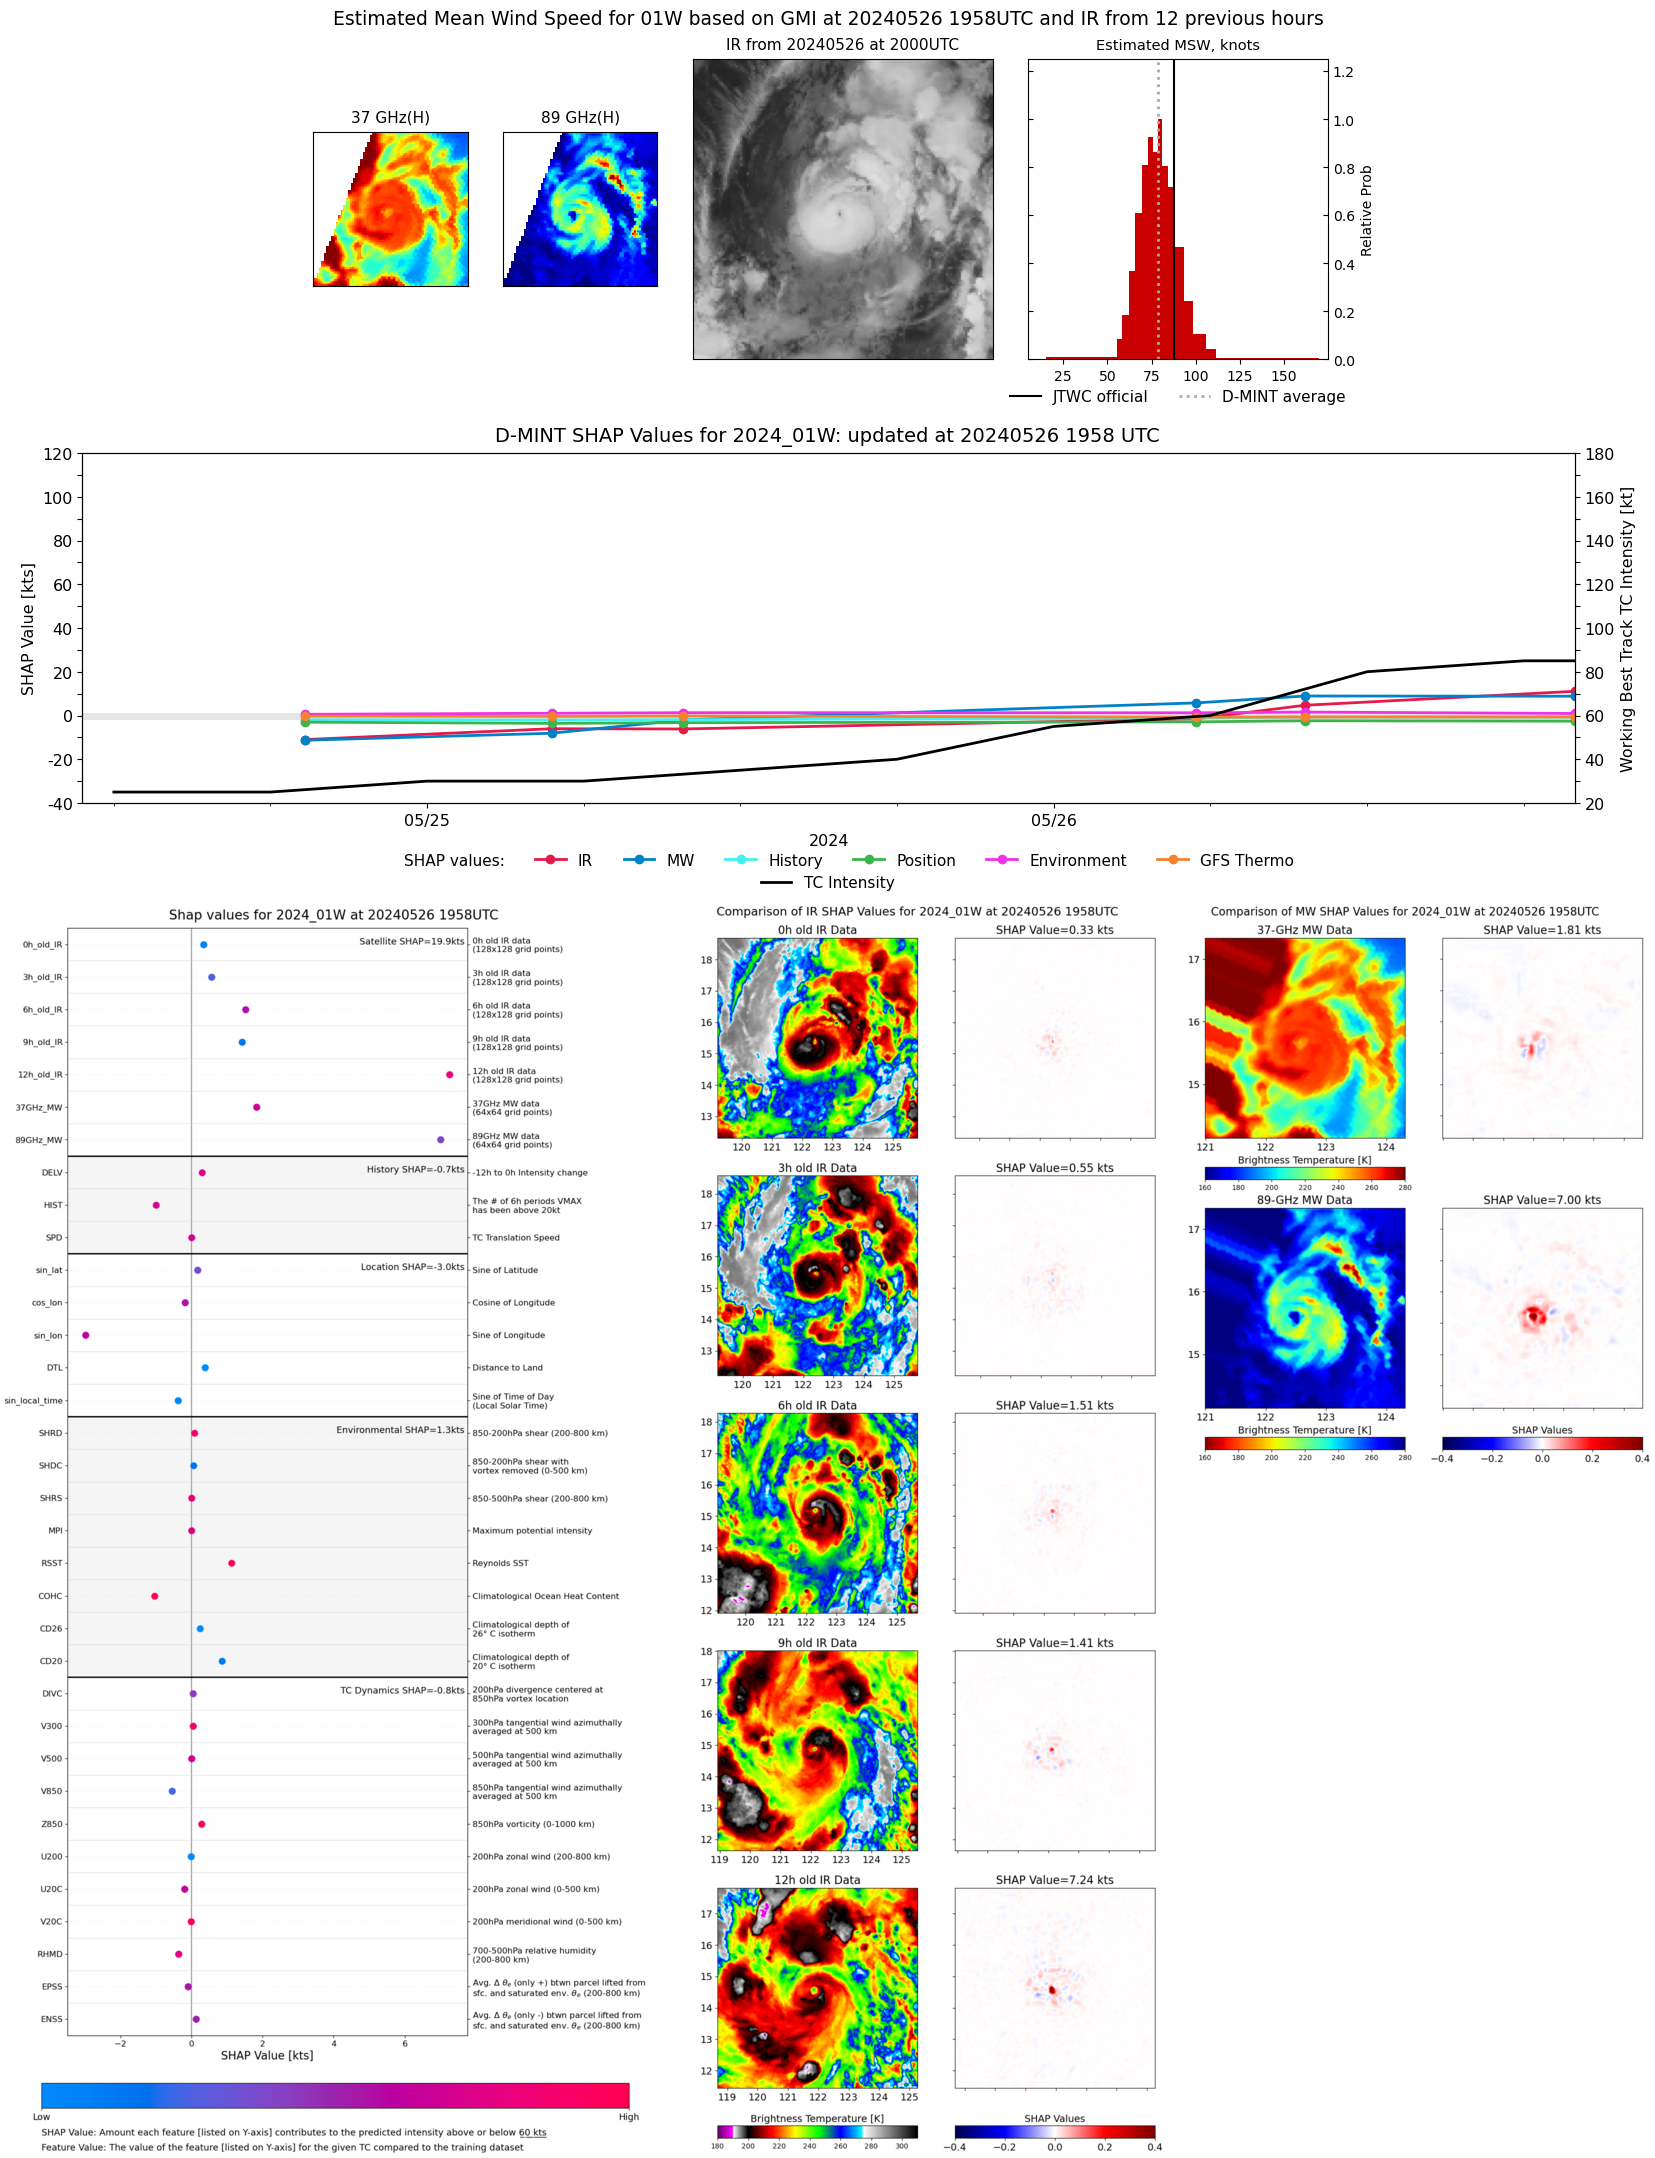 |
| 20240526 | 1742 UTC | AMSR2 | 966 hPa | 72 kts | 64 kts | 81 kts | 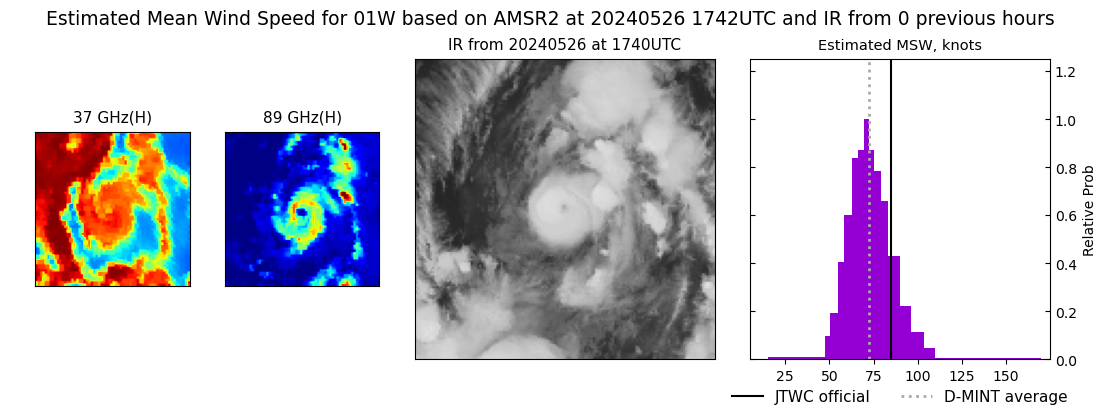 |
| 20240526 | 0958 UTC | SSMISF16 | 984 hPa | 63 kts | 56 kts | 71 kts | 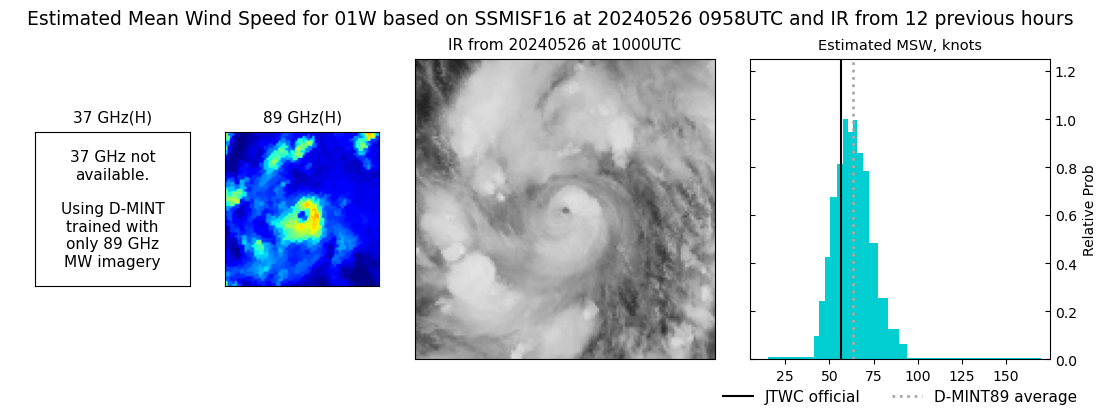 |
| 20240526 | 0937 UTC | SSMISF17 | 971 hPa | 71 kts | 64 kts | 79 kts | 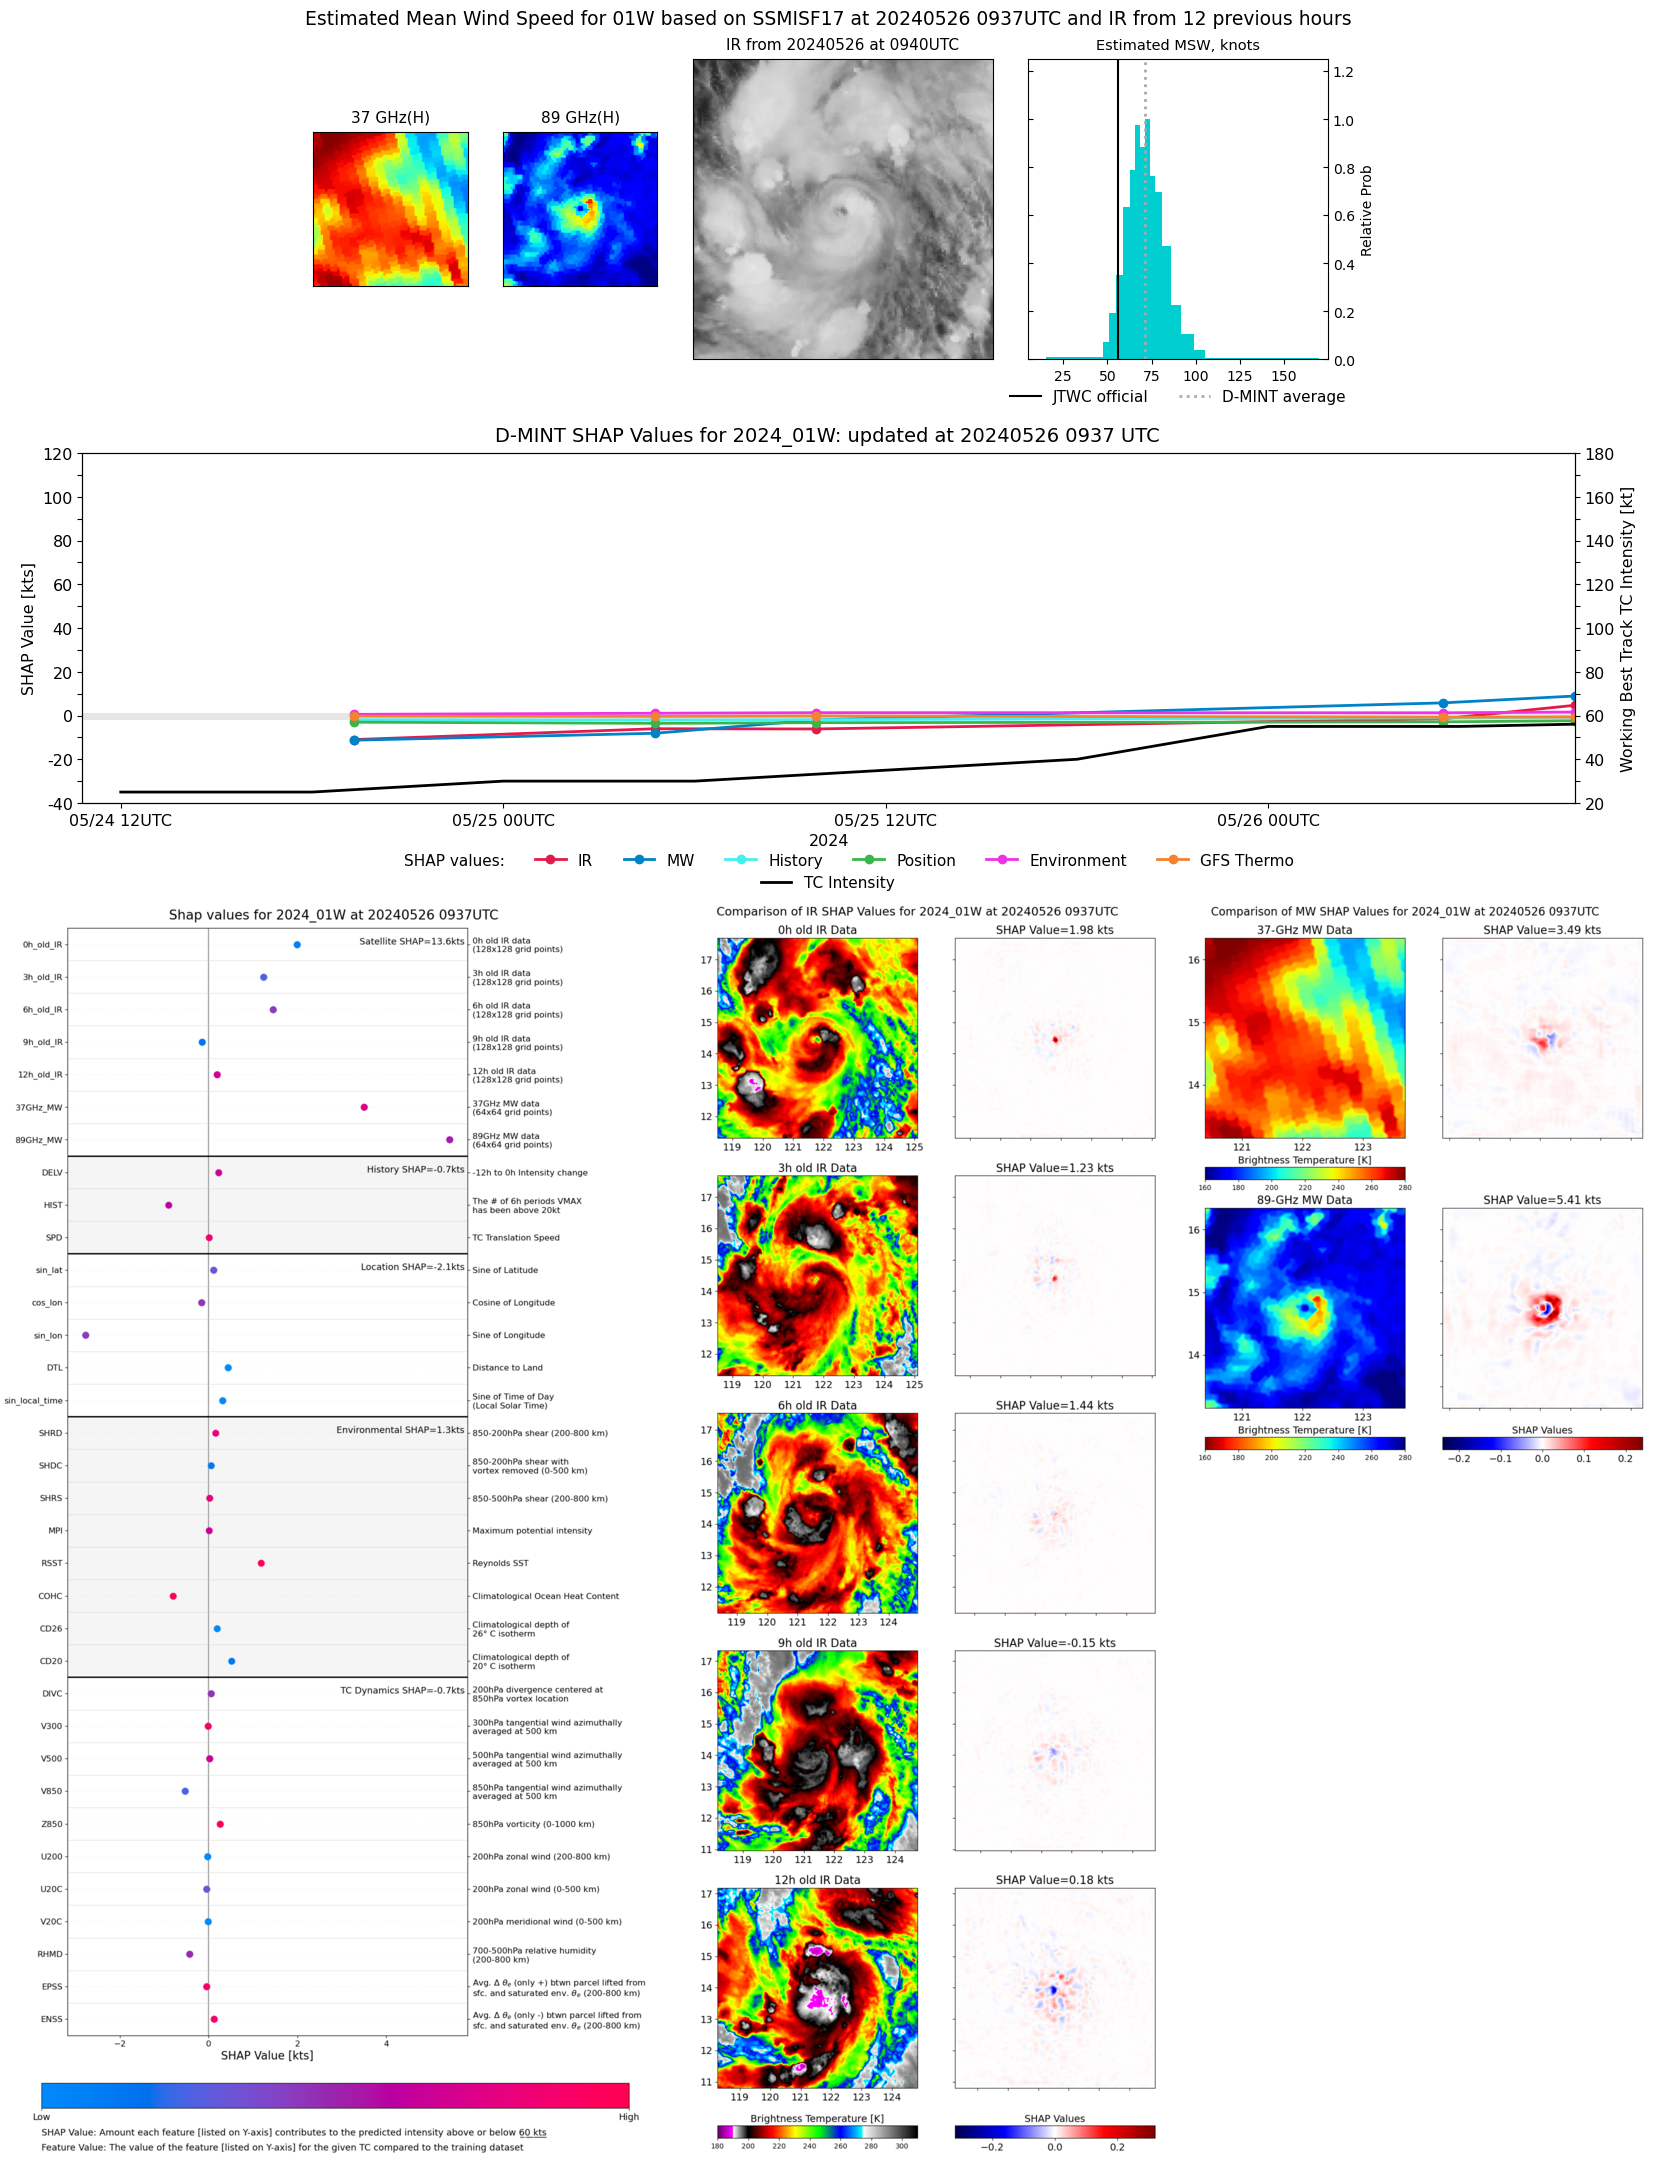 |
| 20240526 | 0528 UTC | AMSR2 | 980 hPa | 61 kts | 53 kts | 68 kts |  |
| 20240525 | 2038 UTC | GMI | 990 hPa | 54 kts | 47 kts | 62 kts | 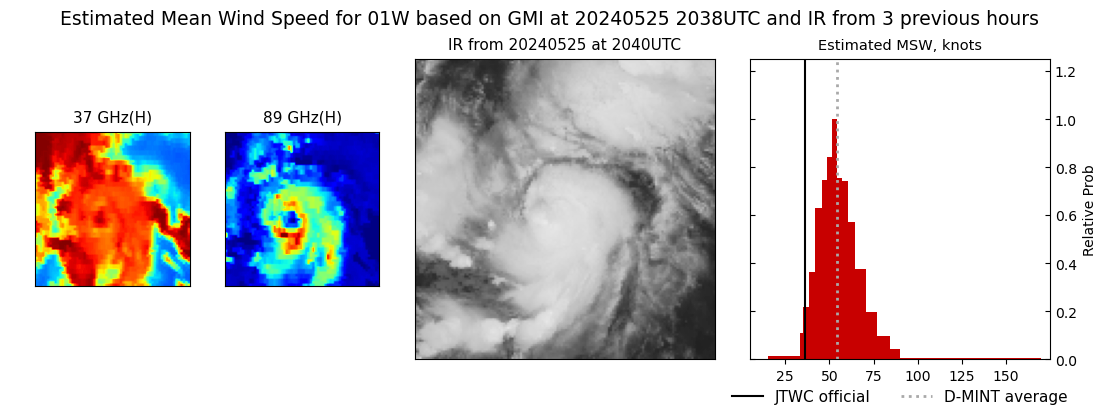 |
| 20240525 | 0949 UTC | SSMISF17 | 995 hPa | 48 kts | 41 kts | 55 kts |  |
| 20240525 | 0446 UTC | AMSR2 | 996 hPa | 41 kts | 35 kts | 47 kts | 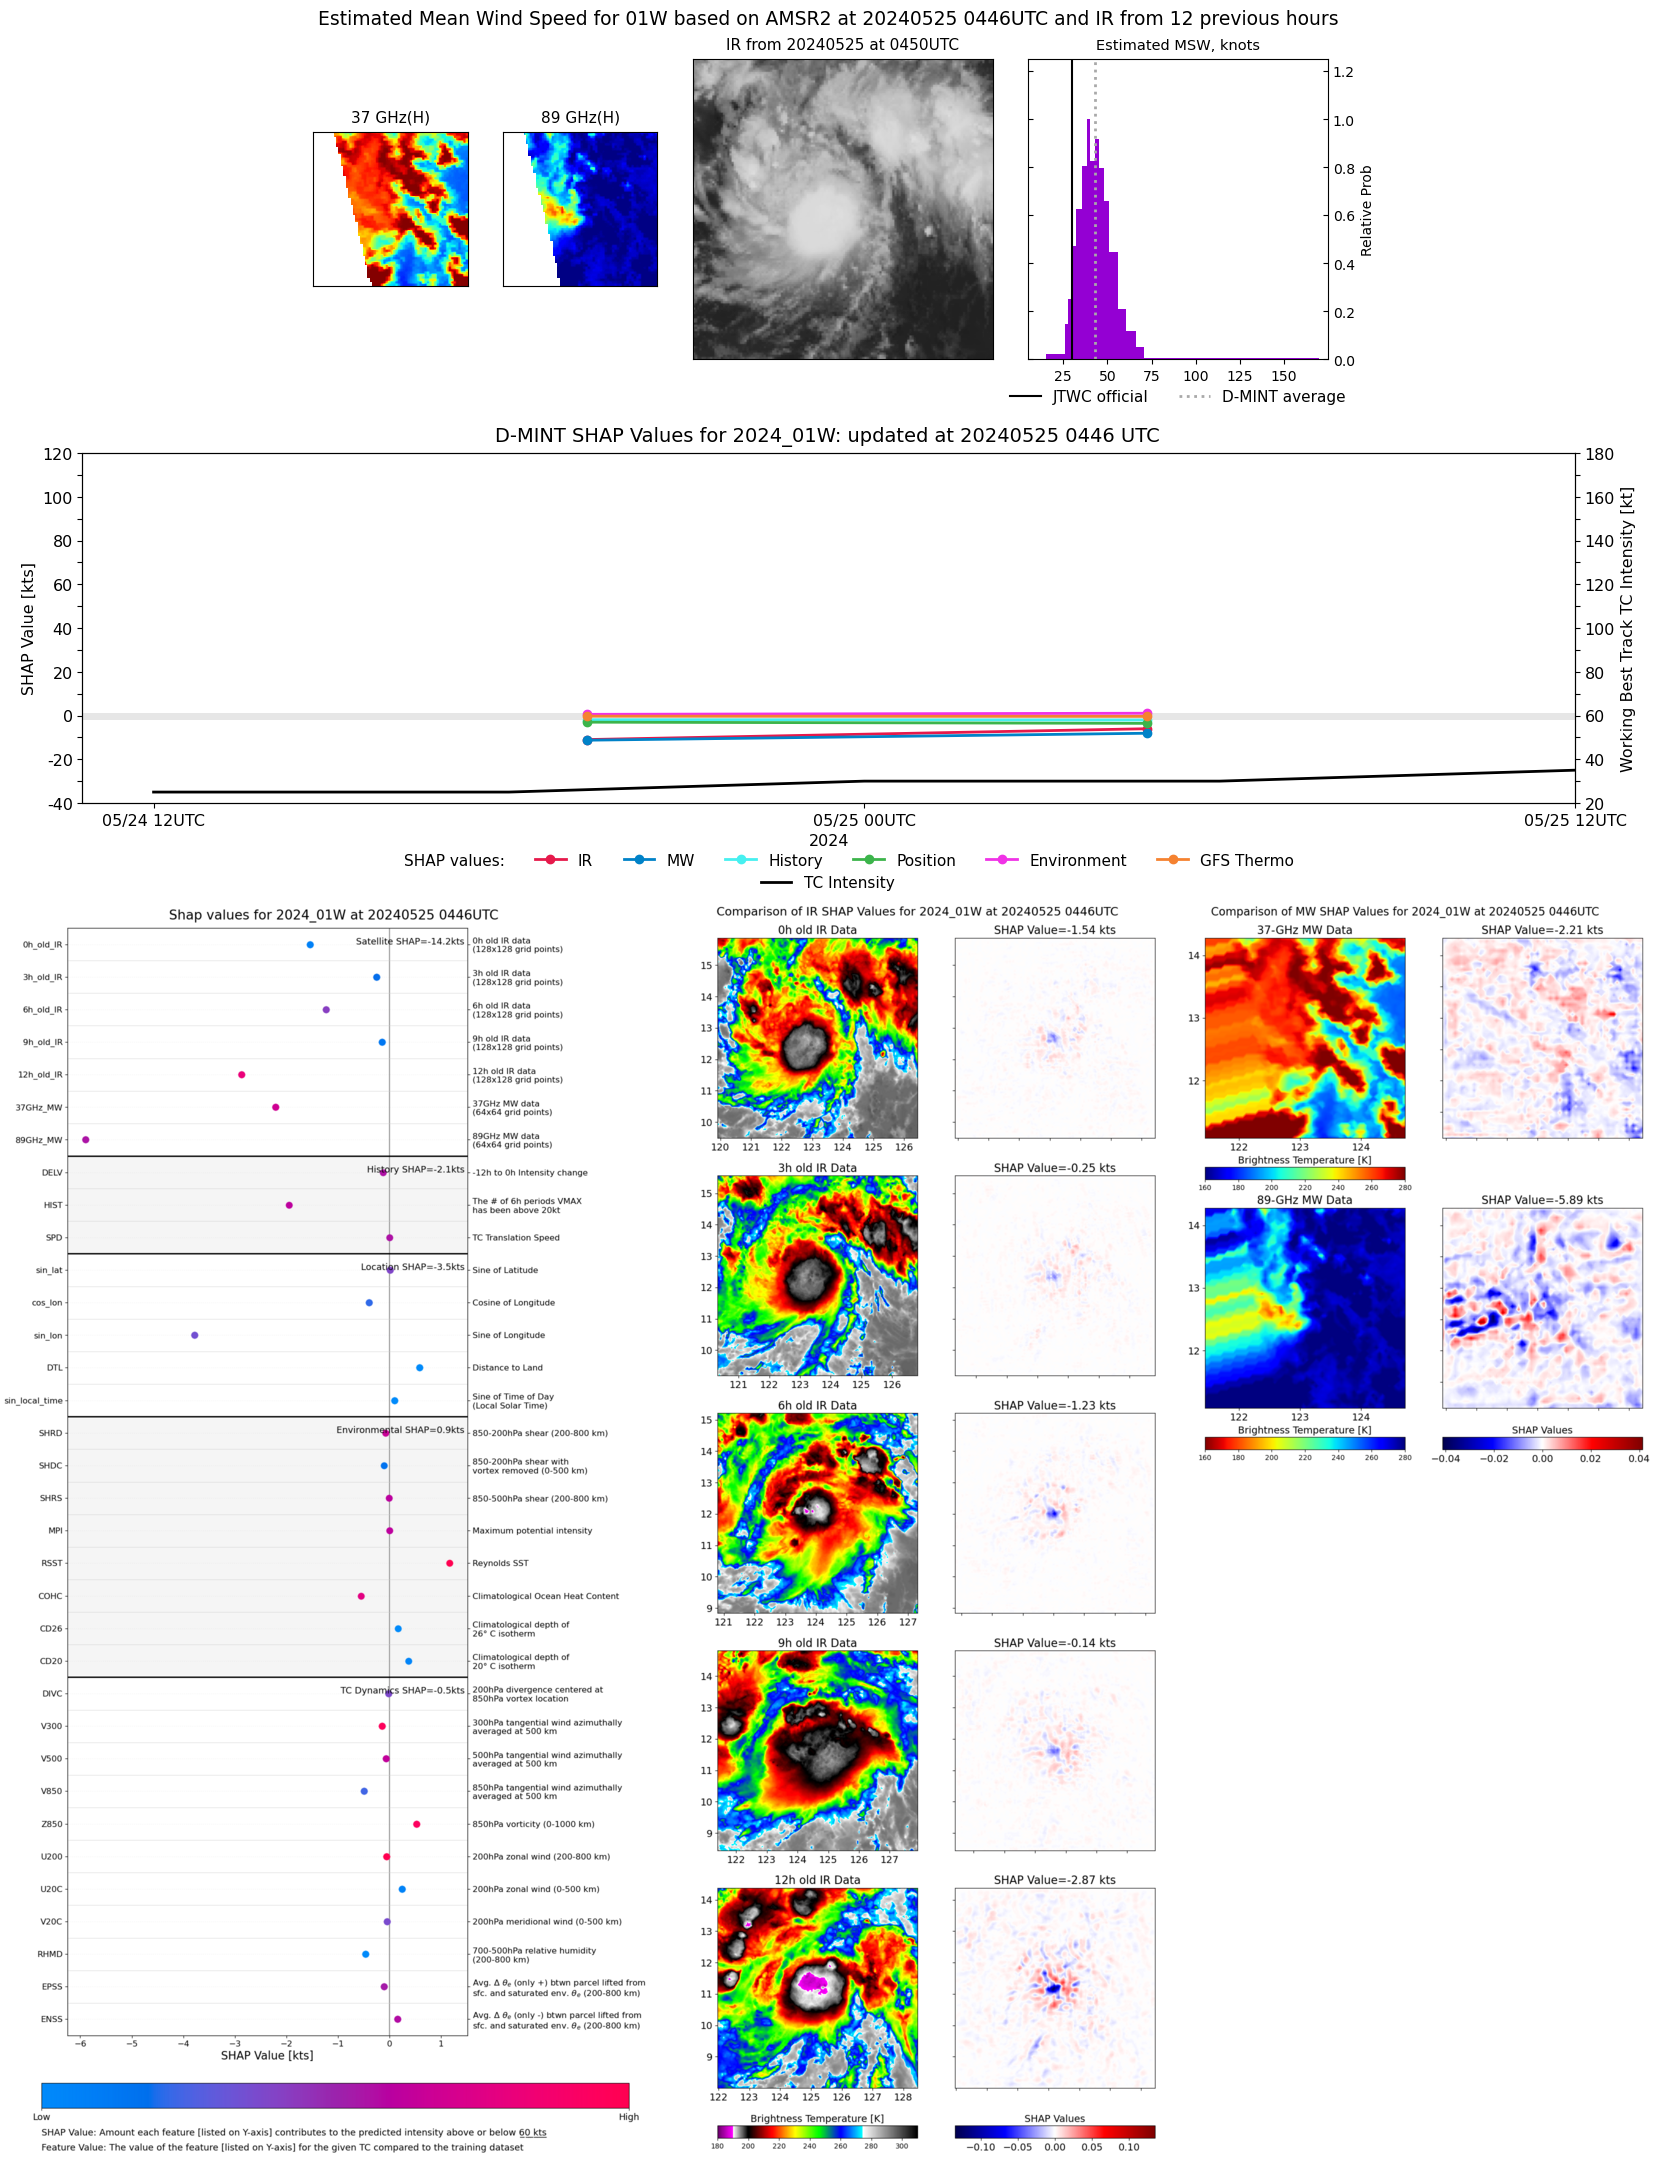 |
| 20240524 | 2121 UTC | SSMISF16 | 997 hPa | 32 kts | 27 kts | 36 kts |  |
| 20240524 | 1919 UTC | SSMISF18 | 997 hPa | 33 kts | 28 kts | 38 kts | 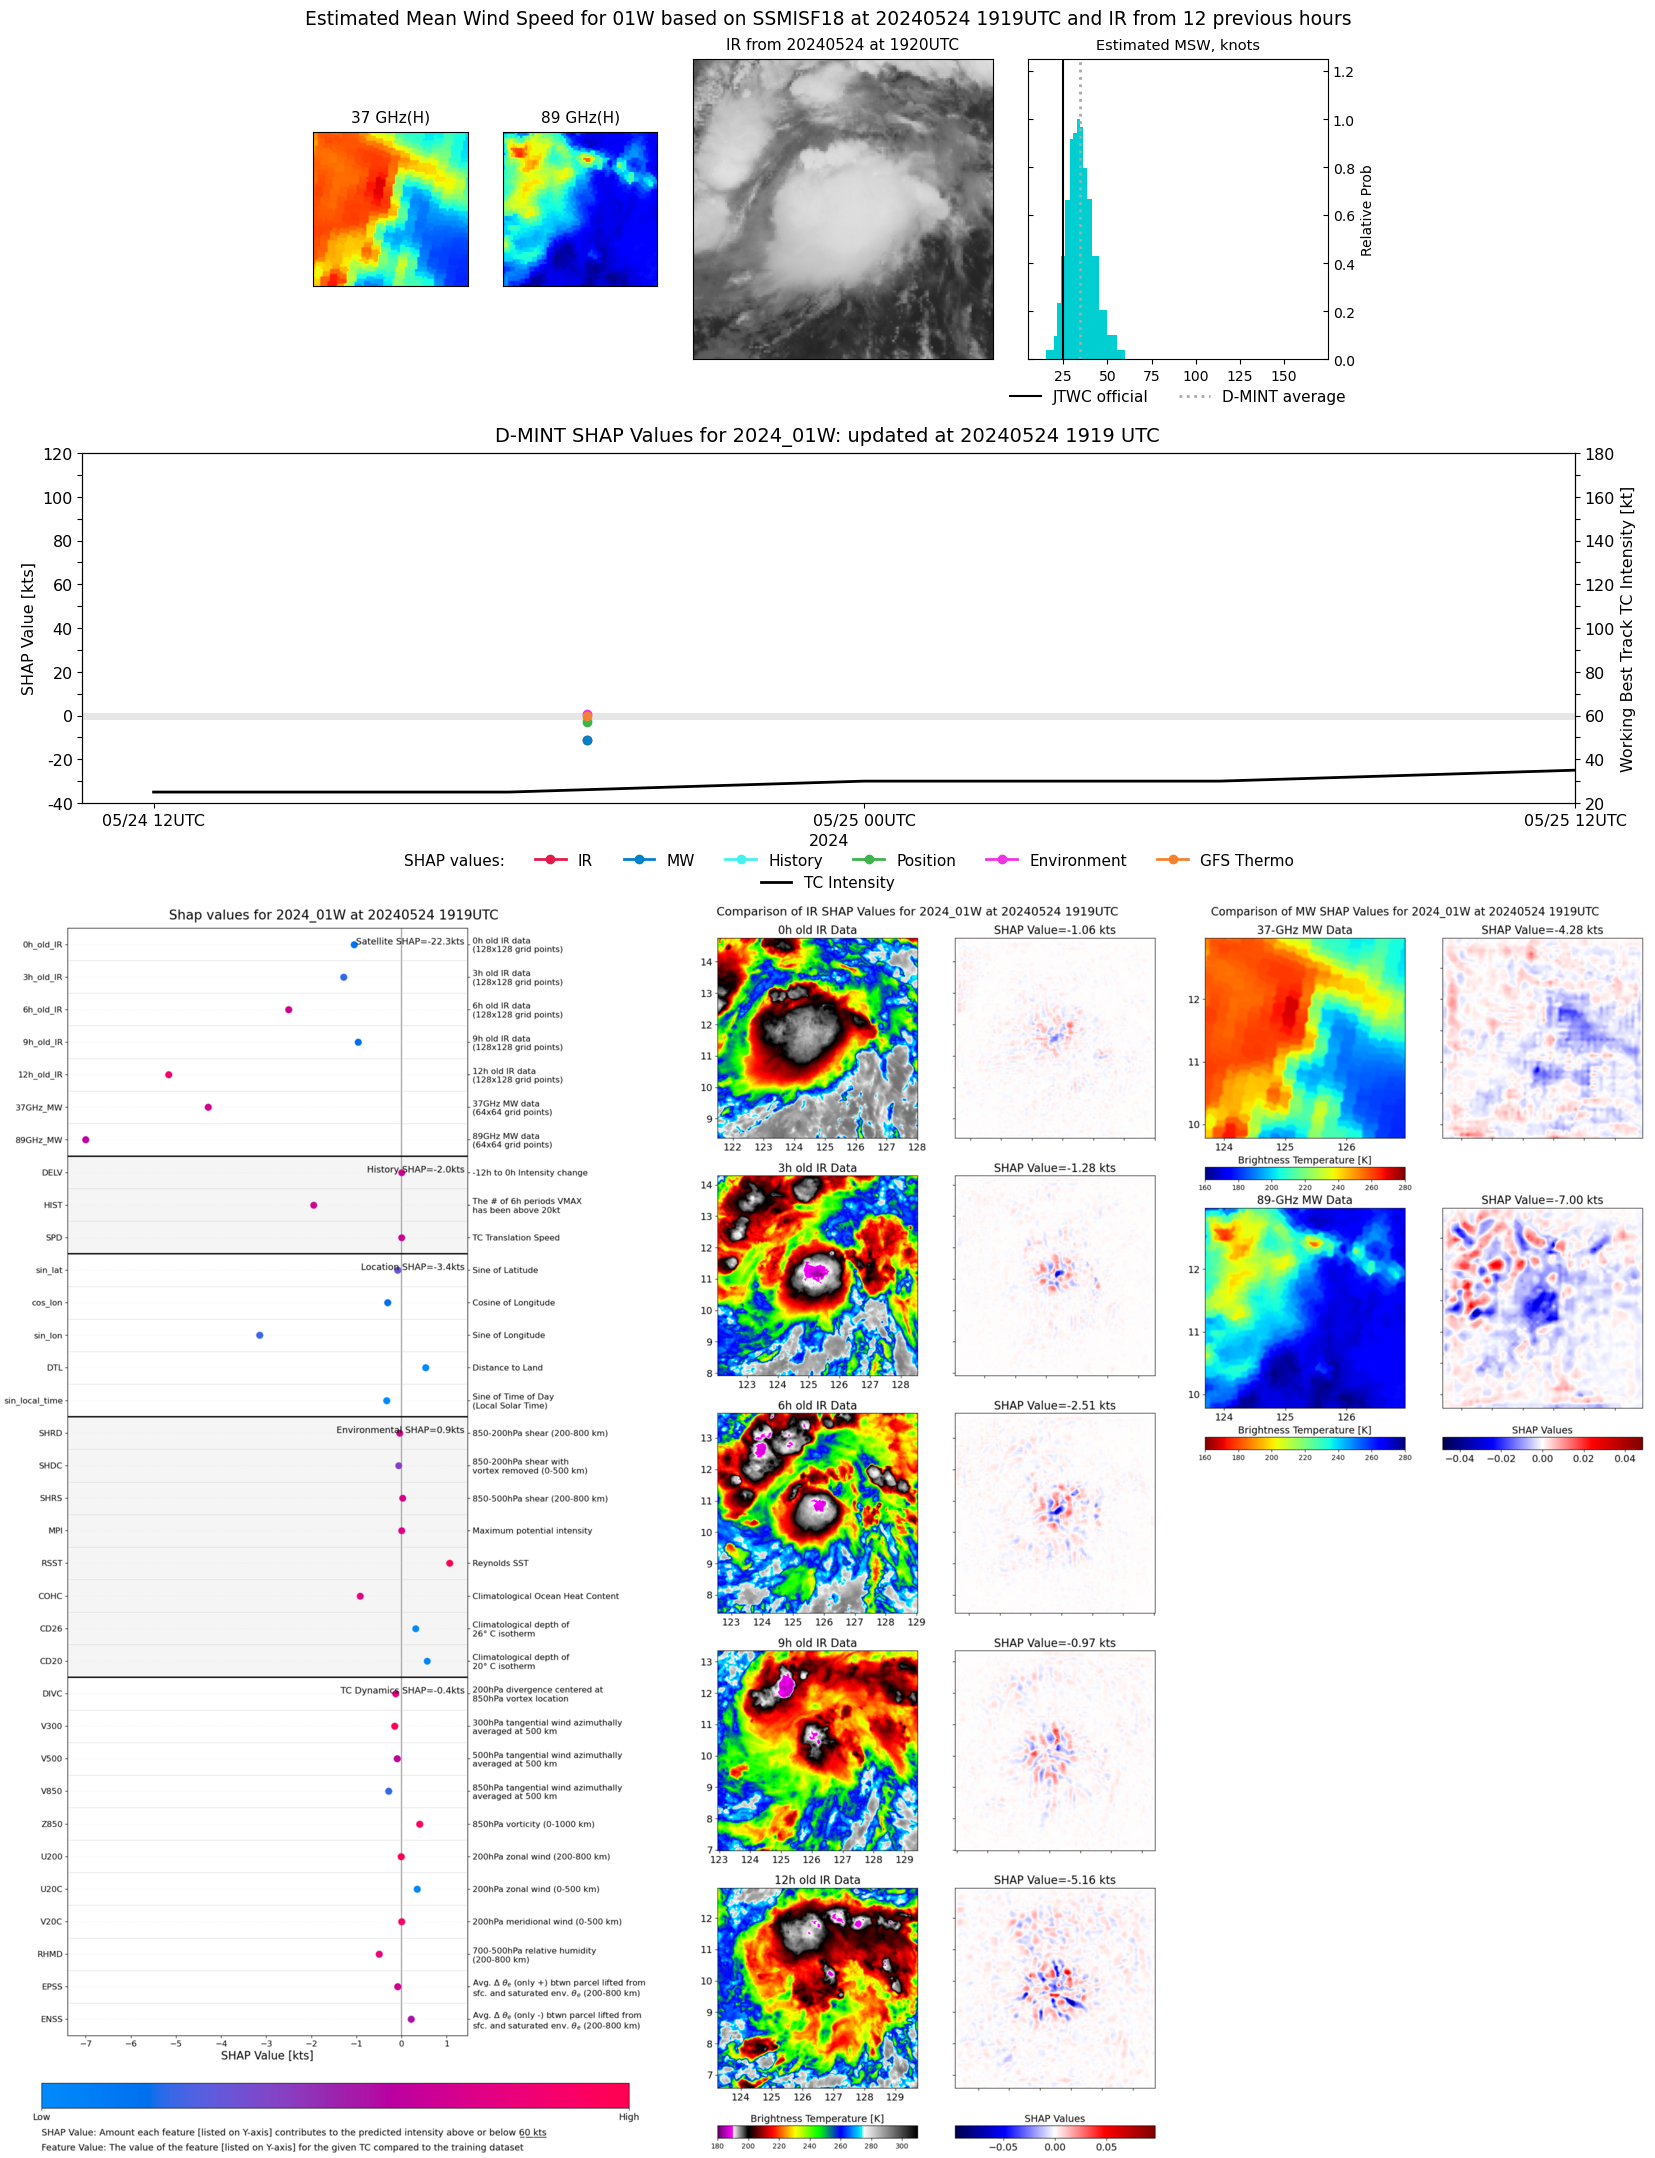 |