|
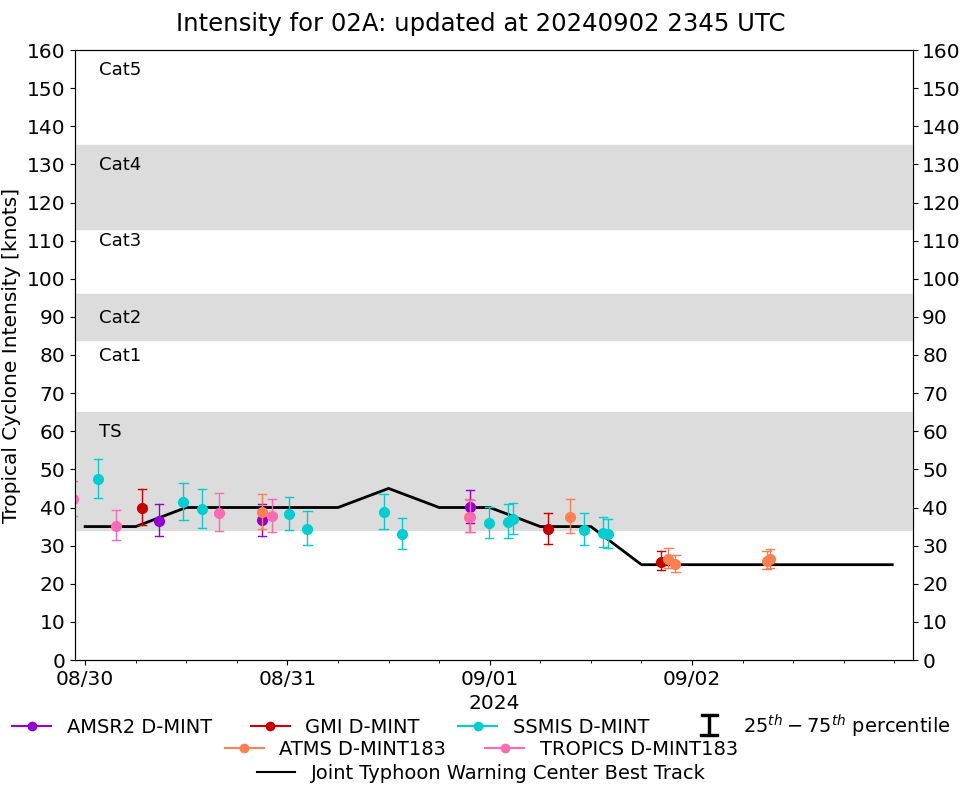
Storm: 02A
D-MINT HISTORY FILE for 2024_02A
| Date | Time | MW Sensor | MSLP | Vmax
(30th-70th percentile average) | Vmax
25th percentile | Vmax
75th percentile | Image |
| 20240902 | 0914 UTC | ATMS-N20 | 998 hPa | 26 kts | 24 kts | 29 kts | 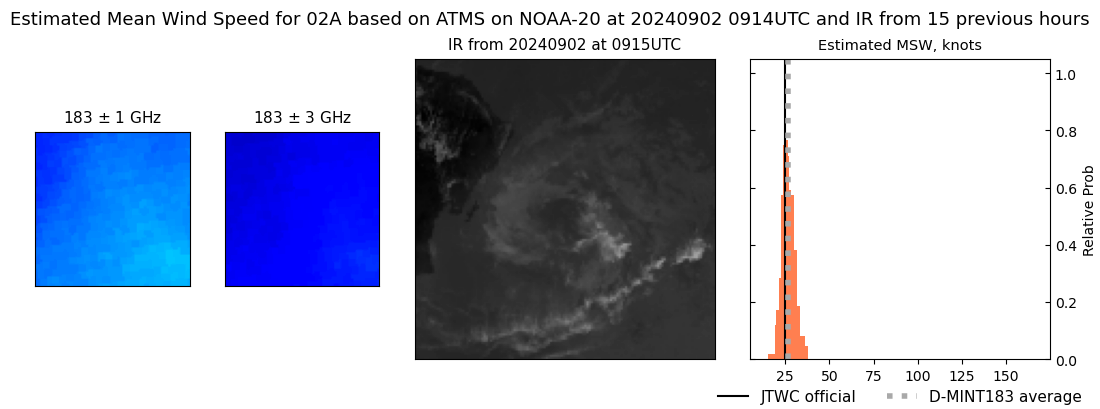 |
| 20240902 | 0850 UTC | ATMS-NPP | 998 hPa | 26 kts | 24 kts | 29 kts | 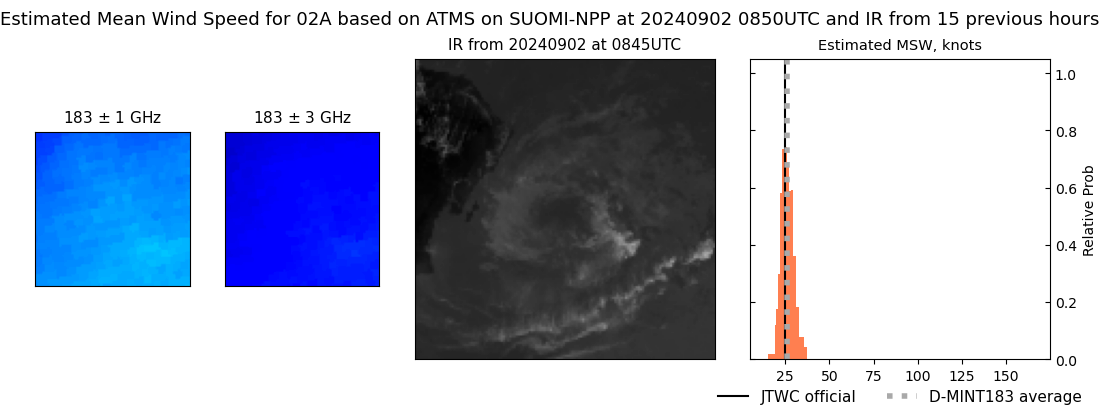 |
| 20240901 | 2201 UTC | ATMS-N20 | 998 hPa | 25 kts | 23 kts | 28 kts | 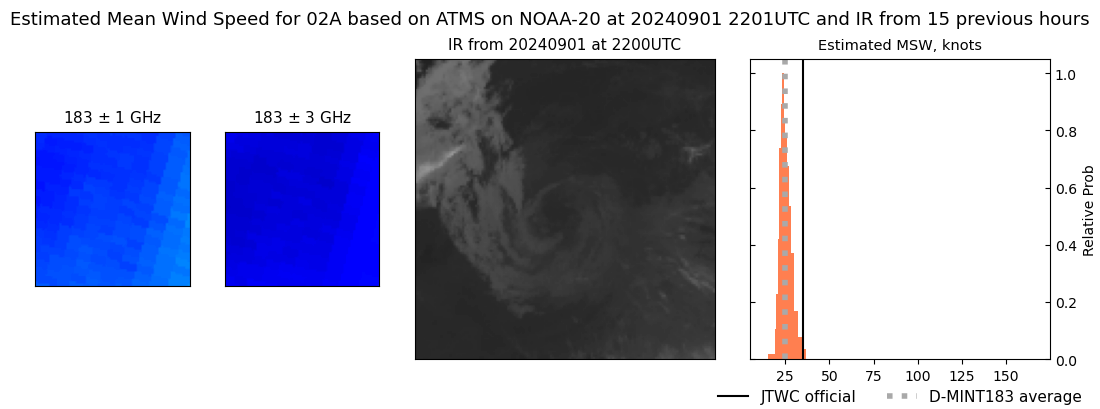 |
| 20240901 | 2112 UTC | ATMS-N21 | 998 hPa | 26 kts | 24 kts | 29 kts | 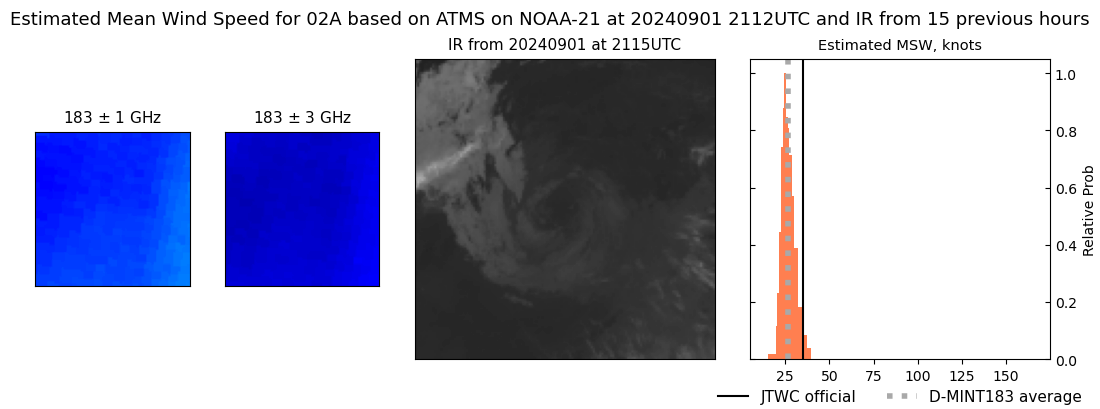 |
| 20240901 | 2018 UTC | GMI | 998 hPa | 26 kts | 24 kts | 29 kts | 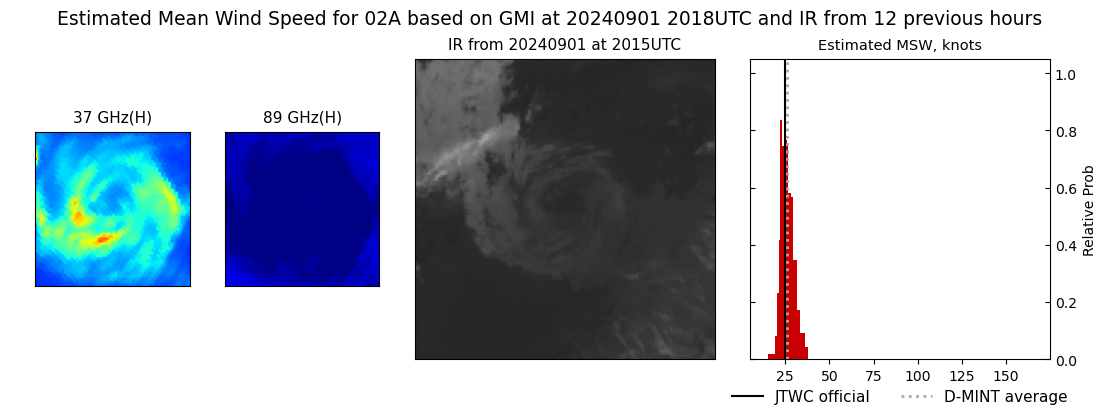 |
| 20240901 | 1359 UTC | SSMISF17 | 995 hPa | 33 kts | 29 kts | 37 kts | 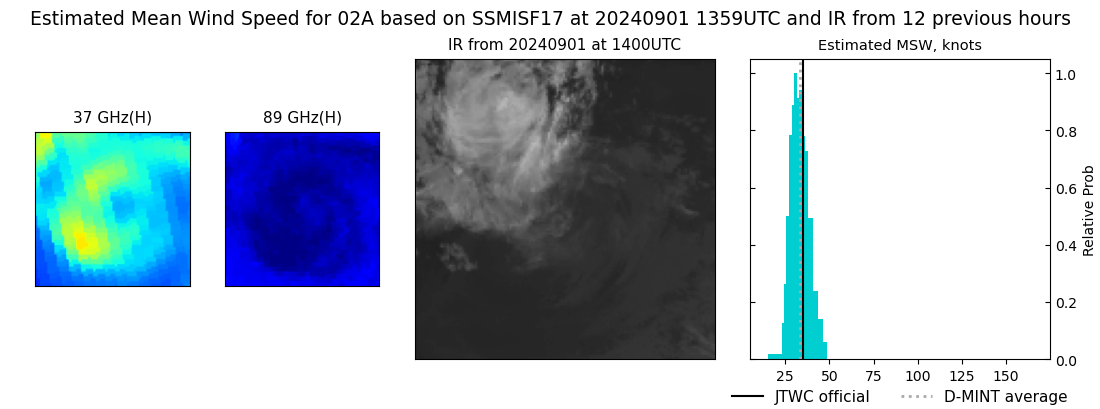 |
| 20240901 | 1324 UTC | SSMISF16 | 994 hPa | 33 kts | 30 kts | 38 kts | 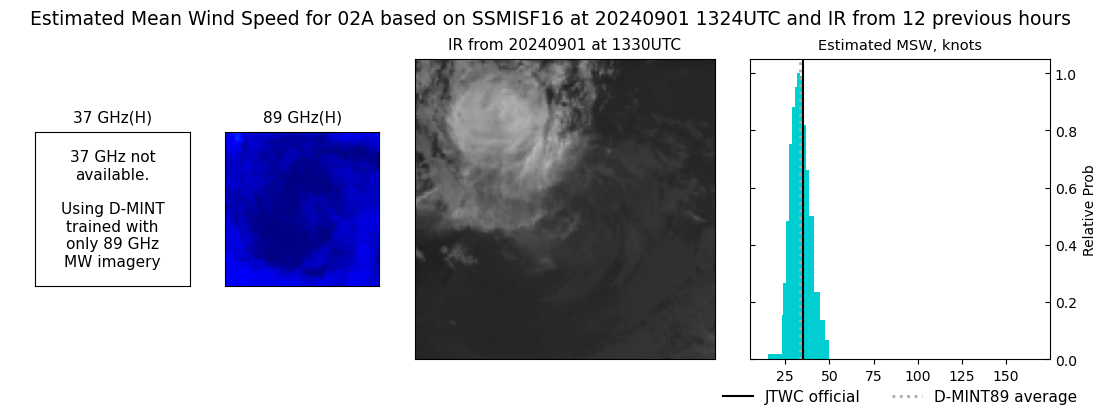 |
| 20240901 | 1112 UTC | SSMISF18 | 992 hPa | 34 kts | 30 kts | 38 kts | 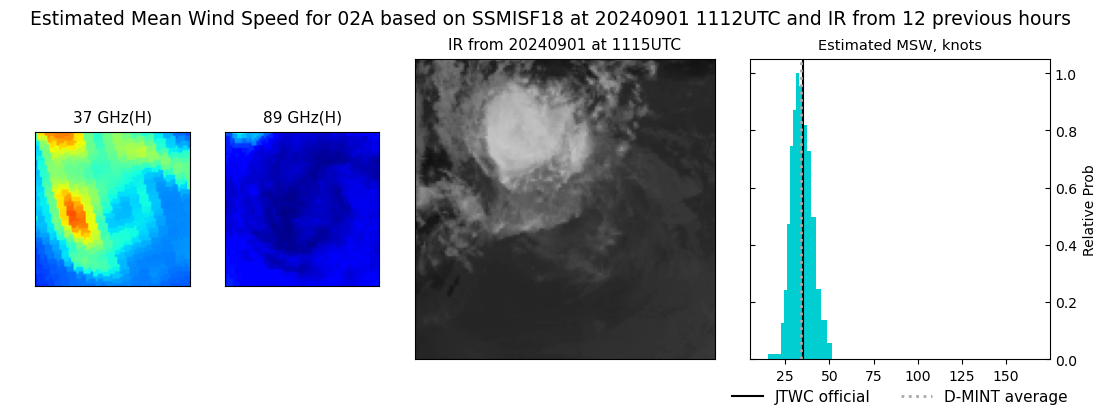 |
| 20240901 | 0933 UTC | ATMS-N20 | 991 hPa | 38 kts | 33 kts | 42 kts | 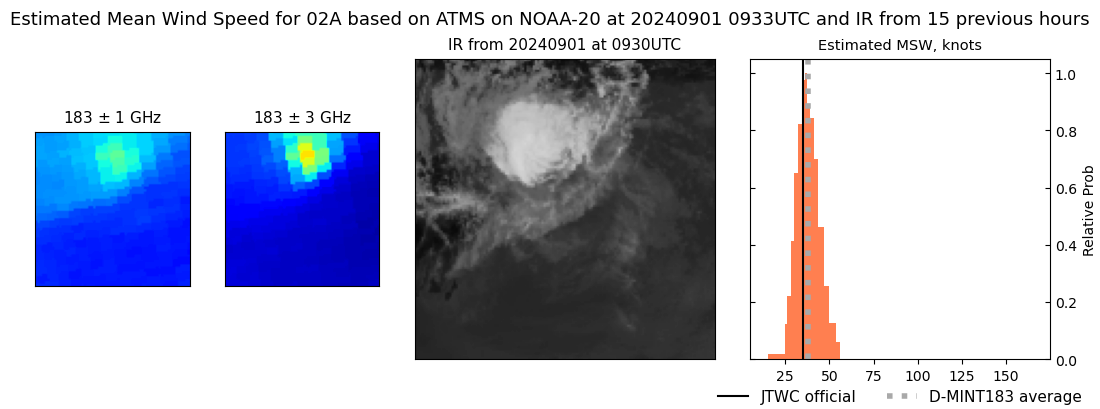 |
| 20240901 | 0653 UTC | GMI | 988 hPa | 34 kts | 30 kts | 39 kts | 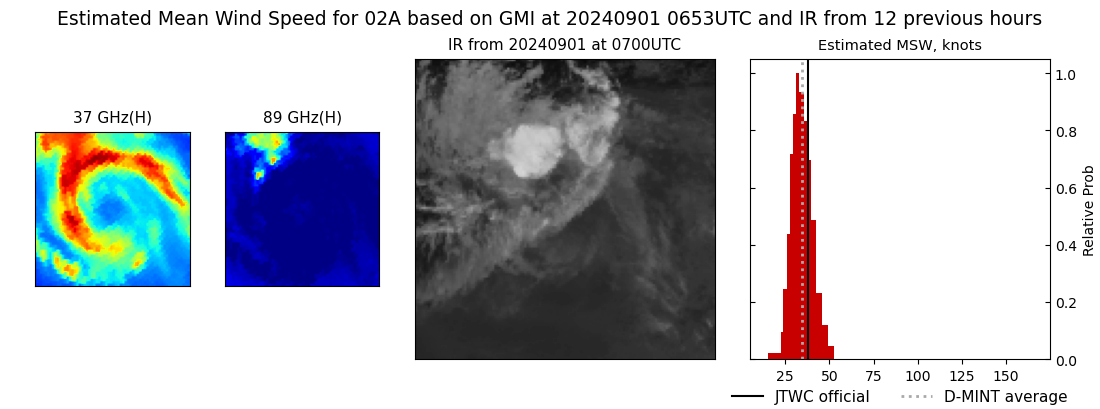 |
| 20240901 | 0245 UTC | SSMISF17 | 990 hPa | 37 kts | 33 kts | 41 kts | 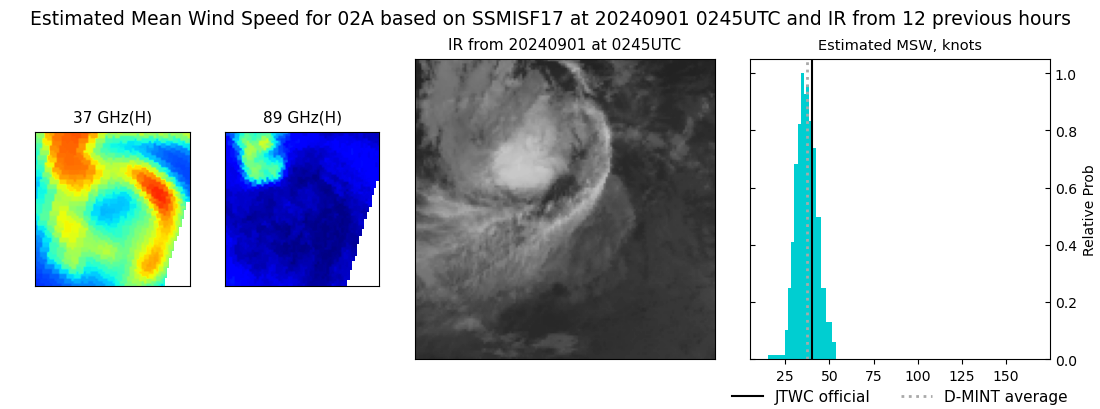 |
| 20240901 | 0208 UTC | SSMISF16 | 990 hPa | 36 kts | 32 kts | 41 kts | 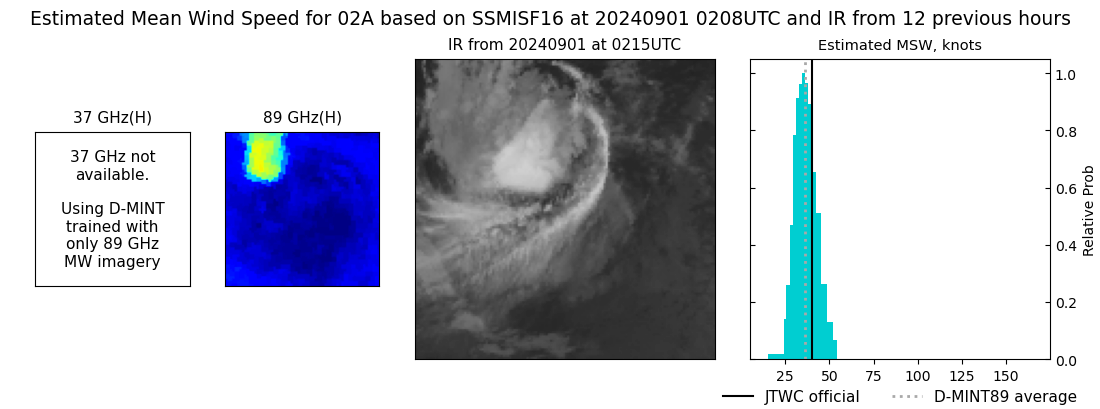 |
| 20240831 | 2356 UTC | SSMISF18 | 990 hPa | 36 kts | 32 kts | 40 kts | 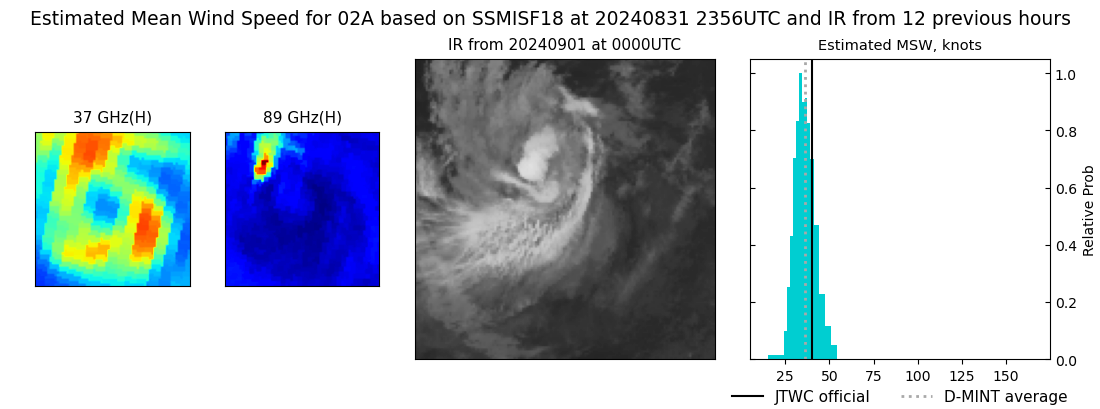 |
| 20240831 | 2143 UTC | TROPICS05 | 990 hPa | 38 kts | 34 kts | 42 kts | 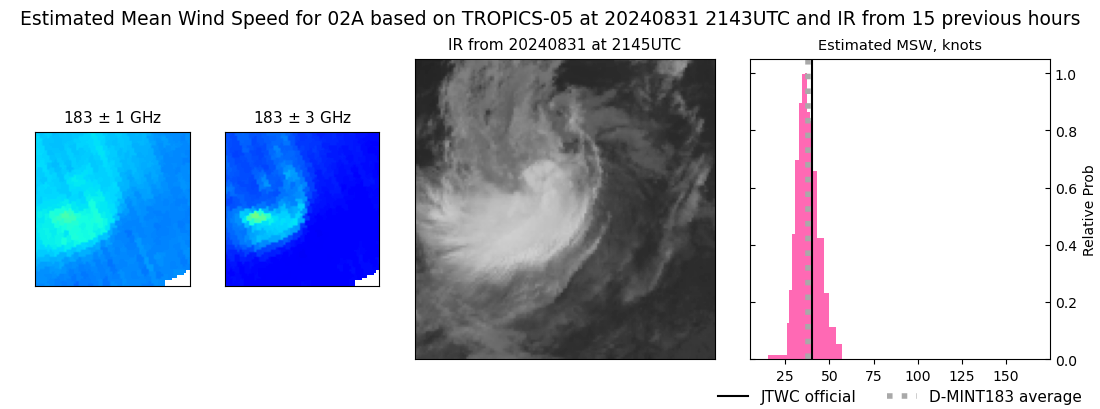 |
| 20240831 | 2140 UTC | AMSR2 | 993 hPa | 40 kts | 36 kts | 45 kts | 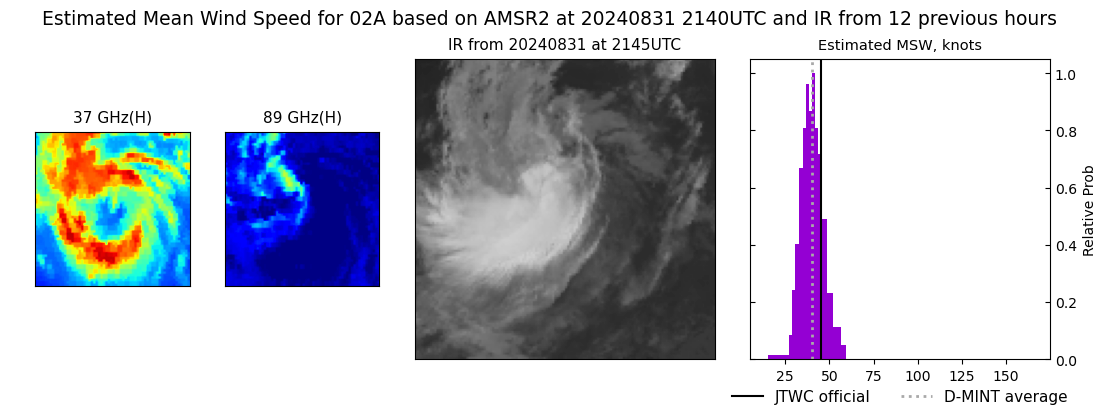 |
| 20240831 | 2131 UTC | ATMS-N21 | 989 hPa | 38 kts | 34 kts | 42 kts | 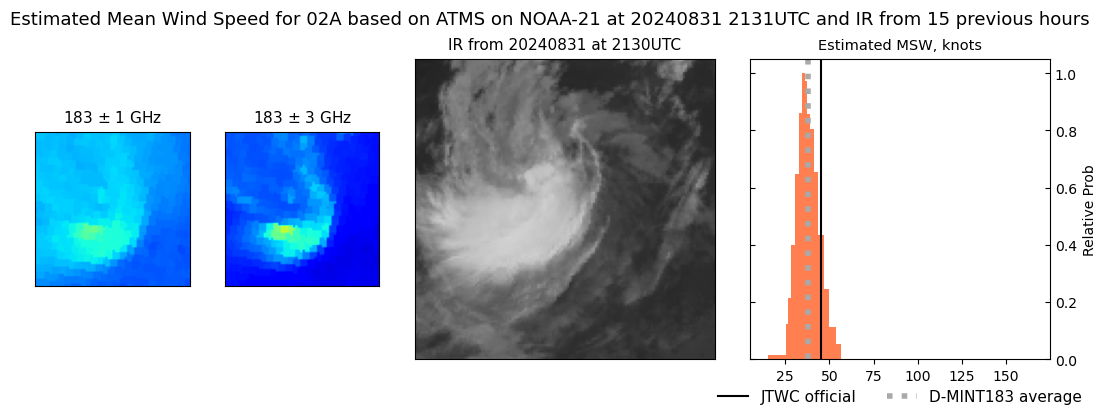 |
| 20240831 | 1337 UTC | SSMISF16 | 992 hPa | 33 kts | 29 kts | 37 kts | 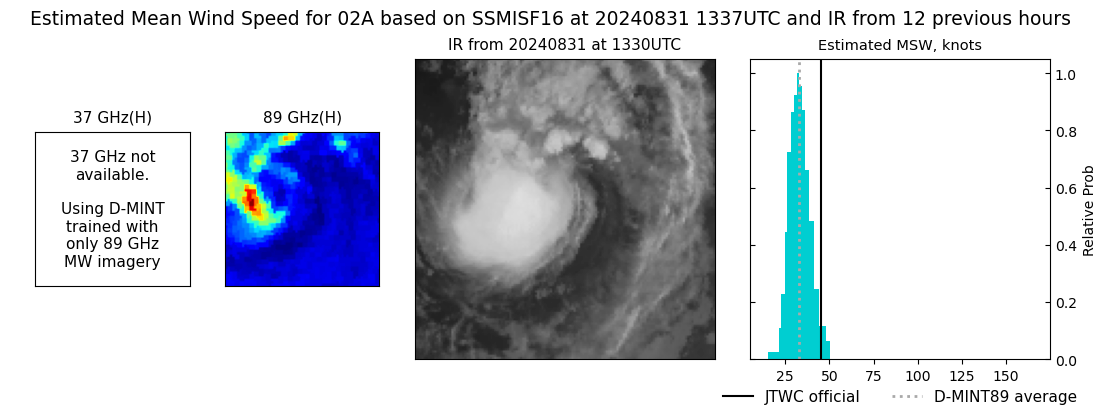 |
| 20240831 | 1125 UTC | SSMISF18 | 991 hPa | 39 kts | 34 kts | 44 kts | 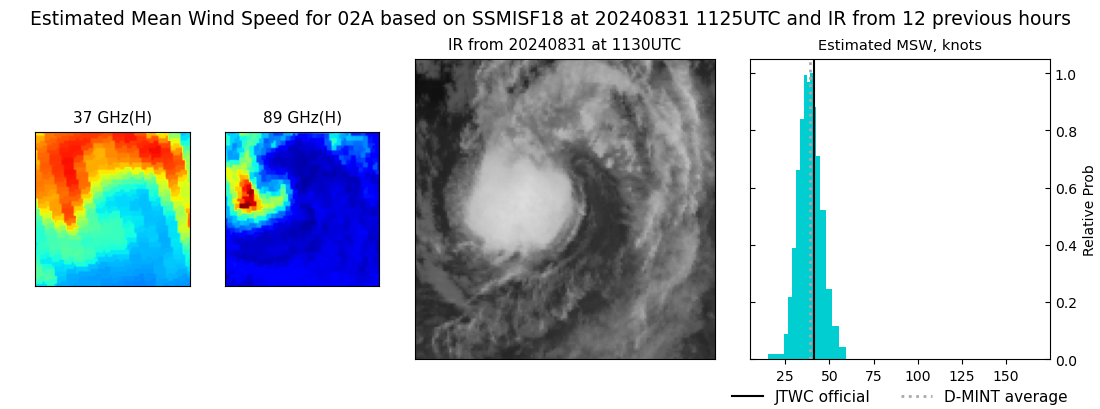 |
| 20240831 | 0222 UTC | SSMISF16 | 992 hPa | 34 kts | 30 kts | 39 kts | 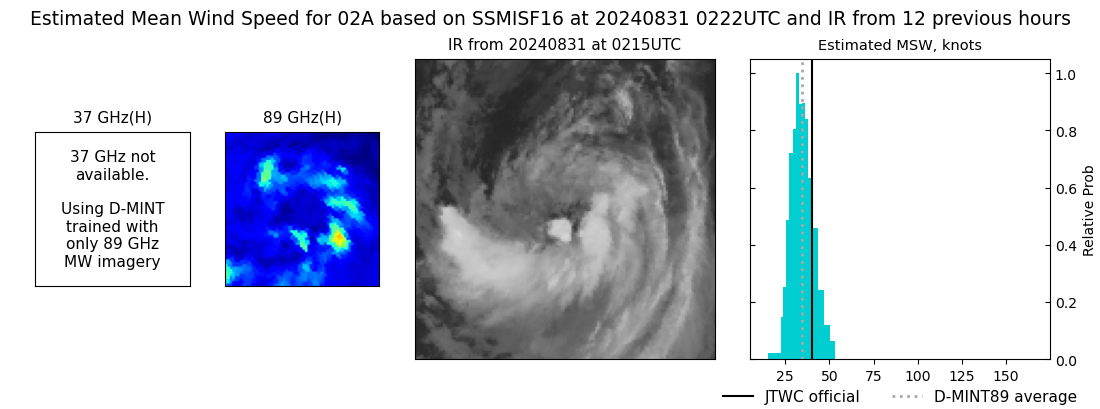 |
| 20240831 | 0009 UTC | SSMISF18 | 990 hPa | 38 kts | 34 kts | 43 kts | 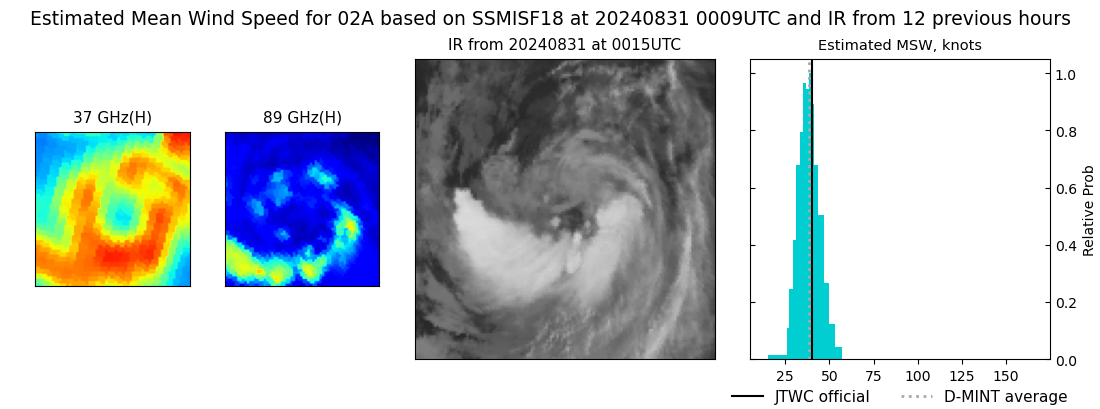 |
| 20240830 | 2208 UTC | TROPICS05 | 987 hPa | 38 kts | 34 kts | 42 kts | 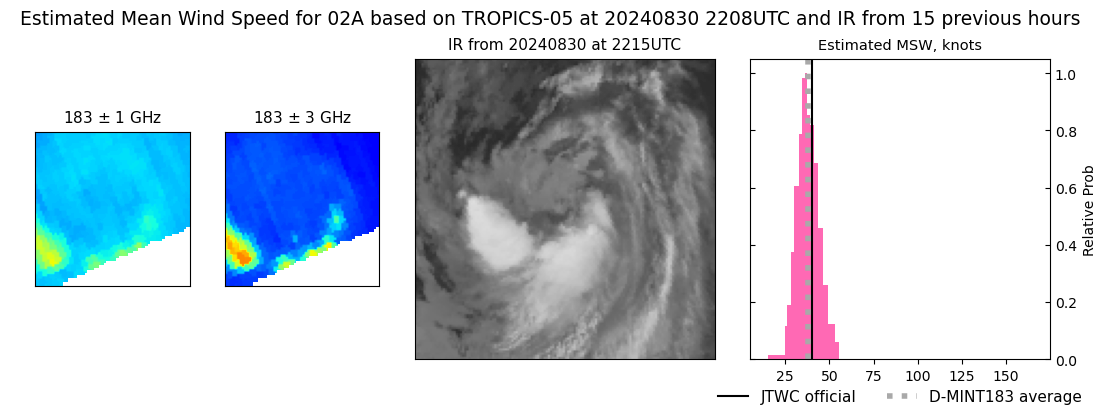 |
| 20240830 | 2059 UTC | ATMS-N20 | 983 hPa | 39 kts | 34 kts | 43 kts | 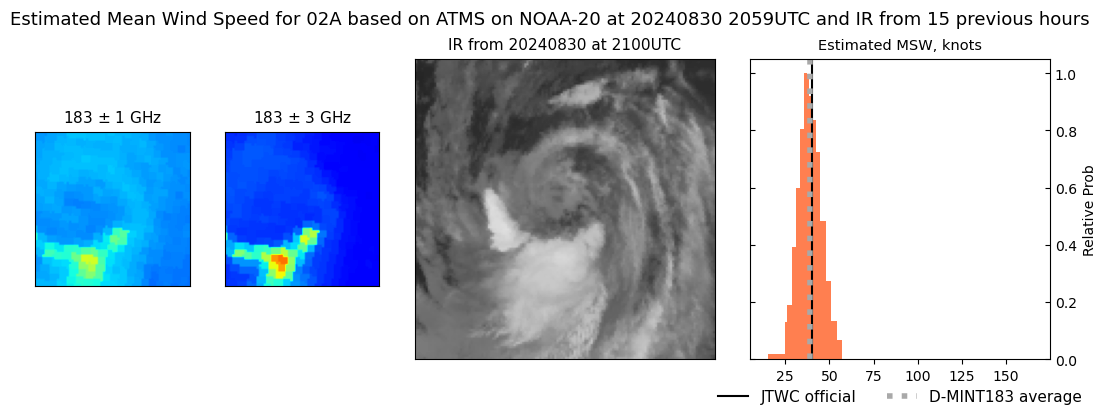 |
| 20240830 | 2057 UTC | AMSR2 | 991 hPa | 37 kts | 33 kts | 41 kts | 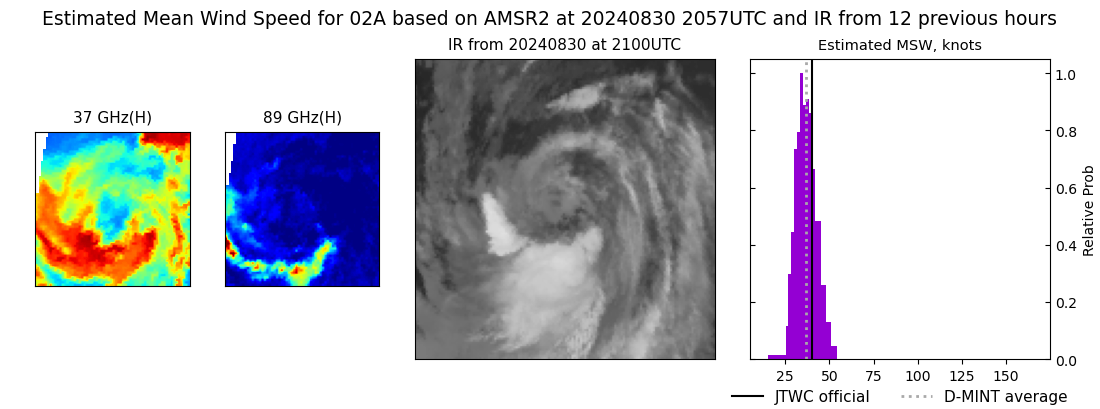 |
| 20240830 | 1552 UTC | TROPICS03 | 986 hPa | 39 kts | 34 kts | 44 kts | 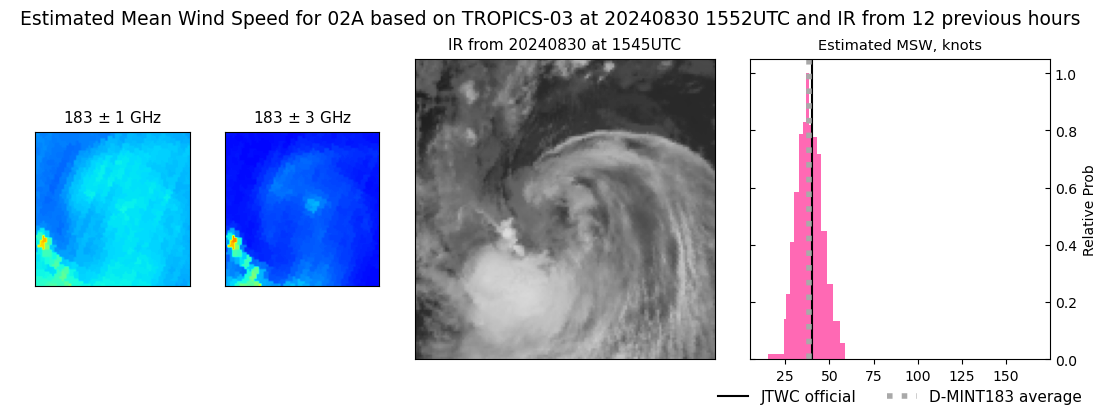 |
| 20240830 | 1352 UTC | SSMISF16 | 989 hPa | 40 kts | 35 kts | 45 kts | 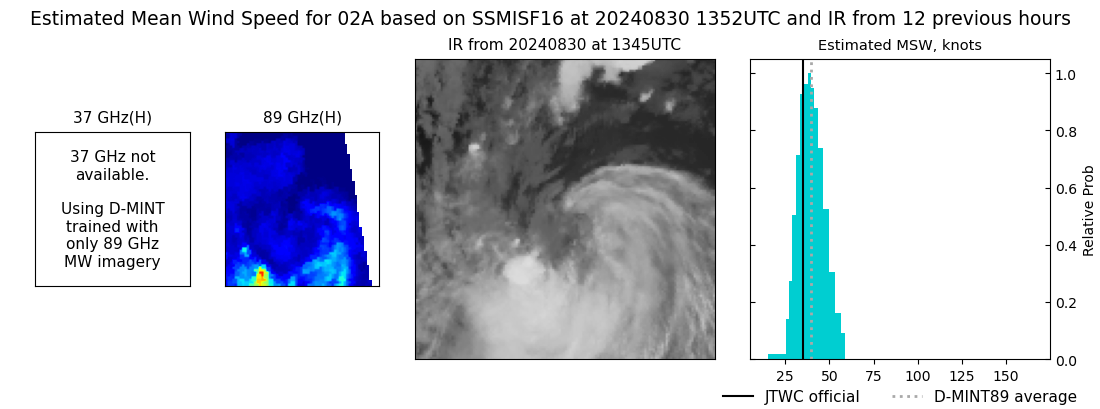 |
| 20240830 | 1139 UTC | SSMISF18 | 988 hPa | 41 kts | 37 kts | 46 kts | 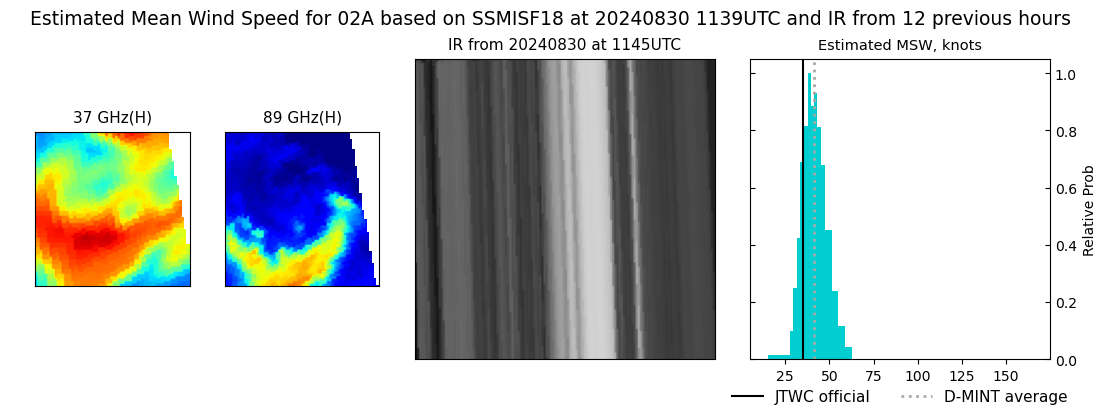 |
| 20240830 | 0848 UTC | AMSR2 | 990 hPa | 37 kts | 32 kts | 41 kts | 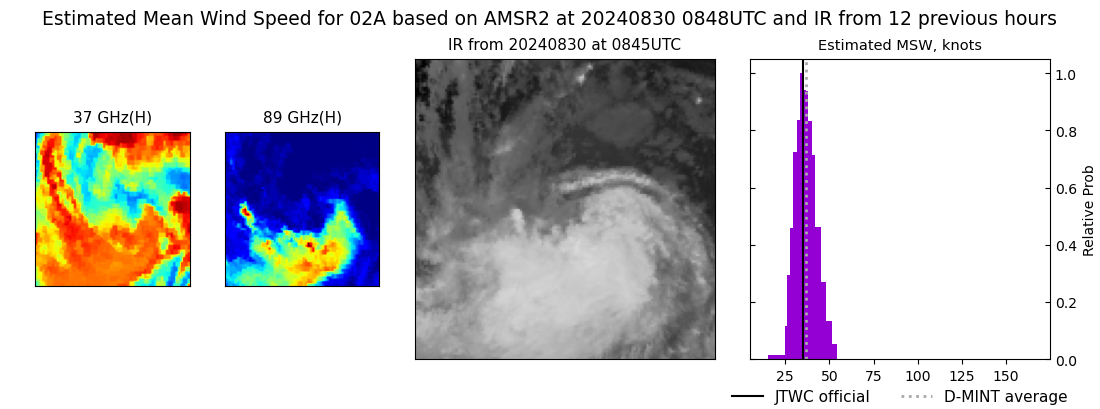 |
| 20240830 | 0643 UTC | GMI | 989 hPa | 40 kts | 35 kts | 45 kts | 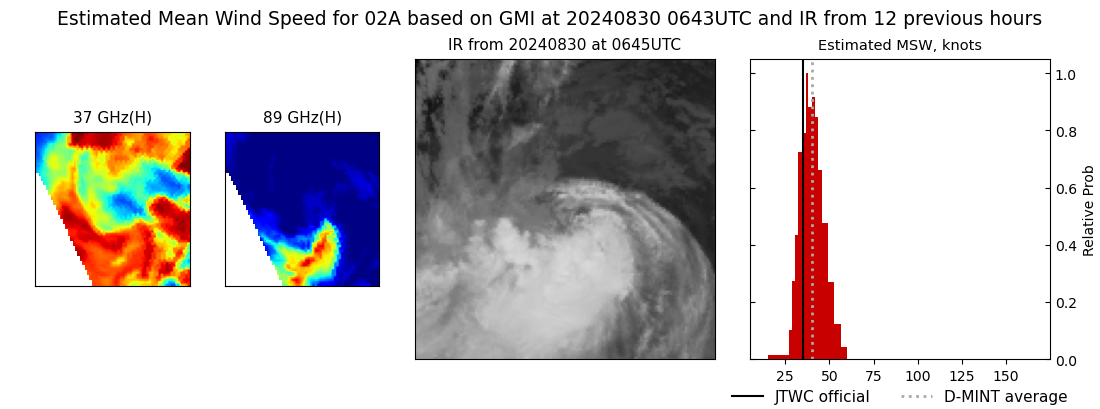 |
| 20240830 | 0342 UTC | TROPICS06 | 981 hPa | 35 kts | 32 kts | 39 kts | 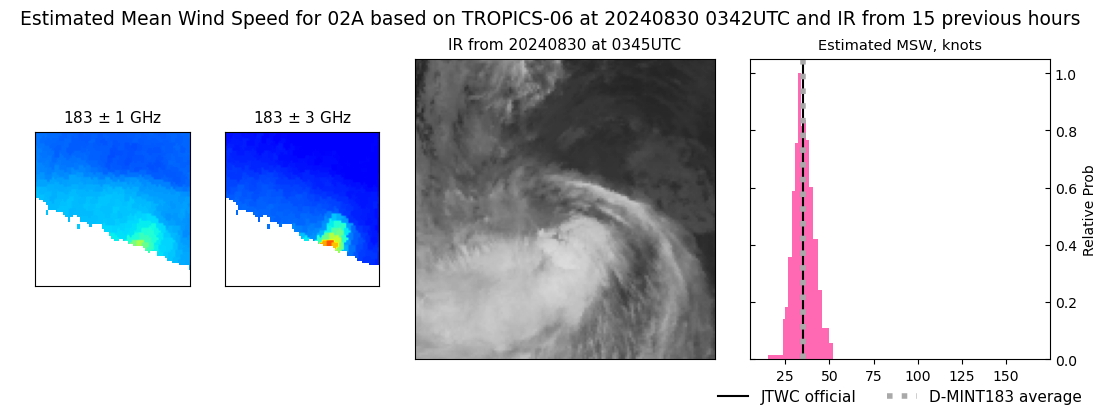 |
| 20240830 | 0131 UTC | SSMISF17 | 989 hPa | 47 kts | 43 kts | 53 kts | 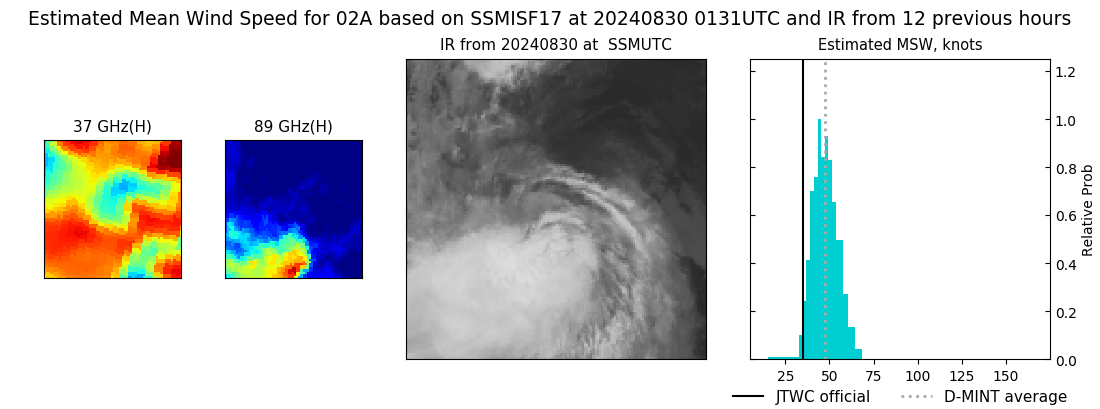 |
| 20240829 | 2231 UTC | TROPICS05 | 982 hPa | 42 kts | 38 kts | 47 kts | 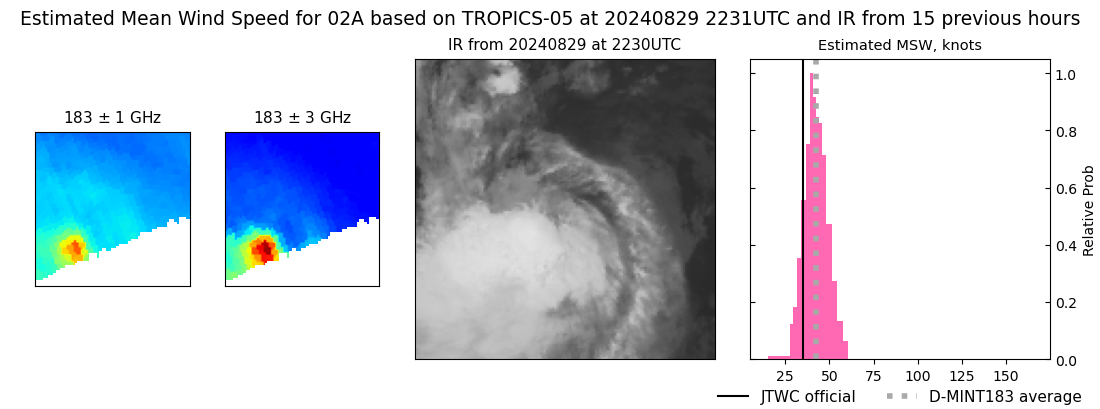 |
| 20240829 | 1615 UTC | TROPICS03 | 983 hPa | 43 kts | 38 kts | 48 kts | 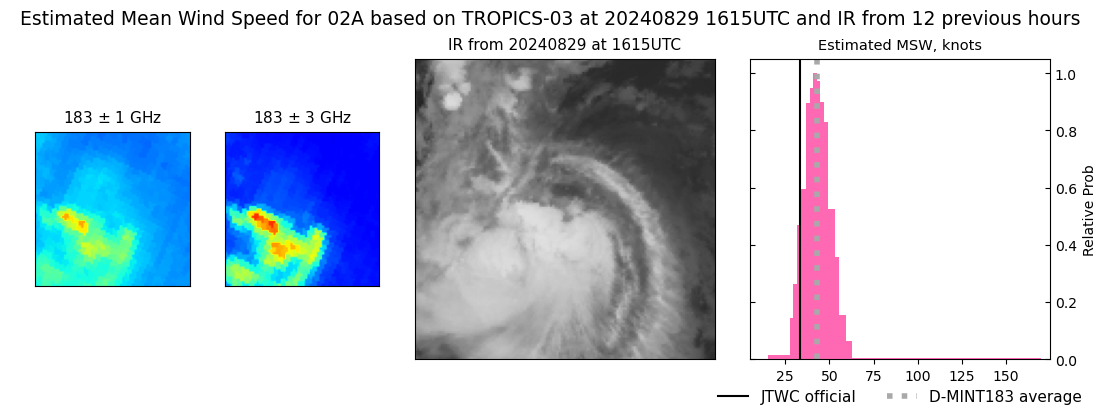 |
| 20240829 | 0800 UTC | ATMS-N21 | 984 hPa | 44 kts | 40 kts | 49 kts | 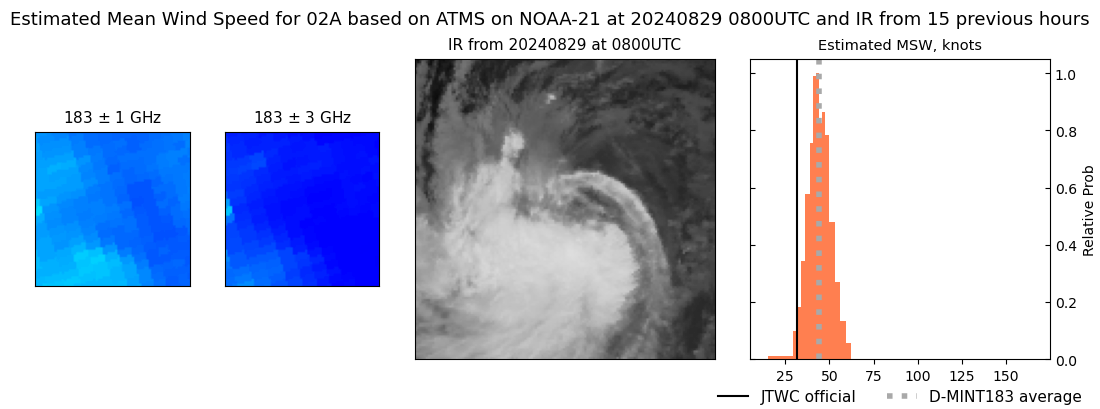 |
| 20240829 | 0407 UTC | TROPICS06 | 985 hPa | 42 kts | 37 kts | 46 kts | 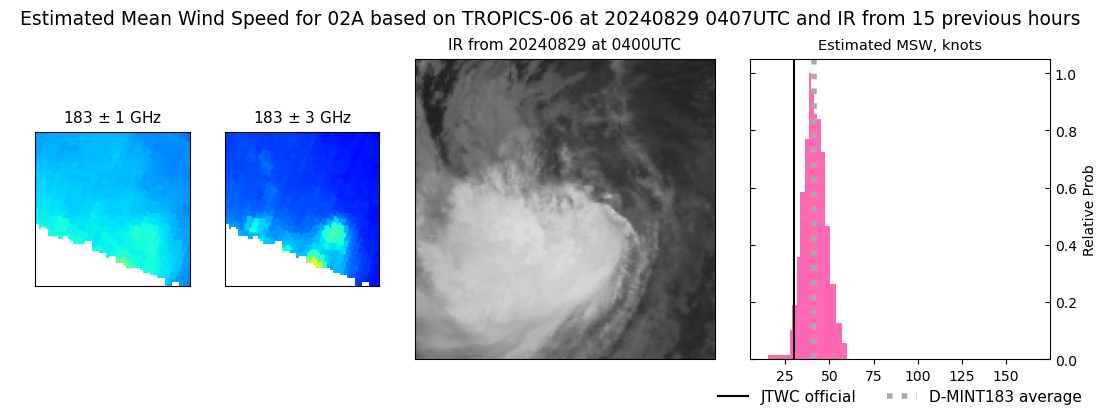 |
|
