|
||
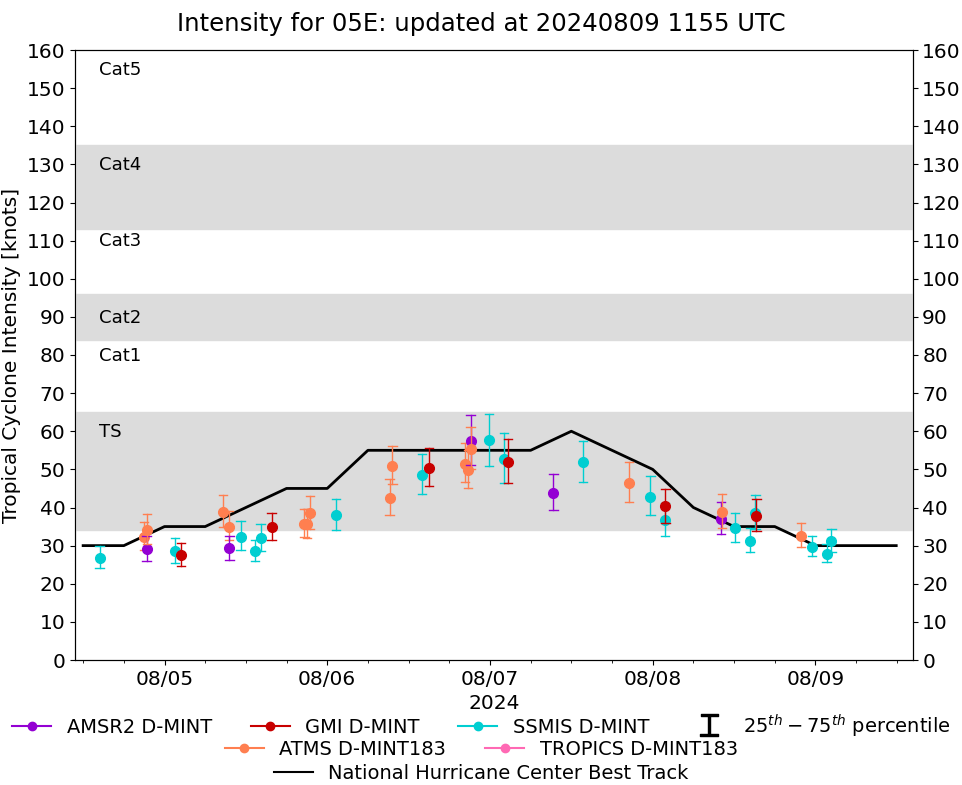 |
D-MINT HISTORY FILE for 2024_05E
| Date | Time | MW Sensor | MSLP | Vmax (30th-70th percentile average) | Vmax 25th percentile | Vmax 75th percentile | Image |
| 20240809 | 0222 UTC | SSMISF17 | 1005 hPa | 31 kts | 28 kts | 34 kts | 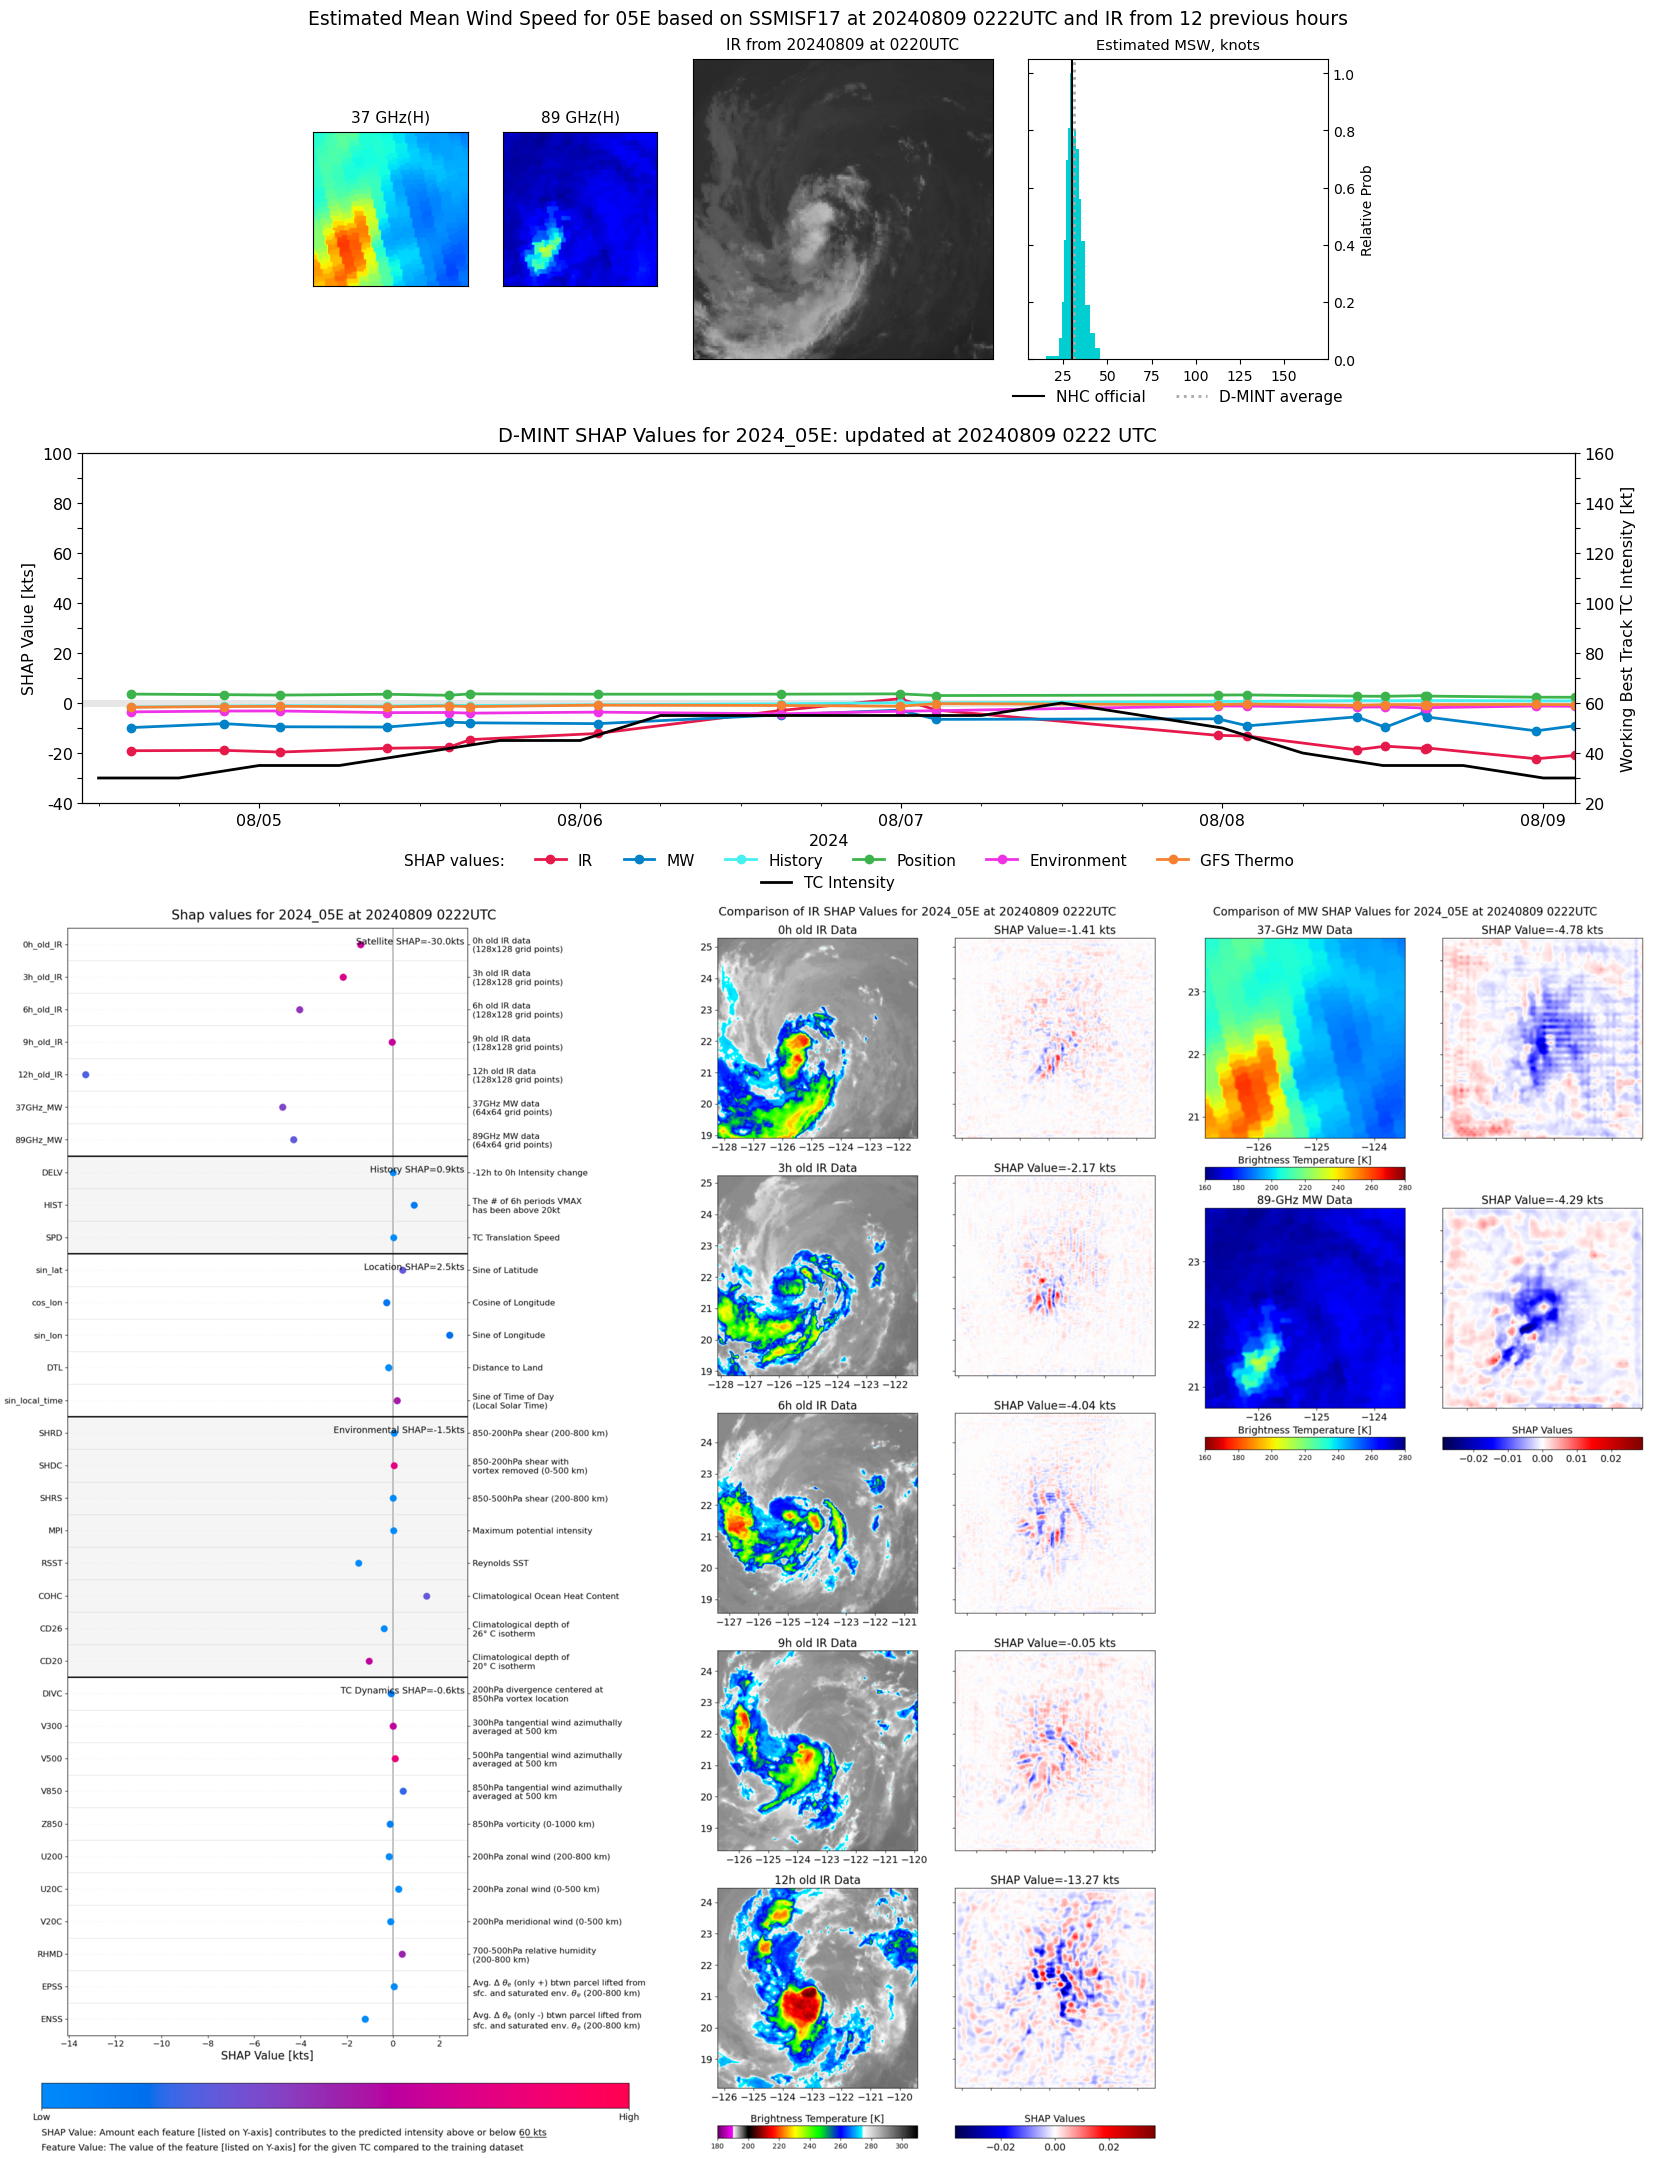 |
| 20240809 | 0138 UTC | SSMISF16 | 1007 hPa | 28 kts | 26 kts | 30 kts | 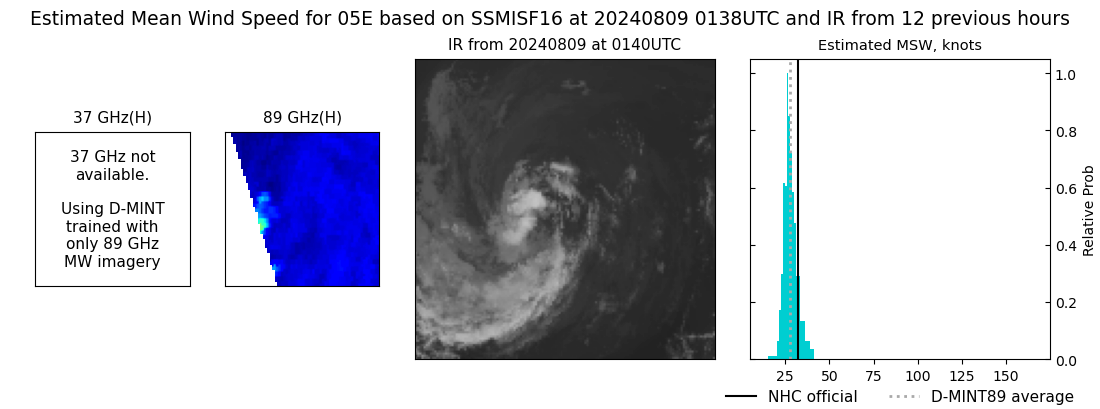 |
| 20240808 | 2328 UTC | SSMISF18 | 1006 hPa | 30 kts | 27 kts | 33 kts | 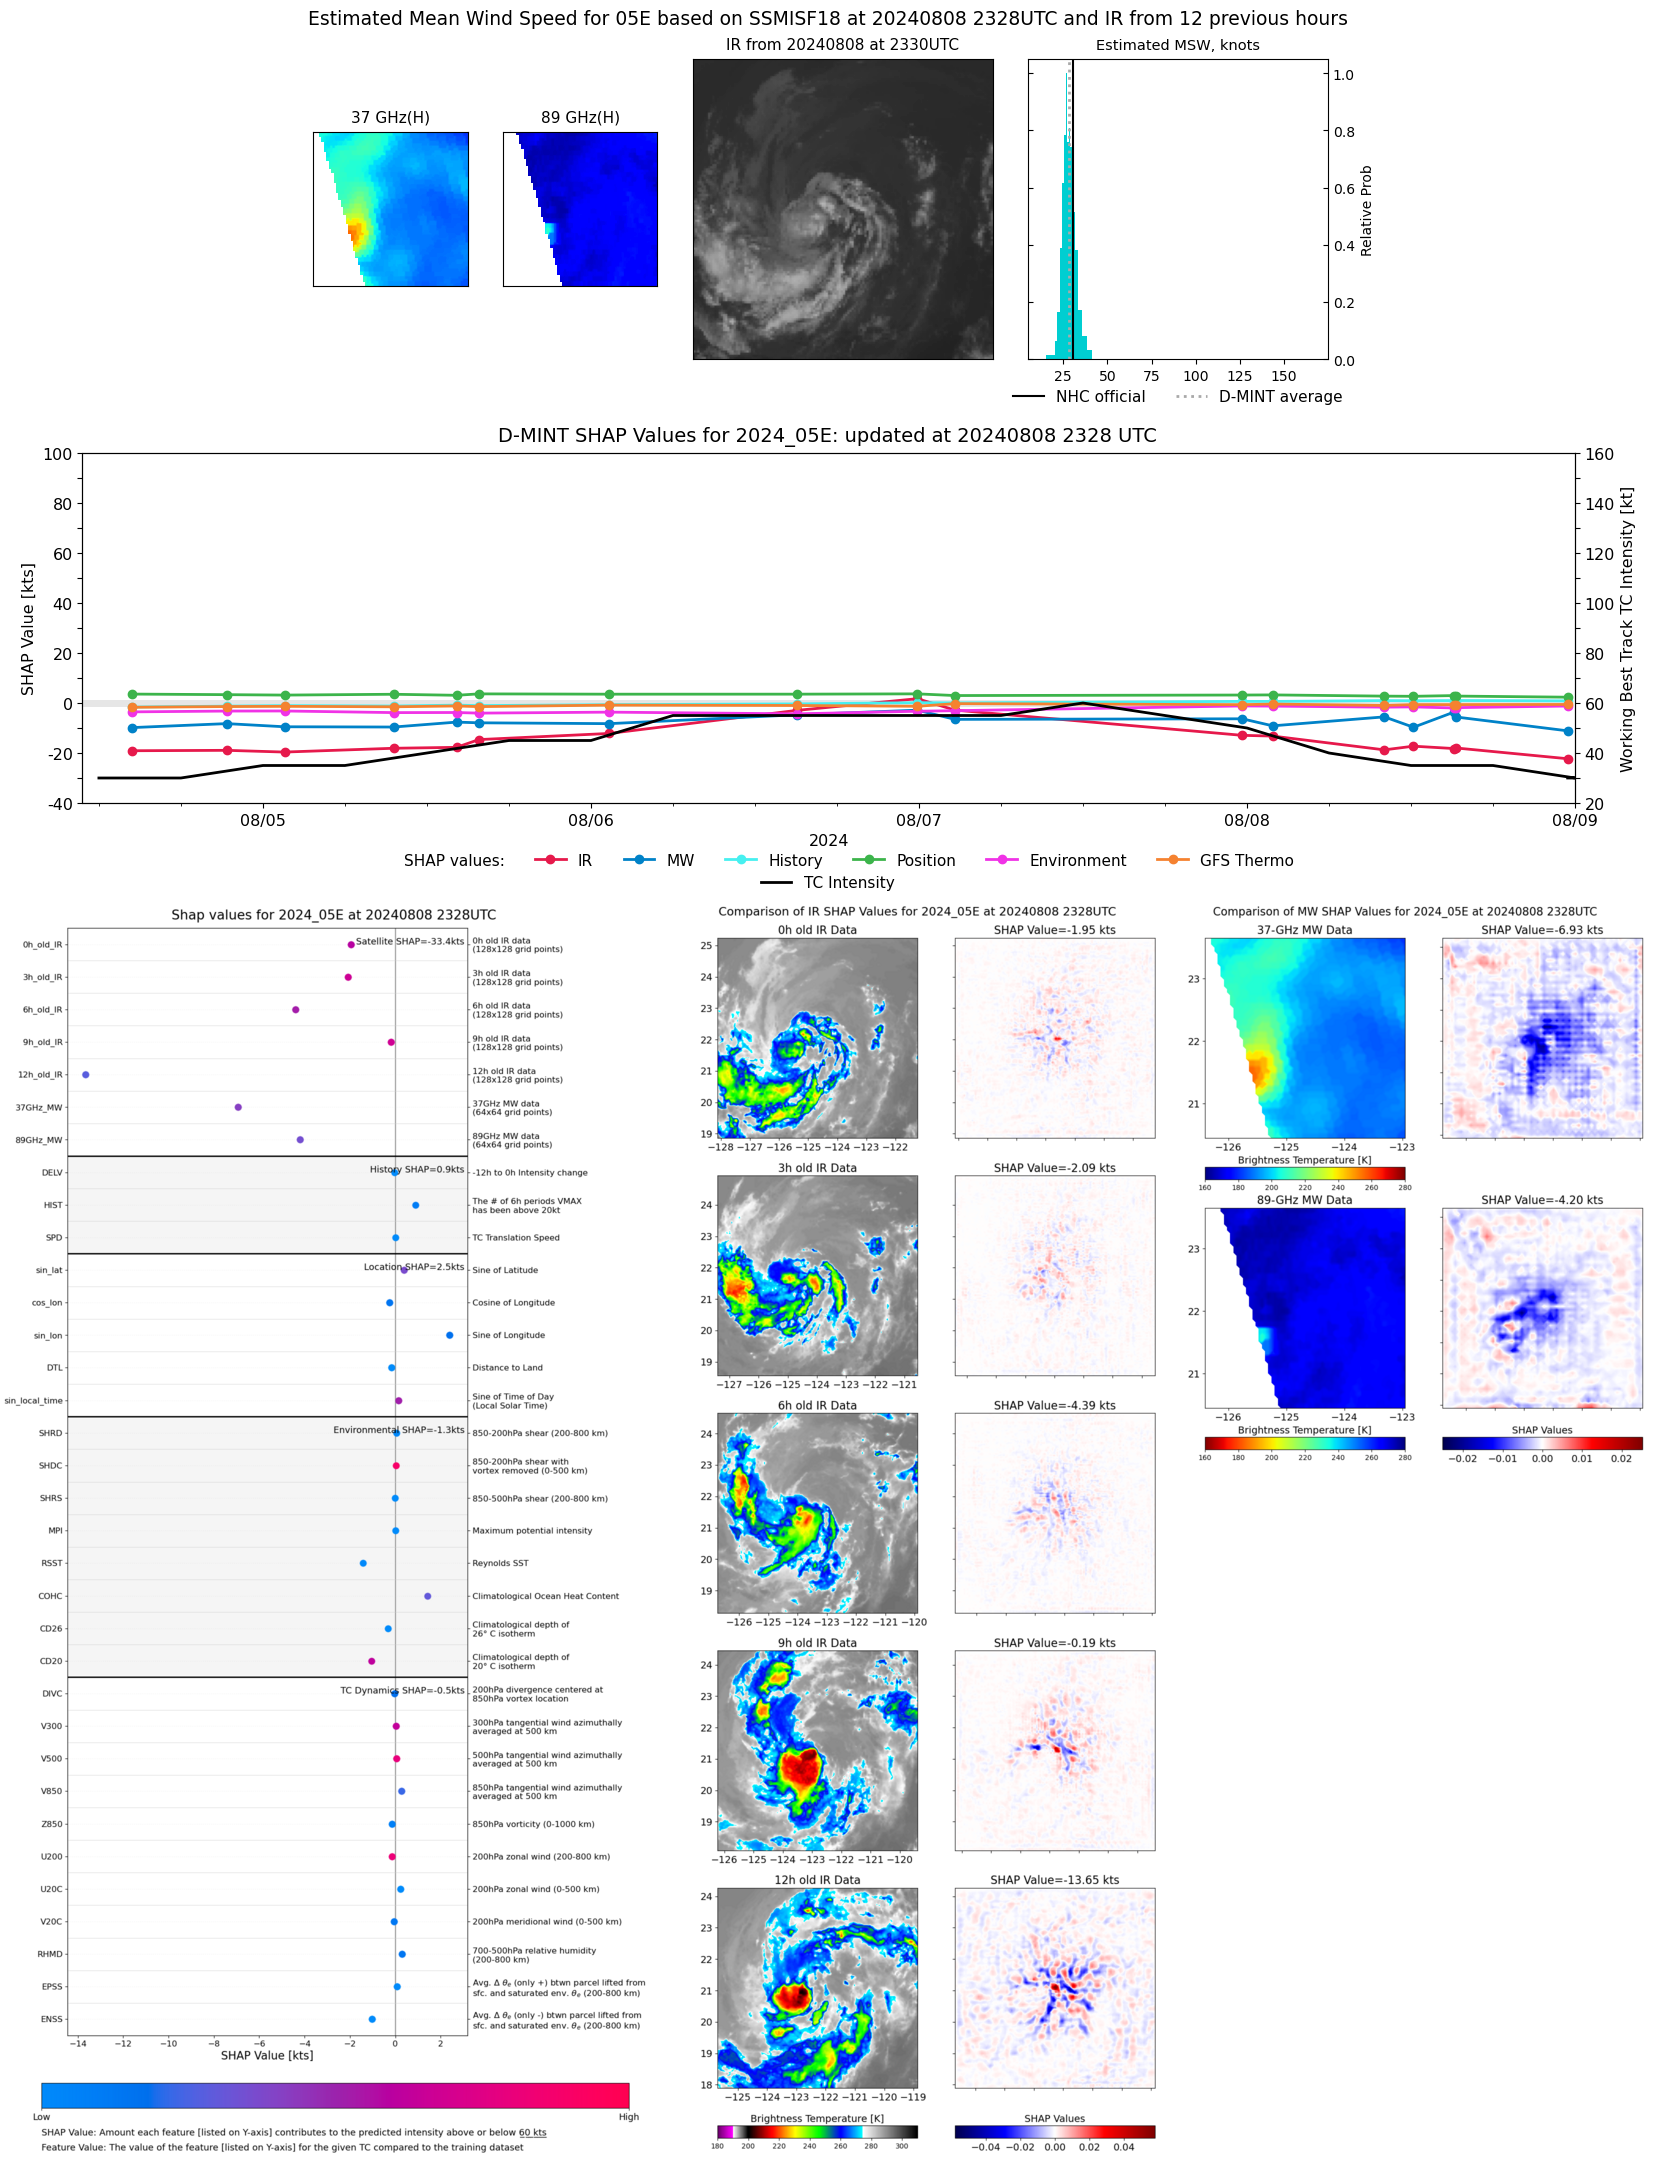 |
| 20240808 | 2150 UTC | ATMS-NPP | 1005 hPa | 33 kts | 30 kts | 36 kts | 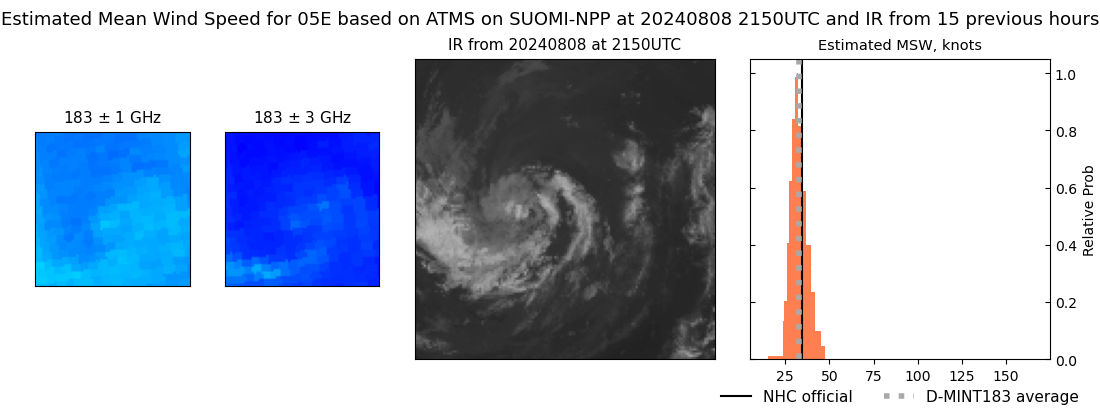 |
| 20240808 | 1518 UTC | GMI | 1003 hPa | 38 kts | 34 kts | 42 kts |  |
| 20240808 | 1509 UTC | SSMISF17 | 1001 hPa | 39 kts | 34 kts | 43 kts | 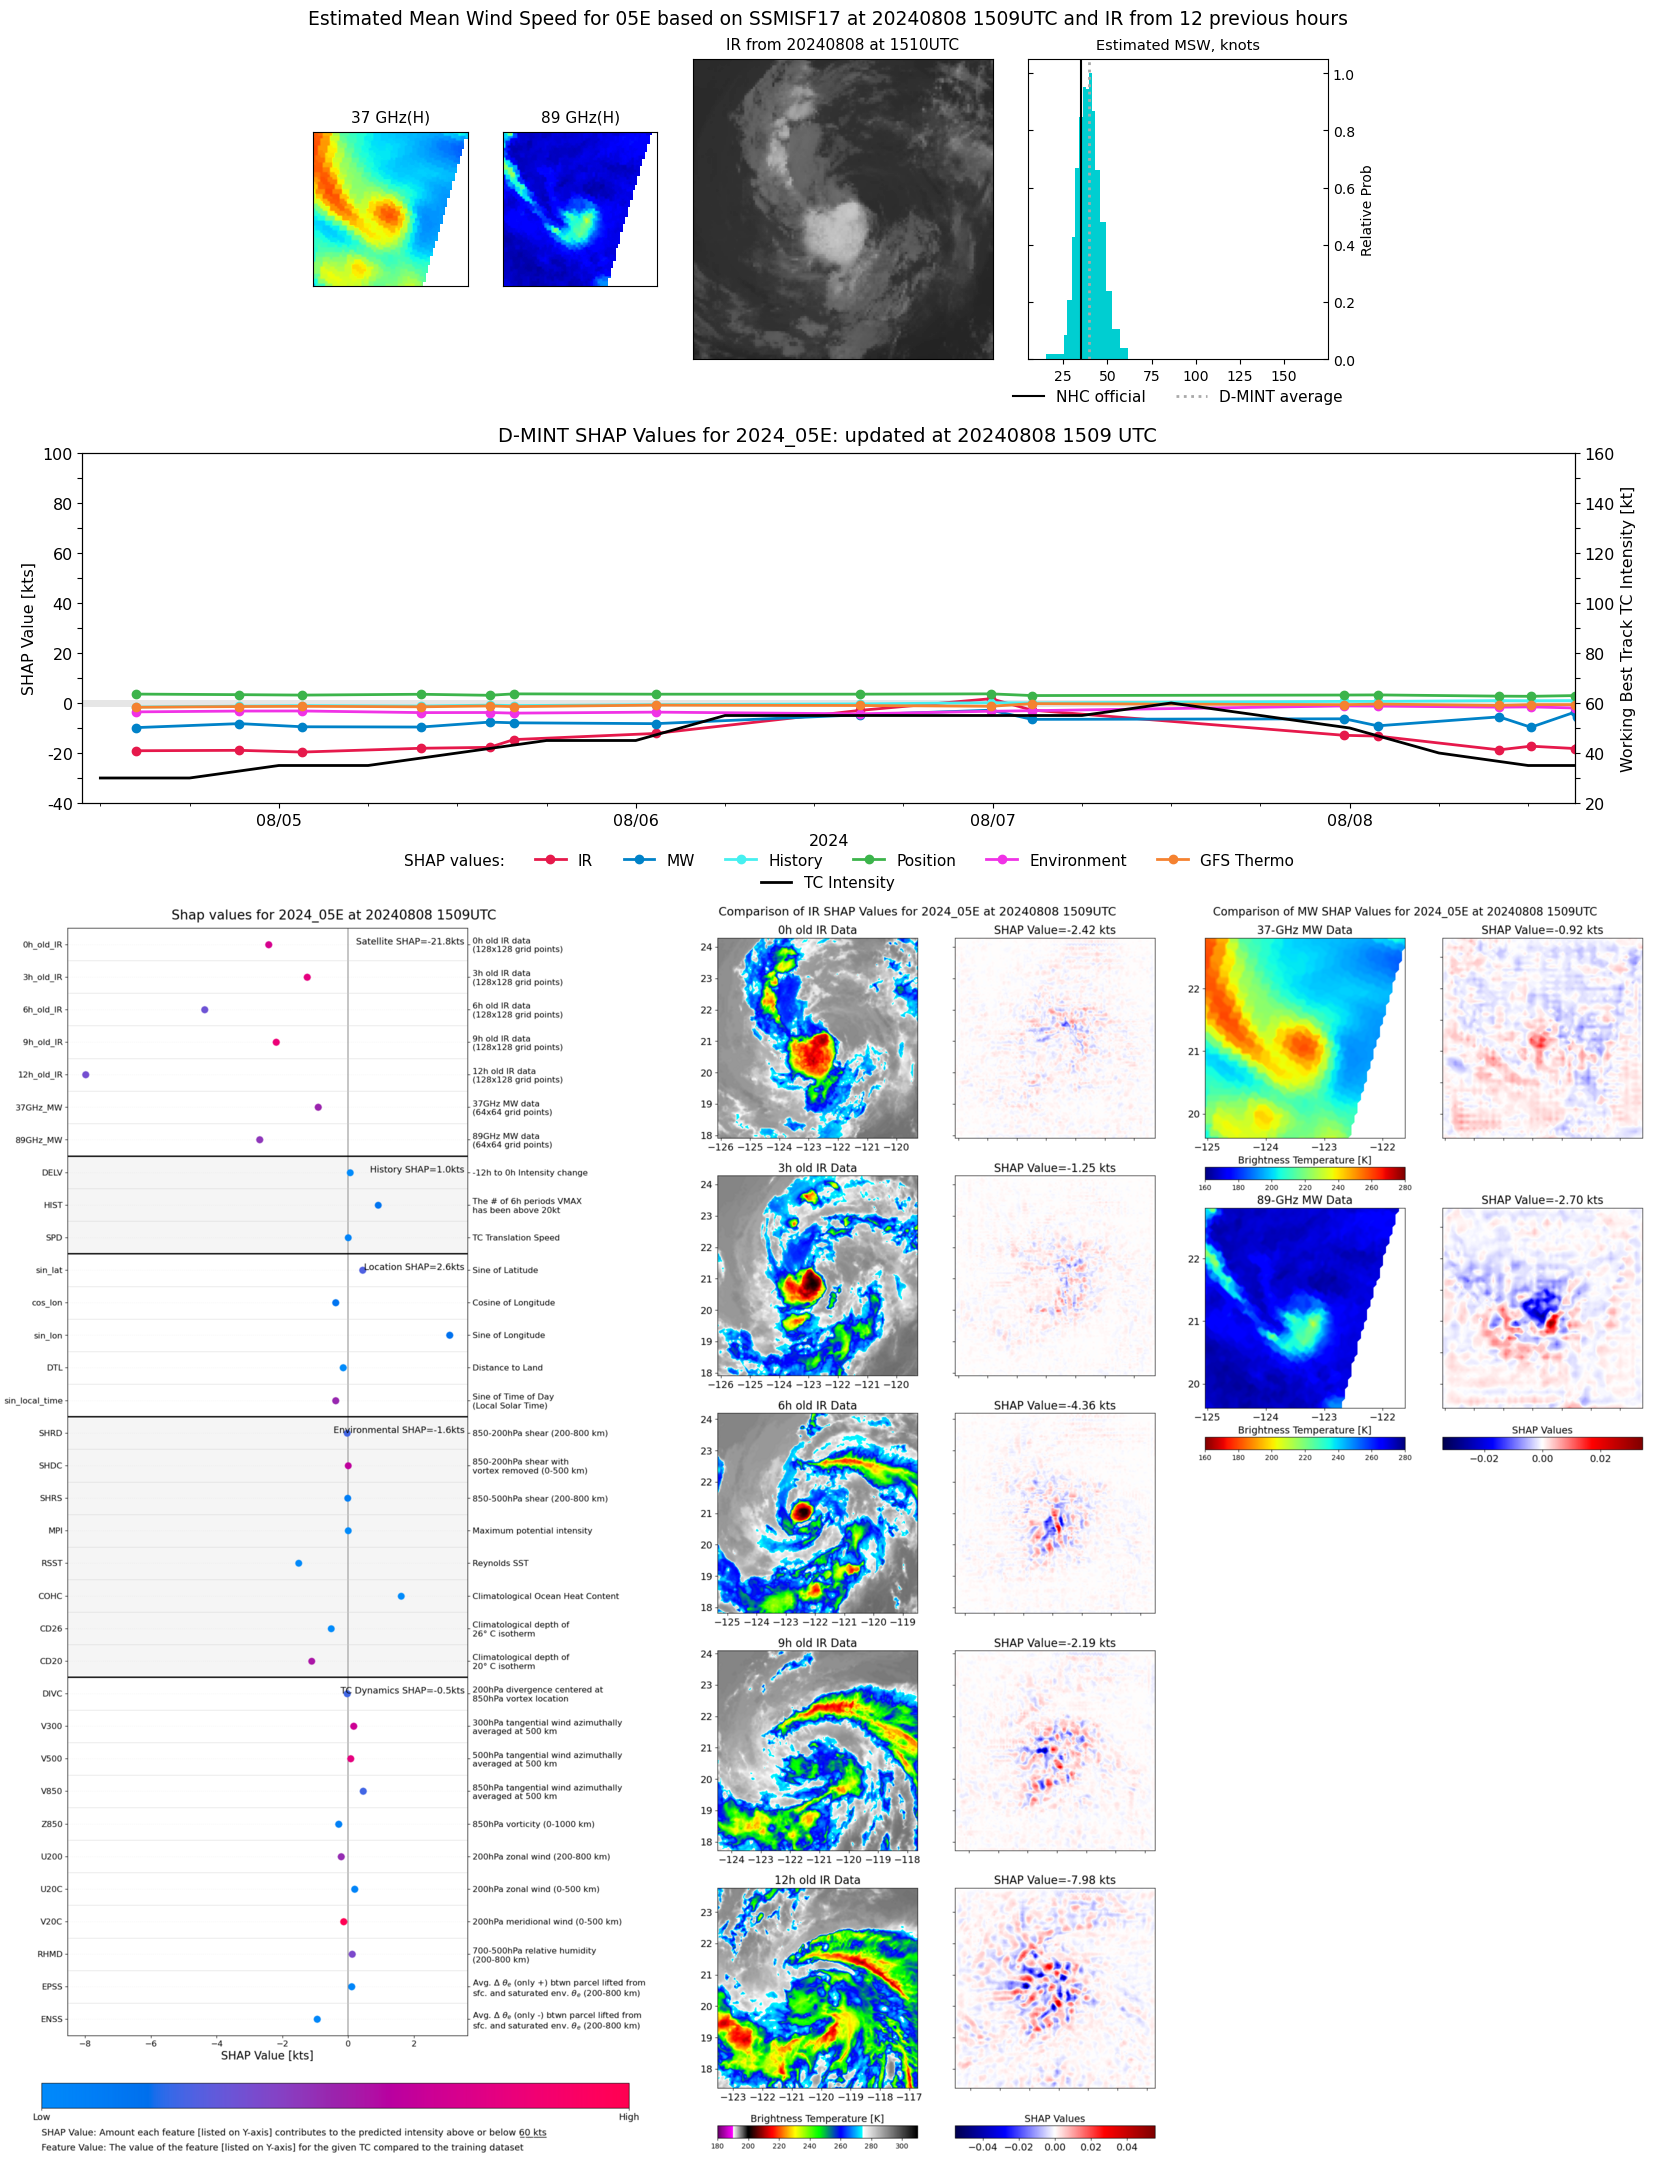 |
| 20240808 | 1422 UTC | SSMISF16 | 1005 hPa | 31 kts | 28 kts | 35 kts | 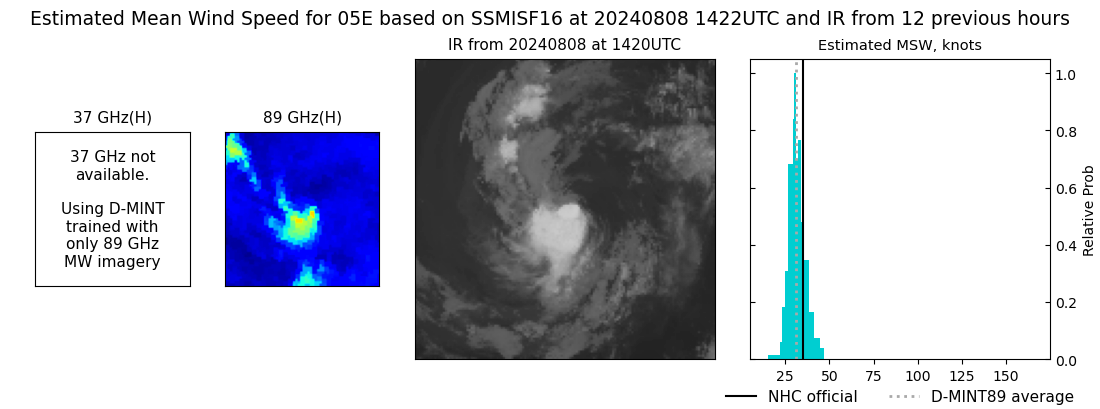 |
| 20240808 | 1211 UTC | SSMISF18 | 1005 hPa | 35 kts | 31 kts | 39 kts | 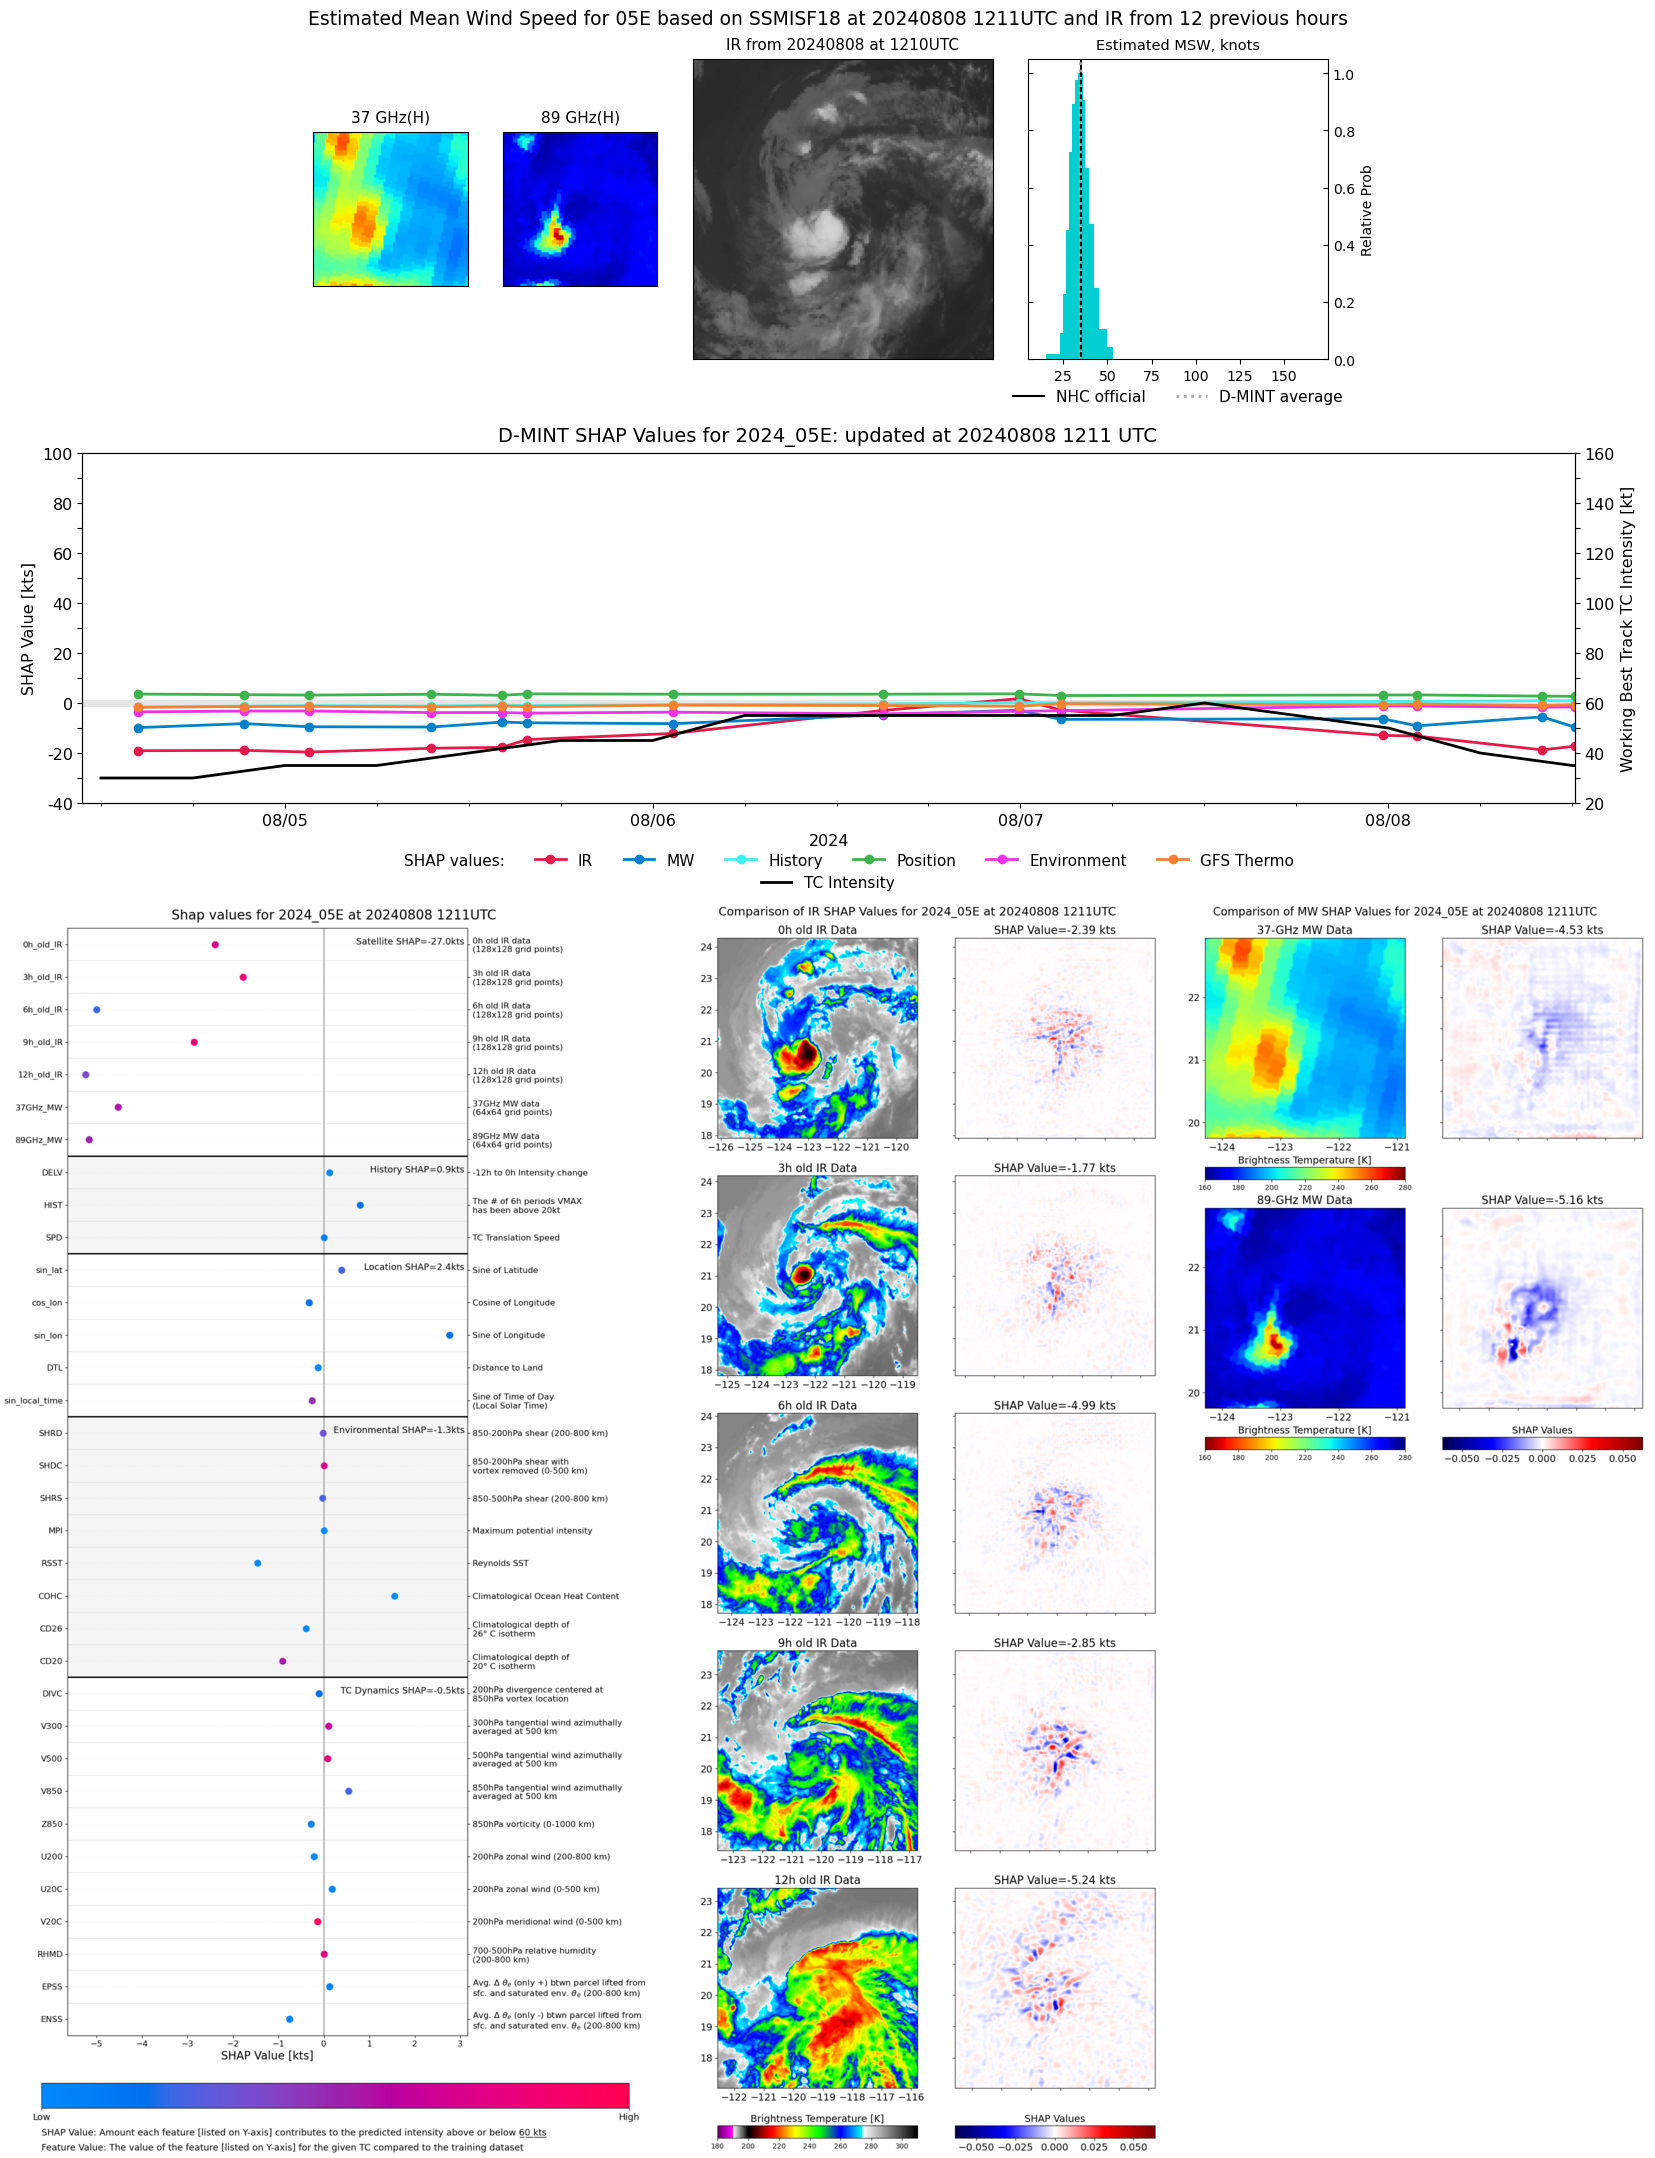 |
| 20240808 | 1012 UTC | ATMS-N21 | 1002 hPa | 39 kts | 35 kts | 44 kts | 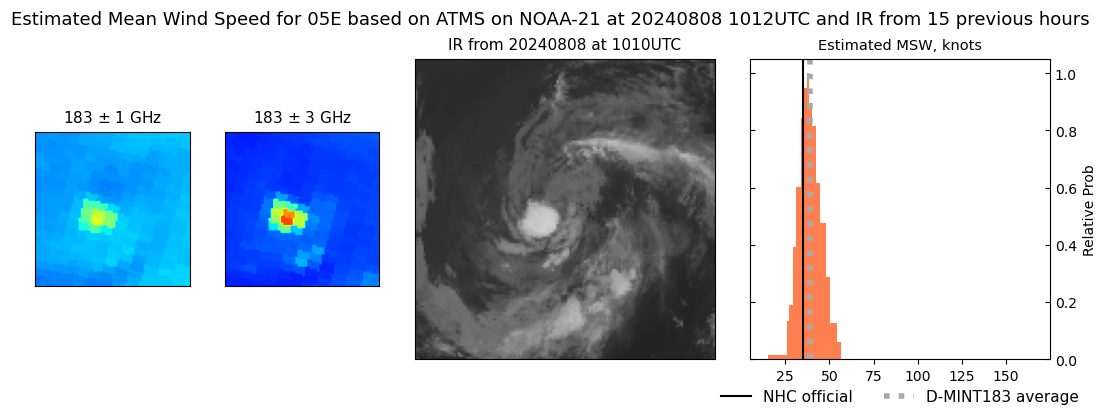 |
| 20240808 | 1003 UTC | AMSR2 | 1003 hPa | 37 kts | 33 kts | 41 kts | 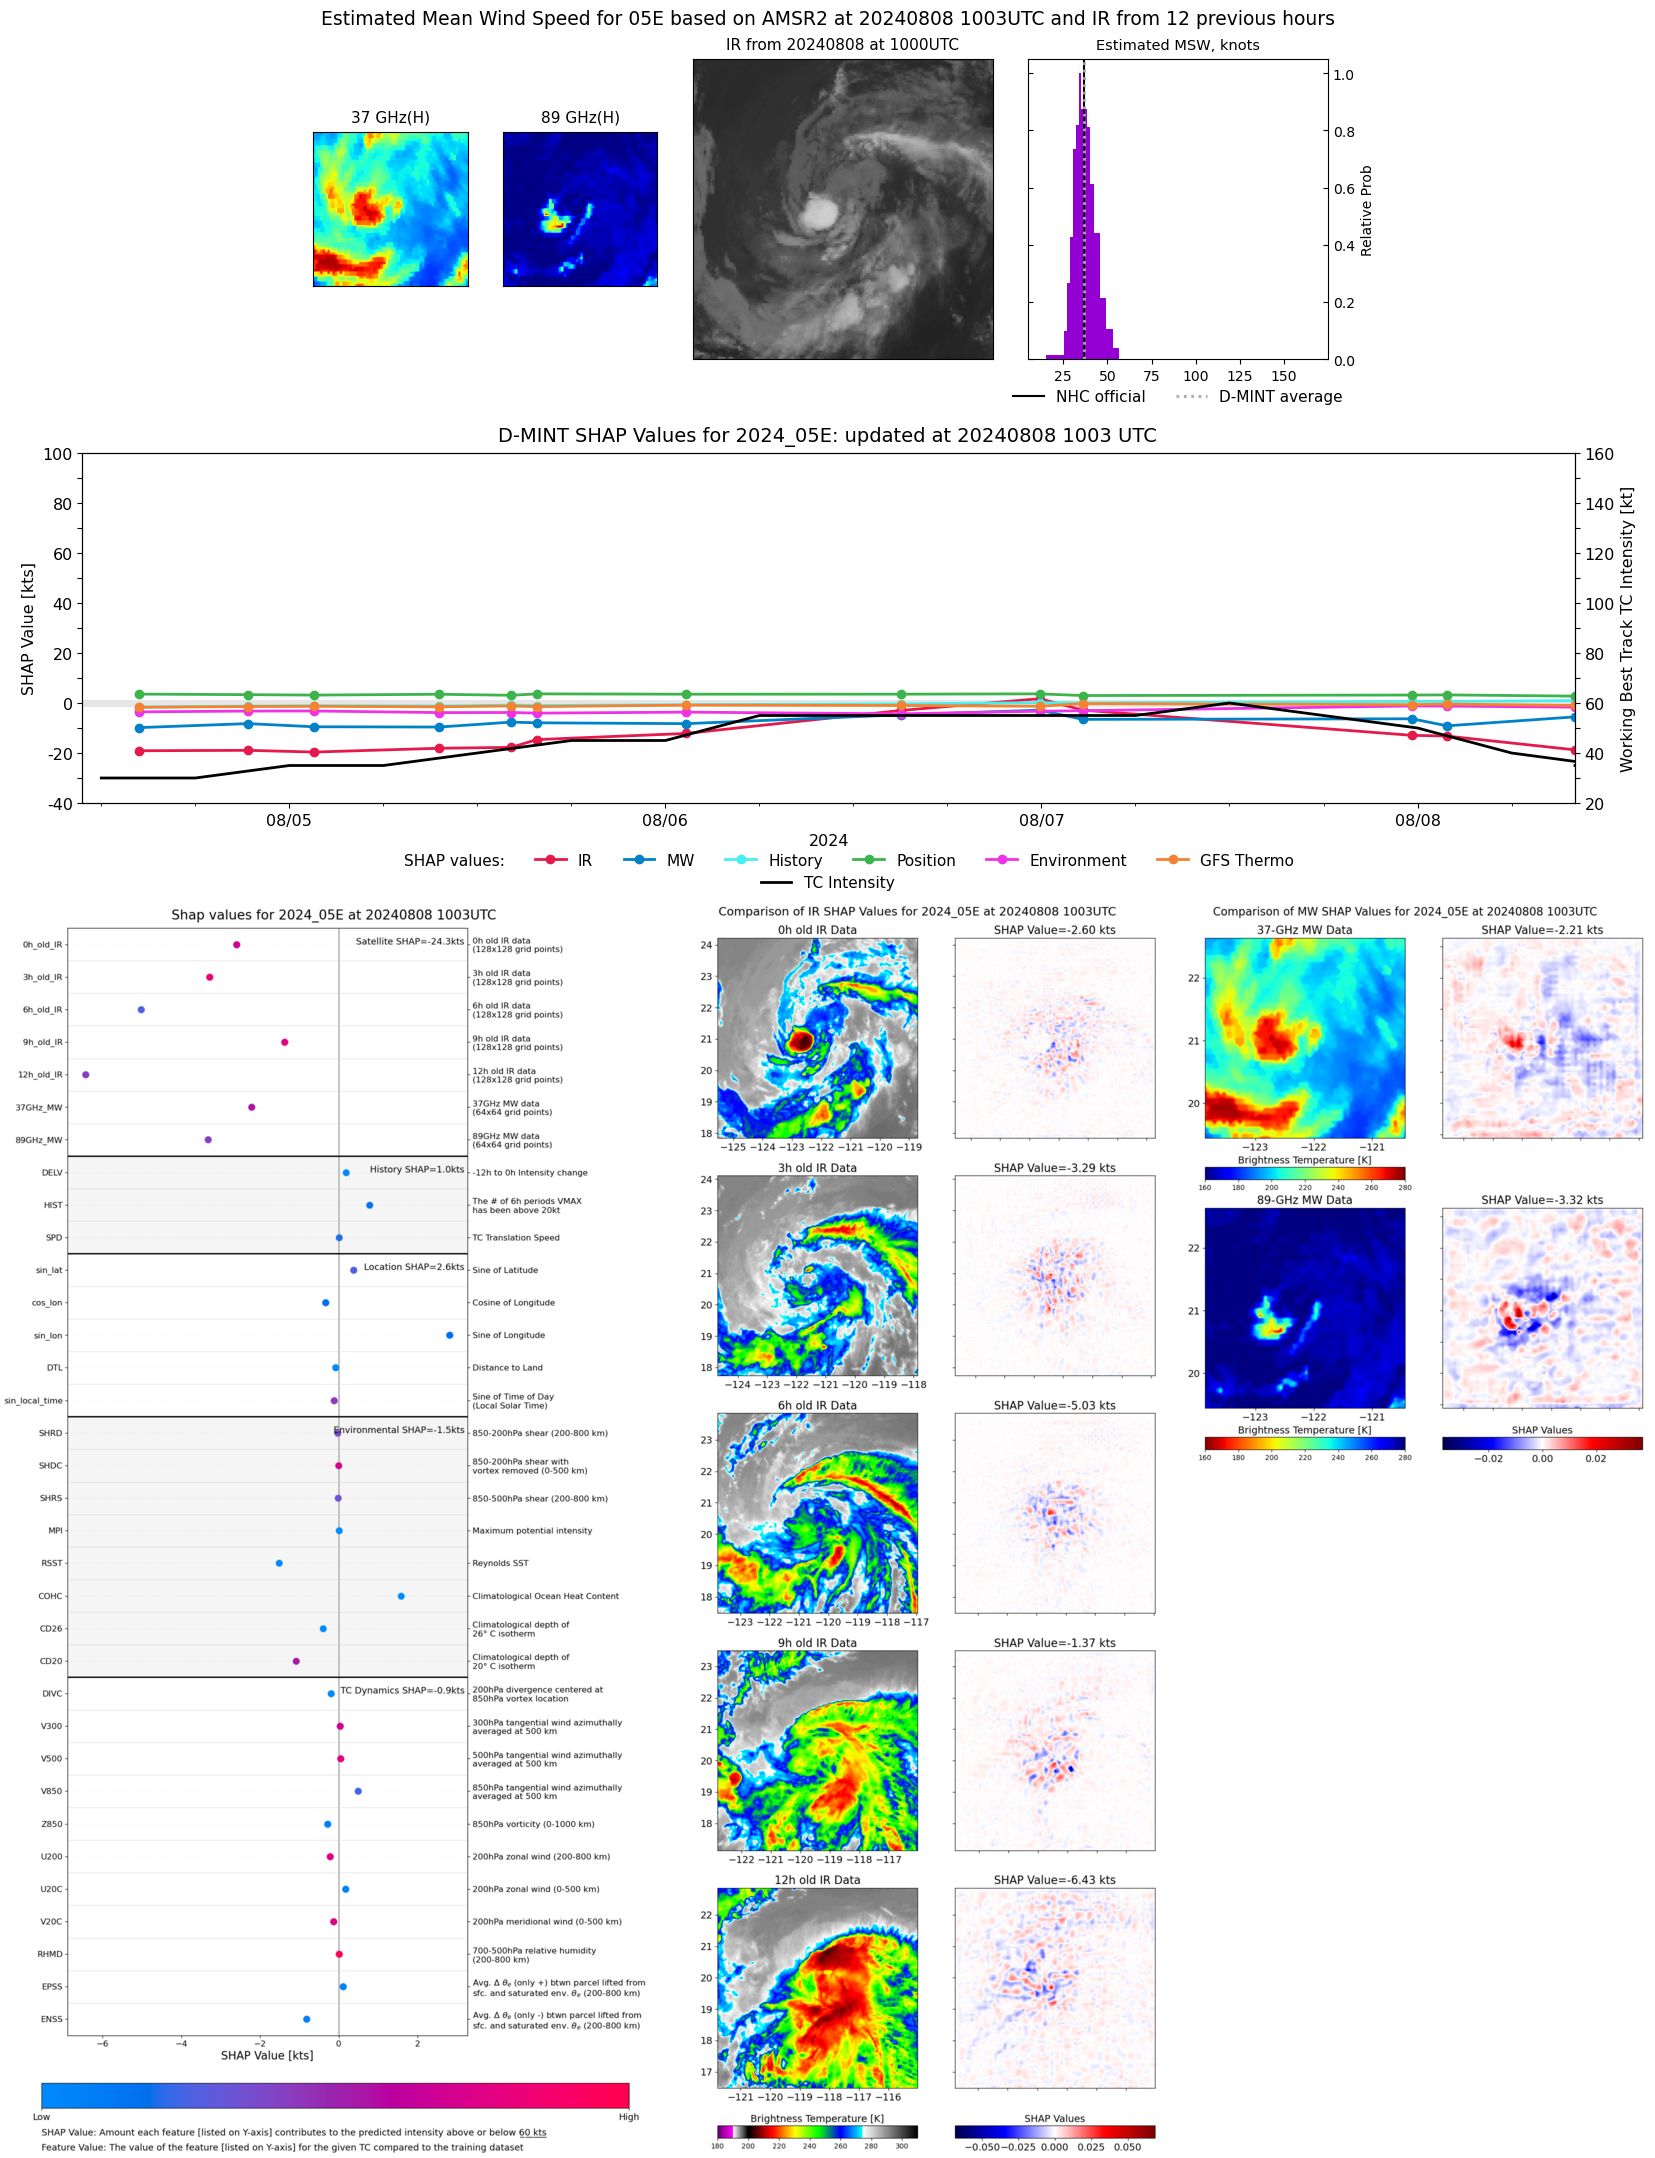 |
| 20240808 | 0153 UTC | GMI | 1003 hPa | 40 kts | 36 kts | 45 kts | 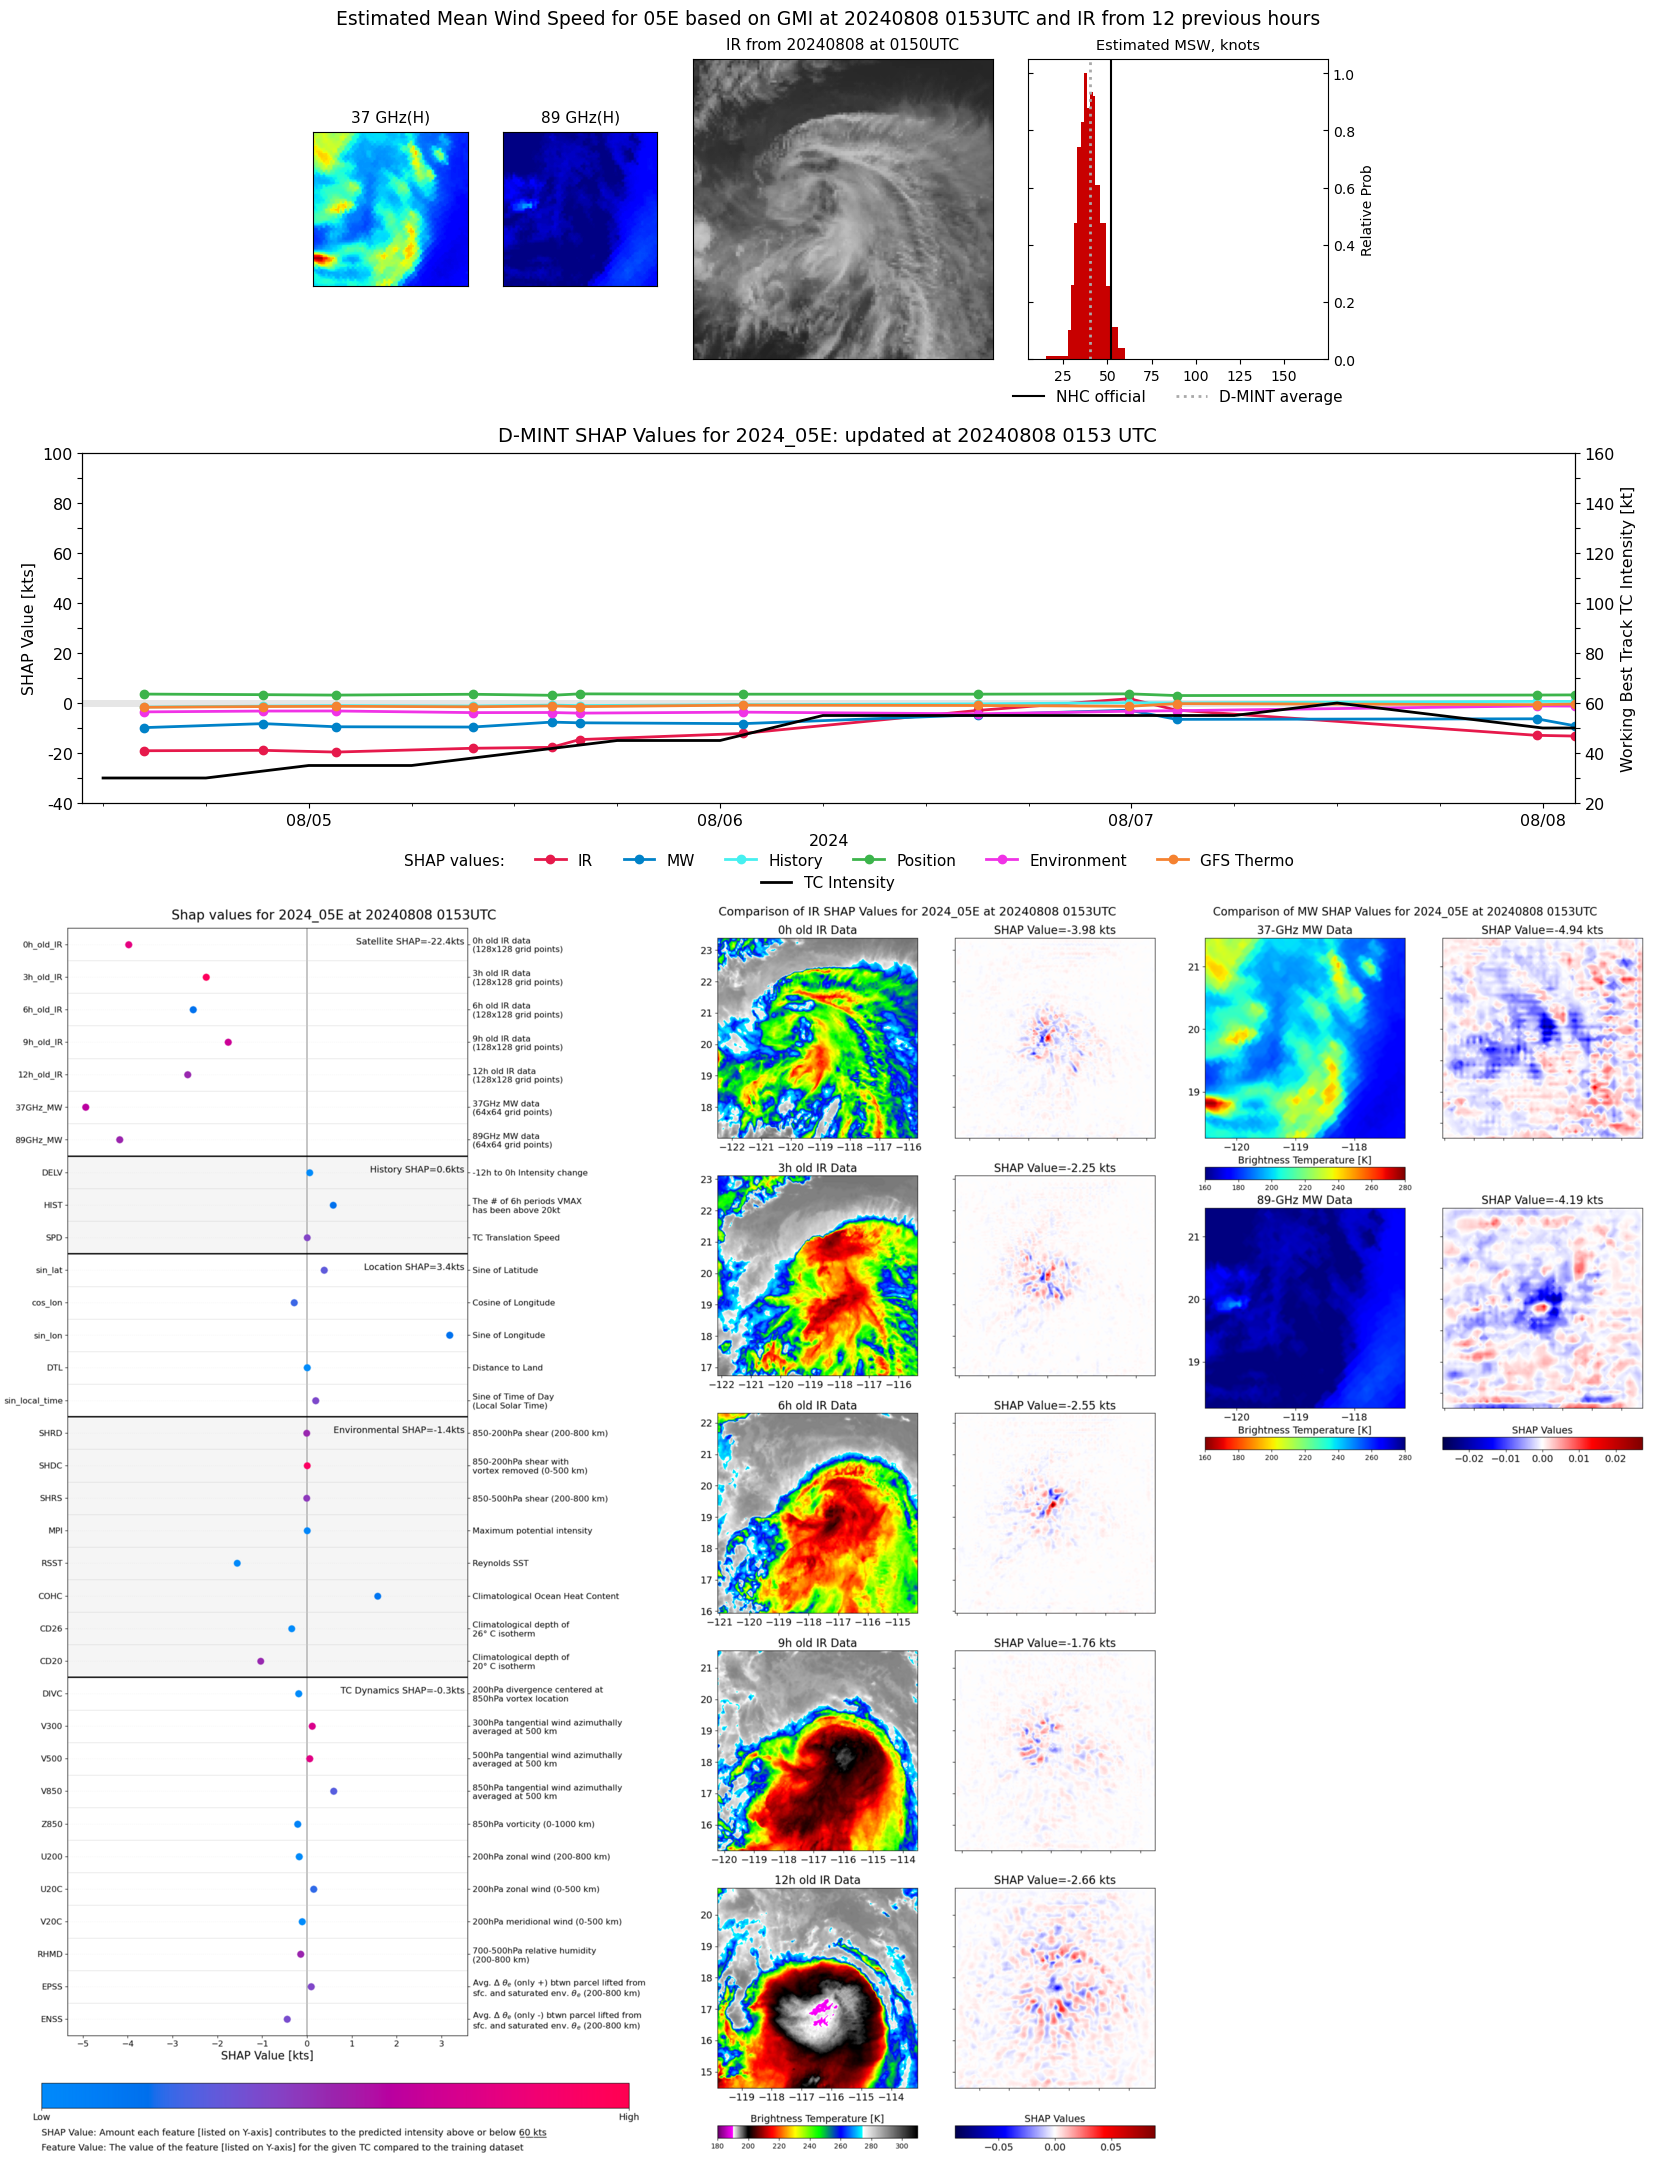 |
| 20240808 | 0149 UTC | SSMISF16 | 1006 hPa | 37 kts | 33 kts | 41 kts | 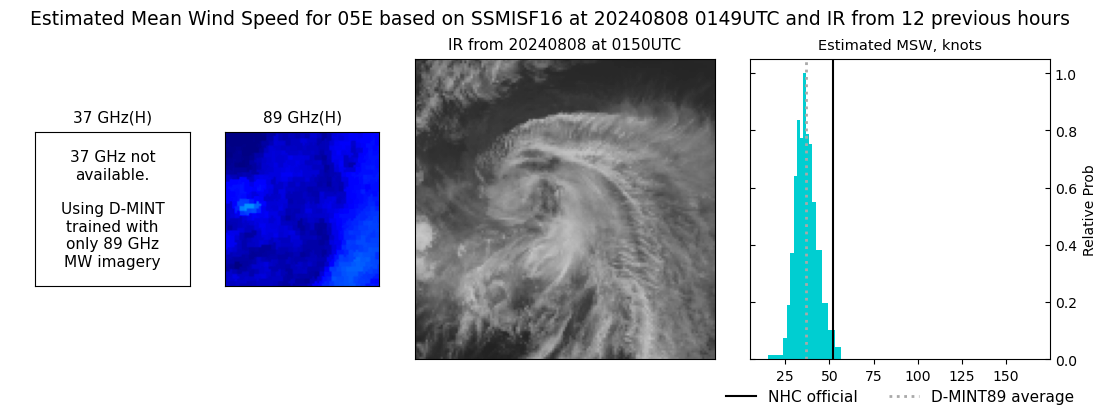 |
| 20240807 | 2339 UTC | SSMISF18 | 1003 hPa | 43 kts | 38 kts | 48 kts | 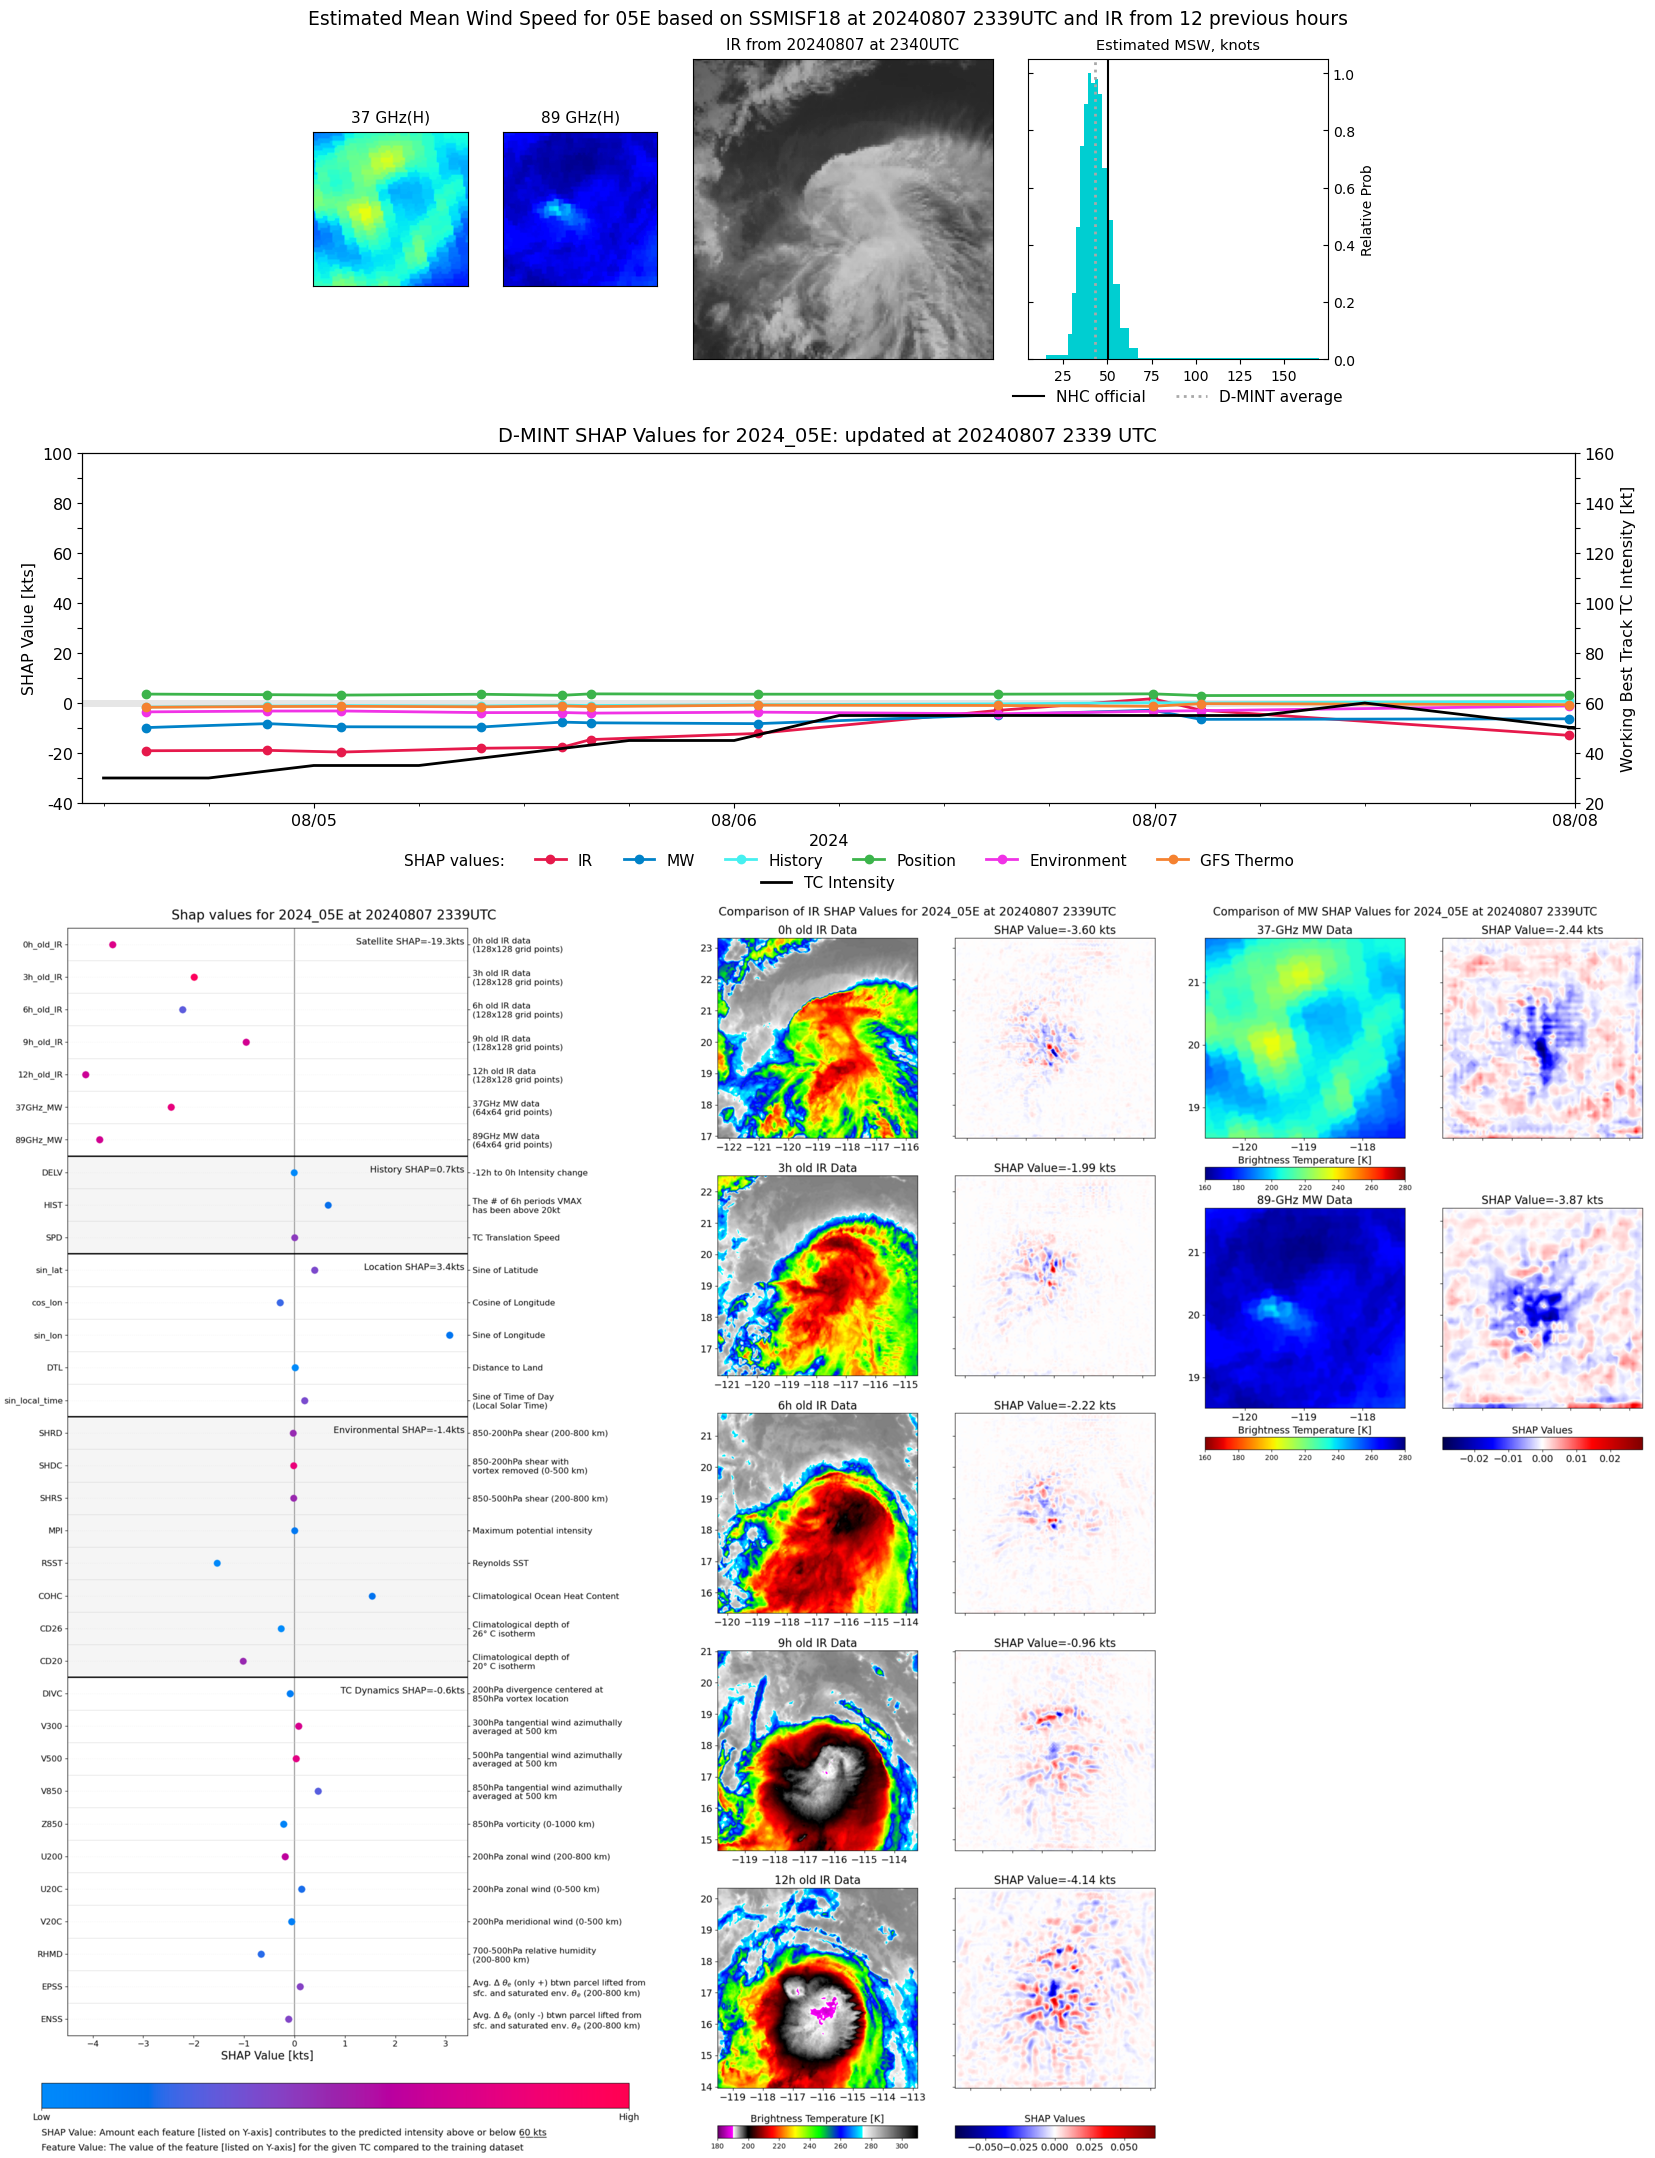 |
| 20240807 | 2028 UTC | ATMS-NPP | 999 hPa | 46 kts | 41 kts | 52 kts | 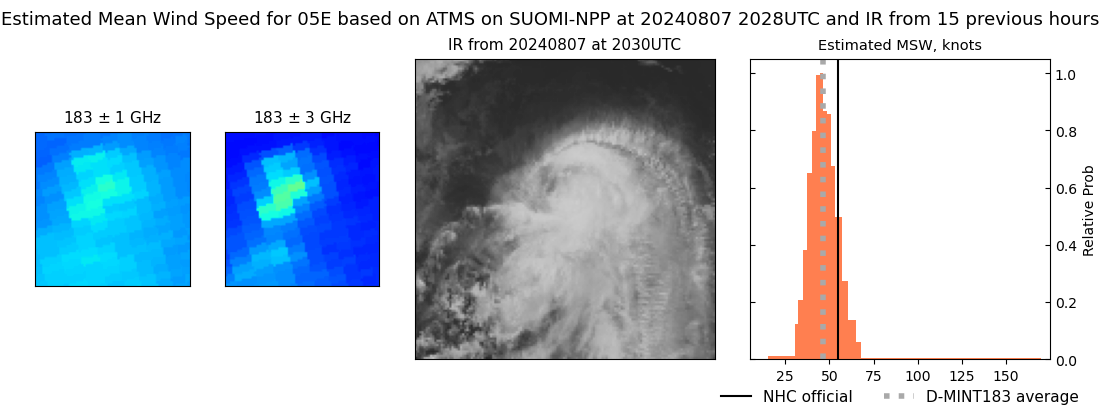 |
| 20240807 | 1342 UTC | SSMISF17 | 994 hPa | 52 kts | 47 kts | 57 kts | 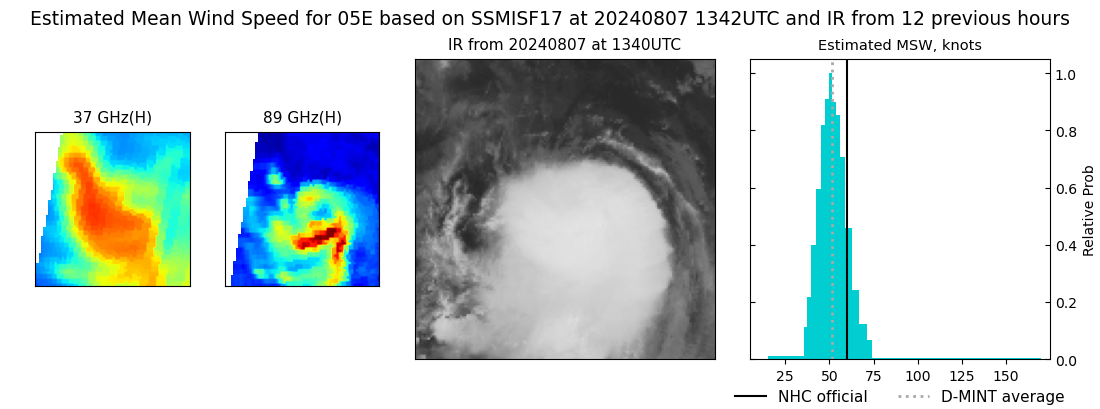 |
| 20240807 | 0921 UTC | AMSR2 | 1000 hPa | 44 kts | 39 kts | 49 kts | 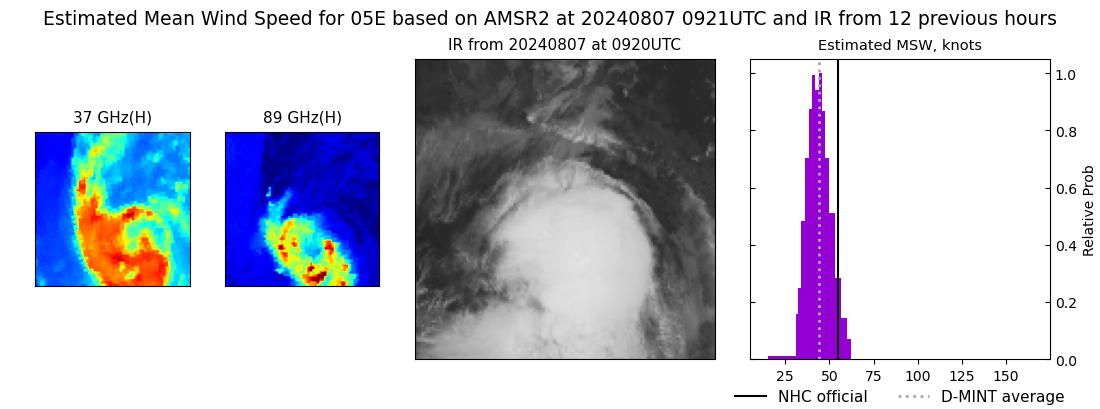 |
| 20240807 | 0238 UTC | GMI | 996 hPa | 52 kts | 46 kts | 58 kts | 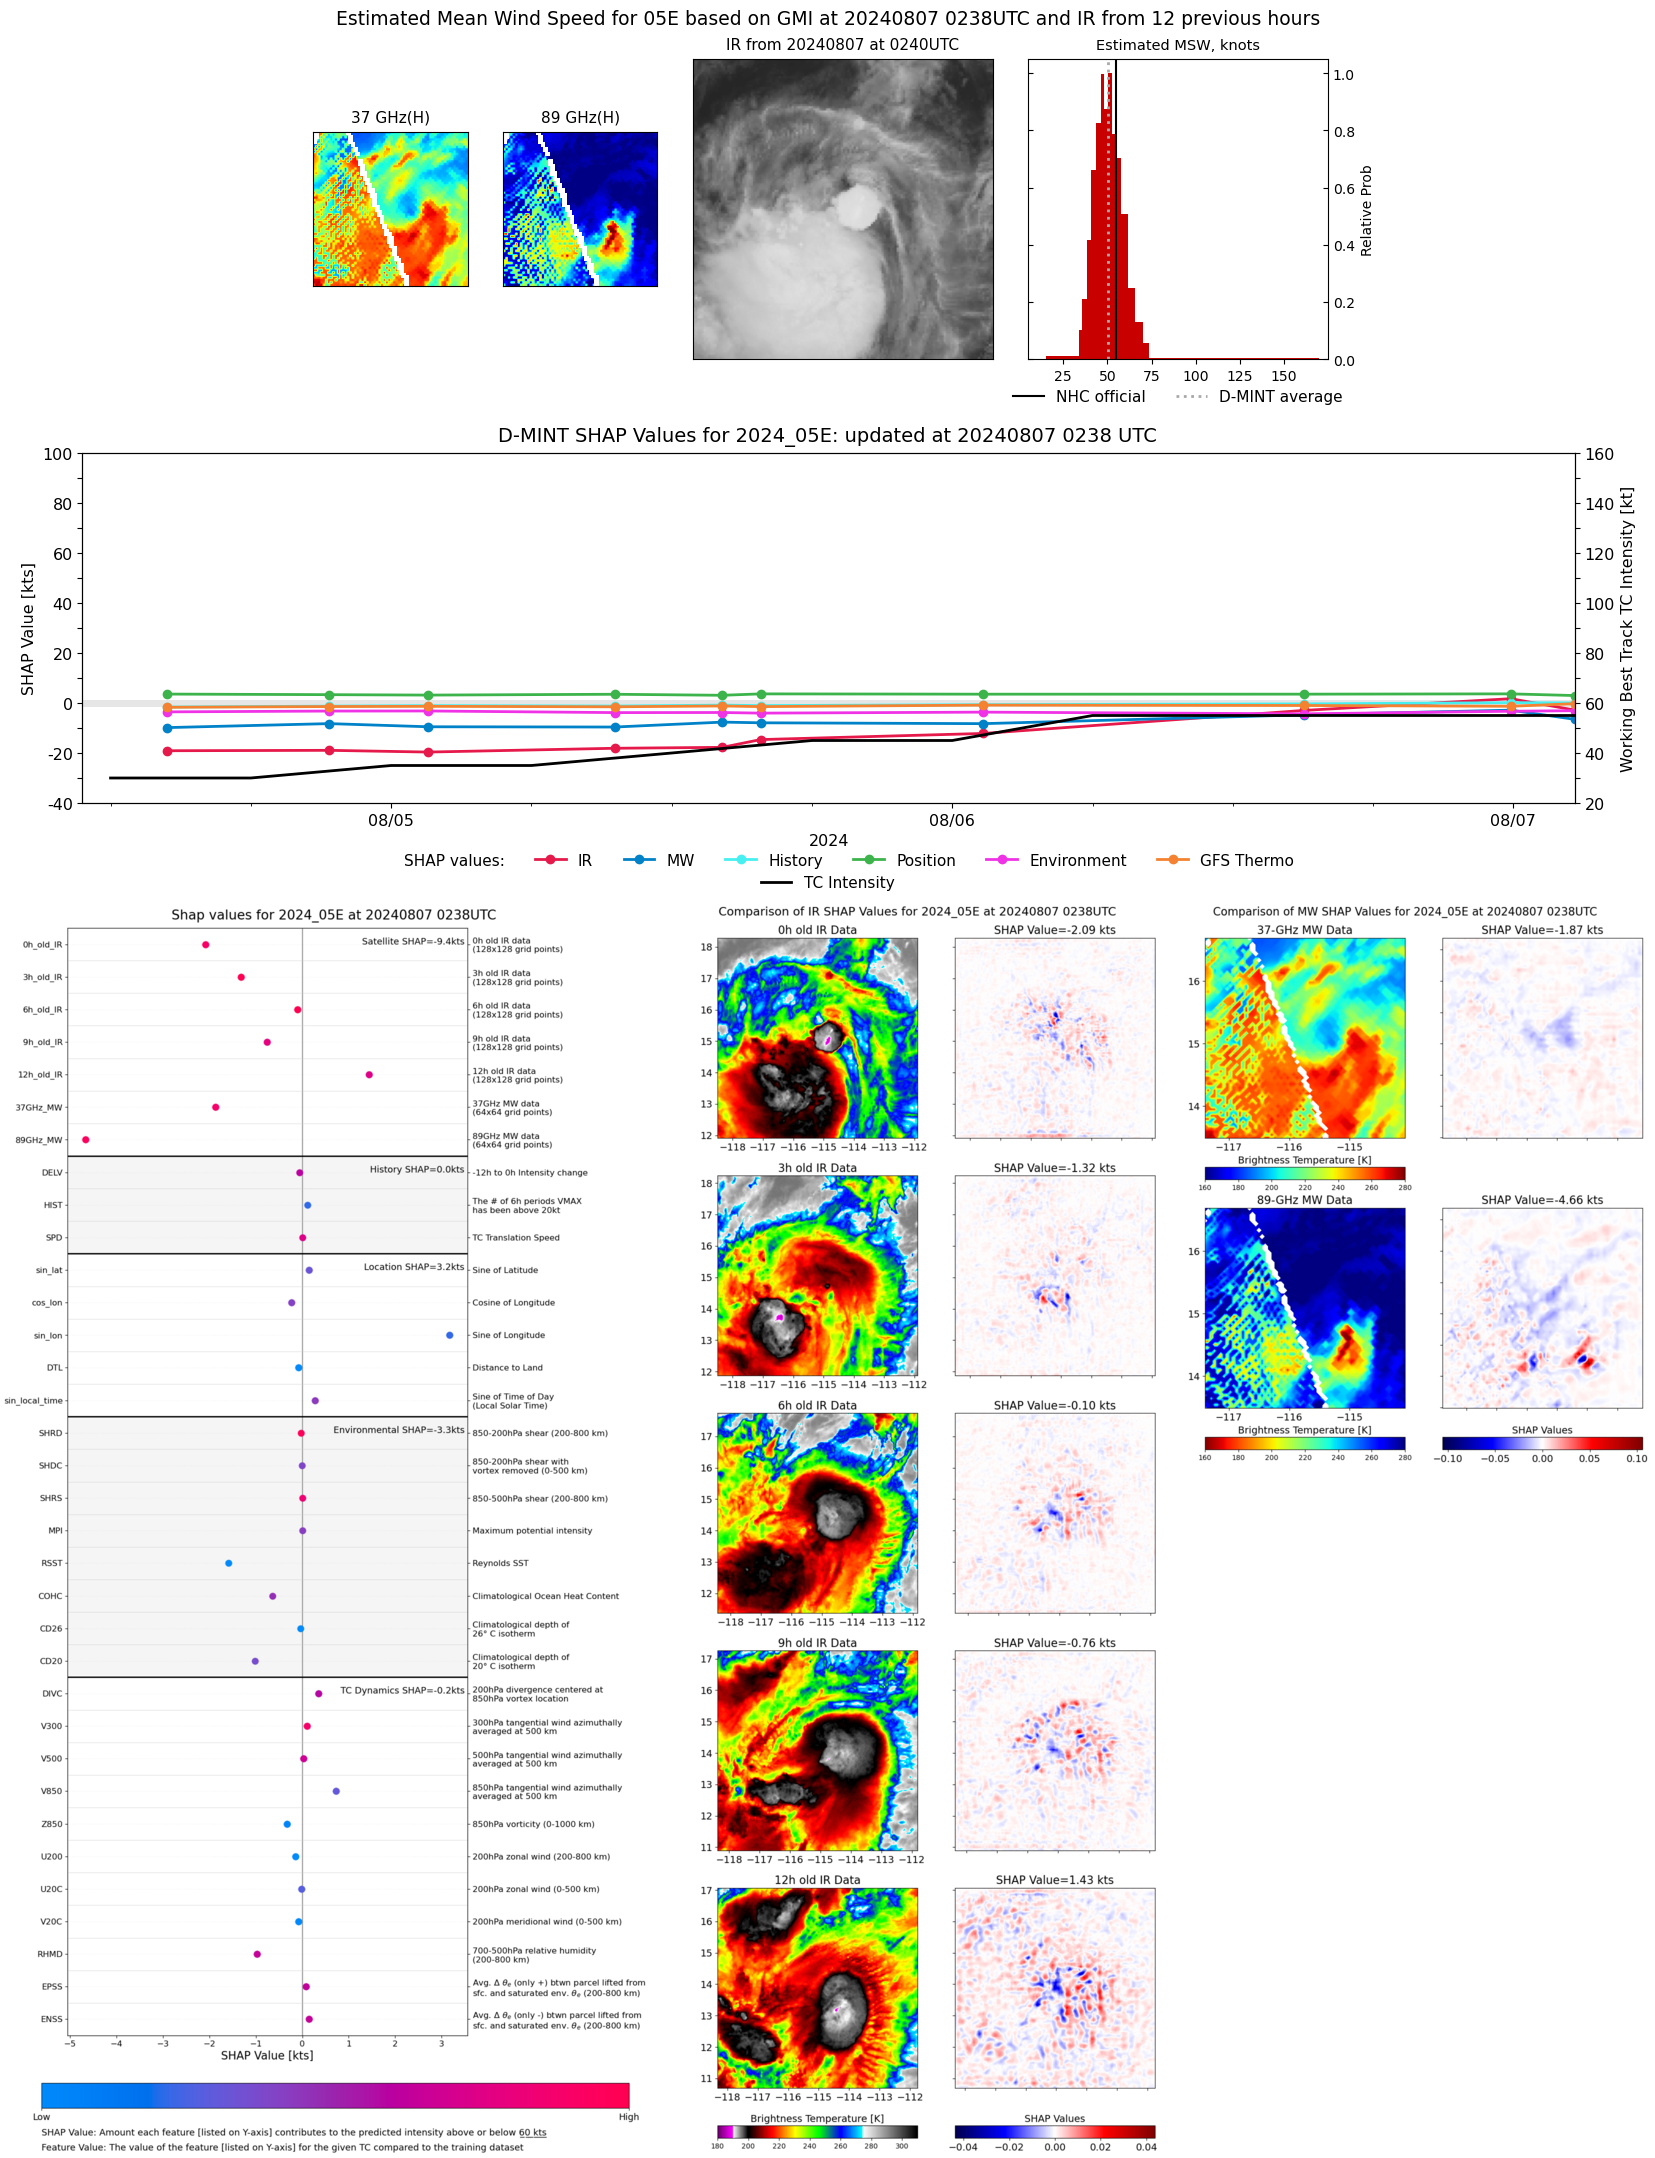 |
| 20240807 | 0202 UTC | SSMISF16 | 998 hPa | 53 kts | 47 kts | 60 kts | 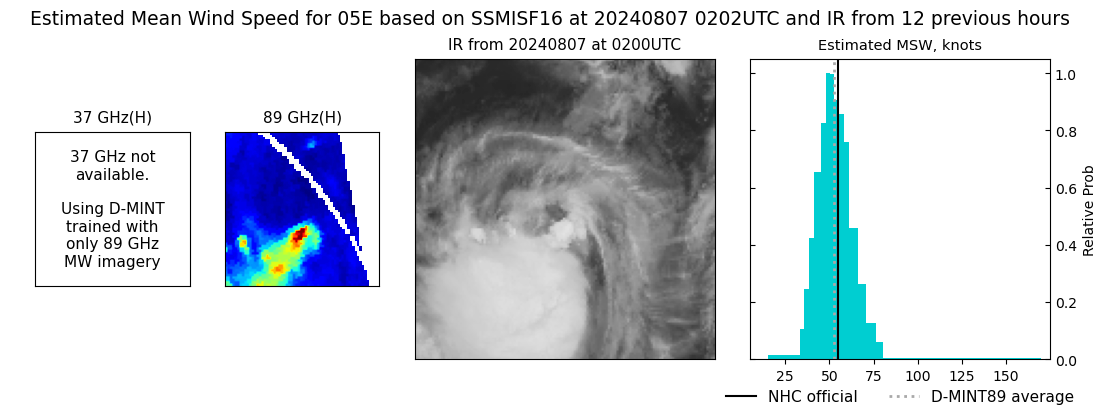 |
| 20240806 | 2353 UTC | SSMISF18 | 991 hPa | 58 kts | 51 kts | 65 kts | 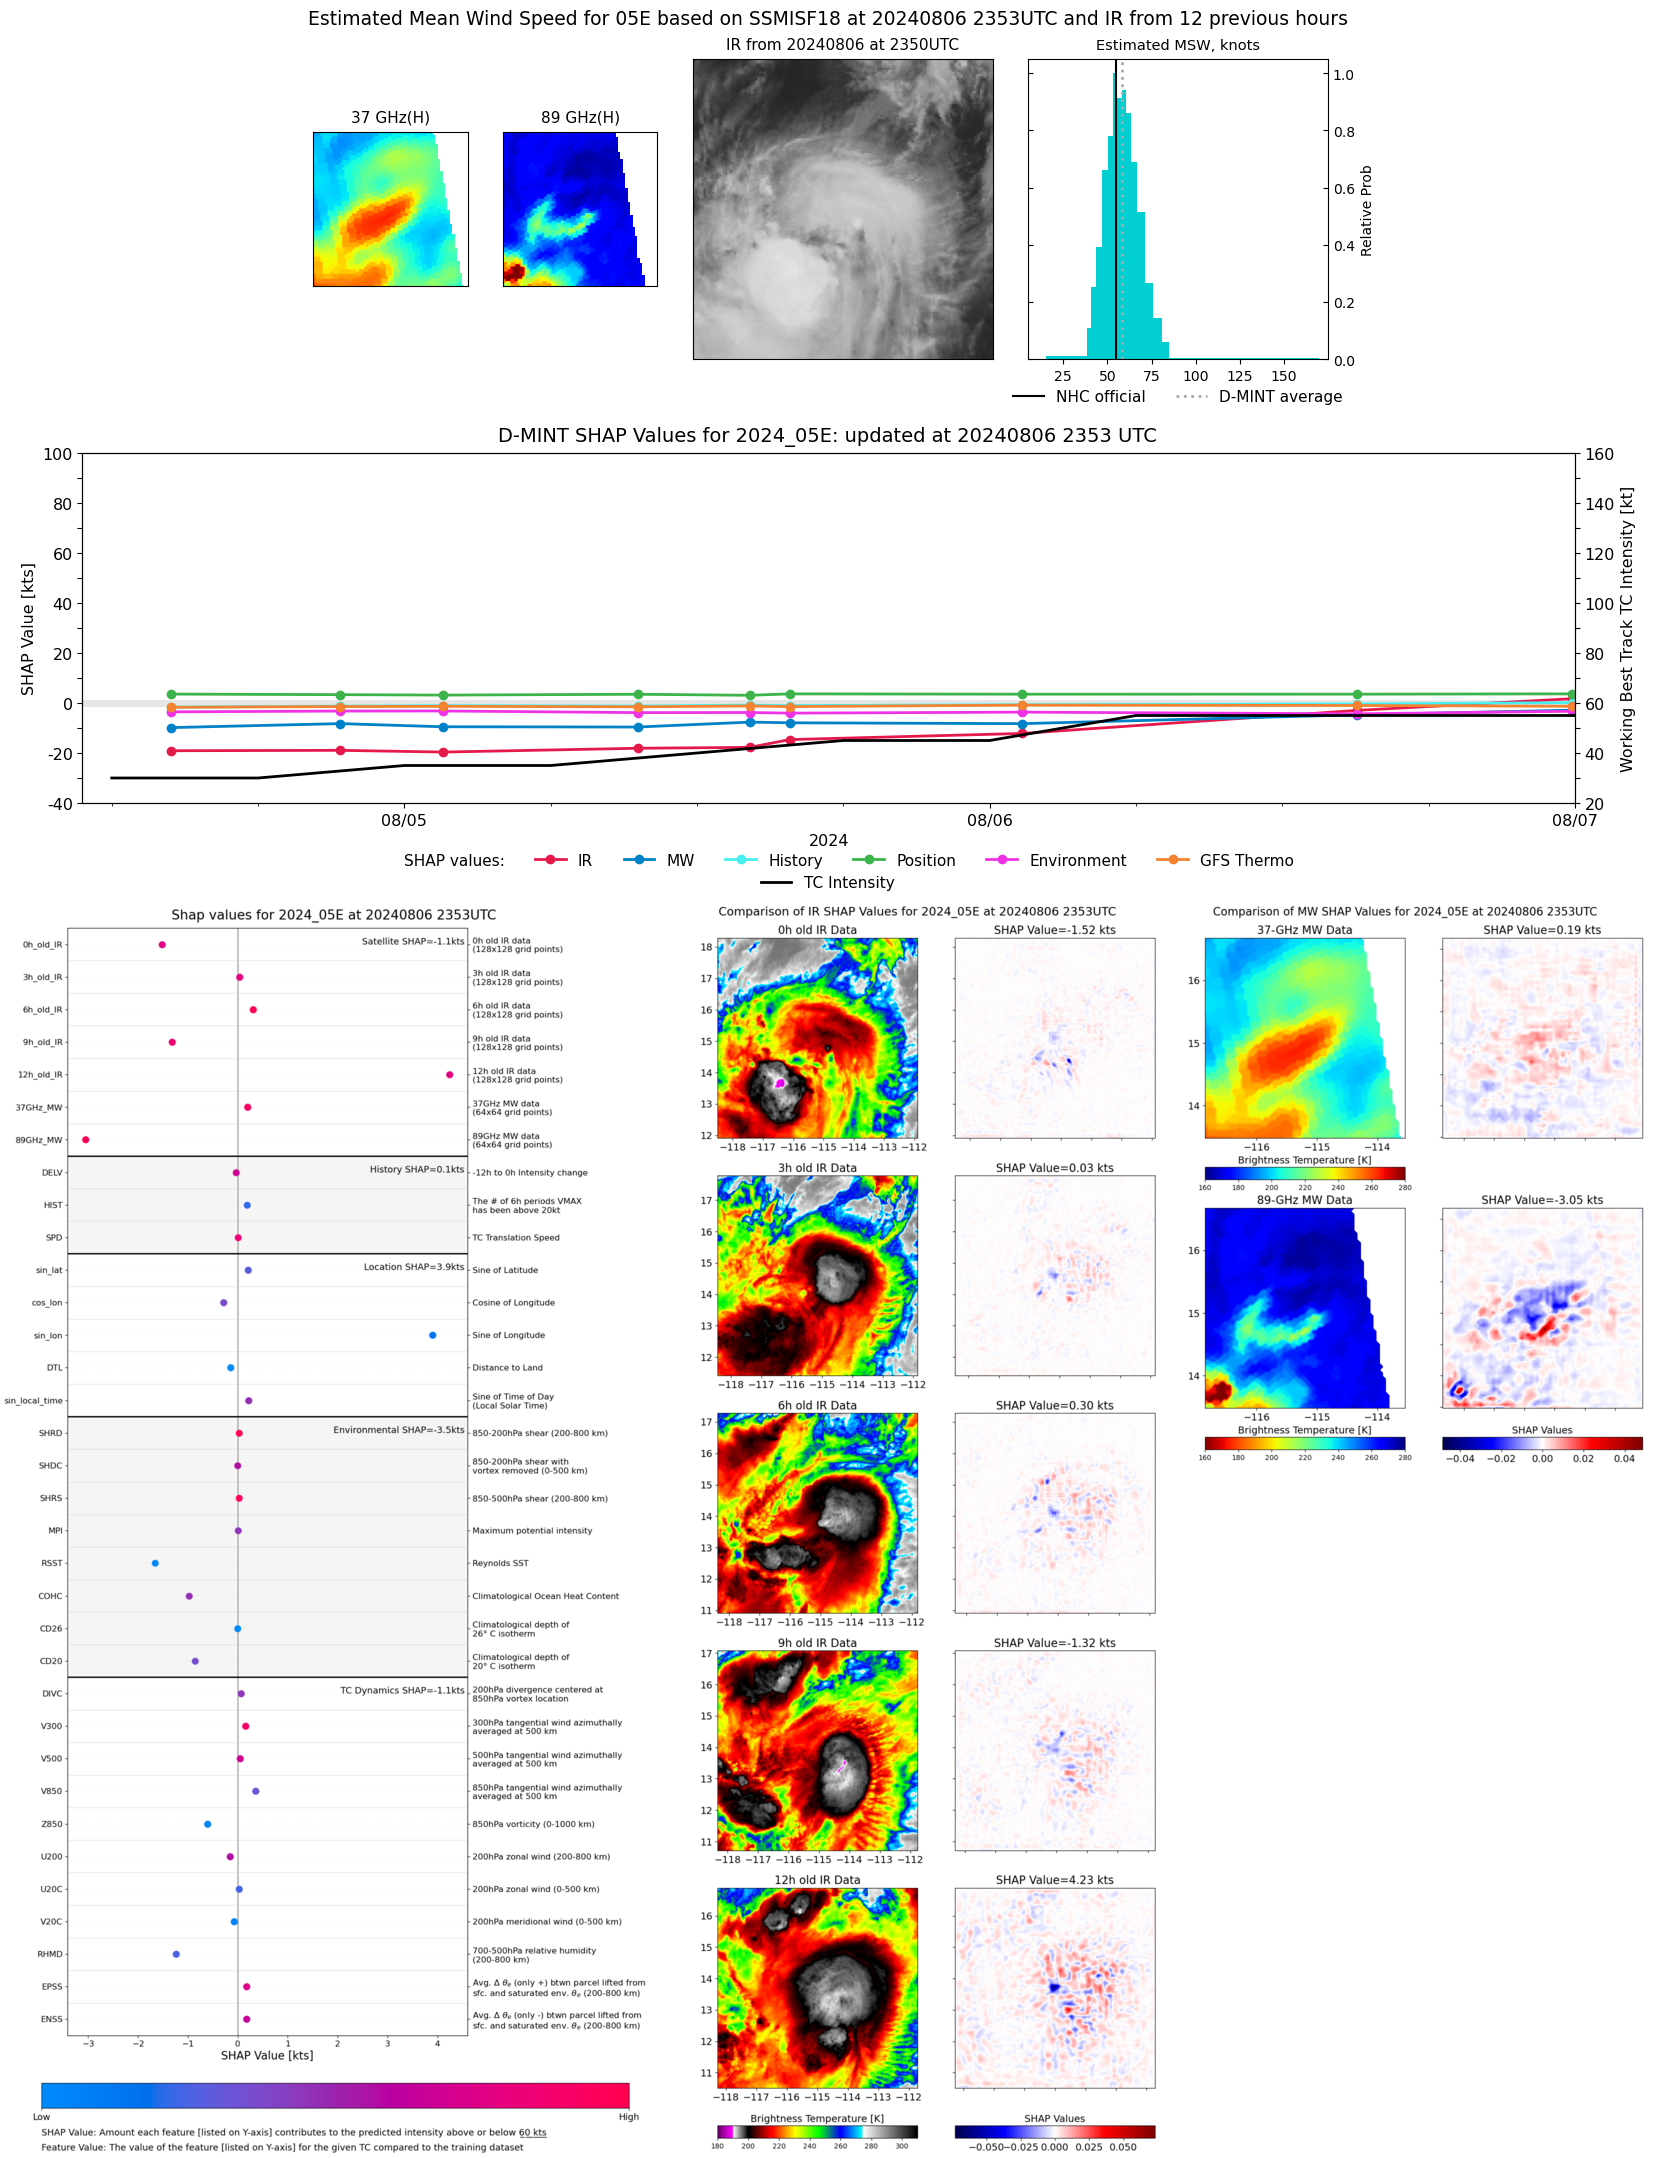 |
| 20240806 | 2109 UTC | ATMS-N20 | 992 hPa | 55 kts | 50 kts | 61 kts | 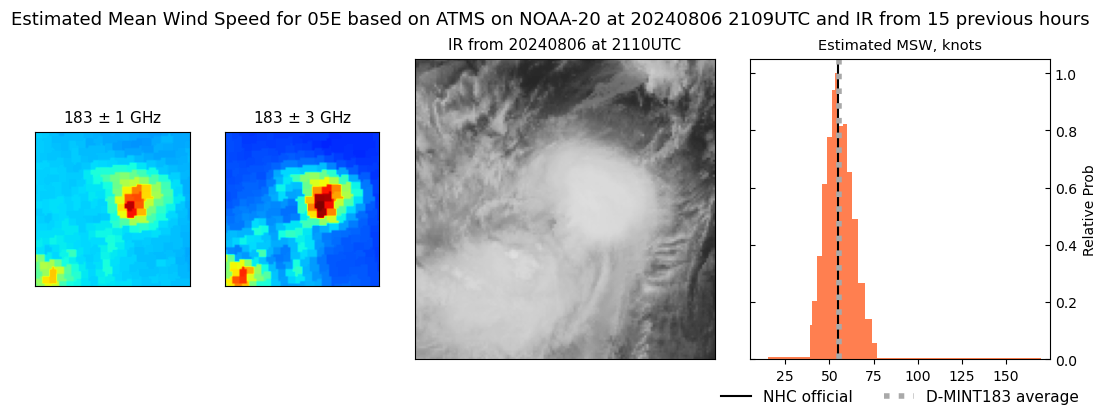 |
| 20240806 | 2108 UTC | AMSR2 | 994 hPa | 58 kts | 51 kts | 64 kts | 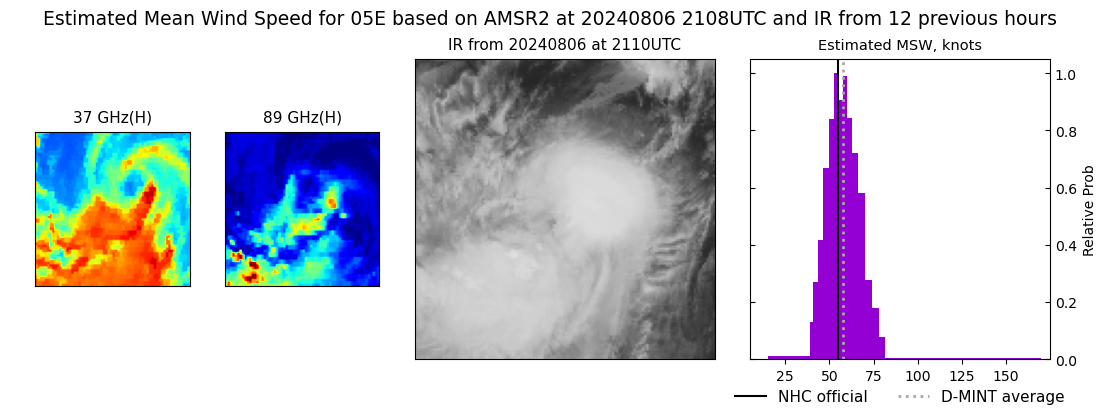 |
| 20240806 | 2045 UTC | ATMS-NPP | 994 hPa | 50 kts | 45 kts | 55 kts |  |
| 20240806 | 2020 UTC | ATMS-N21 | 993 hPa | 52 kts | 47 kts | 57 kts | 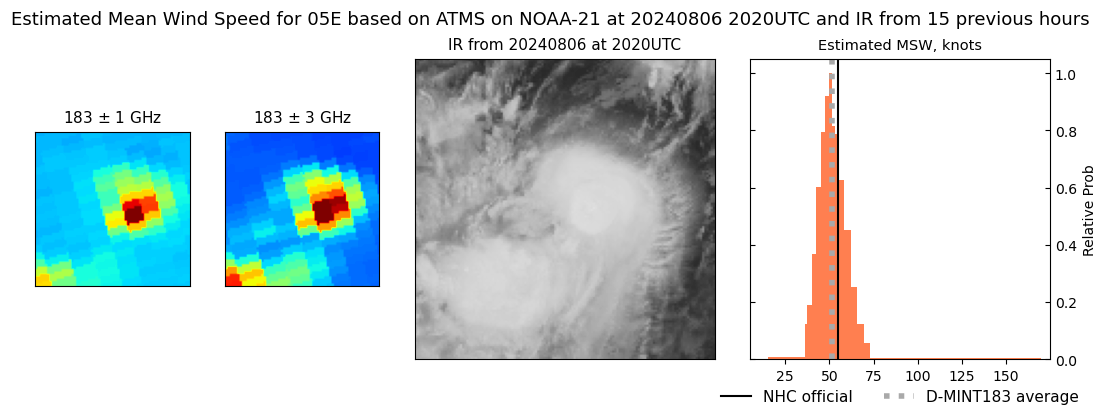 |
| 20240806 | 1503 UTC | GMI | 996 hPa | 50 kts | 46 kts | 56 kts | 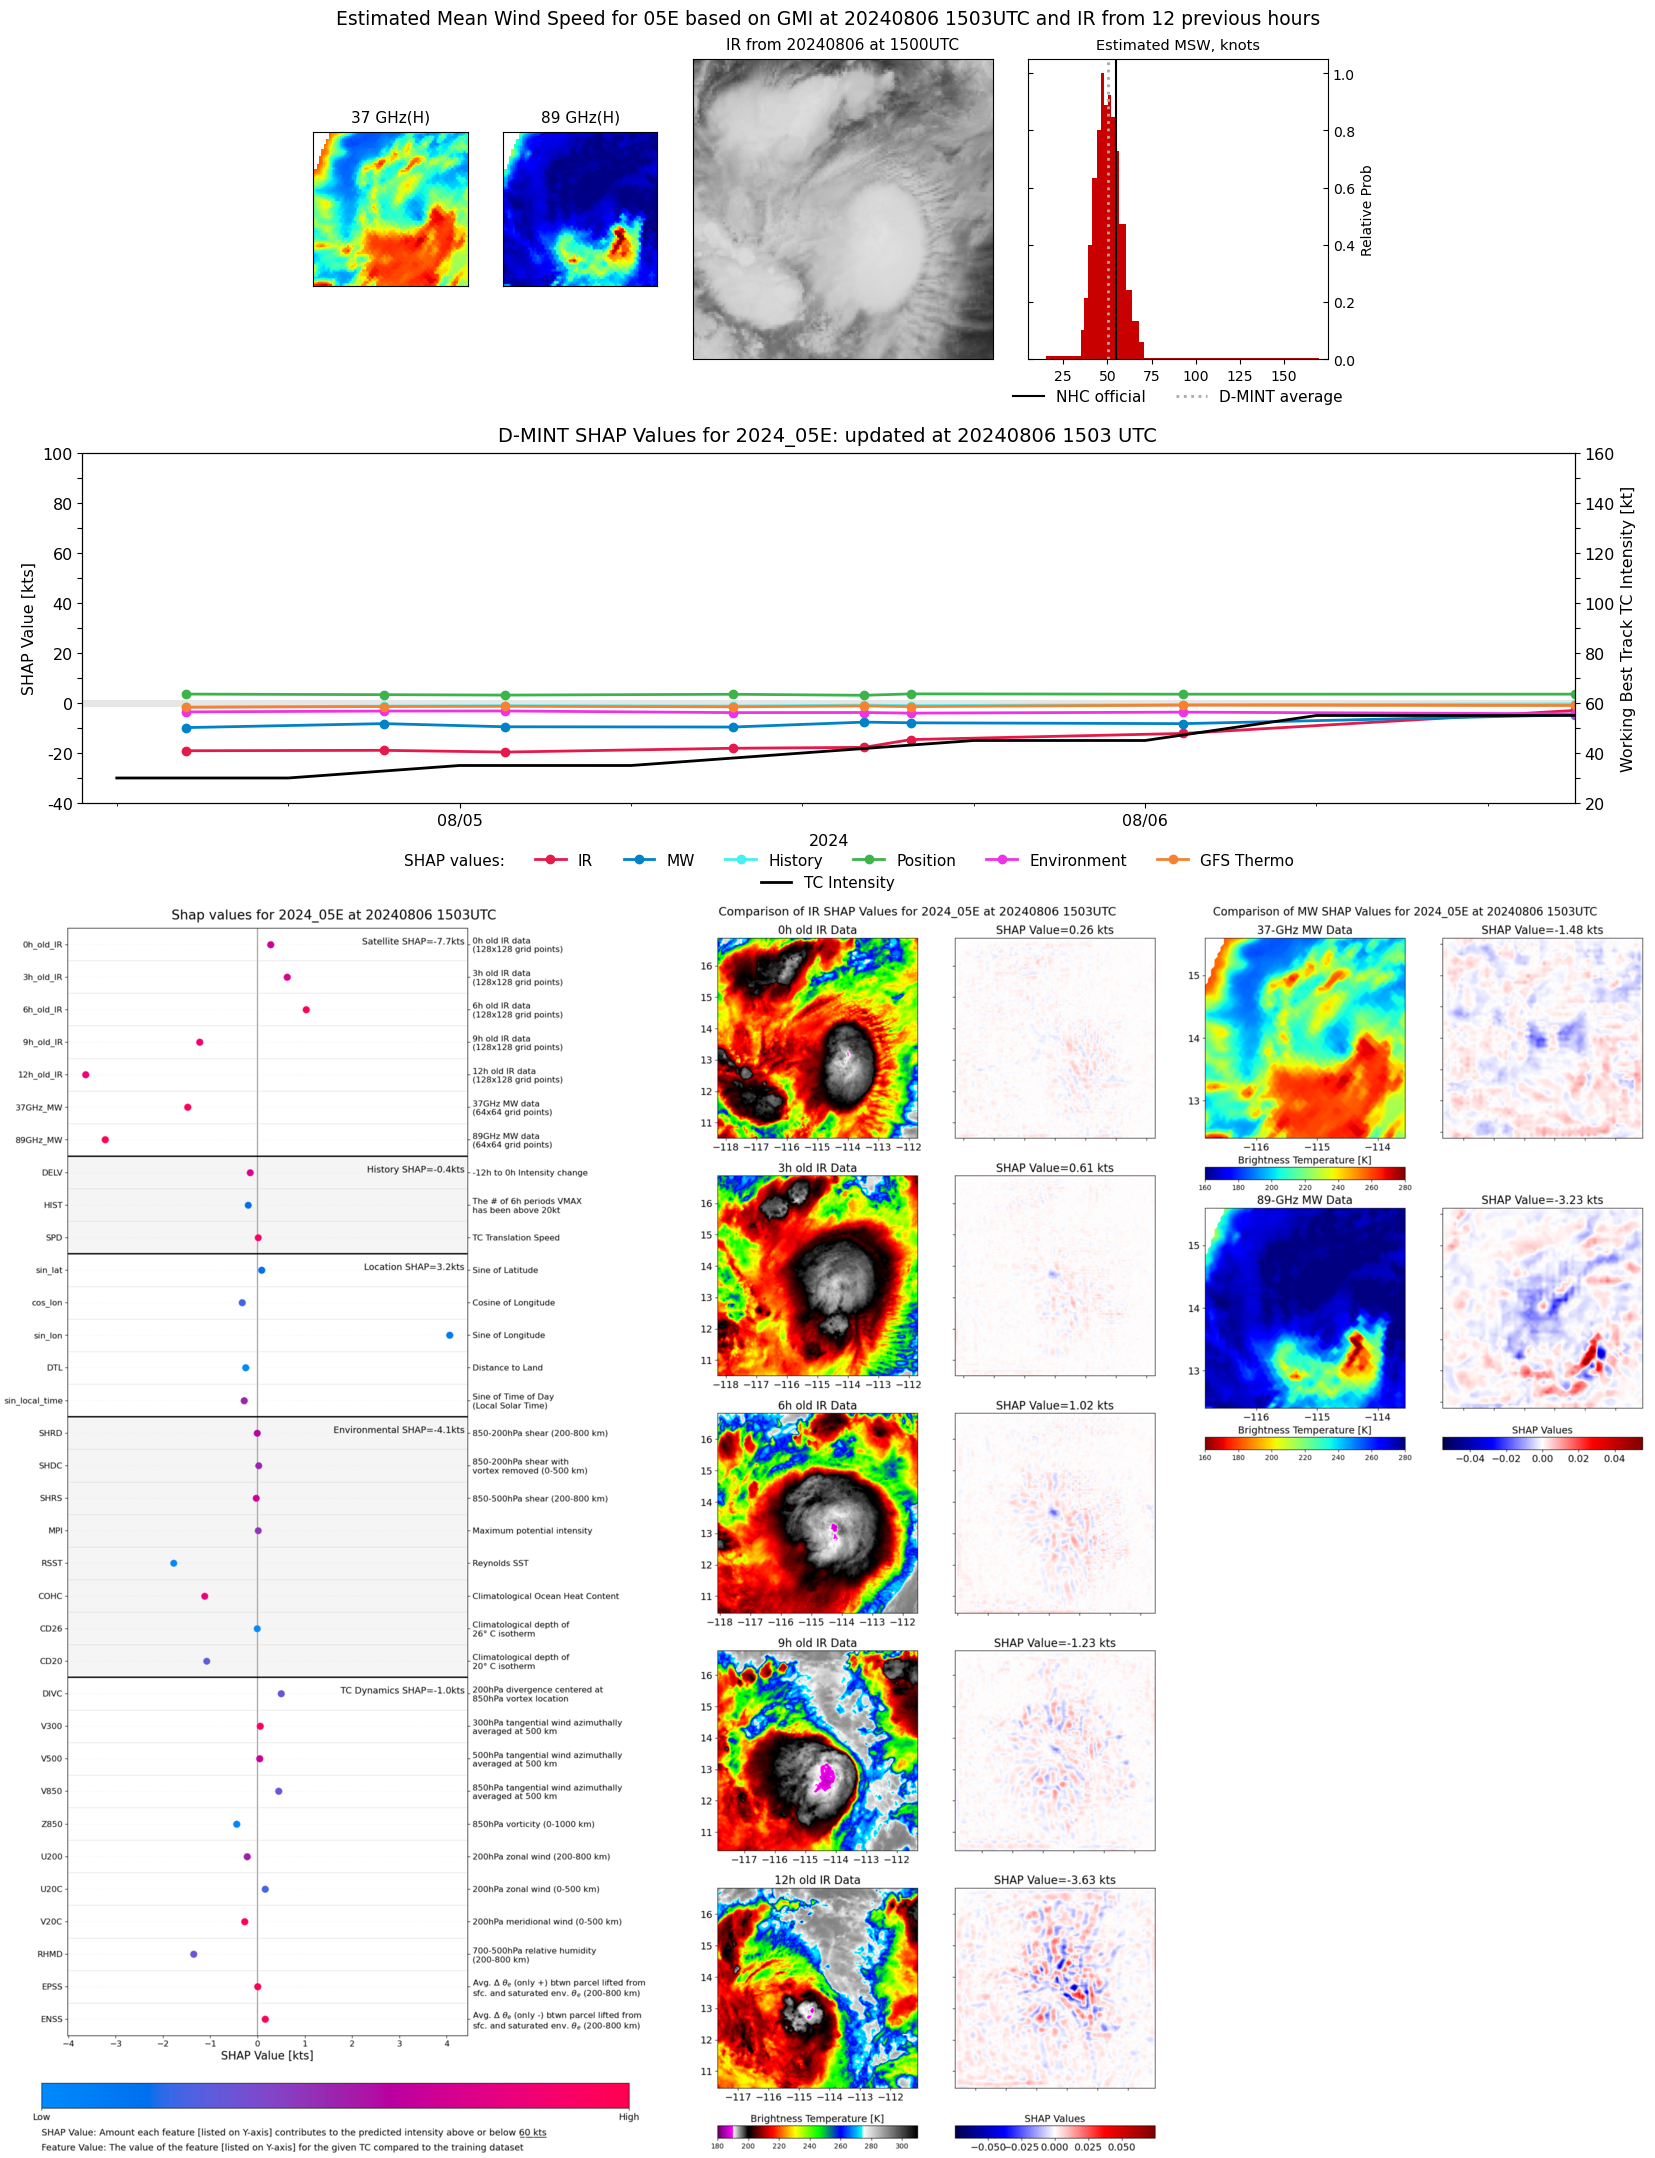 |
| 20240806 | 1357 UTC | SSMISF17 | 998 hPa | 49 kts | 43 kts | 54 kts | 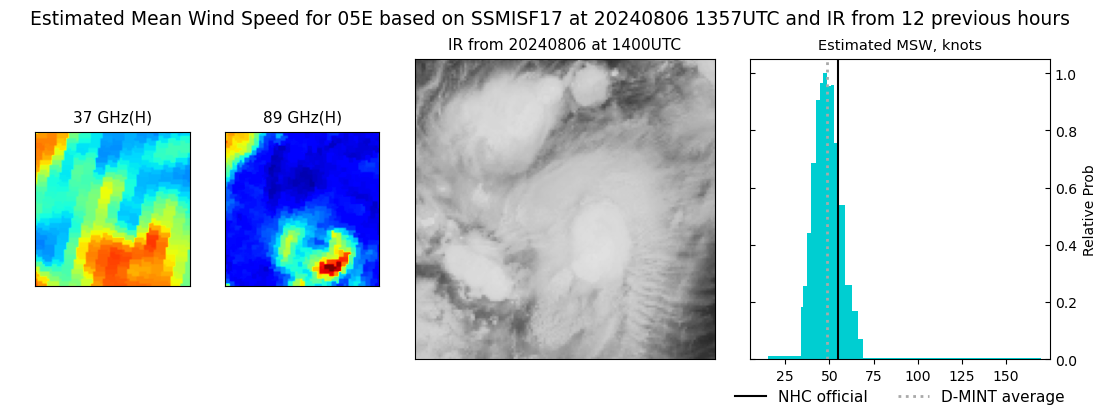 |
| 20240806 | 0937 UTC | ATMS-NPP | 994 hPa | 51 kts | 46 kts | 56 kts | 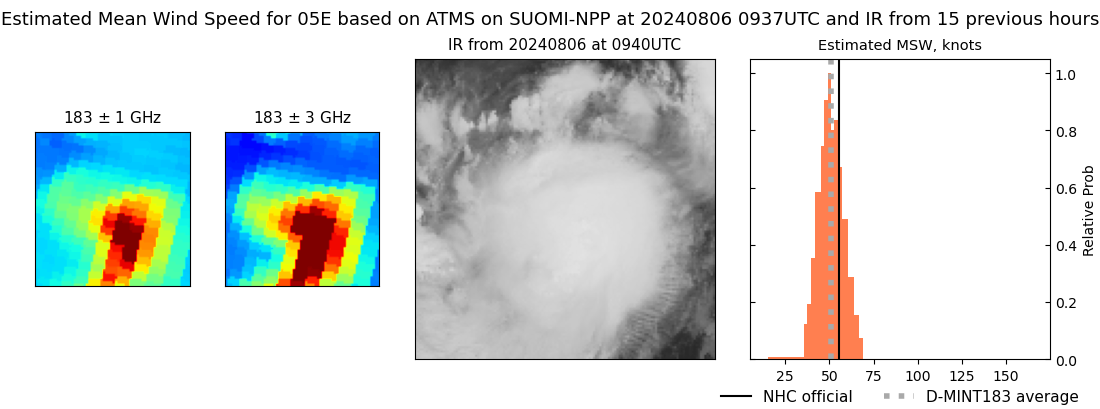 |
| 20240806 | 0912 UTC | ATMS-N21 | 995 hPa | 43 kts | 38 kts | 47 kts | 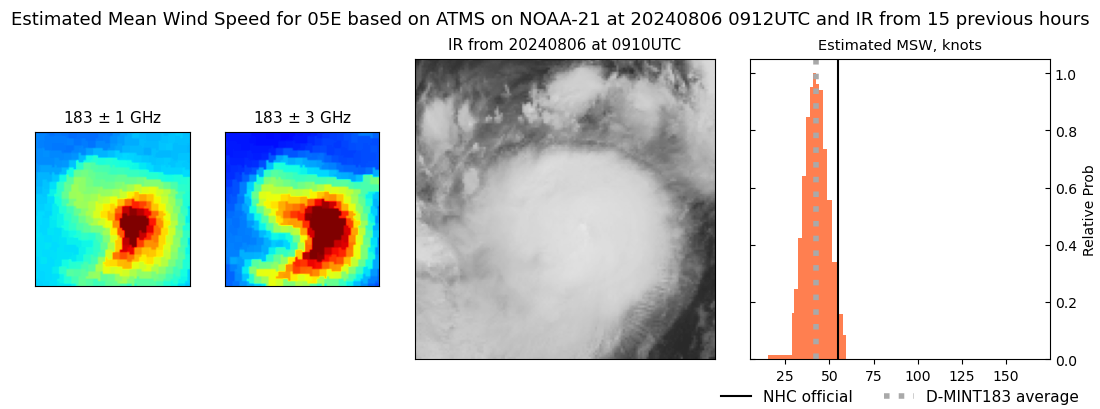 |
| 20240806 | 0120 UTC | SSMISF17 | 999 hPa | 38 kts | 34 kts | 42 kts | 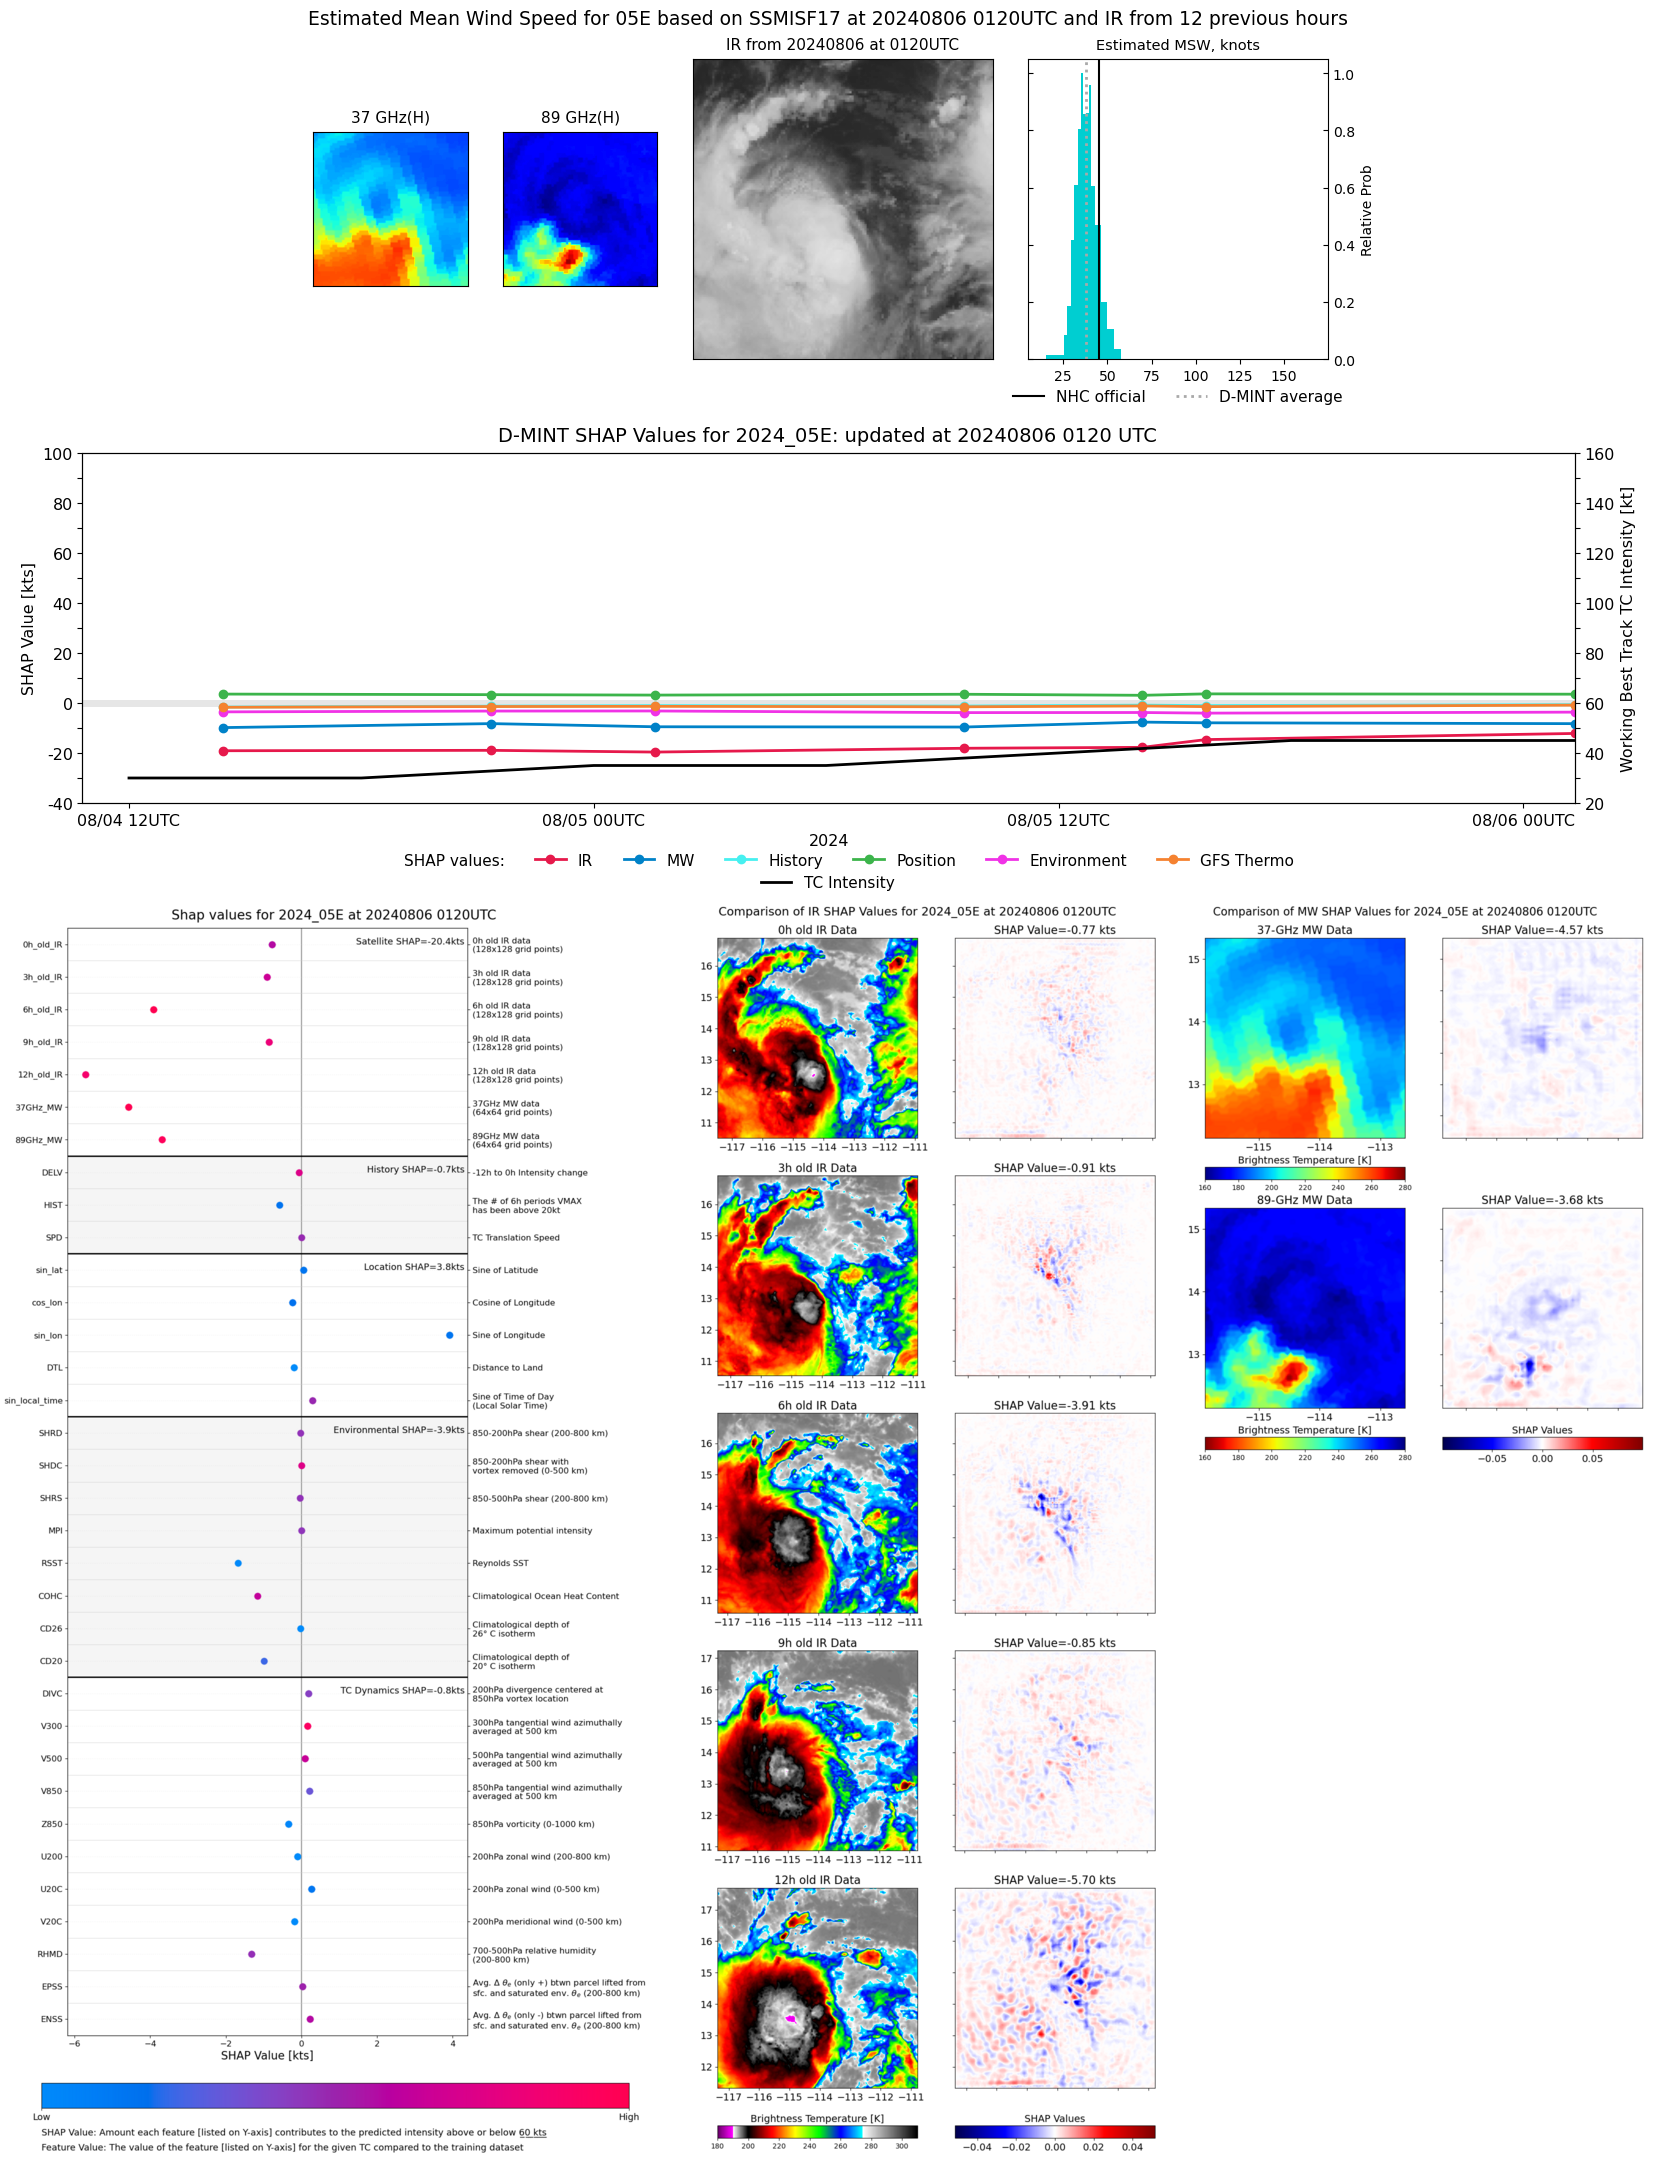 |
| 20240805 | 2128 UTC | ATMS-N20 | 1000 hPa | 38 kts | 34 kts | 43 kts | 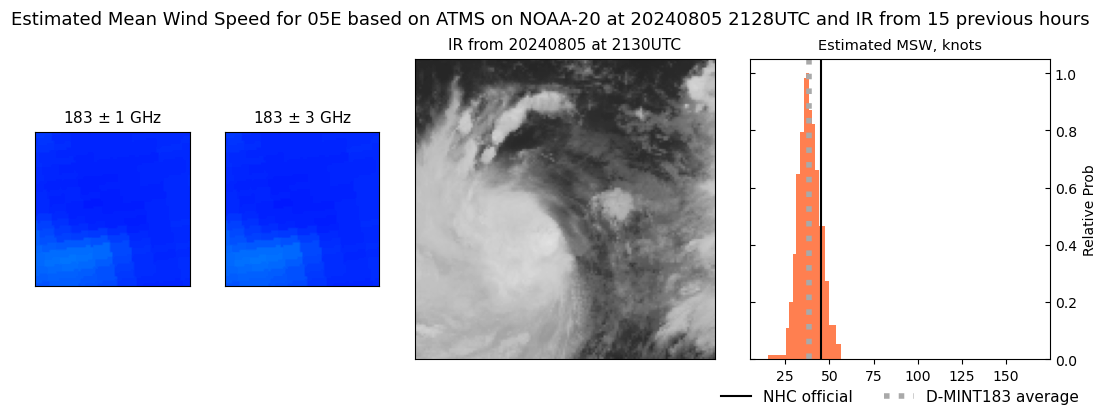 |
| 20240805 | 2103 UTC | ATMS-NPP | 1004 hPa | 36 kts | 32 kts | 40 kts | 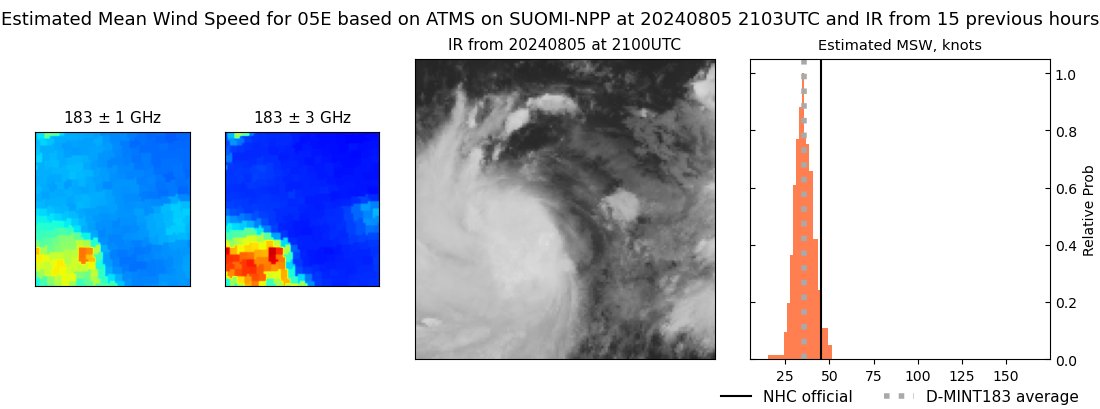 |
| 20240805 | 2038 UTC | ATMS-N21 | 1003 hPa | 36 kts | 32 kts | 40 kts | 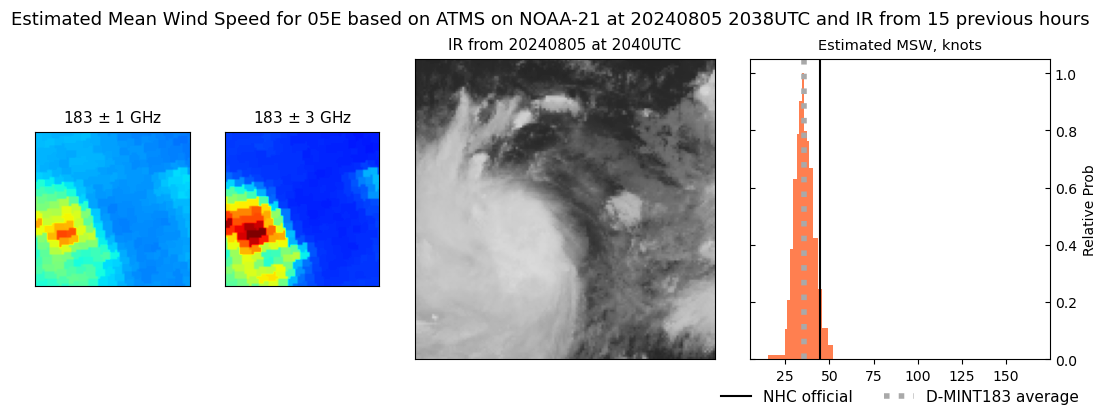 |
| 20240805 | 1548 UTC | GMI | 1005 hPa | 35 kts | 32 kts | 39 kts | 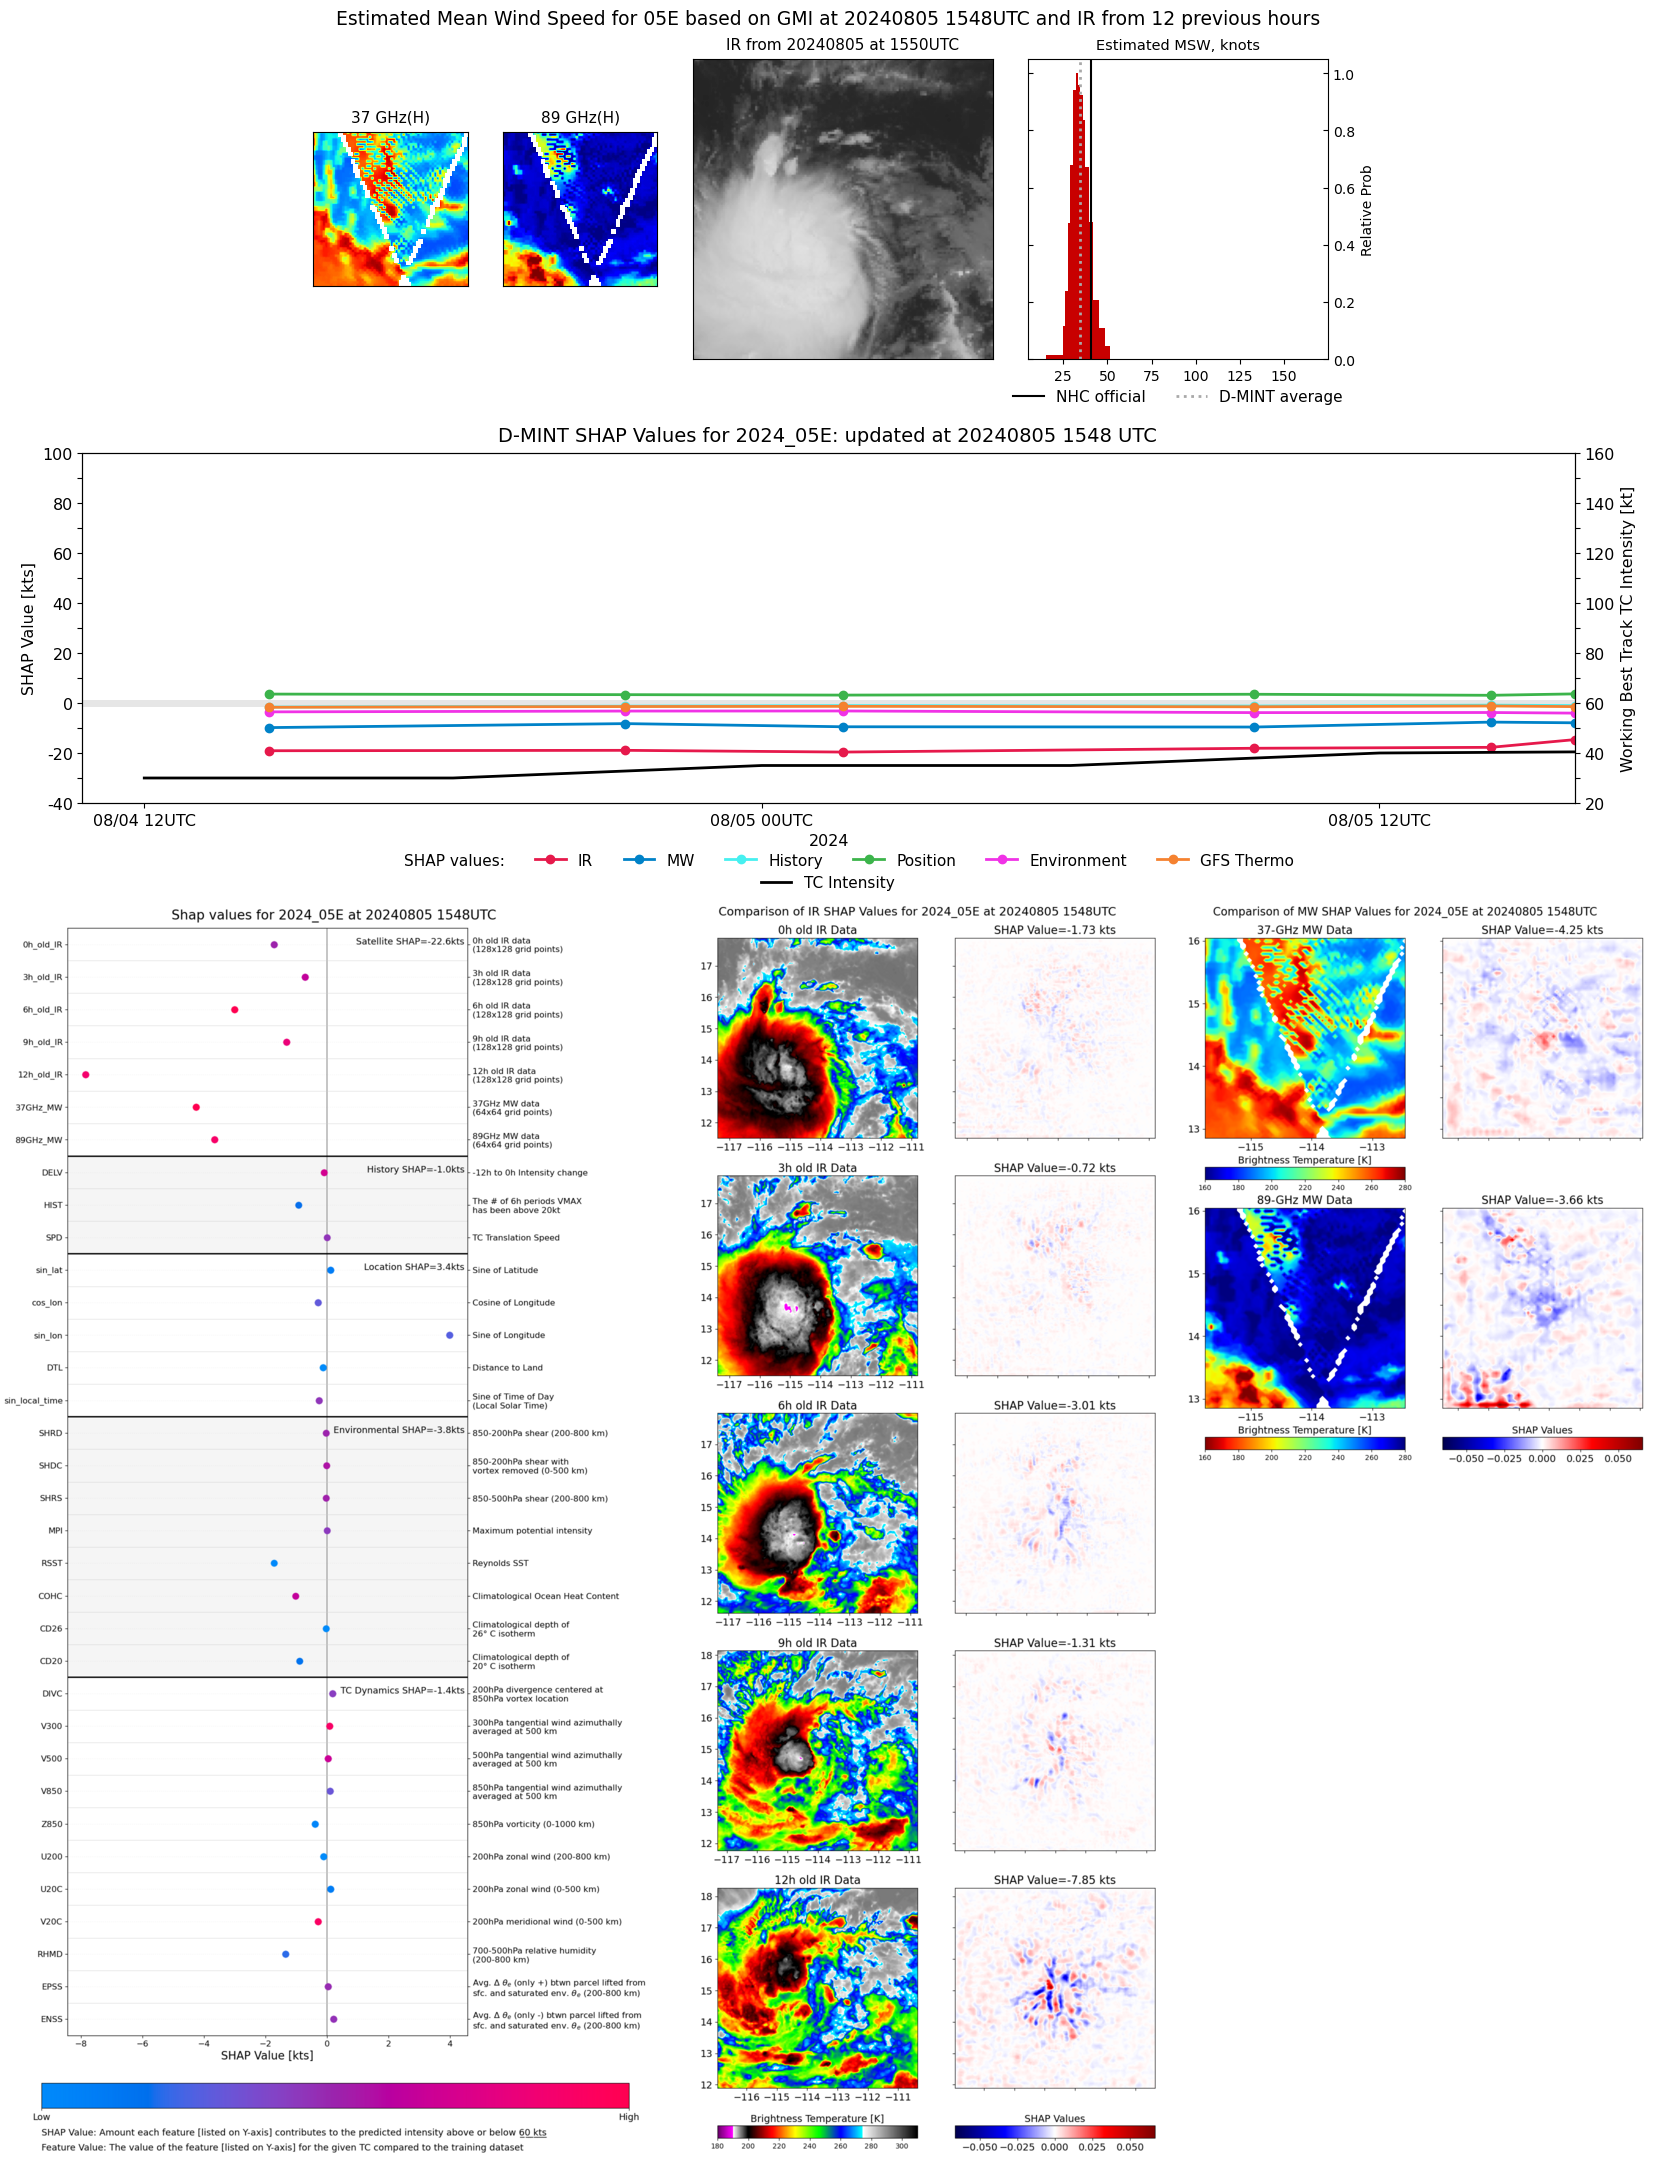 |
| 20240805 | 1410 UTC | SSMISF17 | 1005 hPa | 32 kts | 29 kts | 36 kts | 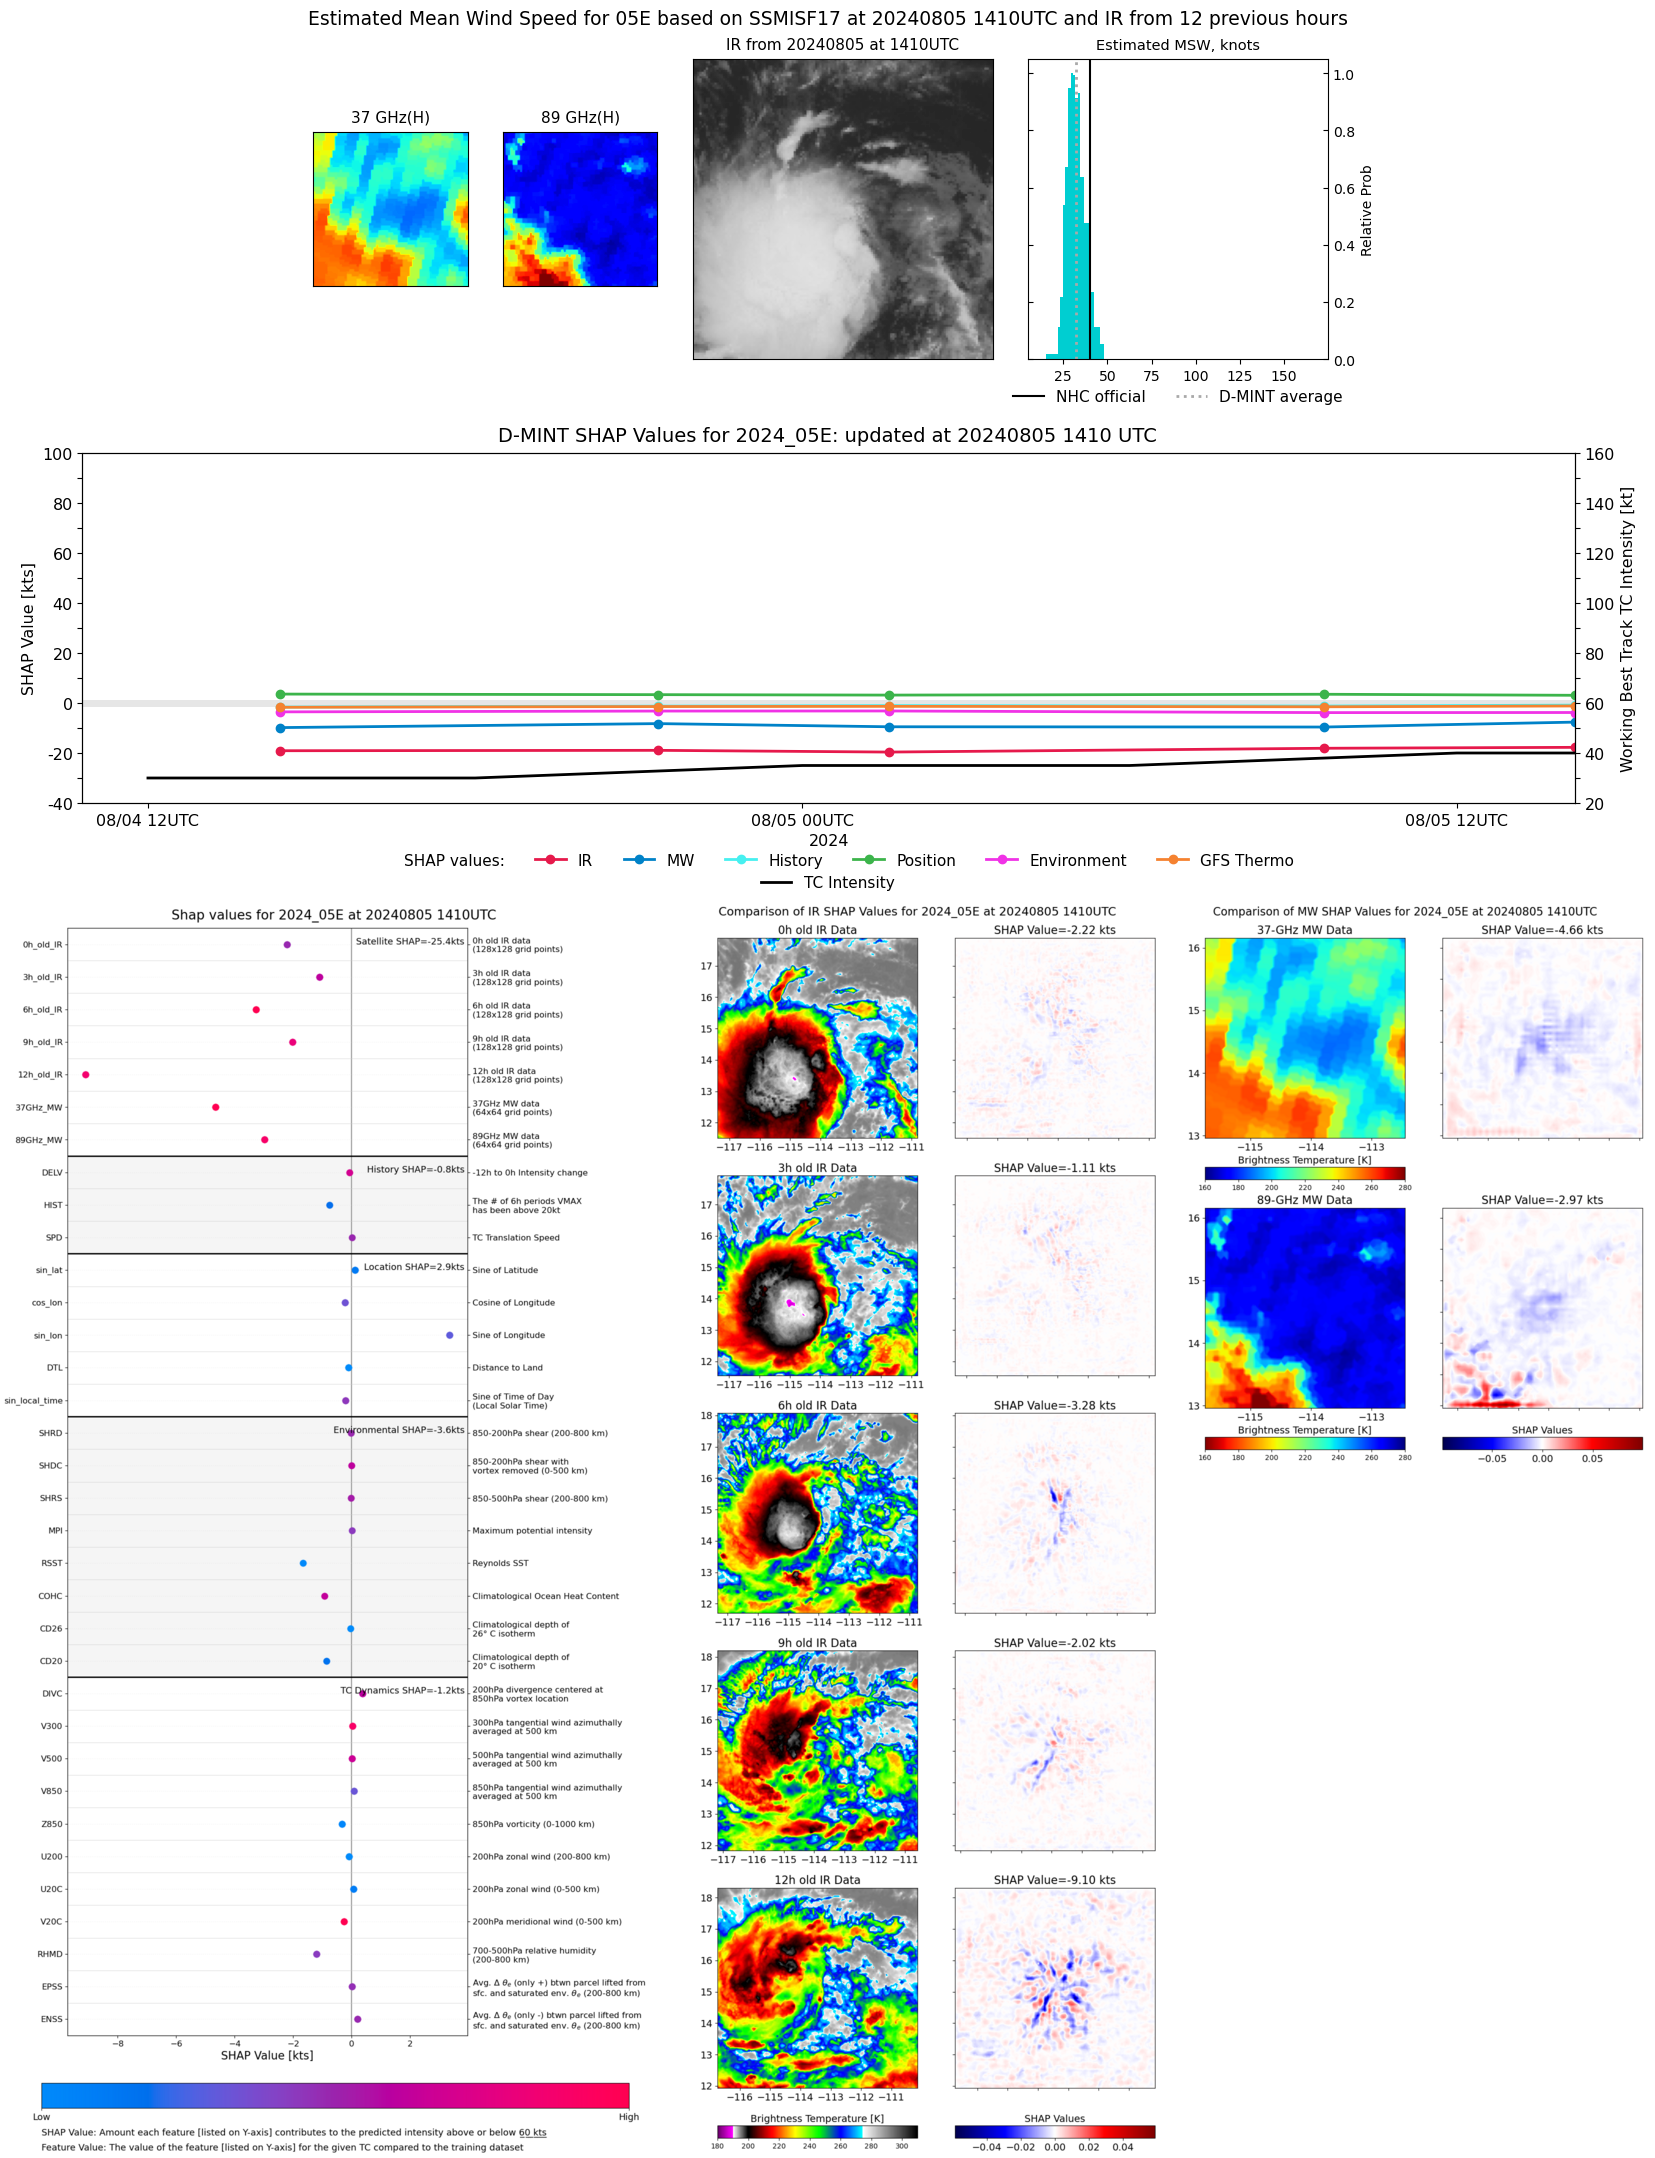 |
| 20240805 | 1323 UTC | SSMISF16 | 1006 hPa | 29 kts | 26 kts | 32 kts | 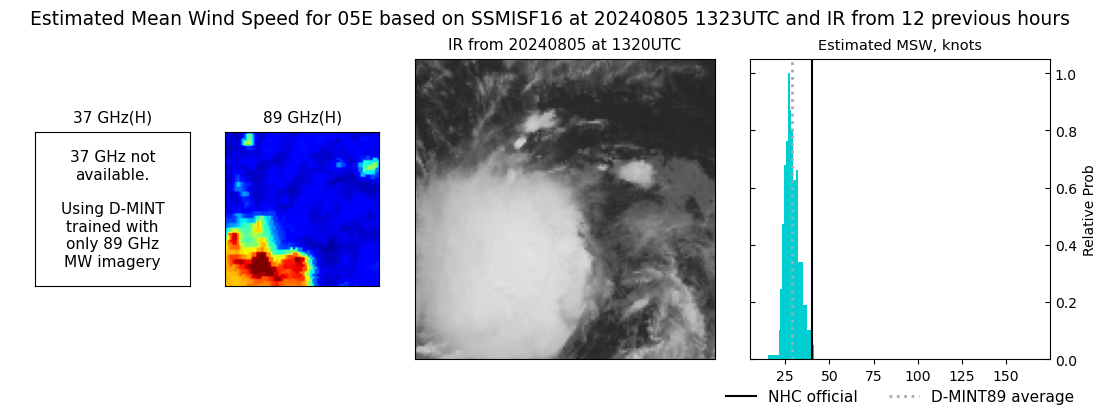 |
| 20240805 | 1114 UTC | SSMISF18 | 1005 hPa | 32 kts | 29 kts | 36 kts |  |
| 20240805 | 0934 UTC | AMSR2 | 1006 hPa | 29 kts | 26 kts | 33 kts | 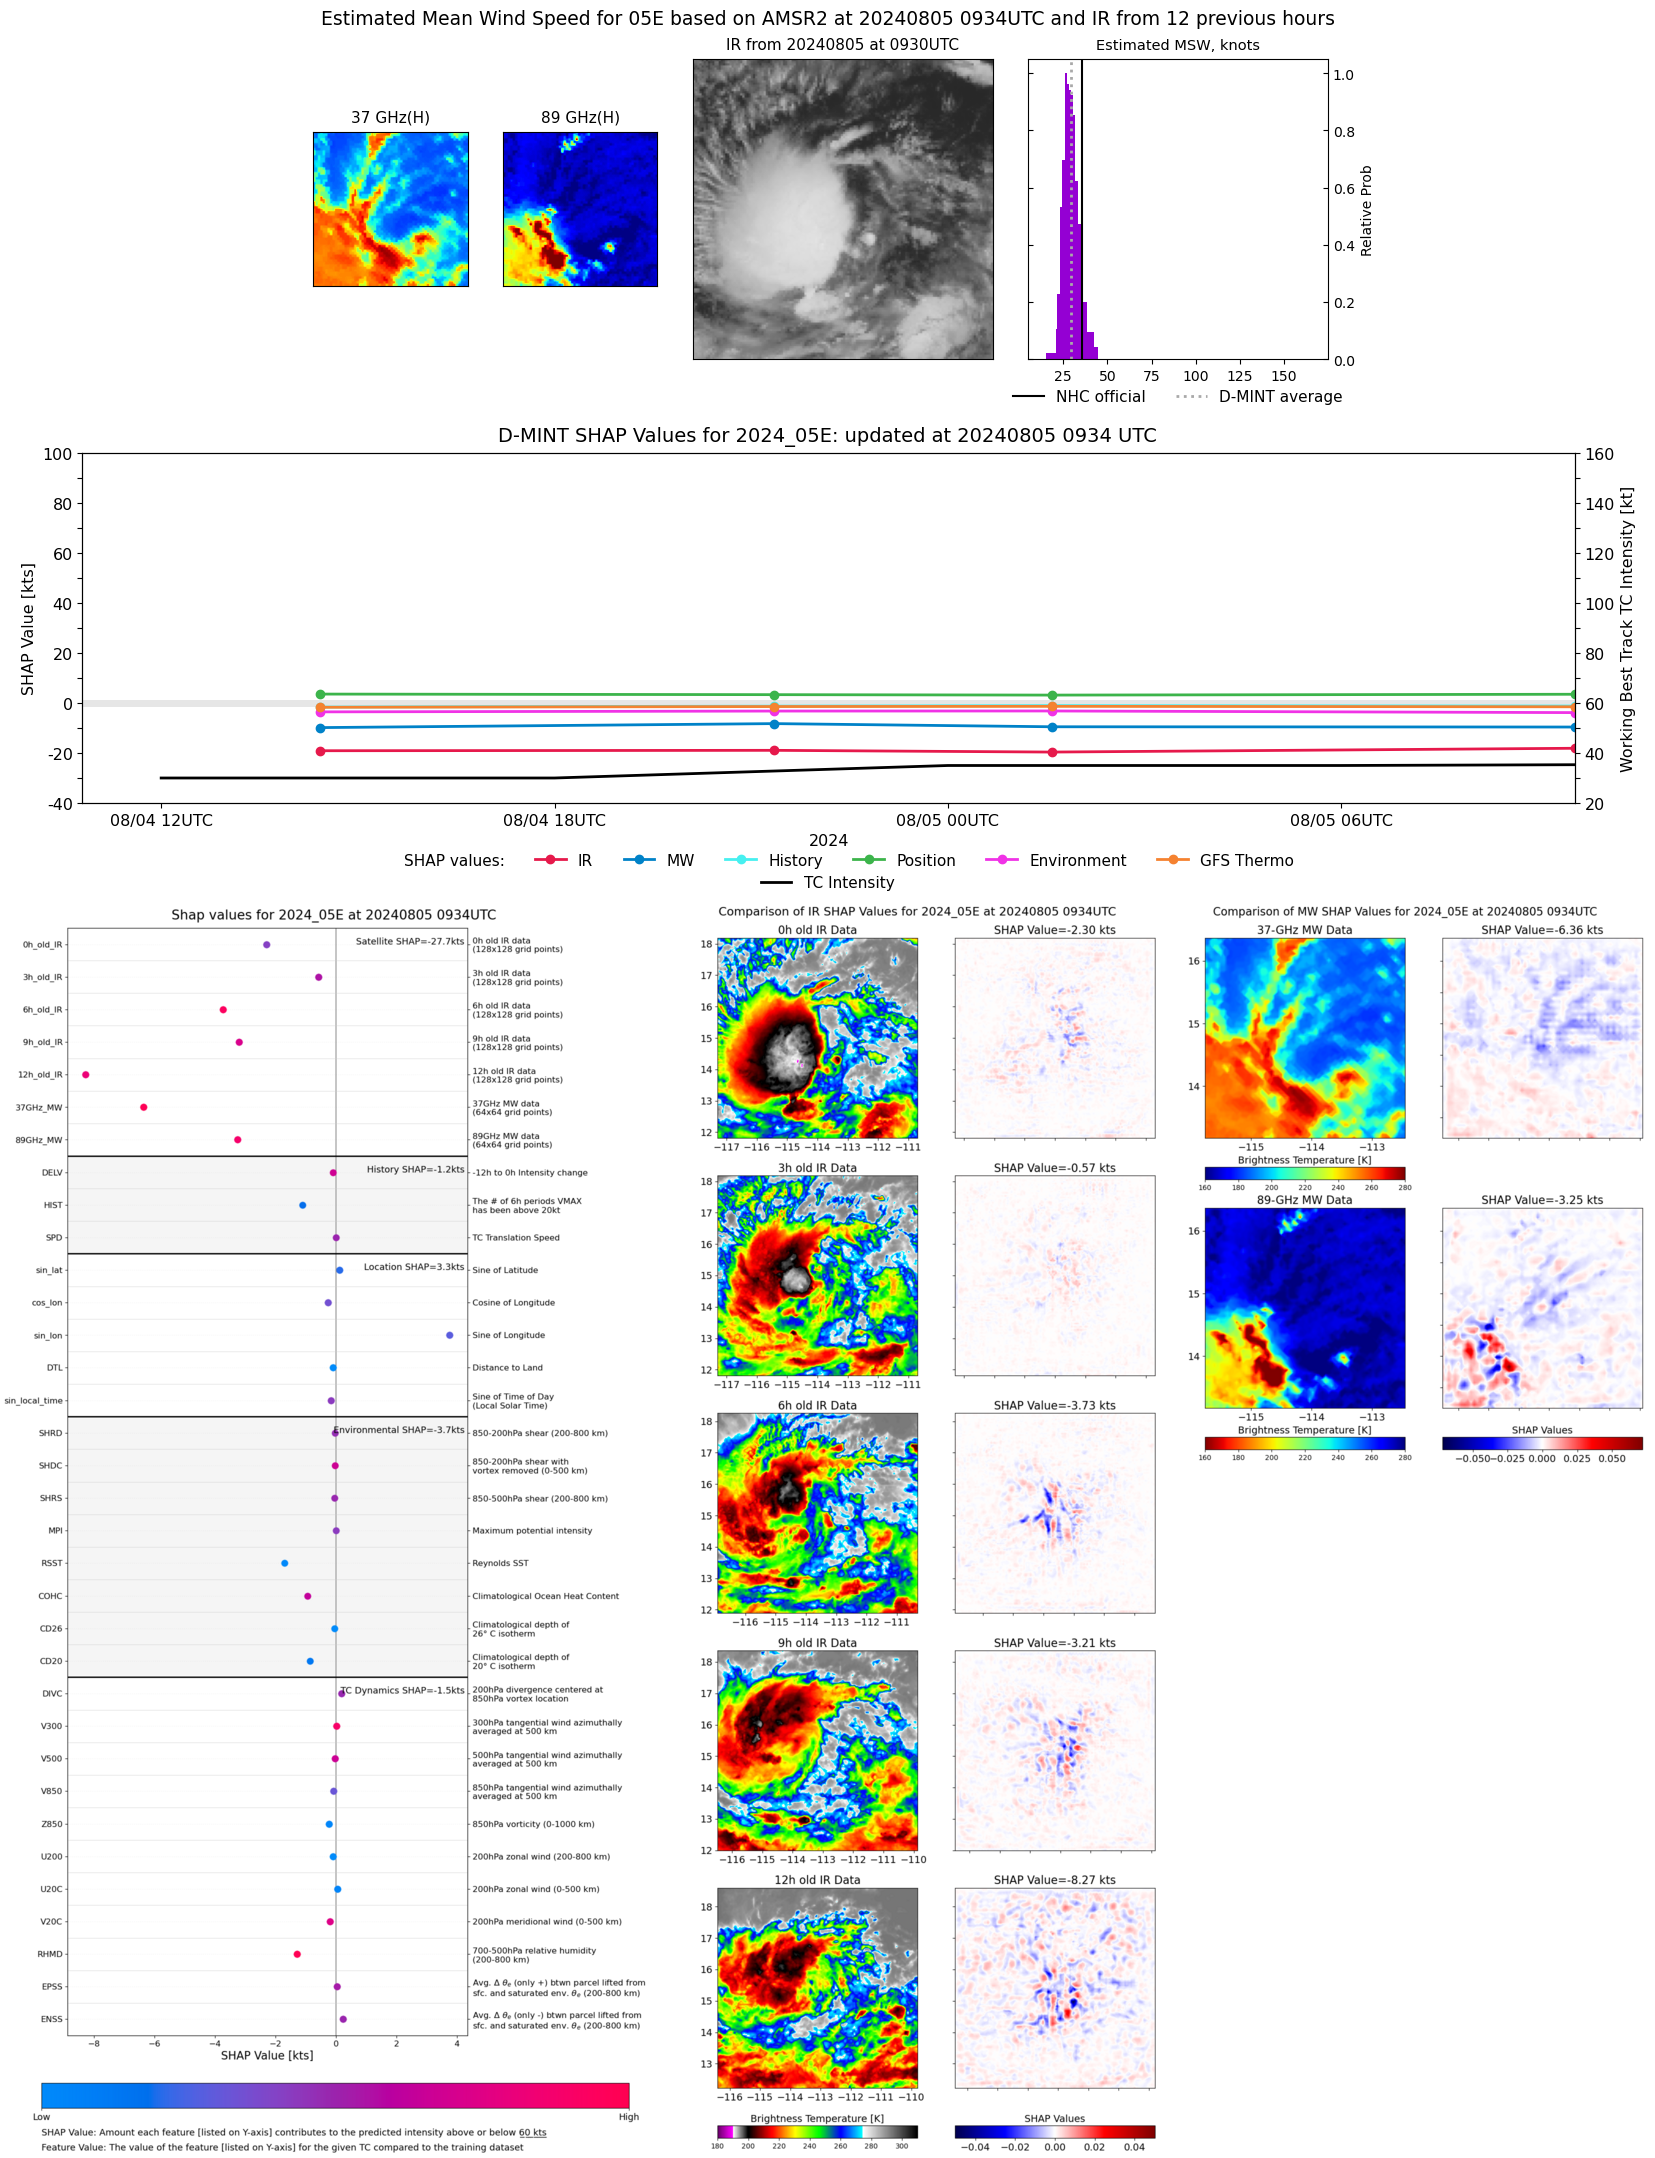 |
| 20240805 | 0930 UTC | ATMS-N21 | 1005 hPa | 35 kts | 31 kts | 39 kts | 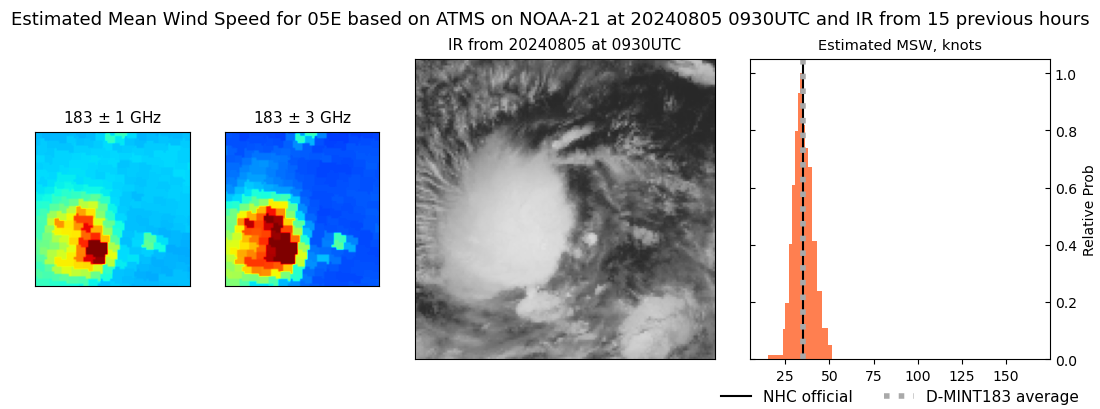 |
| 20240805 | 0839 UTC | ATMS-N20 | 1004 hPa | 39 kts | 35 kts | 43 kts | 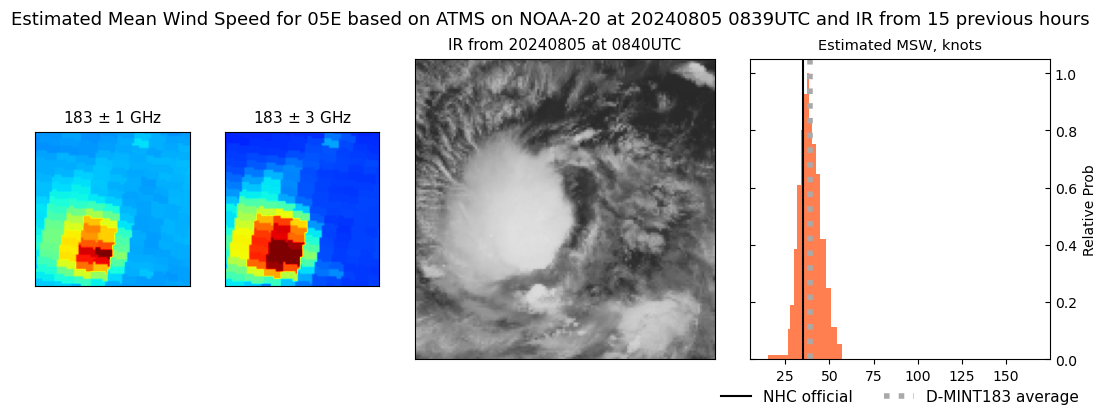 |
| 20240805 | 0228 UTC | GMI | 1004 hPa | 27 kts | 25 kts | 31 kts | 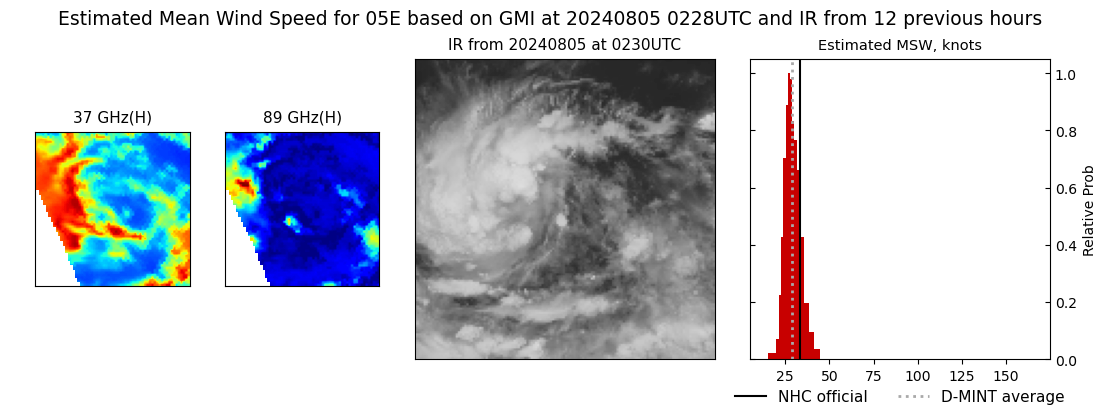 |
| 20240805 | 0135 UTC | SSMISF17 | 1005 hPa | 29 kts | 26 kts | 32 kts | 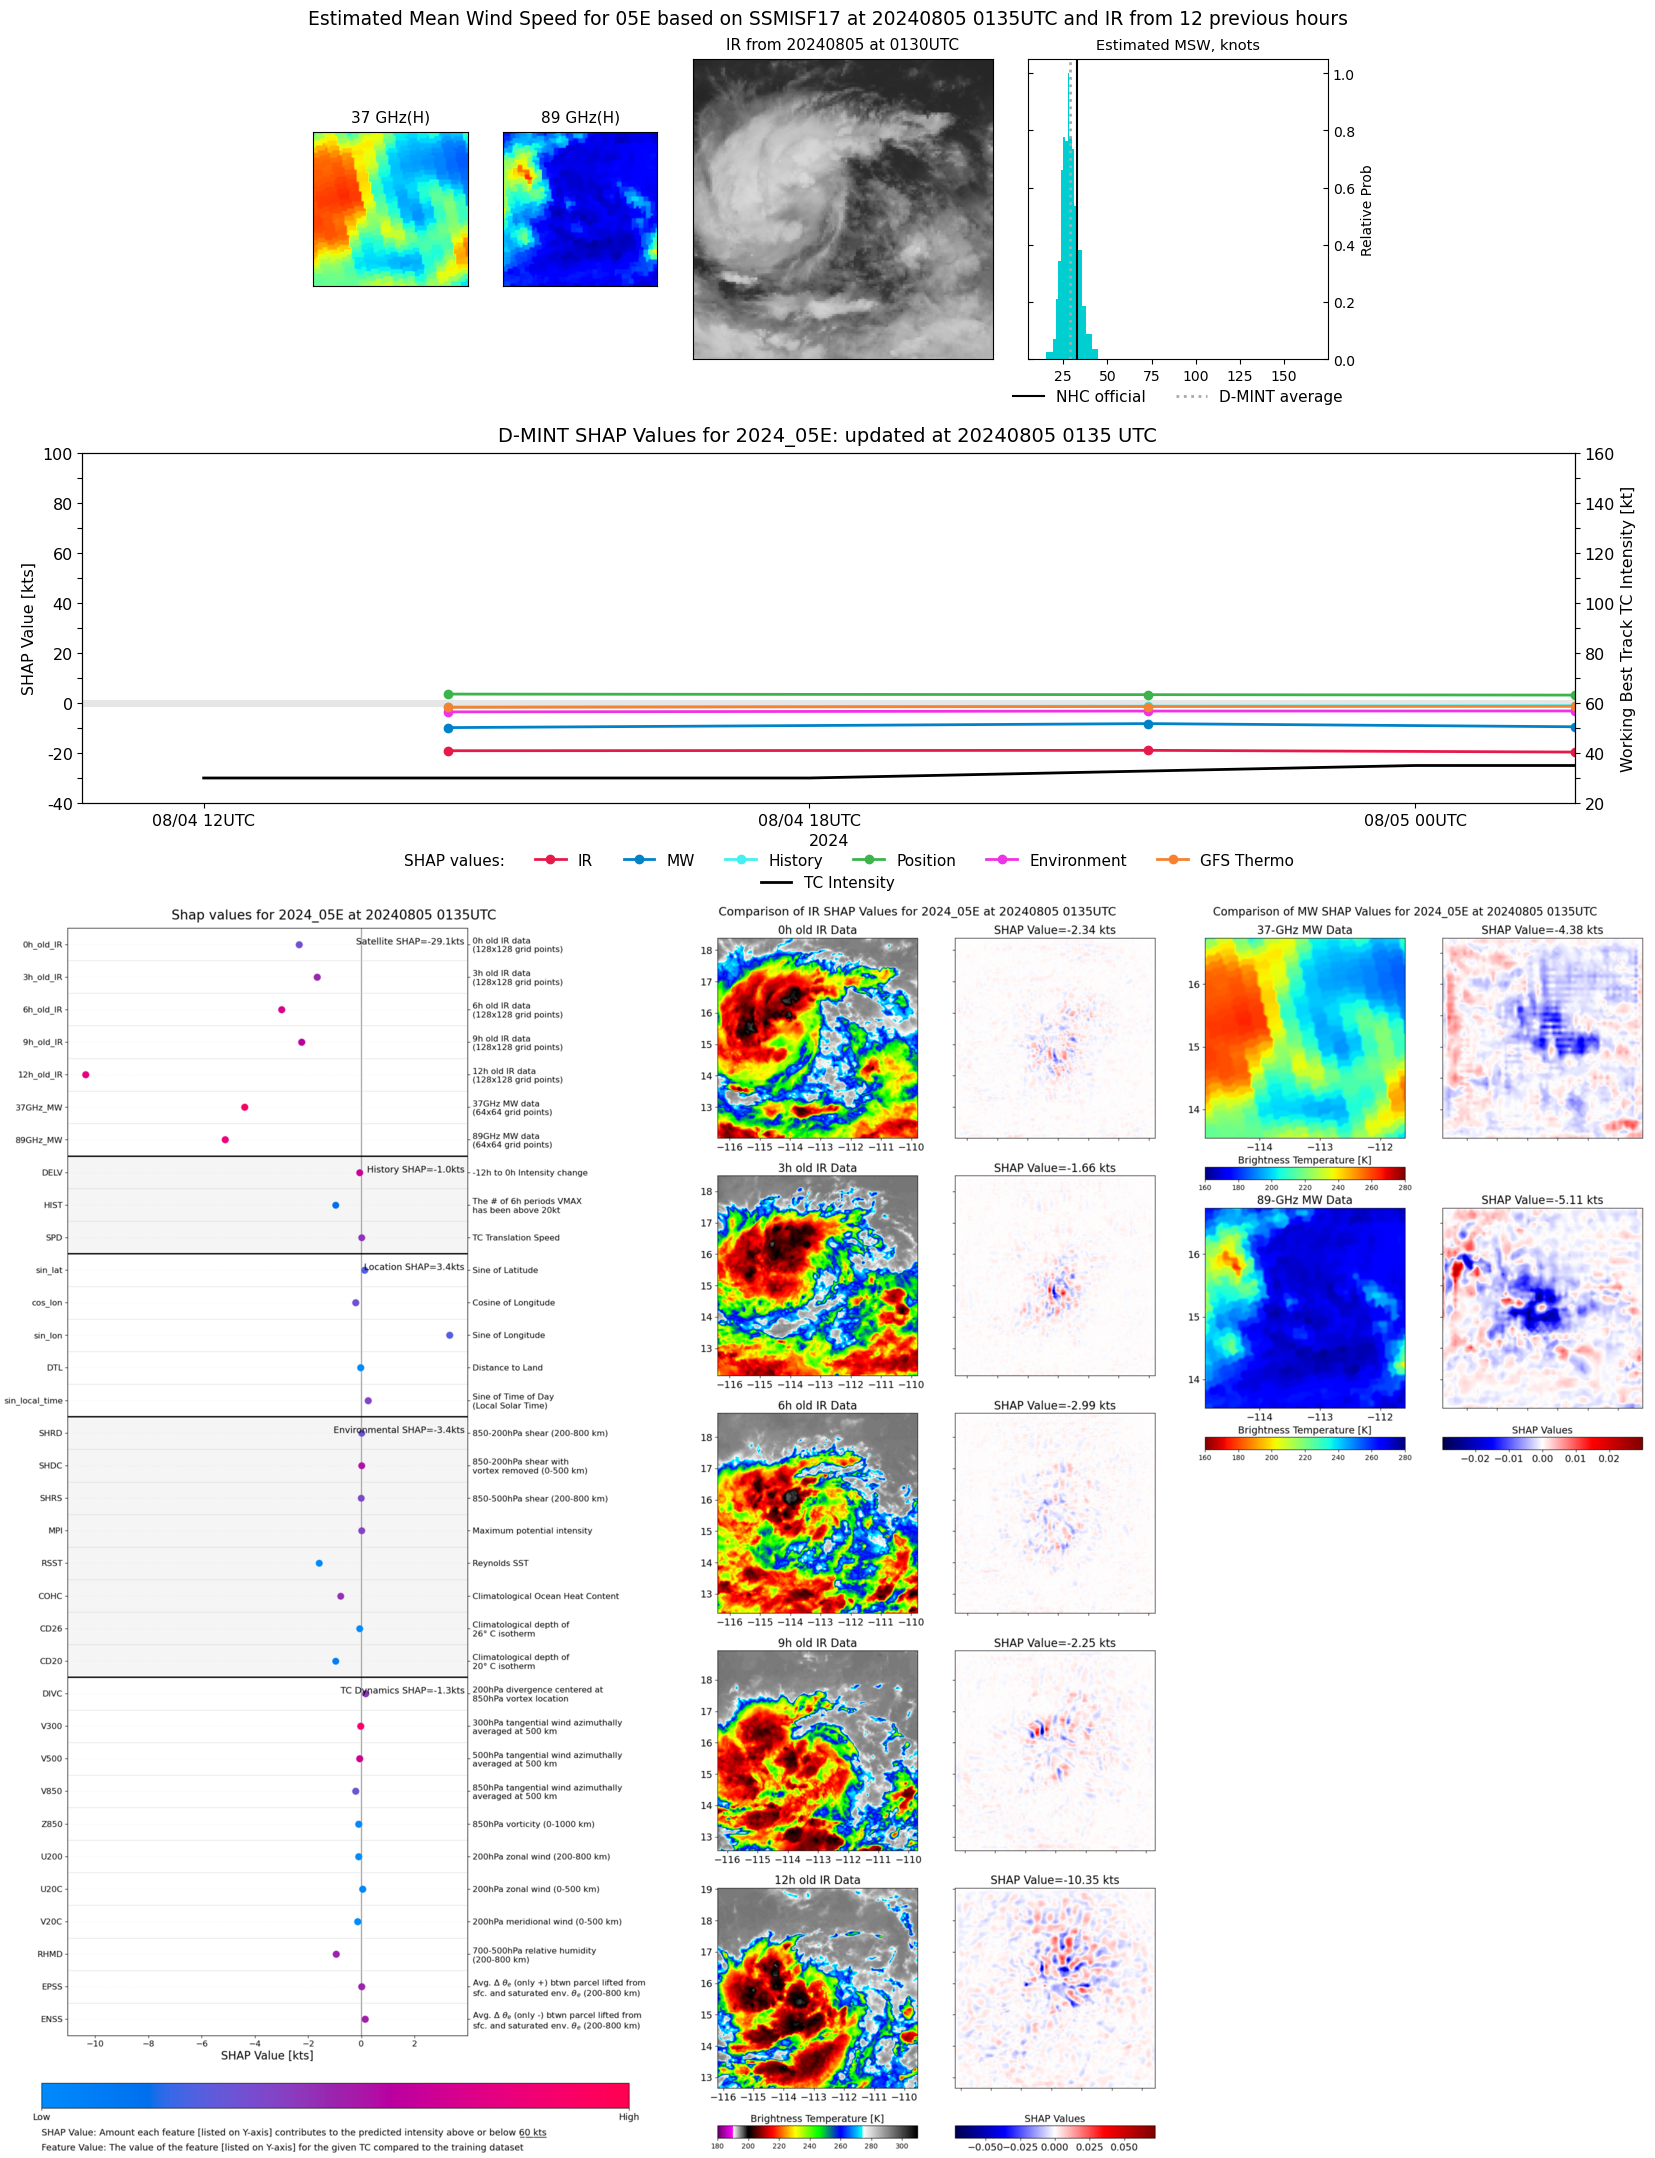 |
| 20240804 | 2123 UTC | ATMS-NPP | 1004 hPa | 34 kts | 30 kts | 38 kts | 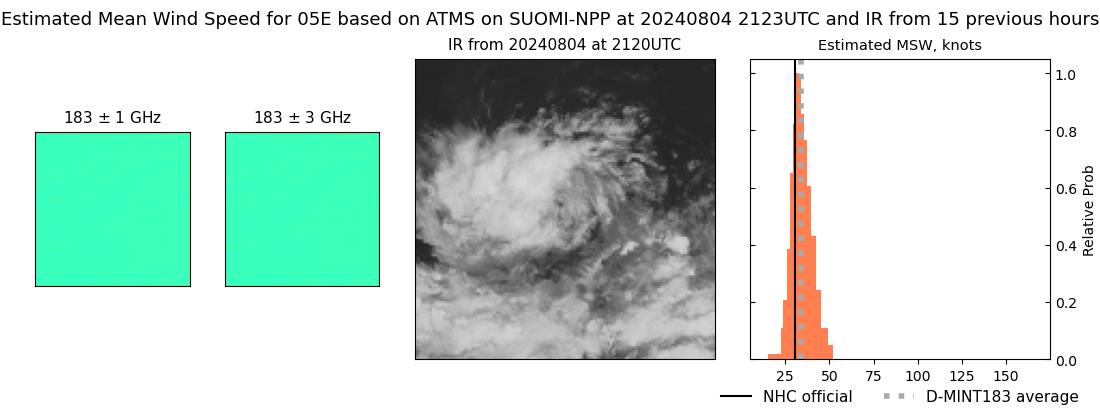 |
| 20240804 | 2121 UTC | AMSR2 | 1006 hPa | 29 kts | 26 kts | 33 kts | 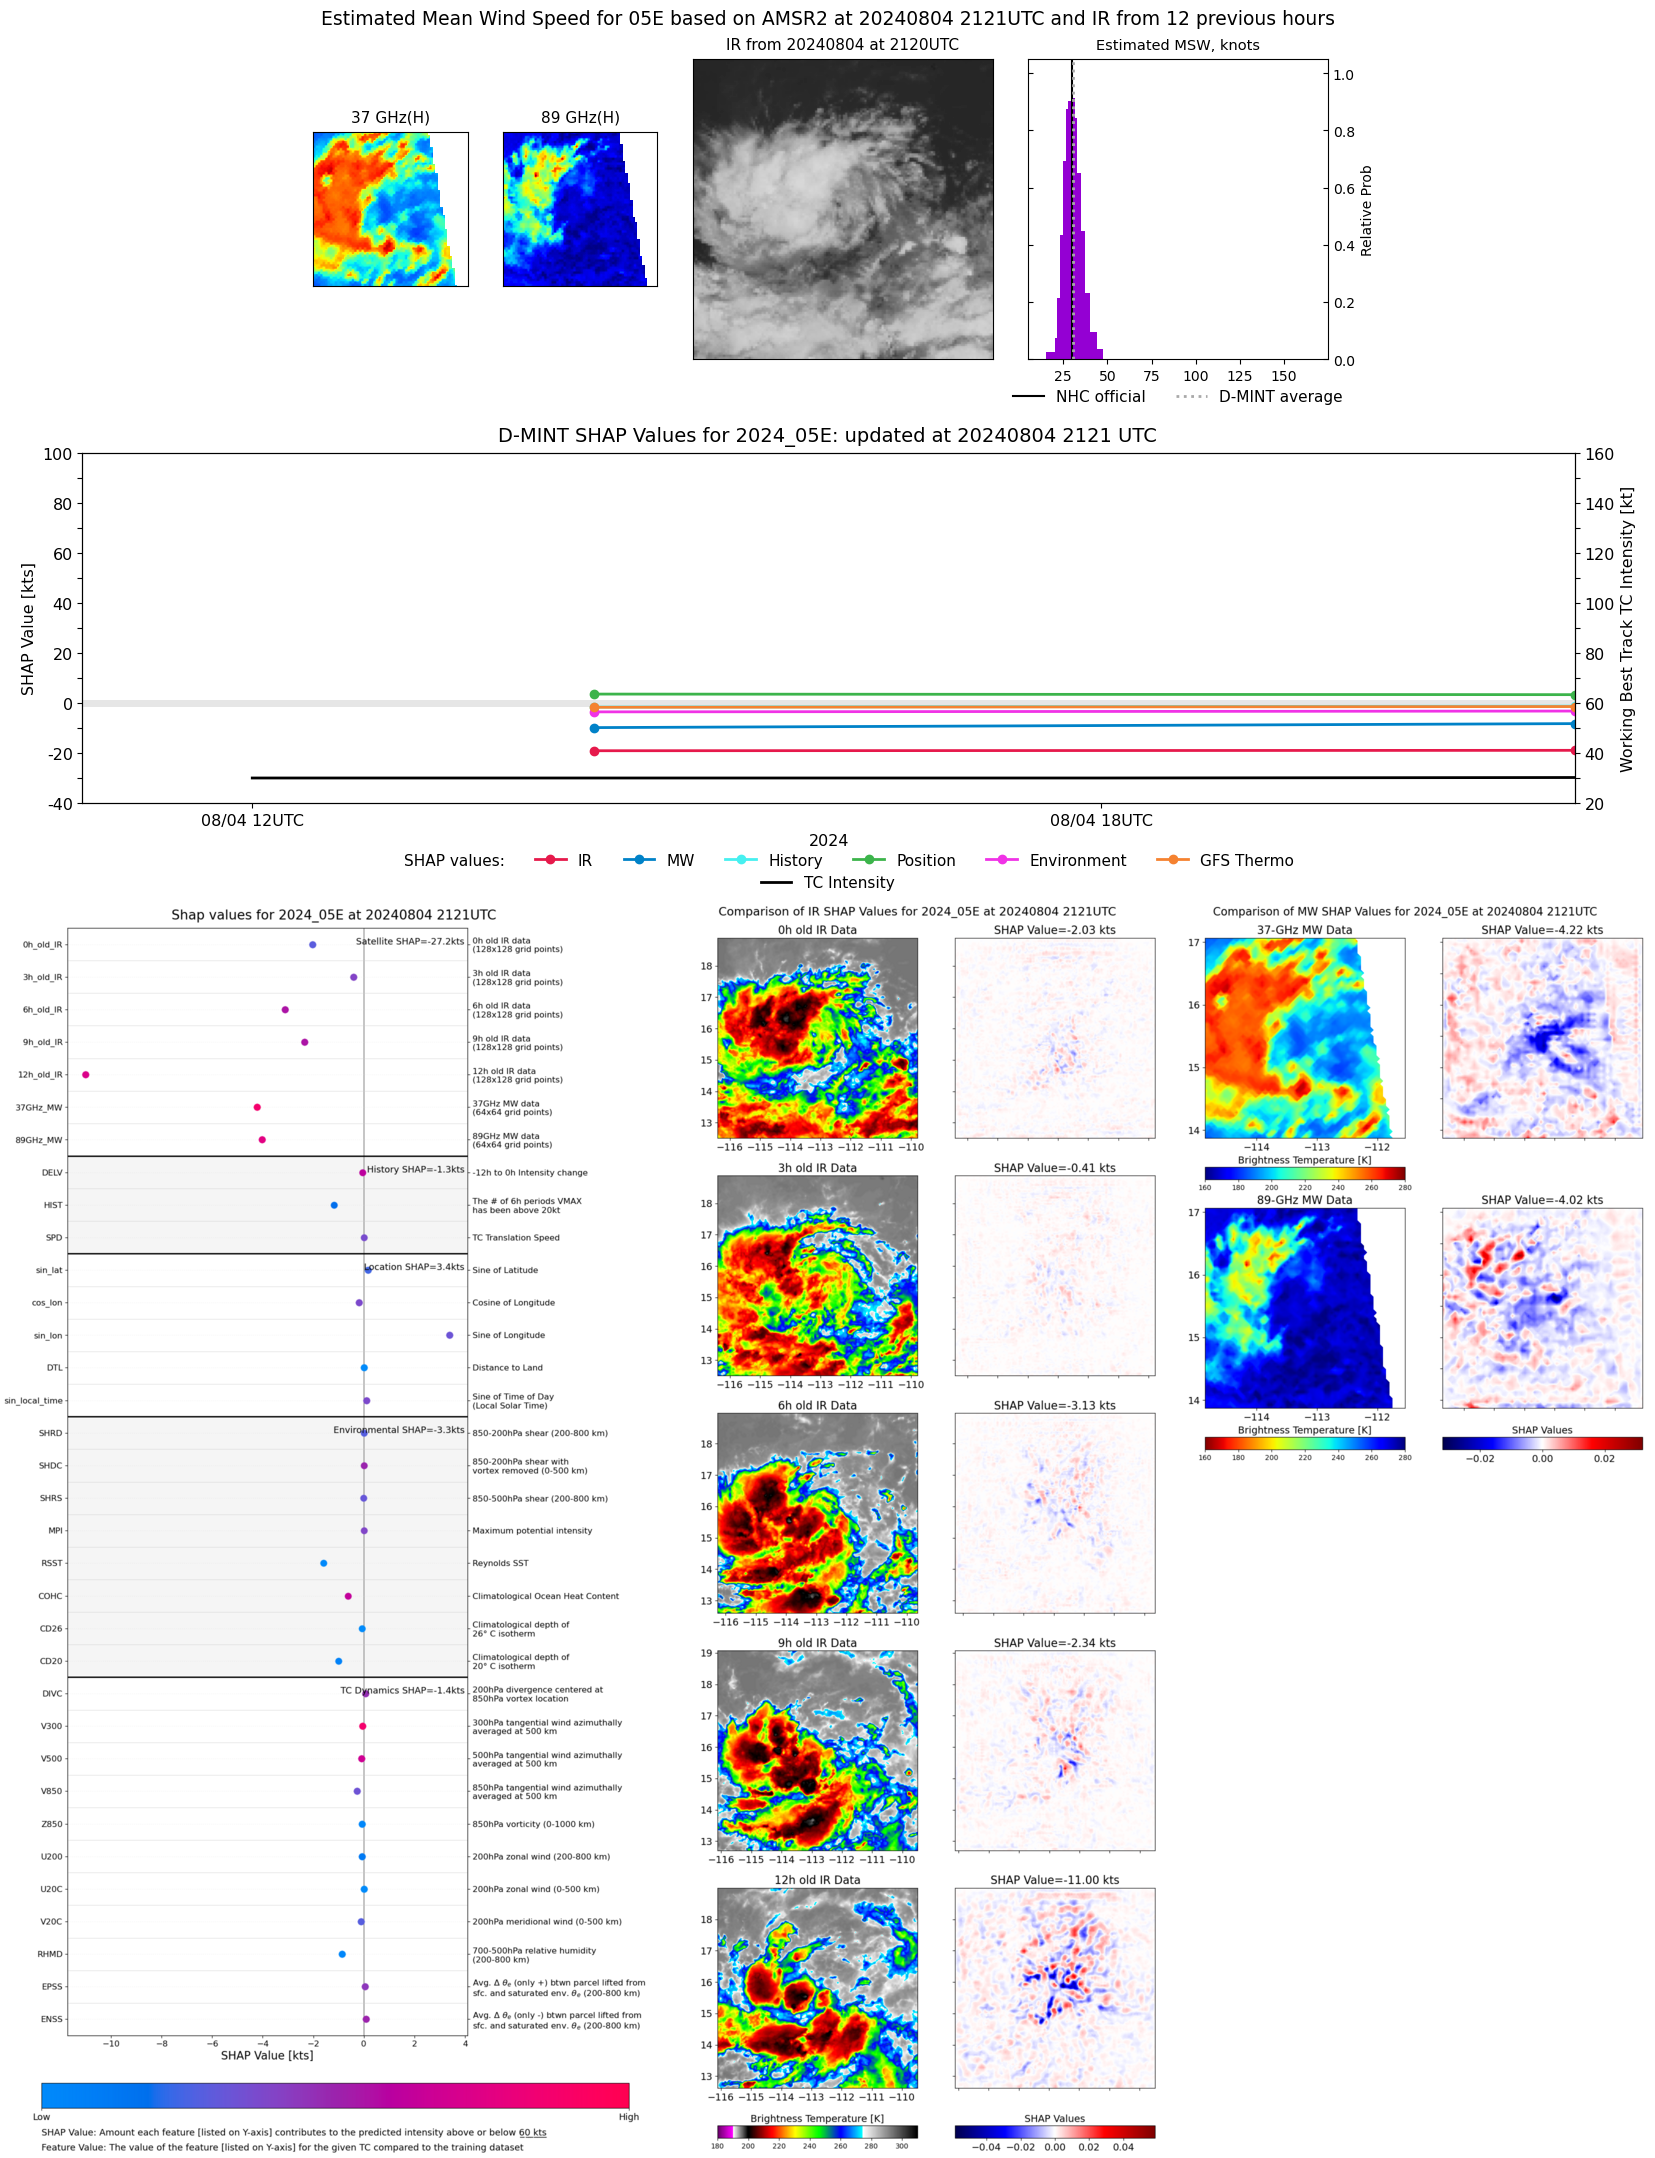 |
| 20240804 | 2058 UTC | ATMS-N21 | 1005 hPa | 32 kts | 29 kts | 36 kts | 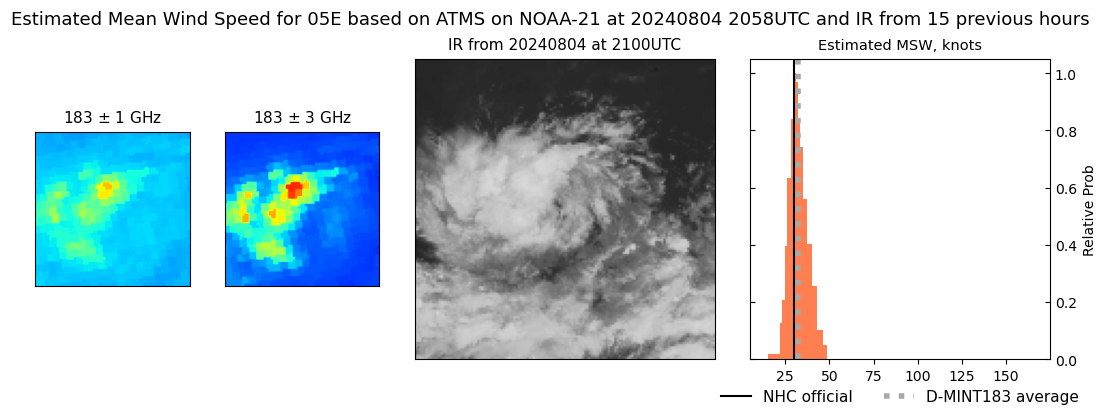 |
| 20240804 | 1425 UTC | SSMISF17 | 1007 hPa | 27 kts | 24 kts | 30 kts | 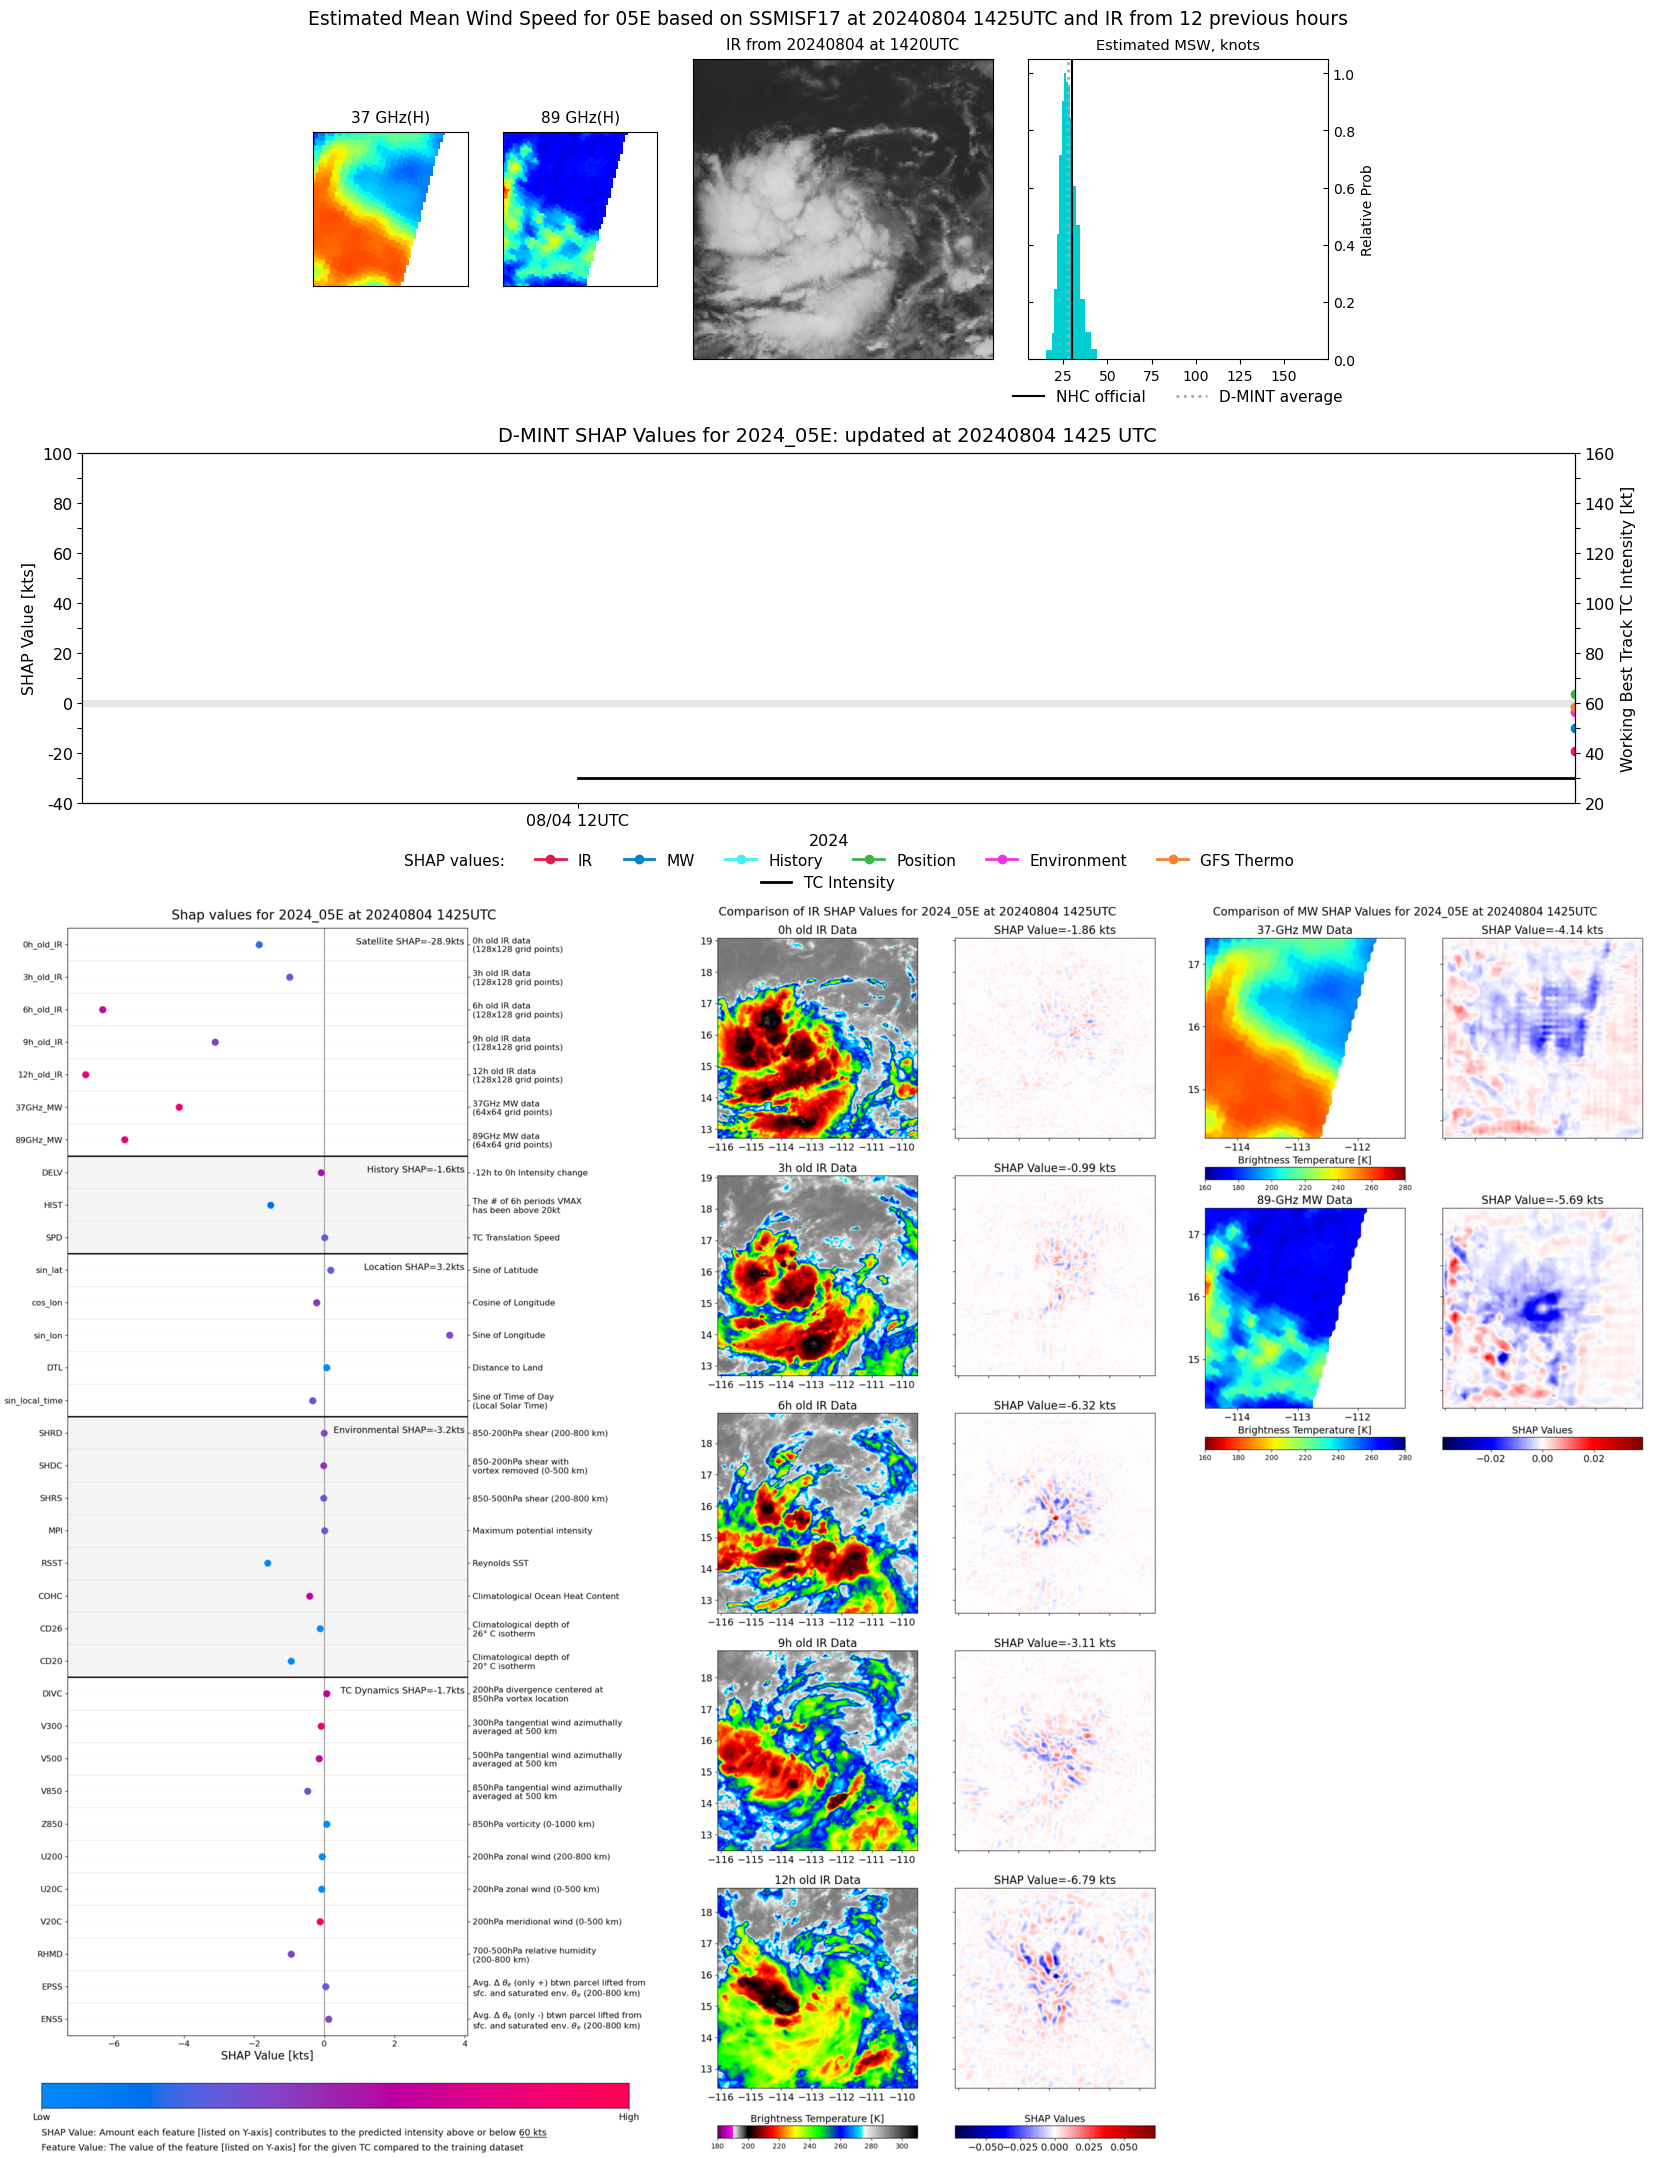 |
| 20240804 | 1127 UTC | SSMISF18 | NaN hPa | 26 kts | 24 kts | 29 kts |  |
| 20240804 | 0851 UTC | AMSR2 | NaN hPa | 27 kts | 24 kts | 29 kts |  |
| 20240804 | 0313 UTC | GMI | NaN hPa | 22 kts | 20 kts | 24 kts |  |
| 20240804 | 0148 UTC | SSMISF17 | NaN hPa | 24 kts | 22 kts | 27 kts |  |
| 20240804 | 0100 UTC | SSMISF16 | NaN hPa | 23 kts | 20 kts | 26 kts |  |