|
Storm: 06E
D-MINT HISTORY FILE for 2024_06E
| Date | Time | MW Sensor | MSLP | Vmax
(30th-70th percentile average) | Vmax
25th percentile | Vmax
75th percentile | Image |
| 20240807 | 1436 UTC | SSMISF16 | 1003 hPa | 31 kts | 29 kts | 34 kts |  |
| 20240807 | 1226 UTC | SSMISF18 | 1001 hPa | 35 kts | 31 kts | 38 kts | 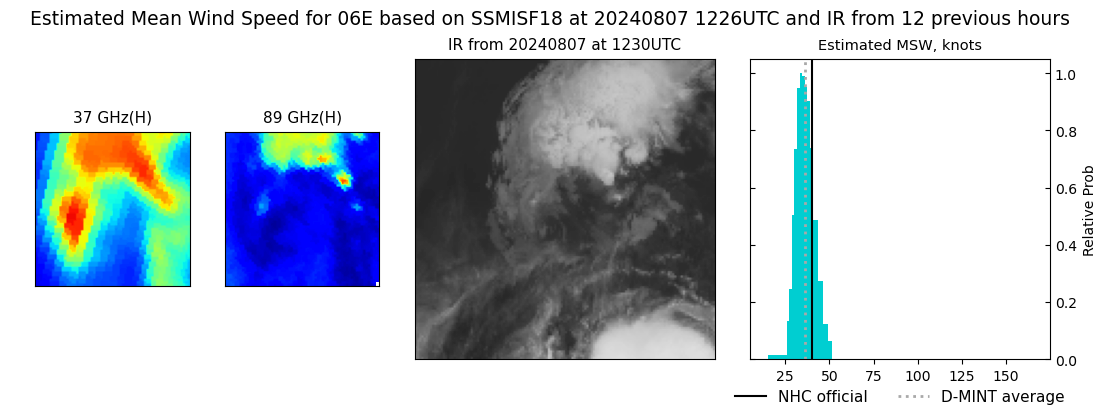 |
| 20240807 | 0920 UTC | AMSR2 | 999 hPa | 37 kts | 33 kts | 41 kts | 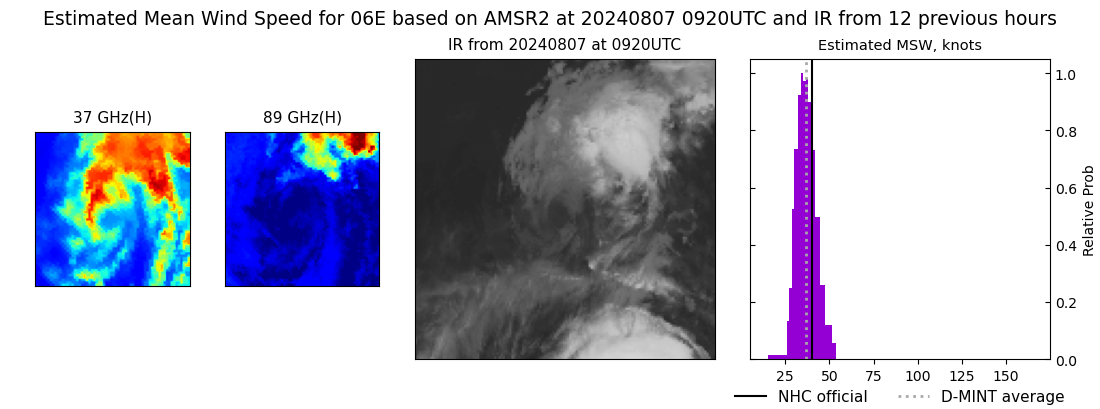 |
| 20240807 | 0916 UTC | ATMS-NPP | 999 hPa | 40 kts | 35 kts | 45 kts |  |
| 20240806 | 2110 UTC | ATMS-N20 | 995 hPa | 53 kts | 48 kts | 58 kts |  |
| 20240806 | 2109 UTC | AMSR2 | 998 hPa | 48 kts | 43 kts | 53 kts | 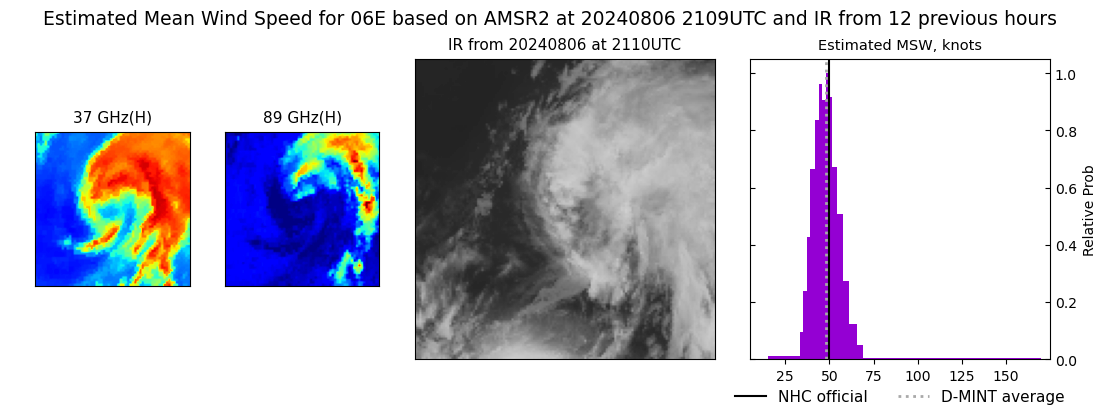 |
| 20240806 | 2046 UTC | ATMS-NPP | 993 hPa | 54 kts | 49 kts | 60 kts |  |
| 20240806 | 2021 UTC | ATMS-N21 | 996 hPa | 53 kts | 48 kts | 59 kts | 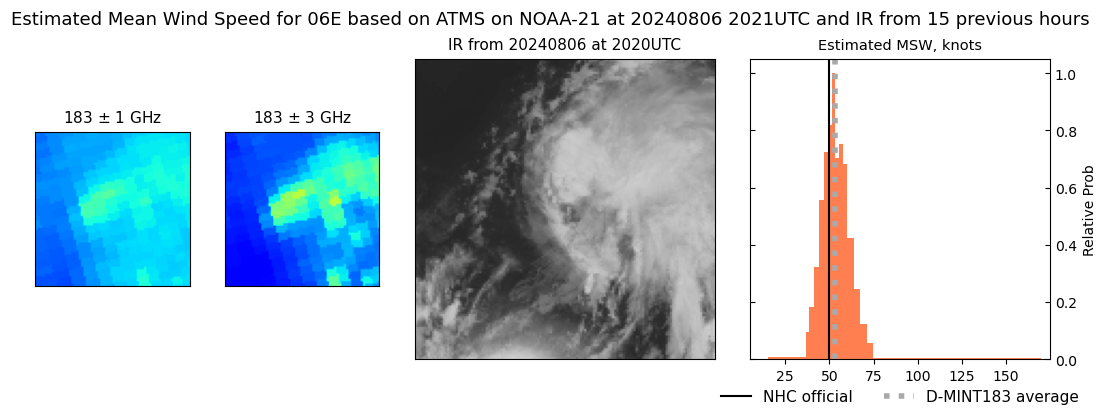 |
| 20240806 | 1508 UTC | GMI | 996 hPa | 51 kts | 46 kts | 56 kts | 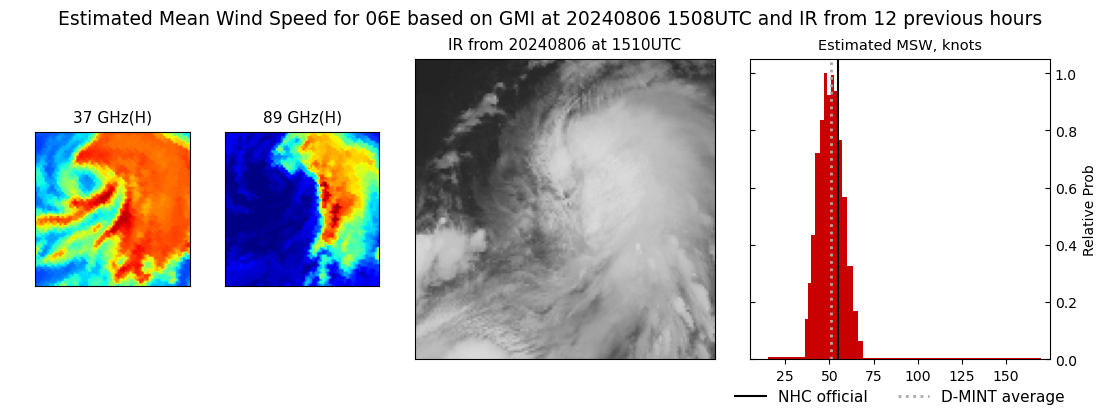 |
| 20240806 | 1356 UTC | SSMISF17 | 995 hPa | 52 kts | 46 kts | 57 kts | 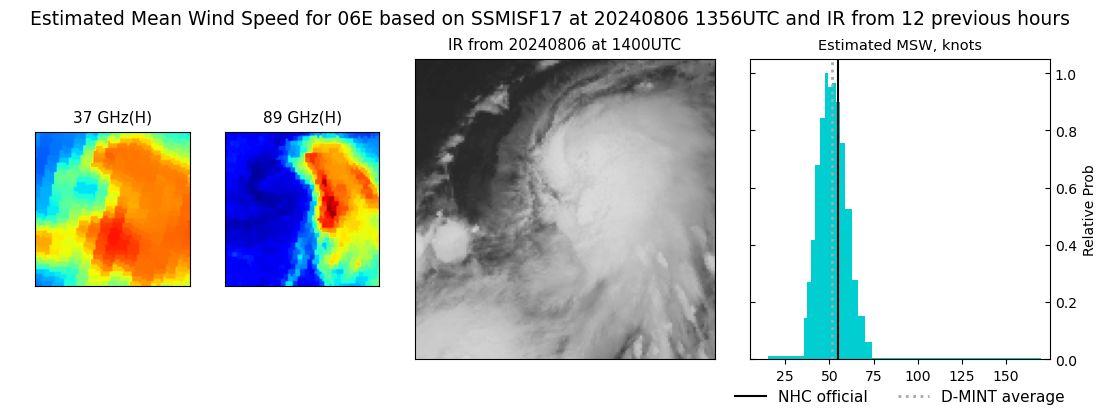 |
| 20240806 | 1100 UTC | SSMISF18 | 997 hPa | 52 kts | 46 kts | 58 kts | 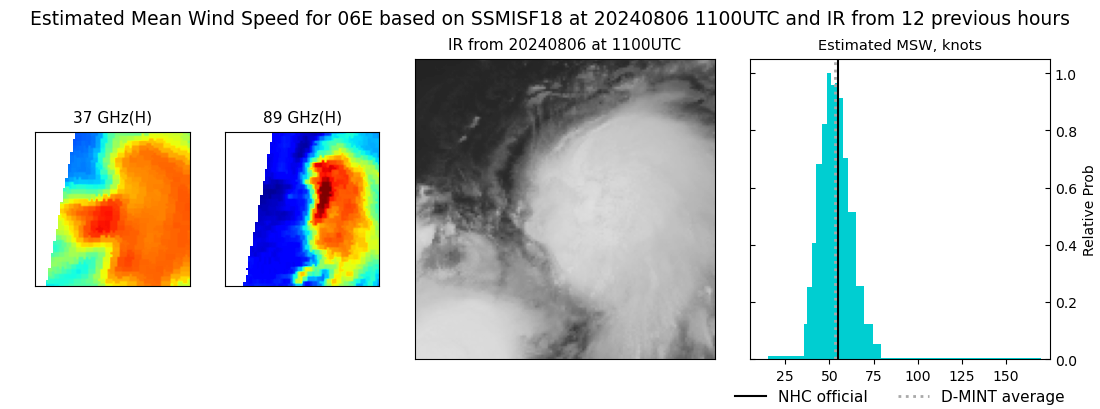 |
| 20240806 | 0910 UTC | ATMS-N21 | 997 hPa | 54 kts | 48 kts | 60 kts | 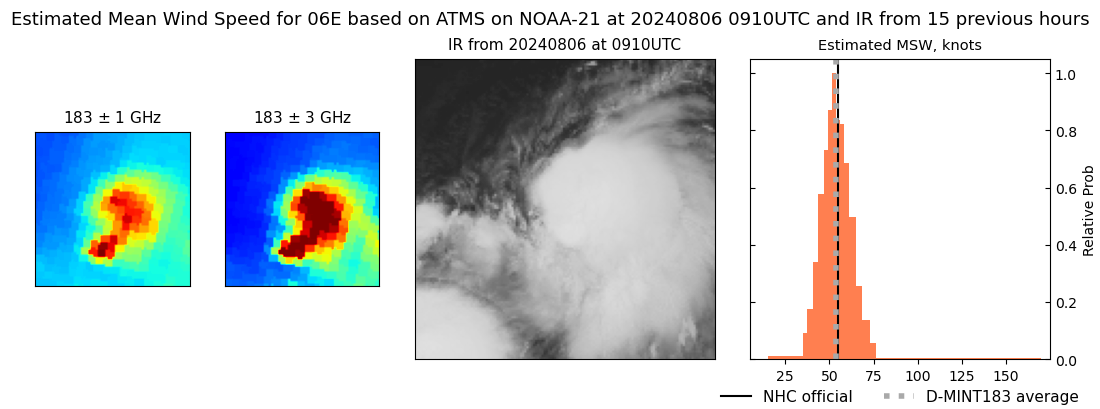 |
| 20240806 | 0839 UTC | AMSR2 | 998 hPa | 54 kts | 48 kts | 60 kts | 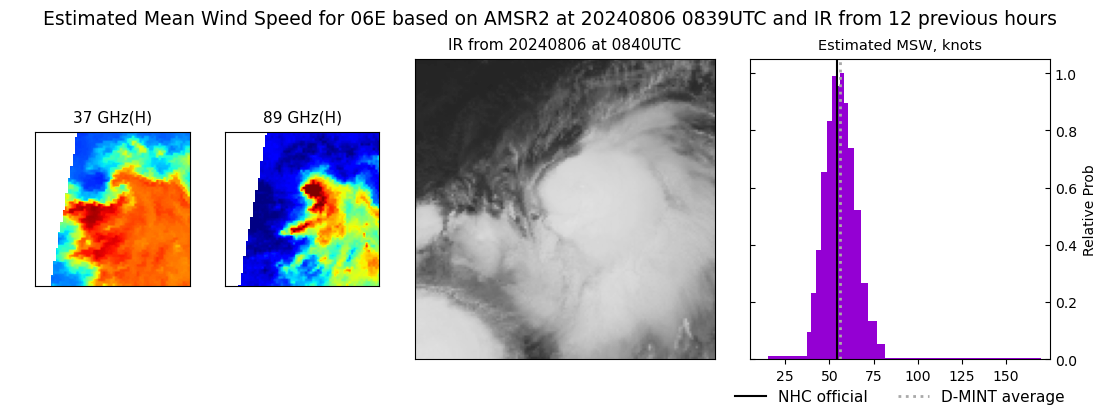 |
| 20240806 | 0120 UTC | SSMISF17 | 999 hPa | 45 kts | 41 kts | 50 kts | 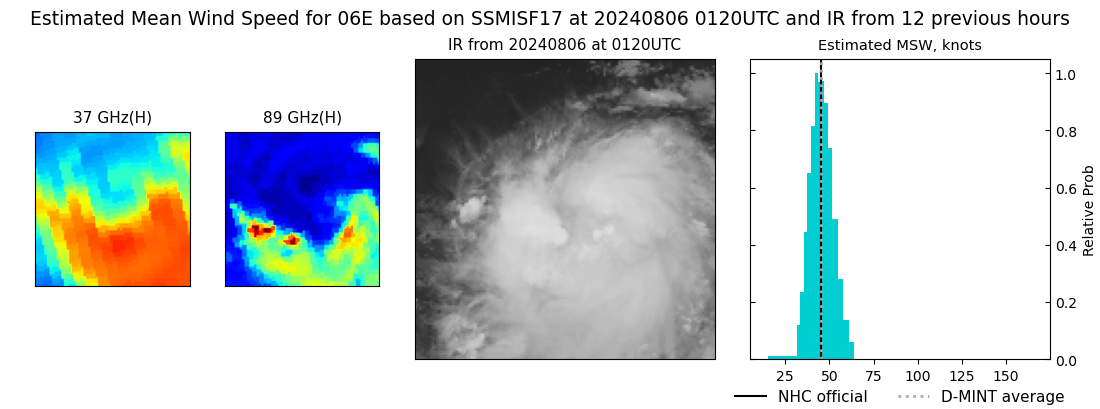 |
| 20240805 | 2038 UTC | ATMS-N21 | 1002 hPa | 37 kts | 33 kts | 40 kts |  |
| 20240805 | 2025 UTC | AMSR2 | 1003 hPa | 40 kts | 36 kts | 44 kts | 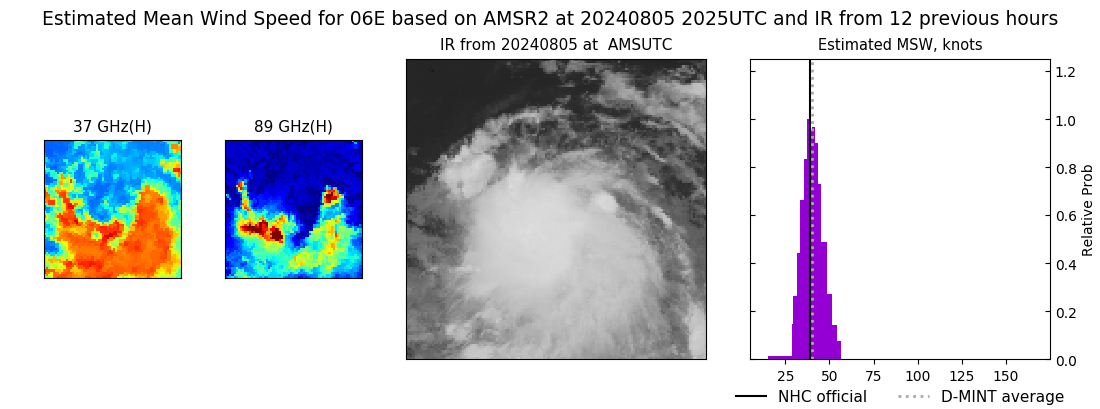 |
|
