|
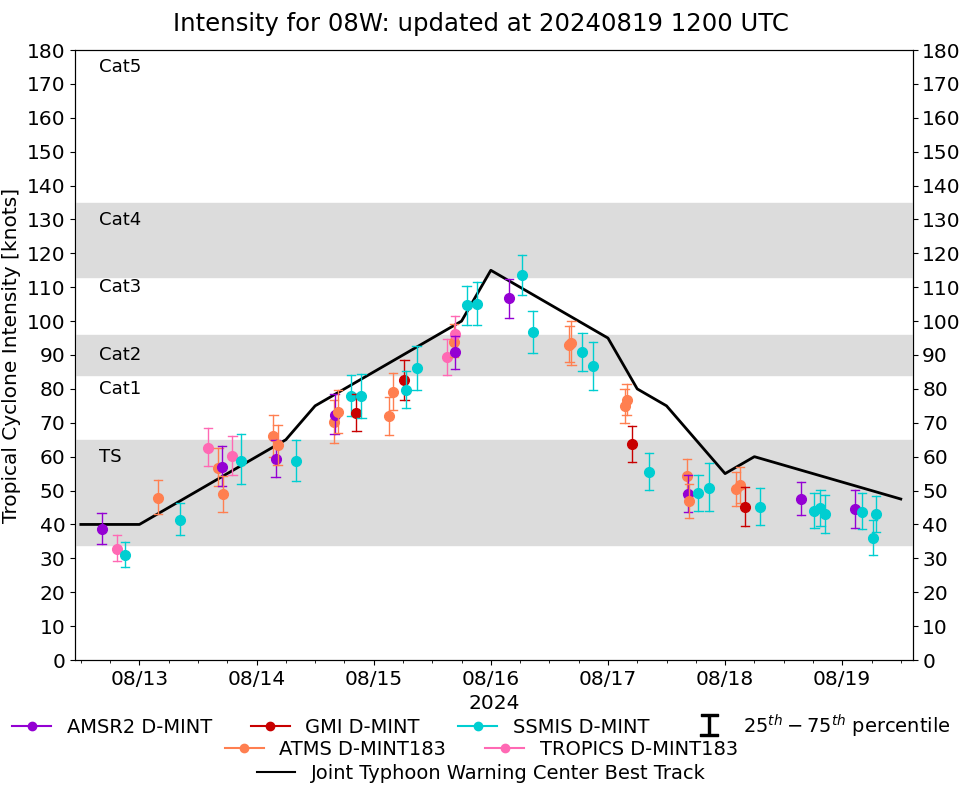
Storm: 08W
D-MINT HISTORY FILE for 2024_08W
| Date | Time | MW Sensor | MSLP | Vmax
(30th-70th percentile average) | Vmax
25th percentile | Vmax
75th percentile | Image |
| 20240819 | 0657 UTC | SSMISF17 | 1001 hPa | 43 kts | 38 kts | 48 kts | 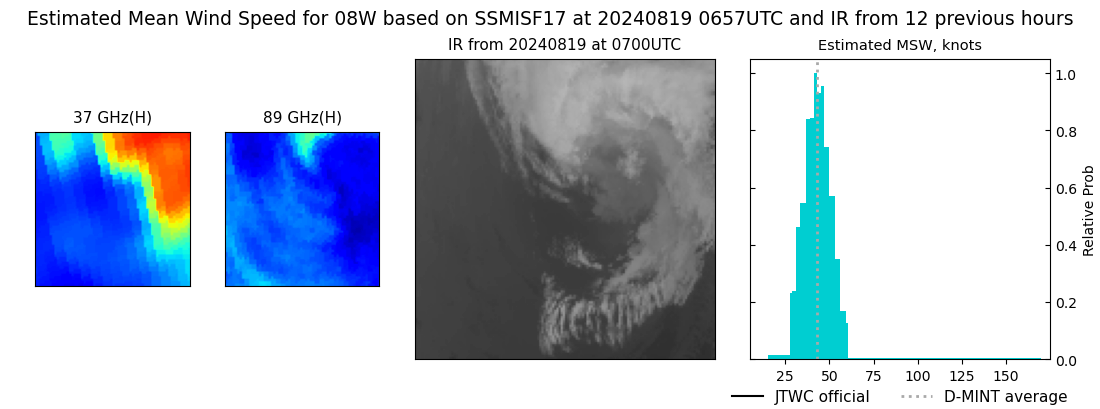 |
| 20240819 | 0616 UTC | SSMISF16 | 1005 hPa | 36 kts | 31 kts | 41 kts | 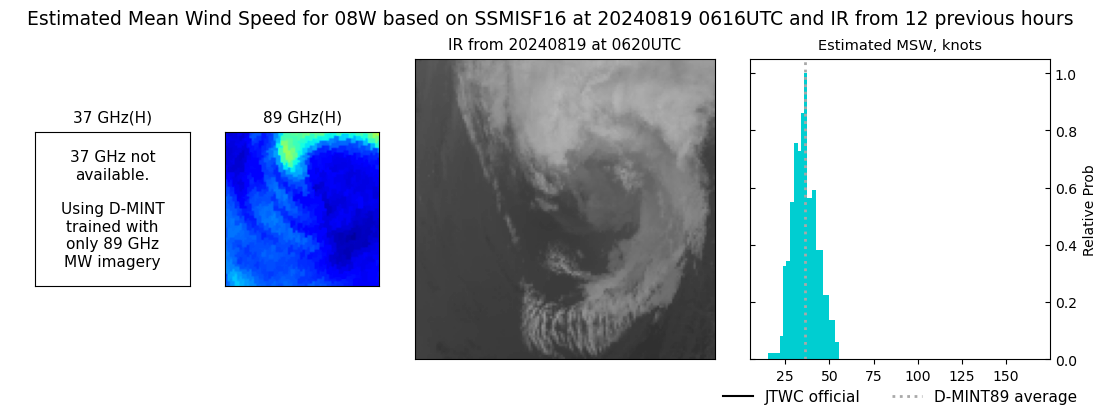 |
| 20240819 | 0404 UTC | SSMISF18 | 1001 hPa | 44 kts | 39 kts | 49 kts | 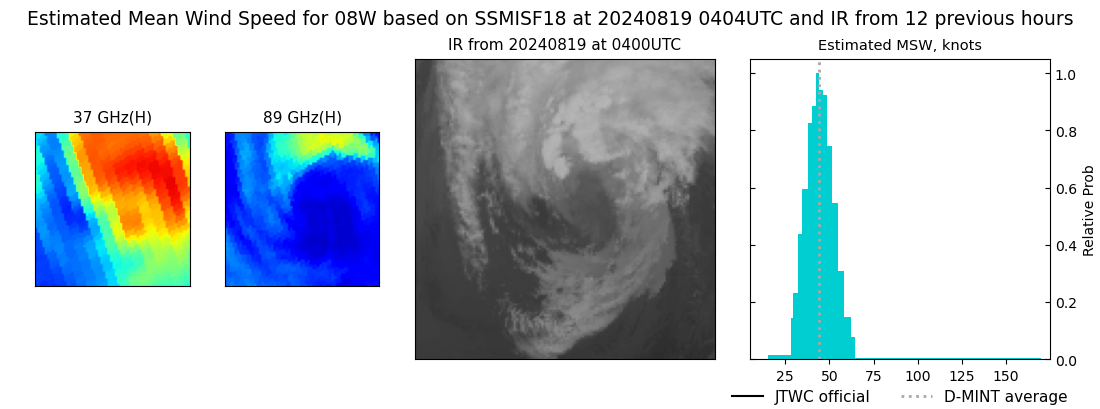 |
| 20240819 | 0238 UTC | AMSR2 | 997 hPa | 45 kts | 39 kts | 50 kts | 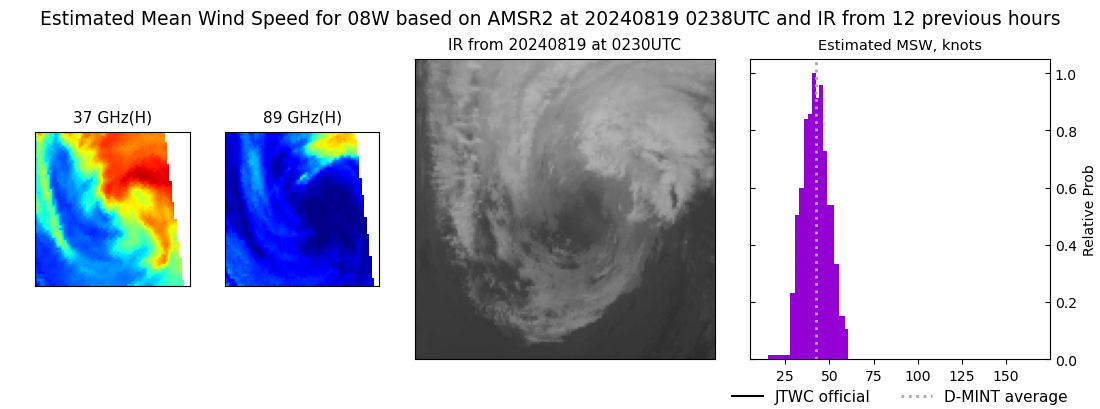 |
| 20240818 | 2029 UTC | SSMISF16 | 1000 hPa | 43 kts | 38 kts | 49 kts | 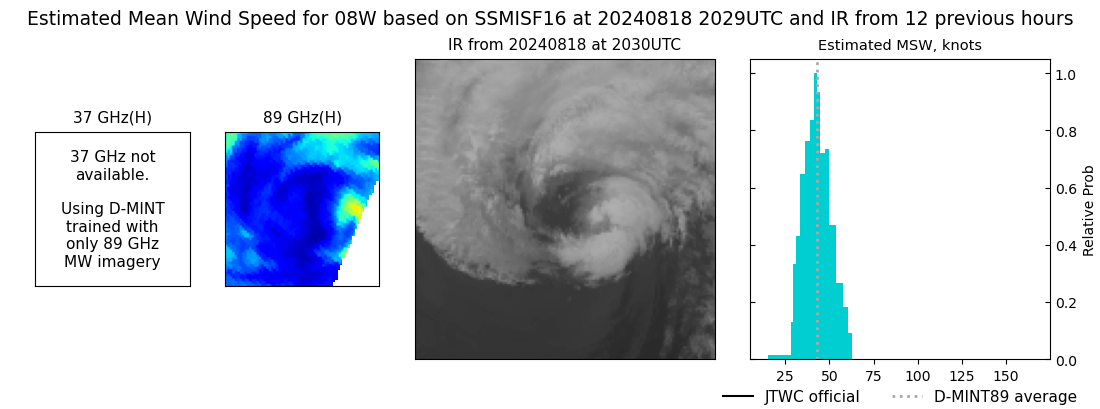 |
| 20240818 | 1931 UTC | SSMISF17 | 998 hPa | 45 kts | 40 kts | 50 kts | 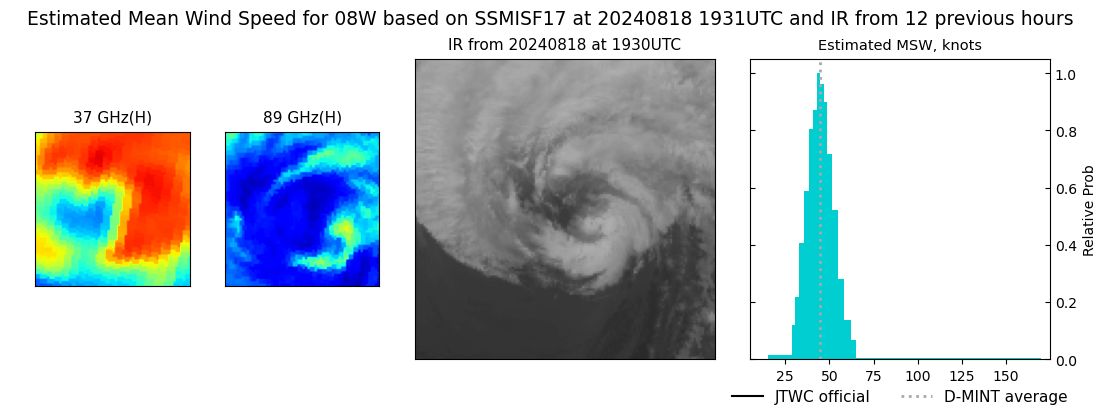 |
| 20240818 | 1819 UTC | SSMISF18 | 996 hPa | 44 kts | 39 kts | 49 kts | 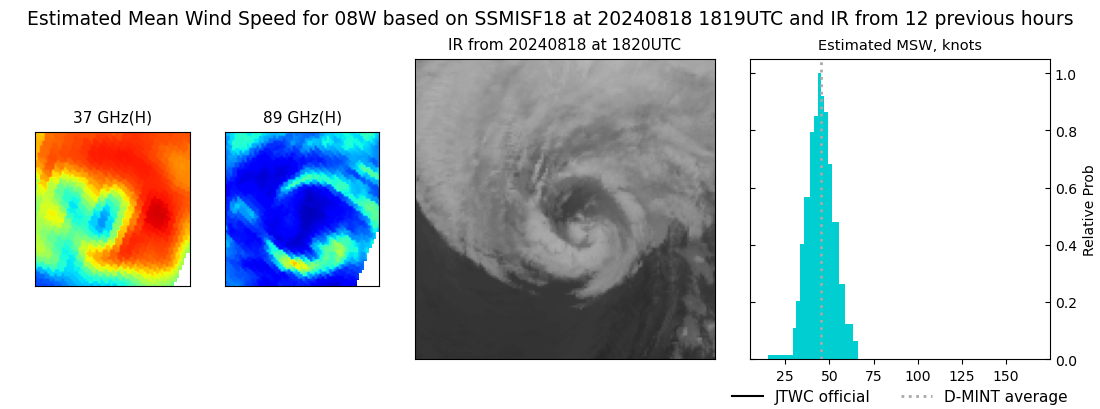 |
| 20240818 | 1530 UTC | AMSR2 | 992 hPa | 48 kts | 43 kts | 52 kts | 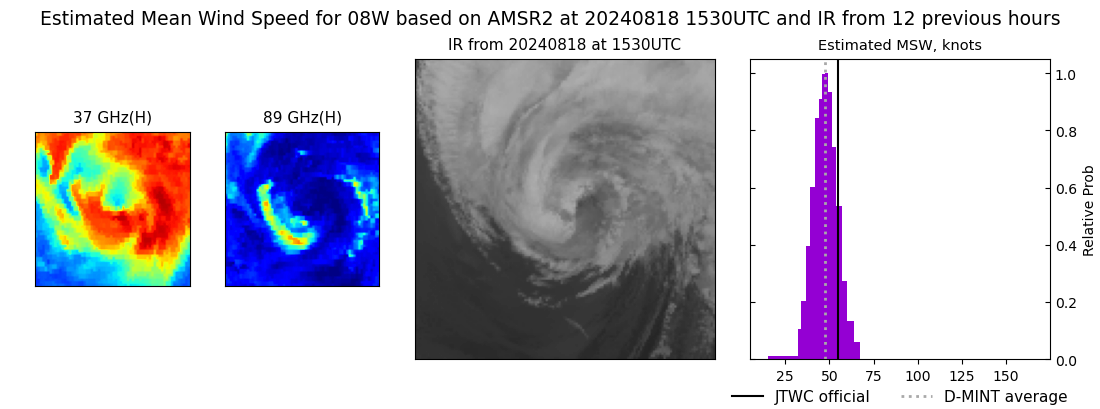 |
| 20240818 | 0710 UTC | SSMISF17 | 994 hPa | 45 kts | 40 kts | 51 kts | 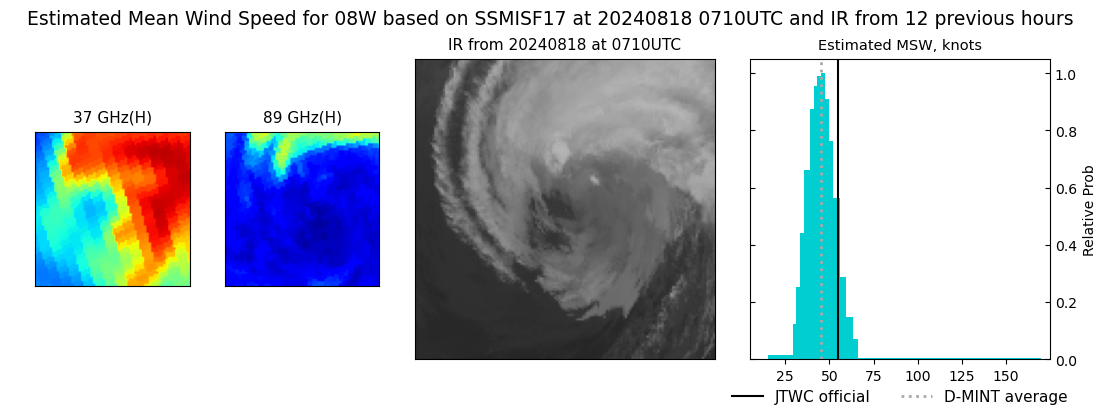 |
| 20240818 | 0408 UTC | GMI | 993 hPa | 45 kts | 39 kts | 51 kts | 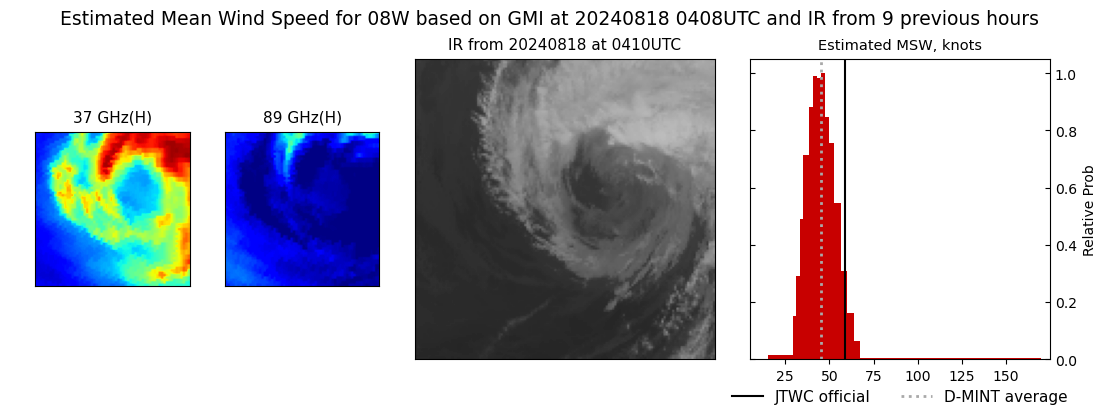 |
| 20240818 | 0306 UTC | ATMS-N21 | 986 hPa | 52 kts | 46 kts | 57 kts | 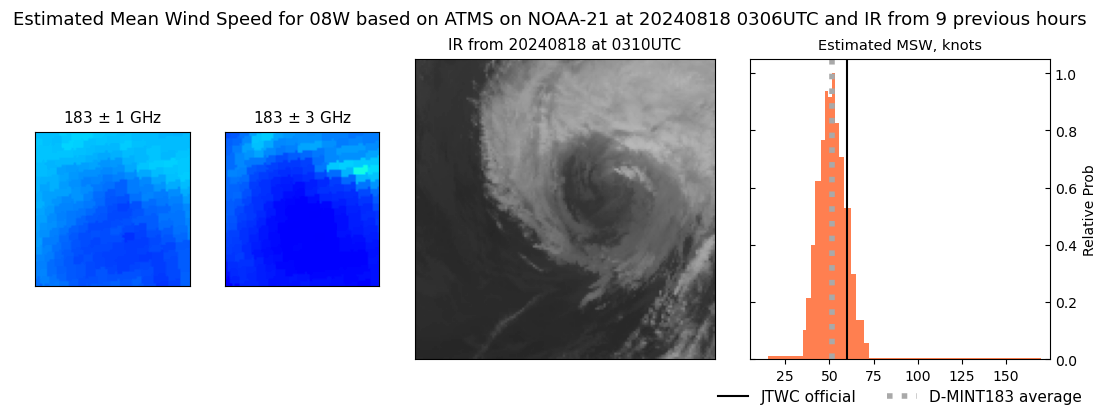 |
| 20240818 | 0215 UTC | ATMS-N20 | 983 hPa | 50 kts | 45 kts | 56 kts | 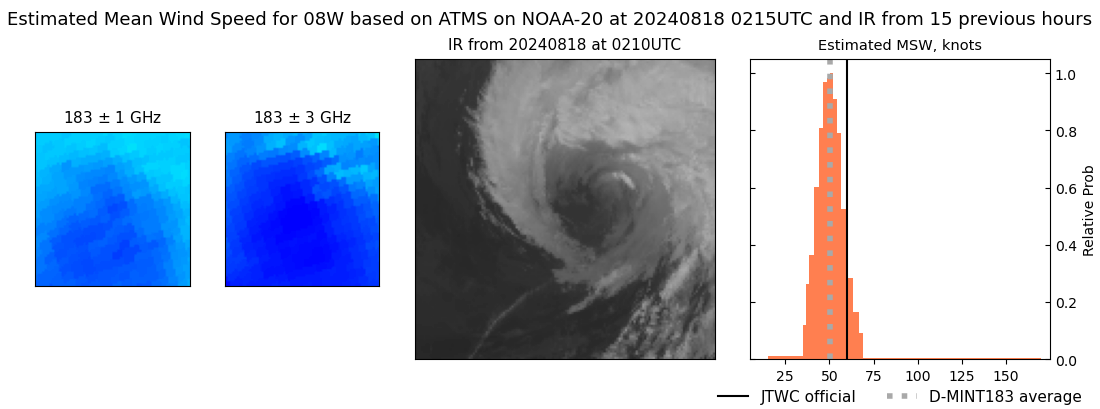 |
| 20240817 | 2044 UTC | SSMISF16 | 990 hPa | 51 kts | 44 kts | 58 kts | 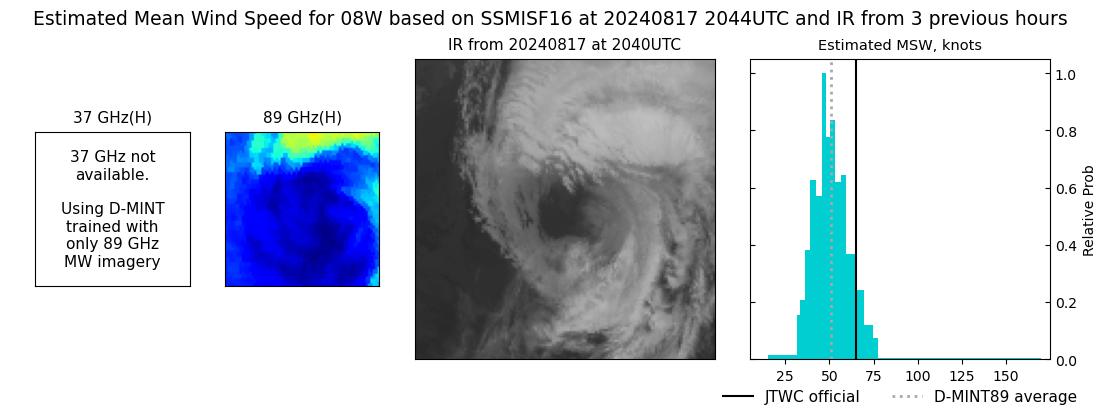 |
| 20240817 | 1833 UTC | SSMISF18 | 992 hPa | 49 kts | 44 kts | 55 kts | 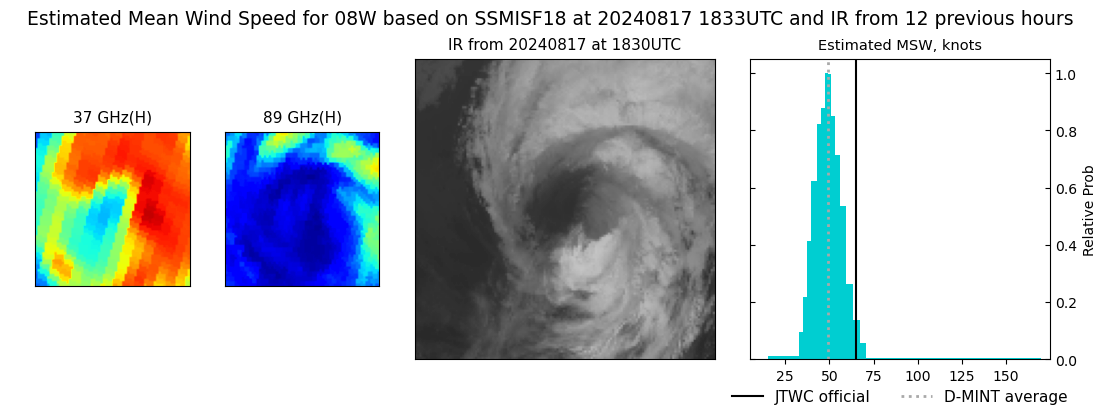 |
| 20240817 | 1634 UTC | ATMS-N20 | 986 hPa | 47 kts | 42 kts | 52 kts | 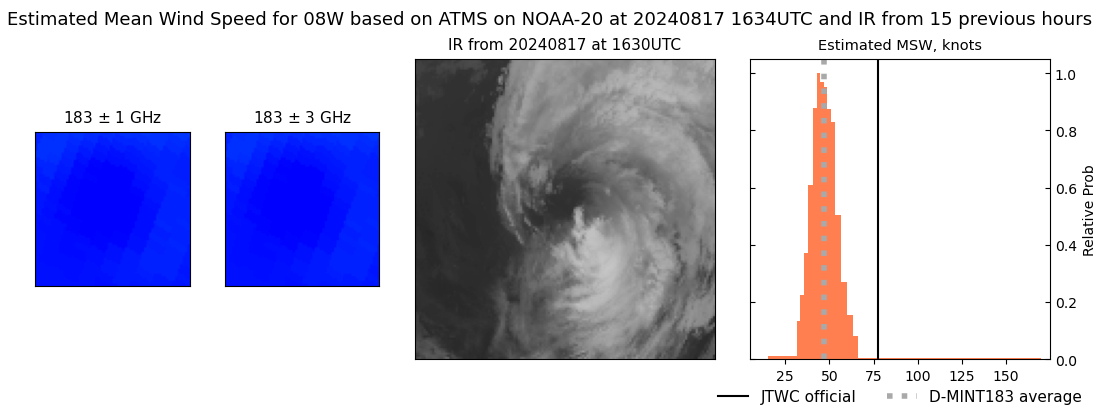 |
| 20240817 | 1627 UTC | AMSR2 | 985 hPa | 49 kts | 44 kts | 54 kts | 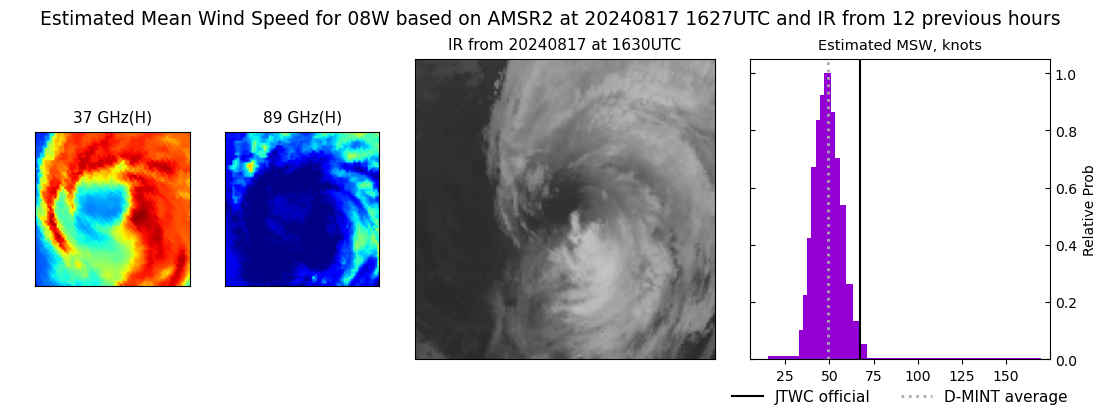 |
| 20240817 | 1610 UTC | ATMS-NPP | 982 hPa | 54 kts | 49 kts | 59 kts | 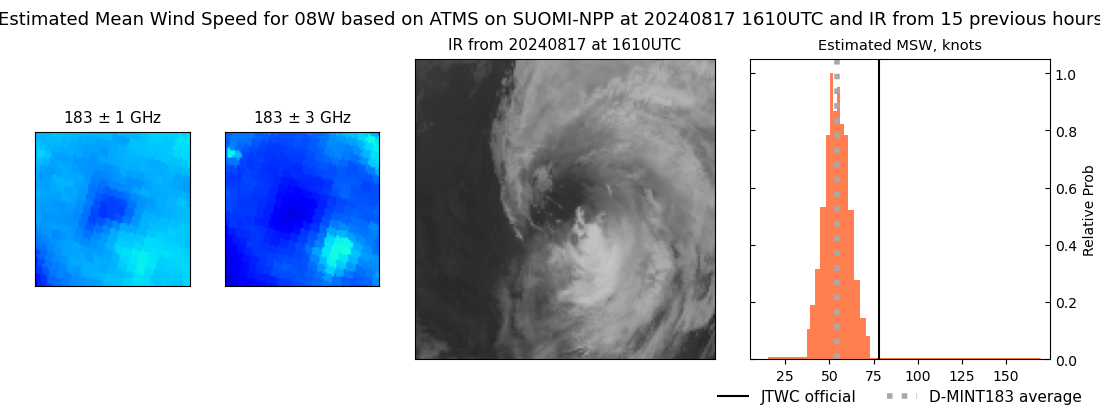 |
| 20240817 | 0822 UTC | SSMISF16 | 979 hPa | 55 kts | 50 kts | 61 kts | 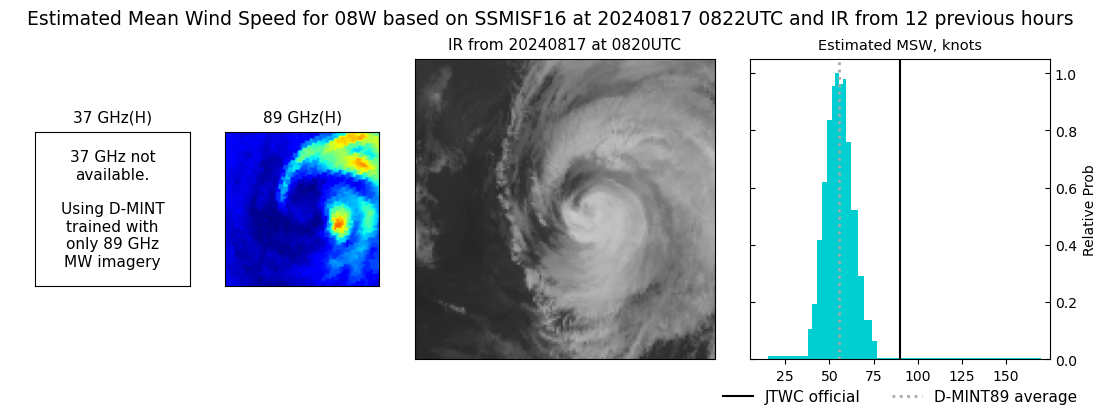 |
| 20240817 | 0453 UTC | GMI | 976 hPa | 64 kts | 58 kts | 69 kts | 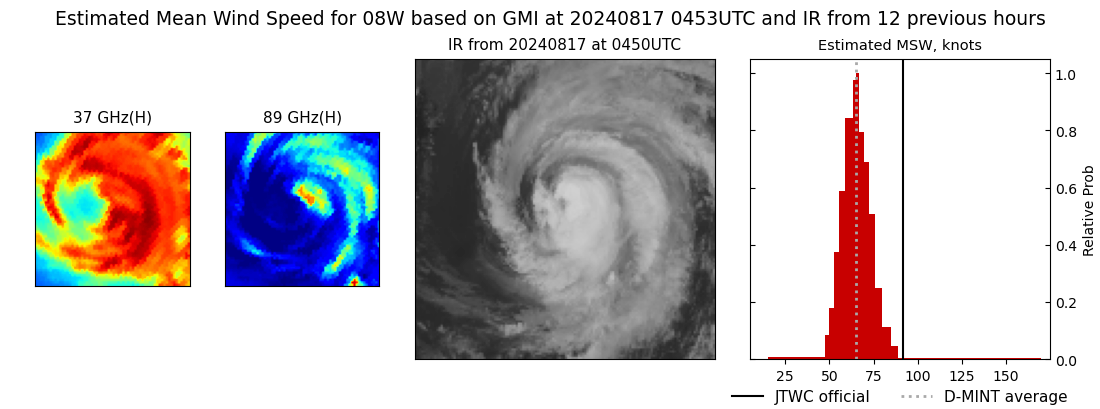 |
| 20240817 | 0349 UTC | ATMS-NPP | 964 hPa | 77 kts | 72 kts | 81 kts | 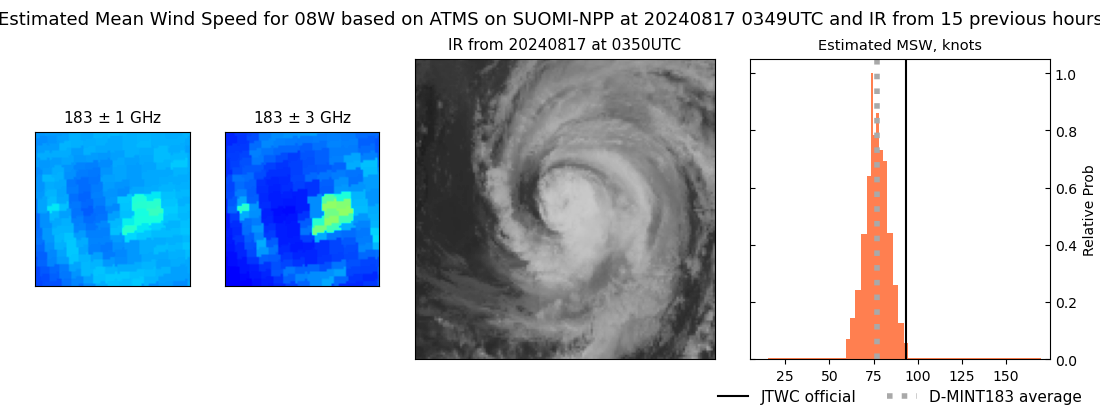 |
| 20240817 | 0324 UTC | ATMS-N21 | 966 hPa | 75 kts | 70 kts | 80 kts | 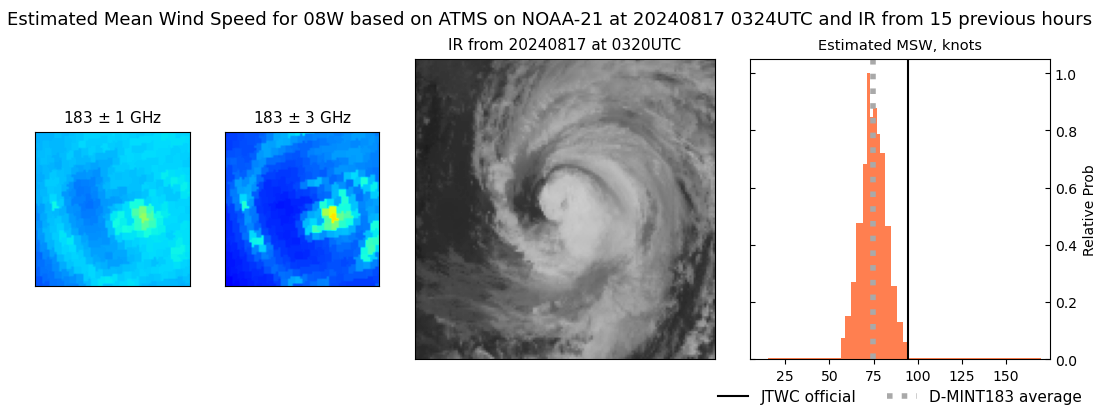 |
| 20240816 | 2058 UTC | SSMISF16 | 959 hPa | 87 kts | 80 kts | 94 kts | 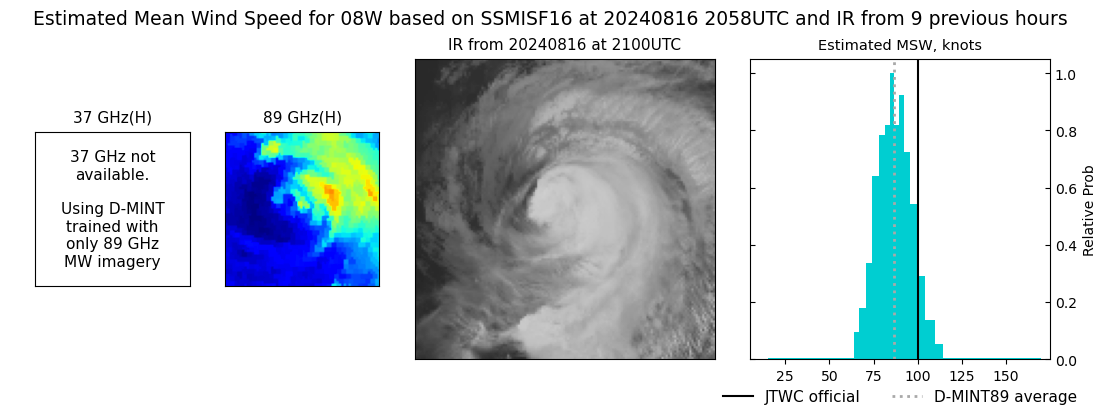 |
| 20240816 | 1847 UTC | SSMISF18 | 946 hPa | 91 kts | 85 kts | 96 kts | 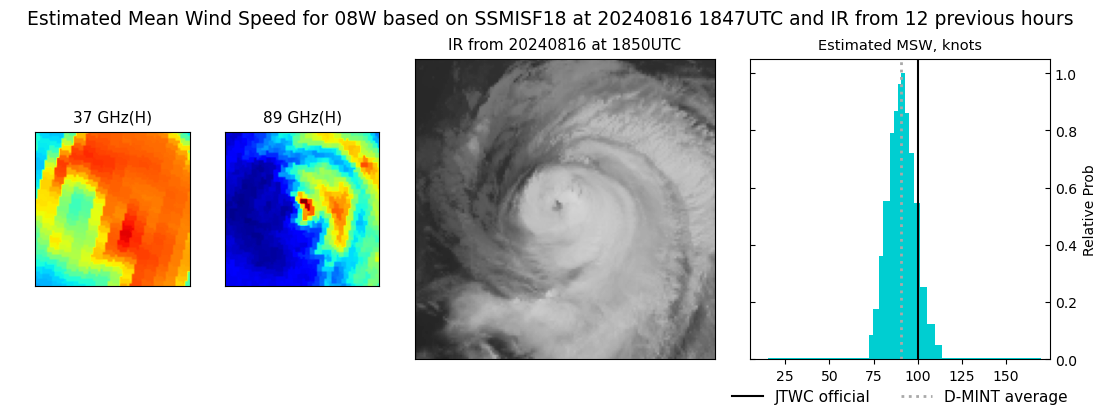 |
| 20240816 | 1630 UTC | ATMS-NPP | 949 hPa | 93 kts | 87 kts | 100 kts | 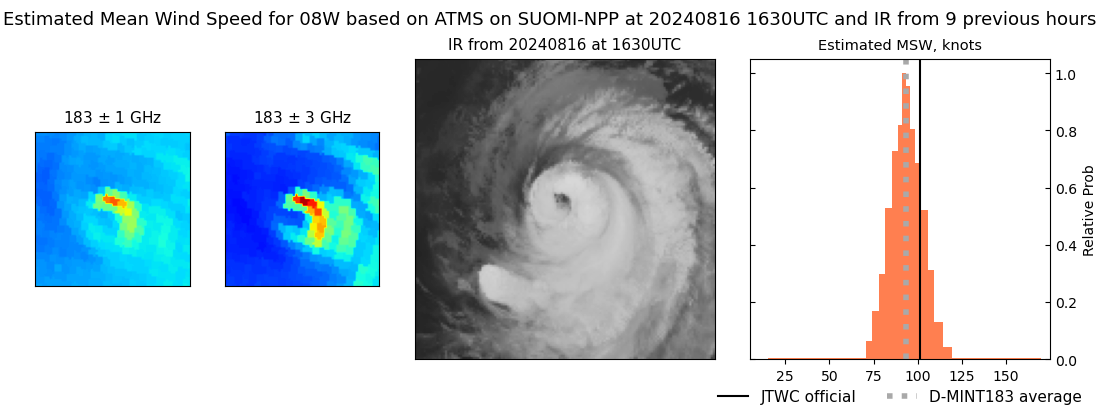 |
| 20240816 | 1605 UTC | ATMS-N21 | 950 hPa | 93 kts | 88 kts | 98 kts | 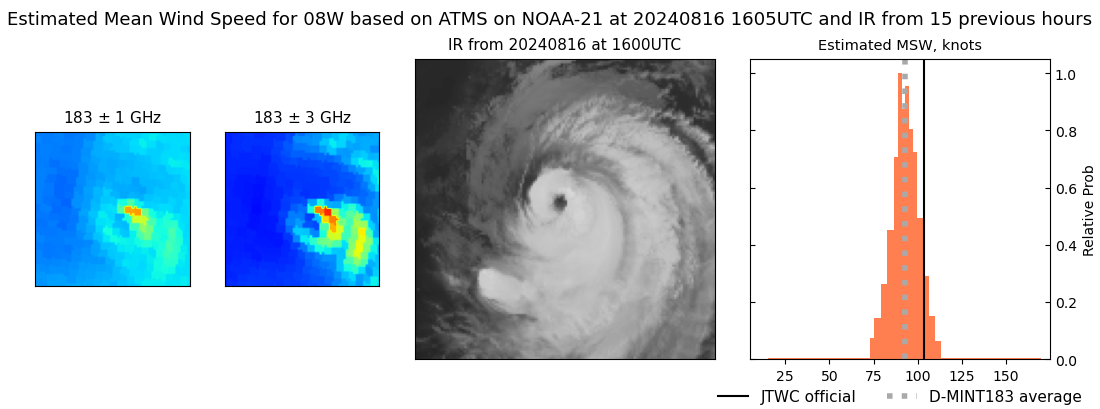 |
| 20240816 | 0834 UTC | SSMISF16 | 951 hPa | 97 kts | 91 kts | 103 kts |  |
| 20240816 | 0624 UTC | SSMISF18 | 942 hPa | 114 kts | 108 kts | 119 kts | 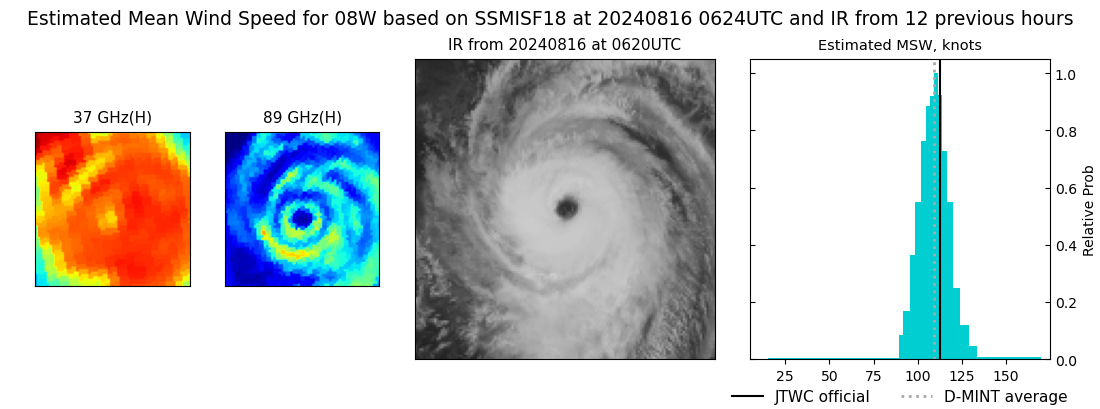 |
| 20240816 | 0342 UTC | AMSR2 | 945 hPa | 107 kts | 101 kts | 113 kts | 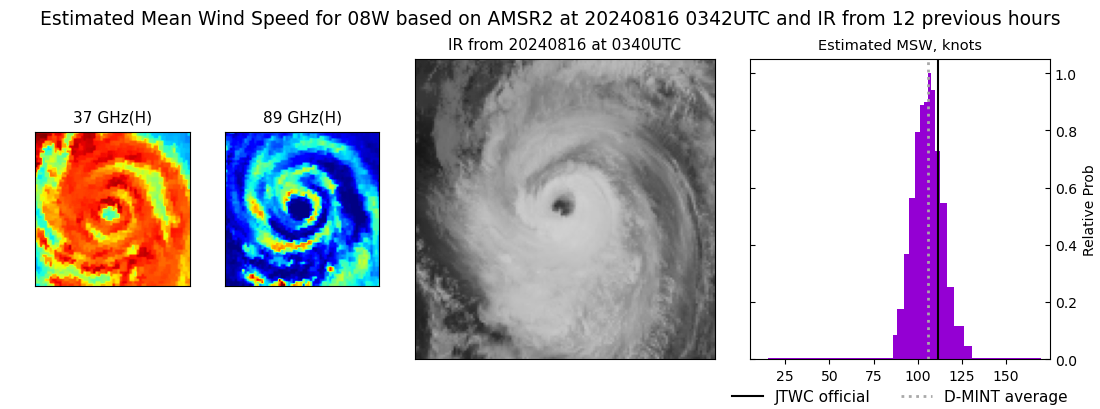 |
| 20240815 | 2112 UTC | SSMISF16 | 942 hPa | 105 kts | 99 kts | 111 kts | 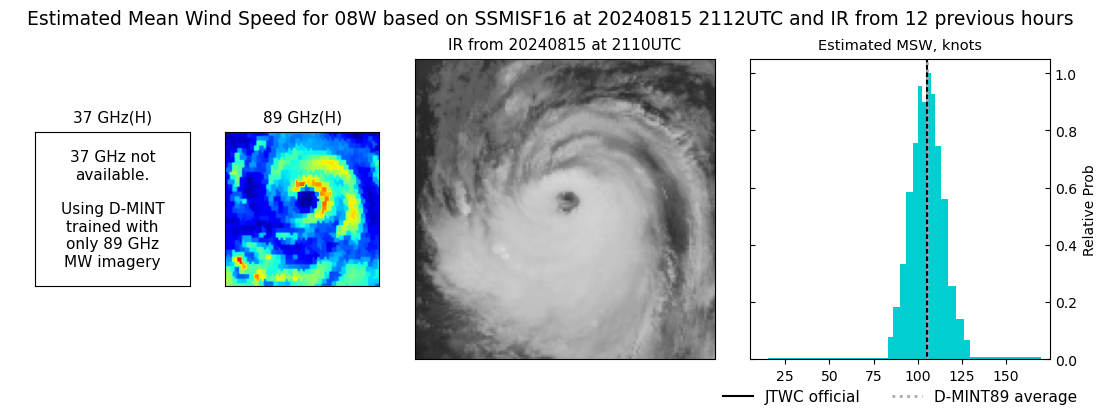 |
| 20240815 | 1902 UTC | SSMISF18 | 942 hPa | 105 kts | 99 kts | 110 kts | 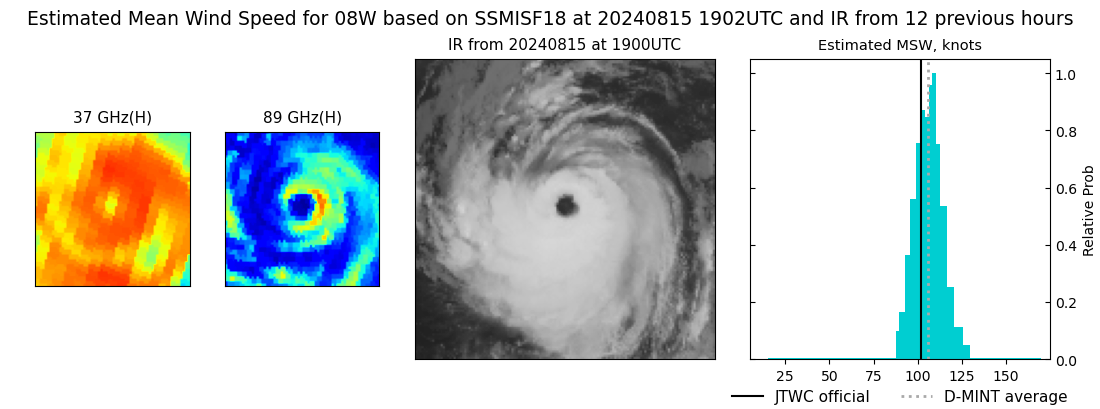 |
| 20240815 | 1641 UTC | AMSR2 | 952 hPa | 91 kts | 86 kts | 96 kts | 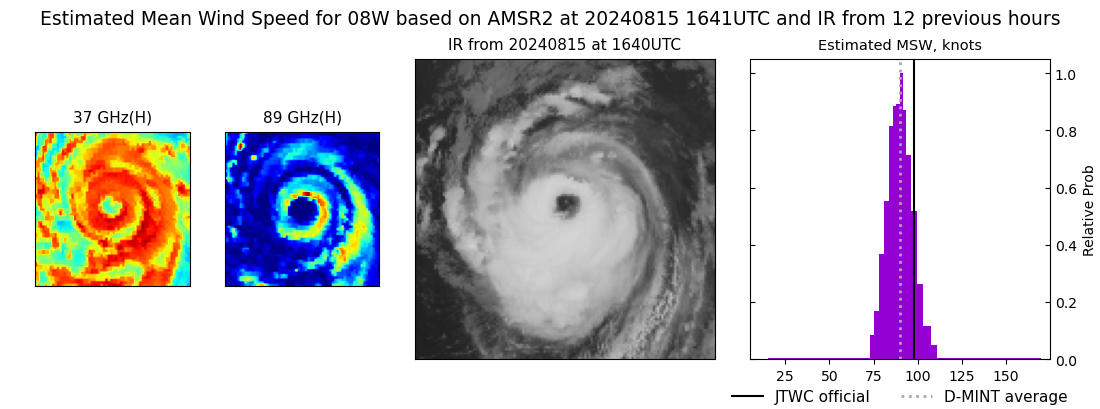 |
| 20240815 | 1638 UTC | TROPICS03 | 952 hPa | 96 kts | 91 kts | 101 kts | 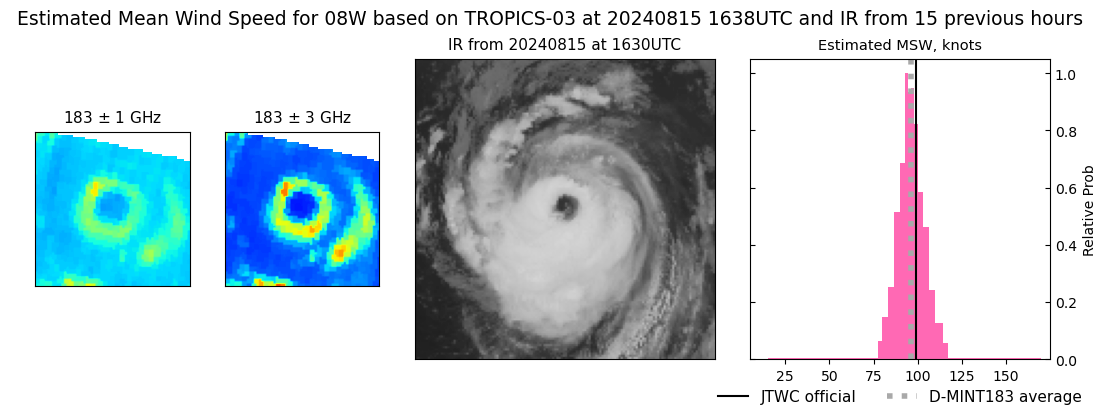 |
| 20240815 | 1624 UTC | ATMS-N21 | 954 hPa | 94 kts | 89 kts | 99 kts | 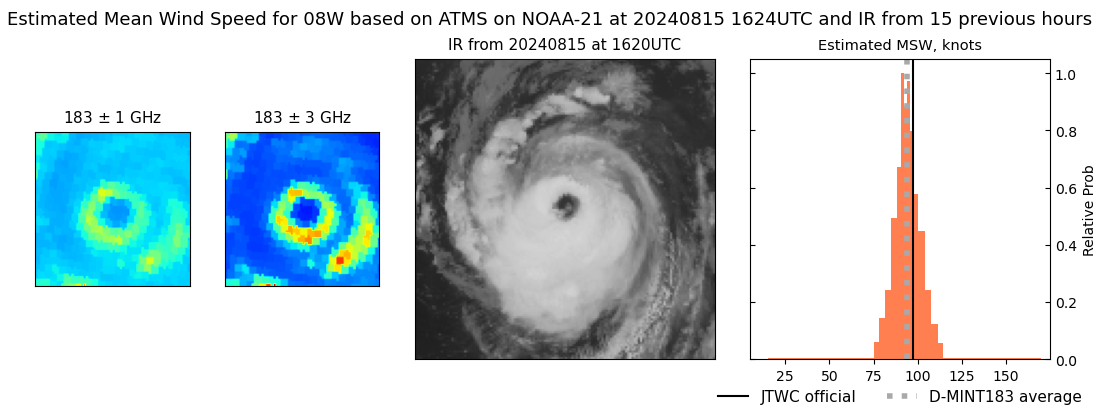 |
| 20240815 | 1458 UTC | TROPICS03 | 959 hPa | 89 kts | 84 kts | 95 kts |  |
| 20240815 | 0848 UTC | SSMISF16 | 962 hPa | 86 kts | 80 kts | 93 kts | 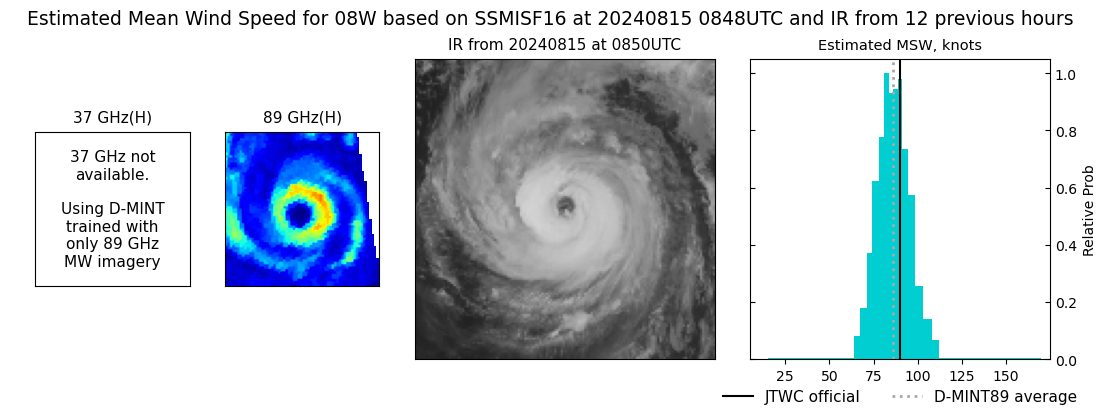 |
| 20240815 | 0637 UTC | SSMISF18 | 968 hPa | 80 kts | 74 kts | 85 kts | 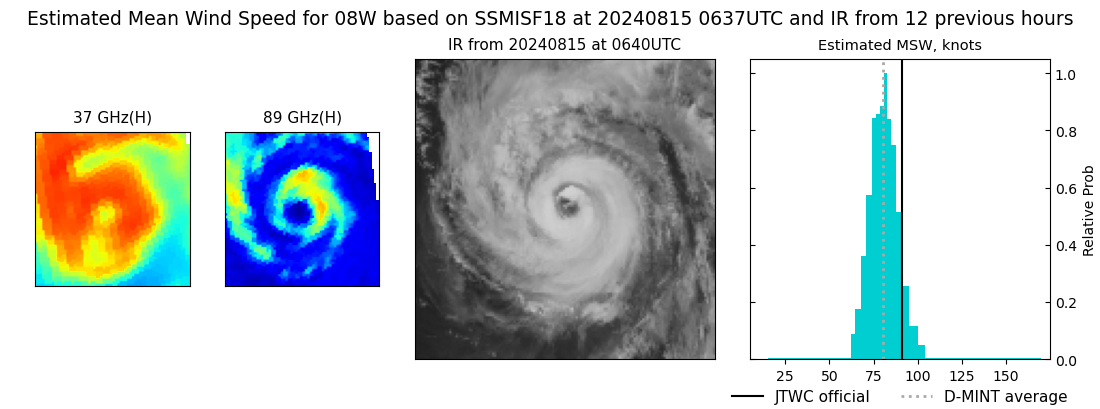 |
| 20240815 | 0618 UTC | GMI | 965 hPa | 83 kts | 77 kts | 89 kts | 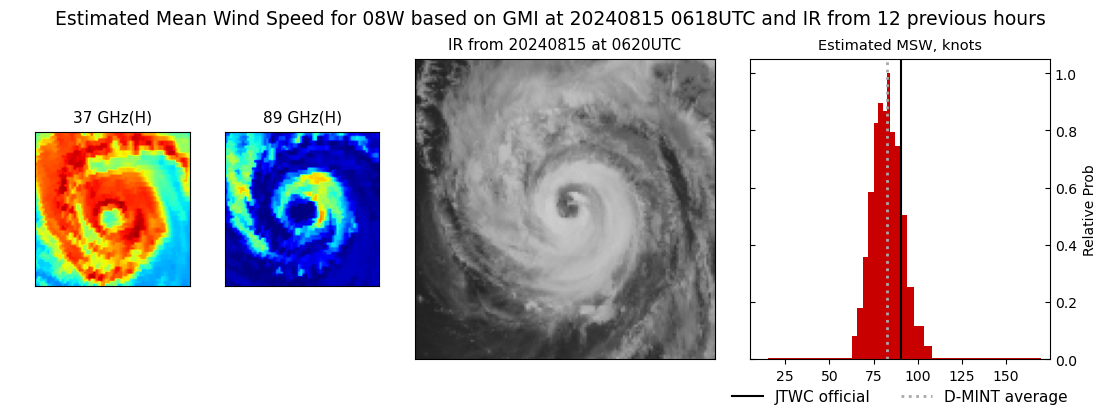 |
| 20240815 | 0400 UTC | ATMS-N21 | 967 hPa | 79 kts | 74 kts | 85 kts | 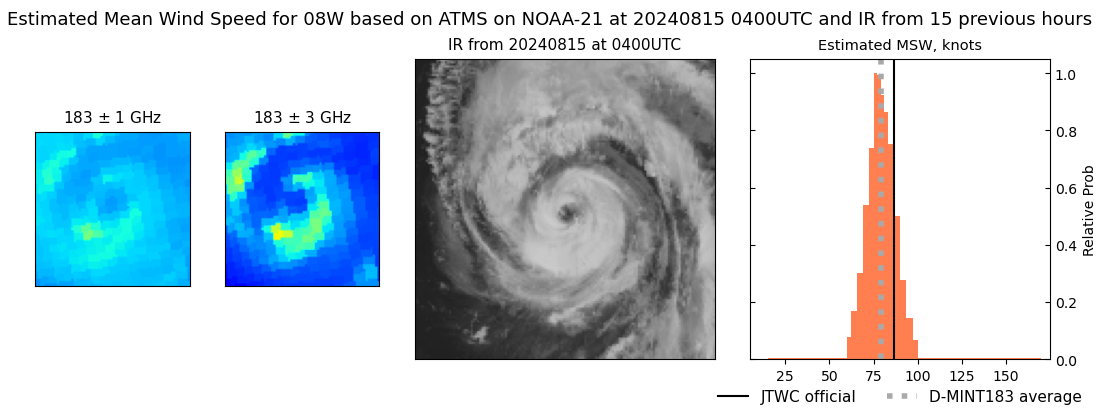 |
| 20240815 | 0309 UTC | ATMS-N20 | 971 hPa | 72 kts | 66 kts | 78 kts | 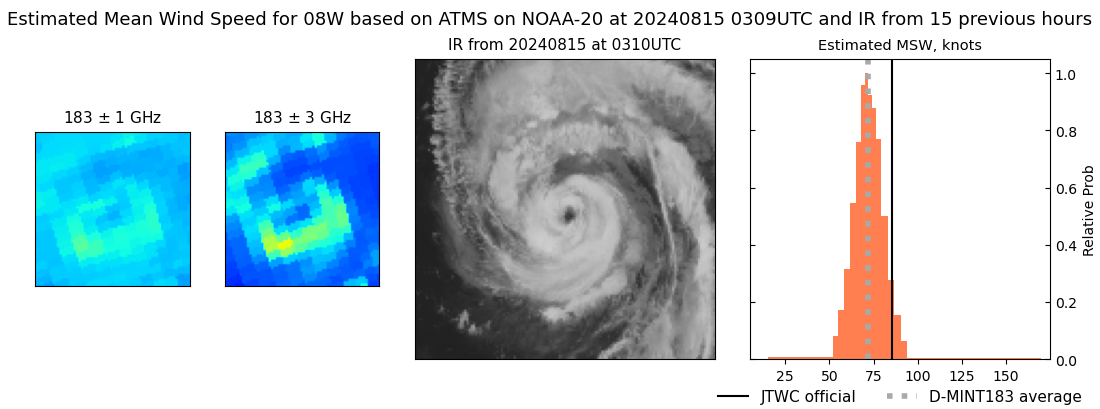 |
| 20240814 | 2128 UTC | SSMISF16 | 972 hPa | 78 kts | 71 kts | 84 kts | 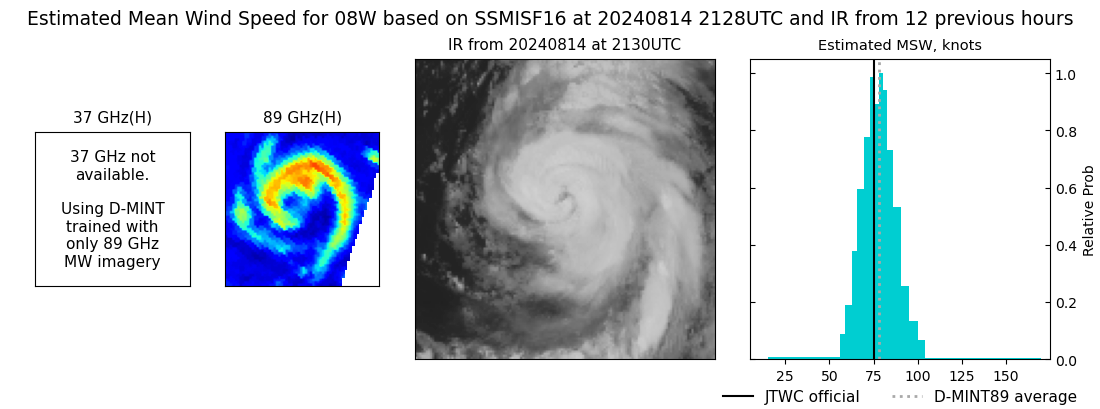 |
| 20240814 | 2028 UTC | GMI | 965 hPa | 73 kts | 68 kts | 79 kts | 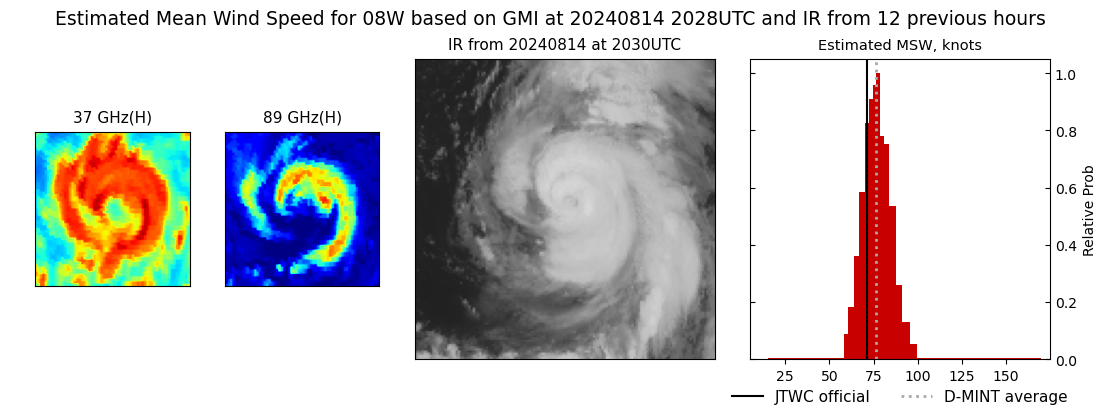 |
| 20240814 | 1918 UTC | SSMISF18 | 966 hPa | 78 kts | 72 kts | 84 kts | 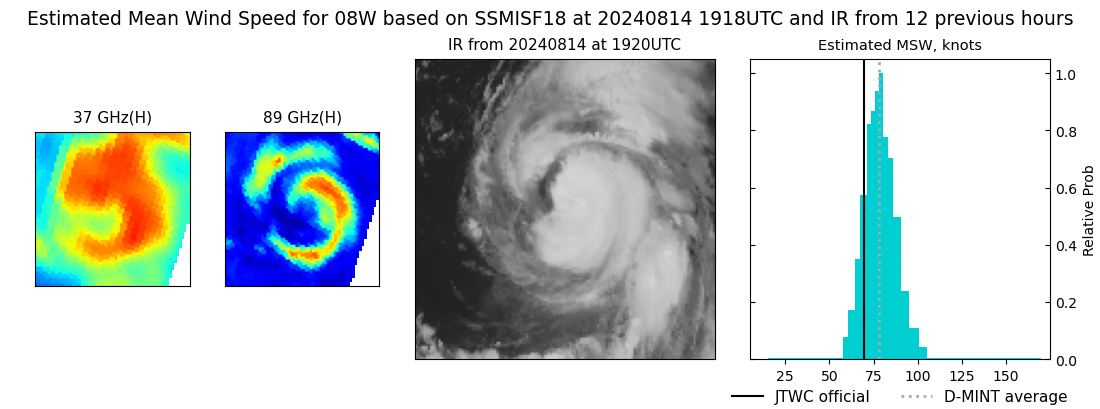 |
| 20240814 | 1644 UTC | ATMS-N21 | 972 hPa | 73 kts | 67 kts | 80 kts | 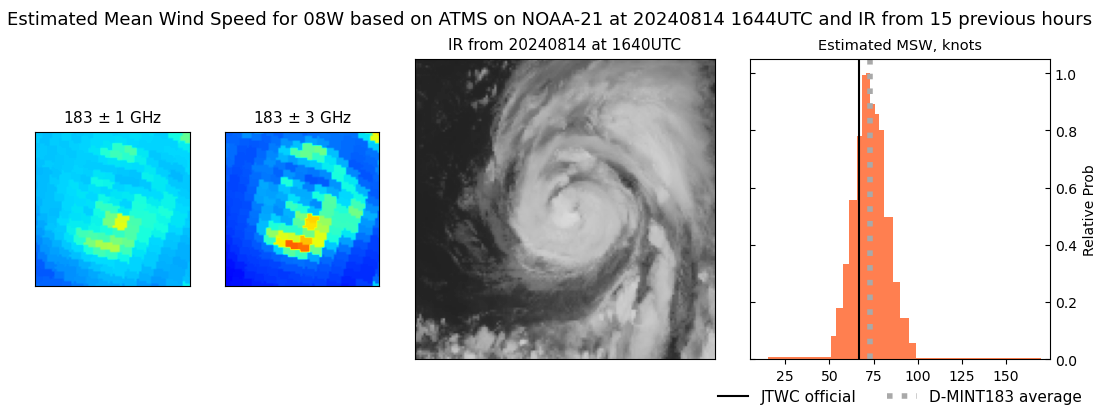 |
| 20240814 | 1600 UTC | AMSR2 | 970 hPa | 72 kts | 67 kts | 79 kts | 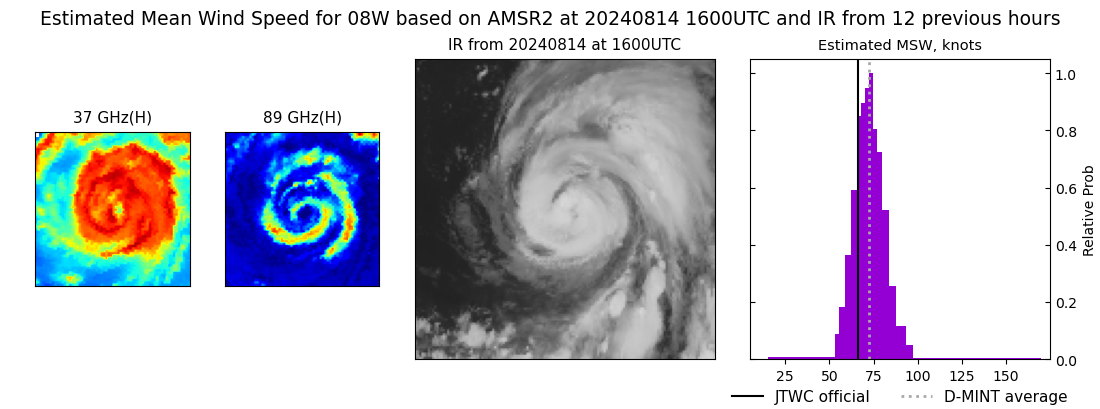 |
| 20240814 | 1553 UTC | ATMS-N20 | 973 hPa | 70 kts | 64 kts | 77 kts | 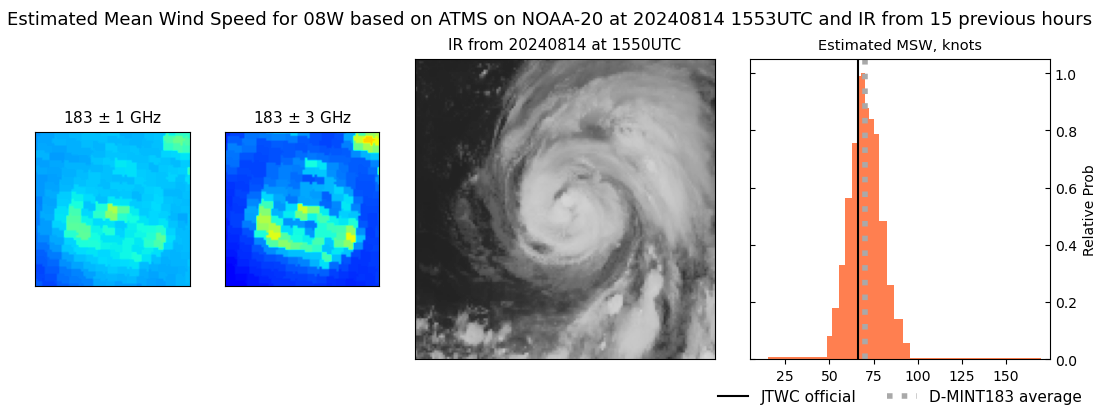 |
| 20240814 | 0802 UTC | SSMISF17 | 977 hPa | 59 kts | 53 kts | 65 kts | 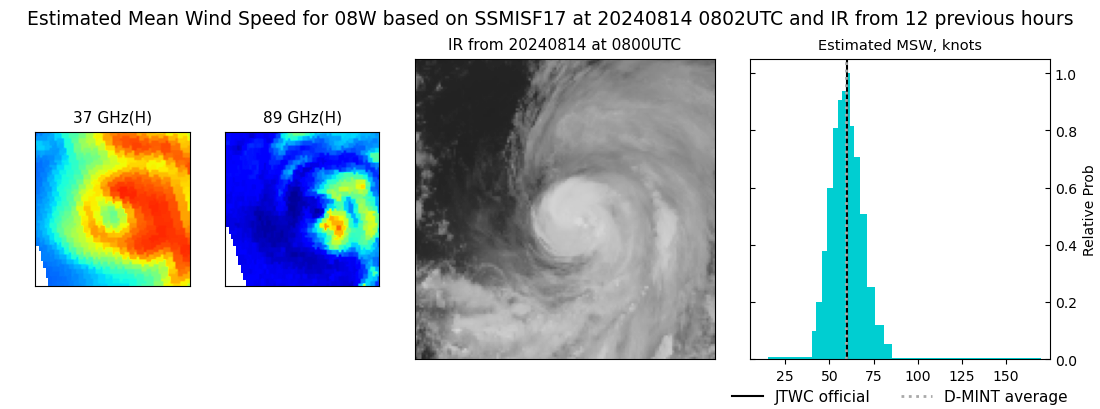 |
| 20240814 | 0418 UTC | ATMS-N21 | 978 hPa | 63 kts | 58 kts | 69 kts | 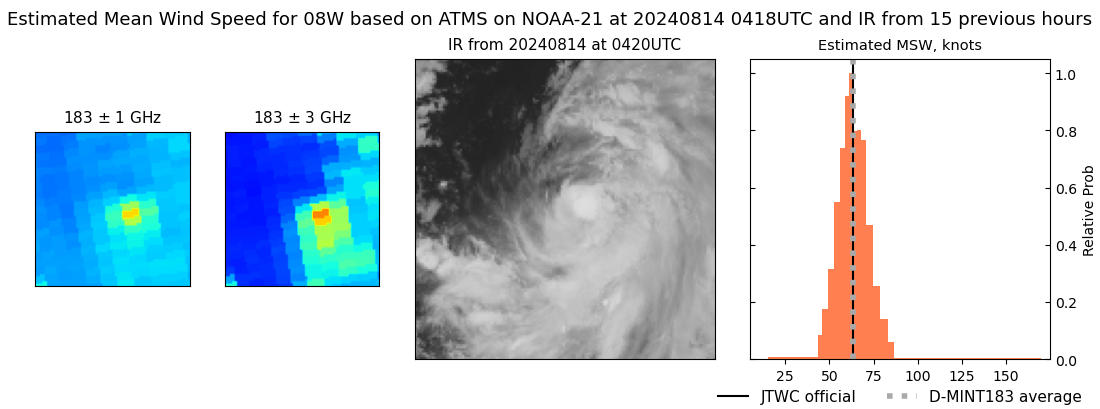 |
| 20240814 | 0353 UTC | AMSR2 | 982 hPa | 59 kts | 54 kts | 65 kts | 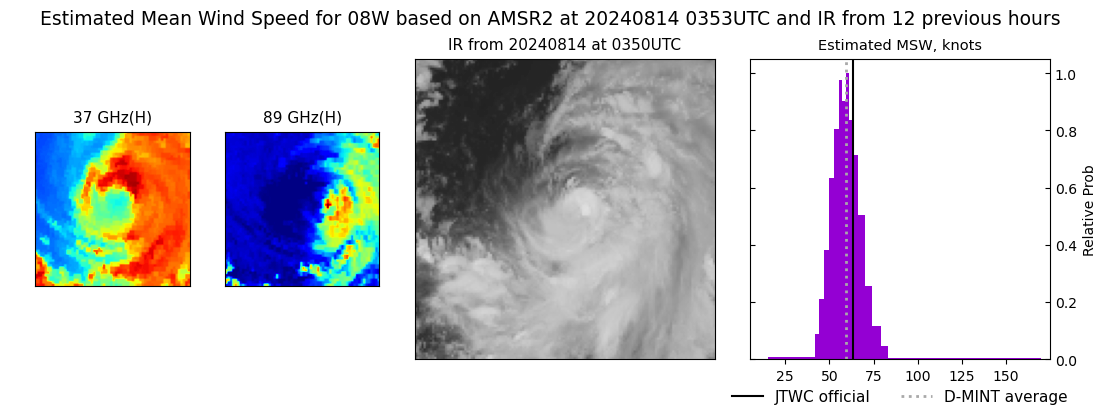 |
| 20240814 | 0327 UTC | ATMS-N20 | 977 hPa | 66 kts | 60 kts | 72 kts | 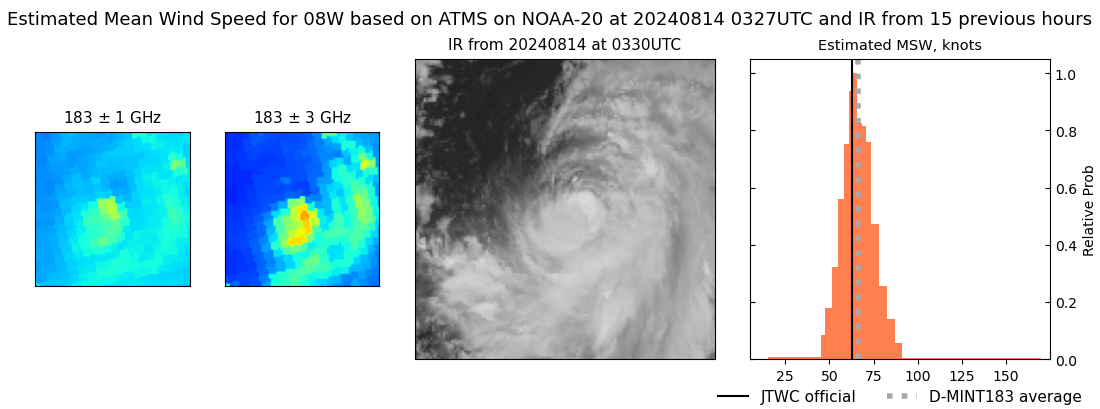 |
| 20240813 | 2045 UTC | SSMISF17 | 985 hPa | 59 kts | 52 kts | 67 kts | 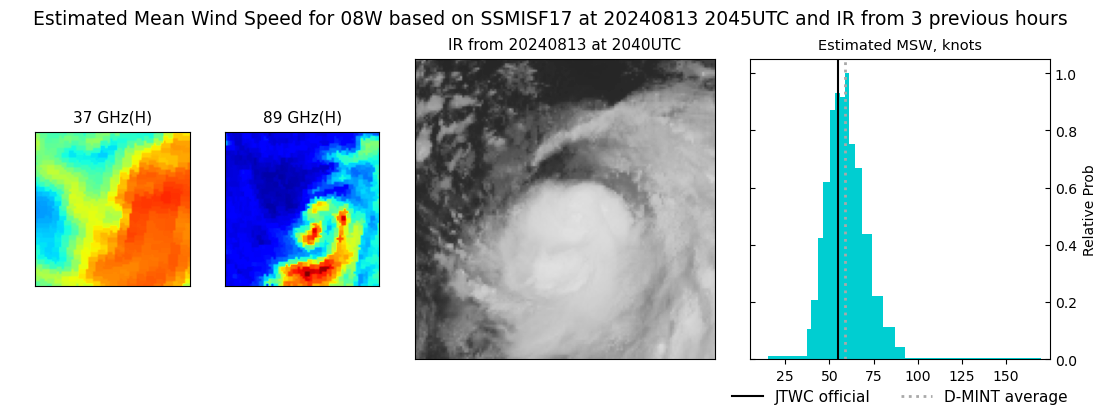 |
| 20240813 | 1902 UTC | TROPICS03 | 981 hPa | 60 kts | 55 kts | 66 kts | 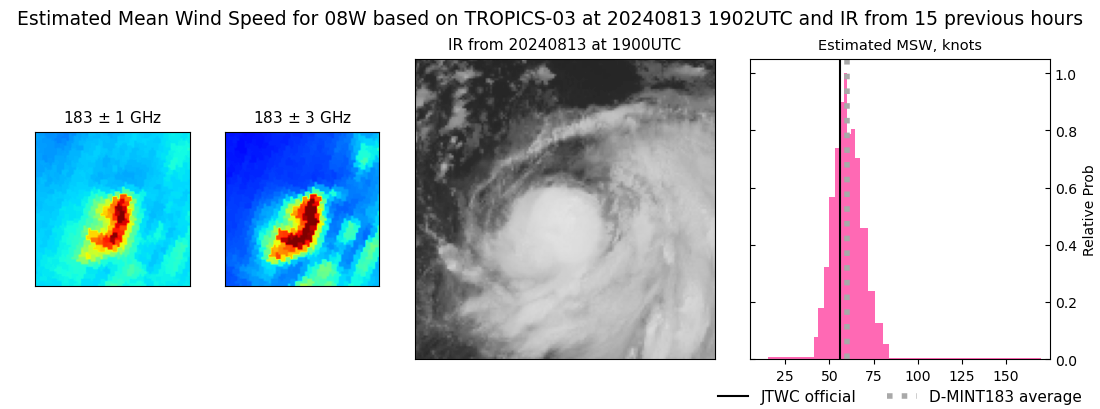 |
| 20240813 | 1703 UTC | ATMS-N21 | 989 hPa | 49 kts | 44 kts | 54 kts | 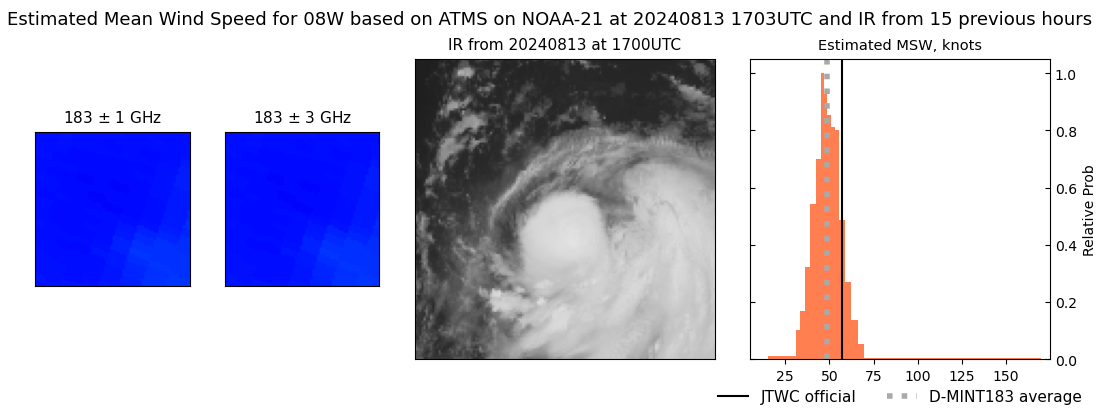 |
| 20240813 | 1656 UTC | AMSR2 | 987 hPa | 57 kts | 51 kts | 63 kts | 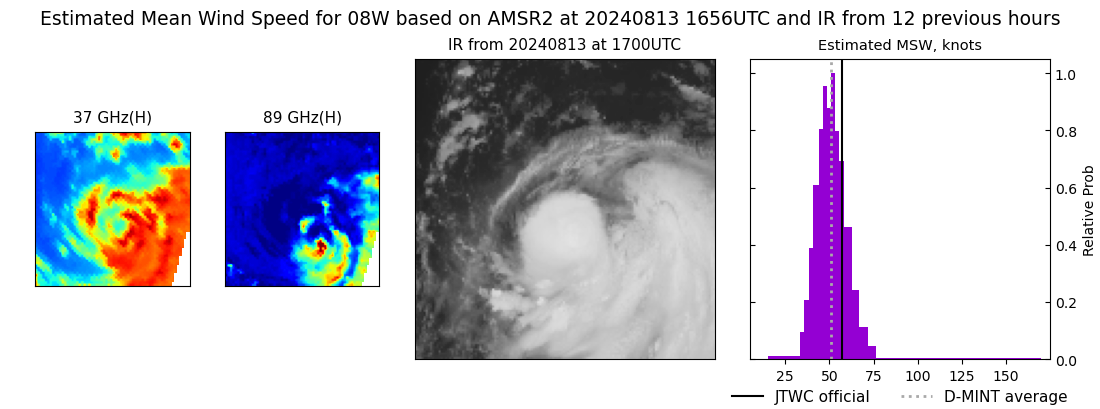 |
| 20240813 | 1612 UTC | ATMS-N20 | 987 hPa | 57 kts | 51 kts | 63 kts | 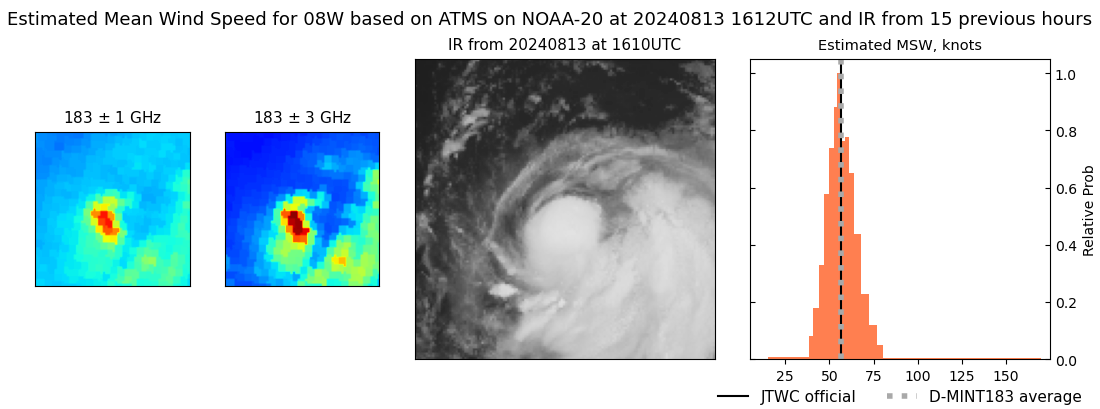 |
| 20240813 | 1400 UTC | TROPICS03 | 985 hPa | 63 kts | 57 kts | 68 kts | 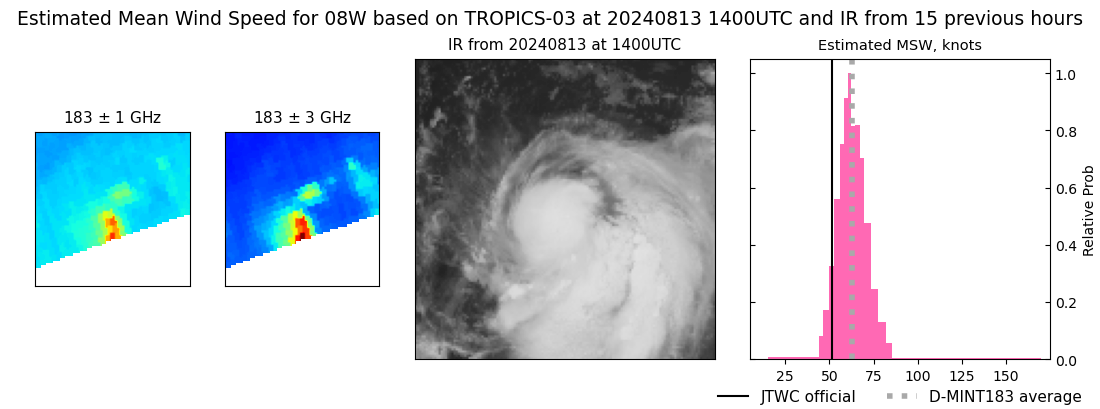 |
| 20240813 | 0816 UTC | SSMISF17 | 988 hPa | 41 kts | 37 kts | 46 kts | 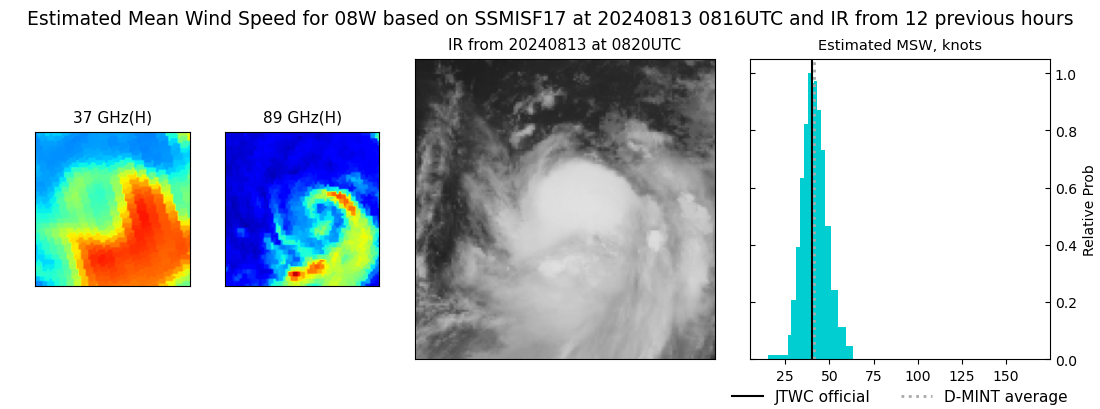 |
| 20240813 | 0346 UTC | ATMS-N20 | 987 hPa | 48 kts | 43 kts | 53 kts | 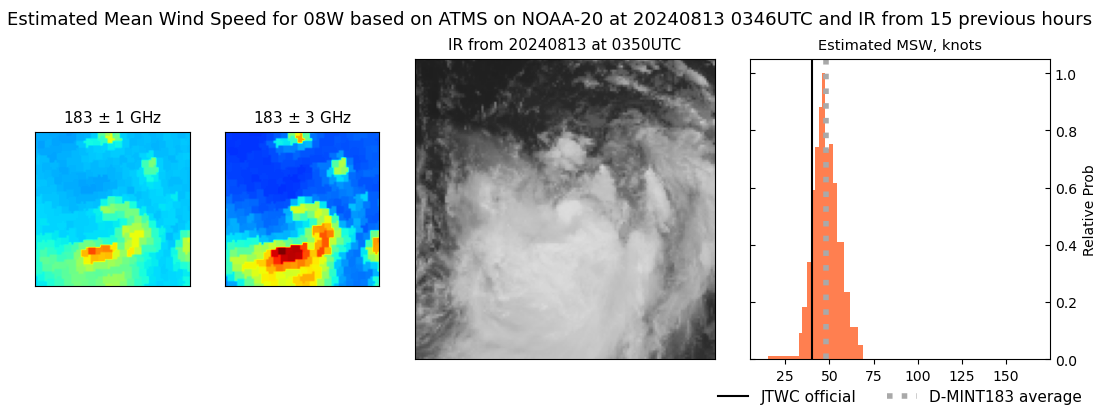 |
| 20240812 | 2059 UTC | SSMISF17 | 995 hPa | 31 kts | 27 kts | 35 kts | 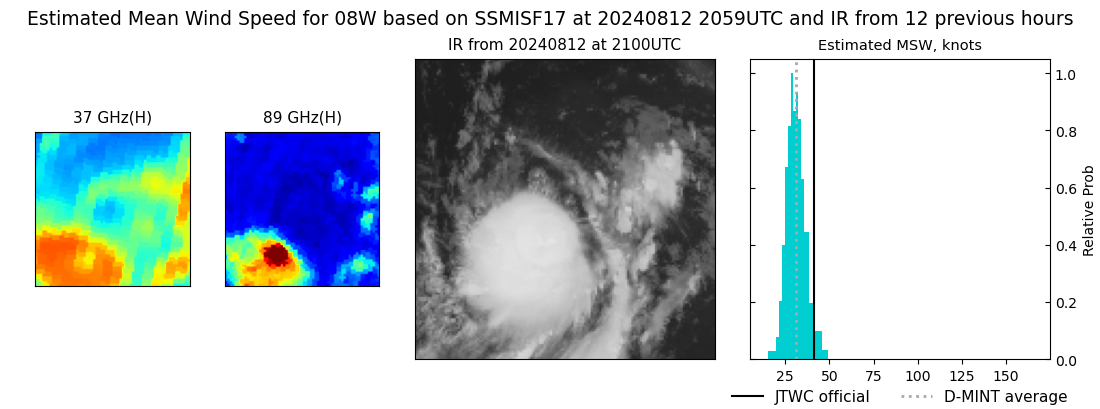 |
| 20240812 | 1923 UTC | TROPICS03 | 993 hPa | 33 kts | 29 kts | 37 kts | 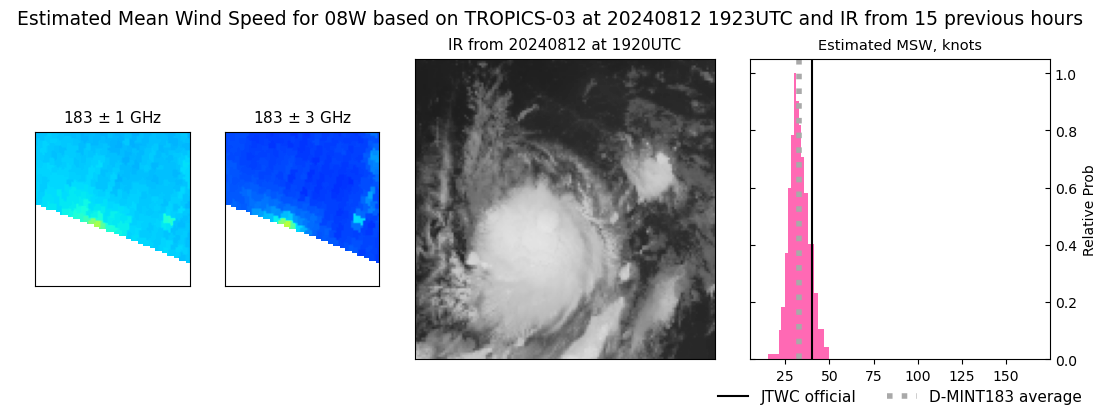 |
| 20240812 | 1614 UTC | AMSR2 | 993 hPa | 39 kts | 34 kts | 43 kts | 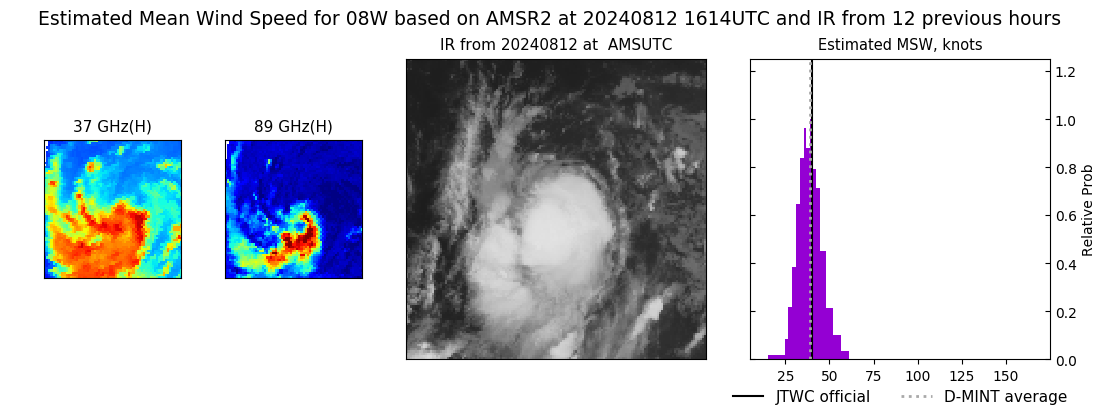 |
|
