|
Storm: 09E
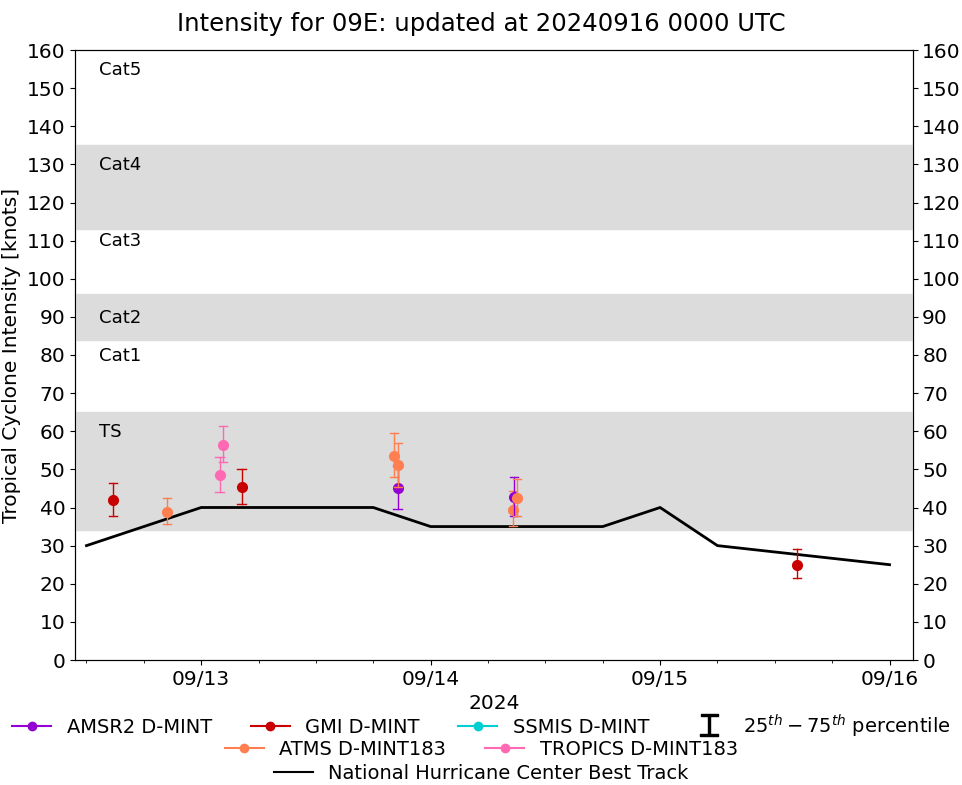
D-MINT HISTORY FILE for 2024_09E
| Date | Time | MW Sensor | MSLP | Vmax
(30th-70th percentile average) | Vmax
25th percentile | Vmax
75th percentile | Image |
| 20240915 | 1418 UTC | GMI | 1005 hPa | 25 kts | 22 kts | 29 kts | 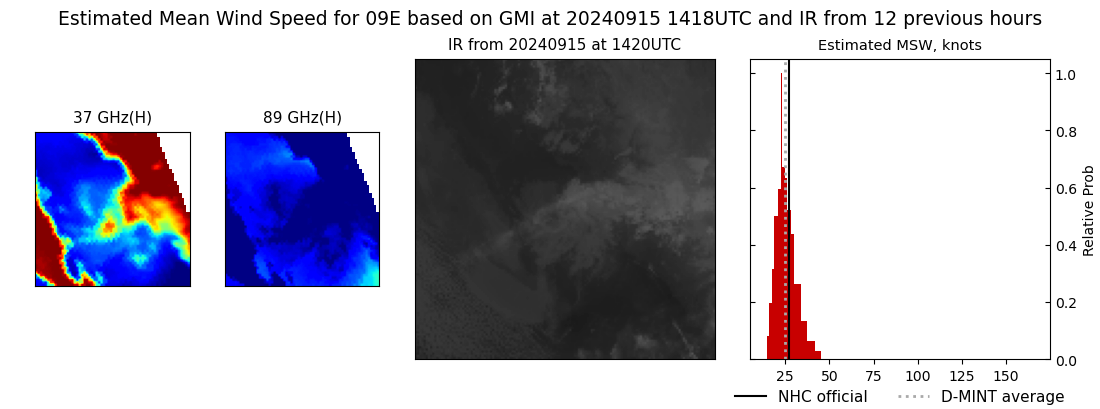 |
| 20240914 | 0902 UTC | ATMS-NPP | 998 hPa | 42 kts | 38 kts | 48 kts | 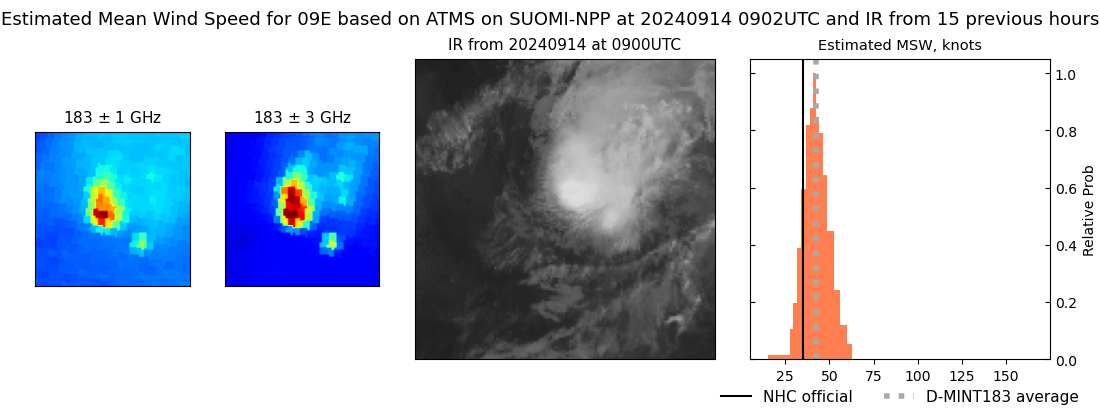 |
| 20240914 | 0842 UTC | AMSR2 | 998 hPa | 43 kts | 38 kts | 48 kts | 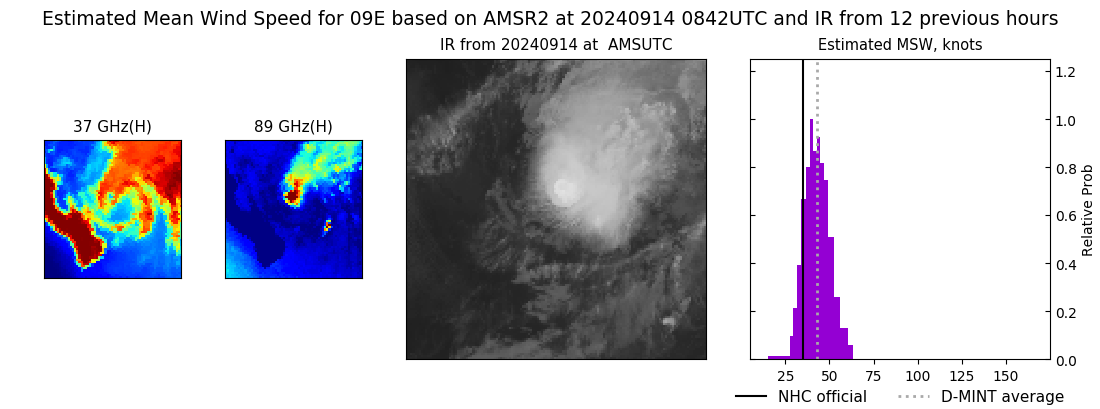 |
| 20240914 | 0837 UTC | ATMS-N21 | 1000 hPa | 39 kts | 35 kts | 44 kts |  |
| 20240913 | 2034 UTC | ATMS-NPP | 993 hPa | 51 kts | 45 kts | 57 kts | 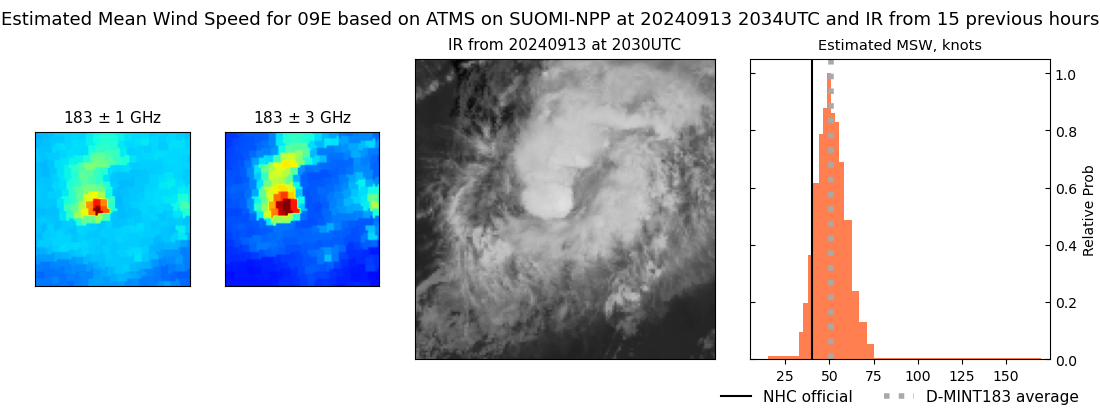 |
| 20240913 | 2032 UTC | AMSR2 | 1003 hPa | 45 kts | 40 kts | 51 kts | 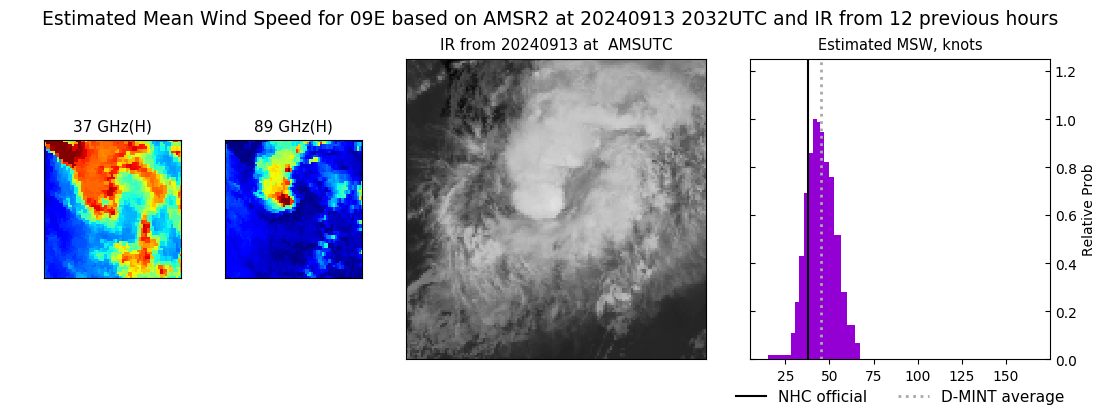 |
| 20240913 | 2009 UTC | ATMS-N21 | 993 hPa | 54 kts | 48 kts | 60 kts | 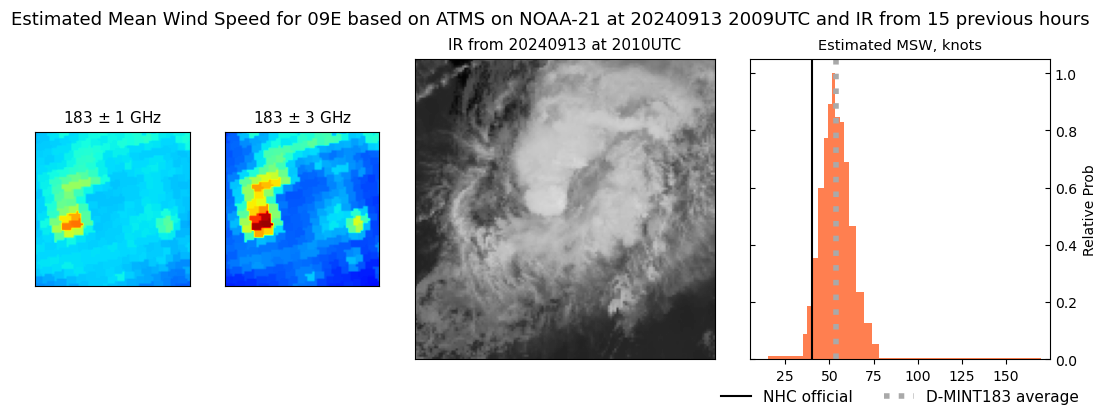 |
| 20240913 | 0413 UTC | GMI | 997 hPa | 45 kts | 41 kts | 50 kts | 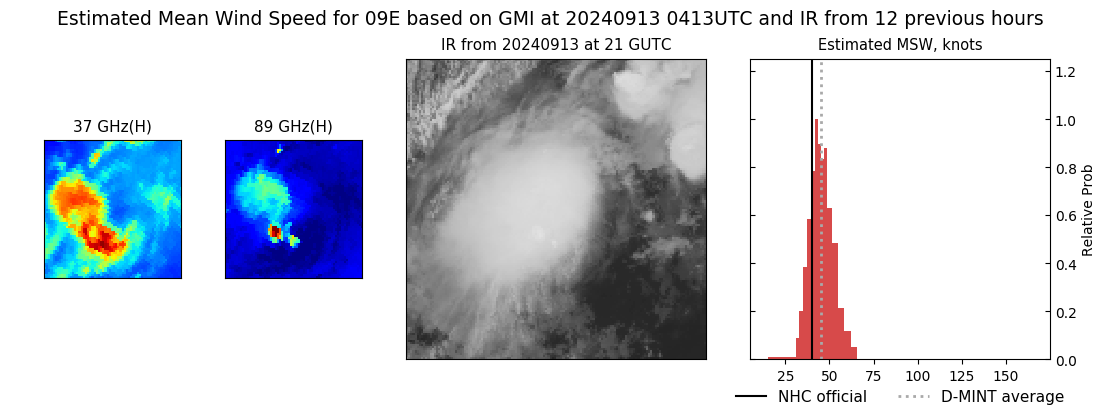 |
| 20240913 | 0217 UTC | TROPICS05 | 994 hPa | 57 kts | 52 kts | 61 kts | 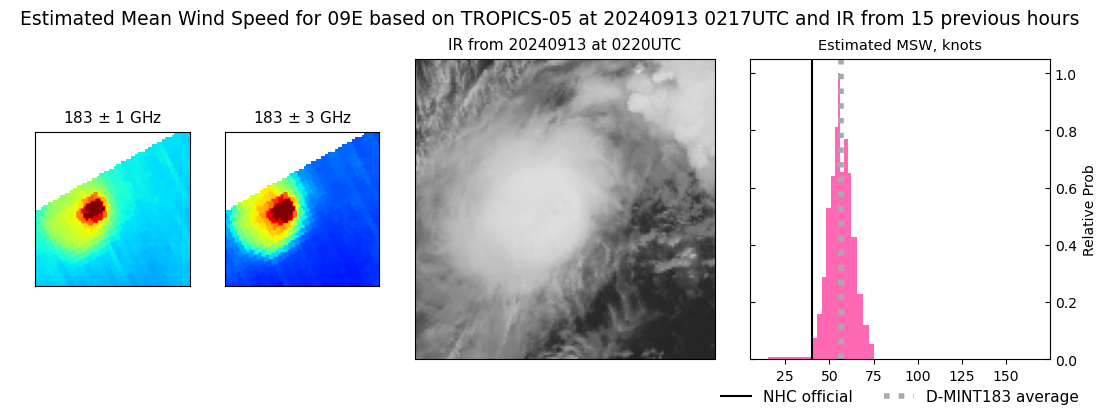 |
| 20240913 | 0156 UTC | TROPICS06 | 995 hPa | 49 kts | 44 kts | 53 kts | 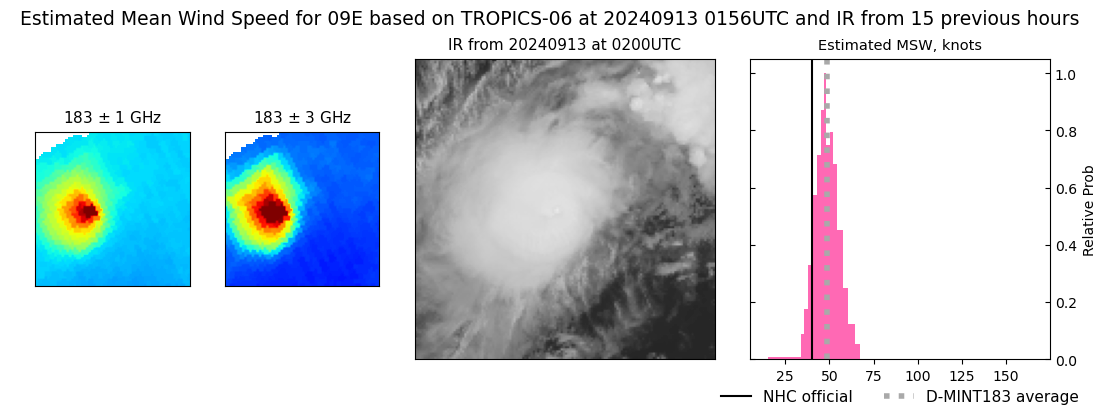 |
| 20240912 | 2027 UTC | ATMS-N21 | 998 hPa | 39 kts | 36 kts | 42 kts | 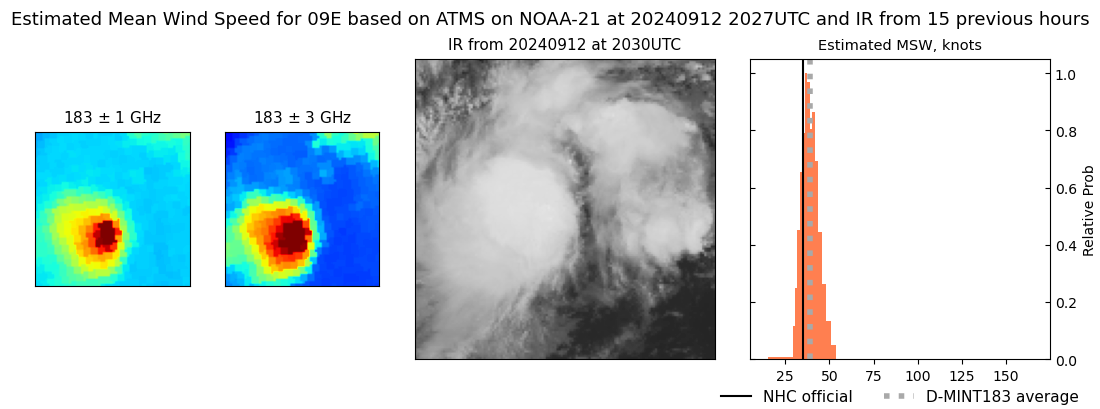 |
| 20240912 | 1448 UTC | GMI | 1000 hPa | 42 kts | 38 kts | 46 kts | 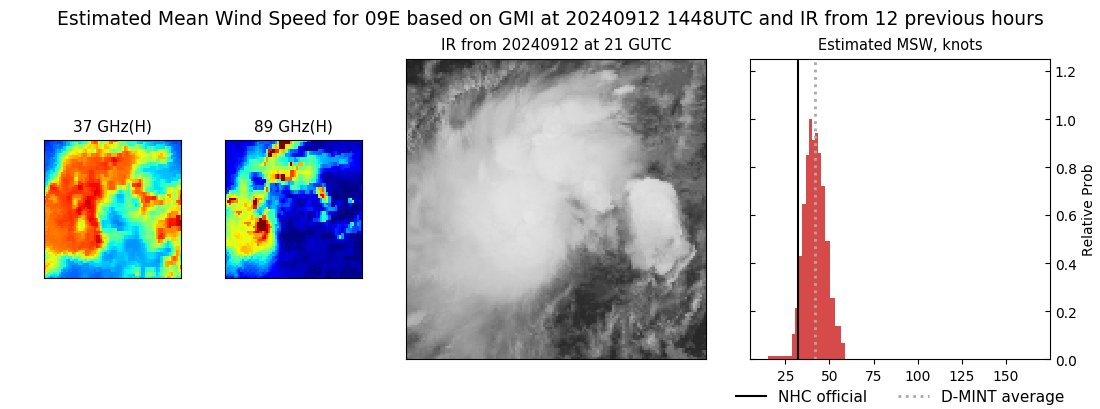 |
| 20240912 | 0241 UTC | TROPICS05 | 1002 hPa | 30 kts | 27 kts | 34 kts | 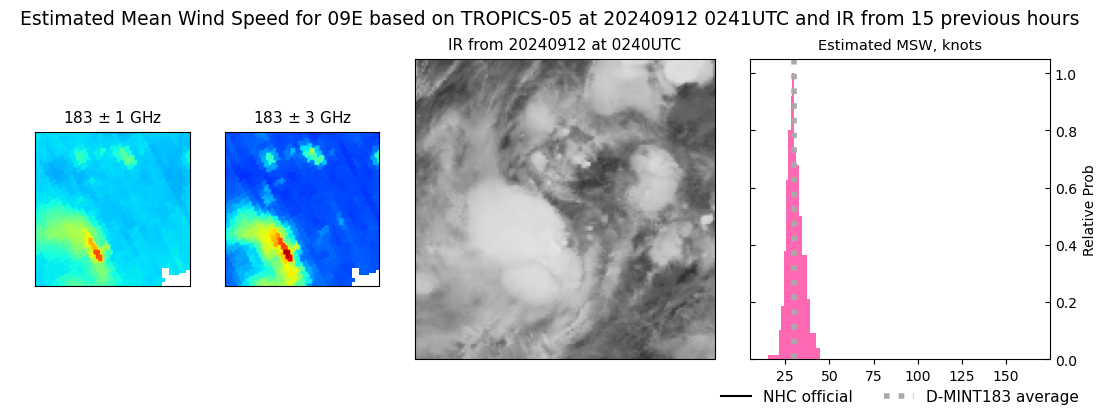 |
| 20240912 | 0222 UTC | TROPICS06 | 1002 hPa | 29 kts | 27 kts | 32 kts | 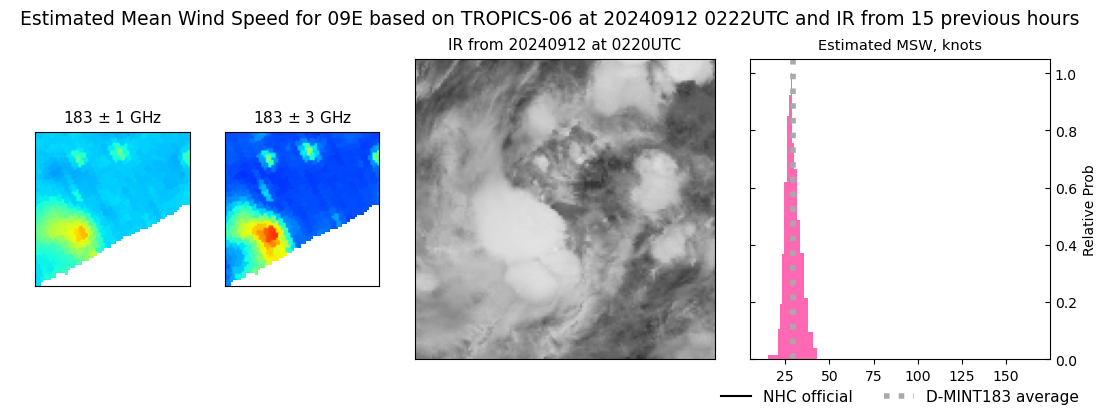 |
|
