|
Storm: 10L
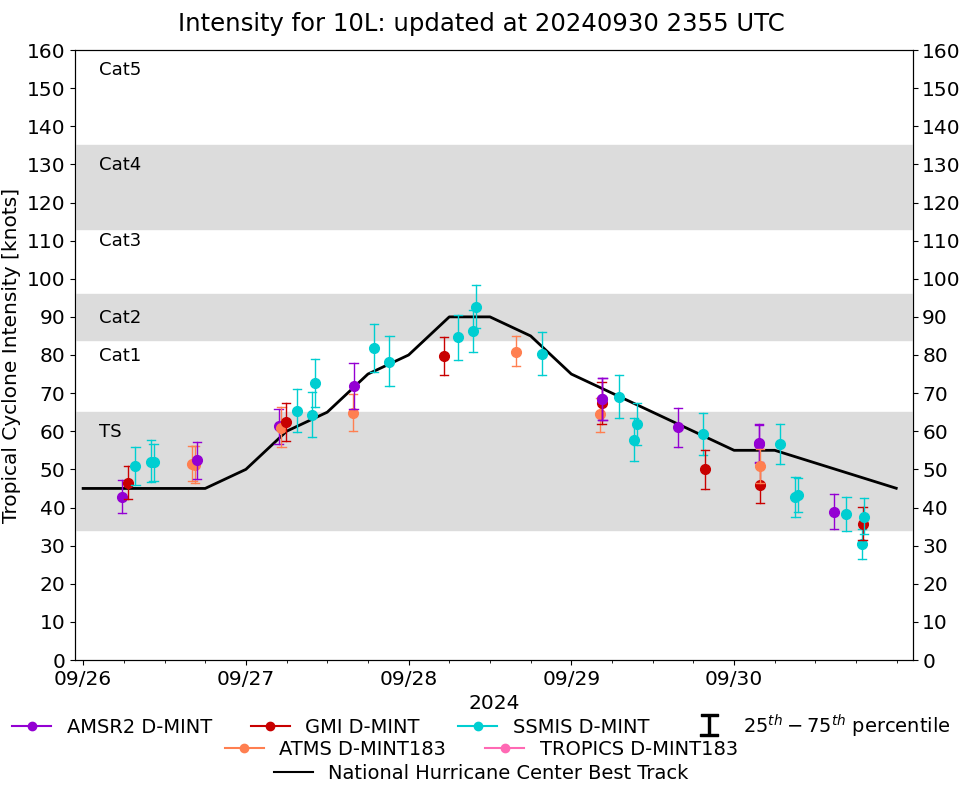
D-MINT HISTORY FILE for 2024_10L
| Date | Time | MW Sensor | MSLP | Vmax
(30th-70th percentile average) | Vmax
25th percentile | Vmax
75th percentile | Image |
| 20240930 | 1912 UTC | SSMISF17 | 1001 hPa | 38 kts | 33 kts | 43 kts | 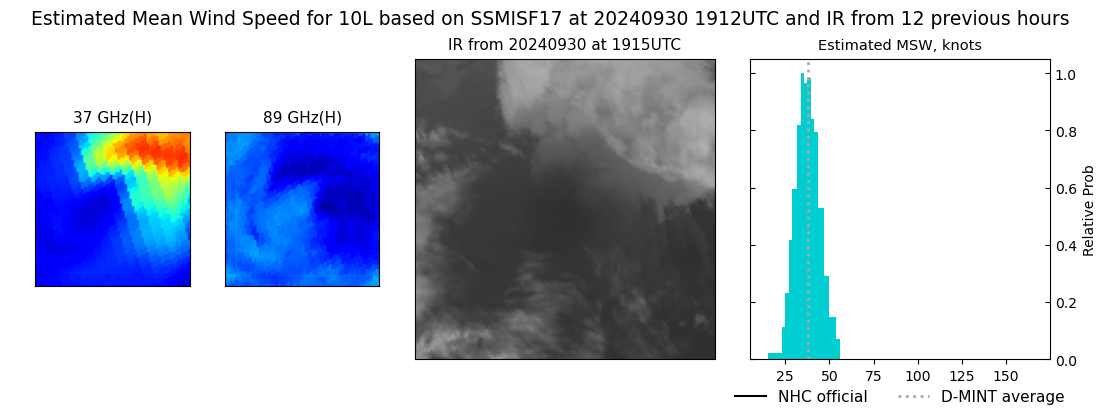 |
| 20240930 | 1858 UTC | GMI | 1001 hPa | 36 kts | 32 kts | 40 kts | 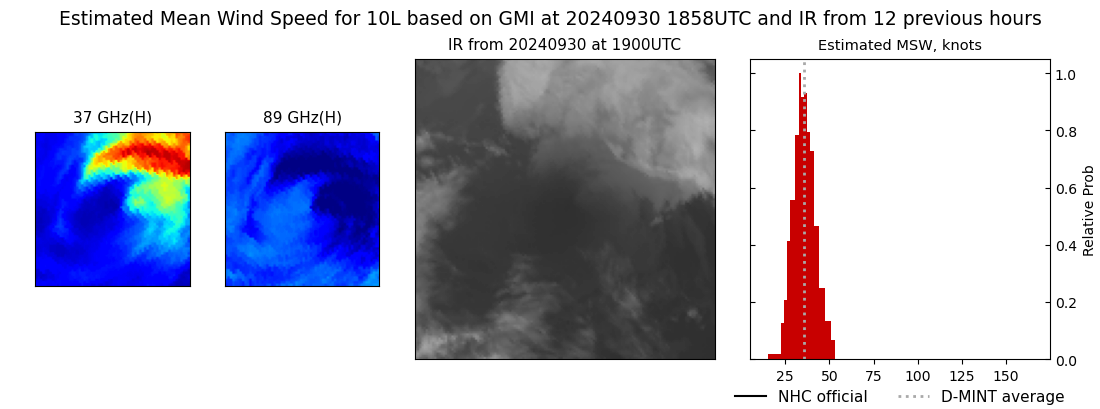 |
| 20240930 | 1850 UTC | SSMISF16 | 1000 hPa | 30 kts | 27 kts | 34 kts | 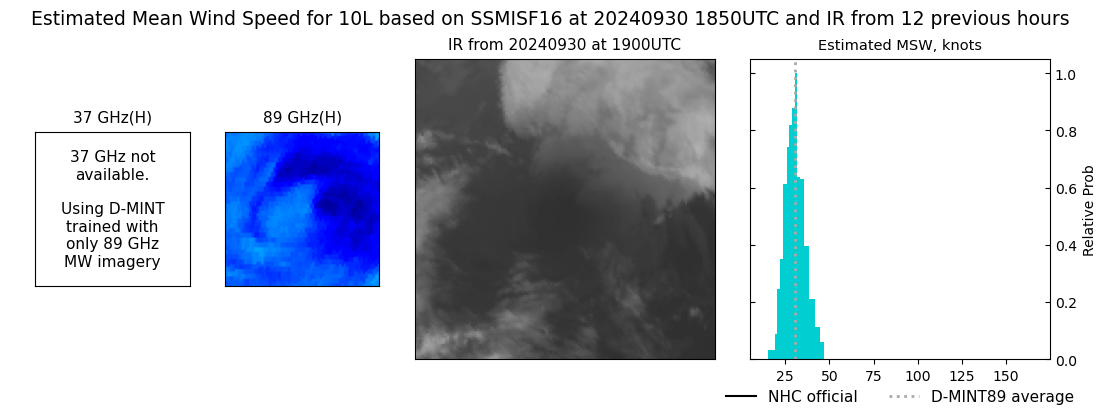 |
| 20240930 | 1634 UTC | SSMISF18 | 1000 hPa | 38 kts | 34 kts | 43 kts | 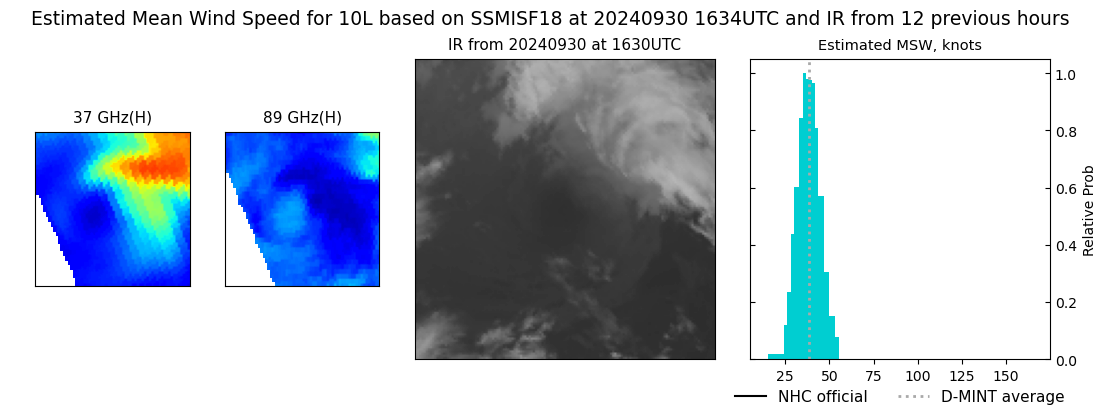 |
| 20240930 | 1447 UTC | AMSR2 | 995 hPa | 39 kts | 34 kts | 44 kts | 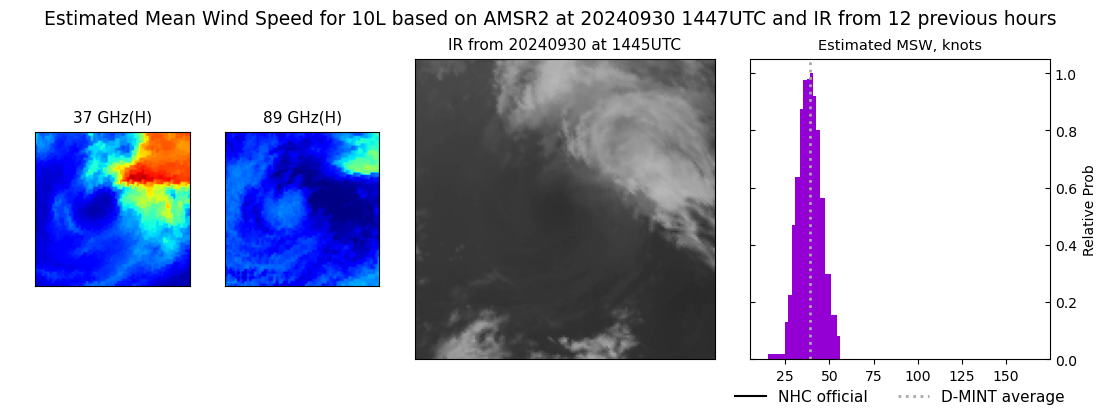 |
| 20240930 | 0926 UTC | SSMISF17 | 992 hPa | 43 kts | 39 kts | 48 kts | 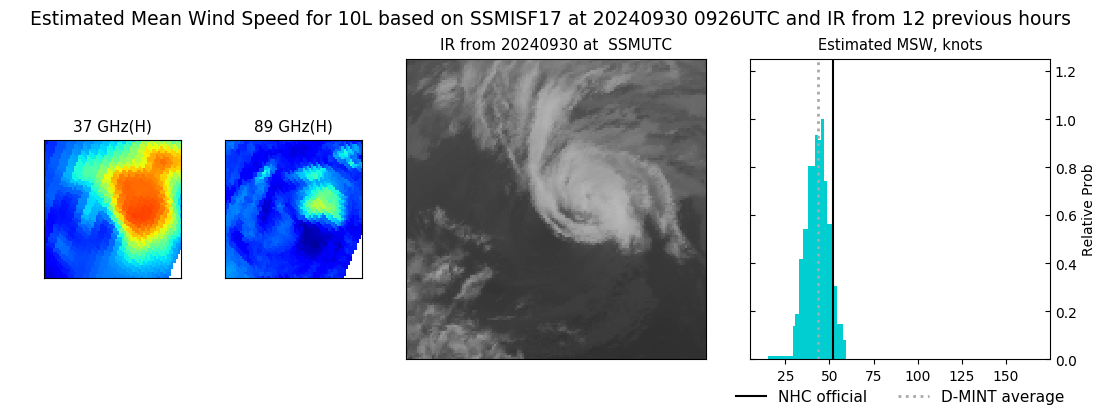 |
| 20240930 | 0903 UTC | SSMISF16 | 992 hPa | 43 kts | 38 kts | 48 kts | 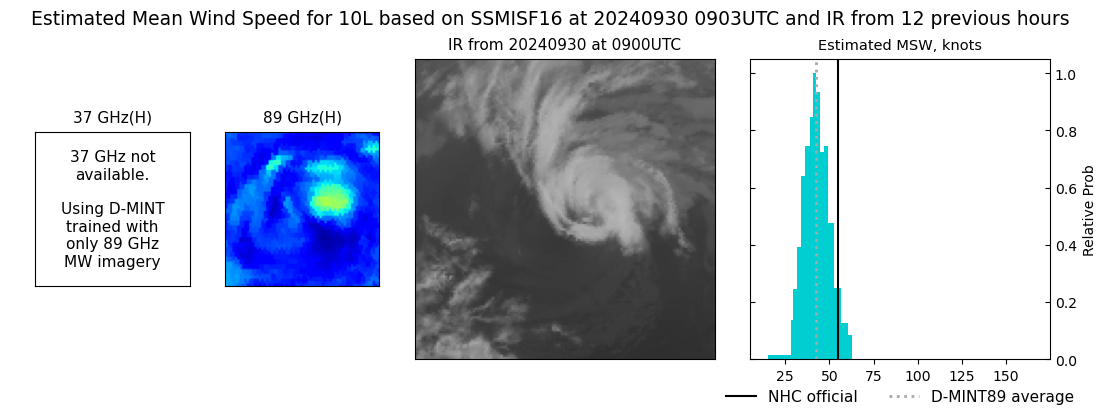 |
| 20240930 | 0646 UTC | SSMISF18 | 984 hPa | 57 kts | 51 kts | 62 kts | 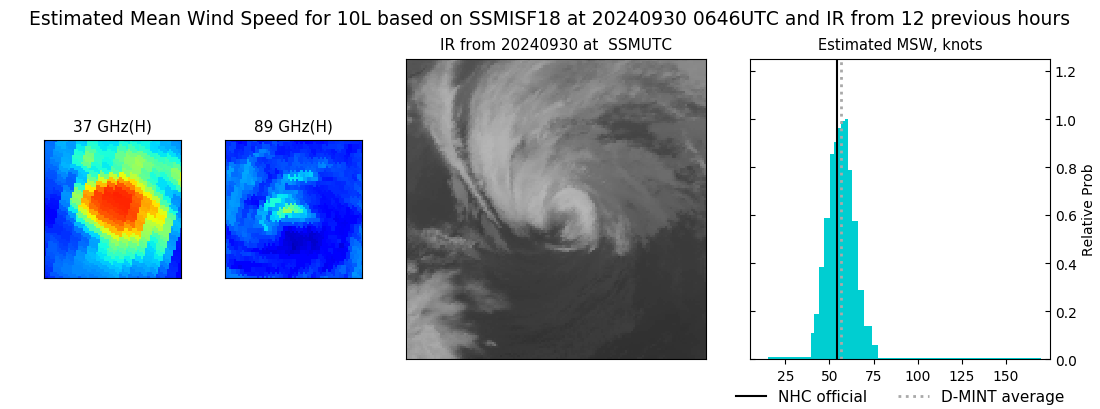 |
| 20240930 | 0351 UTC | ATMS-NPP | 989 hPa | 51 kts | 46 kts | 55 kts | 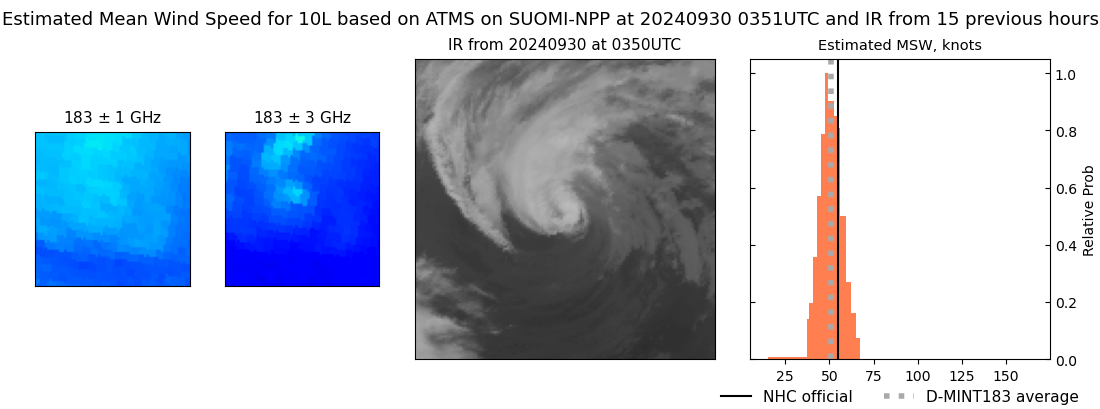 |
| 20240930 | 0348 UTC | GMI | 992 hPa | 46 kts | 41 kts | 51 kts | 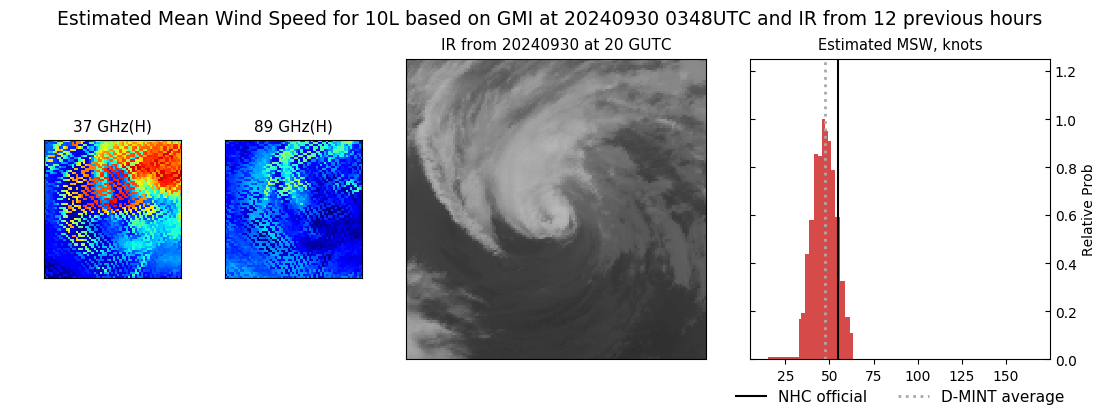 |
| 20240930 | 0340 UTC | AMSR2 | 987 hPa | 57 kts | 52 kts | 62 kts | 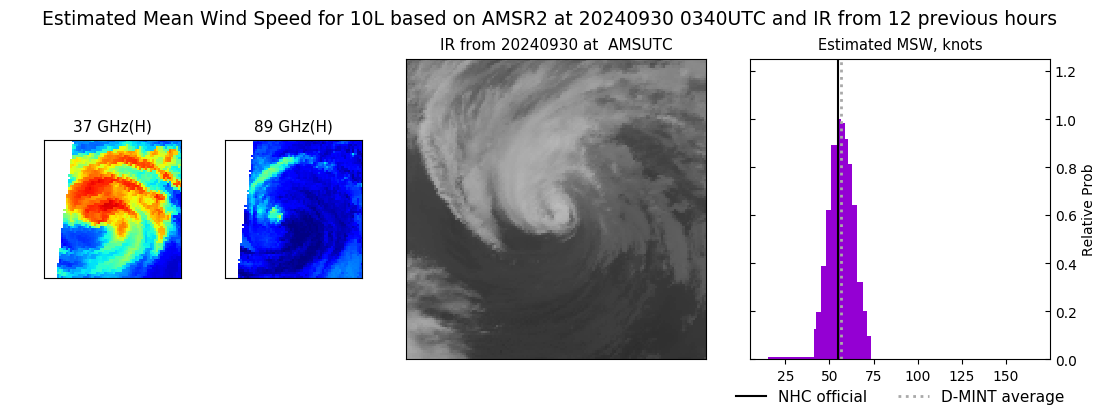 |
| 20240930 | 0340 UTC | AMSR2 | 987 hPa | 57 kts | 52 kts | 62 kts | 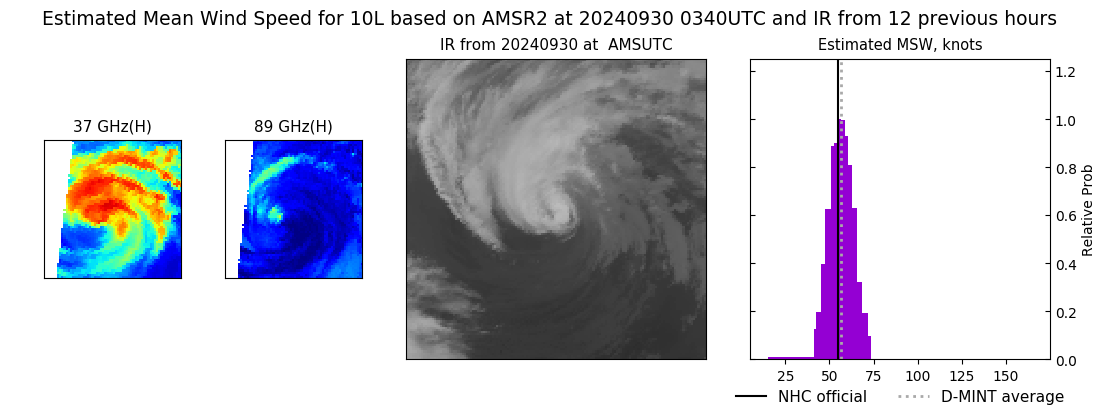 |
| 20240929 | 1943 UTC | GMI | 992 hPa | 50 kts | 45 kts | 55 kts | 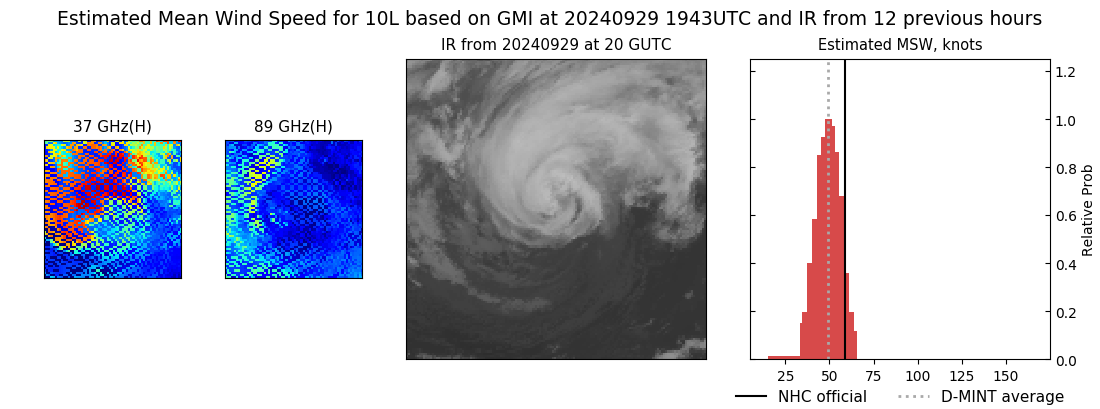 |
| 20240929 | 1927 UTC | SSMISF17 | 987 hPa | 59 kts | 54 kts | 65 kts | 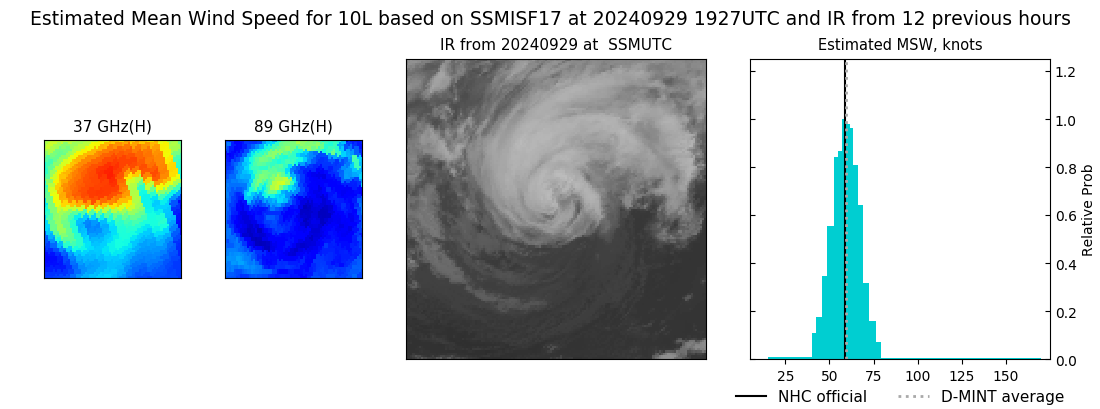 |
| 20240929 | 1542 UTC | AMSR2 | 980 hPa | 61 kts | 56 kts | 66 kts | 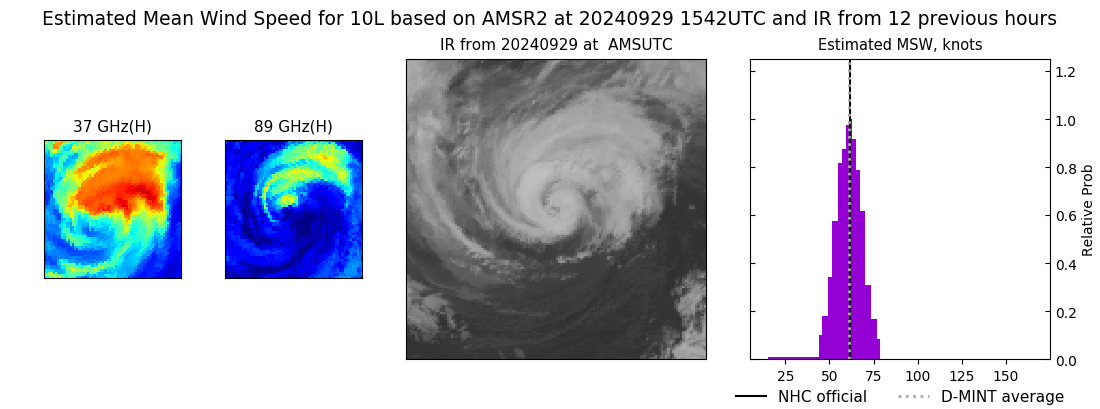 |
| 20240929 | 0941 UTC | SSMISF17 | 980 hPa | 62 kts | 56 kts | 67 kts | 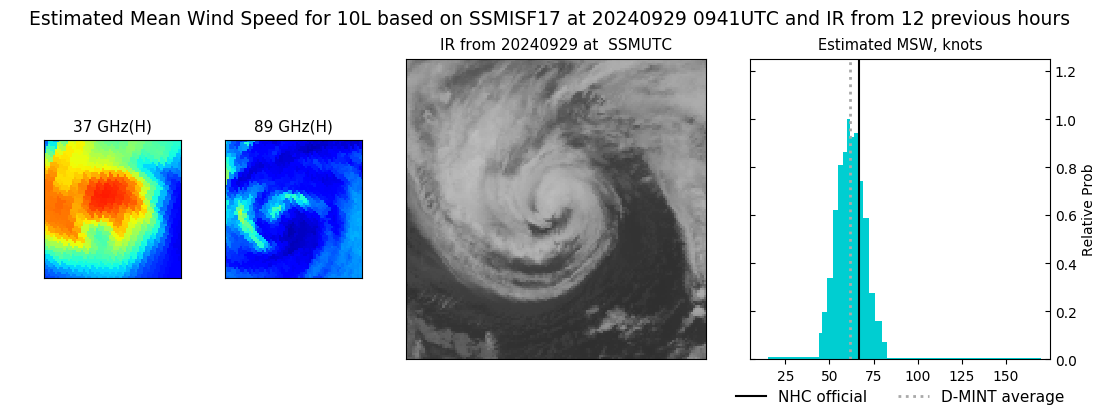 |
| 20240929 | 0917 UTC | SSMISF16 | 981 hPa | 58 kts | 52 kts | 63 kts | 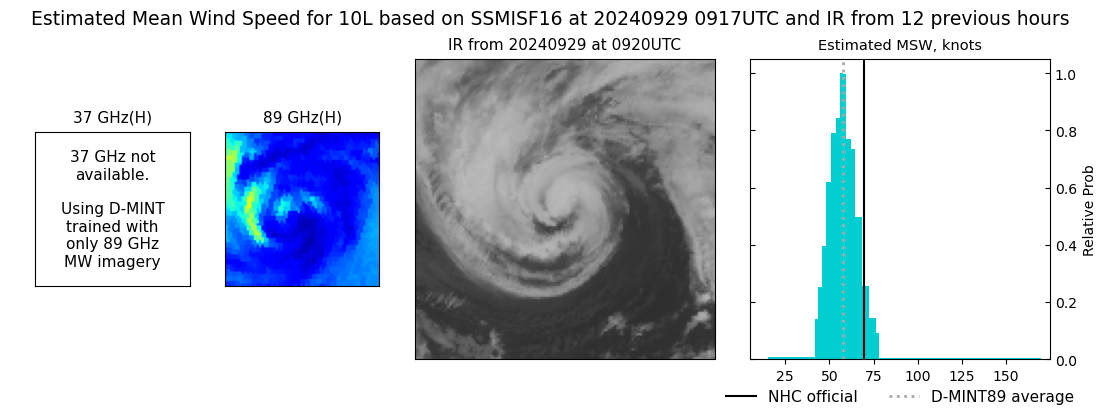 |
| 20240929 | 0700 UTC | SSMISF18 | 978 hPa | 69 kts | 64 kts | 75 kts | 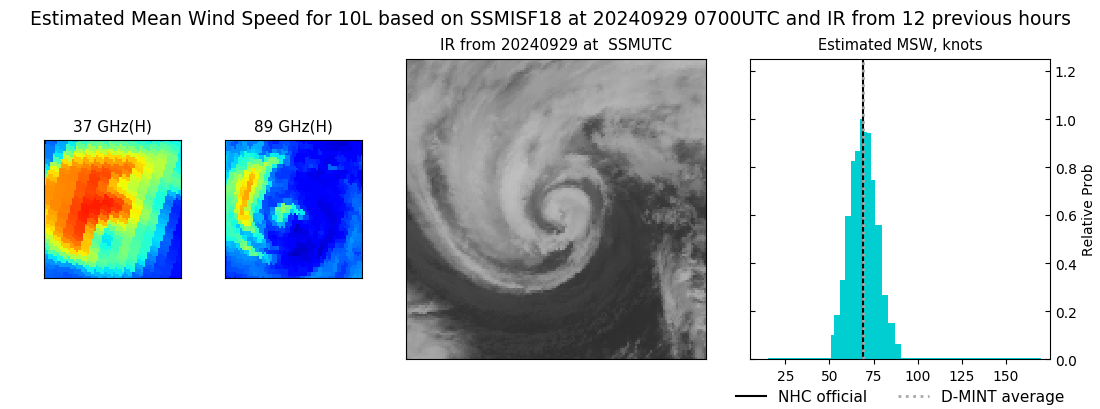 |
| 20240929 | 0435 UTC | AMSR2 | 969 hPa | 68 kts | 63 kts | 74 kts | 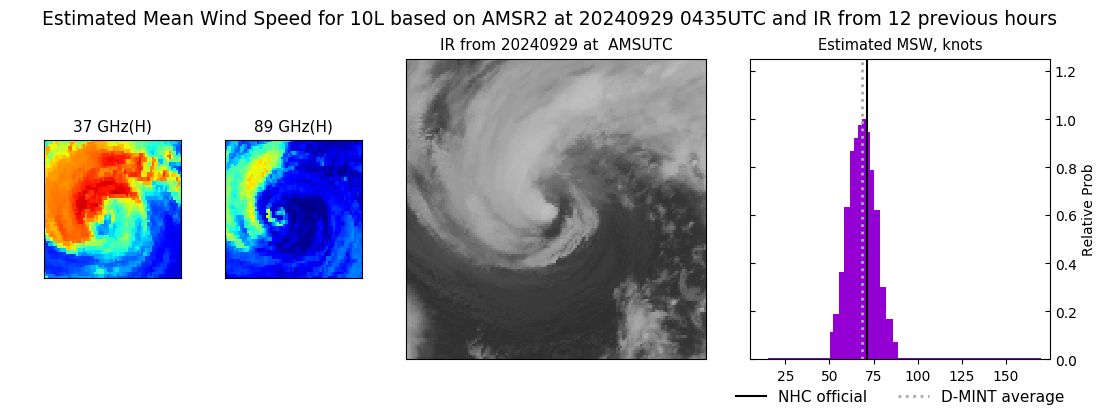 |
| 20240929 | 0435 UTC | AMSR2 | 969 hPa | 68 kts | 63 kts | 74 kts | 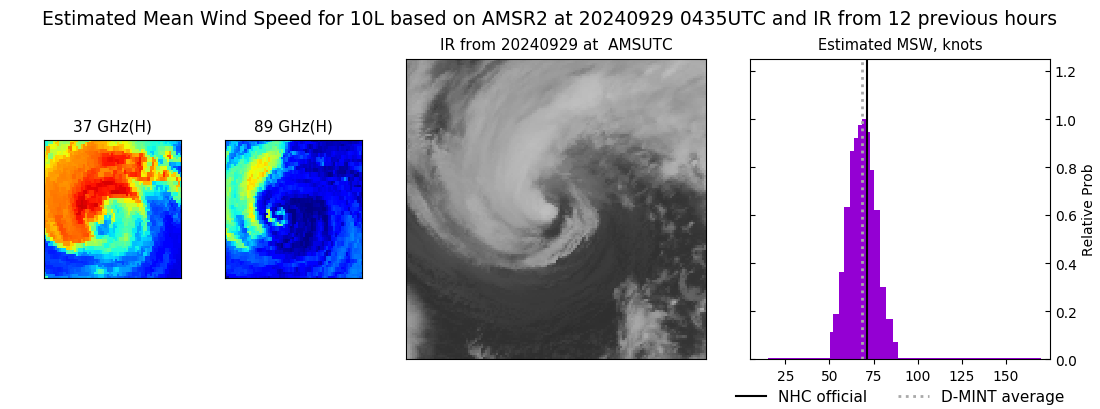 |
| 20240929 | 0428 UTC | GMI | 970 hPa | 67 kts | 62 kts | 73 kts | 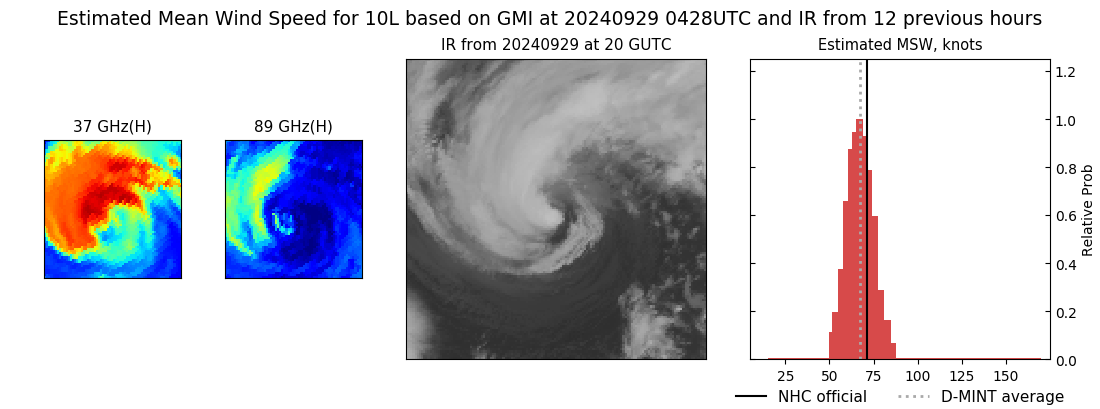 |
| 20240929 | 0412 UTC | ATMS-NPP | 974 hPa | 64 kts | 60 kts | 69 kts | 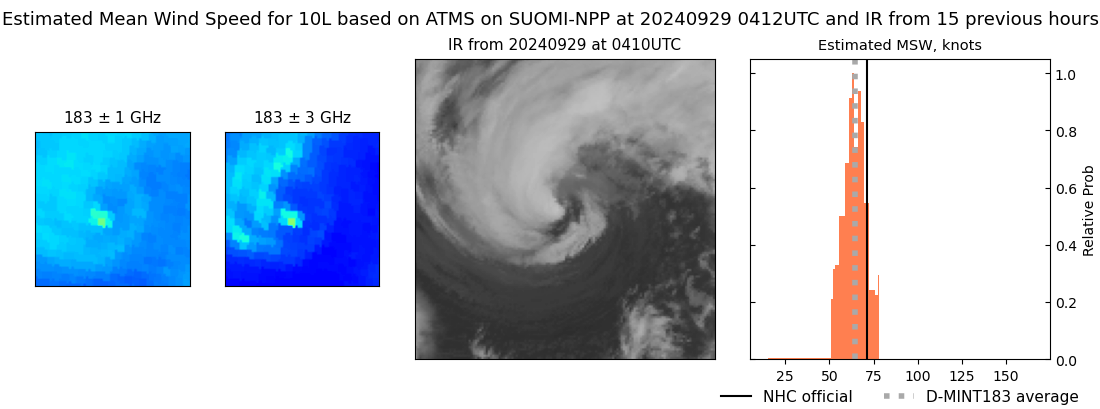 |
| 20240928 | 1940 UTC | SSMISF17 | 964 hPa | 80 kts | 75 kts | 86 kts | 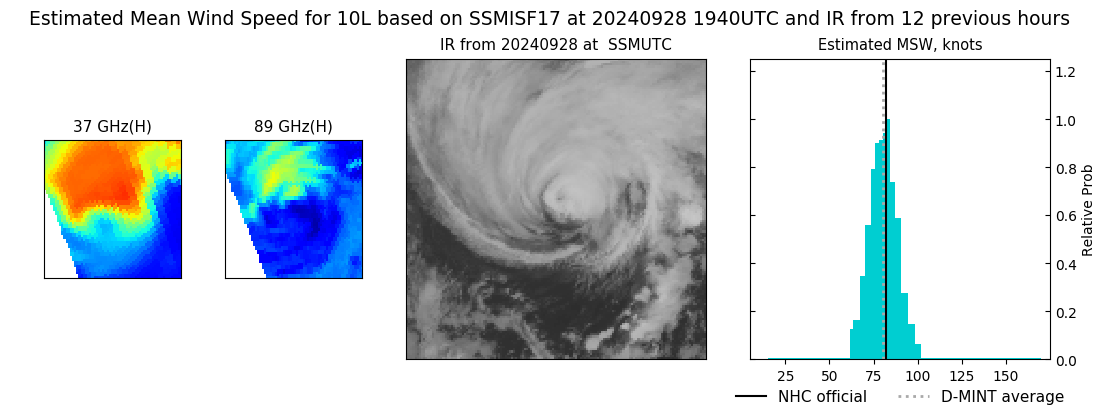 |
| 20240928 | 1553 UTC | ATMS-NPP | 971 hPa | 81 kts | 77 kts | 85 kts | 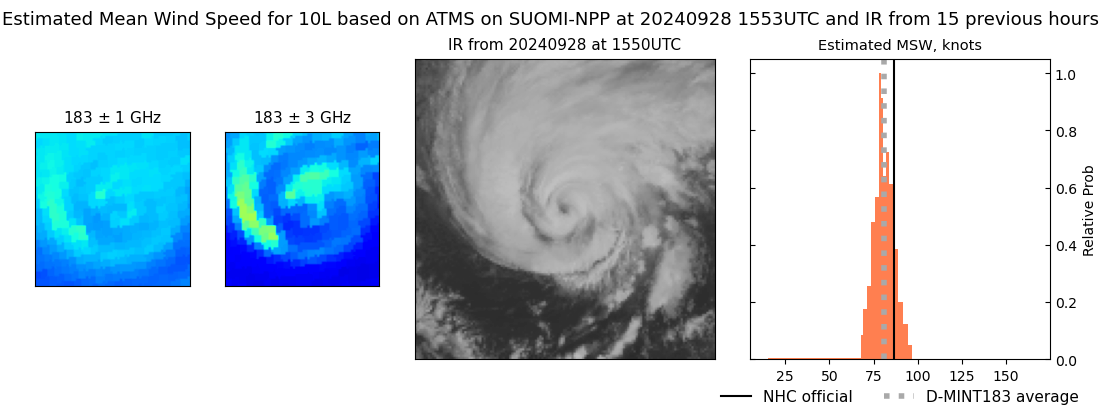 |
| 20240928 | 0956 UTC | SSMISF17 | 969 hPa | 93 kts | 87 kts | 98 kts | 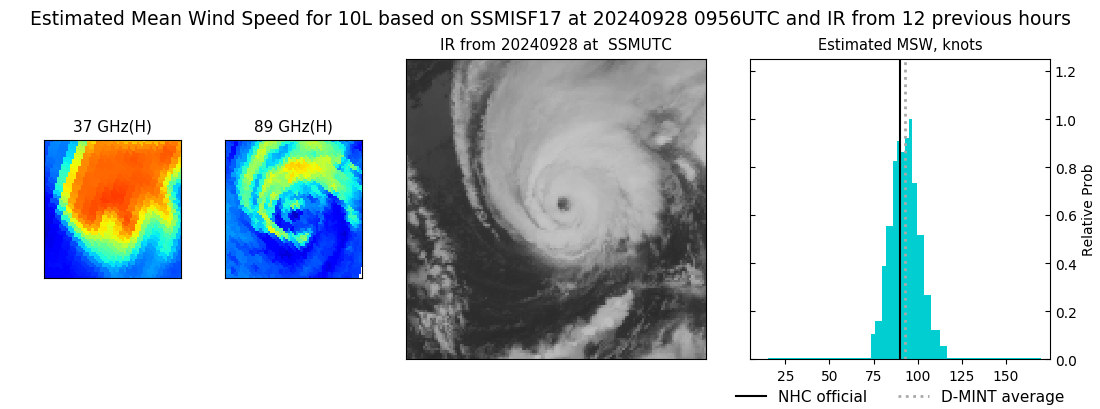 |
| 20240928 | 0932 UTC | SSMISF16 | 973 hPa | 86 kts | 81 kts | 92 kts | 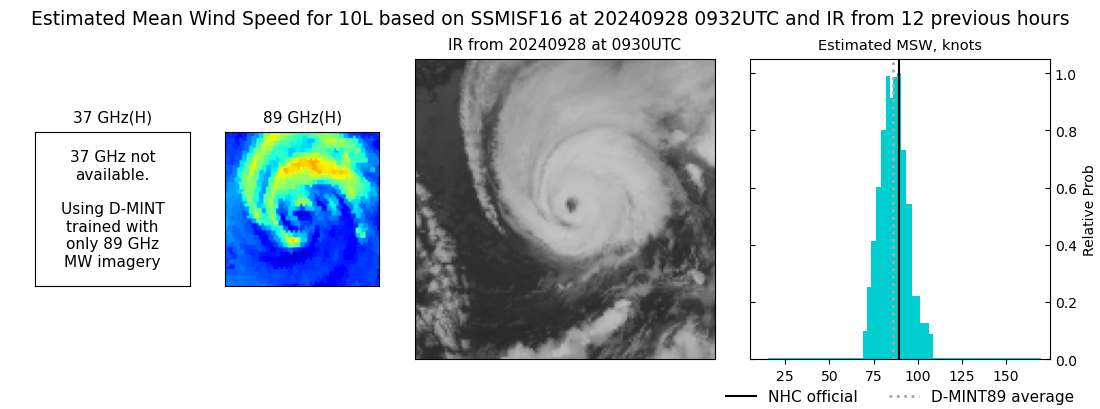 |
| 20240928 | 0715 UTC | SSMISF18 | 974 hPa | 85 kts | 79 kts | 91 kts | 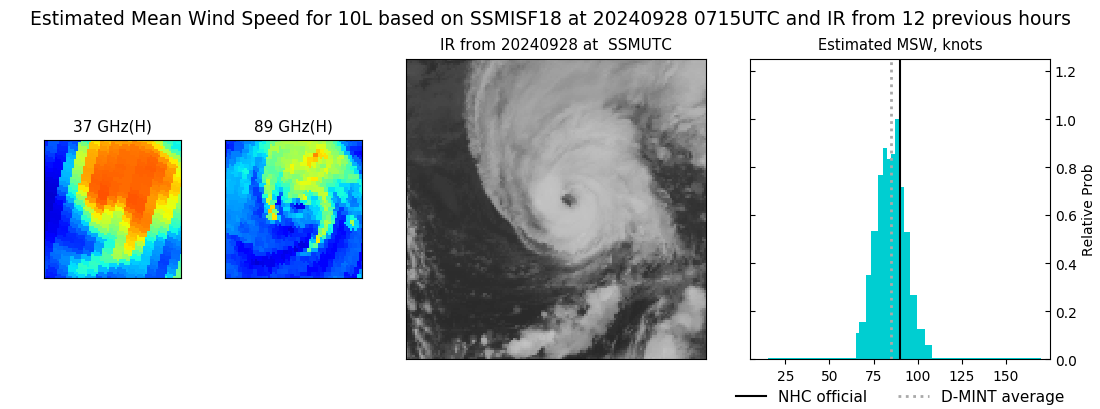 |
| 20240928 | 0513 UTC | GMI | 971 hPa | 80 kts | 75 kts | 85 kts |  |
| 20240927 | 2110 UTC | SSMISF16 | 979 hPa | 78 kts | 72 kts | 85 kts | 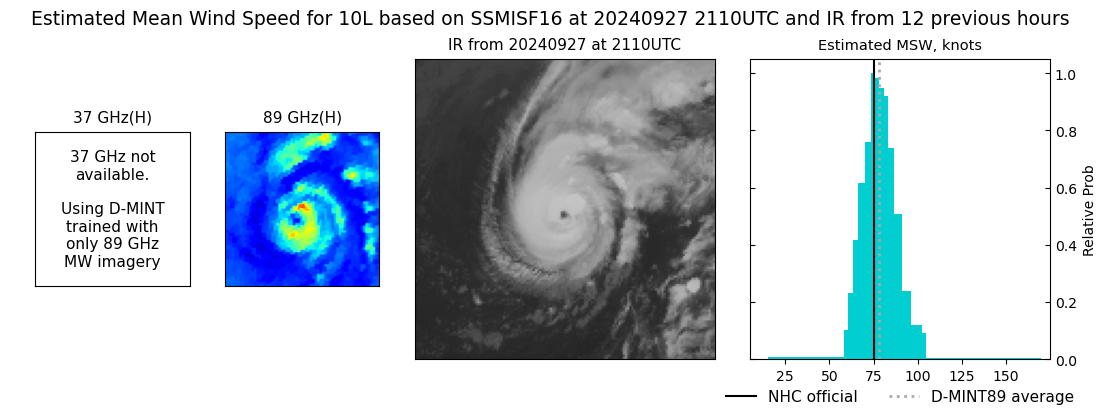 |
| 20240927 | 1853 UTC | SSMISF18 | 981 hPa | 82 kts | 76 kts | 88 kts | 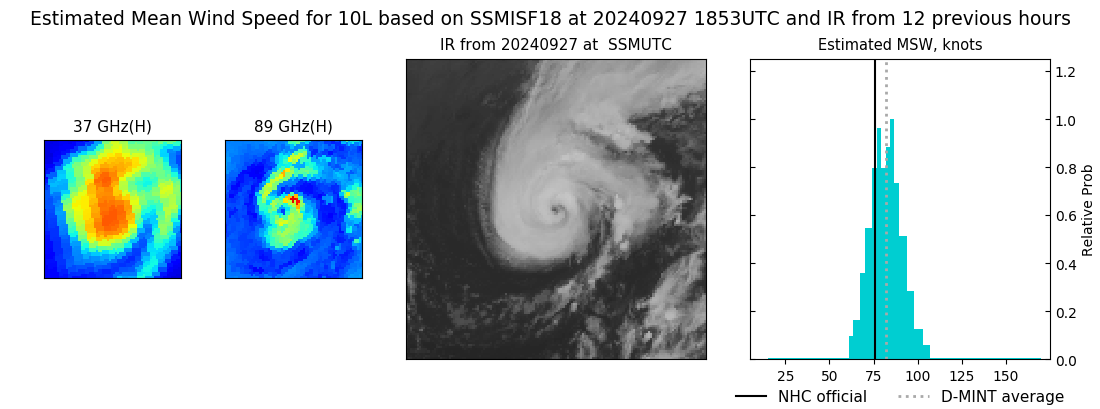 |
| 20240927 | 1553 UTC | AMSR2 | 980 hPa | 72 kts | 66 kts | 78 kts | 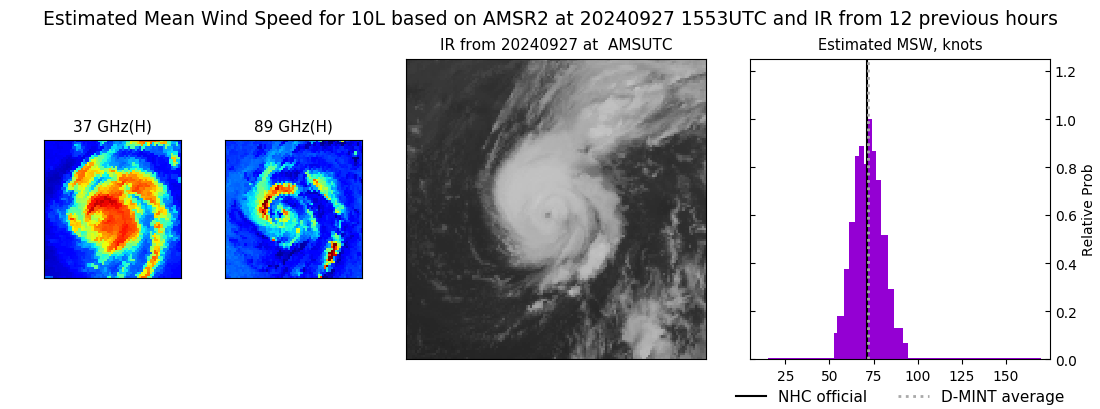 |
| 20240927 | 1548 UTC | ATMS-N21 | 989 hPa | 65 kts | 60 kts | 70 kts | 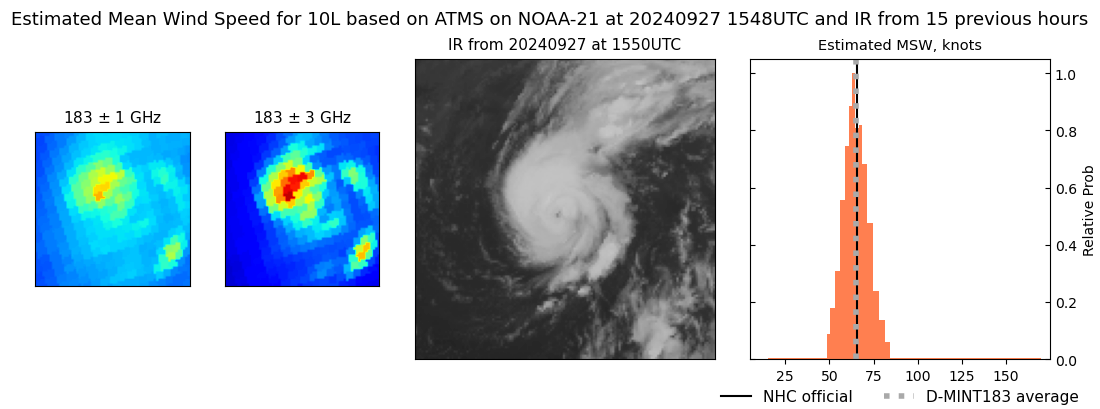 |
| 20240927 | 1010 UTC | SSMISF17 | 989 hPa | 73 kts | 66 kts | 79 kts | 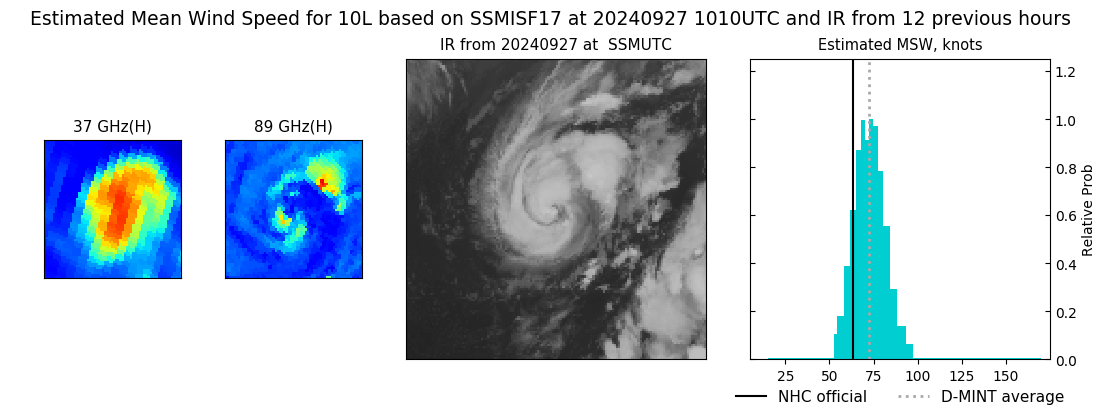 |
| 20240927 | 0946 UTC | SSMISF16 | 989 hPa | 64 kts | 58 kts | 70 kts | 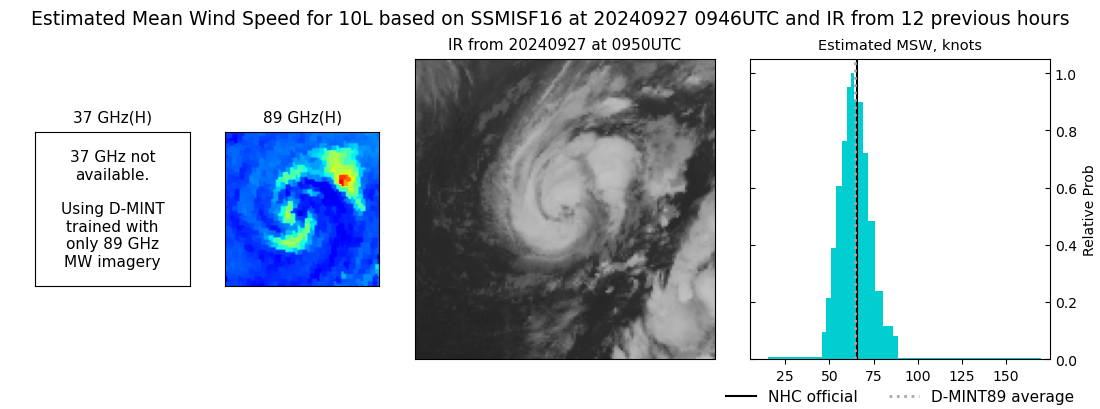 |
| 20240927 | 0730 UTC | SSMISF18 | 990 hPa | 65 kts | 60 kts | 71 kts | 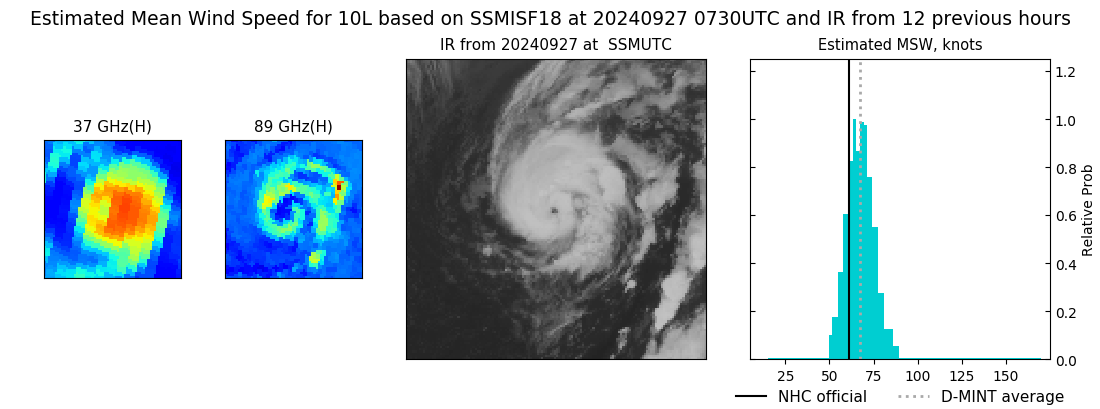 |
| 20240927 | 0553 UTC | GMI | 987 hPa | 62 kts | 58 kts | 67 kts | 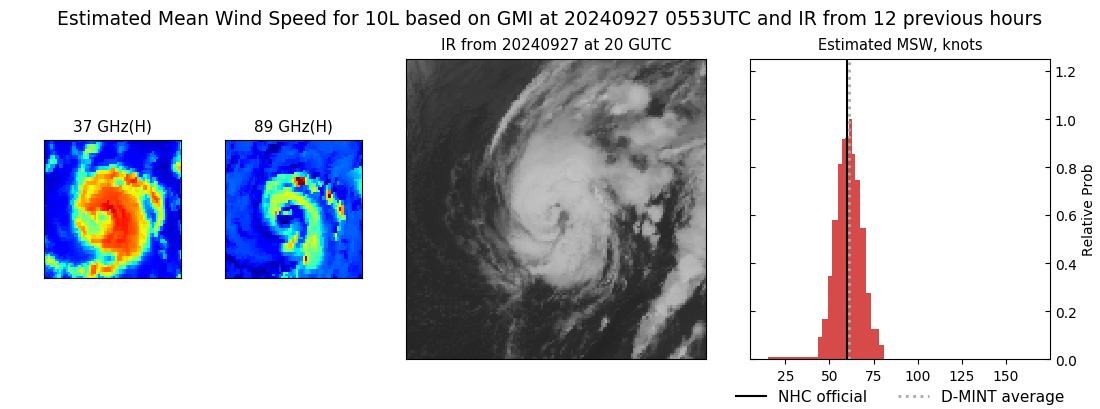 |
| 20240927 | 0514 UTC | ATMS-N20 | 988 hPa | 61 kts | 56 kts | 66 kts | 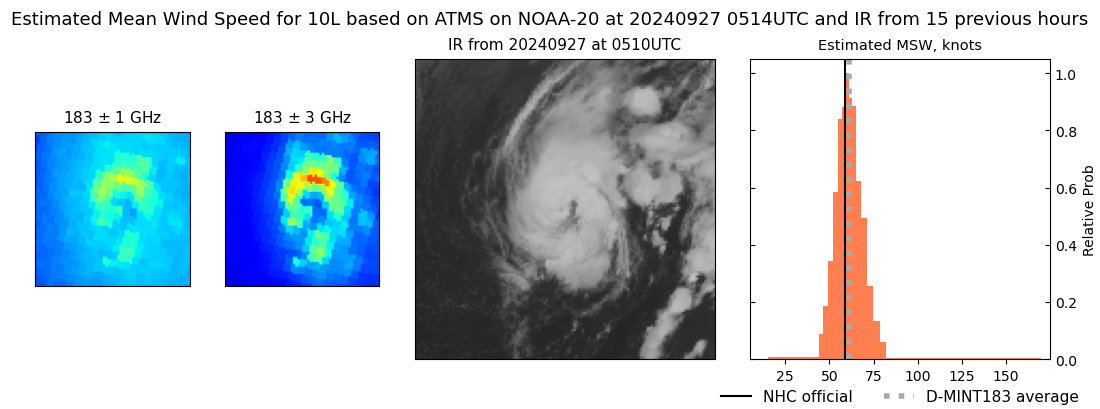 |
| 20240927 | 0450 UTC | AMSR2 | 987 hPa | 61 kts | 57 kts | 66 kts | 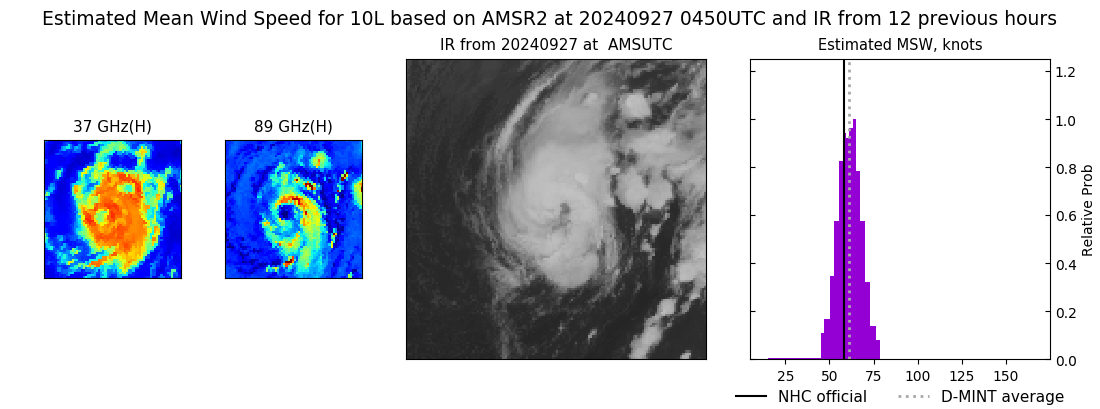 |
| 20240926 | 1648 UTC | AMSR2 | 992 hPa | 52 kts | 48 kts | 57 kts | 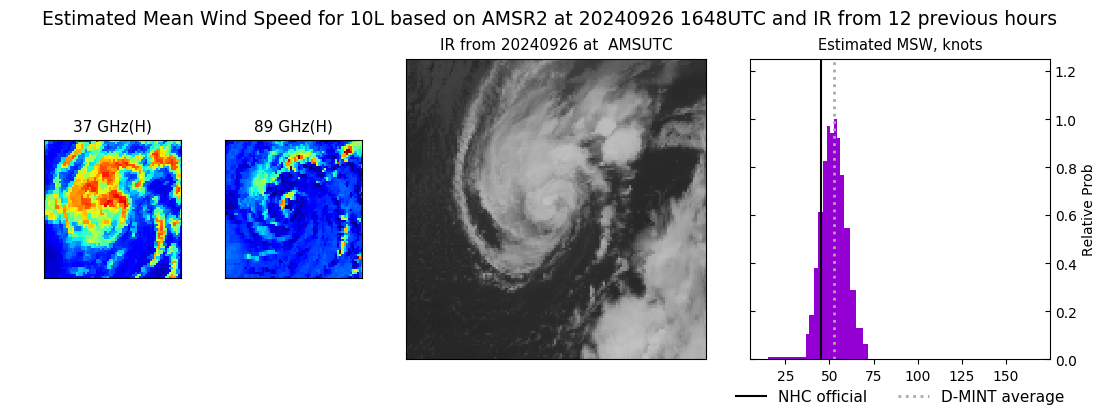 |
| 20240926 | 1631 UTC | ATMS-NPP | 1000 hPa | 51 kts | 46 kts | 56 kts | 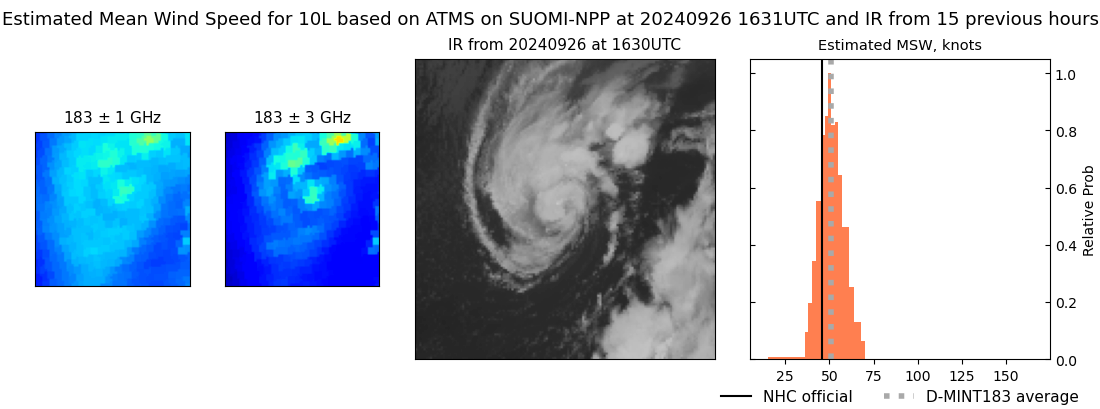 |
| 20240926 | 1607 UTC | ATMS-N21 | 997 hPa | 51 kts | 47 kts | 56 kts | 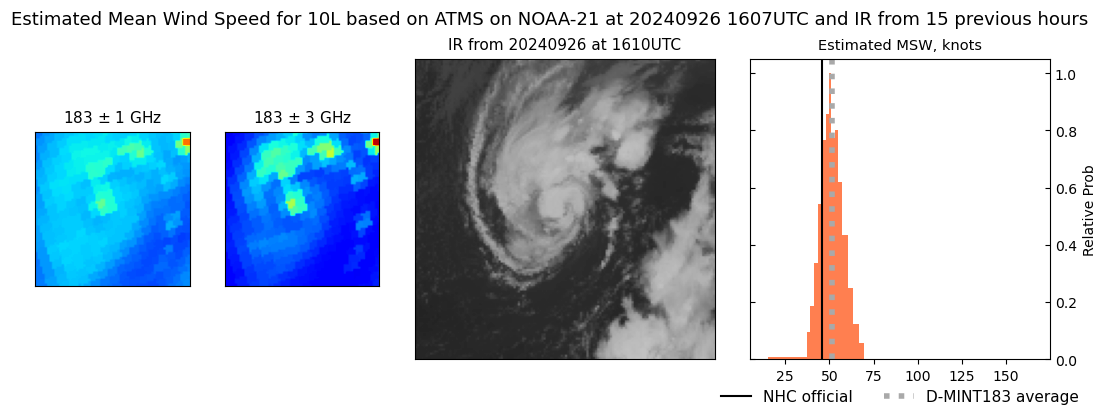 |
| 20240926 | 1024 UTC | SSMISF17 | 996 hPa | 52 kts | 47 kts | 57 kts | 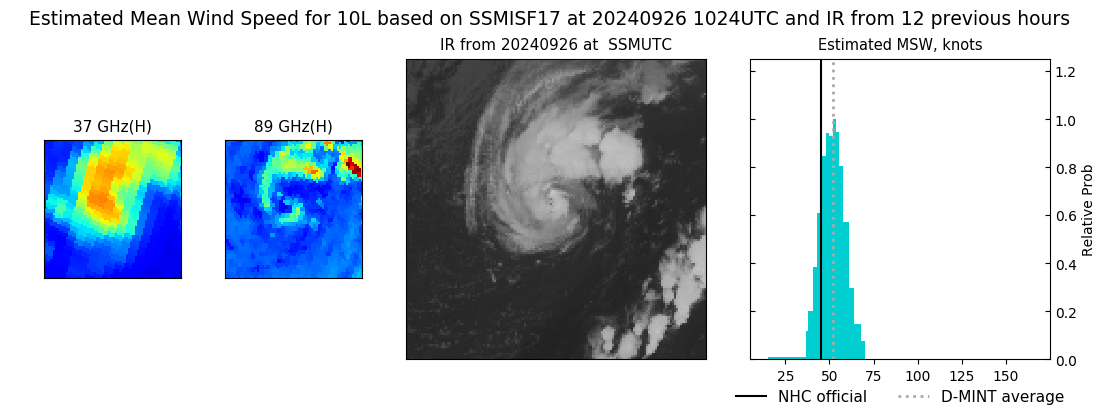 |
| 20240926 | 1000 UTC | SSMISF16 | 995 hPa | 52 kts | 47 kts | 58 kts | 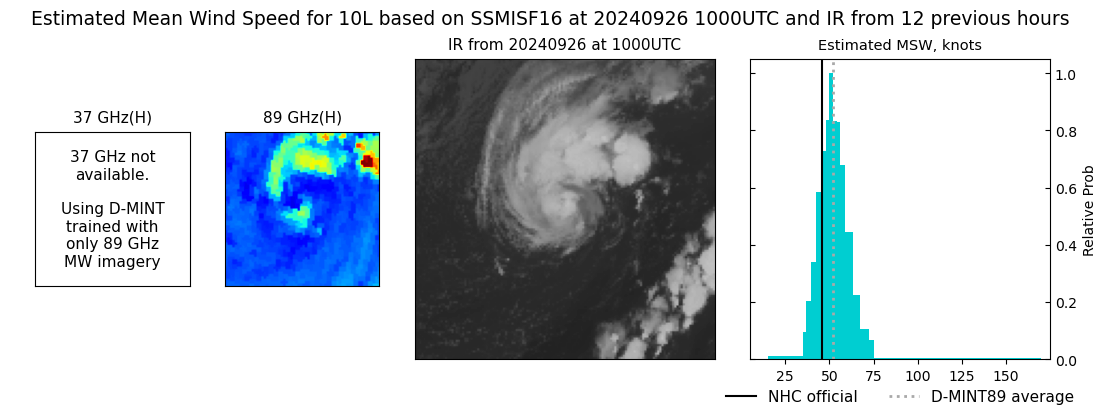 |
| 20240926 | 0743 UTC | SSMISF18 | 998 hPa | 51 kts | 46 kts | 56 kts | 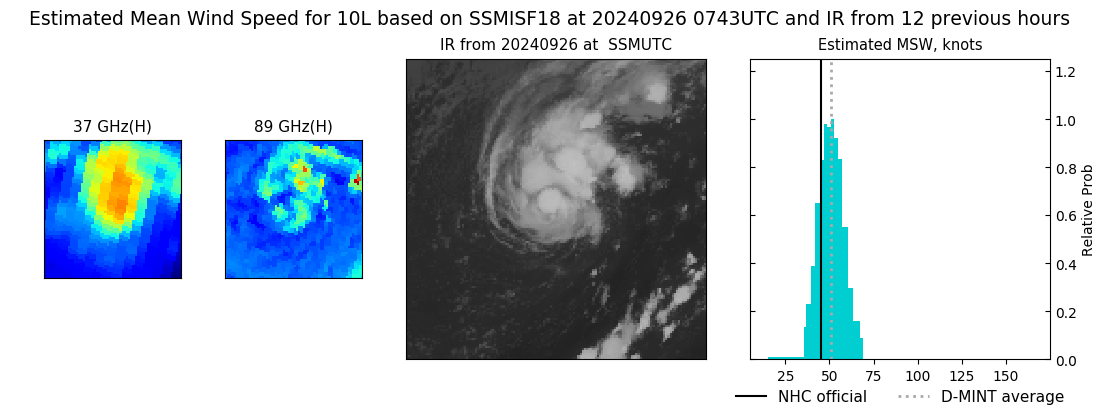 |
| 20240926 | 0638 UTC | GMI | 995 hPa | 46 kts | 42 kts | 51 kts | 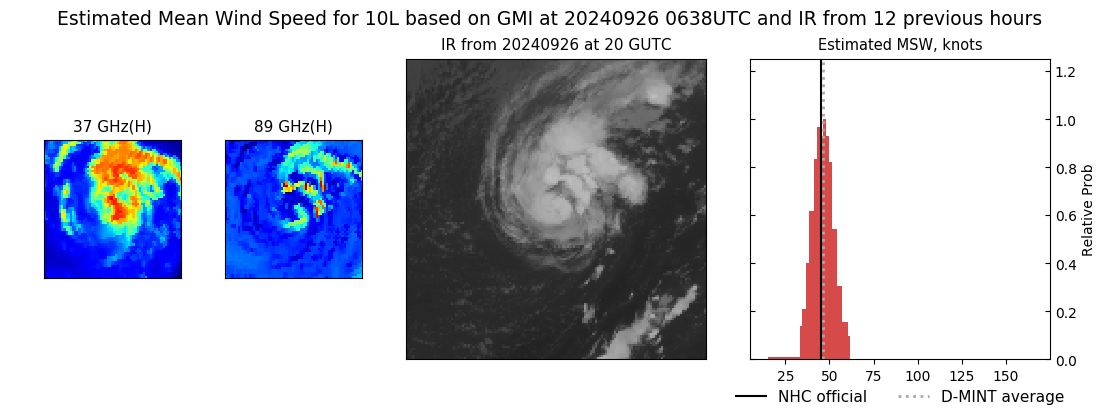 |
| 20240926 | 0545 UTC | AMSR2 | 996 hPa | 43 kts | 39 kts | 47 kts | 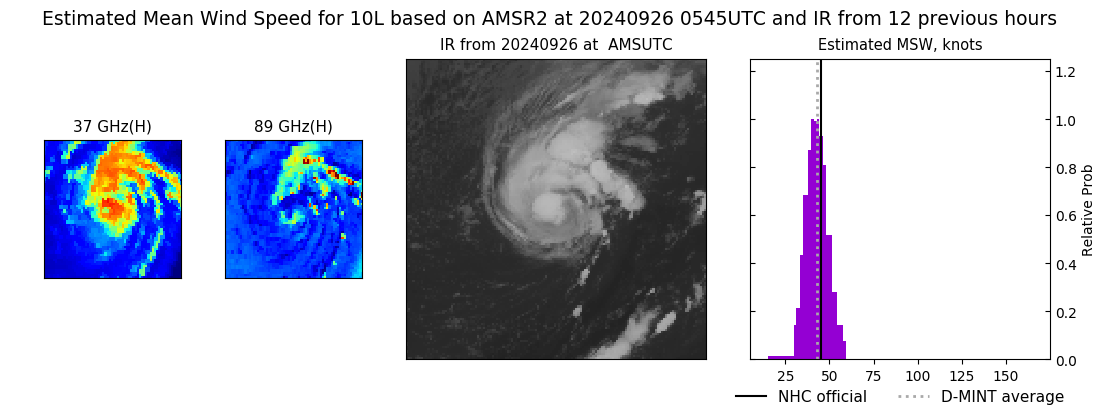 |
| 20240925 | 2203 UTC | SSMISF17 | NaN hPa | 38 kts | 34 kts | 42 kts | 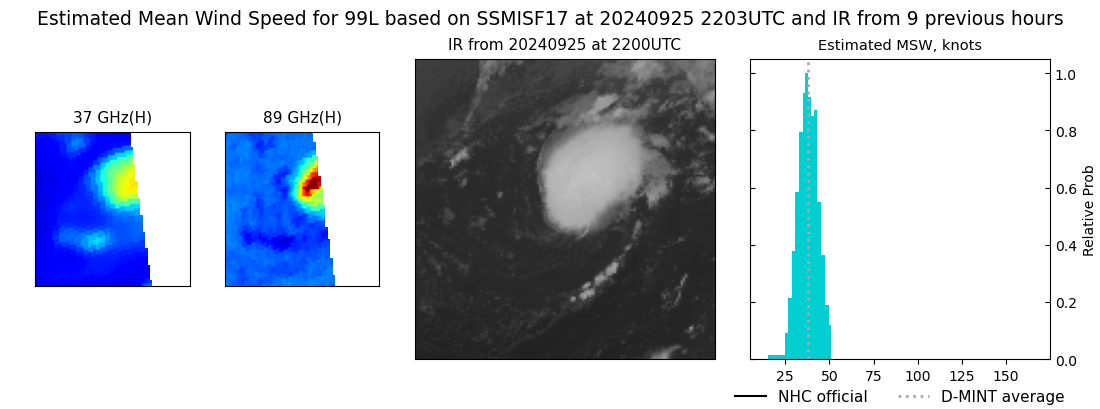 |
| 20240925 | 2137 UTC | SSMISF16 | NaN hPa | 37 kts | 32 kts | 42 kts | 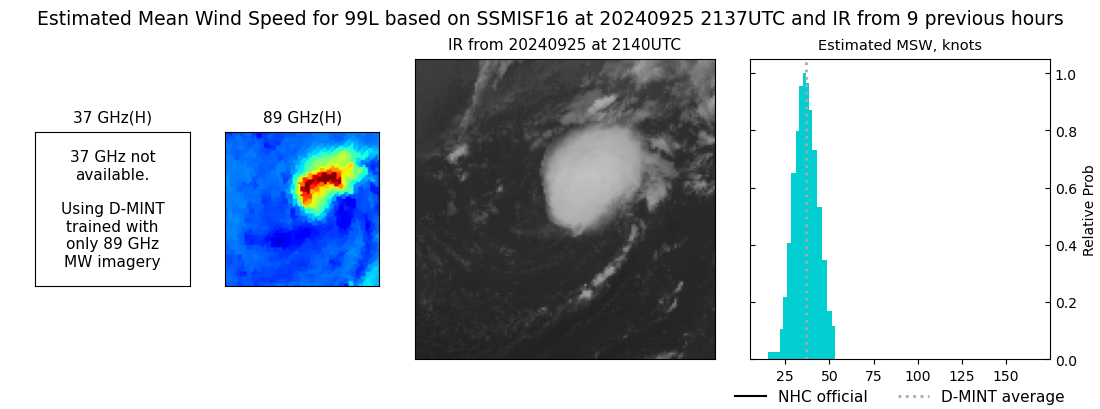 |
| 20240925 | 1920 UTC | SSMISF18 | NaN hPa | 46 kts | 41 kts | 50 kts | 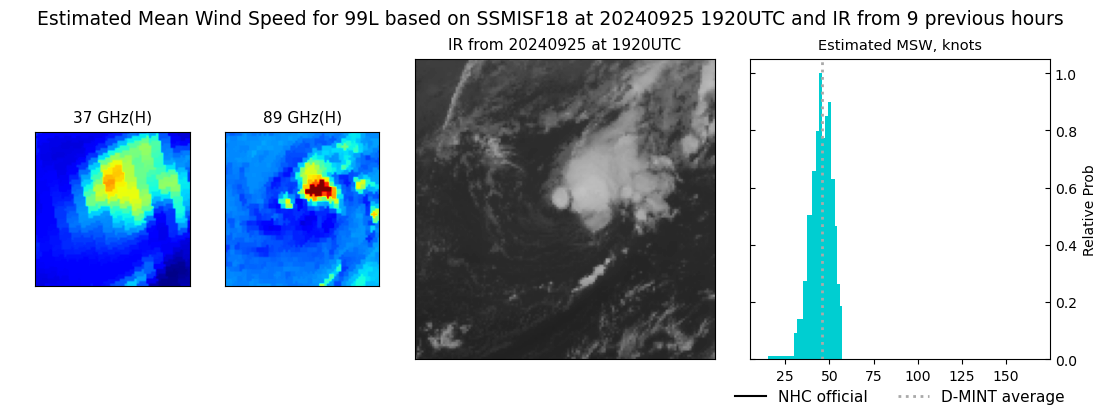 |
| 20240925 | 1039 UTC | SSMISF17 | NaN hPa | 42 kts | 37 kts | 47 kts | 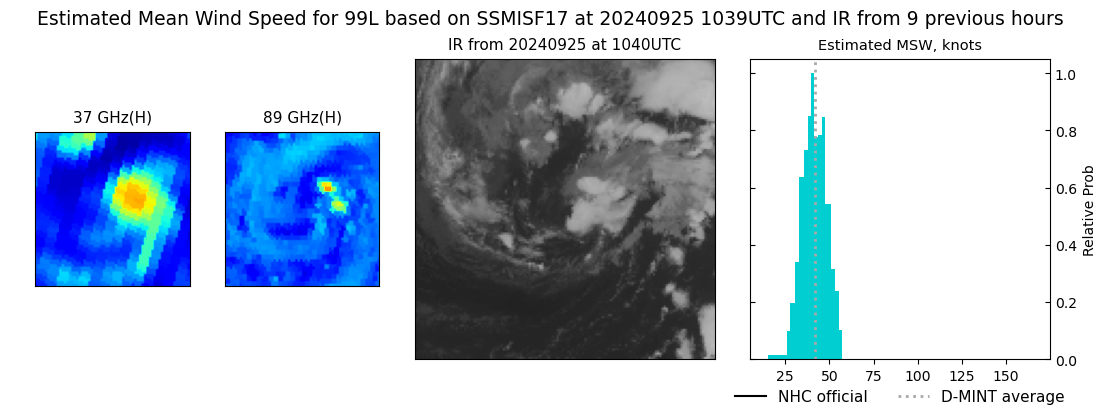 |
| 20240925 | 1014 UTC | SSMISF16 | NaN hPa | 38 kts | 33 kts | 43 kts | 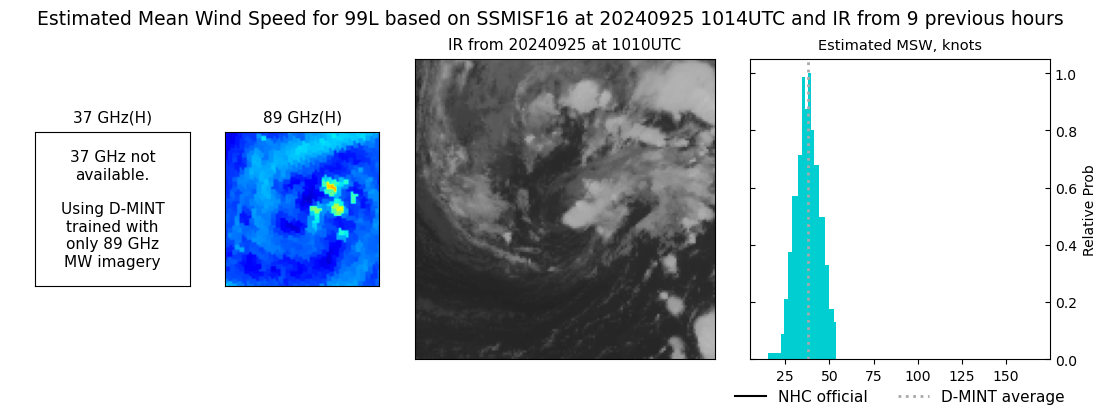 |
| 20240925 | 0757 UTC | SSMISF18 | NaN hPa | 44 kts | 40 kts | 49 kts | 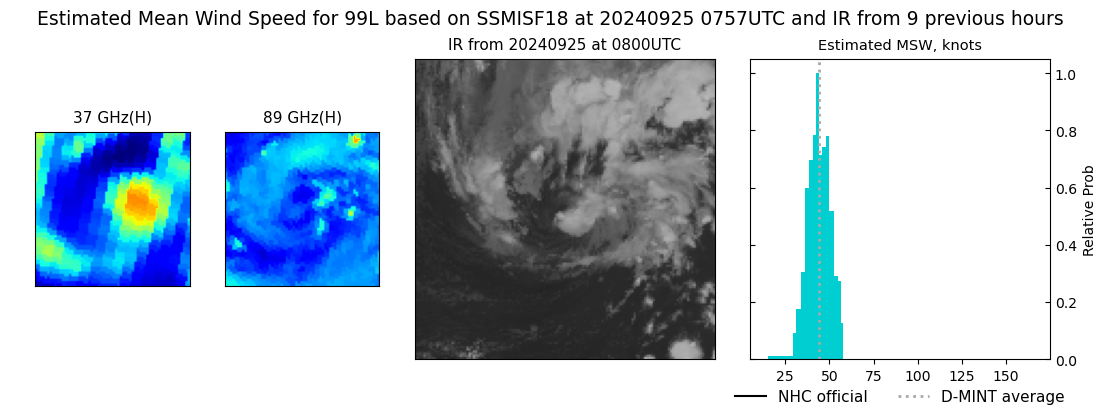 |
| 20240925 | 0723 UTC | GMI | NaN hPa | 42 kts | 37 kts | 48 kts |  |
|
