|
||

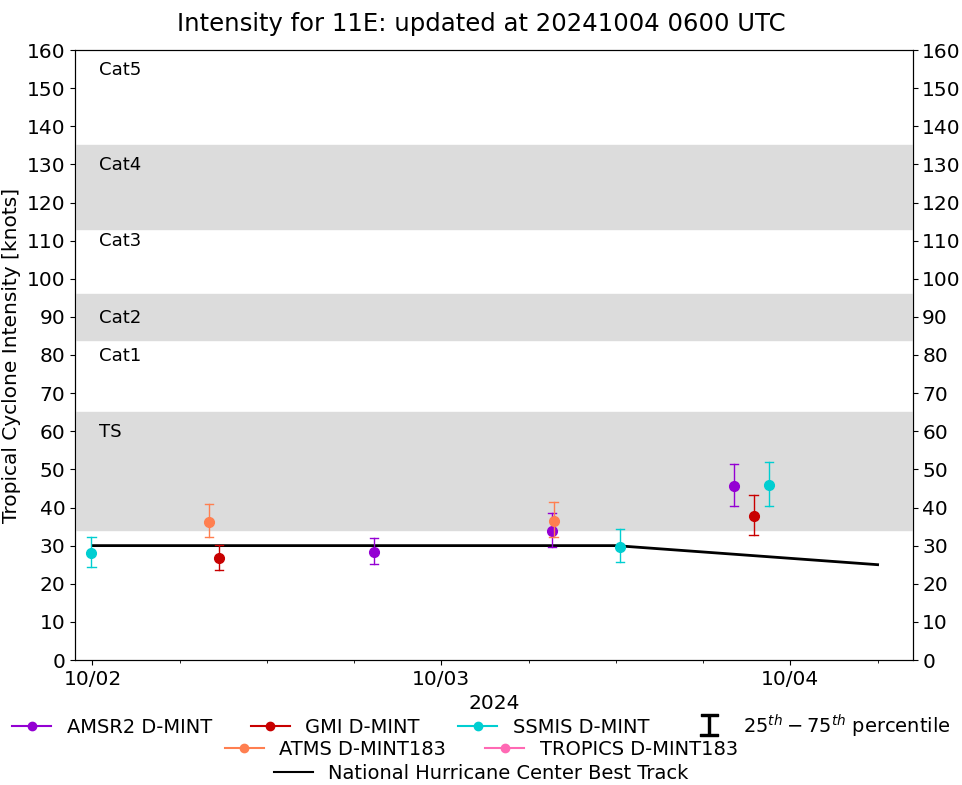 |
D-MINT HISTORY FILE for 2024_11E
| Date | Time | MW Sensor | MSLP | Vmax (30th-70th percentile average) | Vmax 25th percentile | Vmax 75th percentile | Image |
| 20241003 | 2231 UTC | SSMISF18 | 1000 hPa | 46 kts | 40 kts | 52 kts | 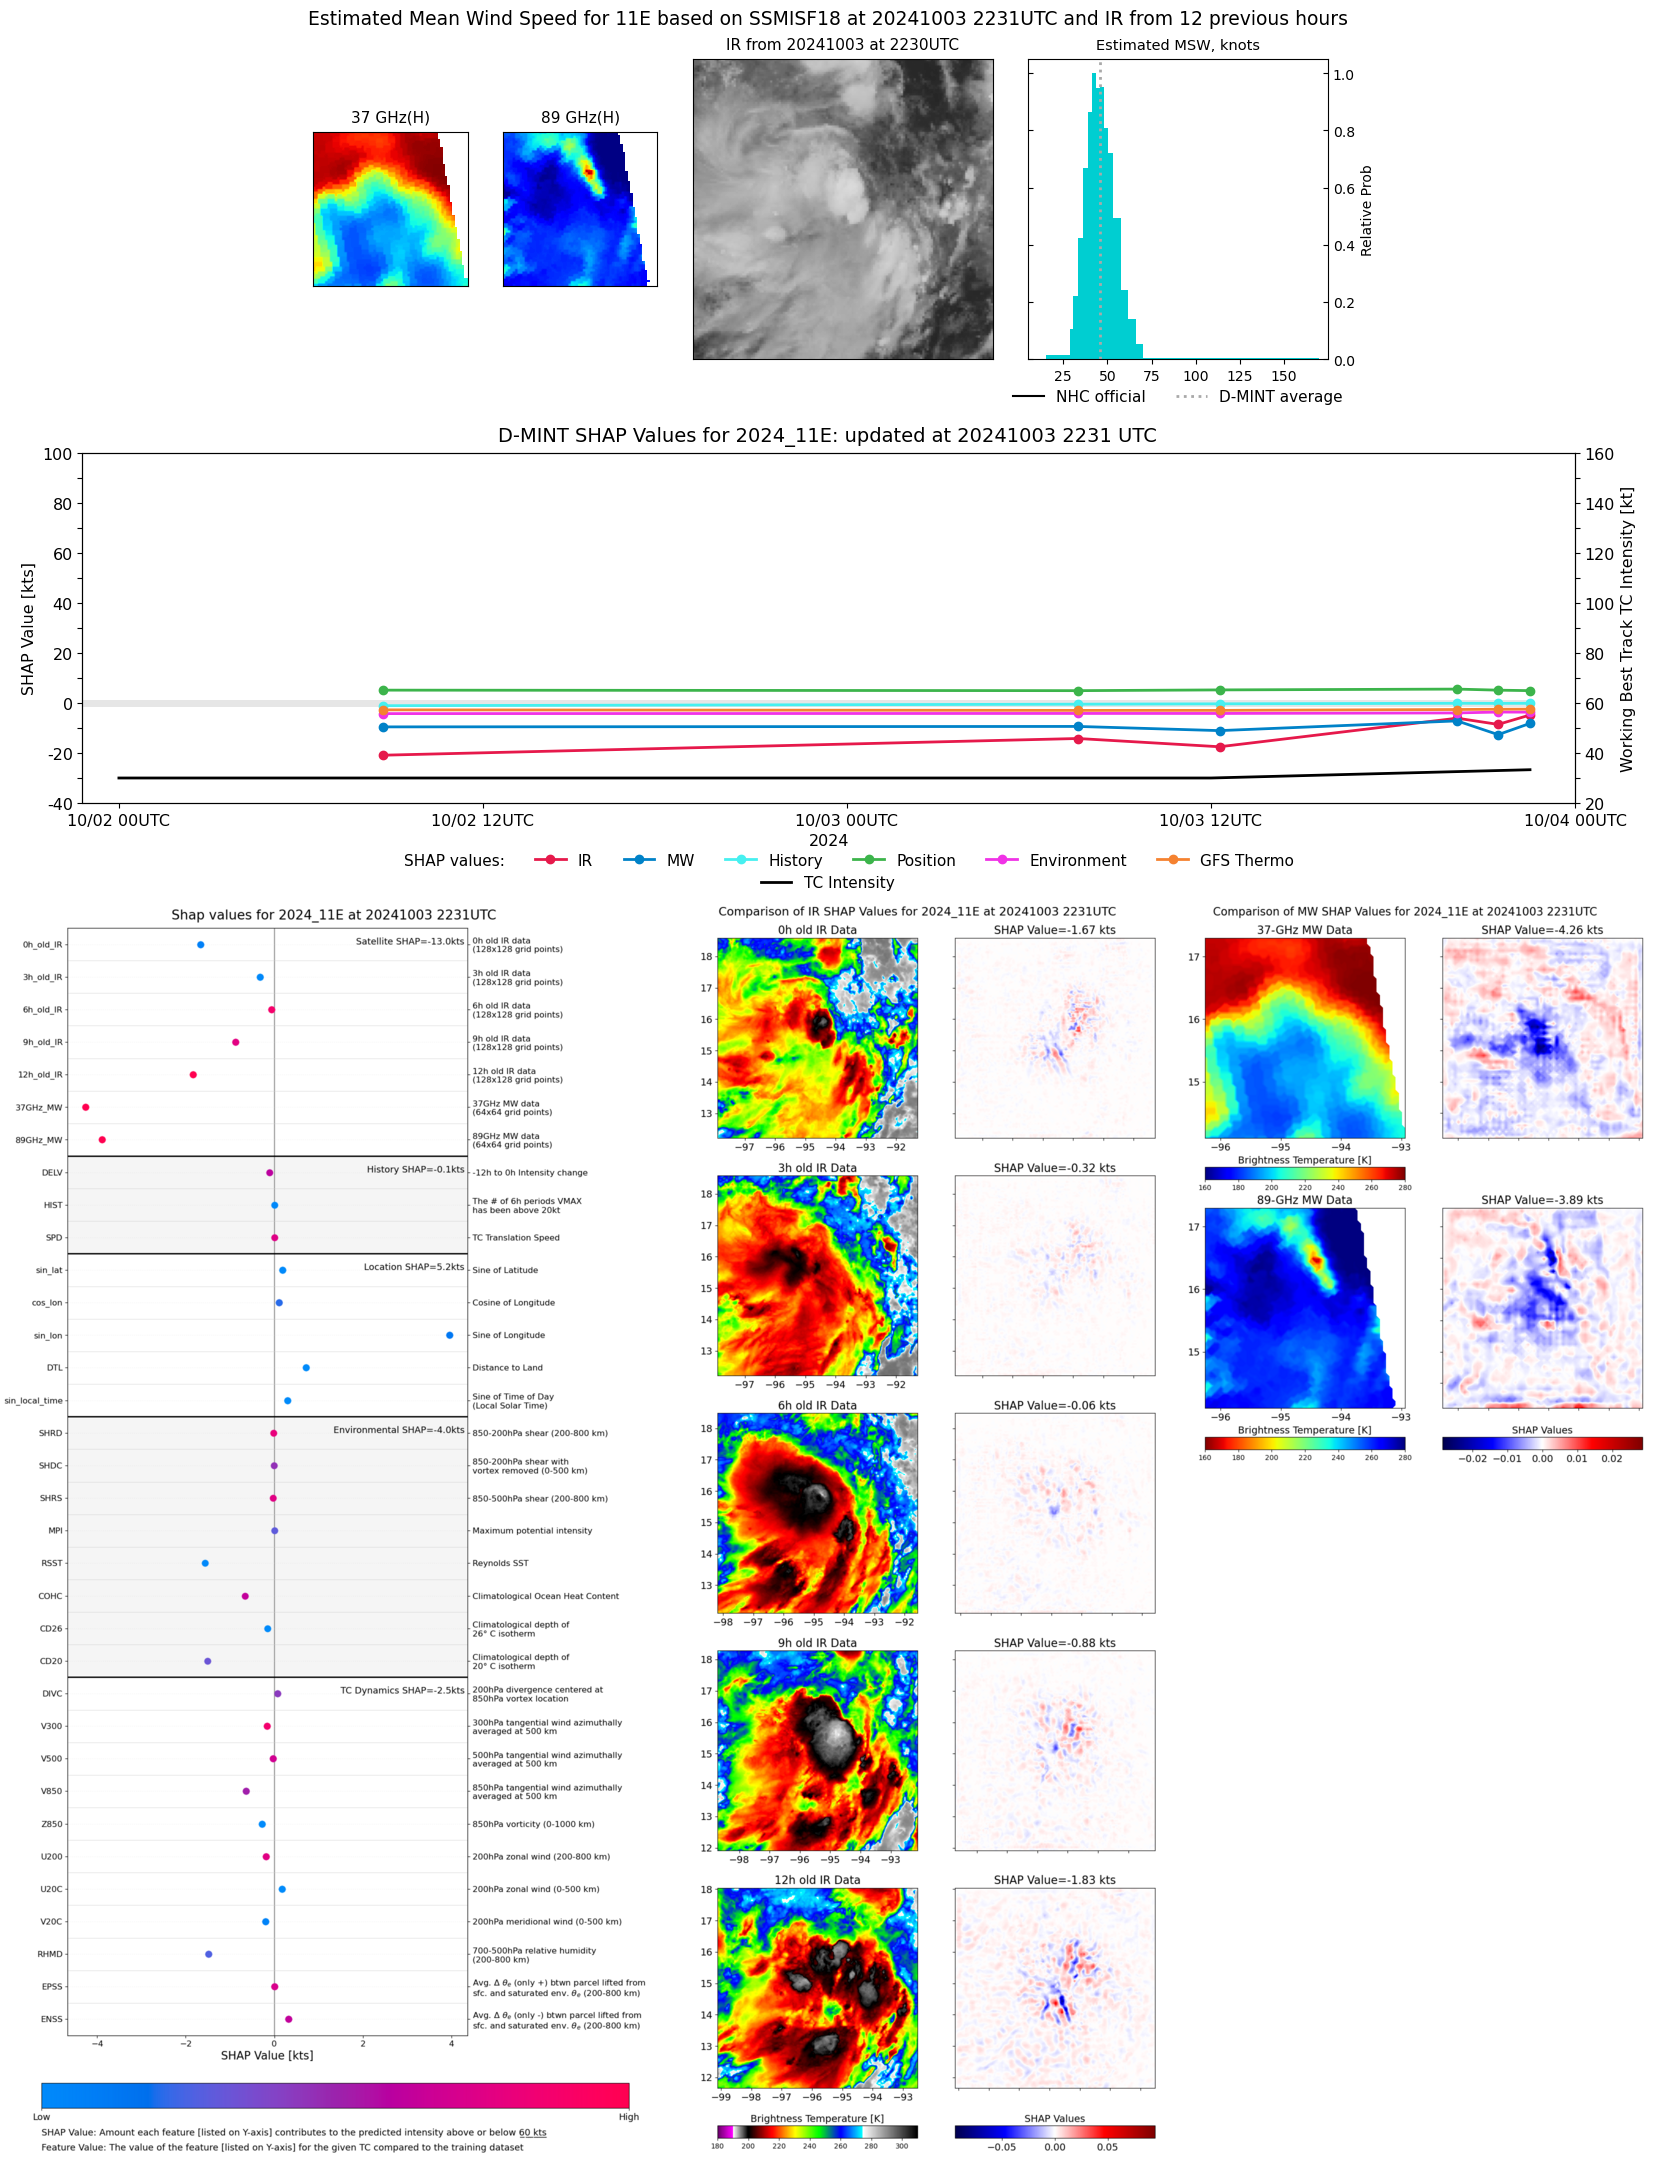 |
| 20241003 | 2128 UTC | GMI | 1001 hPa | 38 kts | 33 kts | 43 kts | 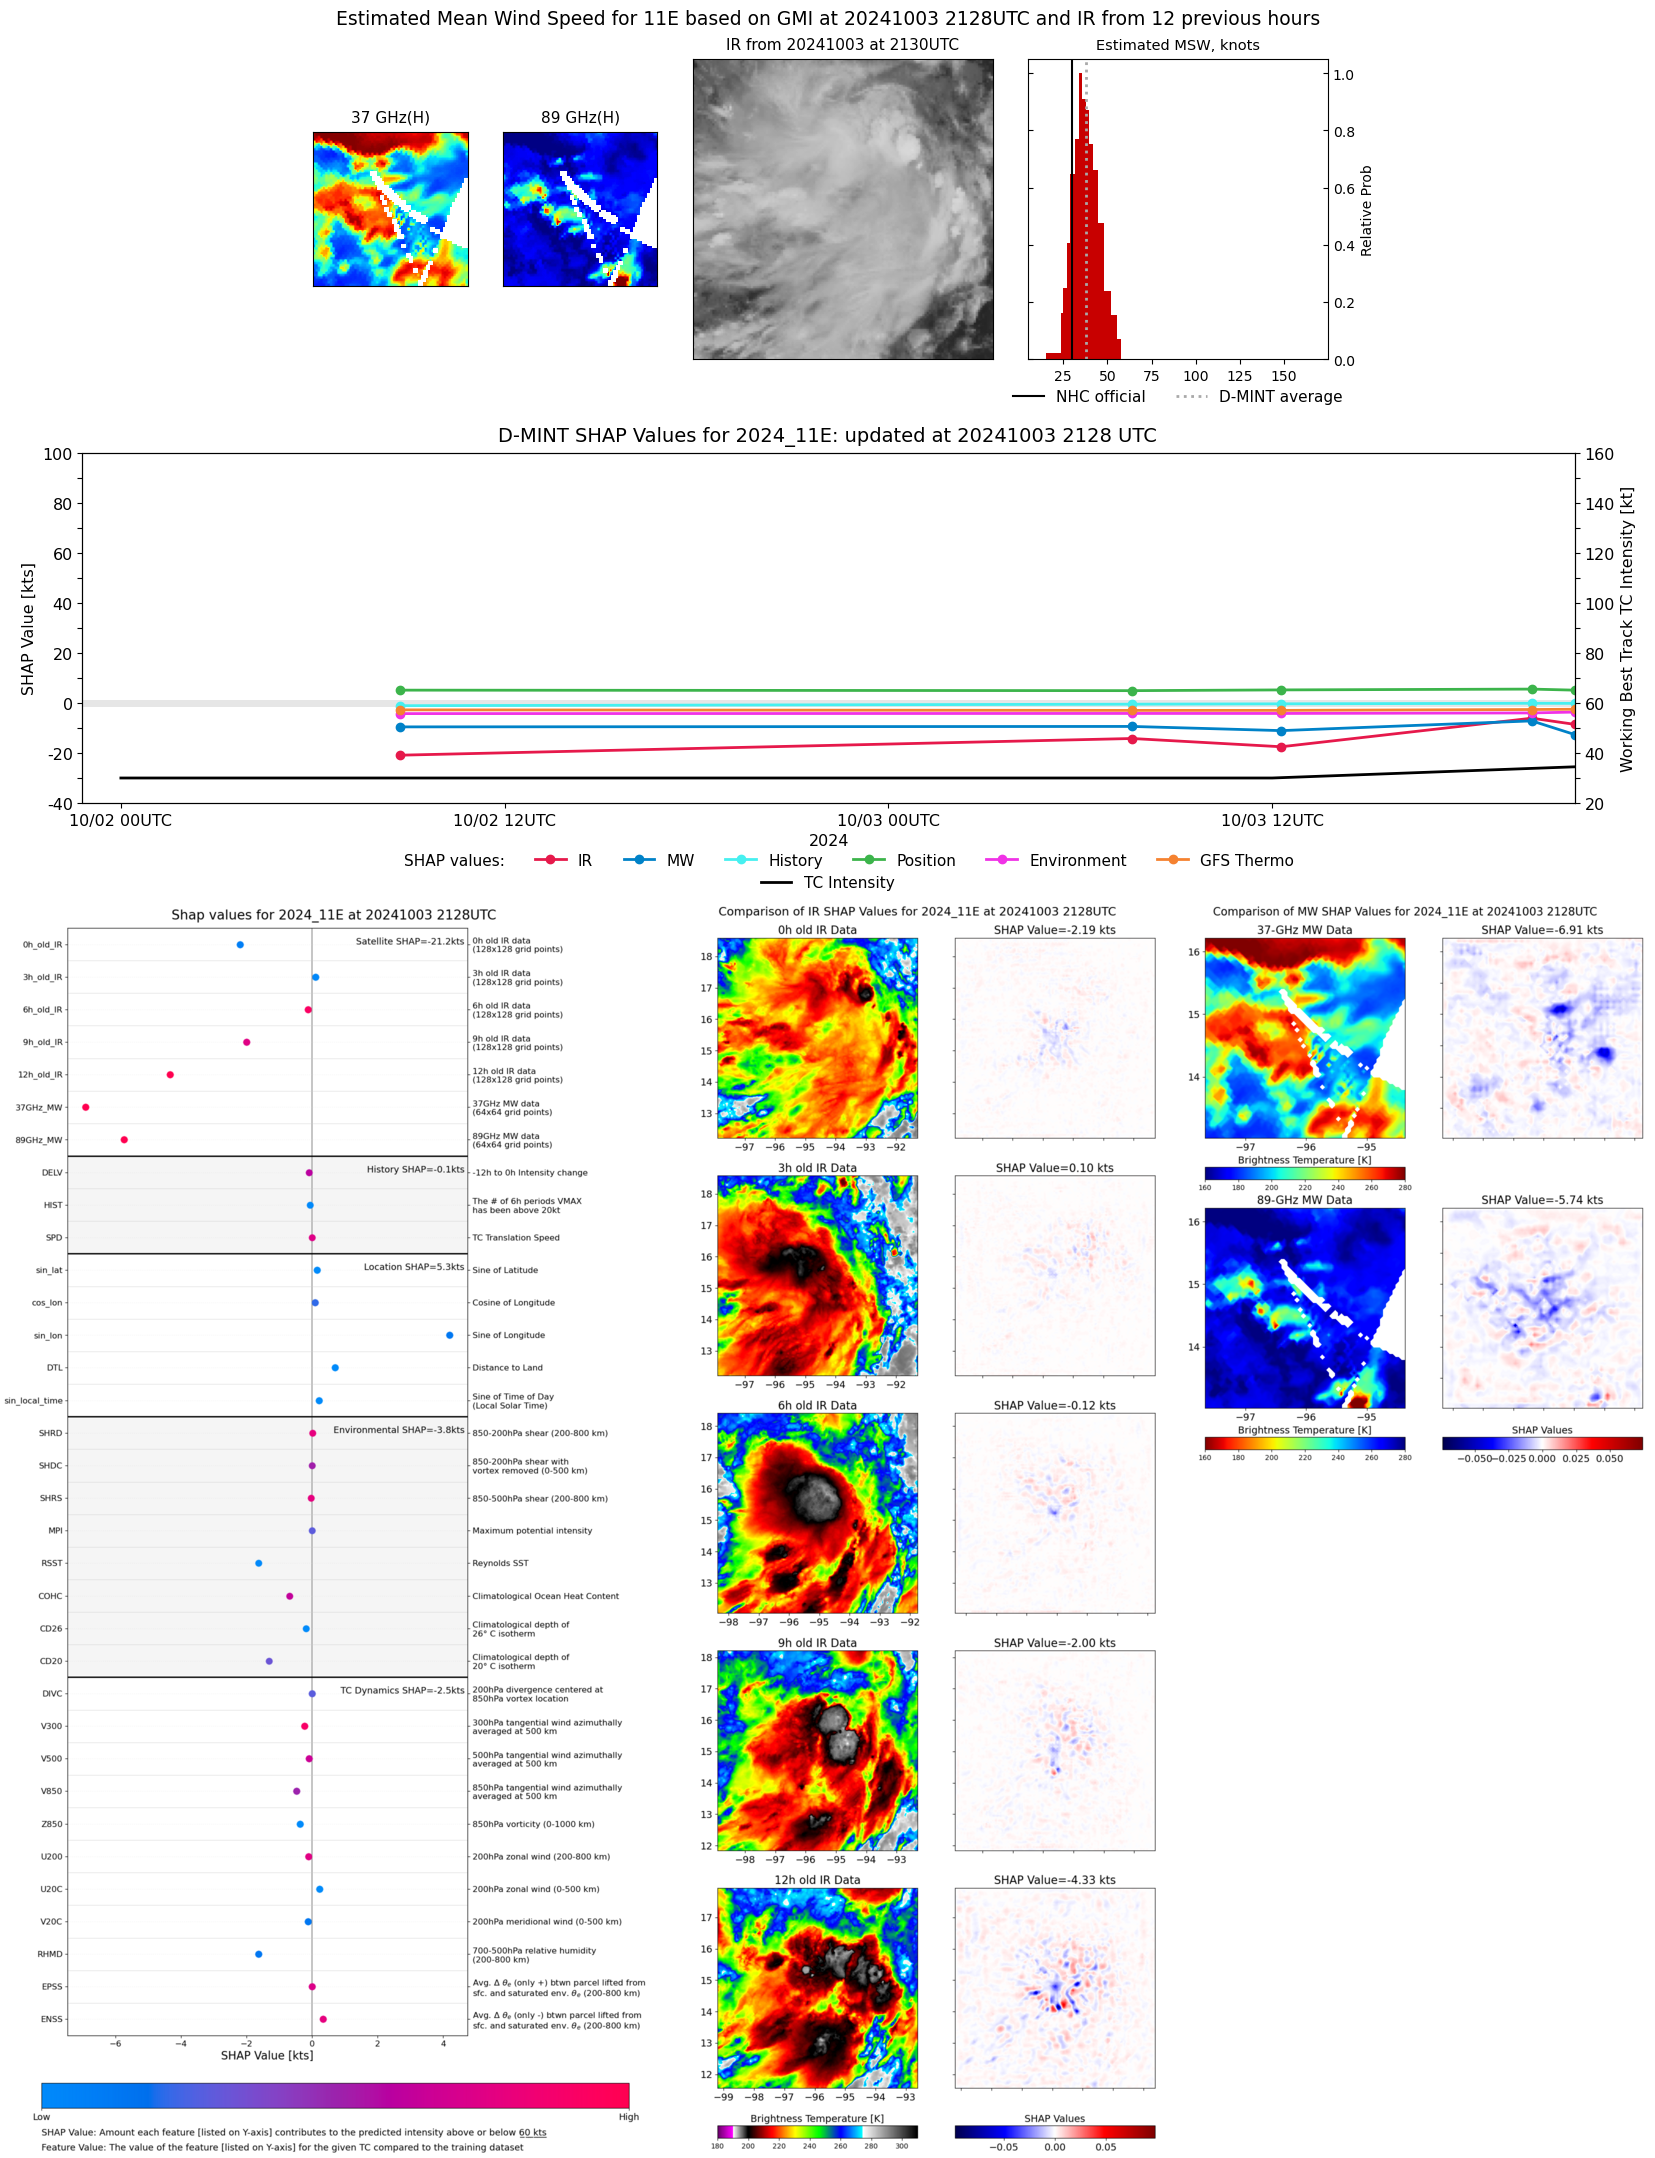 |
| 20241003 | 2007 UTC | AMSR2 | 1000 hPa | 46 kts | 40 kts | 51 kts | 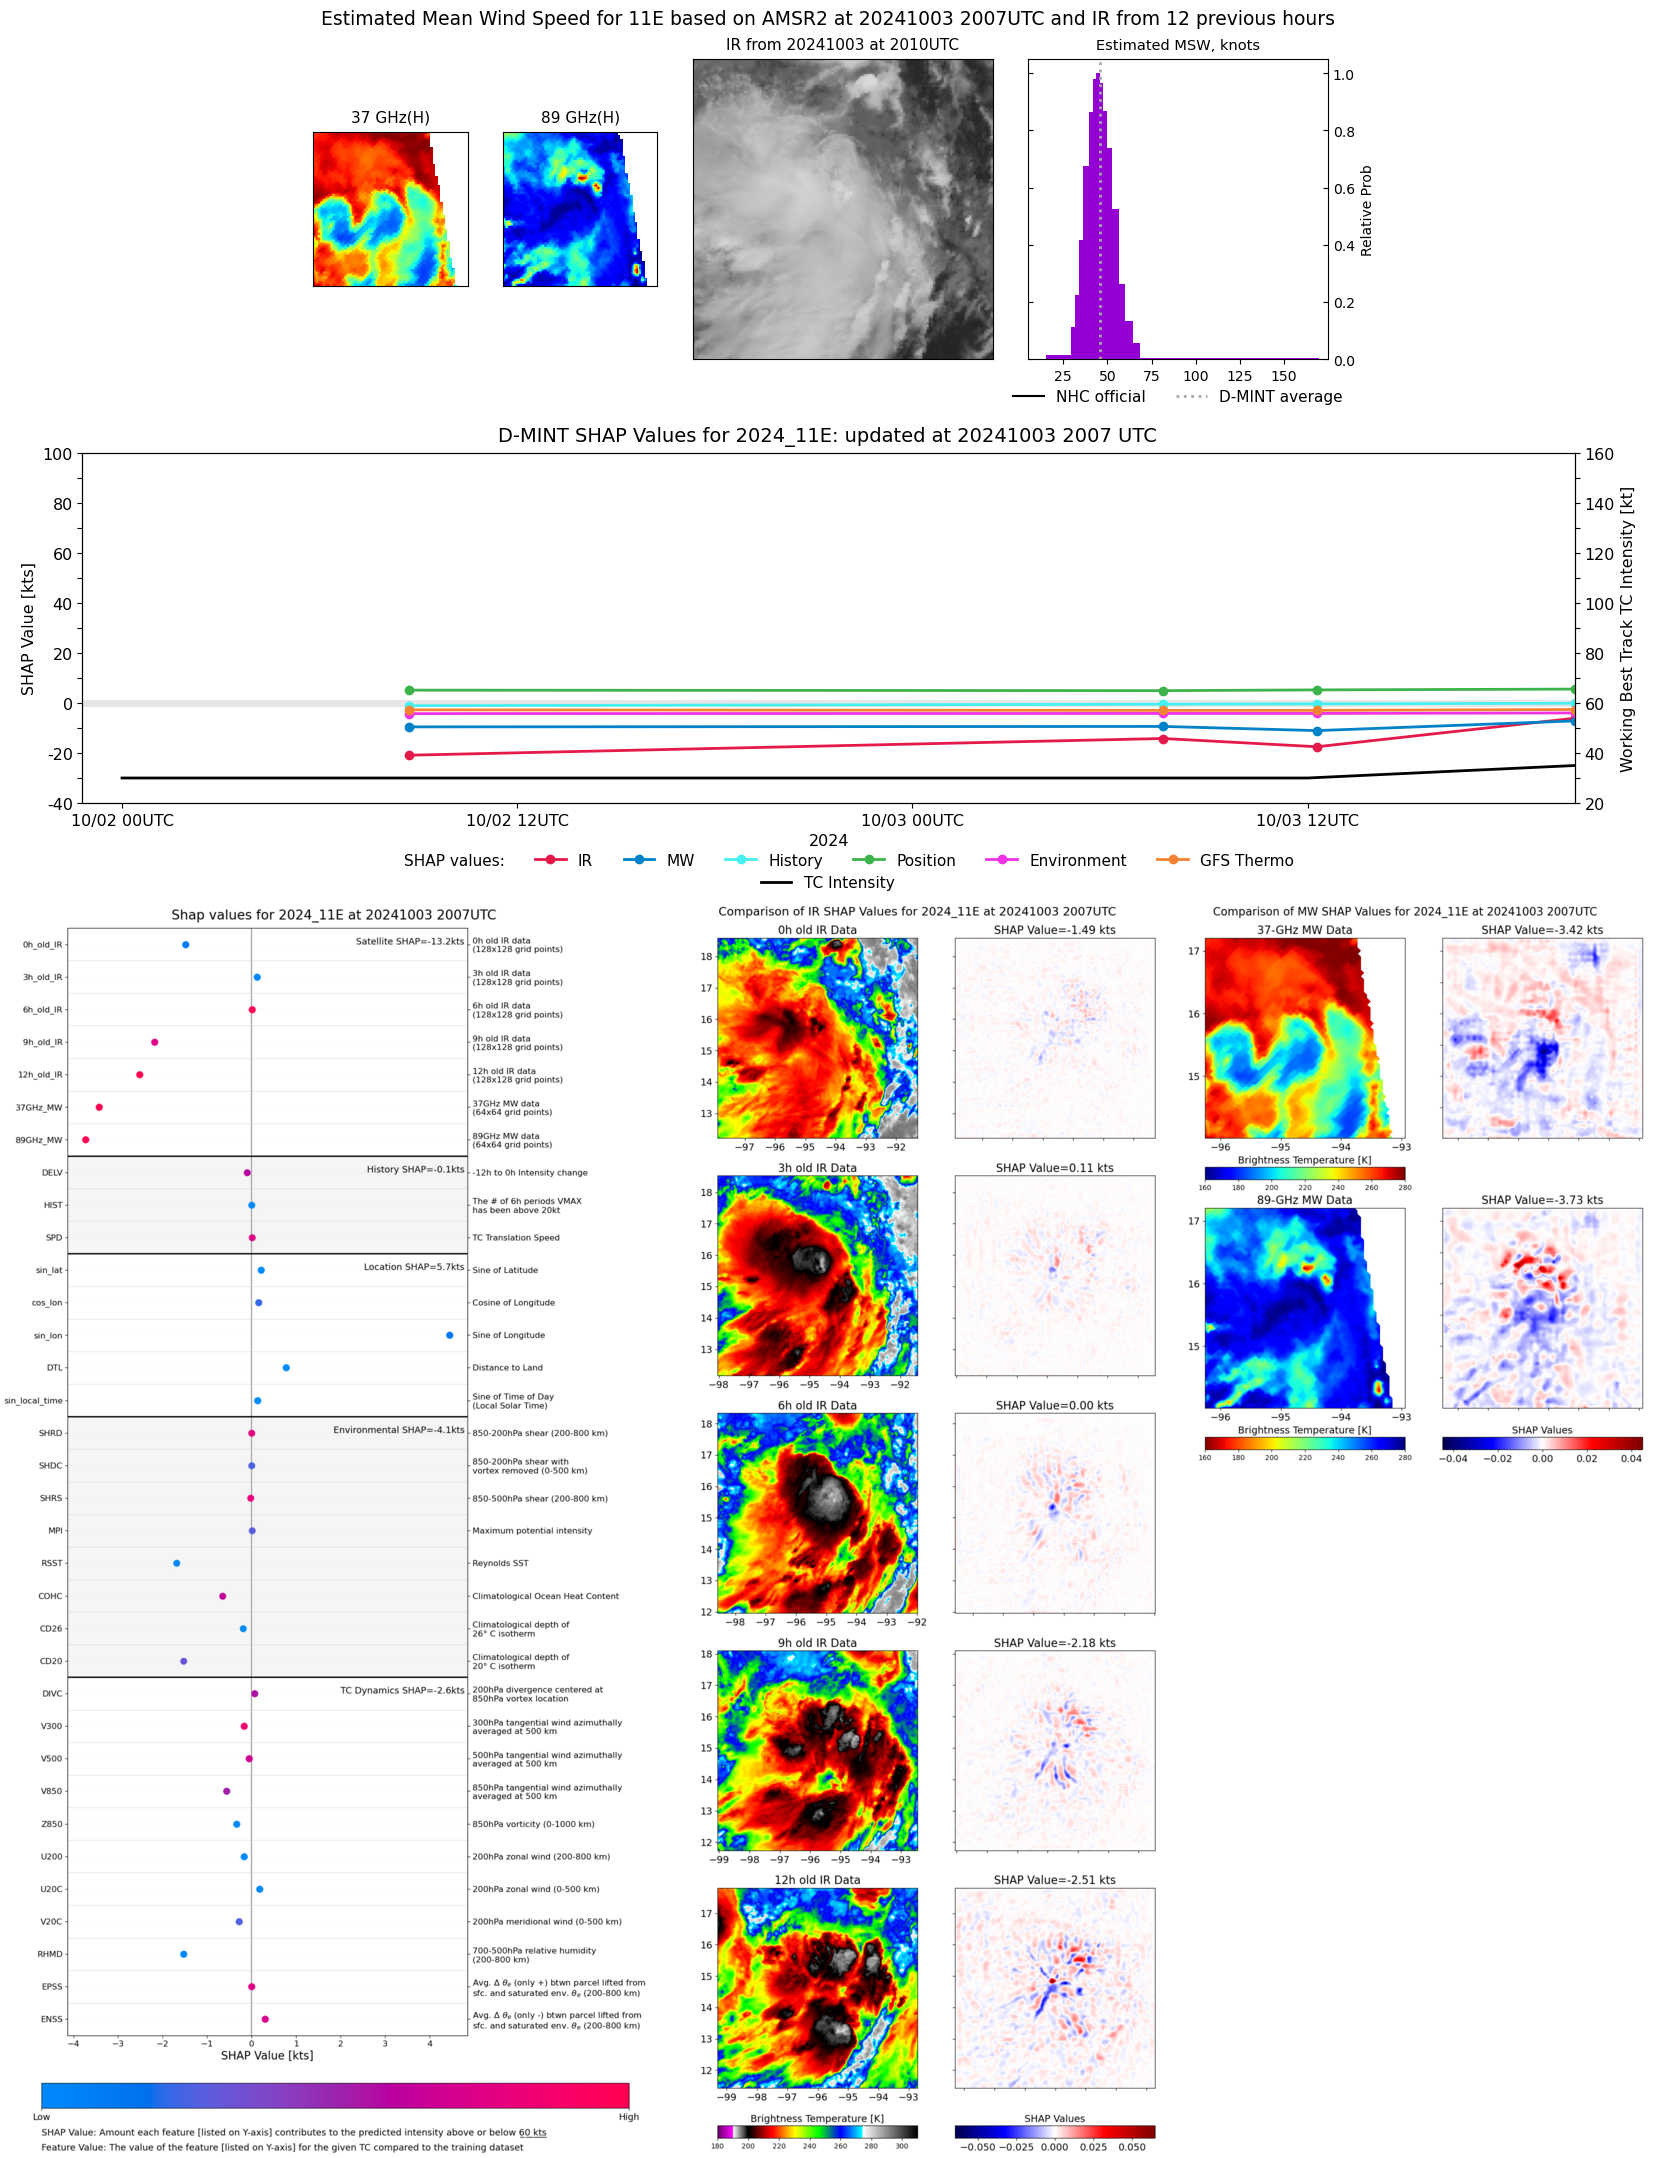 |
| 20241003 | 1217 UTC | SSMISF17 | 1005 hPa | 30 kts | 26 kts | 34 kts | 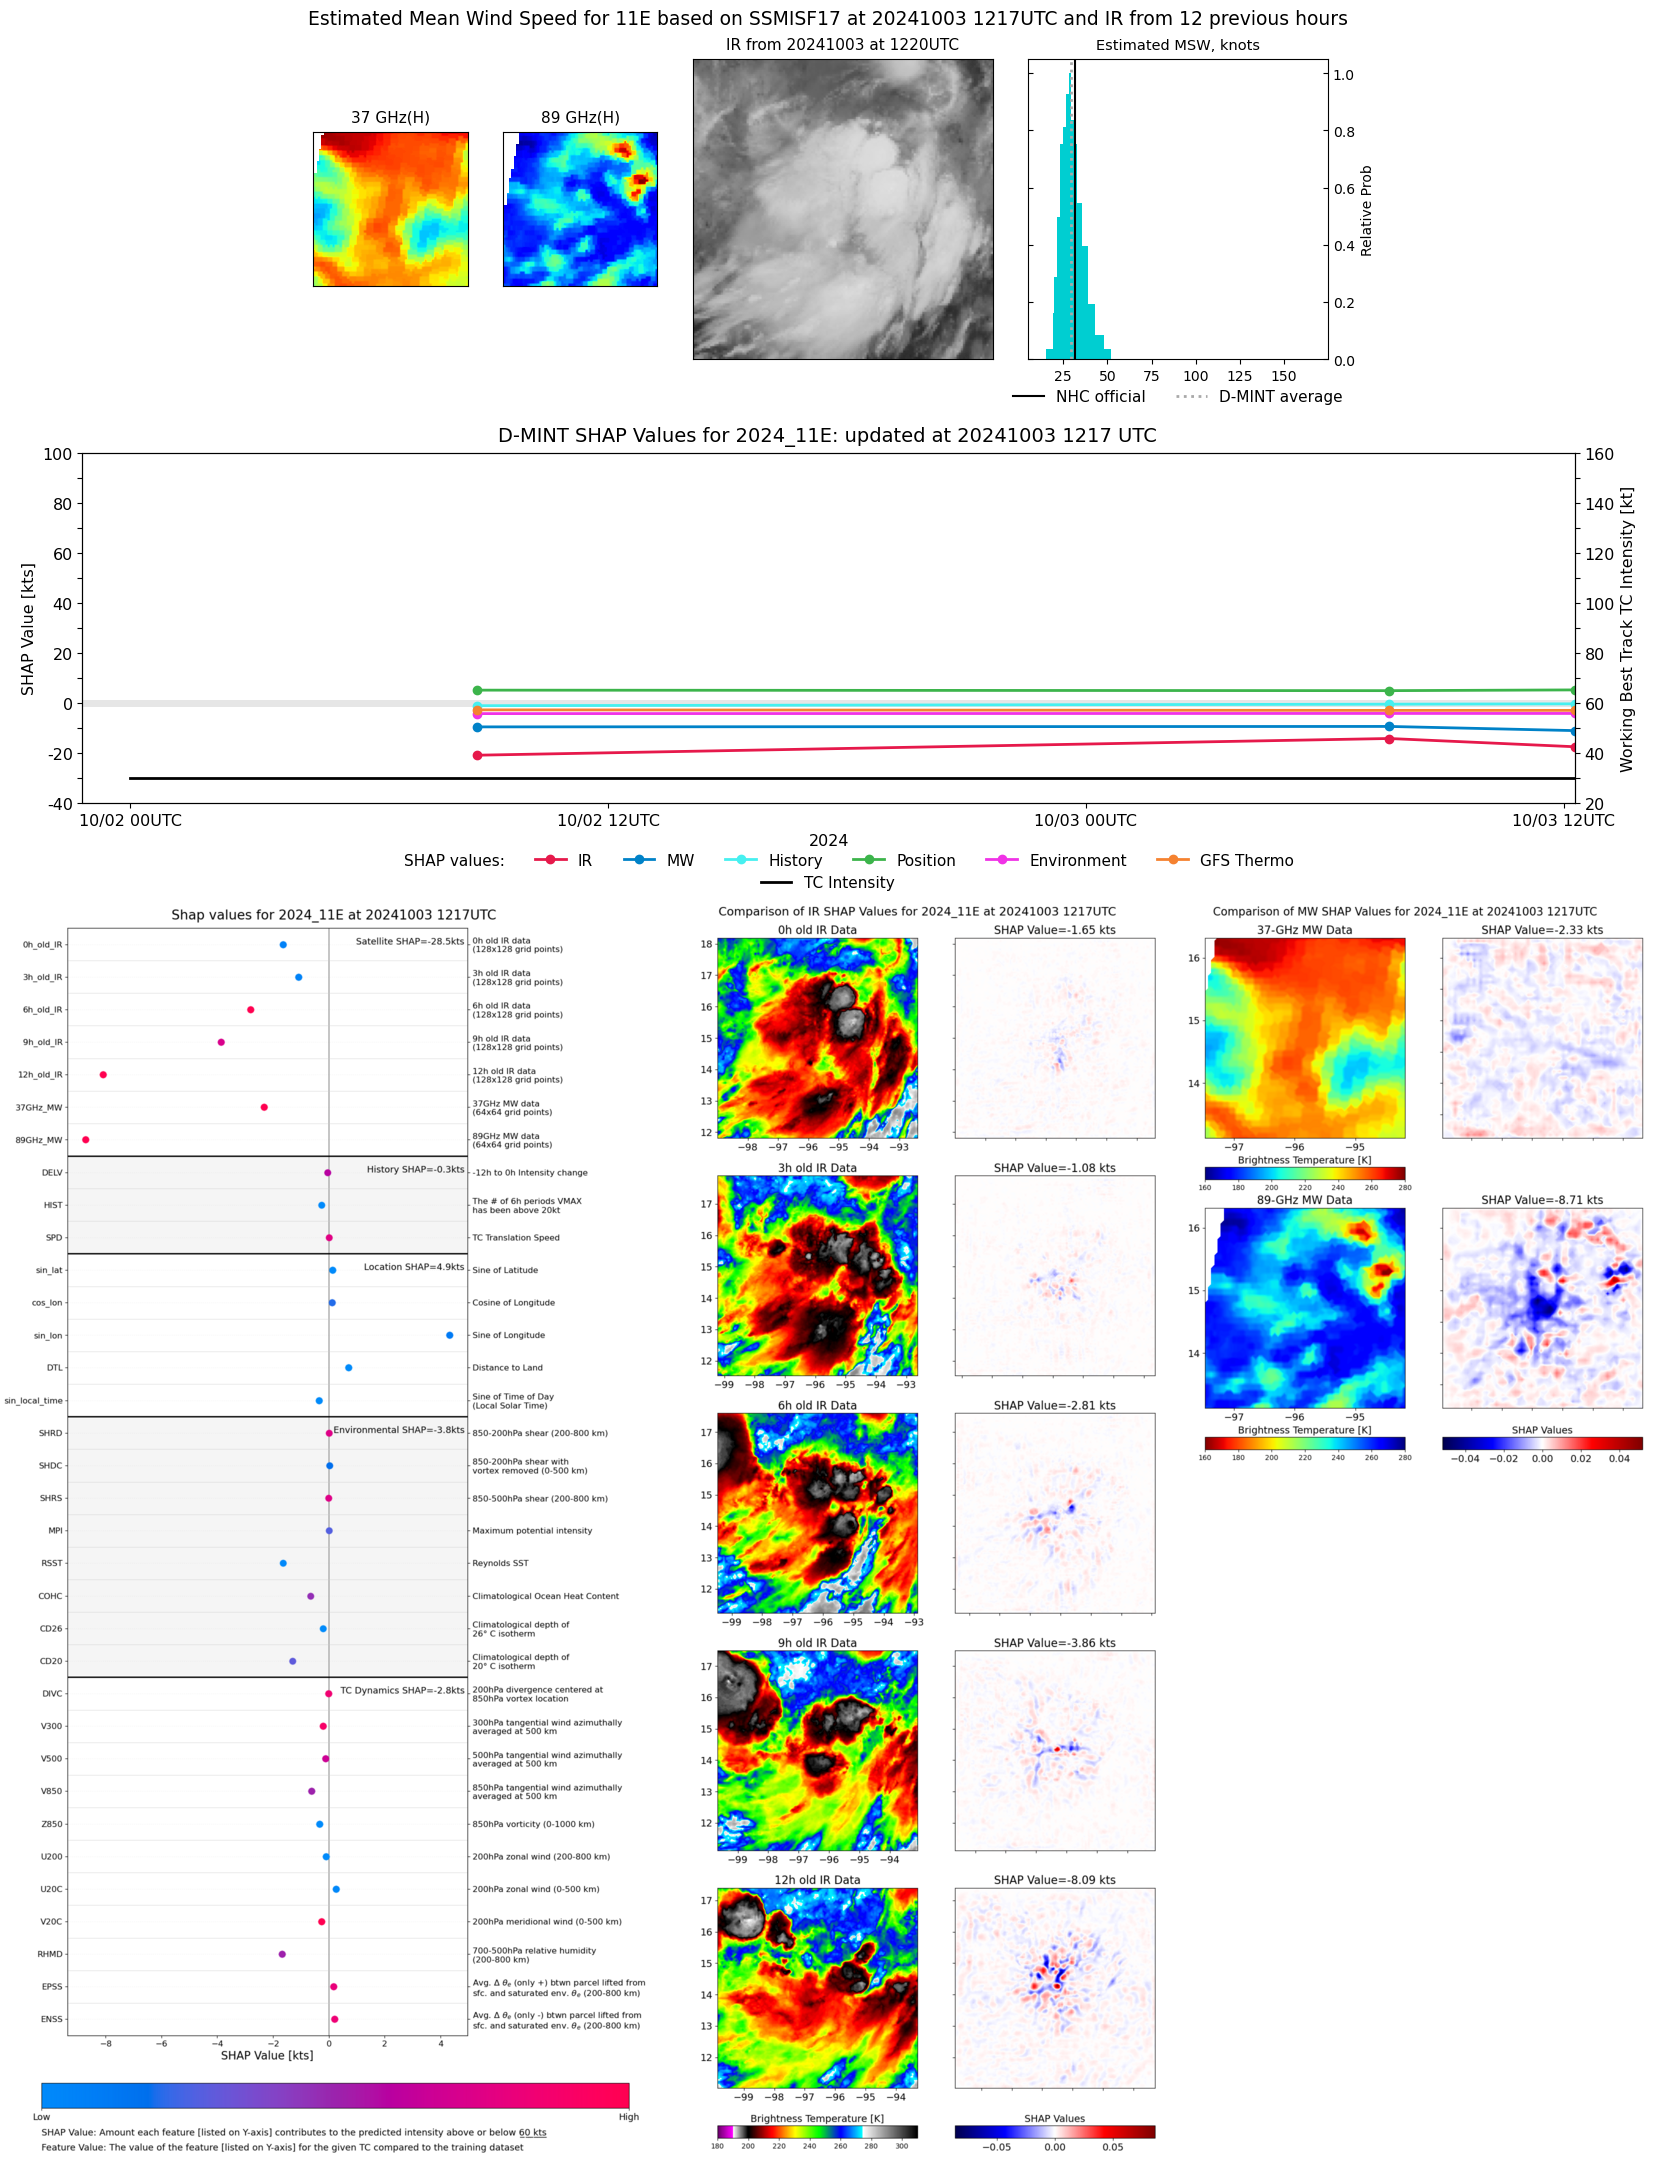 |
| 20241003 | 0743 UTC | ATMS-N21 | 1003 hPa | 37 kts | 32 kts | 41 kts | 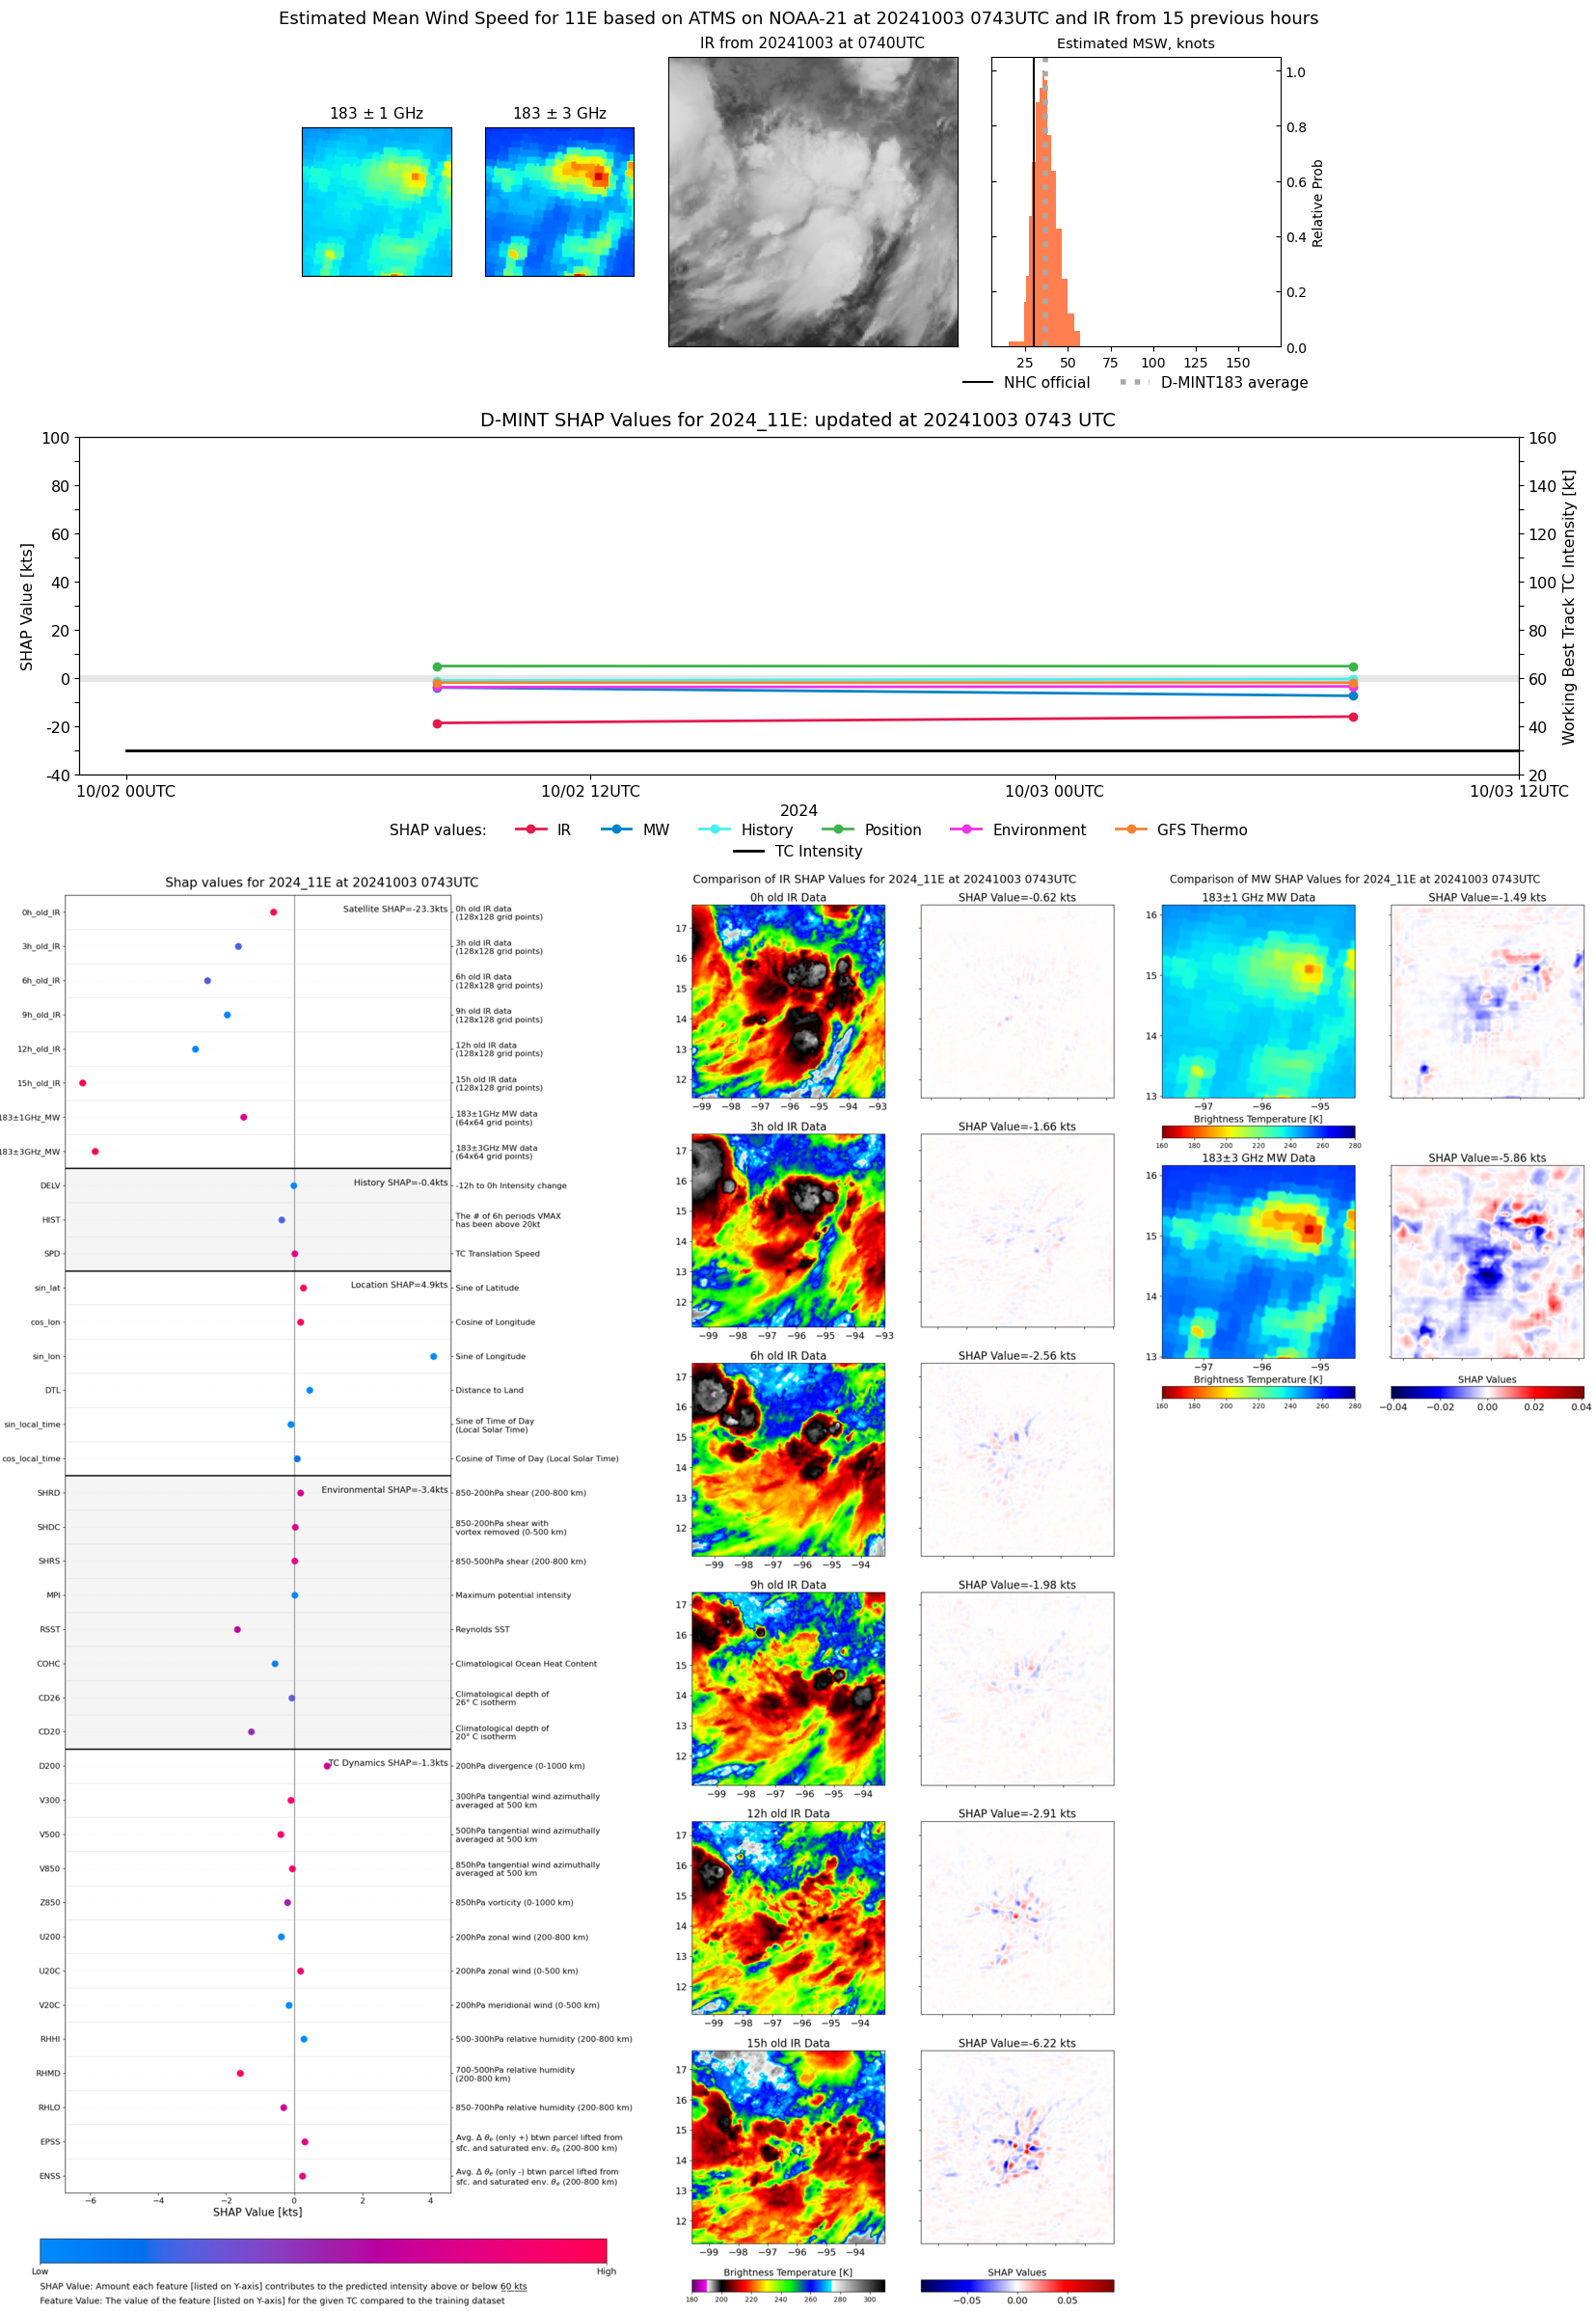 |
| 20241003 | 0737 UTC | AMSR2 | 1004 hPa | 34 kts | 30 kts | 38 kts | 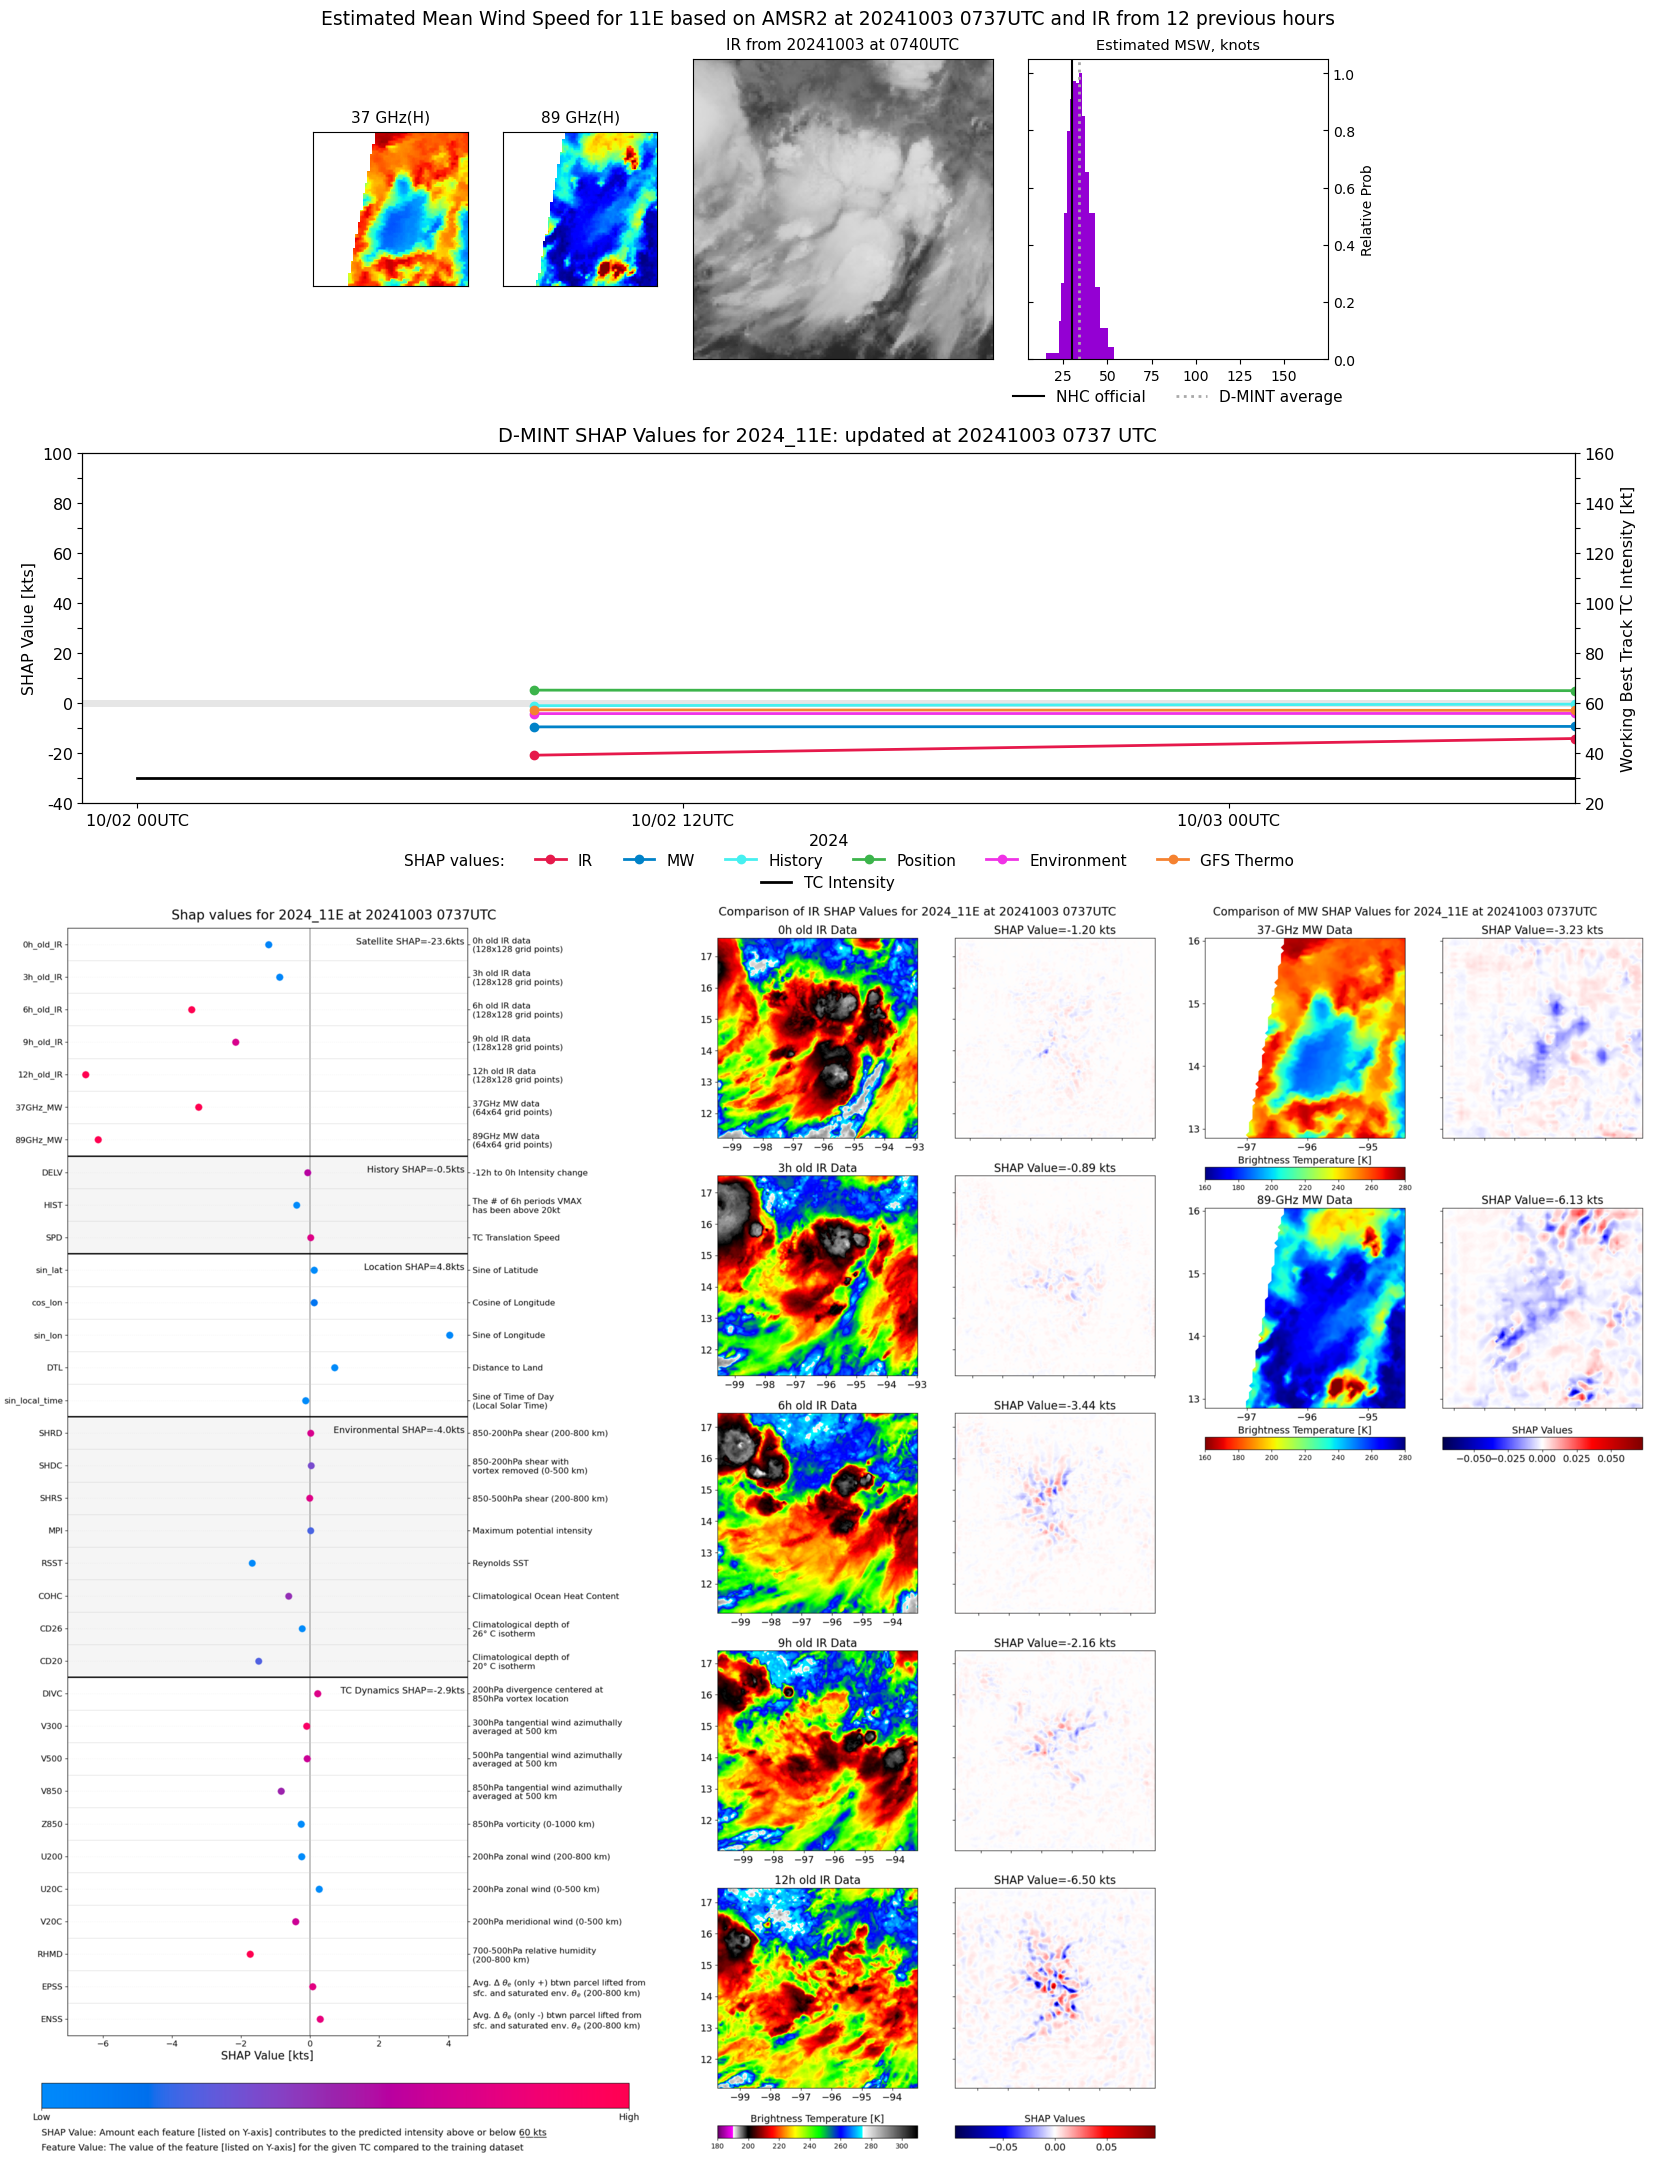 |
| 20241002 | 1923 UTC | AMSR2 | 1005 hPa | 28 kts | 25 kts | 32 kts | 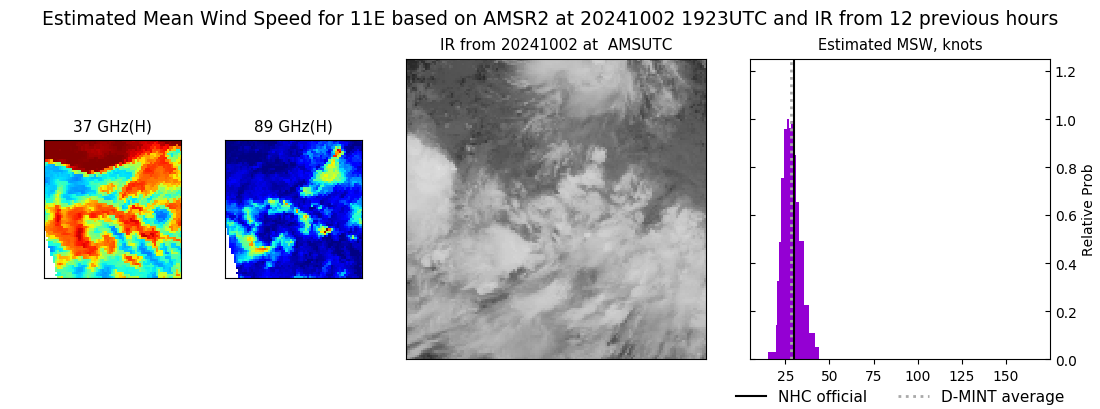 |
| 20241002 | 0843 UTC | GMI | 1006 hPa | 27 kts | 24 kts | 30 kts | 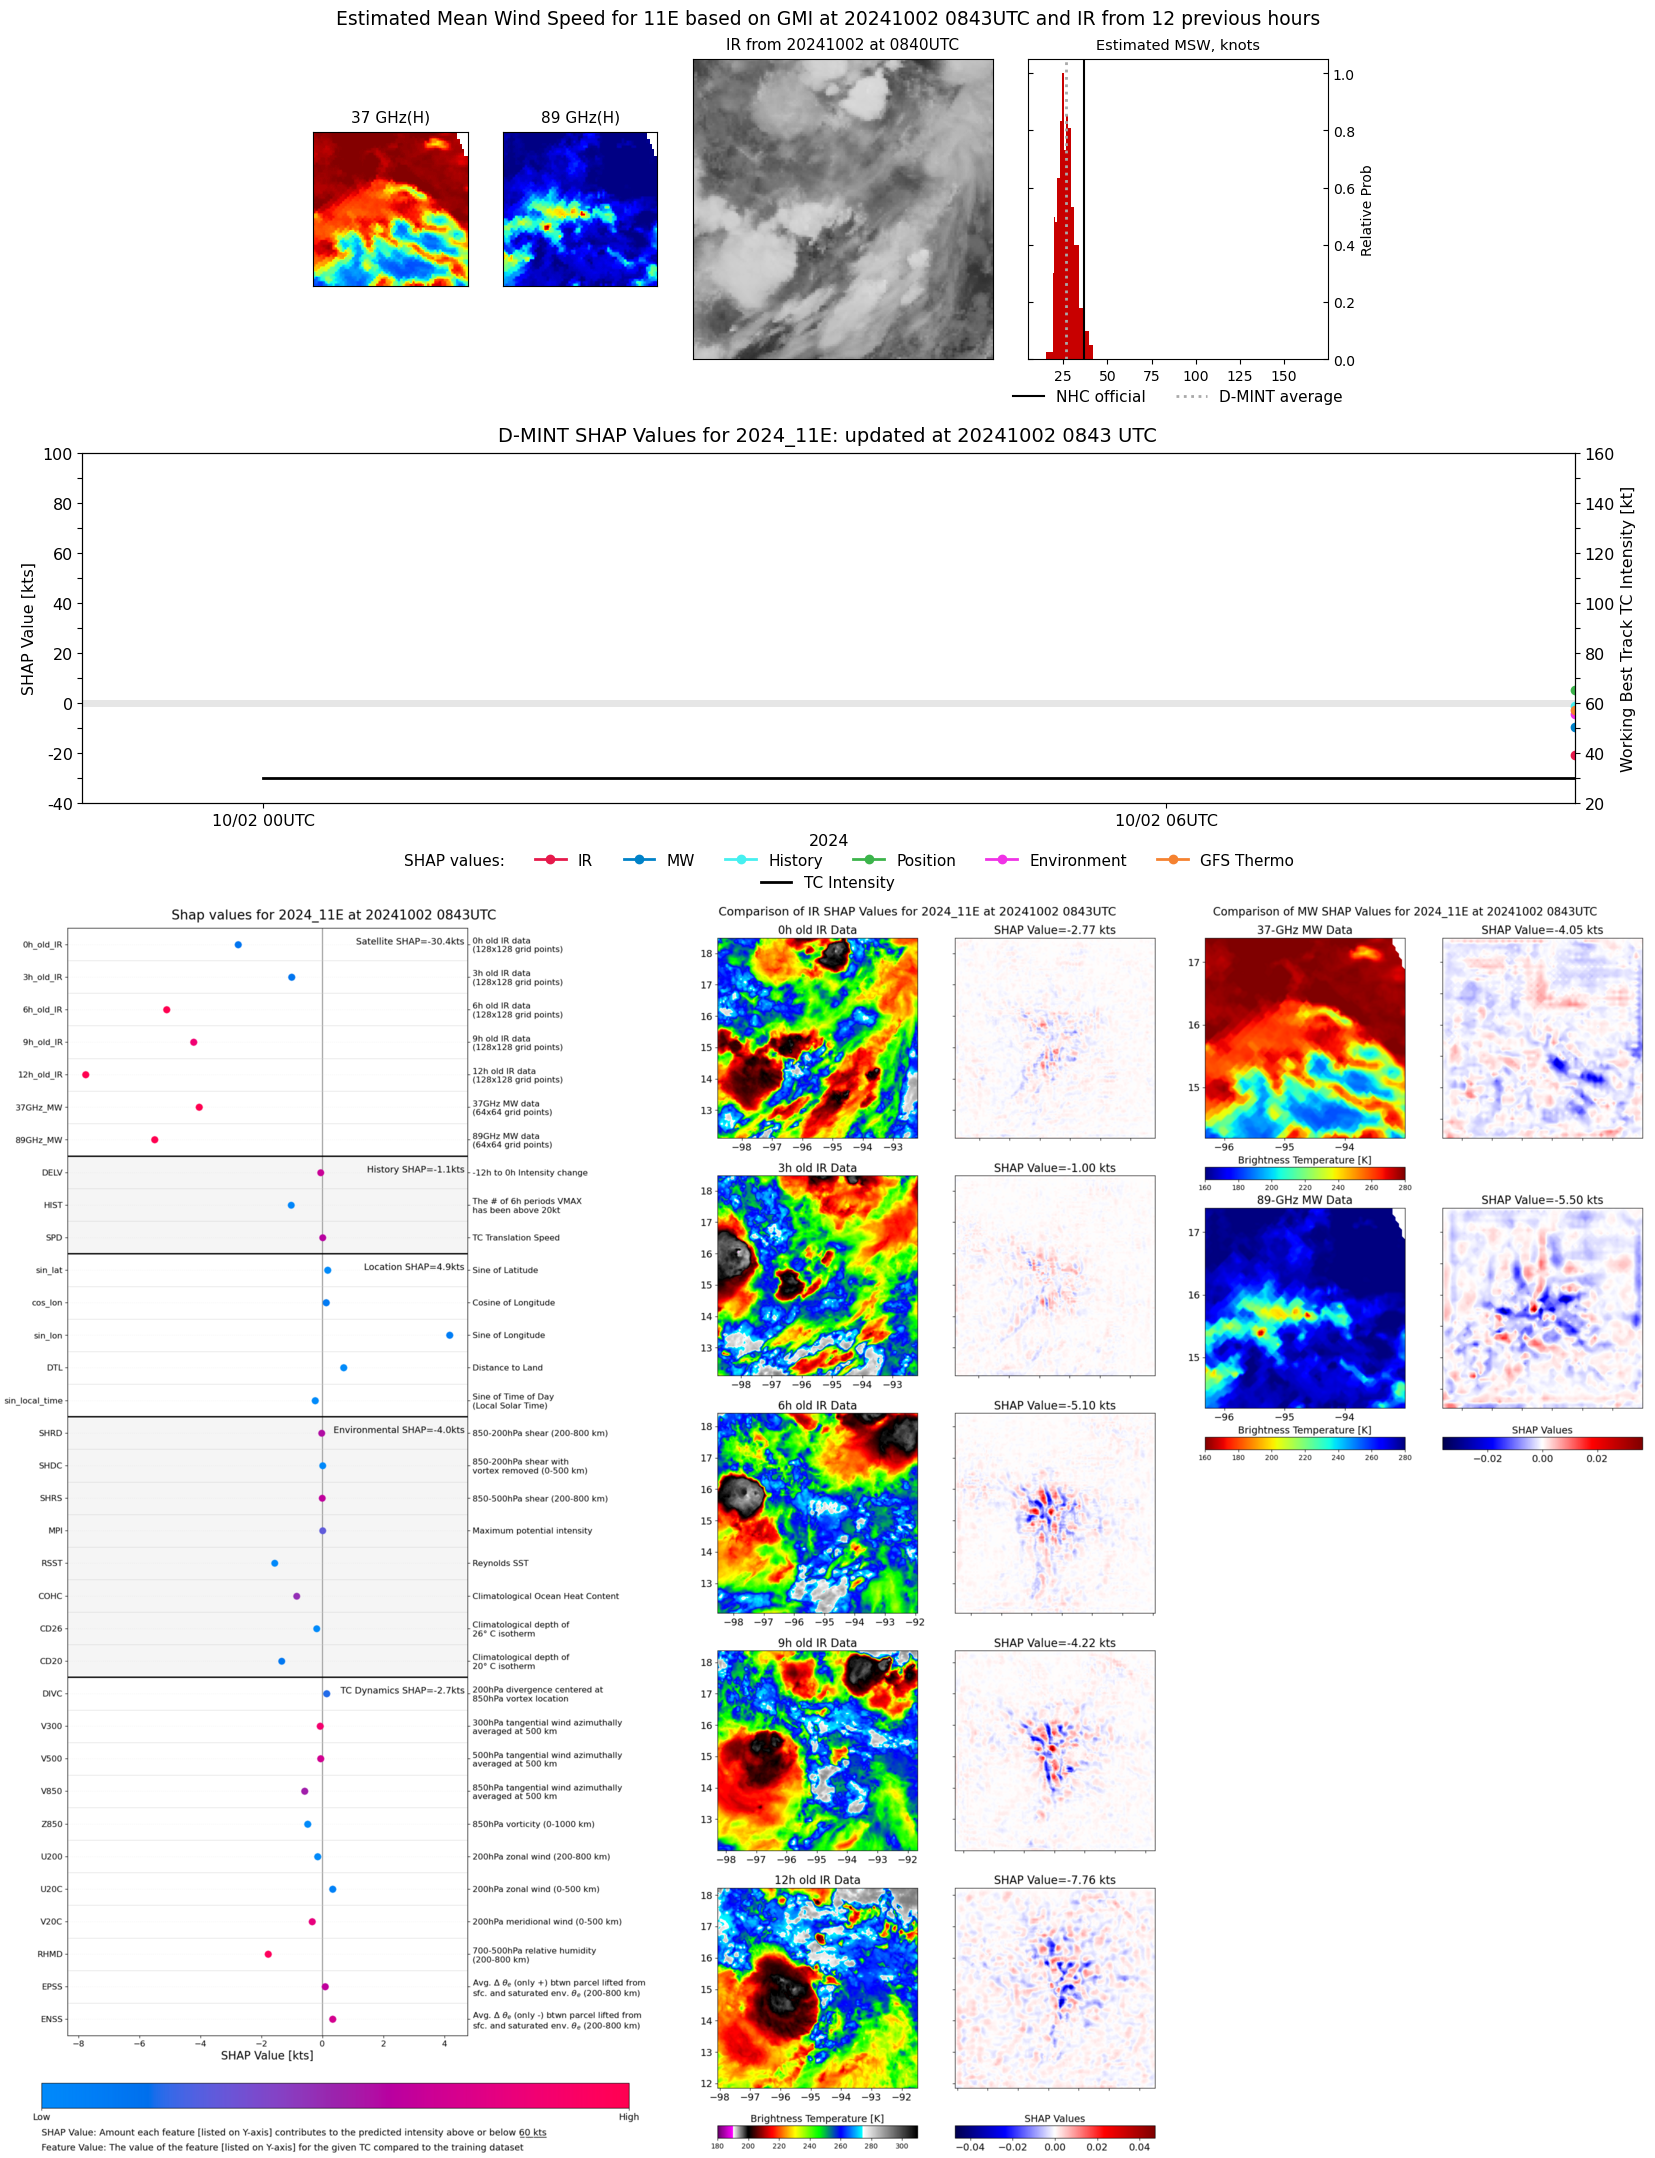 |
| 20241002 | 0802 UTC | ATMS-N21 | 1006 hPa | 36 kts | 32 kts | 41 kts |  |
| 20241001 | 2356 UTC | SSMISF17 | 1006 hPa | 28 kts | 24 kts | 32 kts | 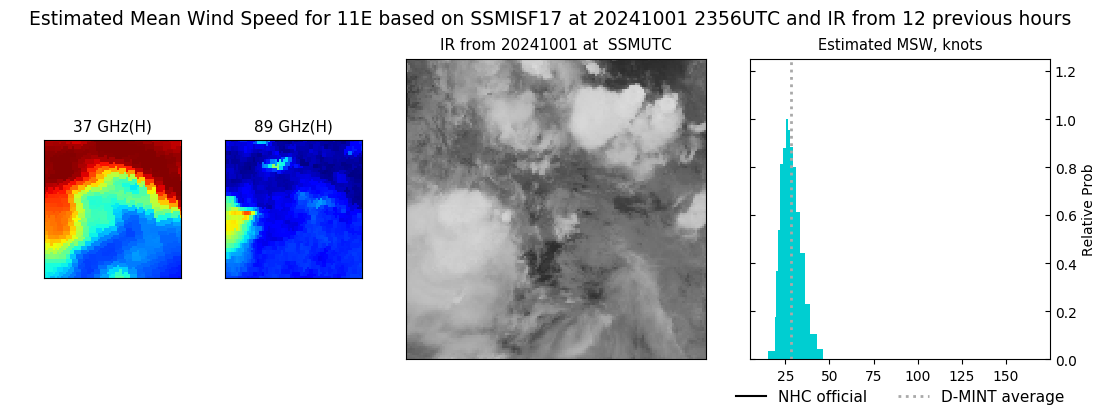 |
| 20241001 | 1244 UTC | SSMISF17 | NaN hPa | 25 kts | 22 kts | 28 kts |  |
| 20241001 | 1223 UTC | SSMISF16 | NaN hPa | 23 kts | 20 kts | 26 kts |  |
| 20241001 | 1006 UTC | SSMISF18 | NaN hPa | 26 kts | 23 kts | 29 kts |  |
| 20241001 | 0749 UTC | AMSR2 | NaN hPa | 25 kts | 22 kts | 28 kts |  |
| 20241001 | 0009 UTC | SSMISF17 | NaN hPa | 30 kts | 26 kts | 35 kts |  |
| 20240930 | 2200 UTC | GMI | NaN hPa | 27 kts | 24 kts | 30 kts |  |
| 20240930 | 1935 UTC | AMSR2 | NaN hPa | 24 kts | 22 kts | 27 kts |  |