|
Storm: 11L
D-MINT HISTORY FILE for 2024_11L
| Date | Time | MW Sensor | MSLP | Vmax
(30th-70th percentile average) | Vmax
25th percentile | Vmax
75th percentile | Image |
| 20240930 | 2048 UTC | SSMISF17 | 1007 hPa | 29 kts | 26 kts | 32 kts | 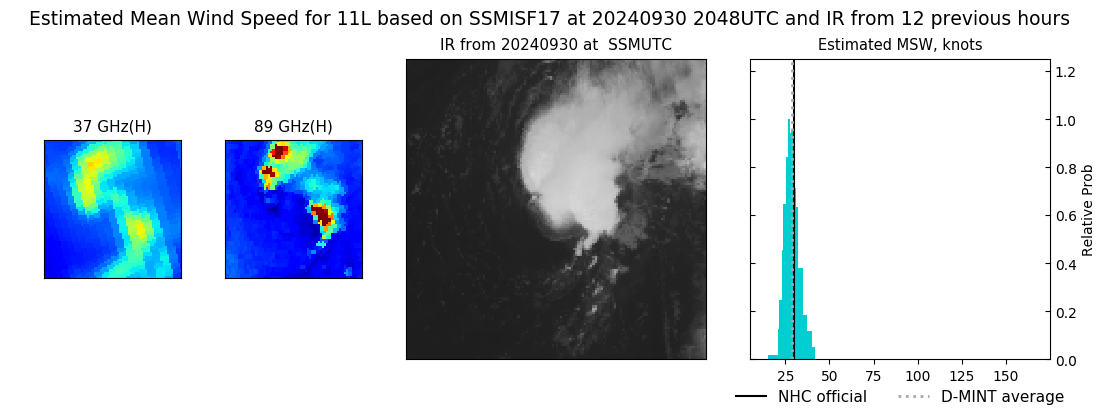 |
| 20240930 | 1620 UTC | AMSR2 | 1007 hPa | 29 kts | 27 kts | 32 kts | 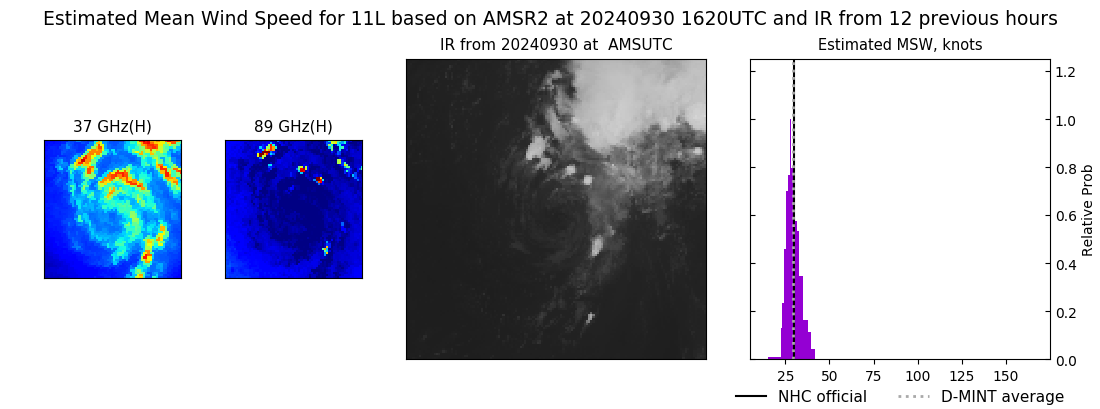 |
| 20240930 | 0933 UTC | SSMISF17 | 1008 hPa | 24 kts | 22 kts | 26 kts | 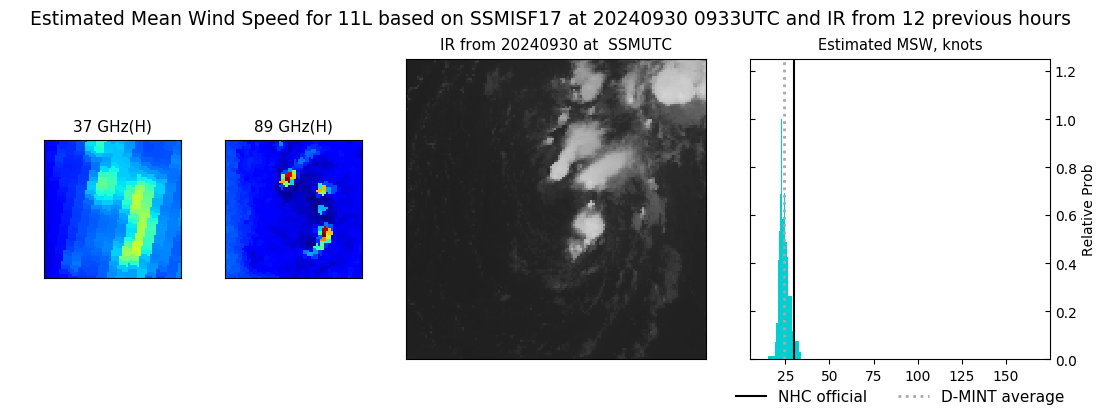 |
| 20240930 | 0911 UTC | SSMISF16 | 1008 hPa | 27 kts | 25 kts | 29 kts | 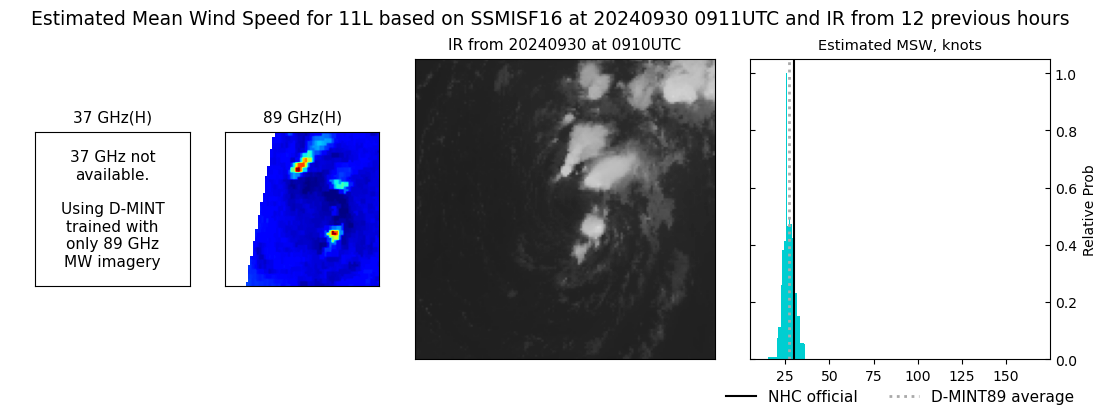 |
| 20240930 | 0524 UTC | AMSR2 | 1006 hPa | 31 kts | 28 kts | 34 kts | 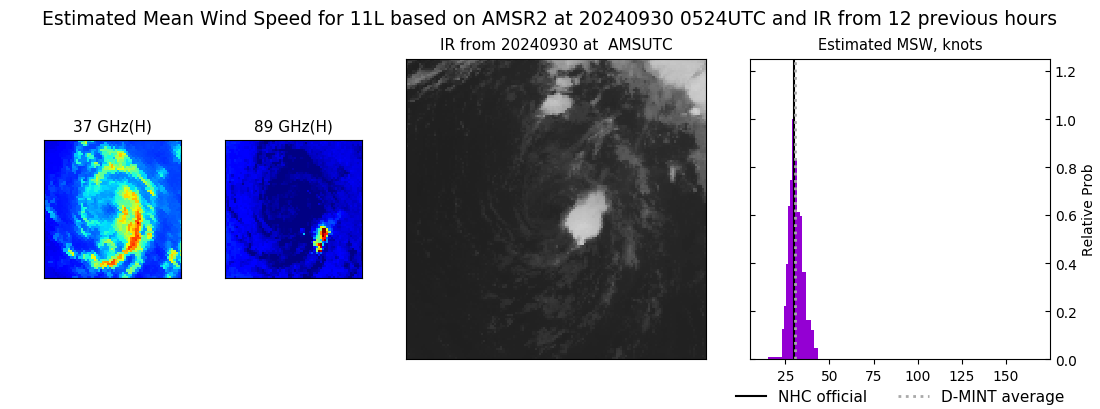 |
| 20240930 | 0524 UTC | AMSR2 | 1006 hPa | 31 kts | 28 kts | 34 kts | 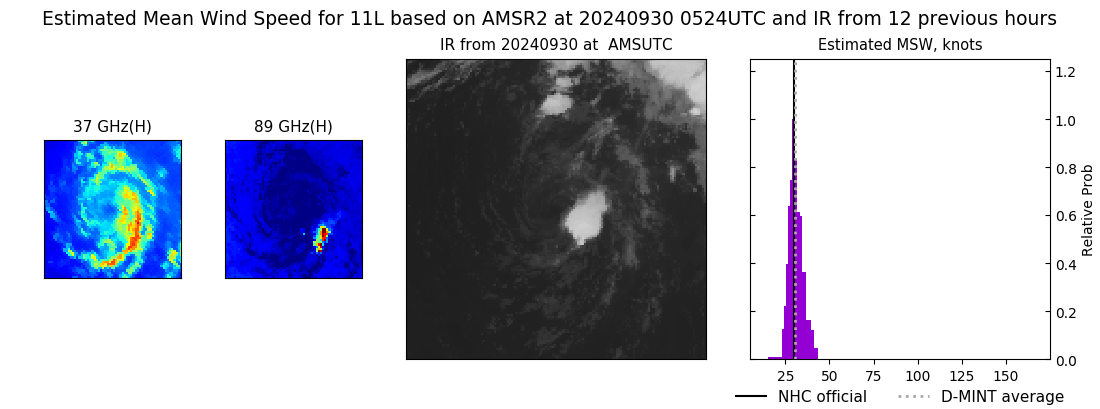 |
| 20240930 | 0515 UTC | ATMS-N21 | 1005 hPa | 25 kts | 23 kts | 27 kts | 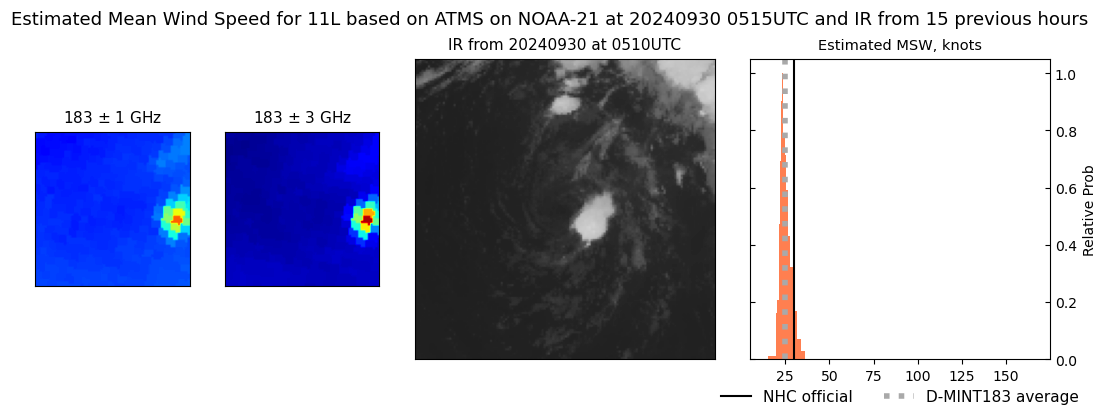 |
| 20240929 | 2108 UTC | TROPICS05 | 1006 hPa | 31 kts | 28 kts | 34 kts | 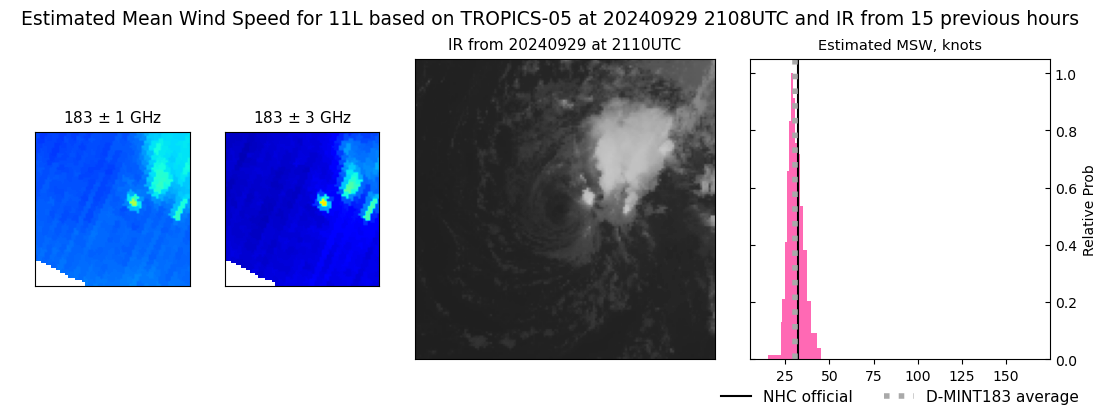 |
| 20240929 | 2102 UTC | SSMISF17 | 1005 hPa | 32 kts | 28 kts | 35 kts | 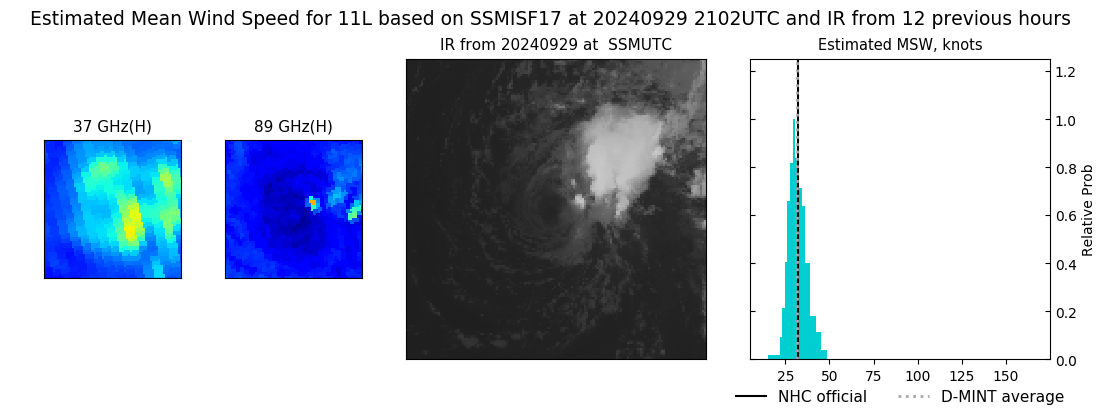 |
| 20240929 | 2040 UTC | SSMISF16 | 1007 hPa | 30 kts | 28 kts | 33 kts |  |
| 20240929 | 2040 UTC | SSMISF16 | 1007 hPa | 30 kts | 28 kts | 33 kts |  |
| 20240929 | 1427 UTC | TROPICS05 | 1006 hPa | 31 kts | 28 kts | 34 kts | 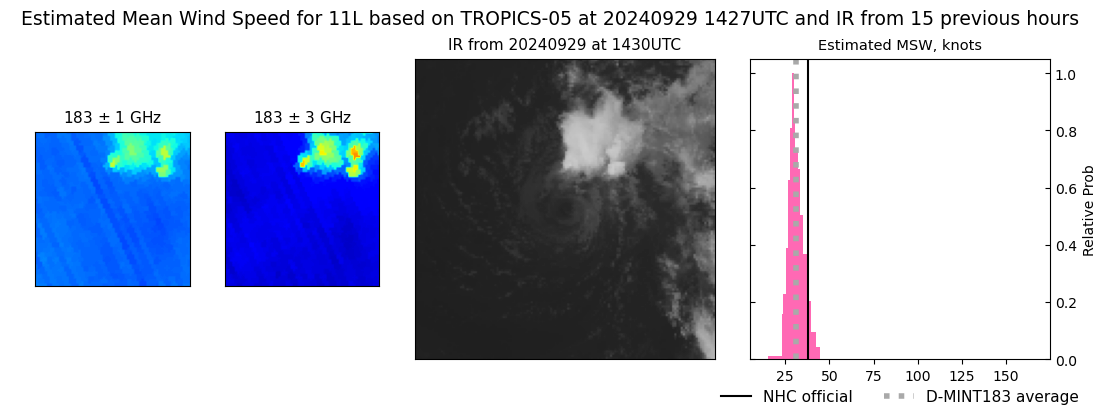 |
| 20240929 | 0947 UTC | SSMISF17 | 1005 hPa | 35 kts | 32 kts | 39 kts | 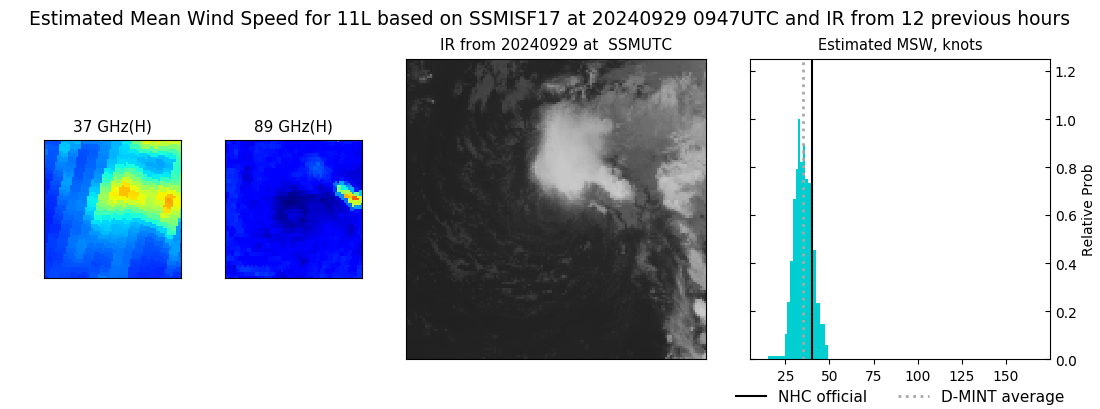 |
| 20240929 | 0924 UTC | SSMISF16 | 1007 hPa | 31 kts | 28 kts | 34 kts |  |
| 20240929 | 0706 UTC | SSMISF18 | 1003 hPa | 39 kts | 35 kts | 43 kts | 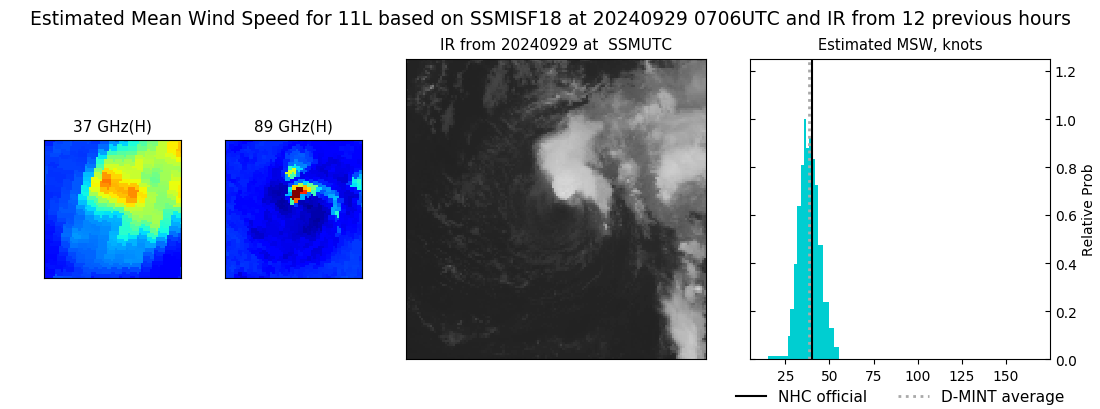 |
| 20240929 | 0608 UTC | GMI | 1004 hPa | 38 kts | 34 kts | 42 kts | 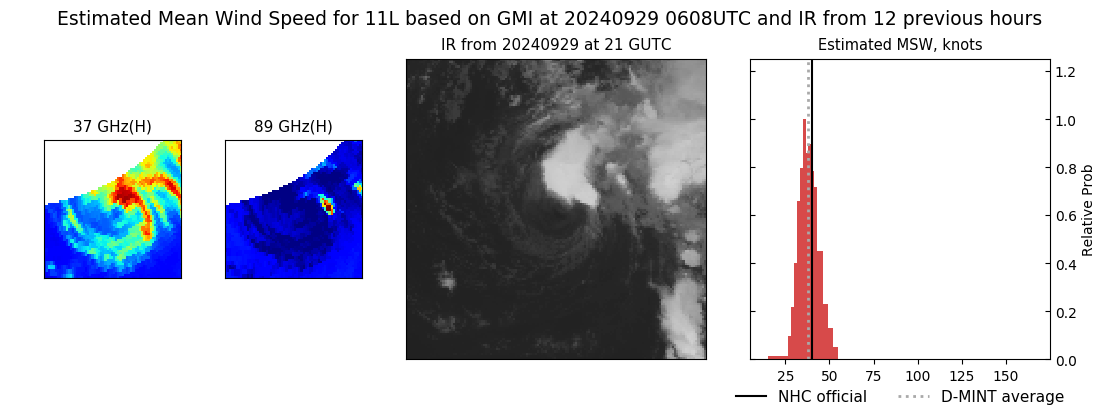 |
| 20240929 | 0533 UTC | ATMS-N21 | 1007 hPa | 32 kts | 29 kts | 35 kts | 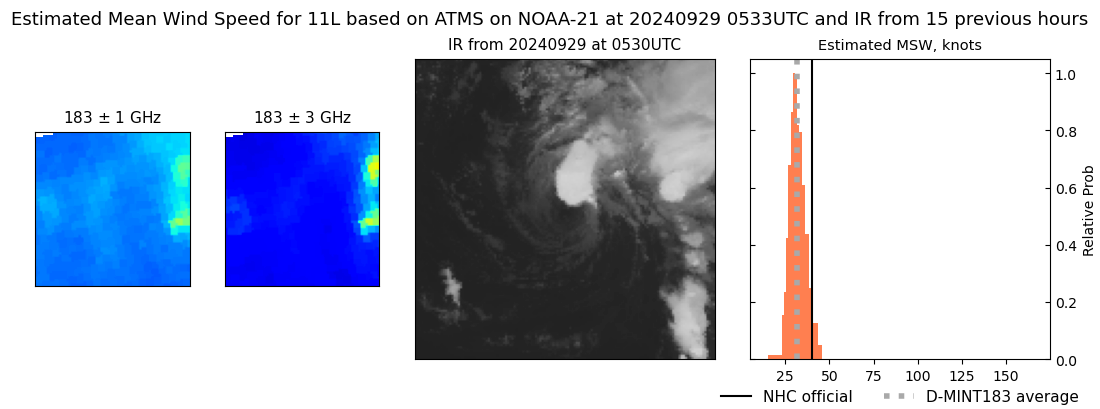 |
| 20240929 | 0441 UTC | AMSR2 | 1004 hPa | 39 kts | 35 kts | 43 kts | 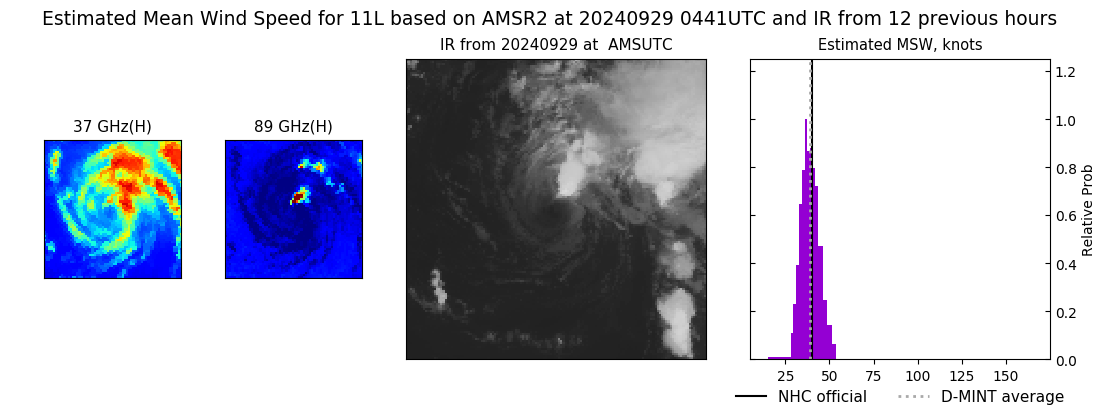 |
| 20240929 | 0441 UTC | AMSR2 | 1004 hPa | 39 kts | 35 kts | 43 kts | 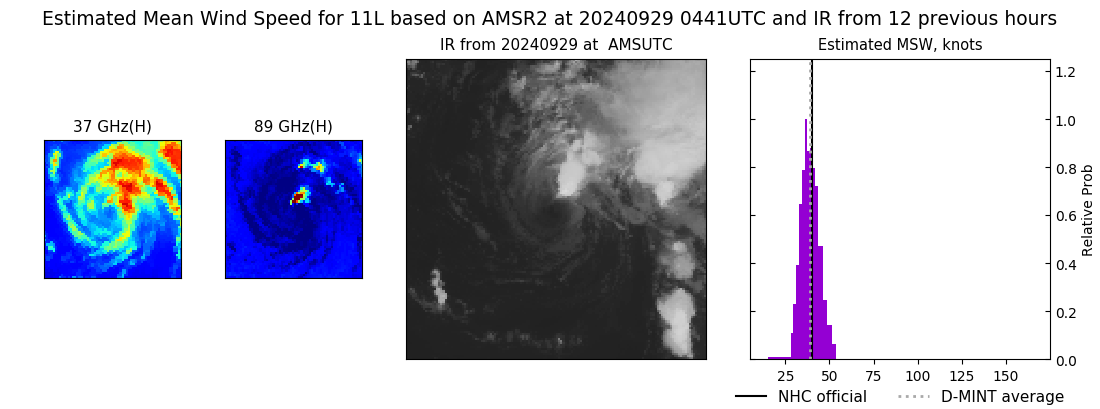 |
| 20240928 | 2134 UTC | TROPICS05 | 1007 hPa | 41 kts | 37 kts | 45 kts | 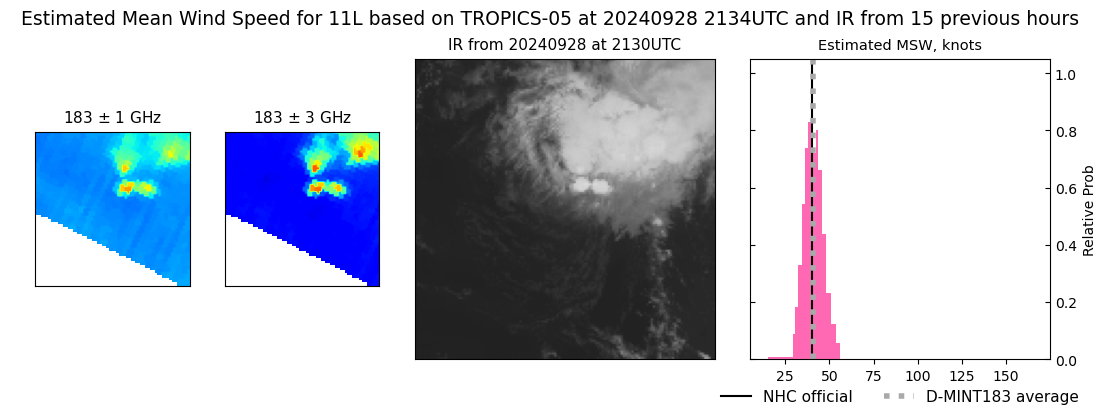 |
| 20240928 | 2115 UTC | SSMISF17 | 1007 hPa | 38 kts | 34 kts | 43 kts | 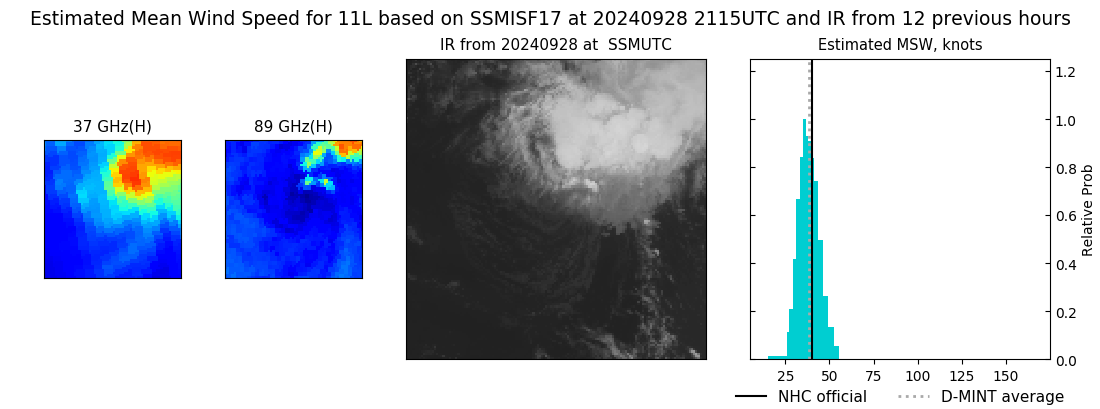 |
| 20240928 | 2052 UTC | SSMISF16 | 1008 hPa | 37 kts | 33 kts | 41 kts |  |
| 20240928 | 1834 UTC | SSMISF18 | 1004 hPa | 43 kts | 38 kts | 47 kts | 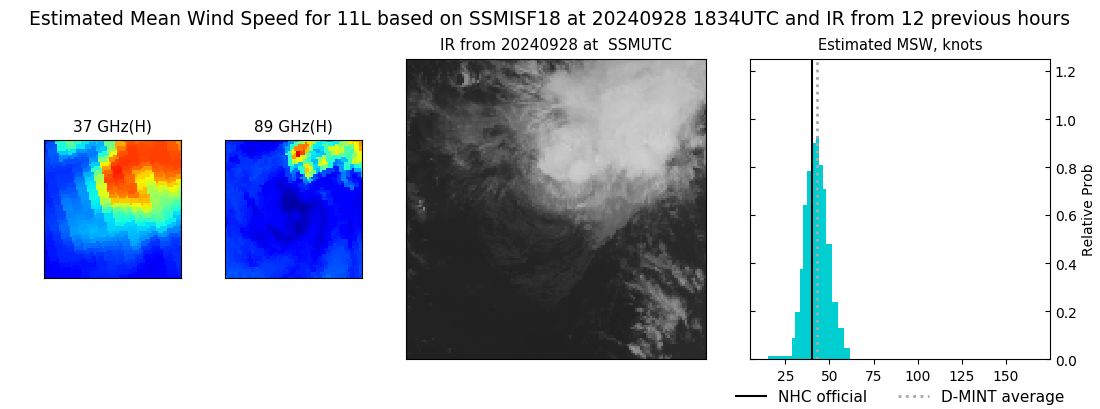 |
| 20240928 | 1631 UTC | AMSR2 | 1001 hPa | 47 kts | 42 kts | 52 kts | 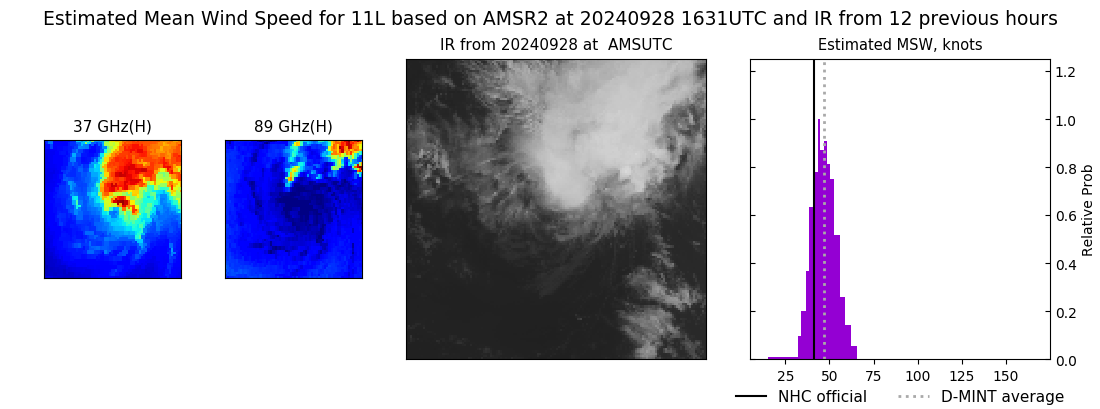 |
| 20240928 | 1612 UTC | ATMS-N20 | 1002 hPa | 44 kts | 40 kts | 48 kts | 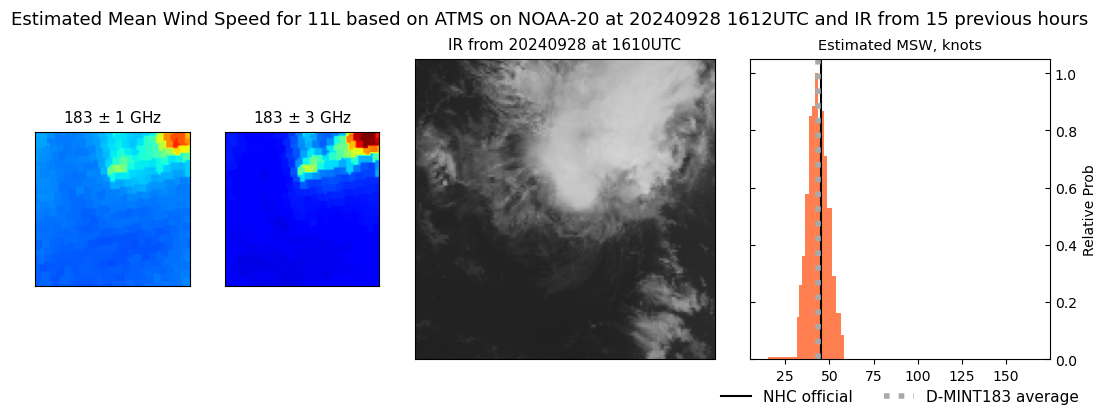 |
| 20240928 | 1355 UTC | TROPICS06 | 1001 hPa | 46 kts | 41 kts | 50 kts | 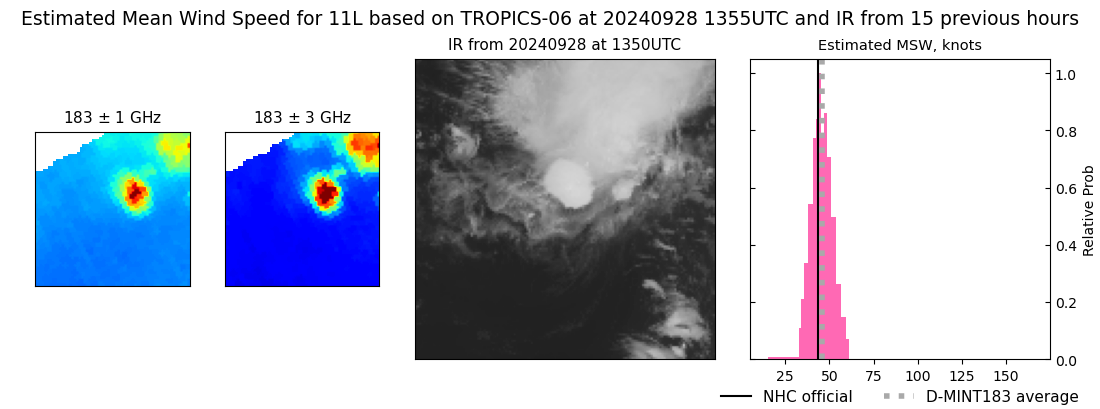 |
| 20240928 | 0938 UTC | SSMISF16 | 1000 hPa | 46 kts | 40 kts | 52 kts | 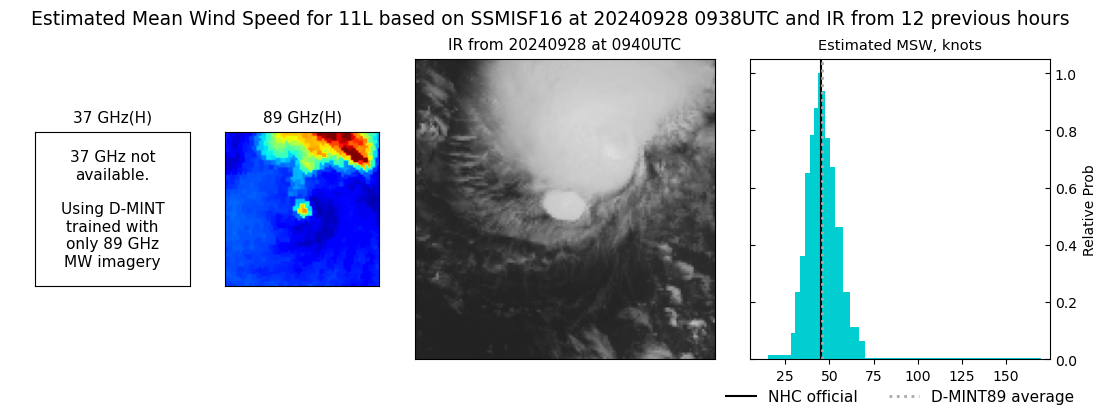 |
| 20240928 | 0721 UTC | SSMISF18 | 1000 hPa | 44 kts | 39 kts | 49 kts | 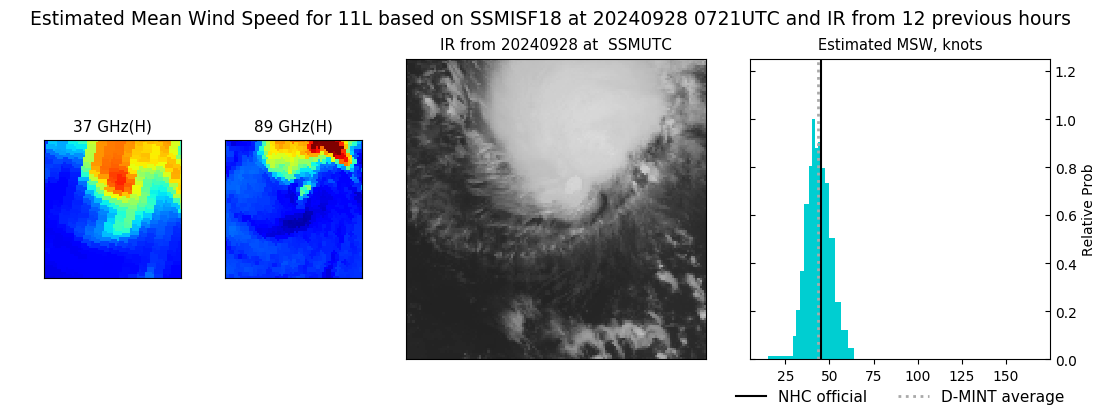 |
| 20240928 | 0412 UTC | ATMS-N21 | 1003 hPa | 46 kts | 42 kts | 51 kts | 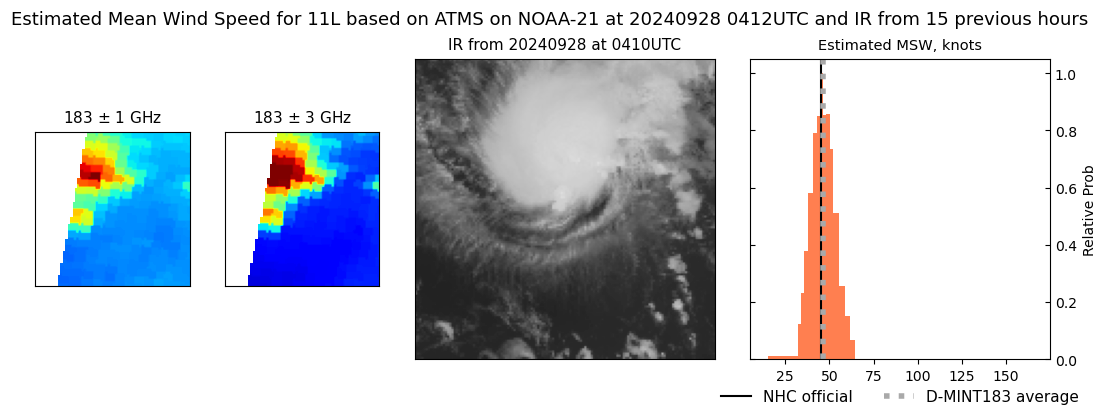 |
| 20240928 | 0216 UTC | TROPICS03 | 1001 hPa | 47 kts | 43 kts | 52 kts | 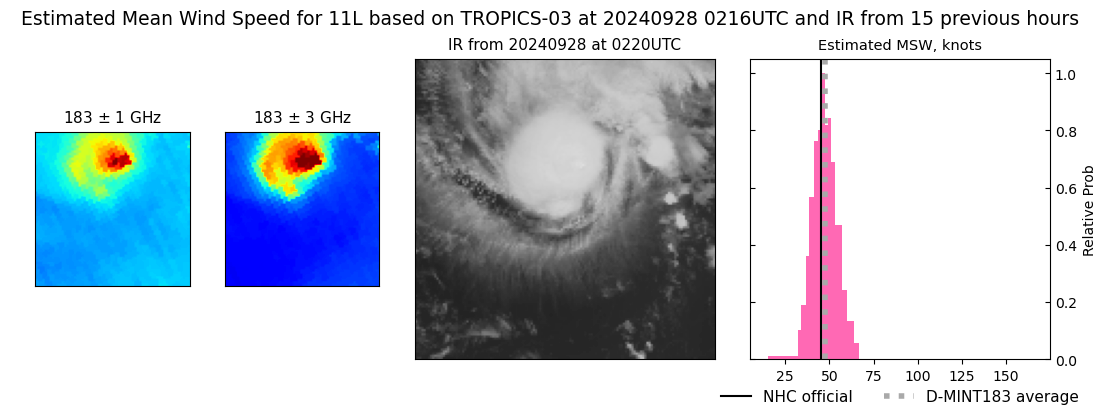 |
| 20240927 | 2104 UTC | SSMISF16 | 998 hPa | 48 kts | 41 kts | 54 kts | 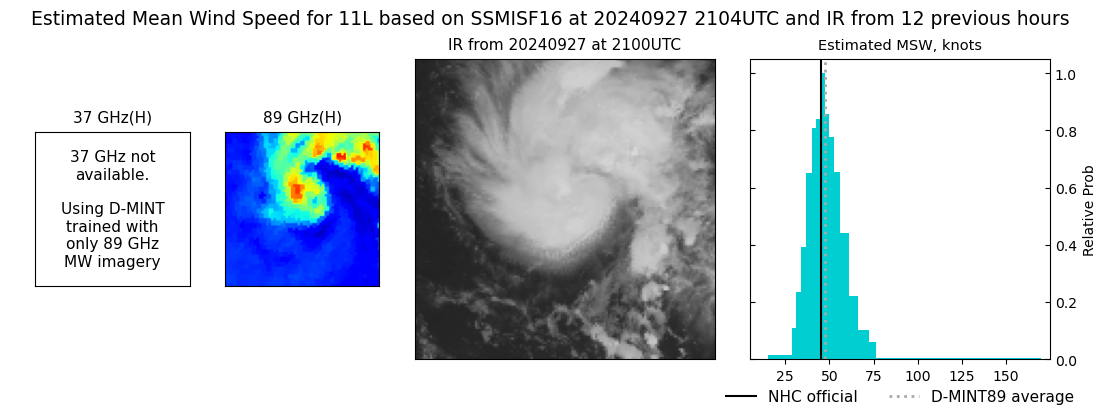 |
| 20240927 | 1923 UTC | GMI | 1001 hPa | 45 kts | 40 kts | 51 kts | 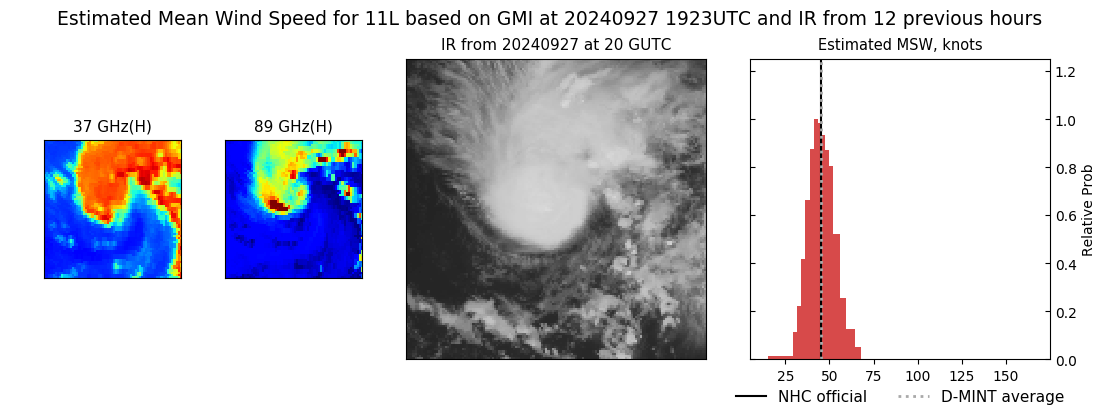 |
| 20240927 | 1847 UTC | SSMISF18 | 1004 hPa | 46 kts | 41 kts | 51 kts | 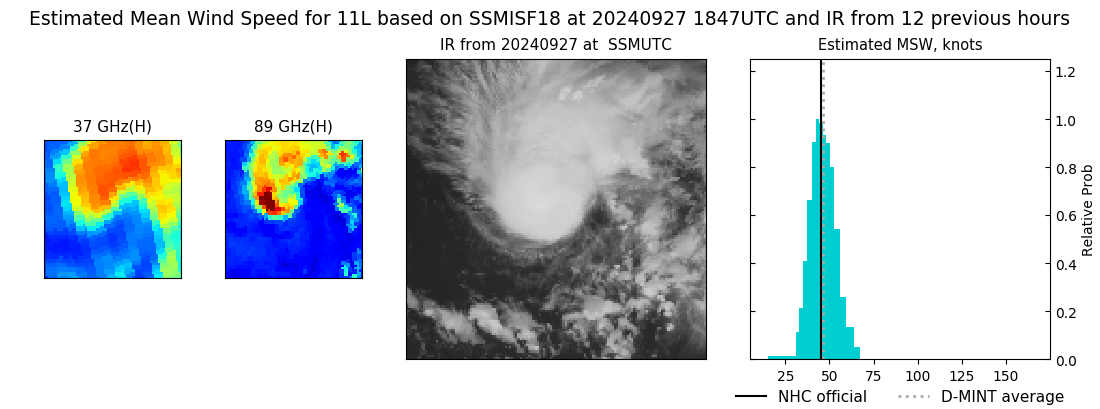 |
| 20240927 | 1548 UTC | AMSR2 | 1006 hPa | 45 kts | 41 kts | 50 kts | 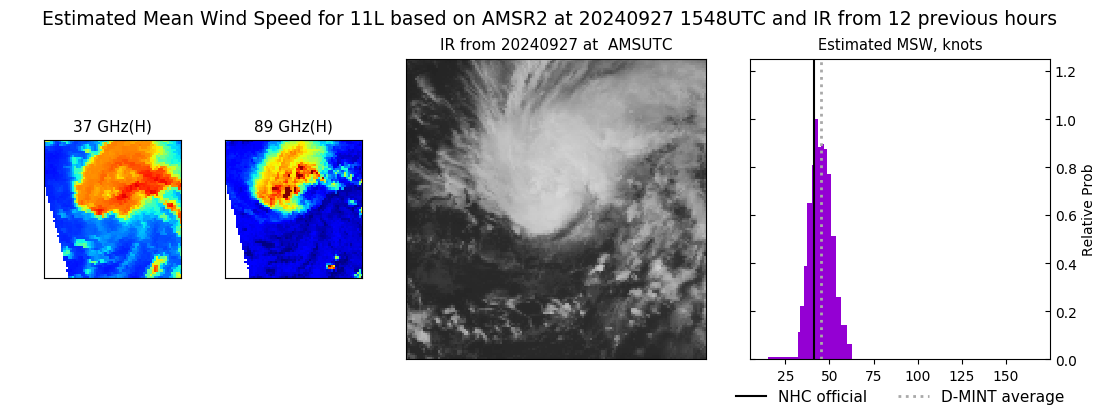 |
| 20240927 | 1542 UTC | ATMS-N21 | 1006 hPa | 38 kts | 34 kts | 42 kts | 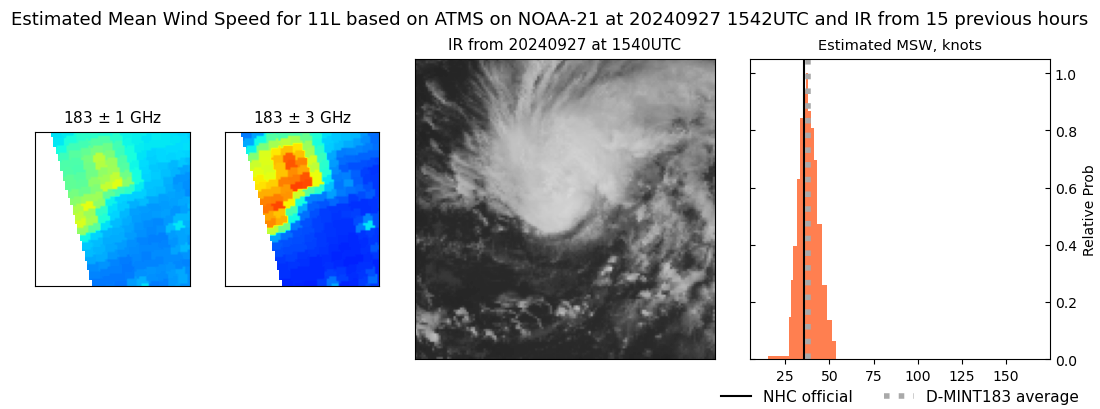 |
| 20240927 | 1424 UTC | TROPICS06 | 1005 hPa | 38 kts | 34 kts | 42 kts | 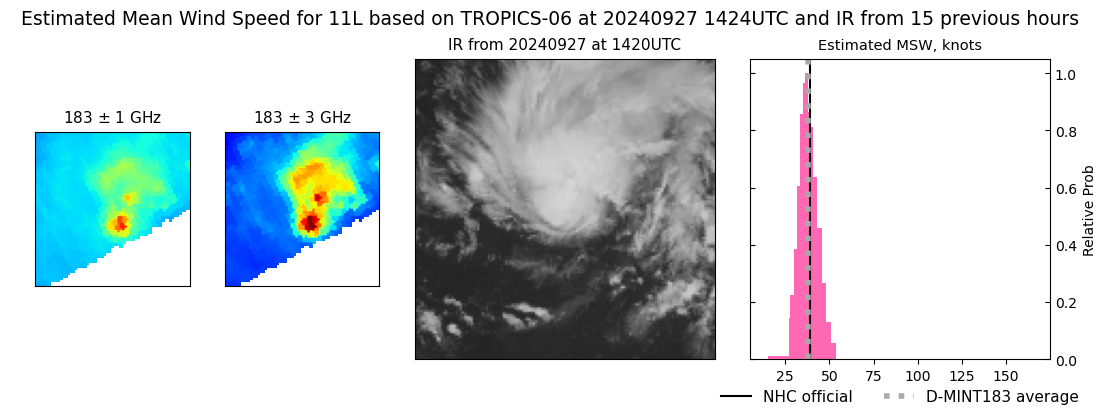 |
| 20240927 | 0455 UTC | AMSR2 | 1007 hPa | 33 kts | 30 kts | 37 kts | 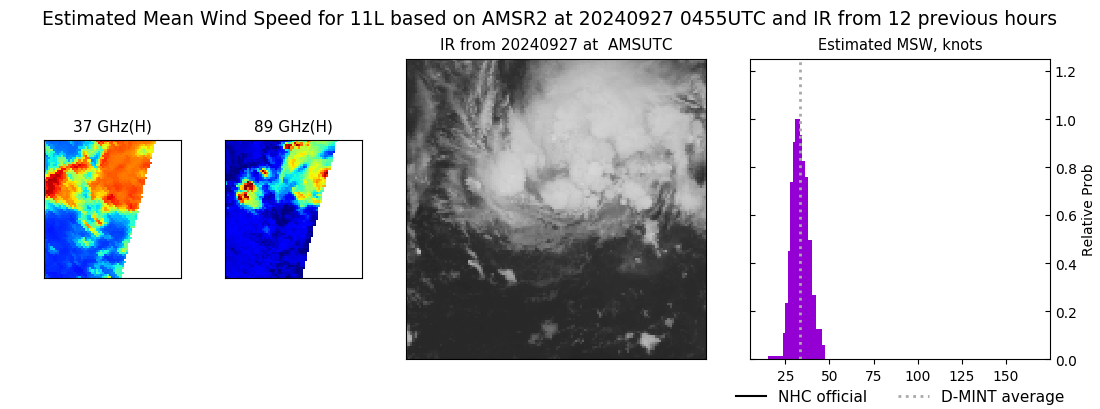 |
| 20240926 | 0849 UTC | SSMISF17 | NaN hPa | 32 kts | 29 kts | 37 kts |  |
| 20240926 | 0825 UTC | SSMISF16 | NaN hPa | 27 kts | 24 kts | 30 kts |  |
| 20240926 | 0648 UTC | GMI | NaN hPa | 31 kts | 28 kts | 34 kts |  |
| 20240926 | 0608 UTC | SSMISF18 | NaN hPa | 35 kts | 31 kts | 39 kts |  |
| 20240926 | 0412 UTC | AMSR2 | NaN hPa | 28 kts | 25 kts | 32 kts |  |
| 20240925 | 2013 UTC | SSMISF17 | NaN hPa | 28 kts | 25 kts | 31 kts |  |
| 20240925 | 1950 UTC | SSMISF16 | NaN hPa | 24 kts | 22 kts | 27 kts |  |
| 20240925 | 1917 UTC | GMI | NaN hPa | 25 kts | 23 kts | 27 kts |  |
| 20240925 | 1733 UTC | SSMISF18 | NaN hPa | 26 kts | 24 kts | 29 kts |  |
| 20240925 | 1559 UTC | AMSR2 | NaN hPa | 23 kts | 21 kts | 25 kts |  |
| 20240925 | 0838 UTC | SSMISF16 | NaN hPa | 26 kts | 23 kts | 29 kts |  |
| 20240925 | 0622 UTC | SSMISF18 | NaN hPa | 26 kts | 24 kts | 29 kts |  |
|
