|
Storm: 12E
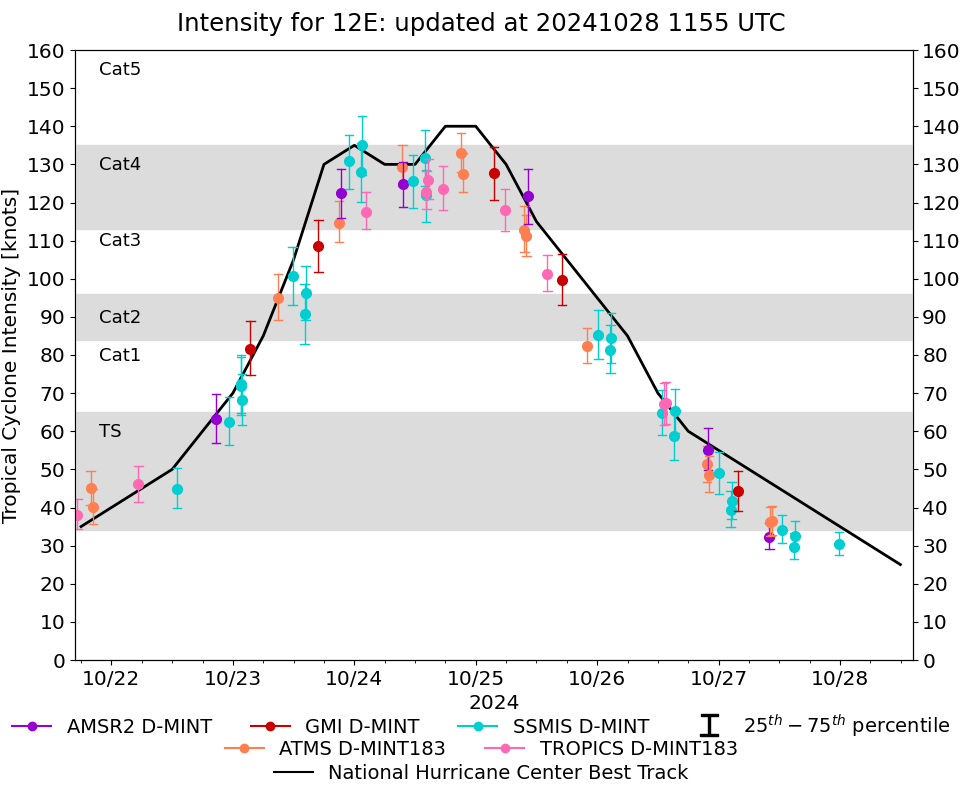
D-MINT HISTORY FILE for 2024_12E
| Date | Time | MW Sensor | MSLP | Vmax
(30th-70th percentile average) | Vmax
25th percentile | Vmax
75th percentile | Image |
| 20241027 | 2350 UTC | SSMISF18 | 1010 hPa | 30 kts | 28 kts | 34 kts | 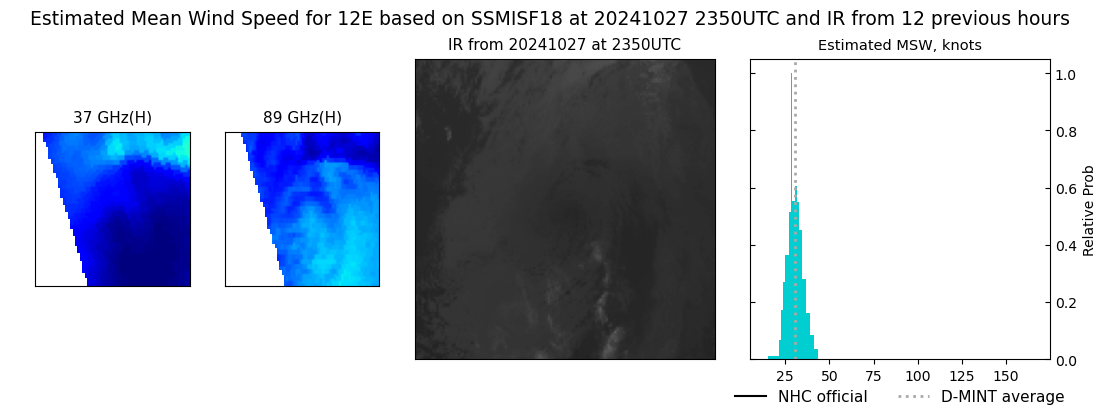 |
| 20241027 | 1505 UTC | SSMISF17 | 1008 hPa | 33 kts | 29 kts | 36 kts | 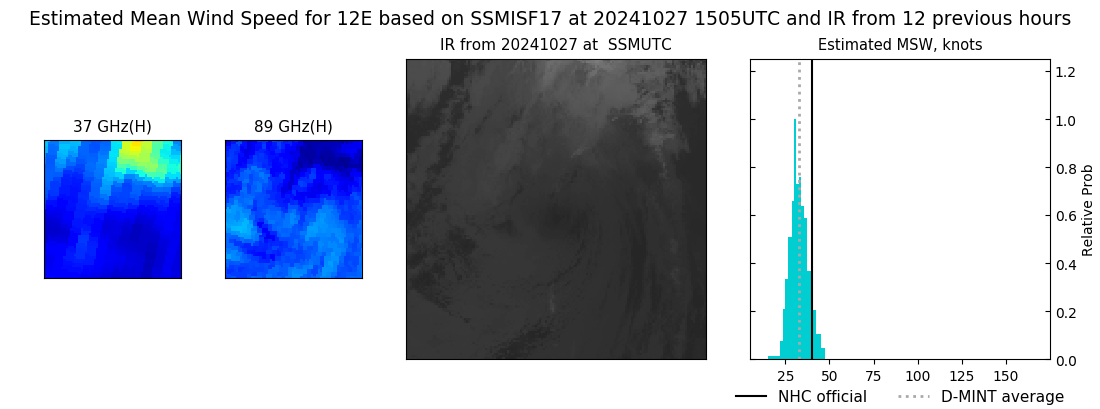 |
| 20241027 | 1455 UTC | SSMISF16 | 1007 hPa | 30 kts | 27 kts | 33 kts | 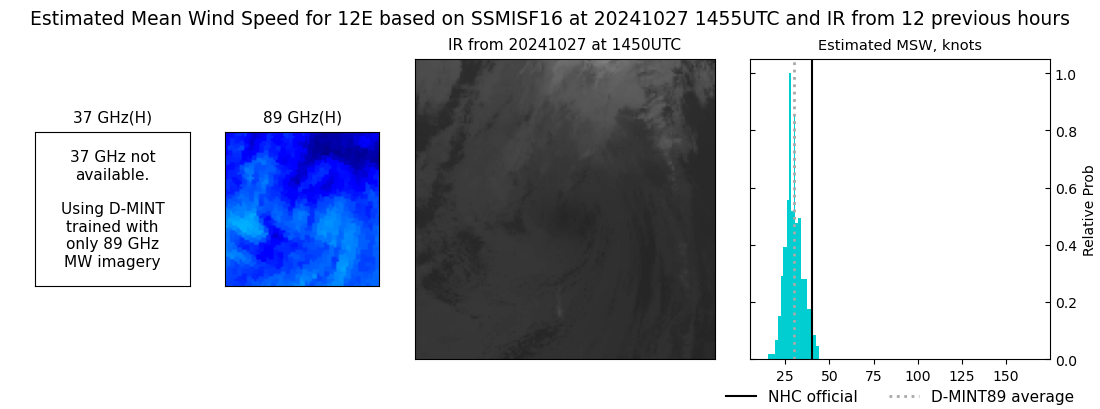 |
| 20241027 | 1234 UTC | SSMISF18 | 1009 hPa | 34 kts | 31 kts | 38 kts | 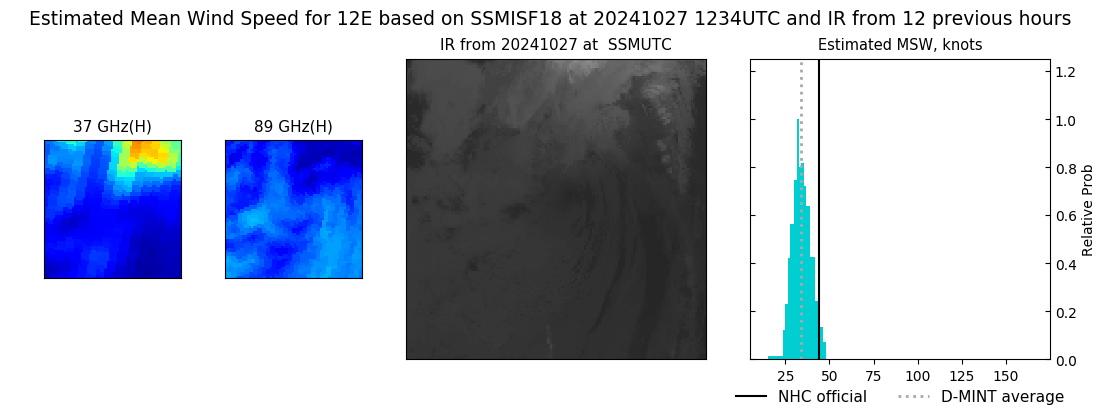 |
| 20241027 | 1036 UTC | ATMS-NPP | 1004 hPa | 36 kts | 33 kts | 40 kts | 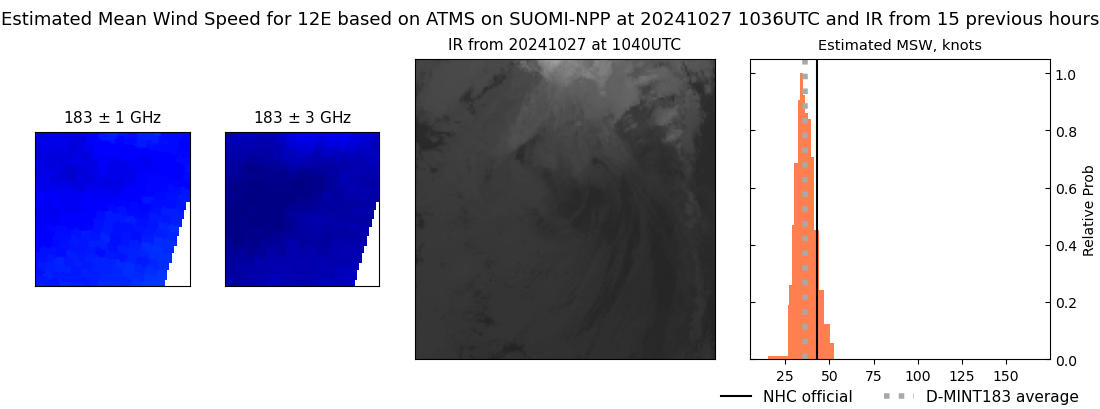 |
| 20241027 | 1013 UTC | ATMS-N21 | 1004 hPa | 36 kts | 33 kts | 40 kts | 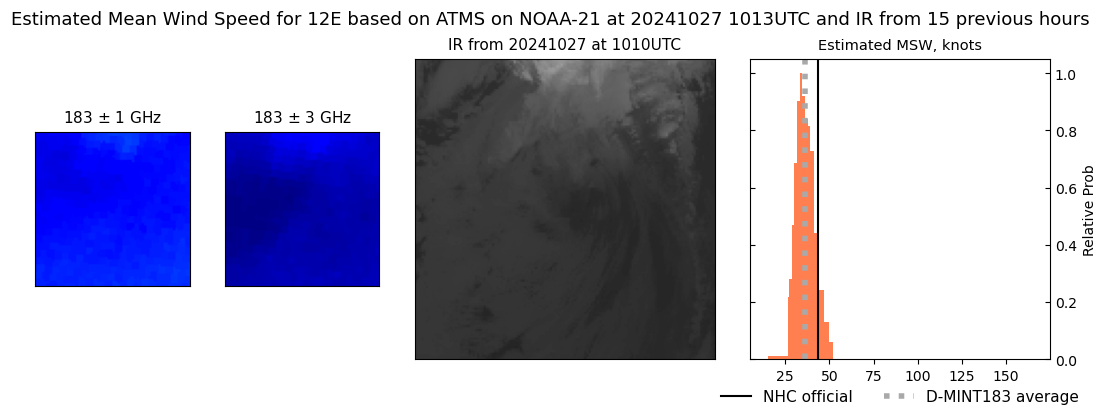 |
| 20241027 | 1003 UTC | AMSR2 | 1008 hPa | 32 kts | 29 kts | 36 kts | 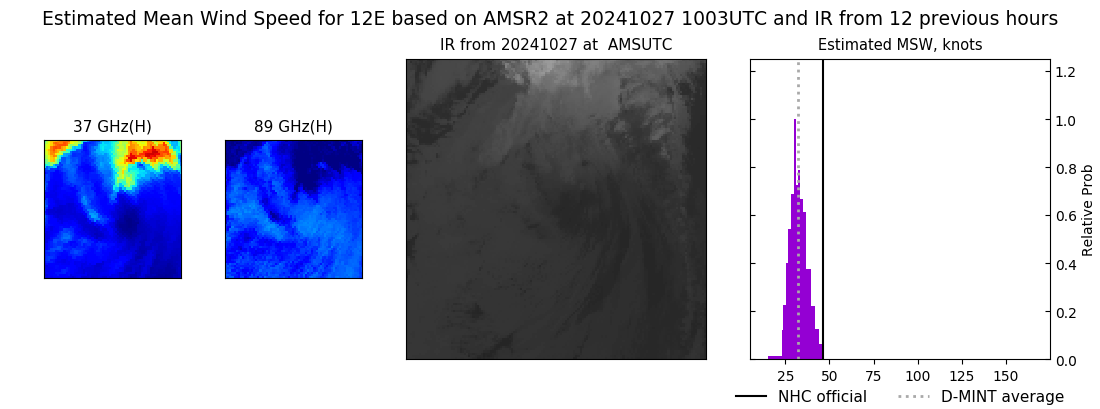 |
| 20241027 | 0348 UTC | GMI | 1001 hPa | 44 kts | 39 kts | 50 kts | 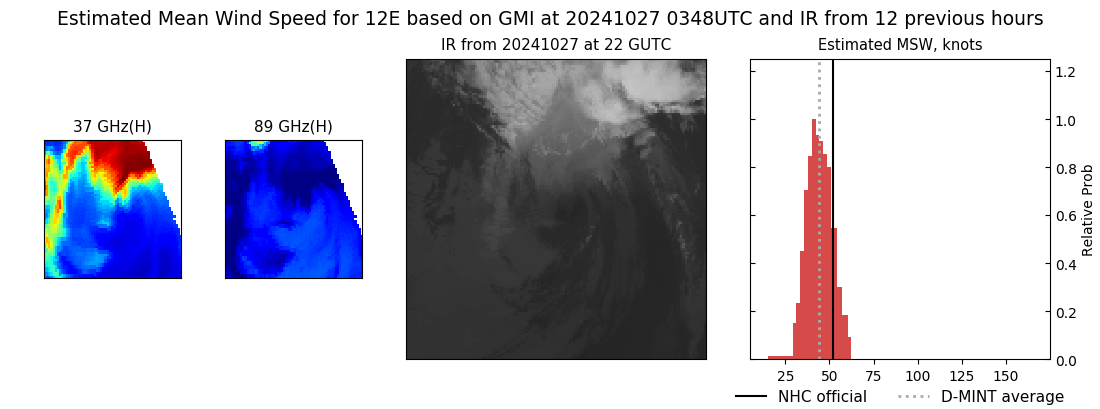 |
| 20241027 | 0234 UTC | SSMISF17 | 1001 hPa | 42 kts | 37 kts | 47 kts | 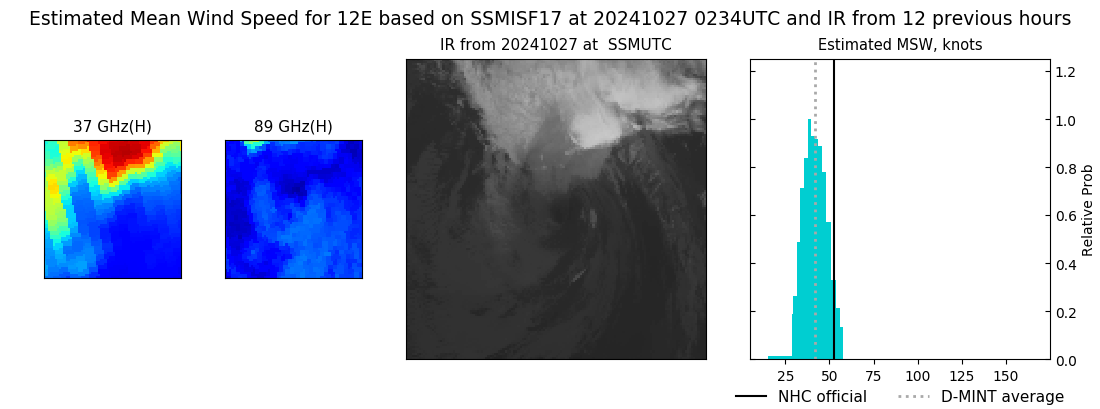 |
| 20241027 | 0223 UTC | SSMISF16 | 999 hPa | 39 kts | 35 kts | 44 kts | 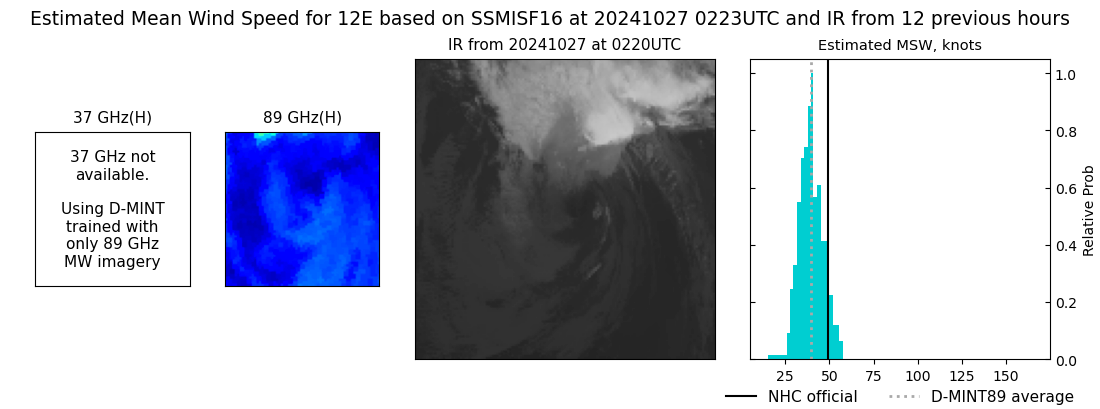 |
| 20241027 | 0002 UTC | SSMISF18 | 999 hPa | 49 kts | 44 kts | 55 kts | 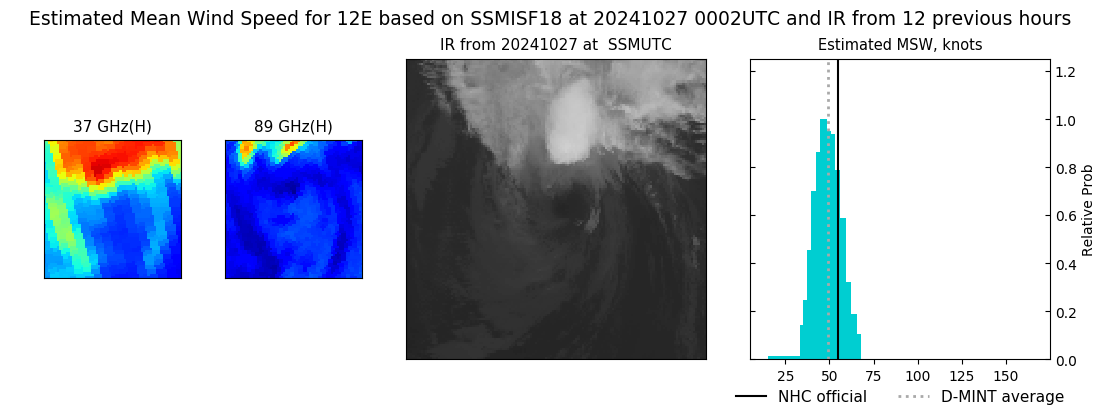 |
| 20241026 | 2208 UTC | ATMS-NPP | 994 hPa | 49 kts | 44 kts | 53 kts | 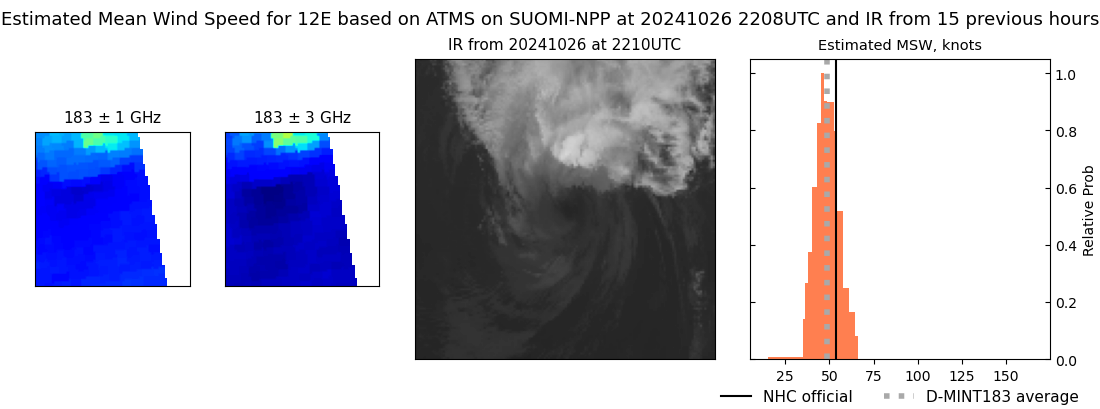 |
| 20241026 | 2153 UTC | AMSR2 | 994 hPa | 55 kts | 50 kts | 61 kts | 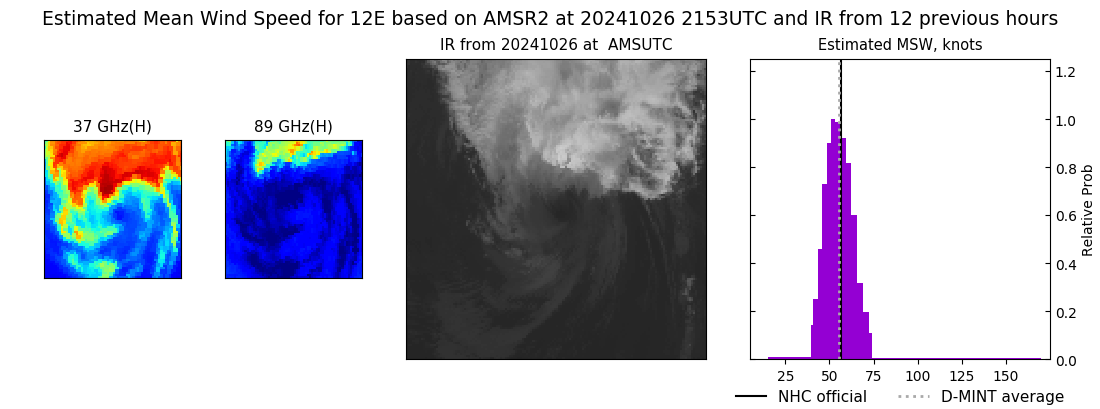 |
| 20241026 | 2145 UTC | ATMS-N21 | 986 hPa | 51 kts | 47 kts | 56 kts | 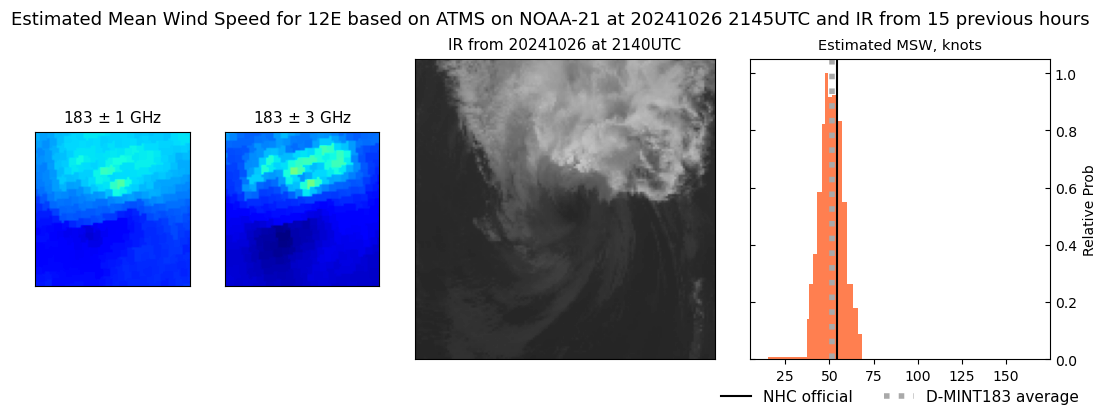 |
| 20241026 | 1520 UTC | SSMISF17 | 983 hPa | 65 kts | 60 kts | 71 kts | 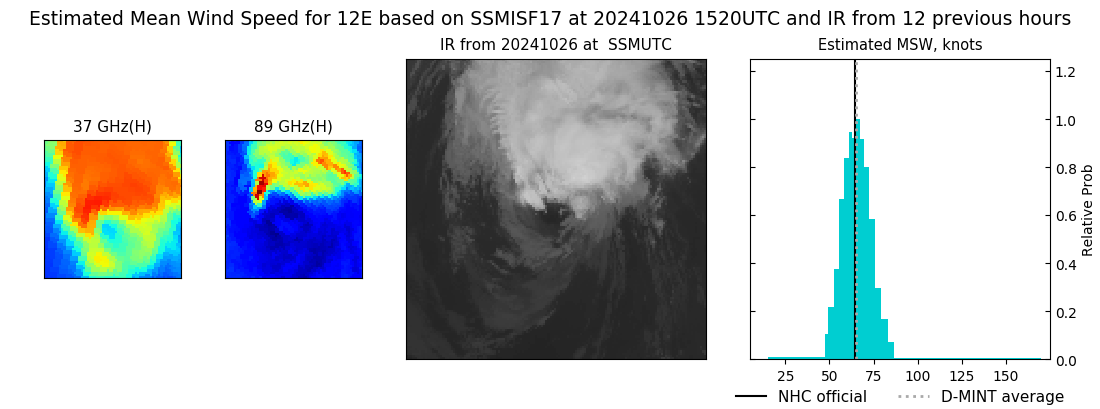 |
| 20241026 | 1510 UTC | SSMISF16 | 988 hPa | 59 kts | 52 kts | 65 kts | 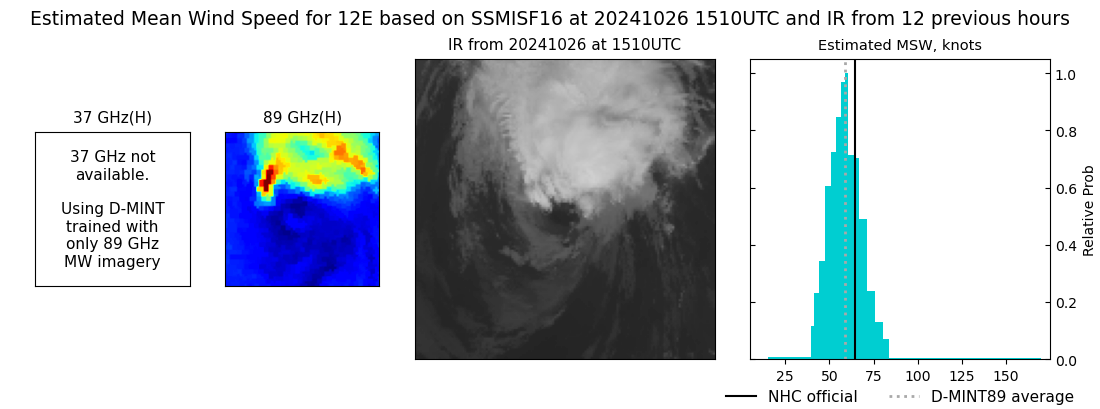 |
| 20241026 | 1339 UTC | TROPICS05 | 982 hPa | 67 kts | 62 kts | 73 kts | 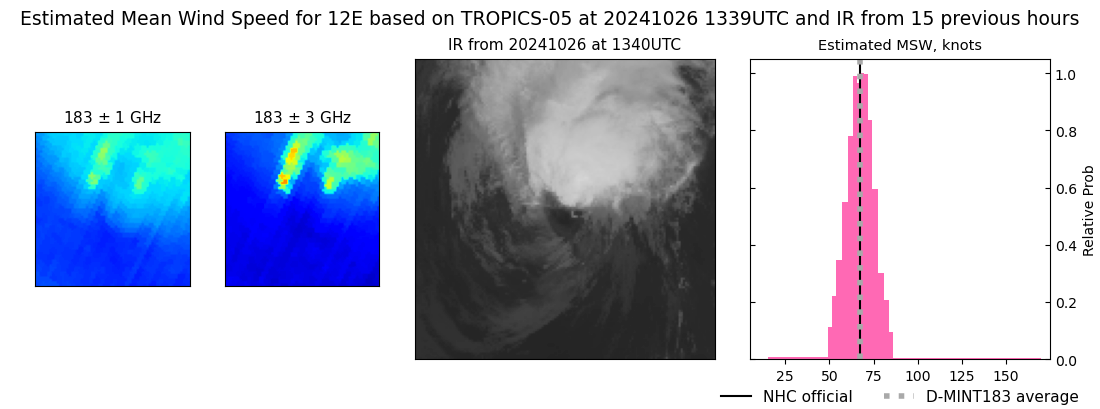 |
| 20241026 | 1312 UTC | TROPICS06 | 982 hPa | 67 kts | 62 kts | 73 kts | 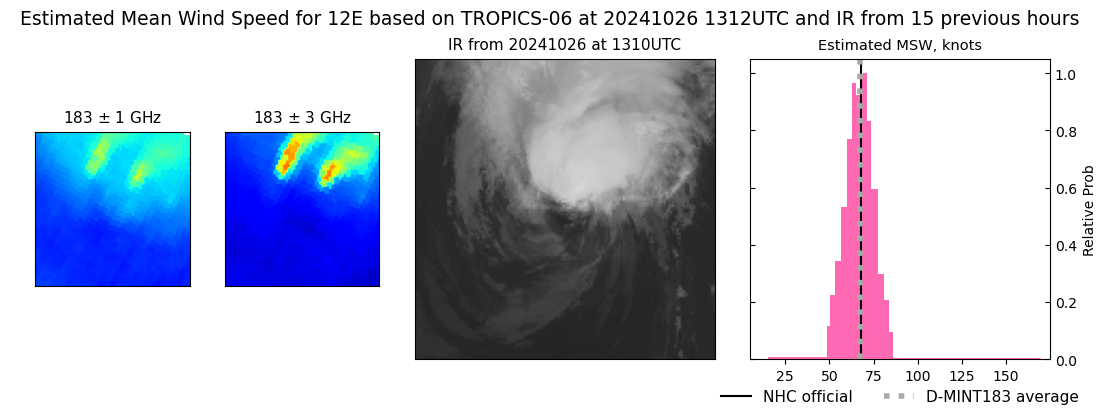 |
| 20241026 | 1248 UTC | SSMISF18 | 983 hPa | 65 kts | 59 kts | 71 kts | 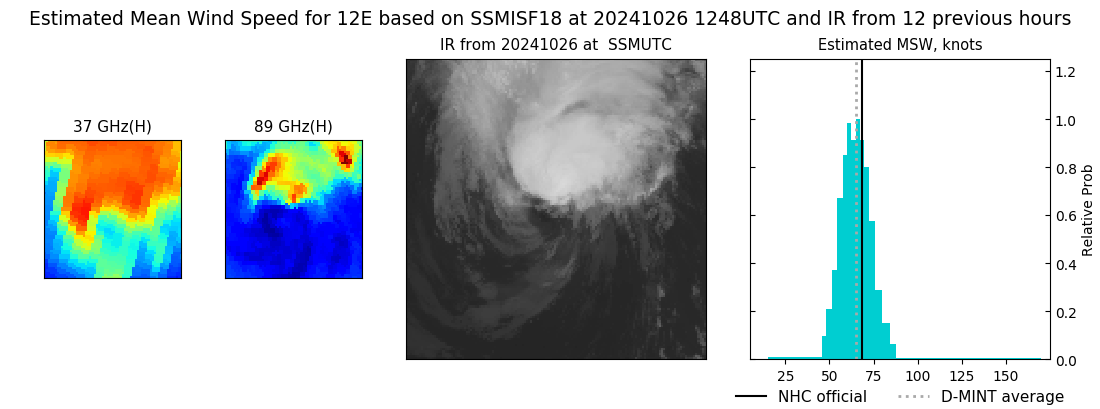 |
| 20241026 | 0247 UTC | SSMISF17 | 969 hPa | 84 kts | 78 kts | 91 kts | 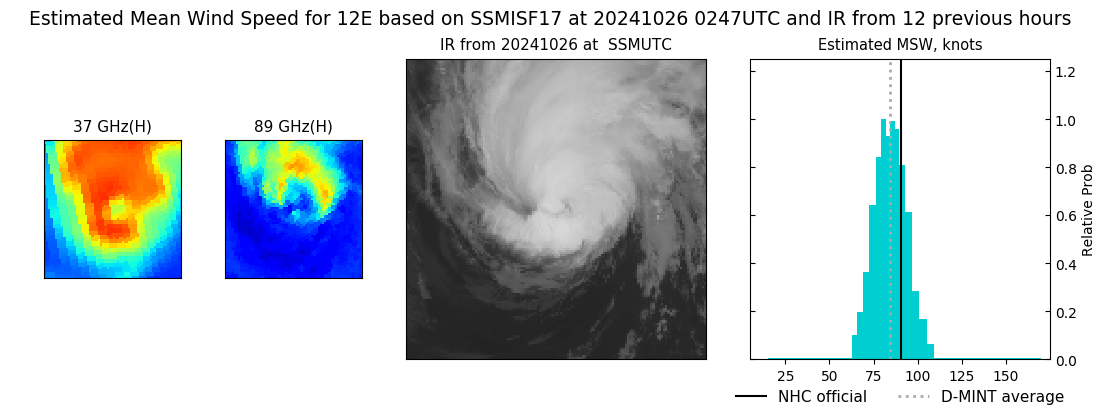 |
| 20241026 | 0236 UTC | SSMISF16 | 971 hPa | 81 kts | 75 kts | 88 kts | 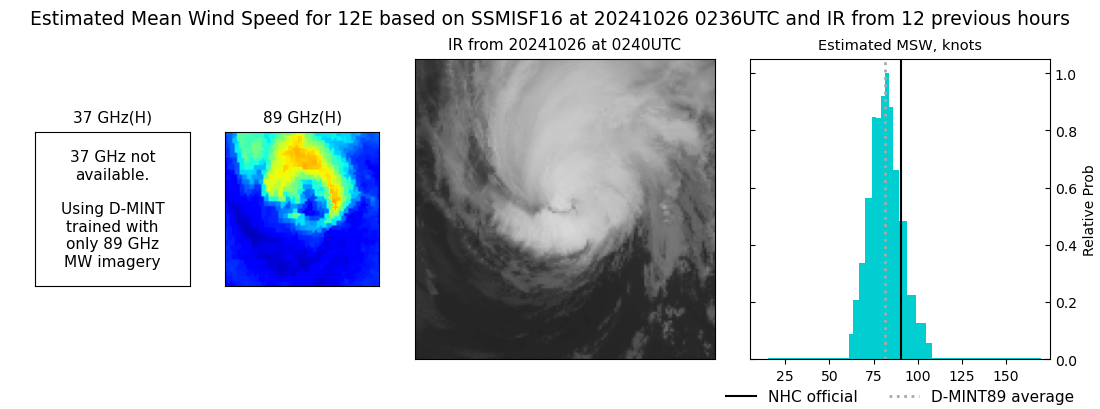 |
| 20241026 | 0015 UTC | SSMISF18 | 967 hPa | 85 kts | 79 kts | 92 kts | 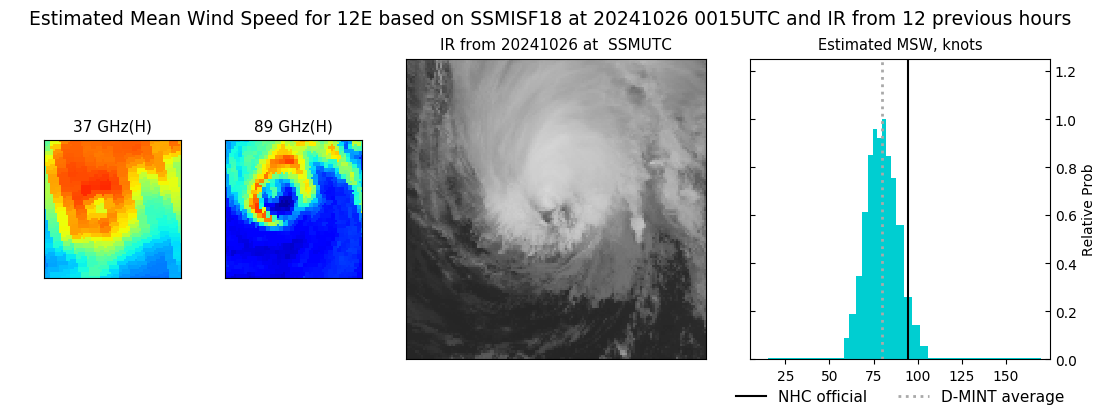 |
| 20241025 | 2202 UTC | ATMS-N21 | 967 hPa | 82 kts | 78 kts | 87 kts | 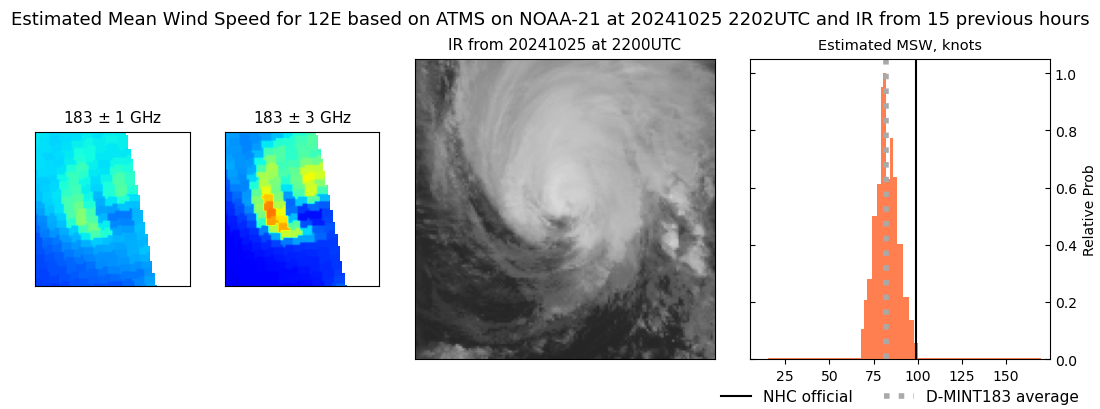 |
| 20241025 | 1703 UTC | GMI | 962 hPa | 100 kts | 93 kts | 107 kts | 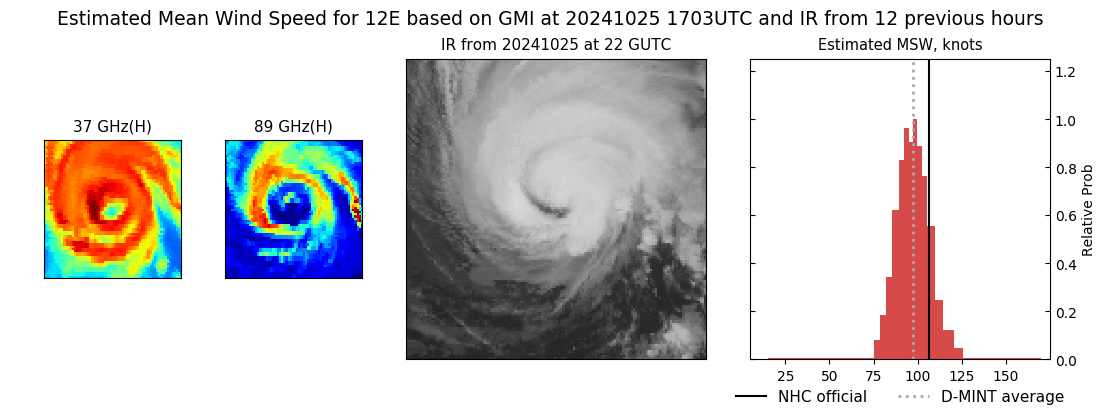 |
| 20241025 | 1409 UTC | TROPICS05 | 952 hPa | 101 kts | 97 kts | 106 kts | 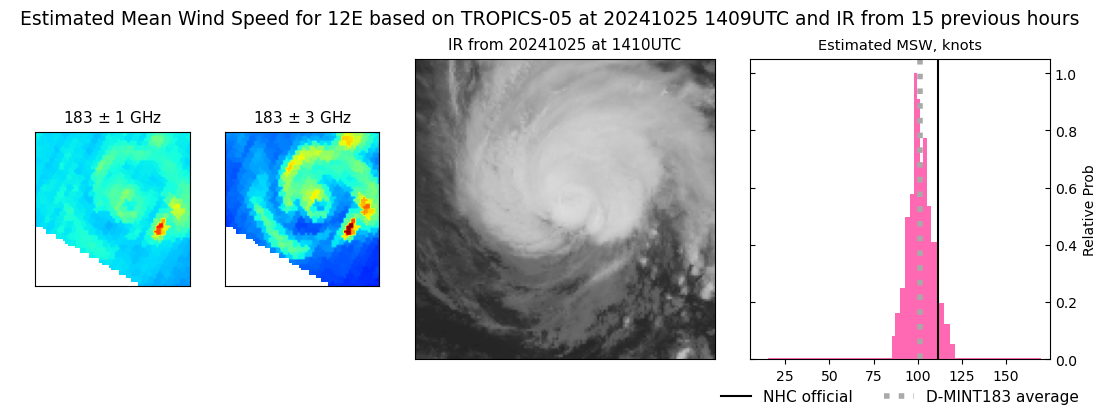 |
| 20241025 | 1017 UTC | AMSR2 | 945 hPa | 122 kts | 114 kts | 129 kts | 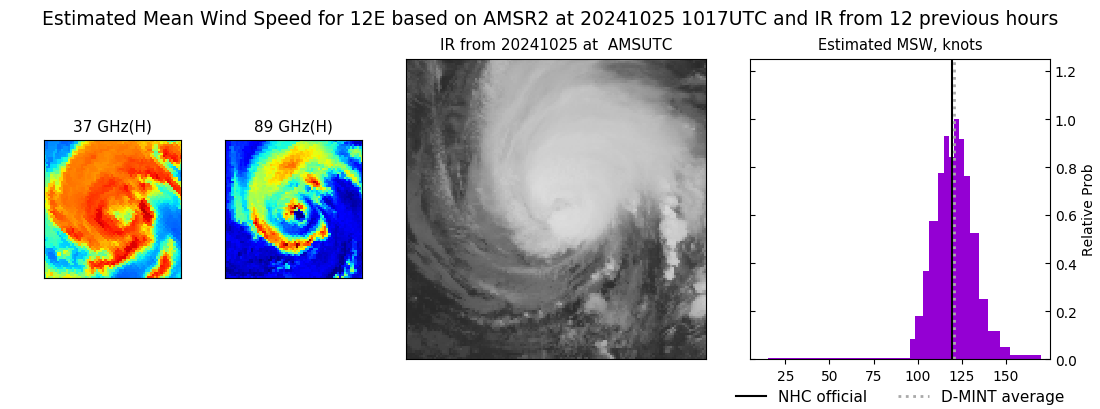 |
| 20241025 | 1000 UTC | ATMS-N20 | 944 hPa | 111 kts | 106 kts | 117 kts | 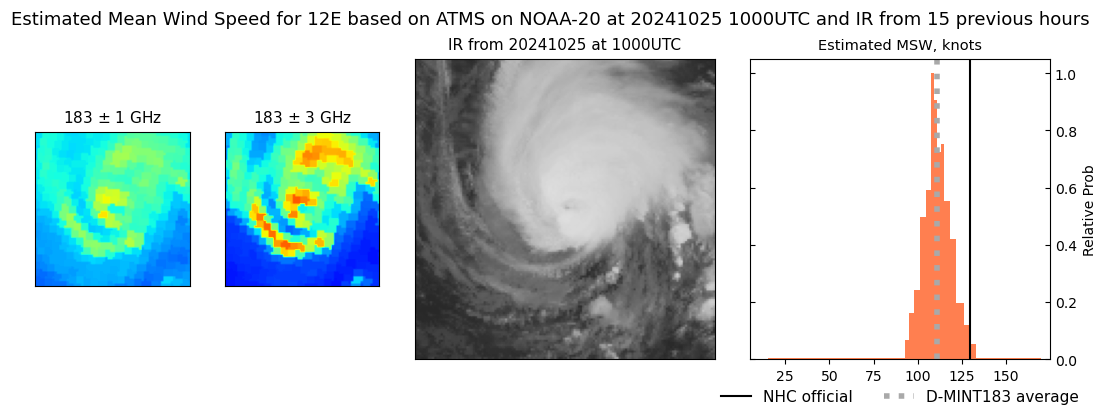 |
| 20241025 | 0936 UTC | ATMS-NPP | 946 hPa | 113 kts | 107 kts | 119 kts | 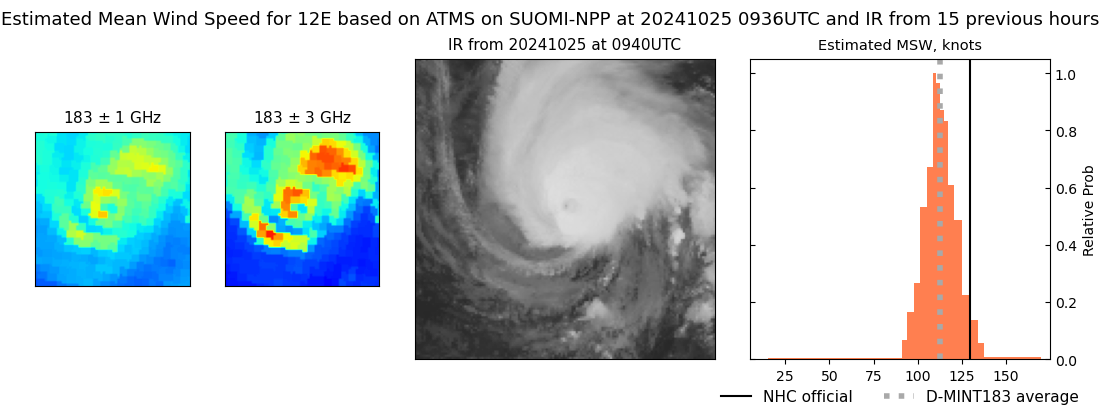 |
| 20241025 | 0547 UTC | TROPICS05 | 943 hPa | 118 kts | 113 kts | 124 kts | 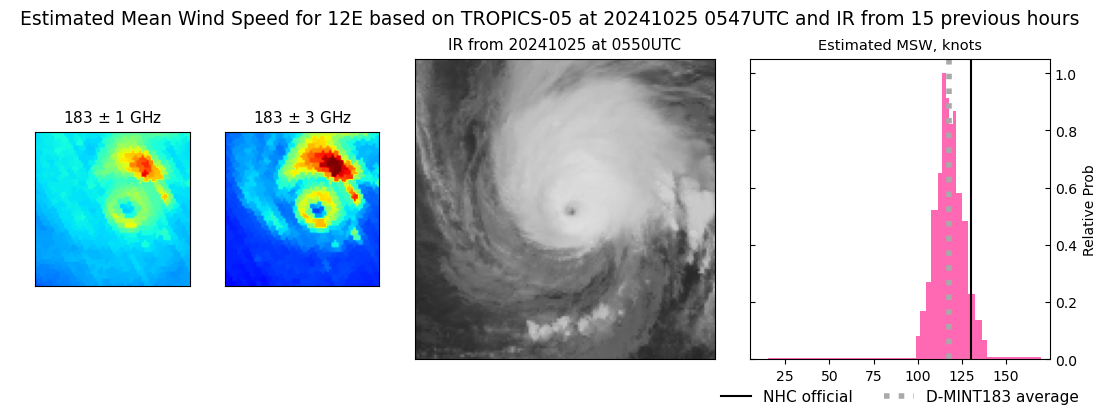 |
| 20241025 | 0338 UTC | GMI | 934 hPa | 128 kts | 121 kts | 135 kts | 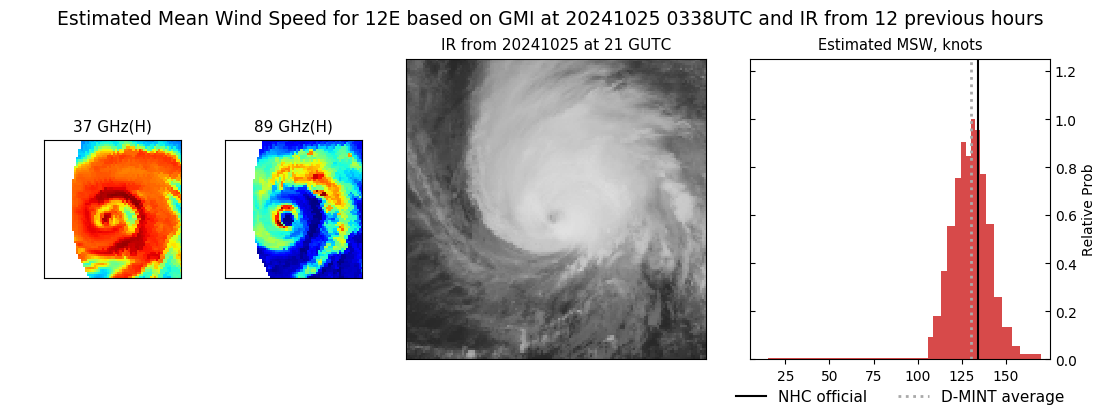 |
| 20241024 | 2127 UTC | ATMS-N20 | 936 hPa | 128 kts | 123 kts | 133 kts | 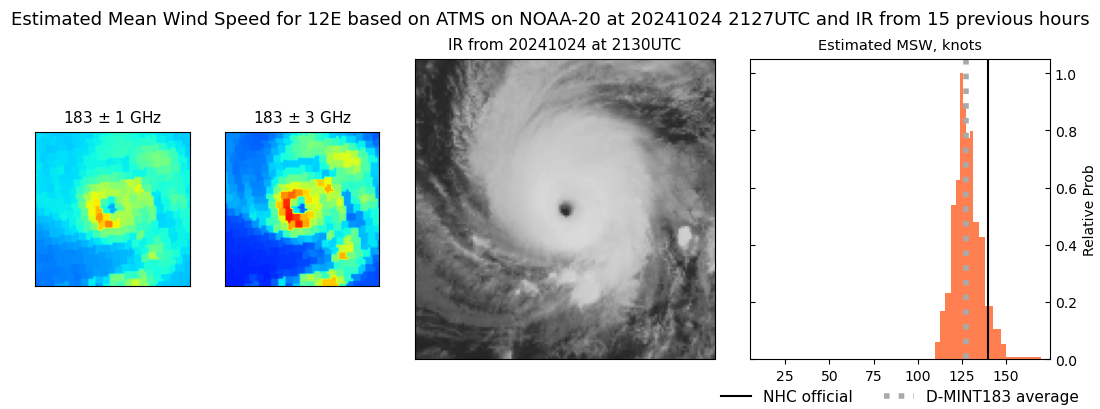 |
| 20241024 | 2103 UTC | ATMS-NPP | 936 hPa | 133 kts | 128 kts | 138 kts | 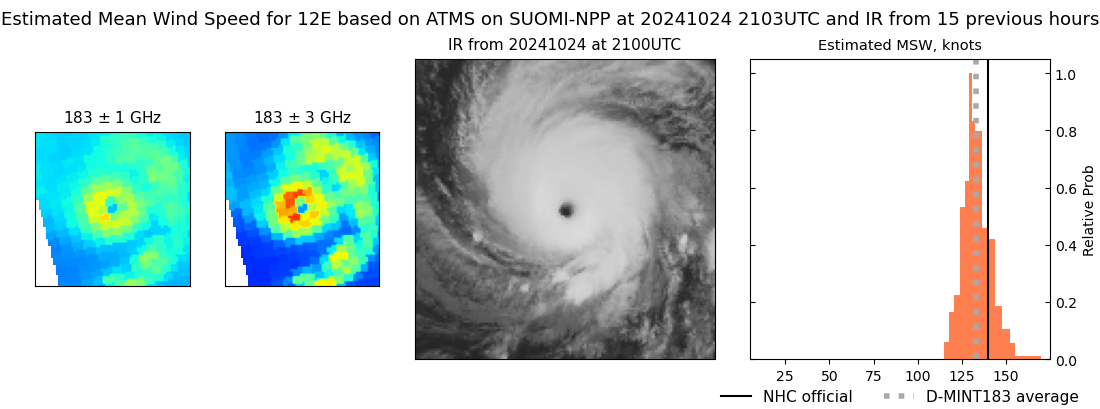 |
| 20241024 | 1729 UTC | TROPICS03 | 933 hPa | 124 kts | 118 kts | 130 kts | 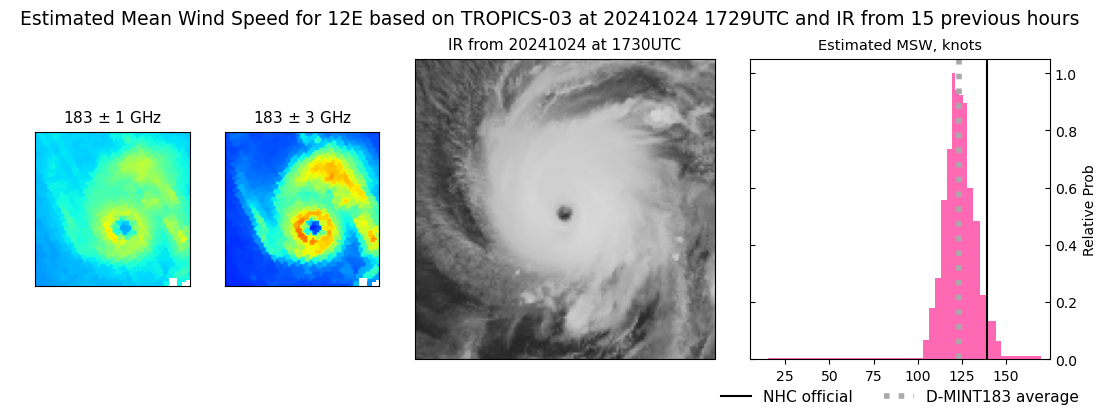 |
| 20241024 | 1438 UTC | TROPICS05 | 933 hPa | 126 kts | 121 kts | 131 kts | 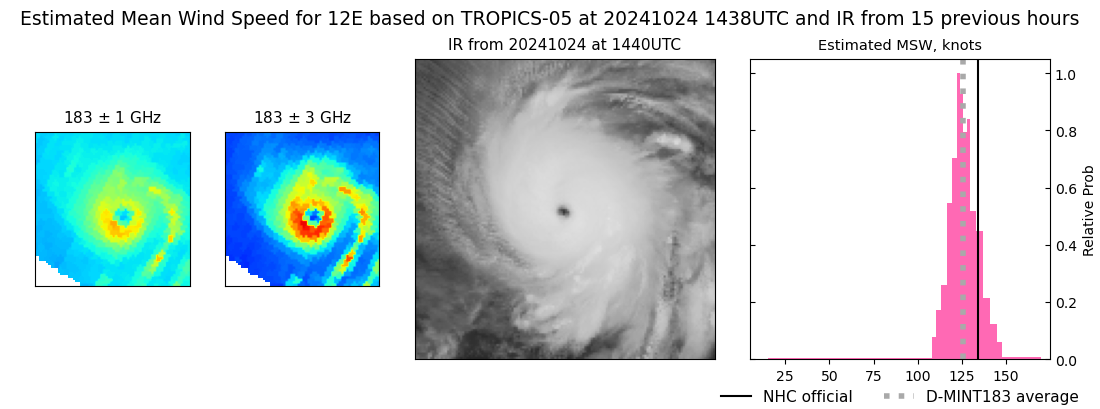 |
| 20241024 | 1416 UTC | TROPICS06 | 930 hPa | 123 kts | 118 kts | 128 kts | 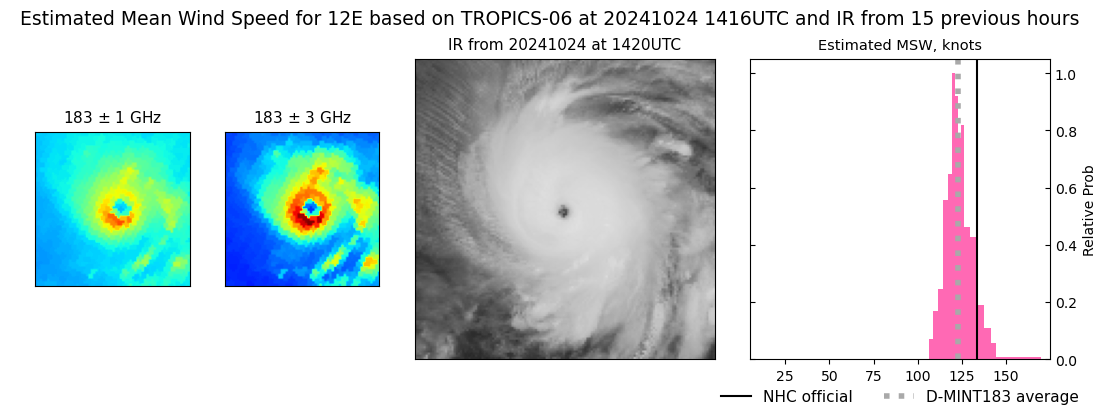 |
| 20241024 | 1409 UTC | SSMISF17 | 941 hPa | 122 kts | 115 kts | 129 kts | 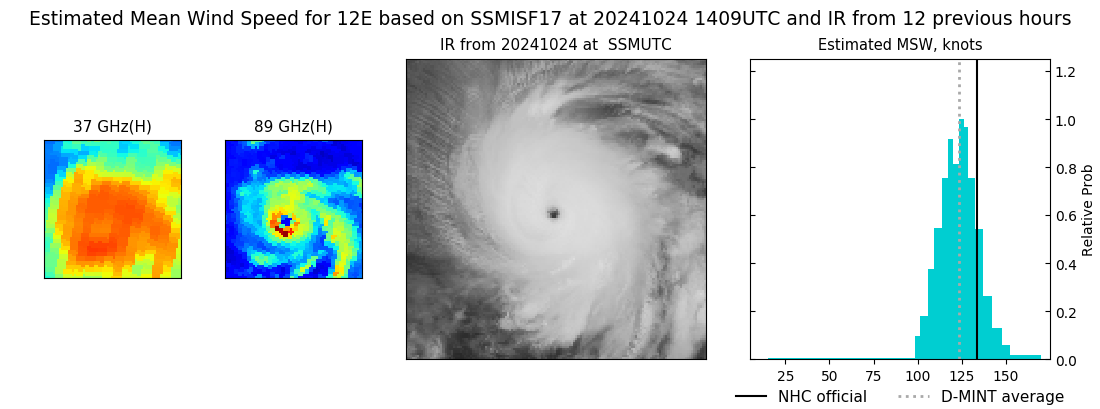 |
| 20241024 | 1357 UTC | SSMISF16 | 939 hPa | 132 kts | 124 kts | 139 kts | 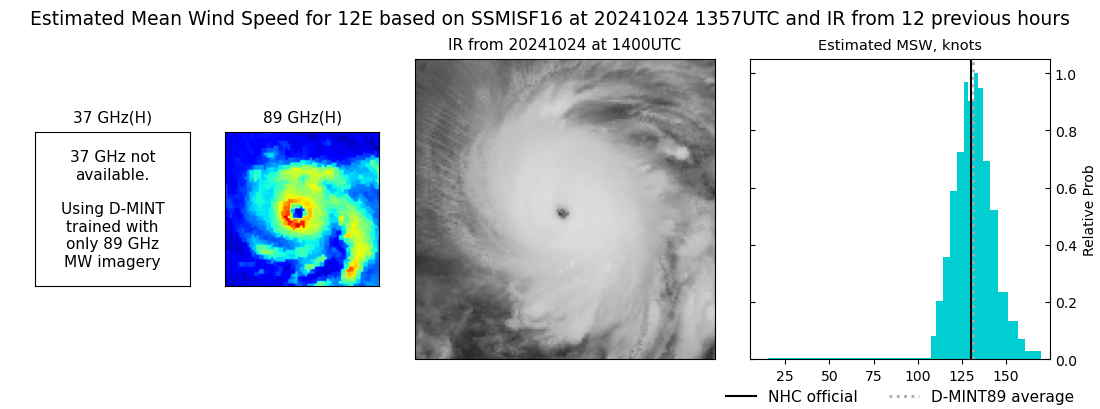 |
| 20241024 | 1136 UTC | SSMISF18 | 938 hPa | 126 kts | 119 kts | 132 kts | 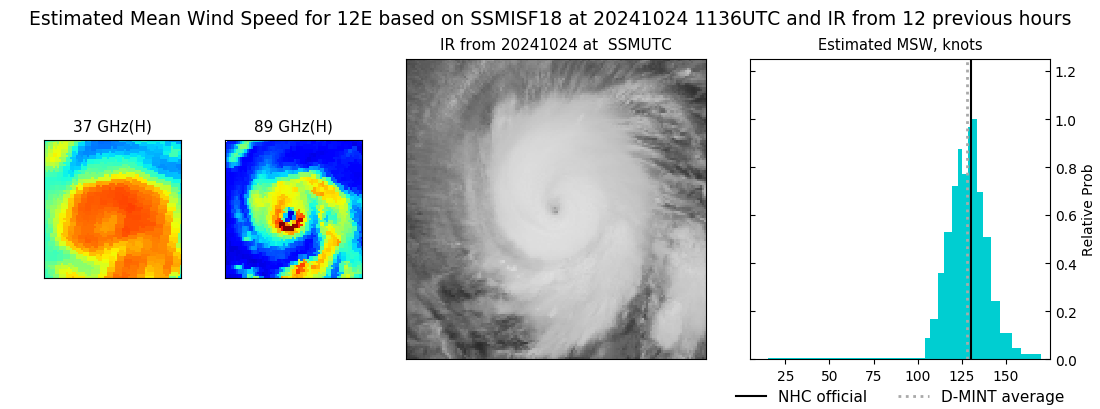 |
| 20241024 | 0934 UTC | AMSR2 | 939 hPa | 125 kts | 119 kts | 131 kts | 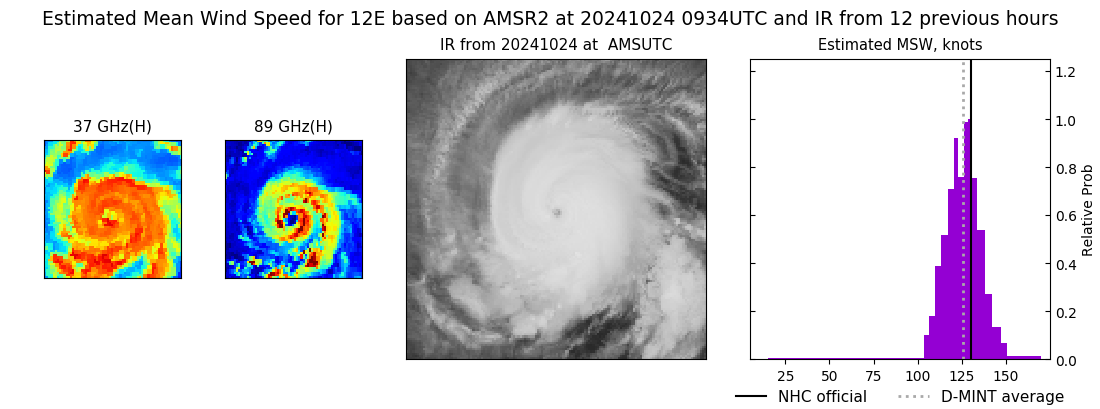 |
| 20241024 | 0931 UTC | ATMS-N21 | 933 hPa | 129 kts | 124 kts | 135 kts | 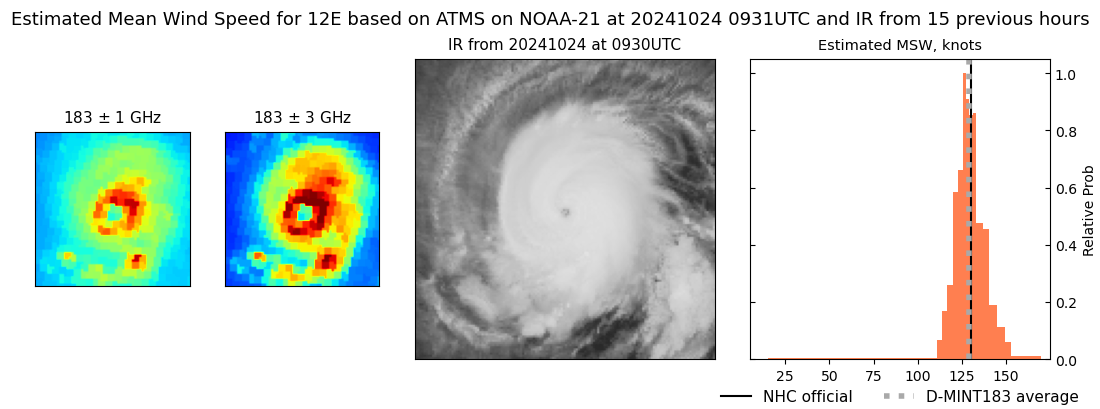 |
| 20241024 | 0220 UTC | TROPICS03 | 945 hPa | 118 kts | 113 kts | 123 kts | 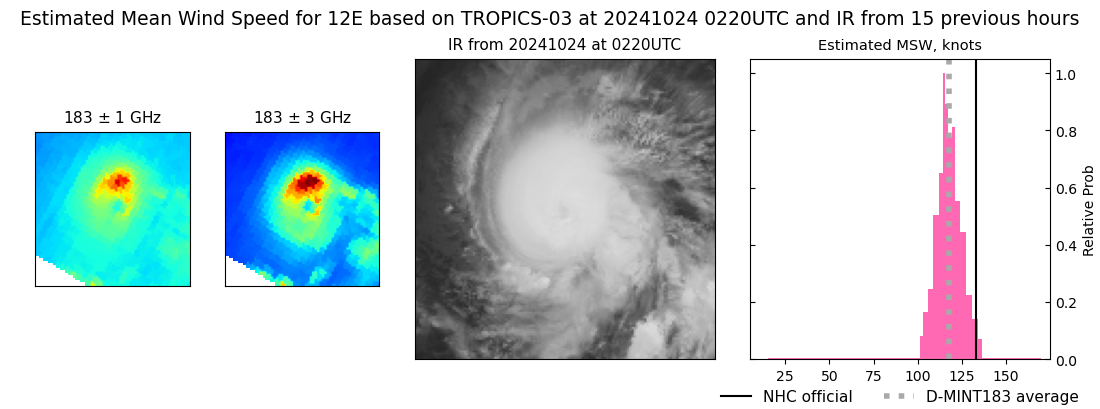 |
| 20241024 | 0133 UTC | SSMISF17 | 940 hPa | 135 kts | 127 kts | 143 kts | 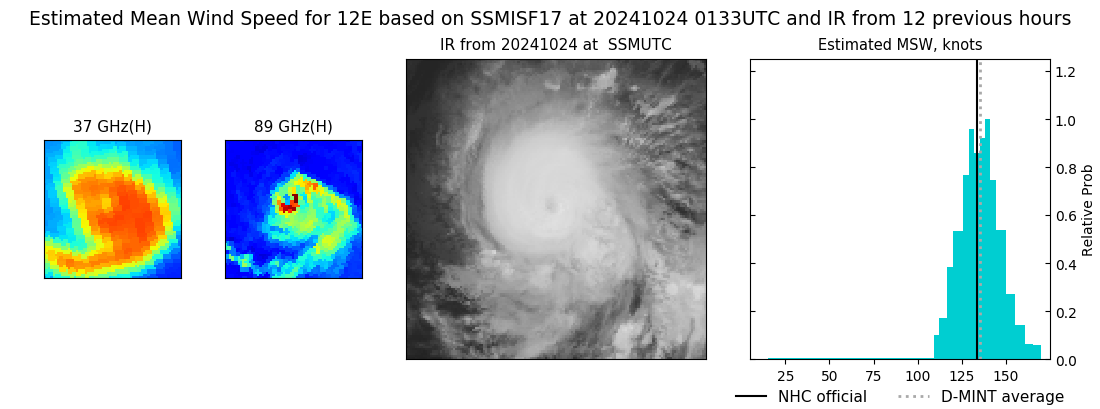 |
| 20241024 | 0121 UTC | SSMISF16 | 937 hPa | 128 kts | 120 kts | 136 kts | 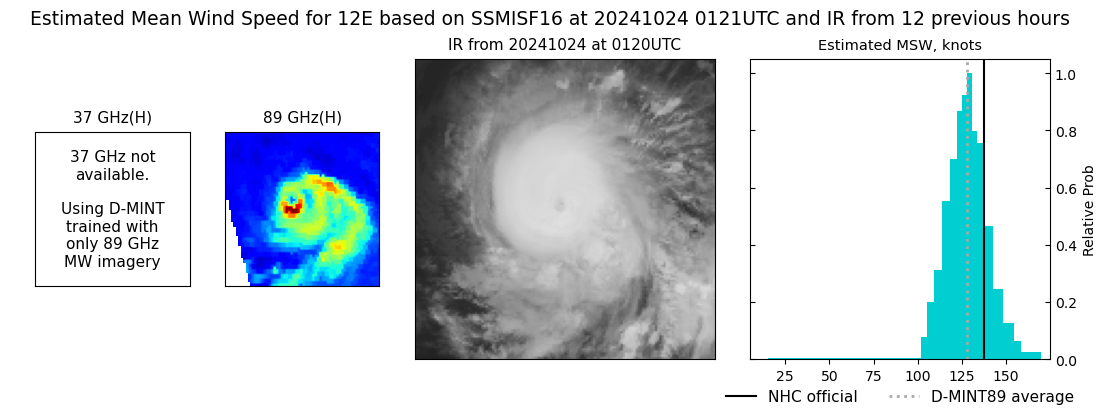 |
| 20241023 | 2300 UTC | SSMISF18 | 941 hPa | 131 kts | 124 kts | 138 kts | 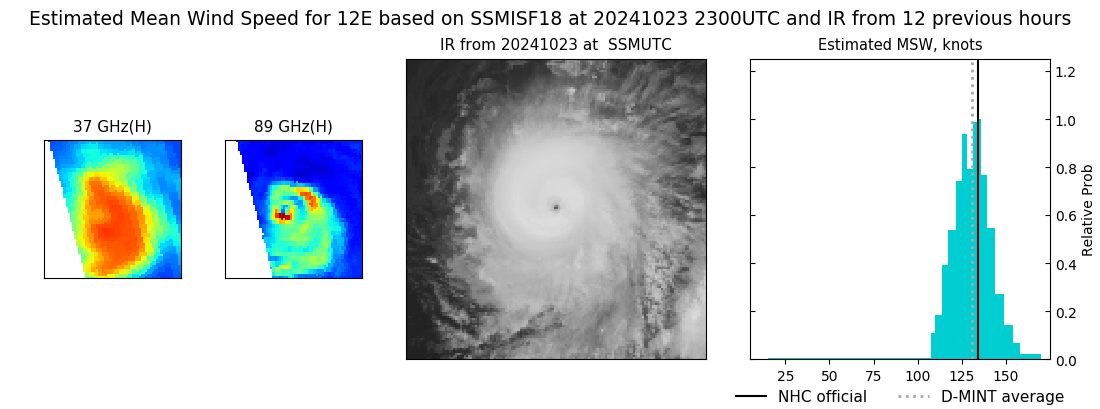 |
| 20241023 | 2120 UTC | AMSR2 | 938 hPa | 123 kts | 116 kts | 129 kts | 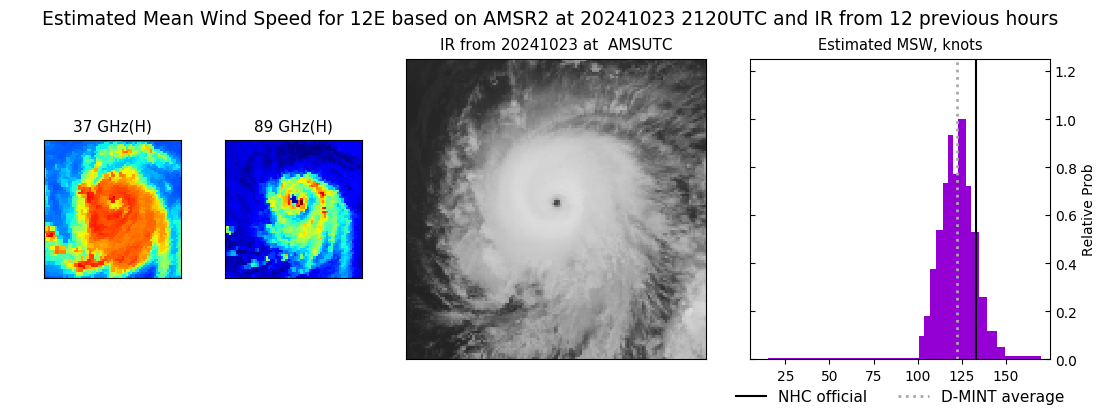 |
| 20241023 | 2058 UTC | ATMS-N21 | 950 hPa | 115 kts | 110 kts | 120 kts | 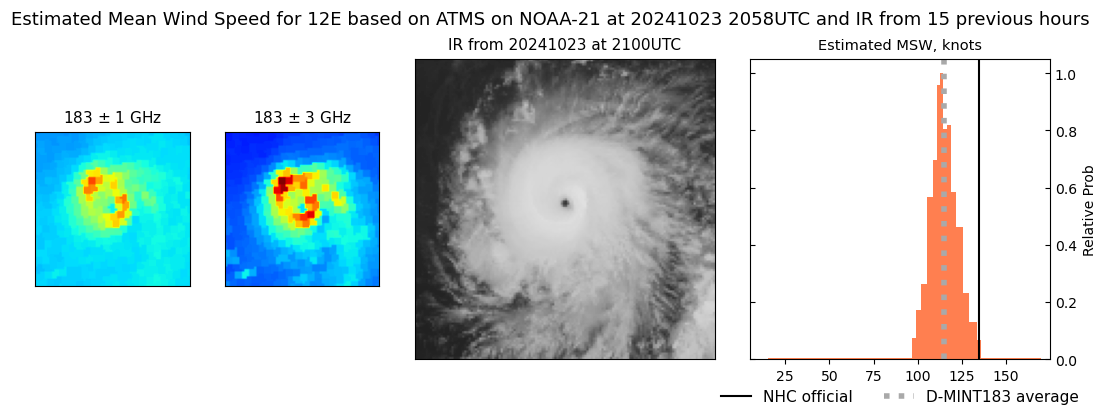 |
| 20241023 | 1655 UTC | GMI | 957 hPa | 109 kts | 102 kts | 115 kts | 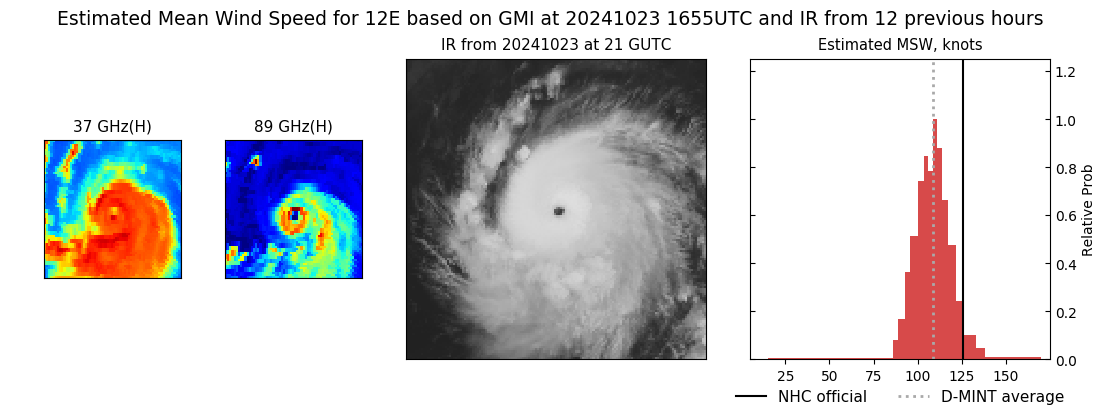 |
| 20241023 | 1423 UTC | SSMISF17 | 962 hPa | 96 kts | 89 kts | 103 kts | 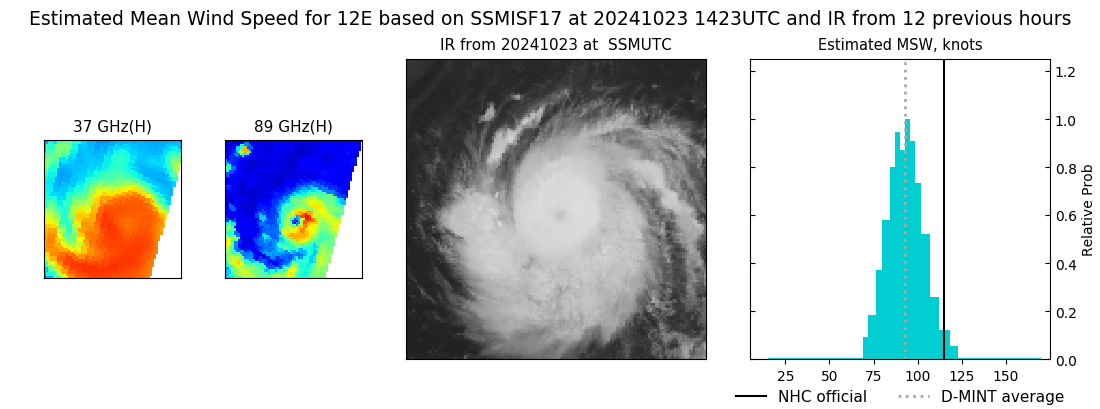 |
| 20241023 | 1410 UTC | SSMISF16 | 965 hPa | 91 kts | 83 kts | 99 kts | 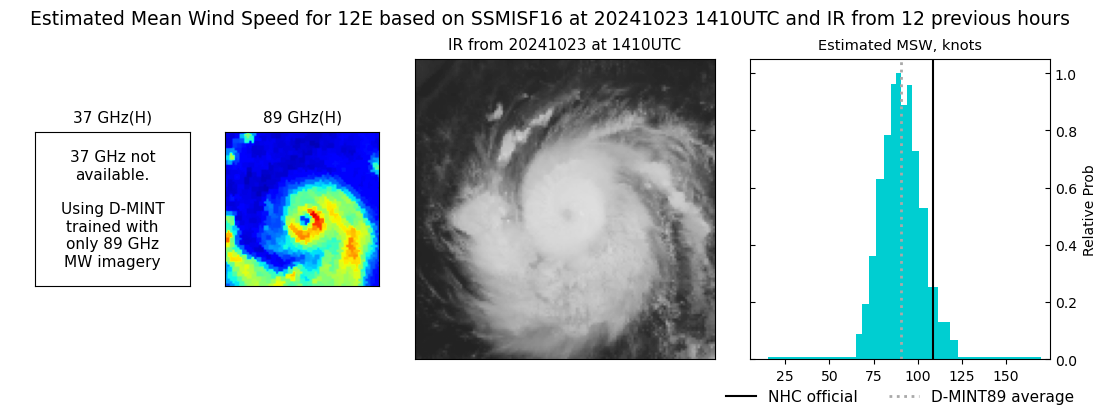 |
| 20241023 | 1149 UTC | SSMISF18 | 965 hPa | 101 kts | 93 kts | 108 kts | 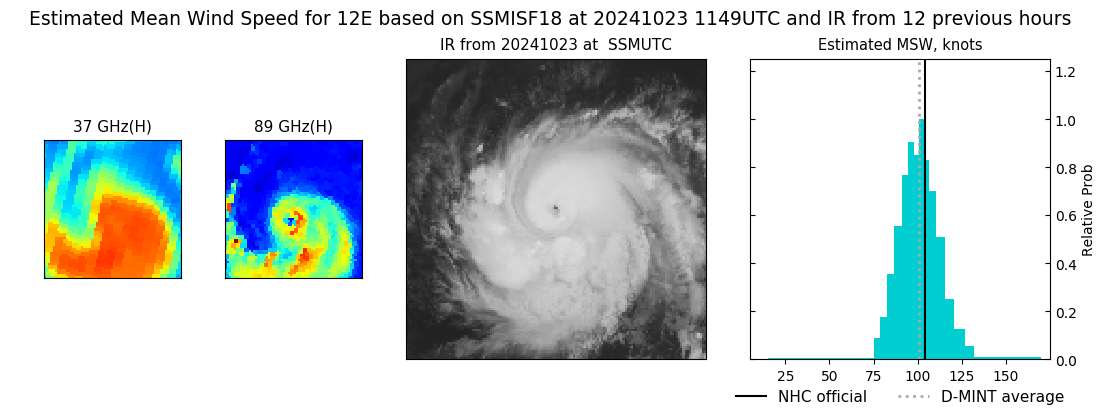 |
| 20241023 | 0857 UTC | ATMS-N20 | 964 hPa | 95 kts | 89 kts | 101 kts | 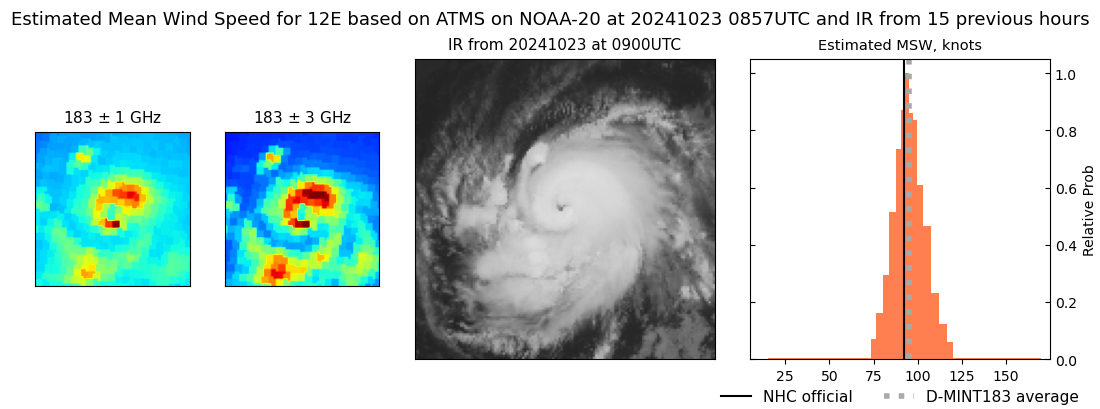 |
| 20241023 | 0328 UTC | GMI | 976 hPa | 82 kts | 75 kts | 89 kts | 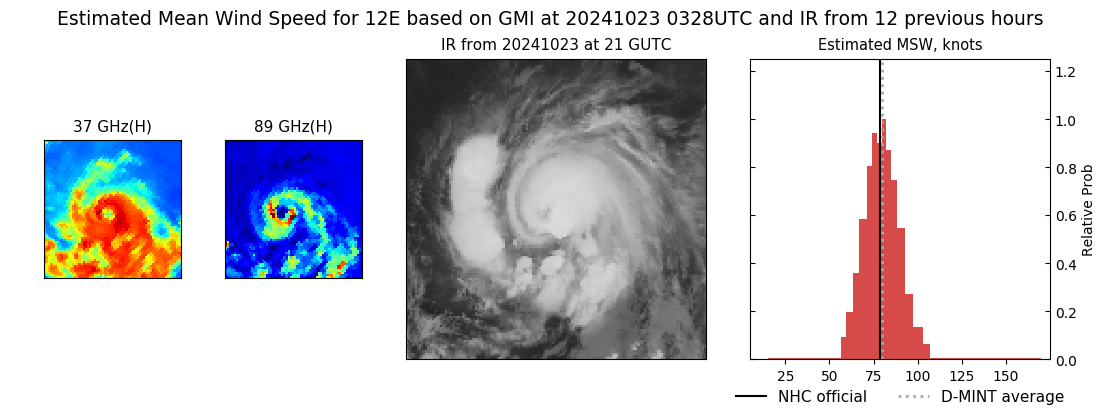 |
| 20241023 | 0147 UTC | SSMISF17 | 986 hPa | 68 kts | 62 kts | 75 kts | 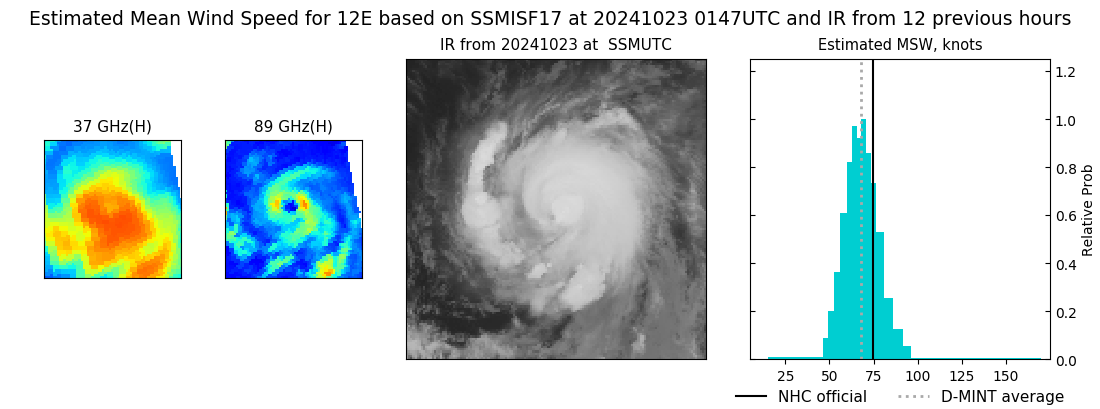 |
| 20241023 | 0135 UTC | SSMISF16 | 991 hPa | 72 kts | 64 kts | 80 kts | 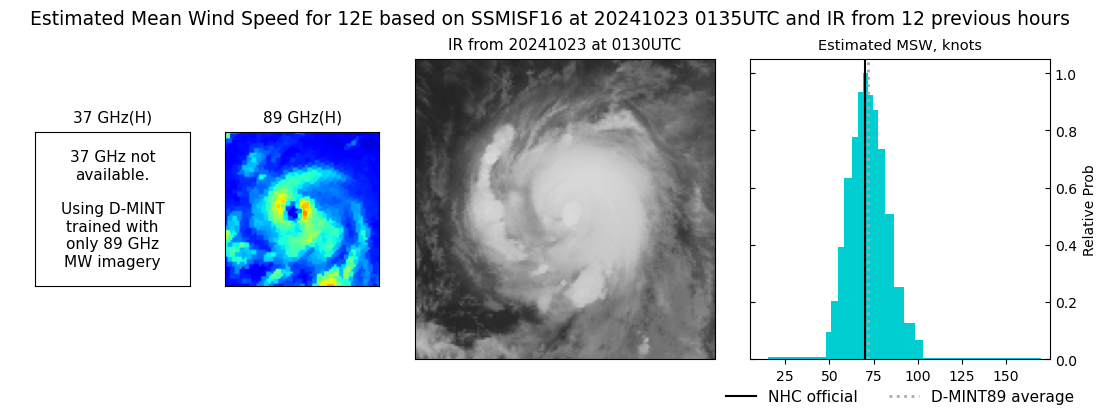 |
| 20241023 | 0134 UTC | SSMISF16 | 993 hPa | 72 kts | 65 kts | 80 kts | 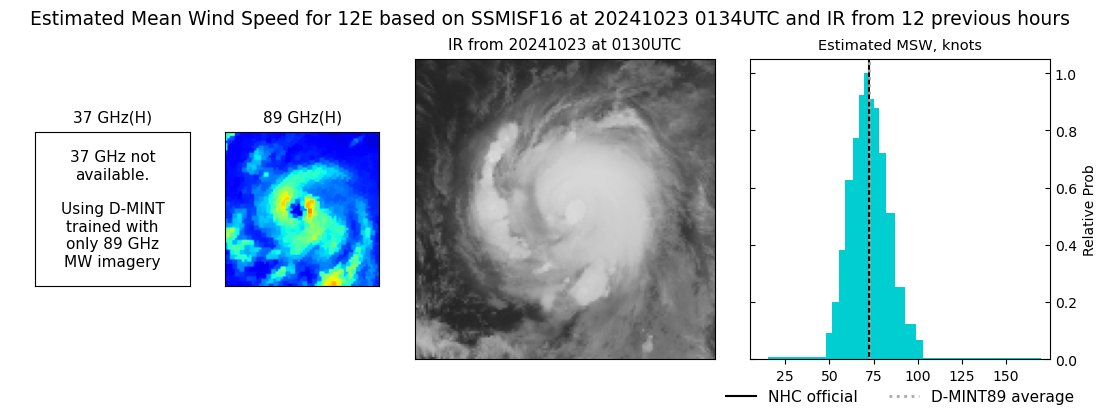 |
| 20241022 | 2313 UTC | SSMISF18 | 994 hPa | 63 kts | 56 kts | 69 kts | 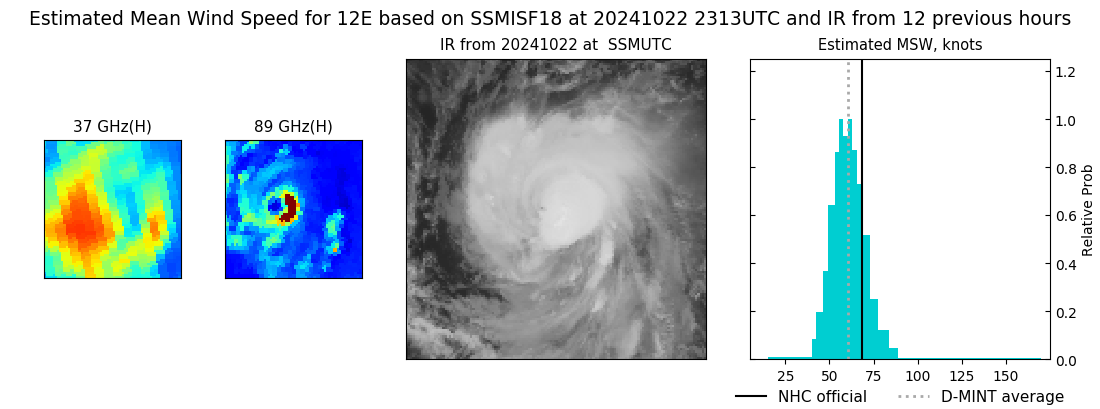 |
| 20241022 | 2037 UTC | AMSR2 | 994 hPa | 63 kts | 57 kts | 70 kts | 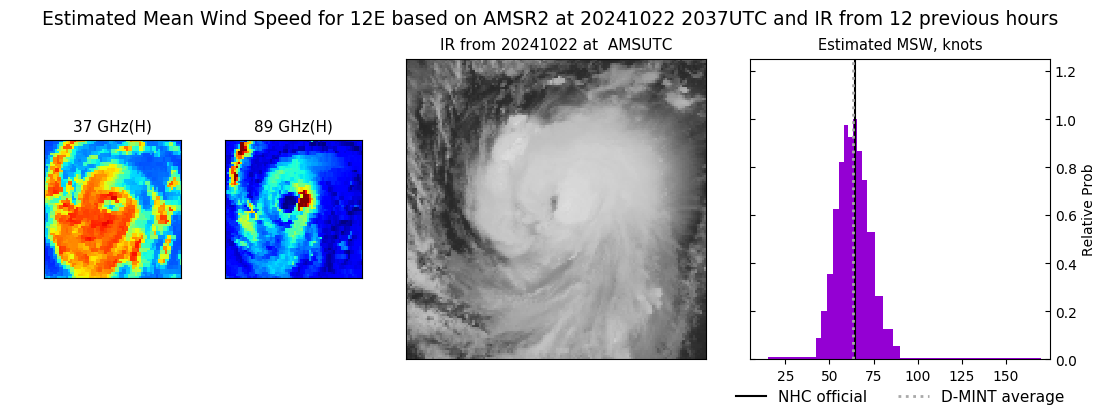 |
| 20241022 | 1256 UTC | SSMISF17 | 1003 hPa | 45 kts | 40 kts | 50 kts | 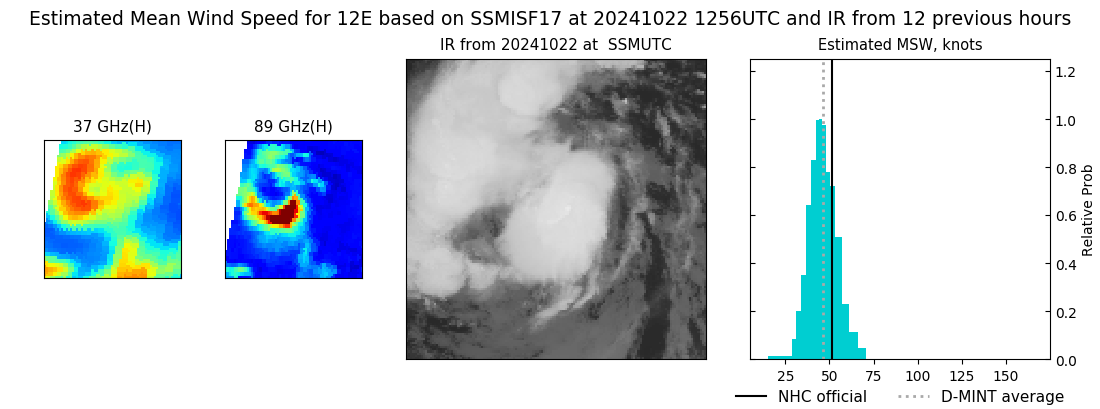 |
| 20241022 | 0520 UTC | TROPICS06 | 1003 hPa | 46 kts | 42 kts | 51 kts | 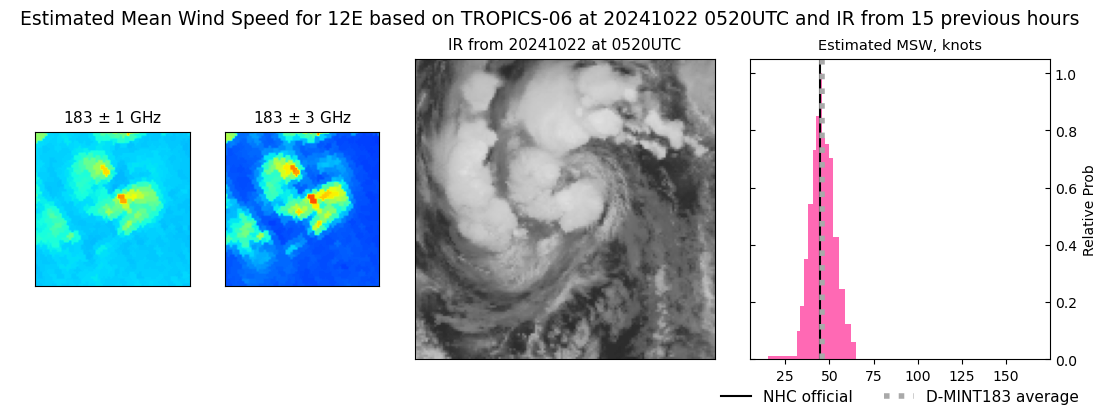 |
| 20241021 | 2018 UTC | ATMS-NPP | 1006 hPa | 40 kts | 36 kts | 45 kts | 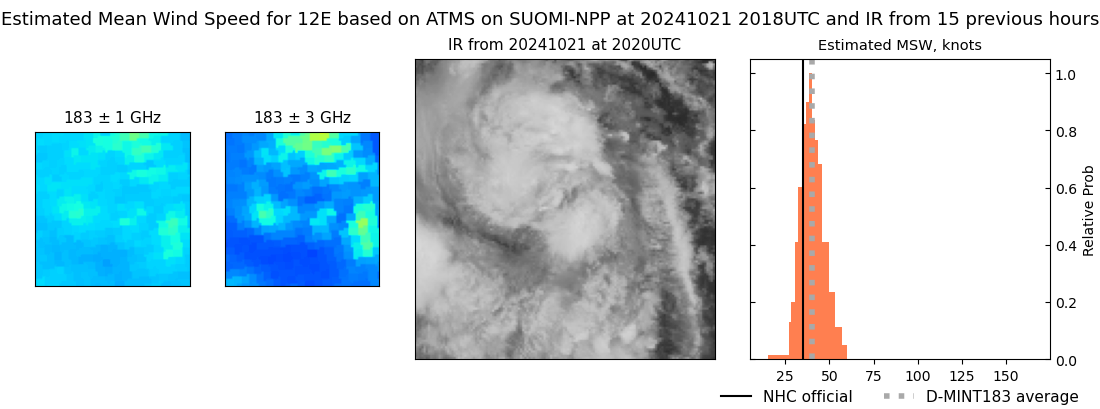 |
| 20241021 | 1954 UTC | ATMS-N21 | 1005 hPa | 45 kts | 41 kts | 50 kts | 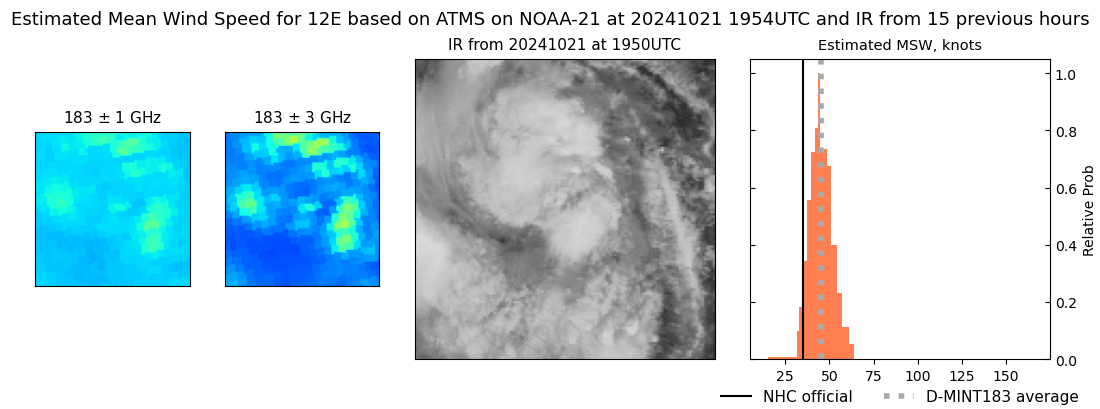 |
| 20241021 | 1716 UTC | TROPICS03 | 1005 hPa | 38 kts | 34 kts | 42 kts | 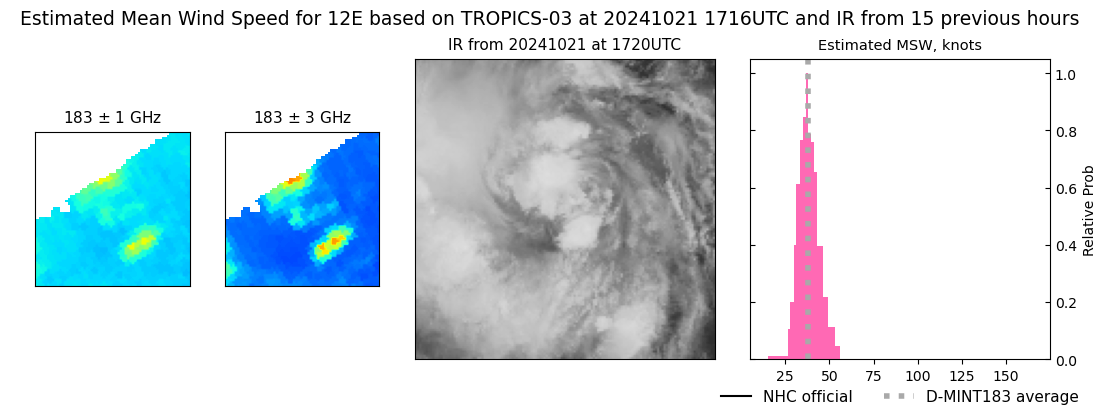 |
|
