|
Storm: 12W
D-MINT HISTORY FILE for 2024_12W
| Date | Time | MW Sensor | MSLP | Vmax
(30th-70th percentile average) | Vmax
25th percentile | Vmax
75th percentile | Image |
| 20240908 | 0915 UTC | TROPICS03 | 989 hPa | 45 kts | 39 kts | 52 kts |  |
| 20240907 | 2325 UTC | SSMISF17 | 993 hPa | 47 kts | 40 kts | 54 kts |  |
| 20240907 | 2253 UTC | SSMISF16 | 984 hPa | 52 kts | 46 kts | 59 kts | 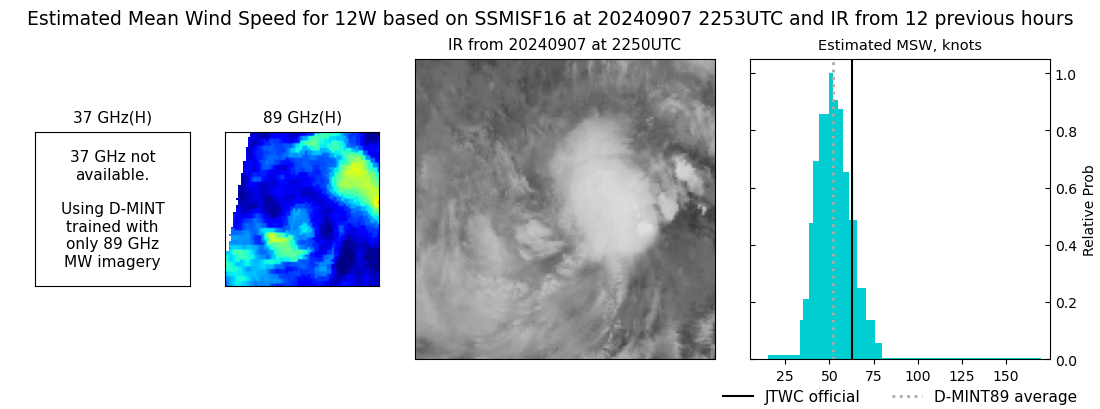 |
| 20240907 | 2039 UTC | SSMISF18 | 986 hPa | 60 kts | 54 kts | 68 kts | 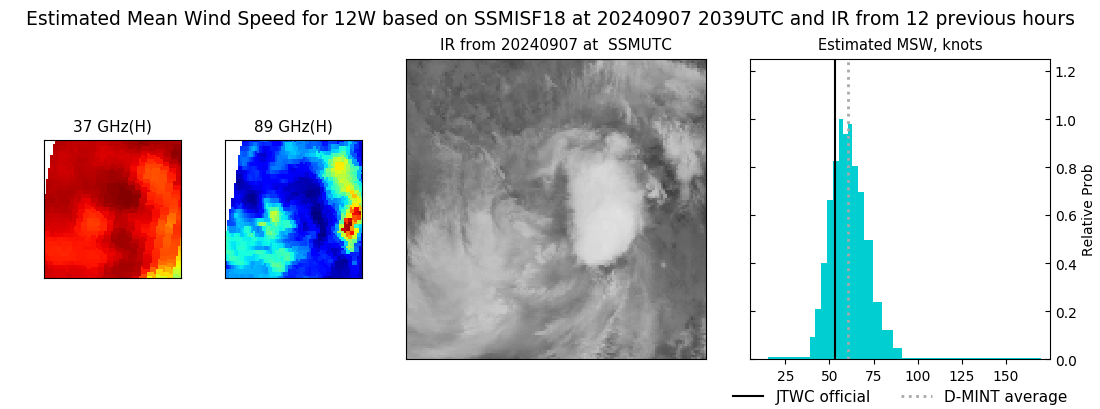 |
| 20240907 | 1829 UTC | AMSR2 | 986 hPa | 63 kts | 56 kts | 71 kts | 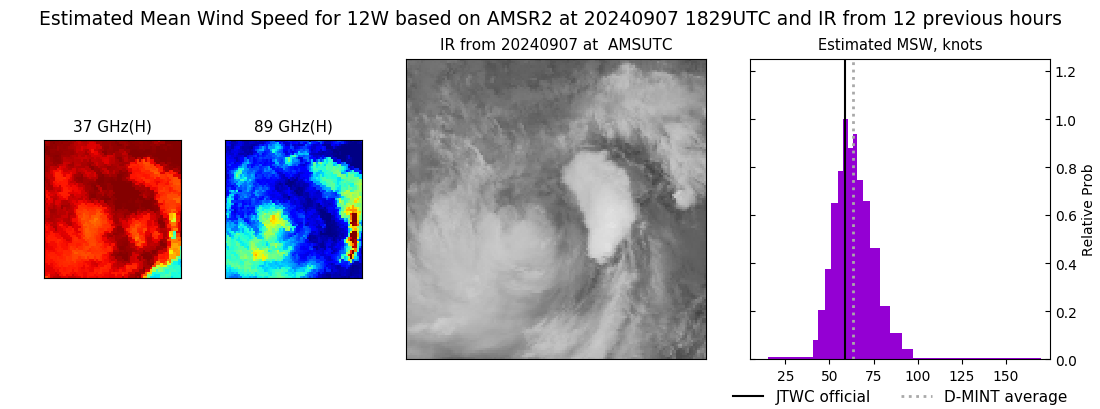 |
| 20240907 | 1053 UTC | SSMISF17 | 966 hPa | 85 kts | 77 kts | 94 kts | 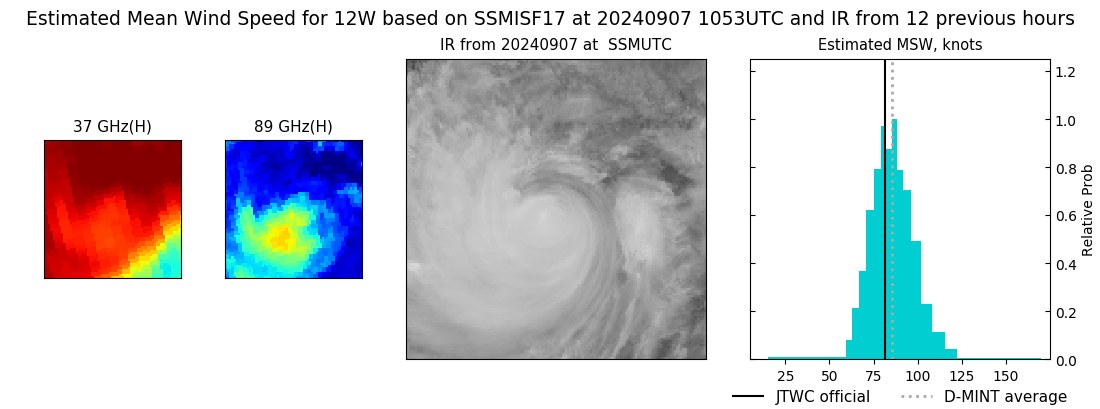 |
| 20240907 | 1021 UTC | SSMISF16 | 962 hPa | 87 kts | 79 kts | 95 kts | 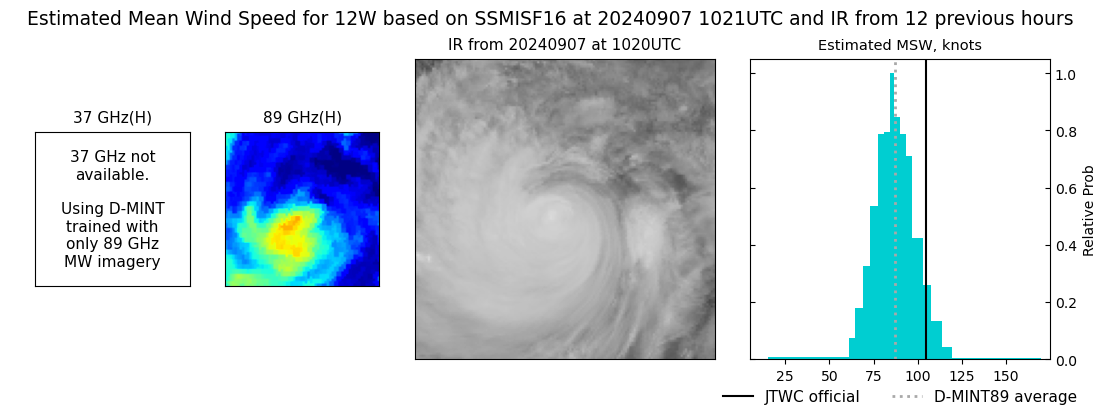 |
| 20240907 | 0939 UTC | TROPICS03 | 956 hPa | 98 kts | 91 kts | 105 kts |  |
| 20240907 | 0807 UTC | SSMISF18 | 950 hPa | 100 kts | 93 kts | 107 kts | 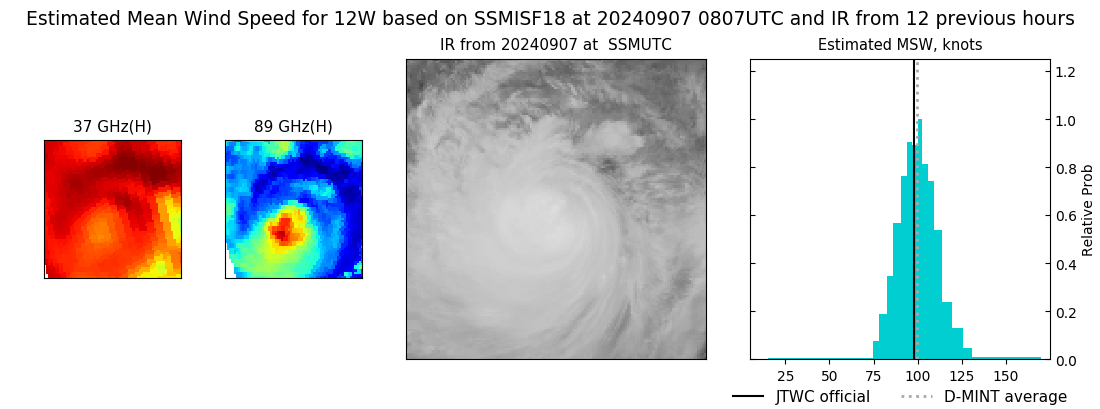 |
| 20240907 | 0619 UTC | AMSR2 | 936 hPa | 115 kts | 107 kts | 122 kts | 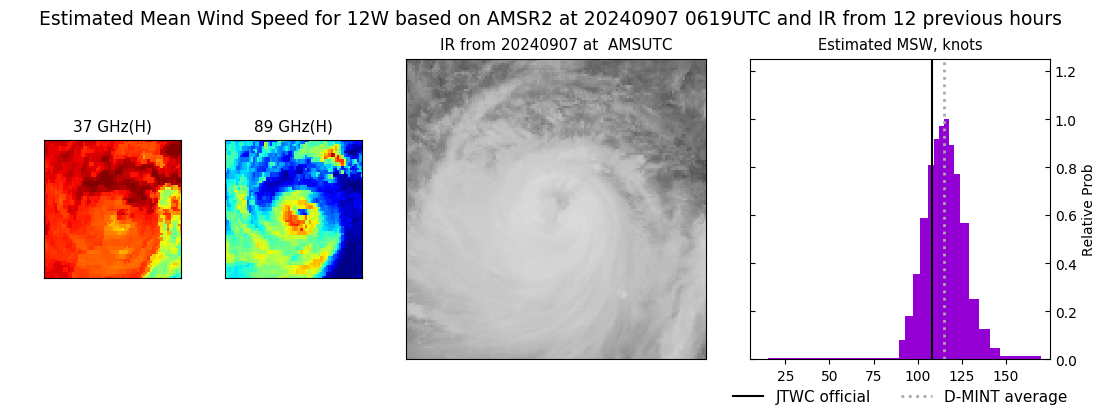 |
| 20240907 | 0257 UTC | TROPICS03 | 937 hPa | 111 kts | 105 kts | 117 kts | 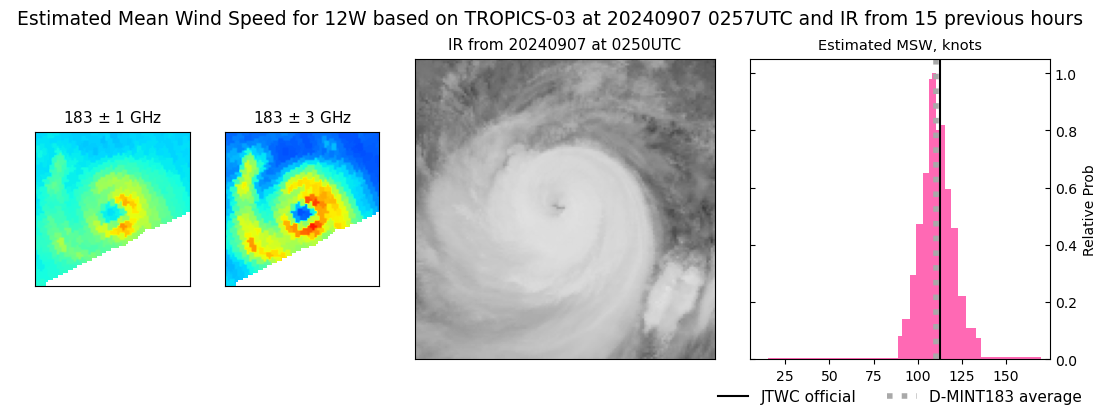 |
| 20240906 | 2339 UTC | SSMISF17 | 943 hPa | 103 kts | 95 kts | 110 kts | 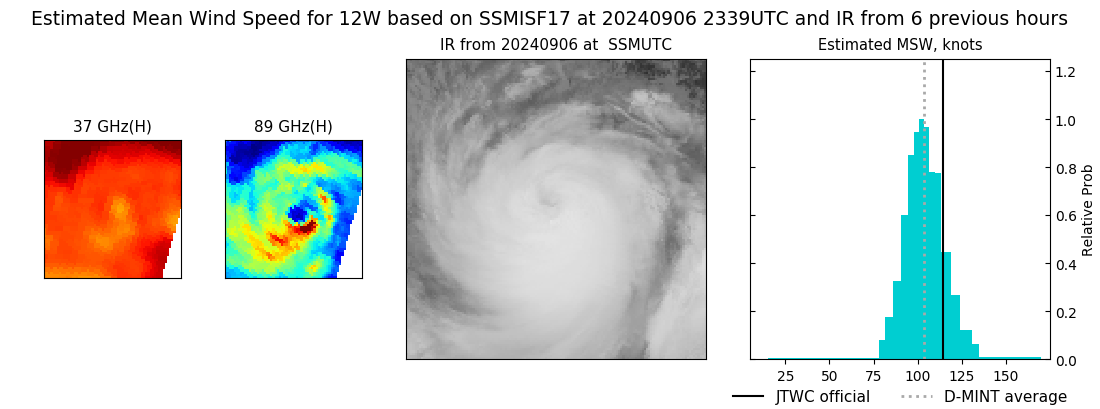 |
| 20240906 | 2306 UTC | SSMISF16 | 951 hPa | 101 kts | 94 kts | 108 kts | 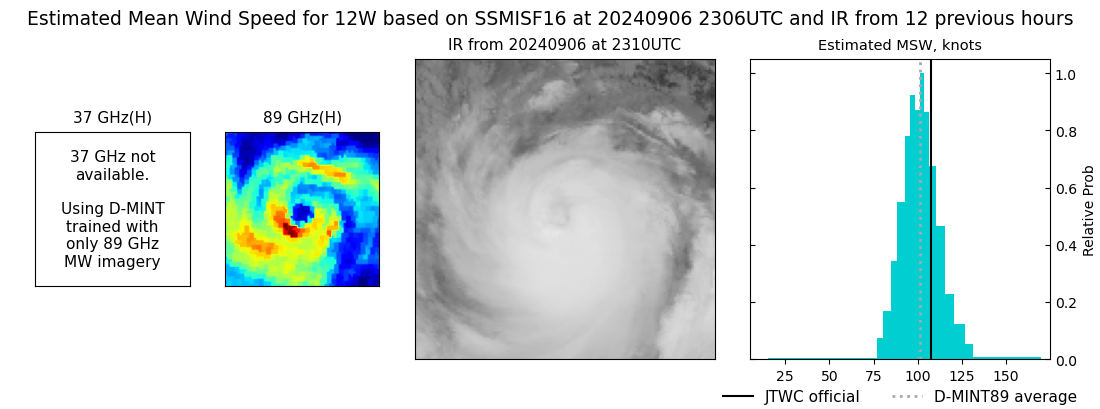 |
| 20240906 | 2052 UTC | SSMISF18 | 939 hPa | 99 kts | 94 kts | 104 kts | 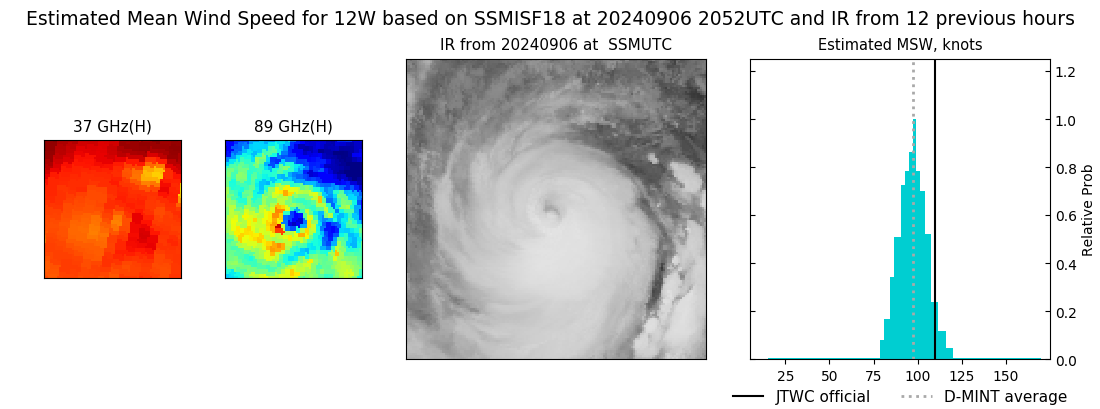 |
| 20240906 | 1821 UTC | ATMS-NPP | 939 hPa | 109 kts | 102 kts | 115 kts | 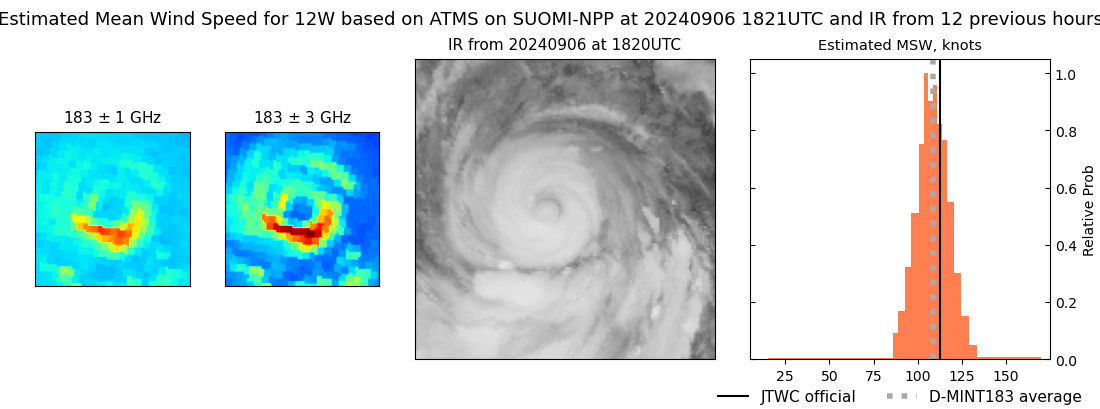 |
| 20240906 | 1518 UTC | GMI | 934 hPa | 111 kts | 105 kts | 118 kts | 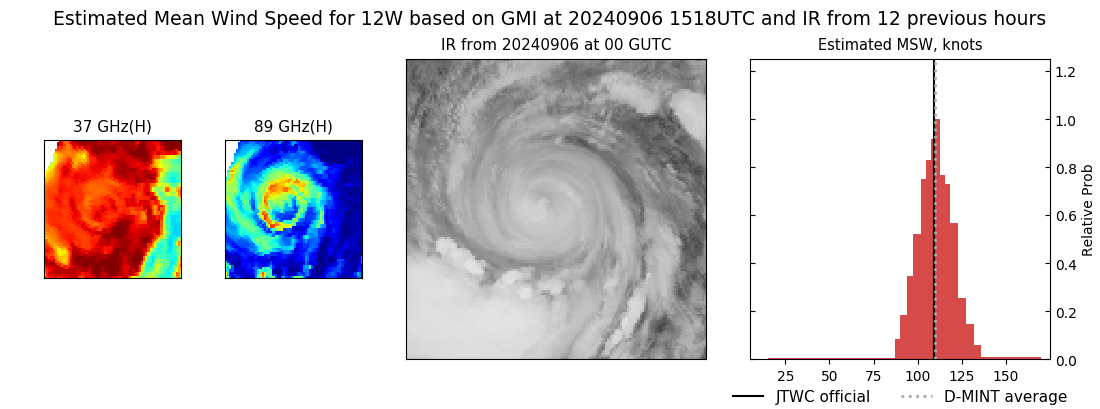 |
| 20240906 | 1425 UTC | TROPICS06 | 935 hPa | 112 kts | 106 kts | 119 kts | 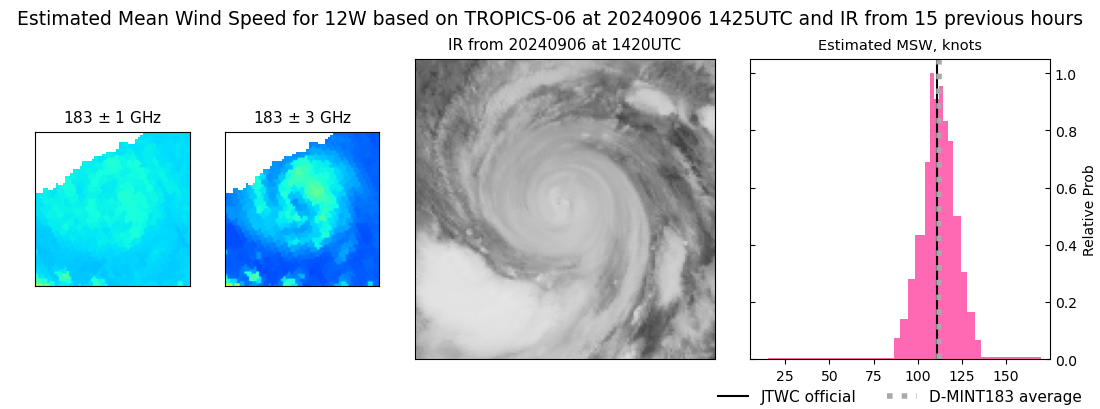 |
| 20240906 | 1108 UTC | SSMISF17 | 923 hPa | 119 kts | 112 kts | 125 kts | 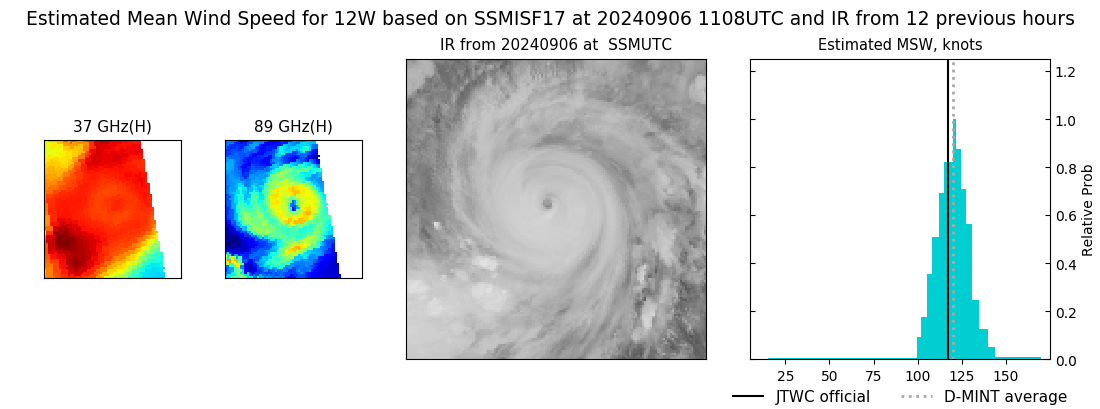 |
| 20240906 | 1033 UTC | SSMISF16 | 915 hPa | 130 kts | 123 kts | 138 kts | 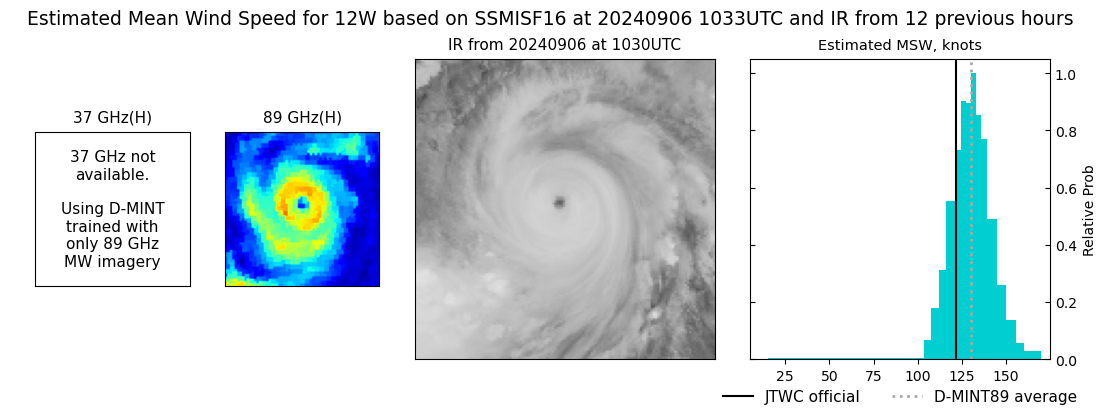 |
| 20240906 | 1003 UTC | TROPICS03 | 924 hPa | 124 kts | 118 kts | 130 kts | 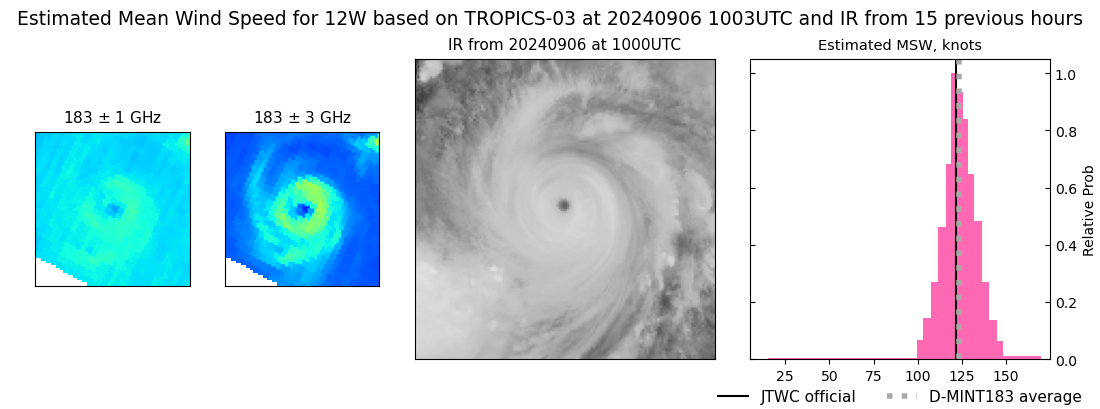 |
| 20240906 | 0820 UTC | SSMISF18 | 920 hPa | 132 kts | 125 kts | 138 kts | 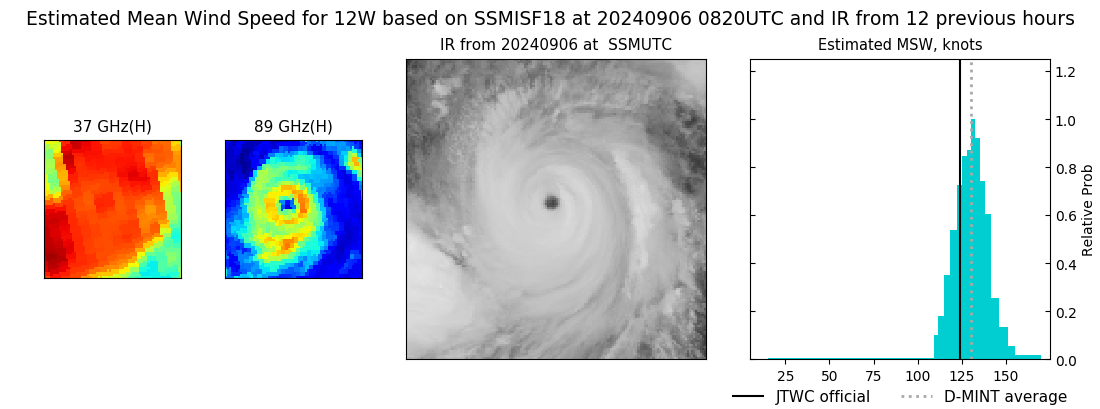 |
| 20240906 | 0551 UTC | ATMS-NPP | 919 hPa | 127 kts | 121 kts | 133 kts | 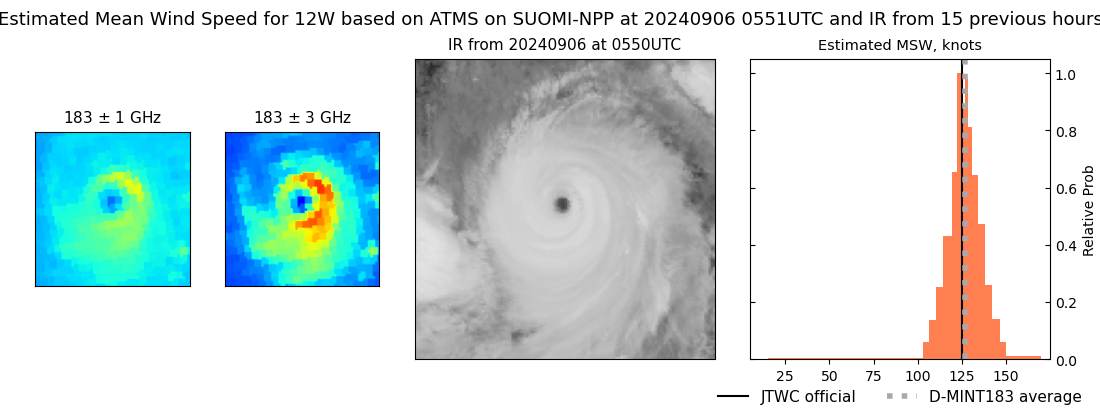 |
| 20240906 | 0536 UTC | AMSR2 | 920 hPa | 131 kts | 125 kts | 138 kts | 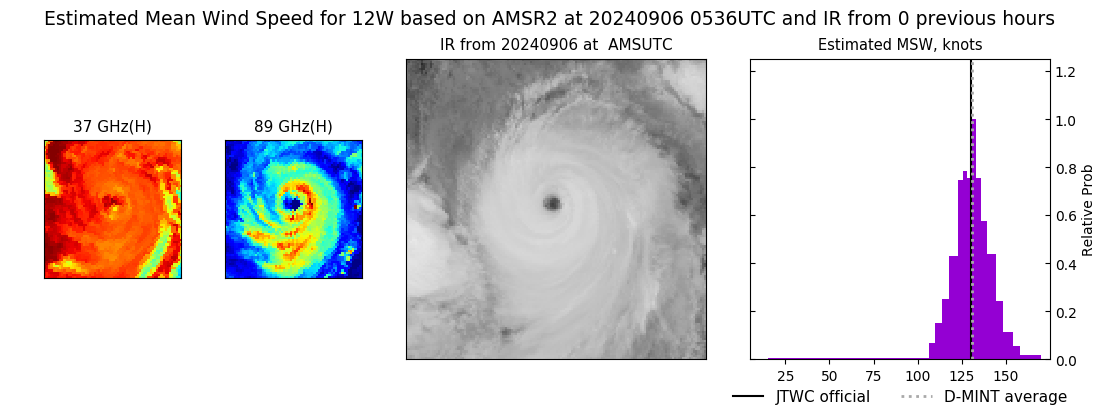 |
| 20240906 | 0526 UTC | ATMS-N21 | 923 hPa | 127 kts | 121 kts | 133 kts | 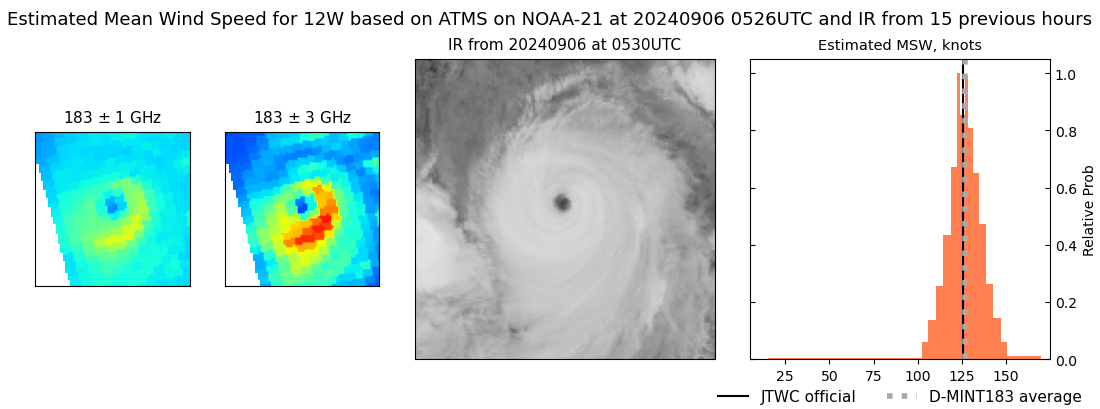 |
| 20240905 | 2321 UTC | SSMISF16 | 926 hPa | 123 kts | 116 kts | 130 kts | 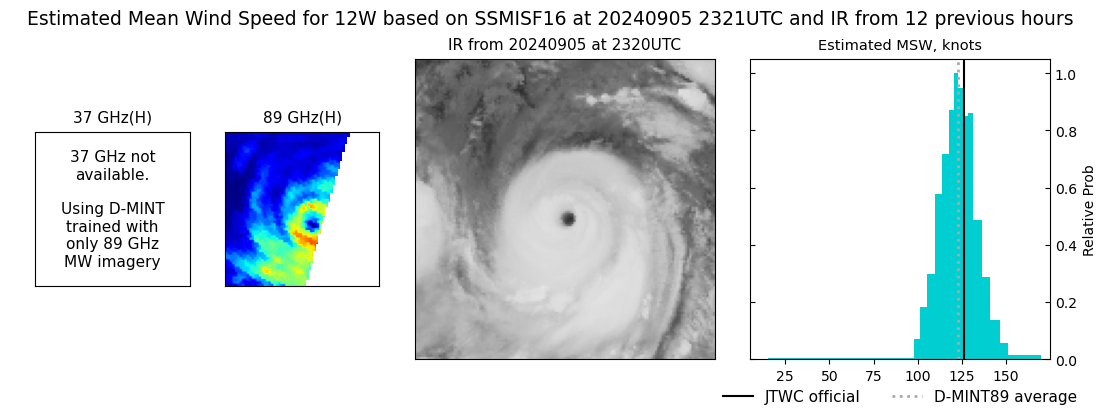 |
| 20240905 | 1815 UTC | ATMS-N21 | 928 hPa | 120 kts | 114 kts | 128 kts | 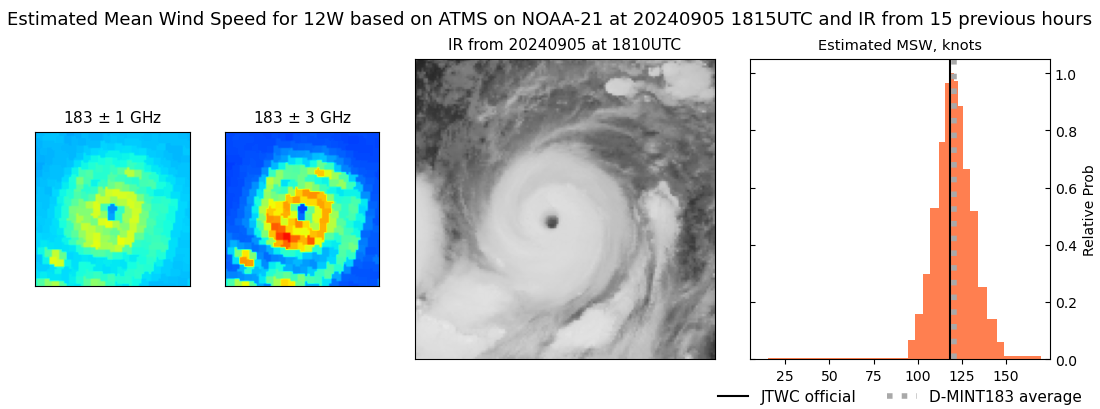 |
| 20240905 | 1452 UTC | TROPICS06 | 928 hPa | 124 kts | 117 kts | 131 kts | 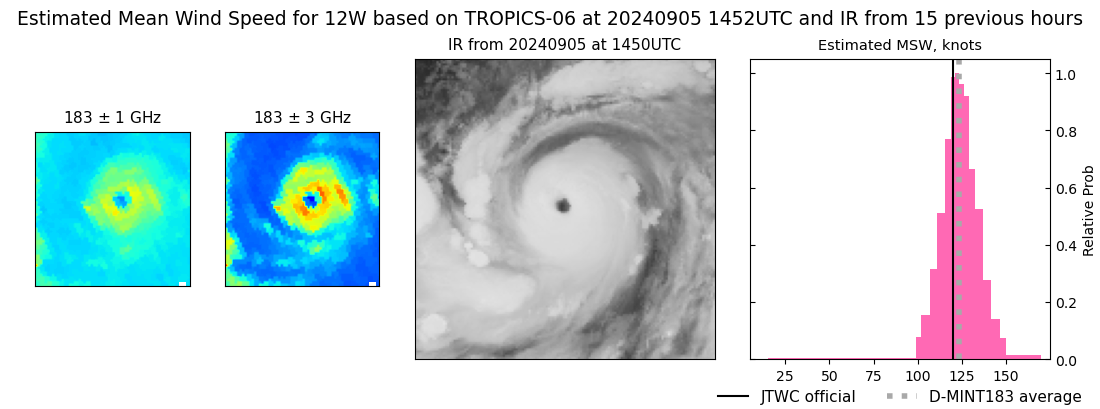 |
| 20240905 | 0834 UTC | SSMISF18 | 928 hPa | 119 kts | 112 kts | 126 kts | 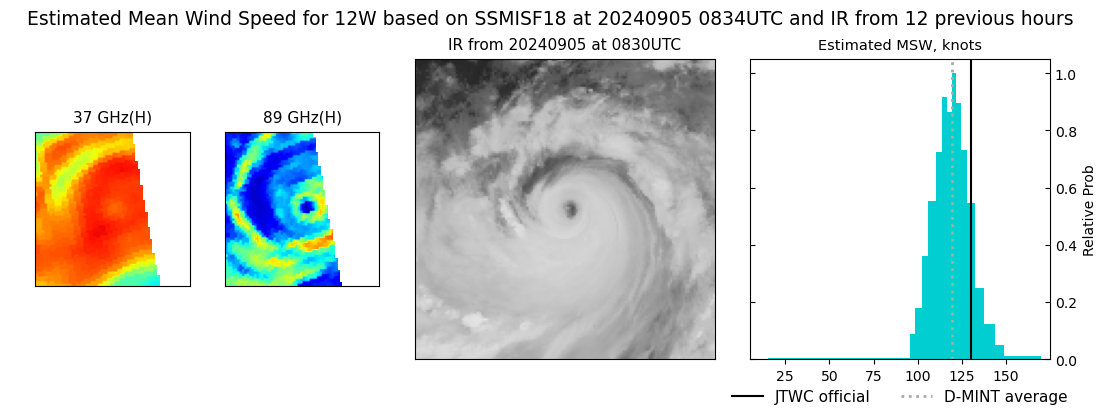 |
| 20240905 | 0611 UTC | ATMS-NPP | 932 hPa | 115 kts | 107 kts | 123 kts | 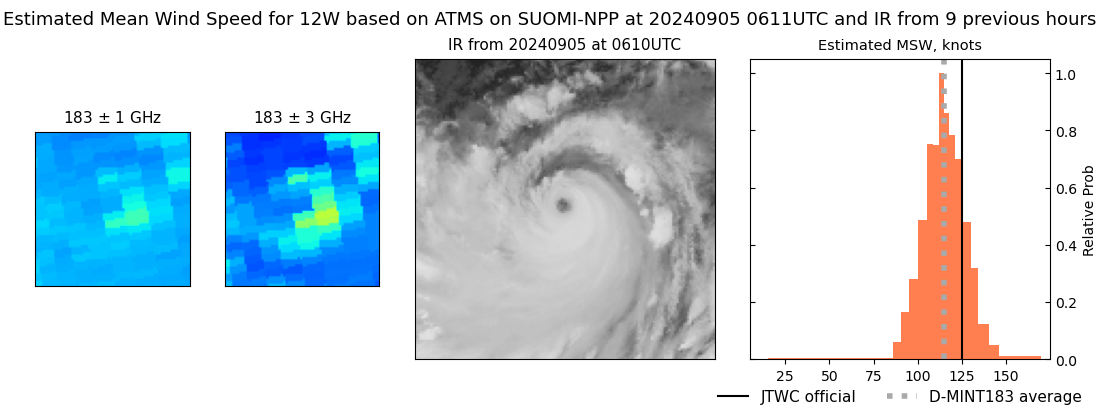 |
| 20240905 | 0545 UTC | ATMS-N21 | 935 hPa | 116 kts | 108 kts | 125 kts | 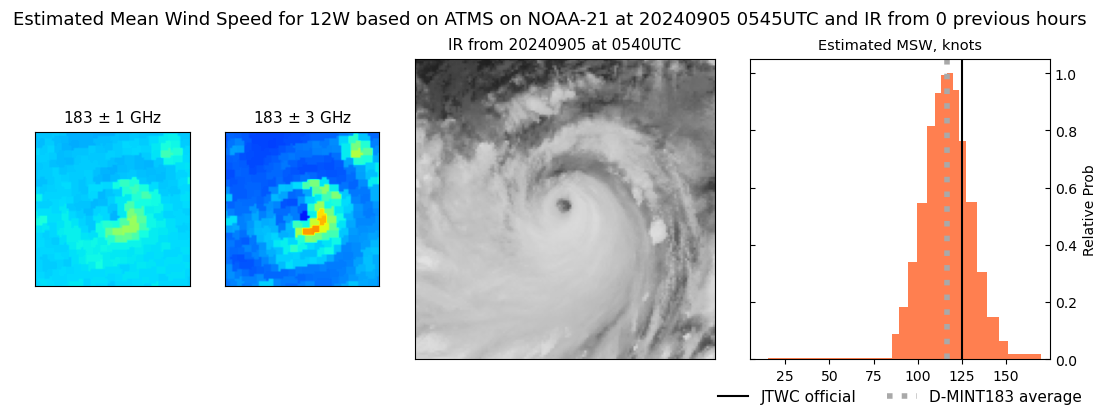 |
| 20240905 | 0454 UTC | ATMS-N20 | 932 hPa | 118 kts | 112 kts | 124 kts | 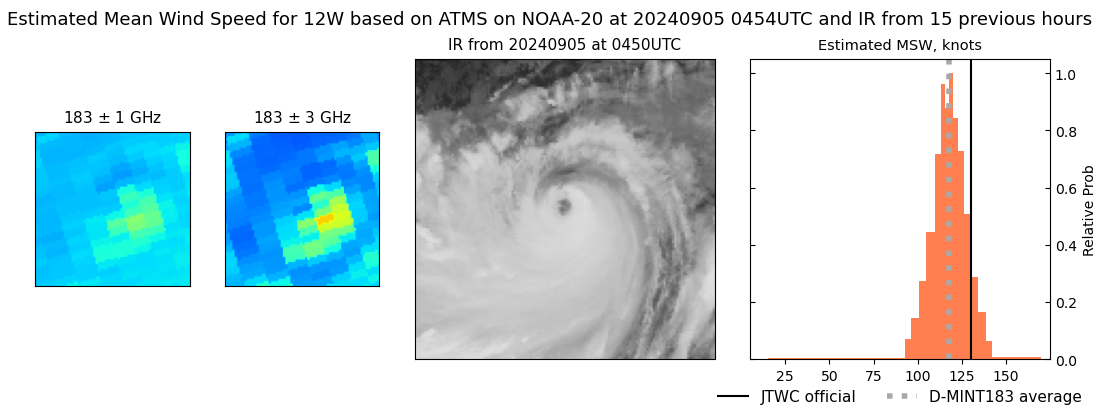 |
| 20240904 | 2226 UTC | SSMISF17 | 924 hPa | 127 kts | 119 kts | 134 kts | 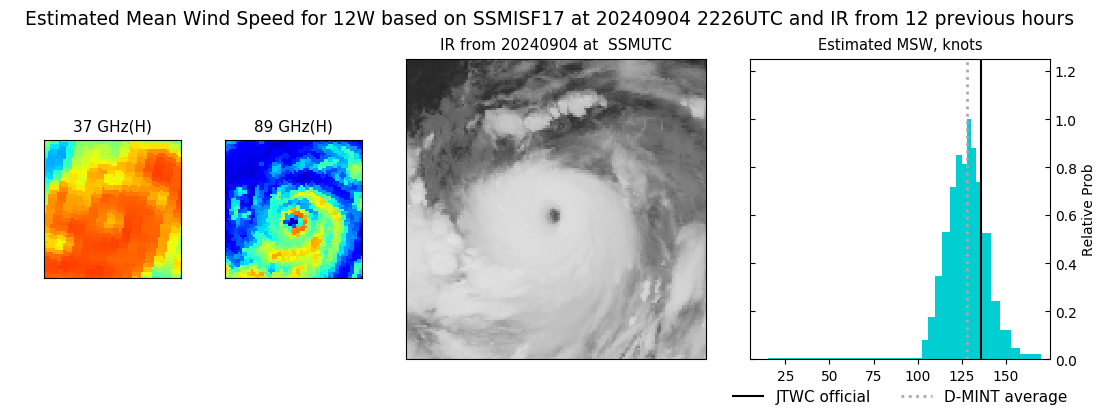 |
| 20240904 | 1758 UTC | AMSR2 | 917 hPa | 130 kts | 123 kts | 137 kts | 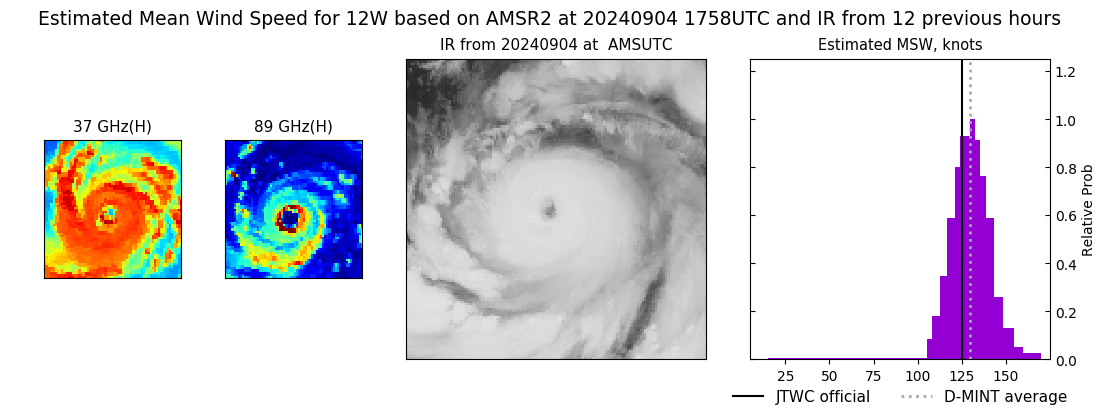 |
| 20240904 | 1743 UTC | ATMS-N20 | 927 hPa | 117 kts | 109 kts | 126 kts | 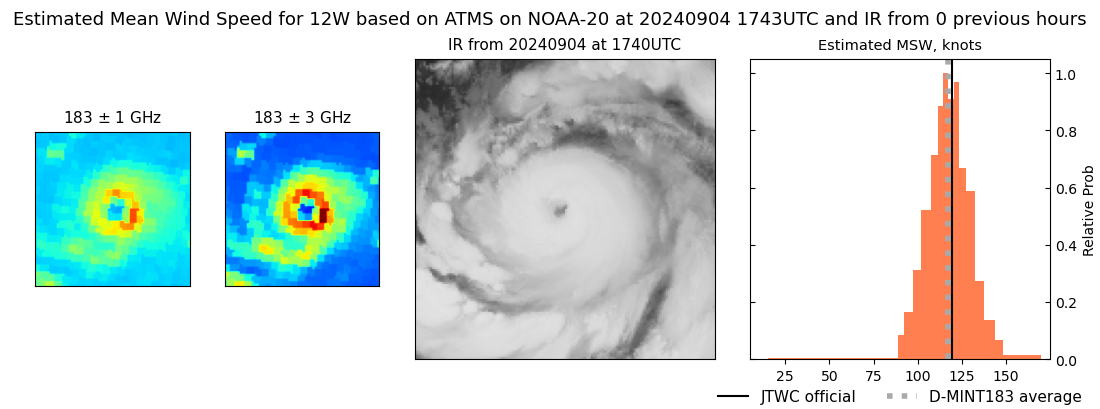 |
| 20240904 | 1719 UTC | ATMS-NPP | 935 hPa | 119 kts | 111 kts | 126 kts | 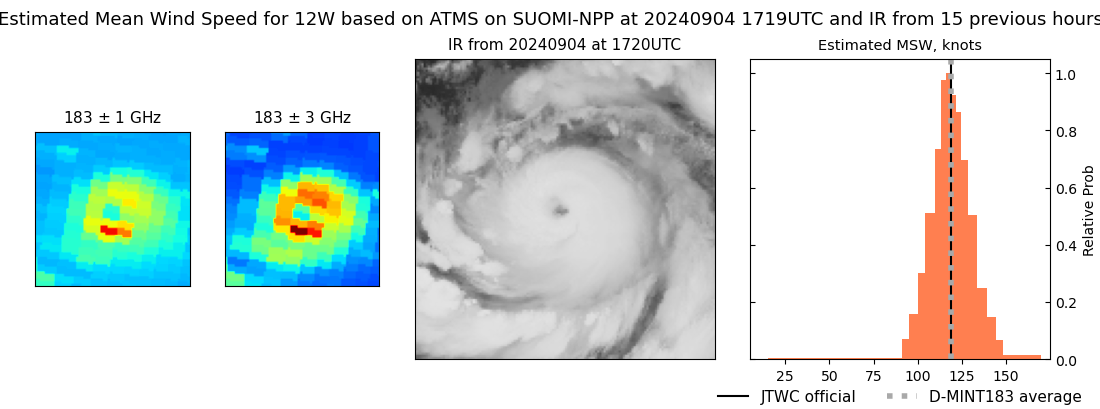 |
| 20240904 | 1518 UTC | TROPICS06 | 928 hPa | 121 kts | 113 kts | 128 kts | 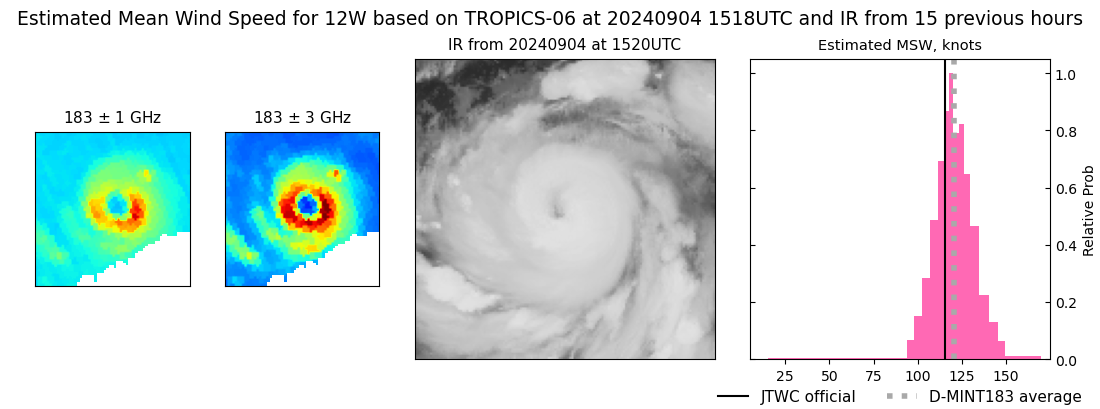 |
| 20240904 | 1051 UTC | TROPICS03 | 934 hPa | 109 kts | 102 kts | 116 kts | 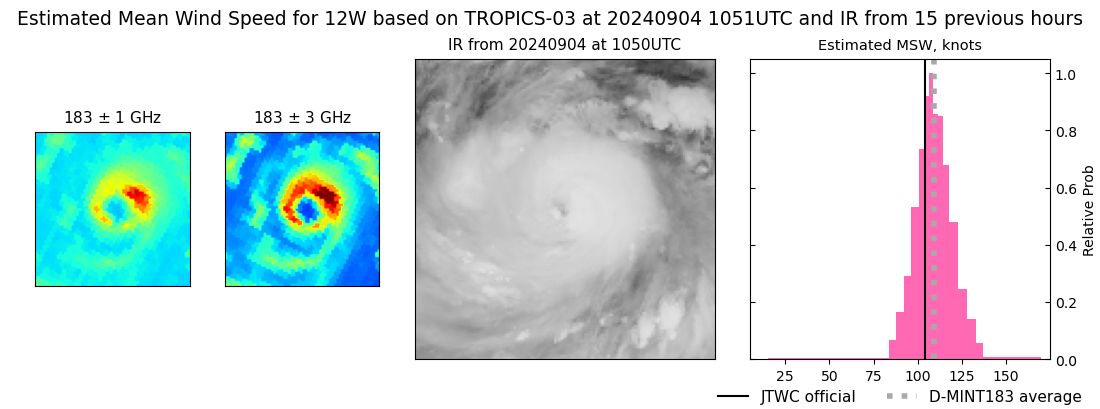 |
| 20240904 | 0954 UTC | SSMISF17 | 938 hPa | 105 kts | 97 kts | 112 kts | 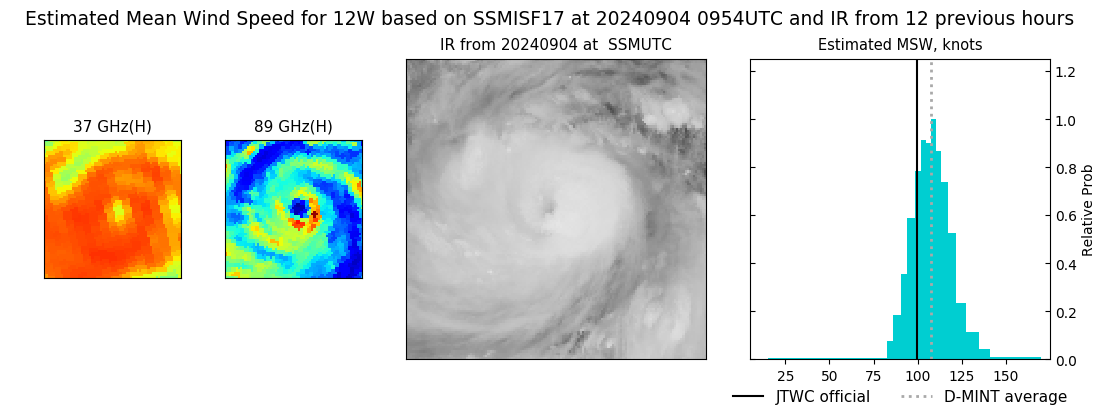 |
| 20240904 | 0604 UTC | ATMS-N21 | 960 hPa | 80 kts | 74 kts | 86 kts | 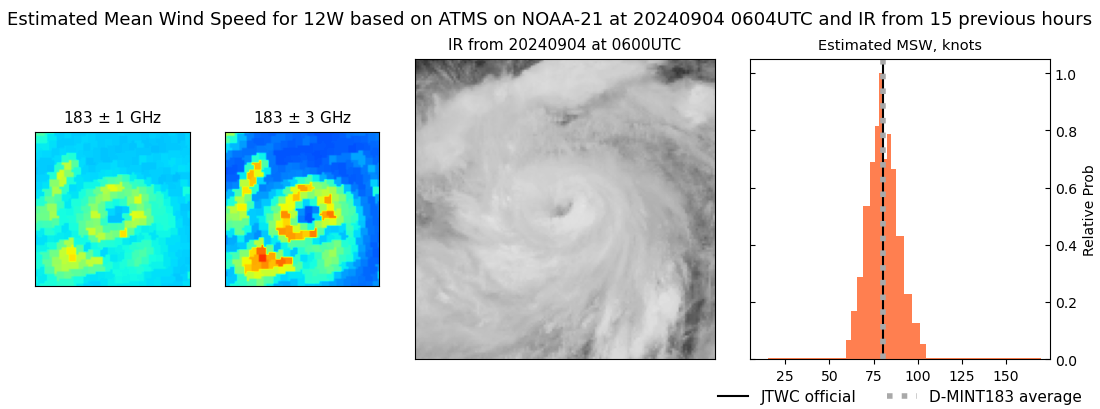 |
| 20240904 | 0548 UTC | AMSR2 | 957 hPa | 80 kts | 74 kts | 87 kts | 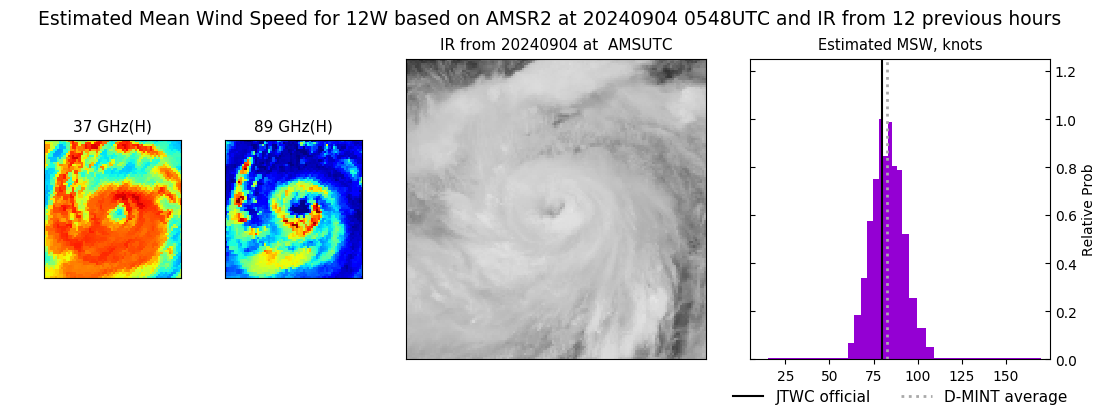 |
| 20240904 | 0512 UTC | ATMS-N20 | 958 hPa | 82 kts | 76 kts | 88 kts | 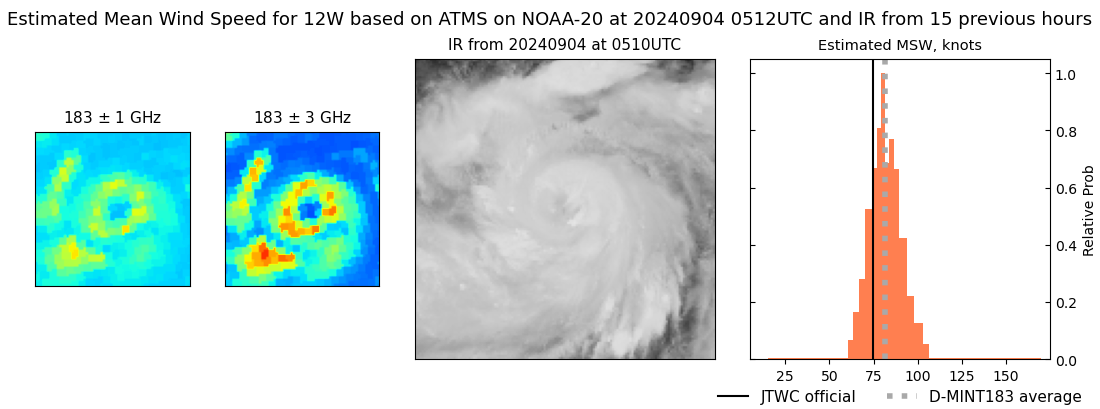 |
| 20240903 | 2239 UTC | SSMISF17 | 969 hPa | 68 kts | 62 kts | 74 kts | 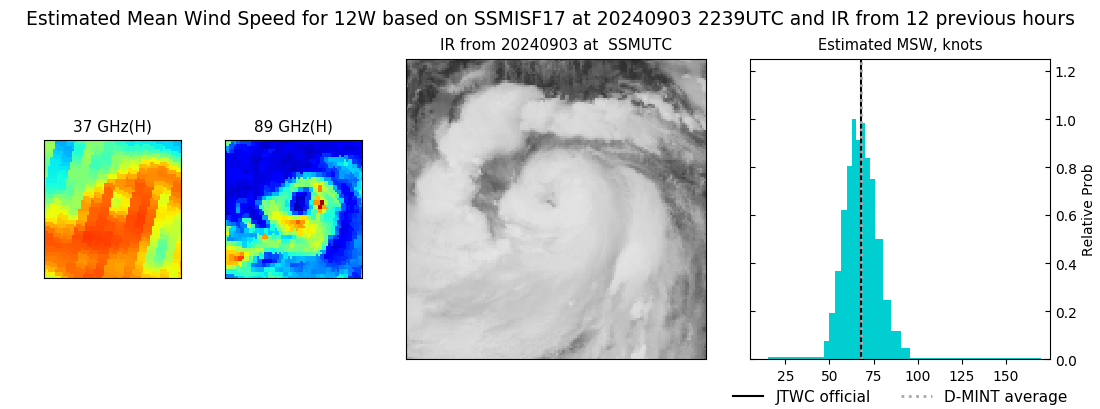 |
| 20240903 | 2206 UTC | SSMISF16 | 968 hPa | 68 kts | 62 kts | 75 kts | 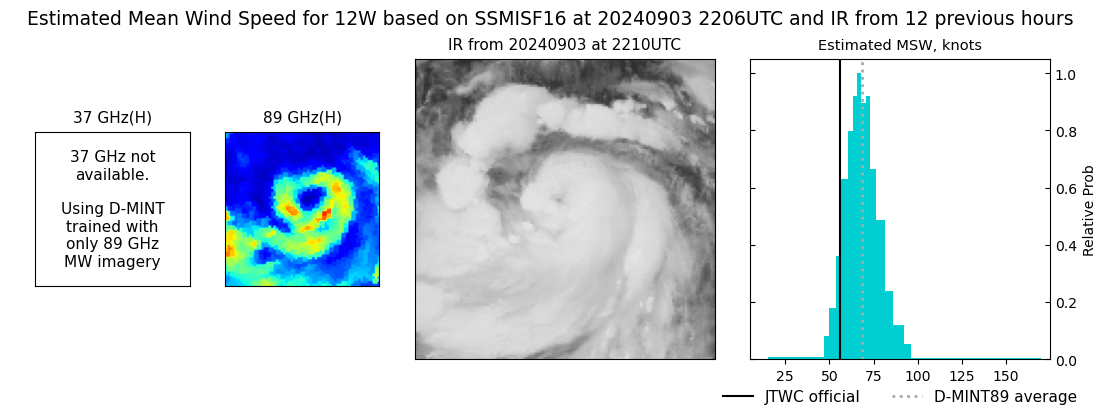 |
| 20240903 | 1953 UTC | SSMISF18 | 974 hPa | 64 kts | 58 kts | 71 kts | 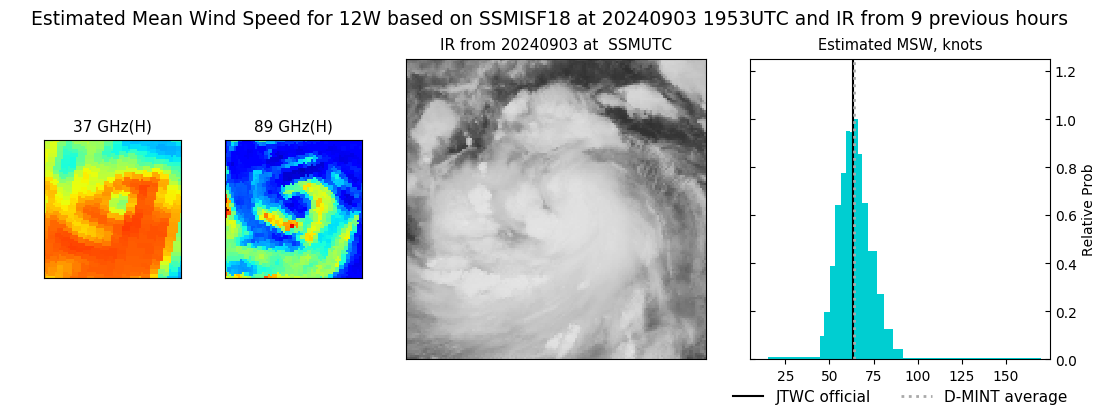 |
| 20240903 | 1738 UTC | ATMS-NPP | 983 hPa | 53 kts | 46 kts | 60 kts | 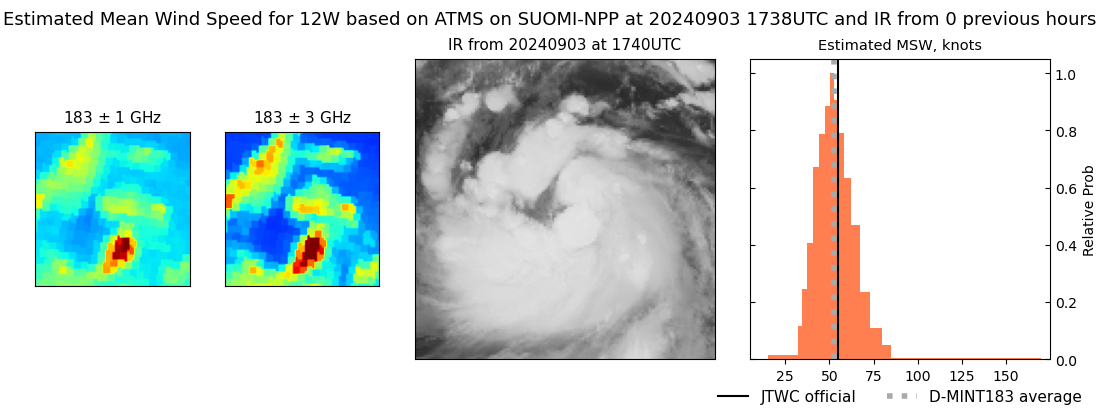 |
| 20240903 | 1712 UTC | ATMS-N21 | 981 hPa | 55 kts | 50 kts | 61 kts | 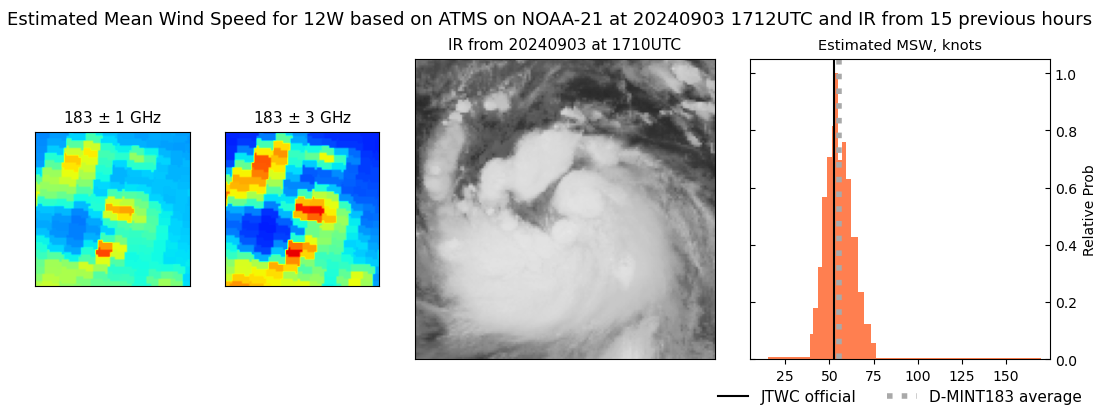 |
| 20240903 | 1548 UTC | GMI | 985 hPa | 54 kts | 48 kts | 59 kts | 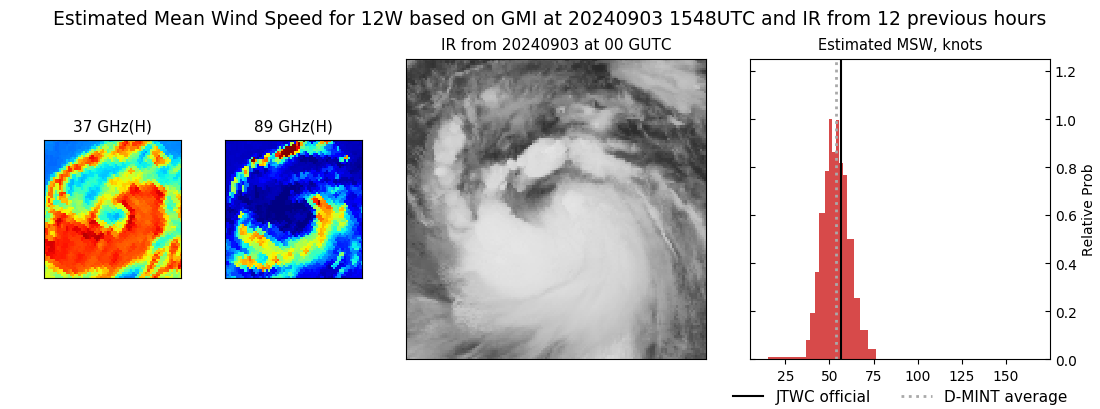 |
| 20240903 | 1545 UTC | TROPICS05 | 982 hPa | 53 kts | 47 kts | 58 kts | 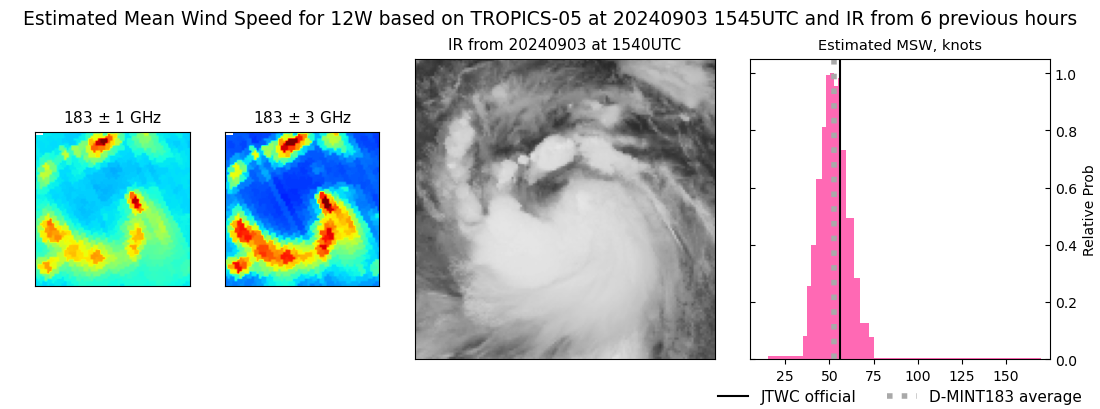 |
| 20240903 | 1114 UTC | TROPICS03 | 983 hPa | 52 kts | 46 kts | 60 kts | 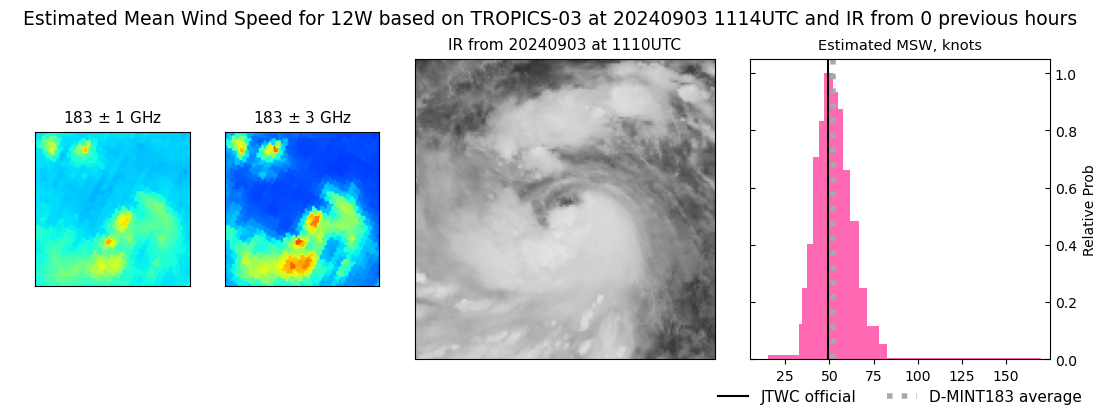 |
| 20240903 | 1007 UTC | SSMISF17 | 982 hPa | 53 kts | 47 kts | 59 kts | 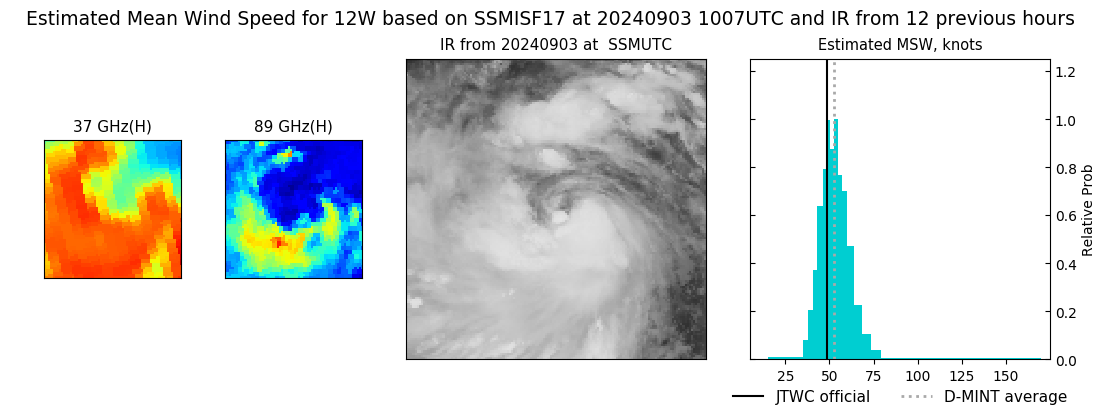 |
| 20240903 | 0933 UTC | SSMISF16 | 985 hPa | 50 kts | 44 kts | 56 kts | 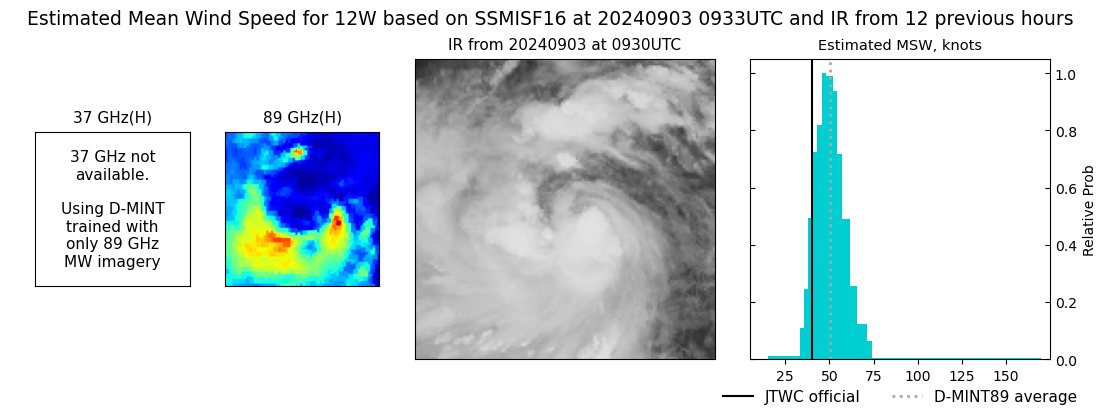 |
| 20240903 | 0720 UTC | SSMISF18 | 991 hPa | 50 kts | 45 kts | 55 kts | 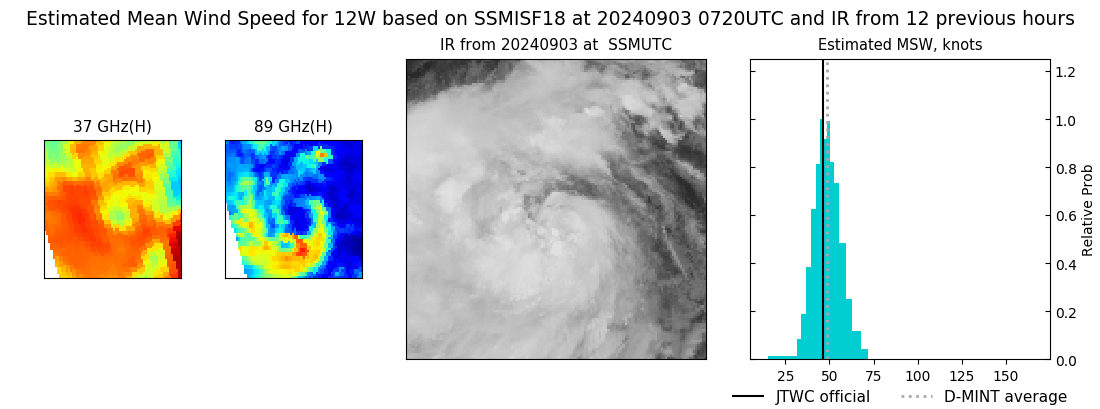 |
| 20240903 | 0531 UTC | ATMS-N20 | 993 hPa | 46 kts | 42 kts | 51 kts | 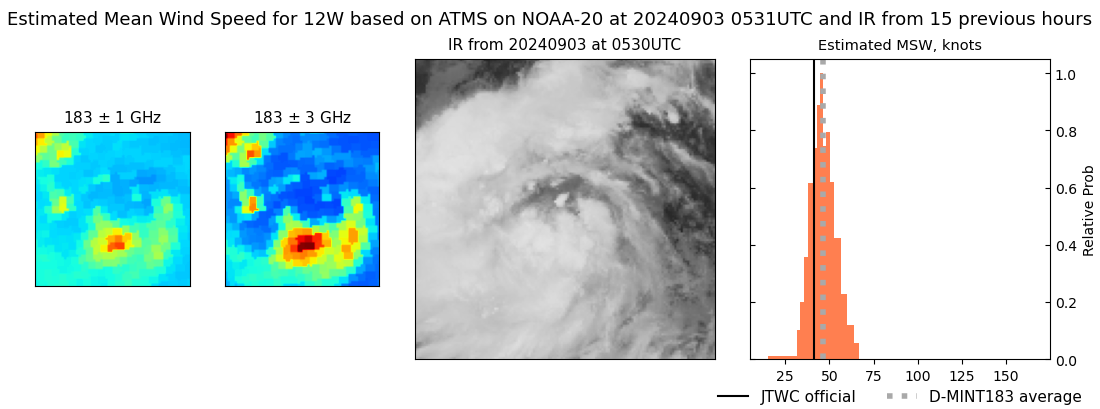 |
| 20240903 | 0505 UTC | AMSR2 | 994 hPa | 42 kts | 37 kts | 47 kts | 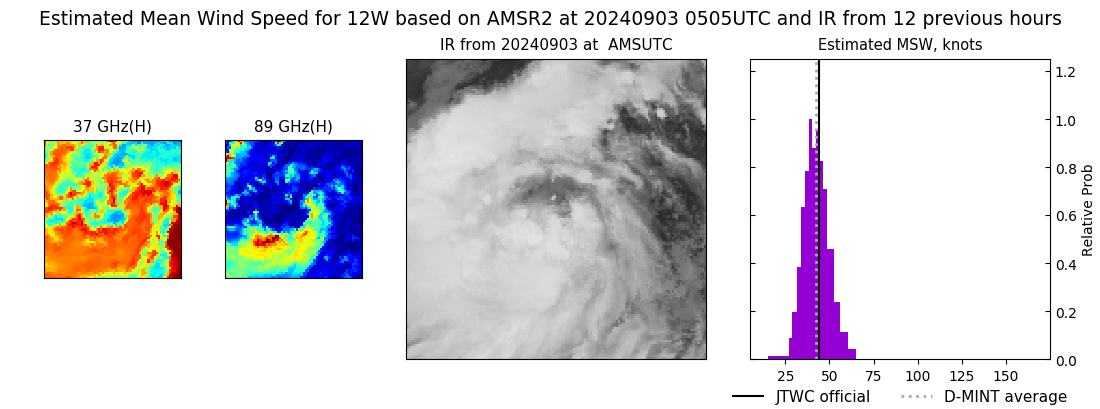 |
| 20240903 | 0442 UTC | ATMS-N21 | 998 hPa | 37 kts | 32 kts | 41 kts | 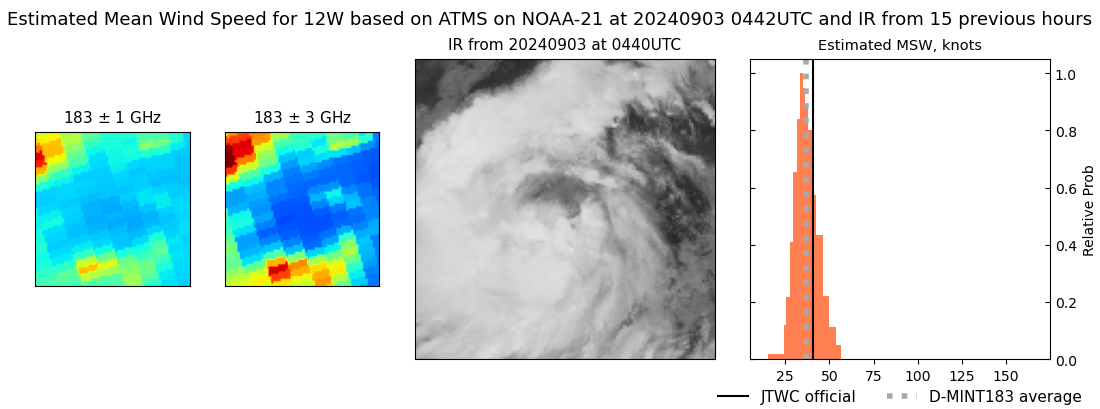 |
| 20240903 | 0228 UTC | GMI | 998 hPa | 36 kts | 32 kts | 40 kts | 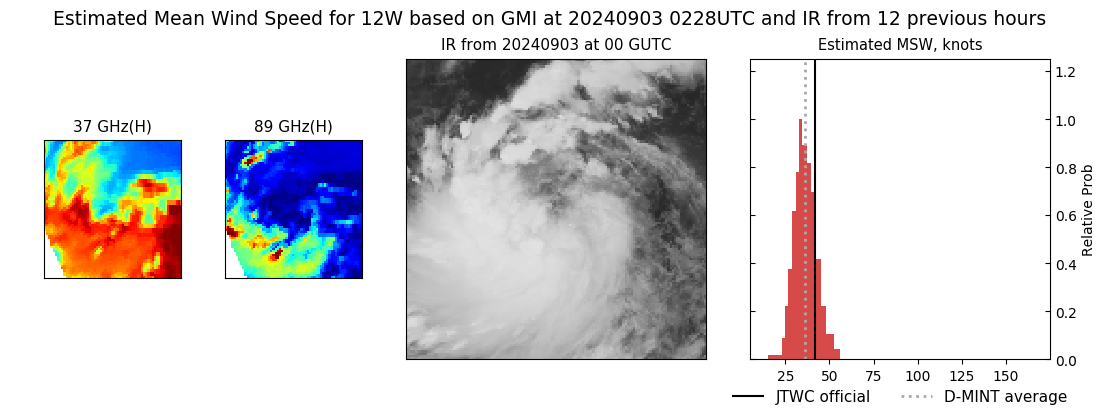 |
| 20240902 | 2218 UTC | SSMISF16 | 1000 hPa | 35 kts | 30 kts | 40 kts | 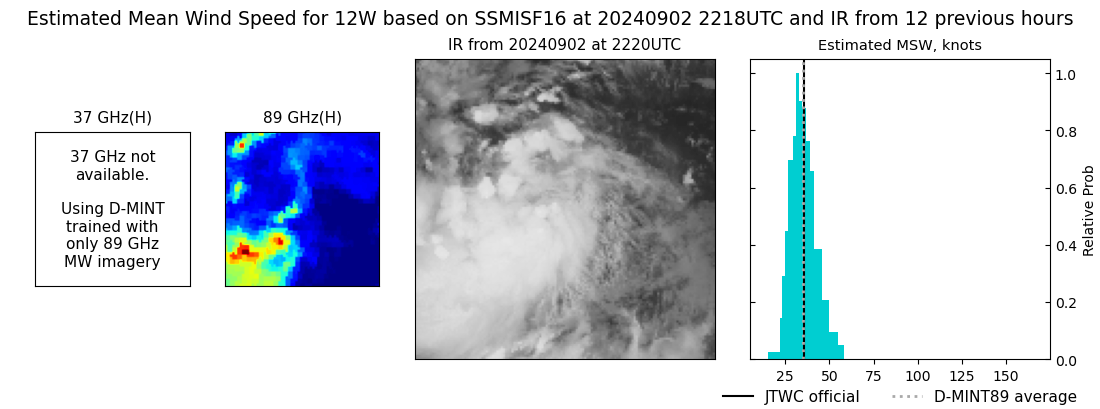 |
| 20240902 | 2005 UTC | SSMISF18 | 1001 hPa | 33 kts | 29 kts | 38 kts | 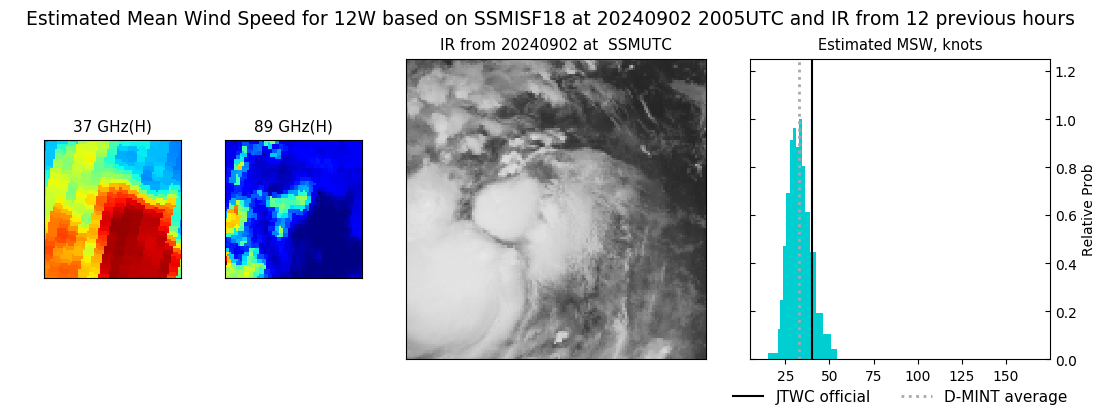 |
| 20240902 | 1756 UTC | ATMS-NPP | 1000 hPa | 32 kts | 29 kts | 36 kts | 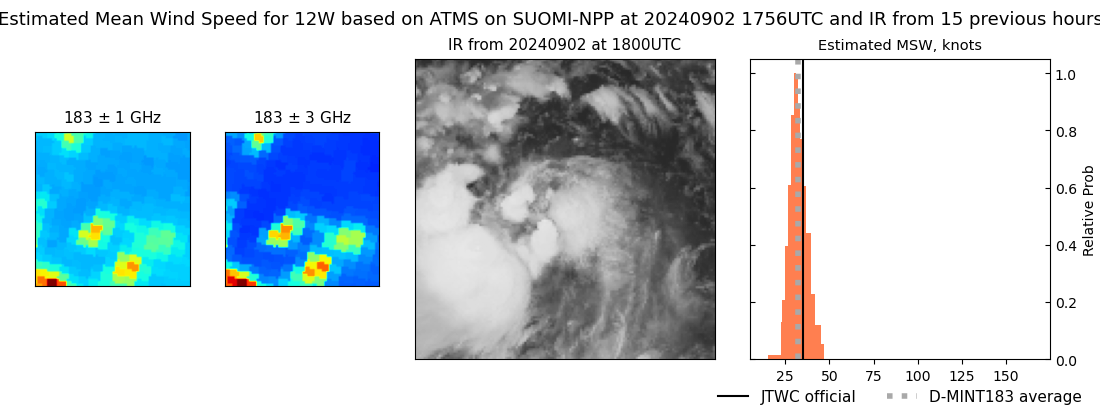 |
| 20240902 | 1731 UTC | ATMS-N21 | 999 hPa | 30 kts | 27 kts | 33 kts | 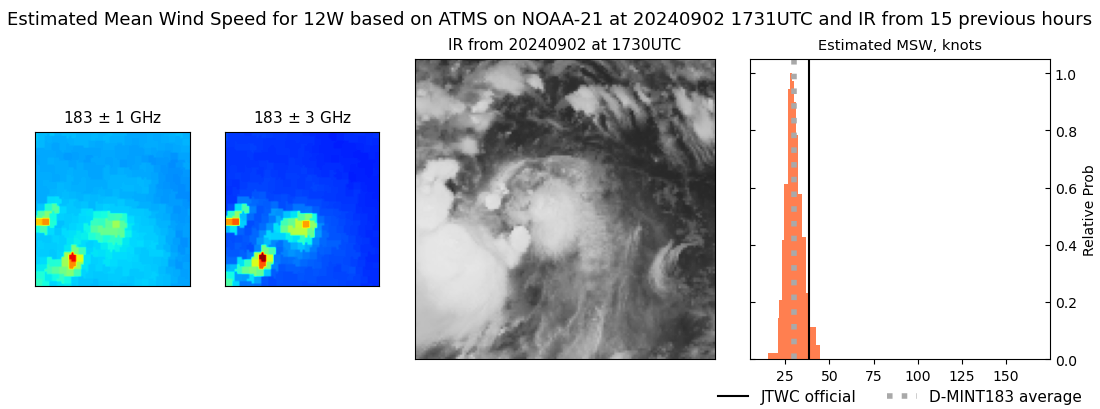 |
| 20240902 | 1609 UTC | TROPICS05 | 997 hPa | 38 kts | 34 kts | 42 kts | 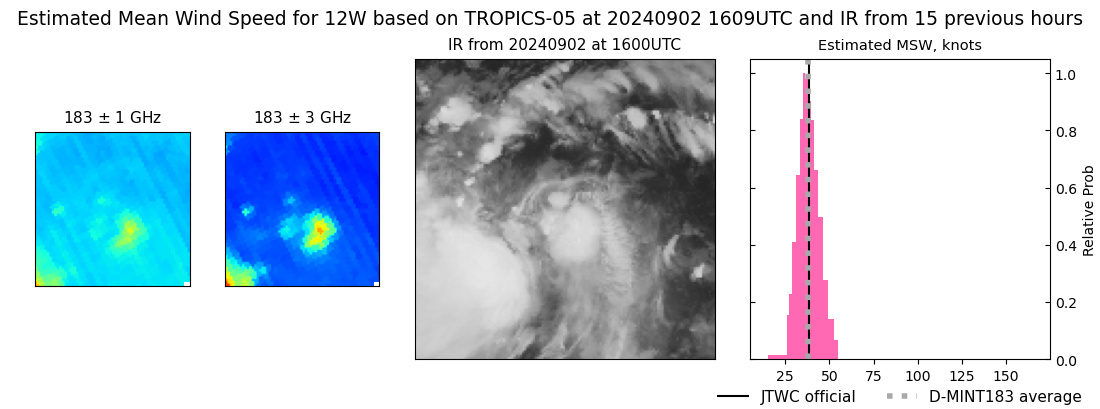 |
| 20240902 | 1138 UTC | TROPICS03 | 996 hPa | 39 kts | 35 kts | 44 kts | 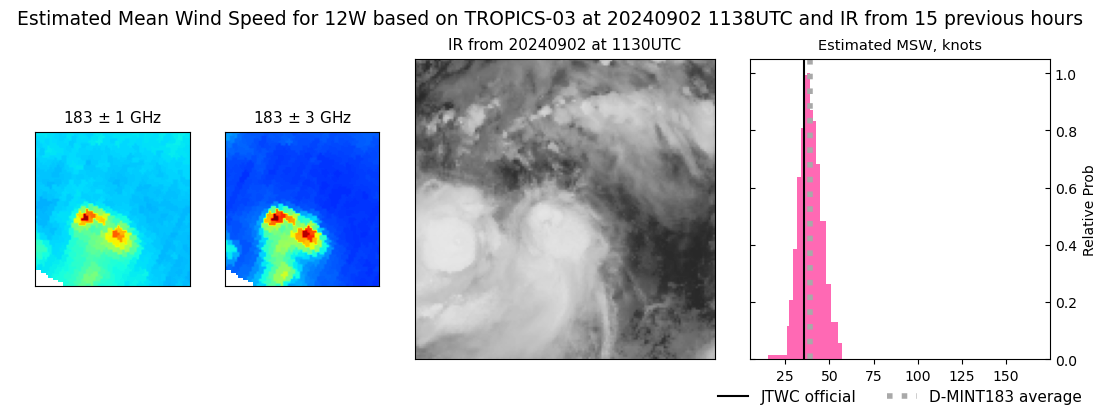 |
| 20240902 | 1020 UTC | SSMISF17 | 996 hPa | 34 kts | 30 kts | 40 kts | 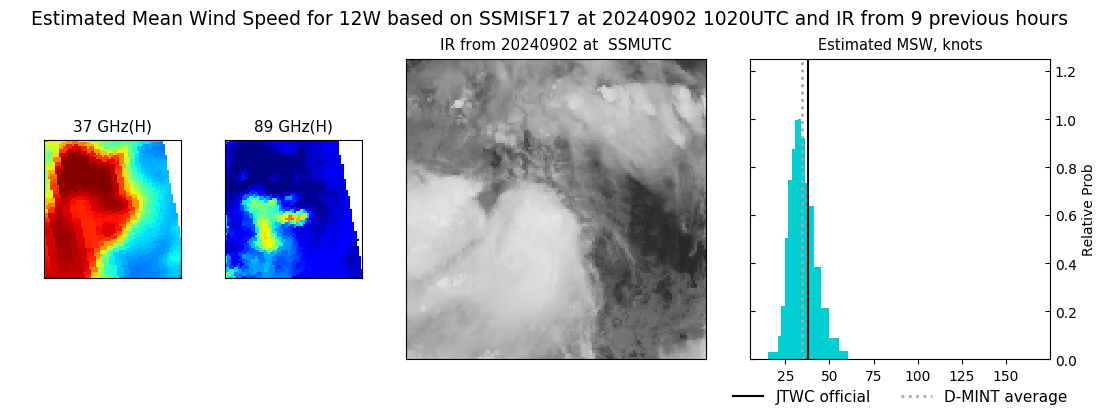 |
| 20240902 | 0944 UTC | SSMISF16 | 995 hPa | 33 kts | 29 kts | 38 kts | 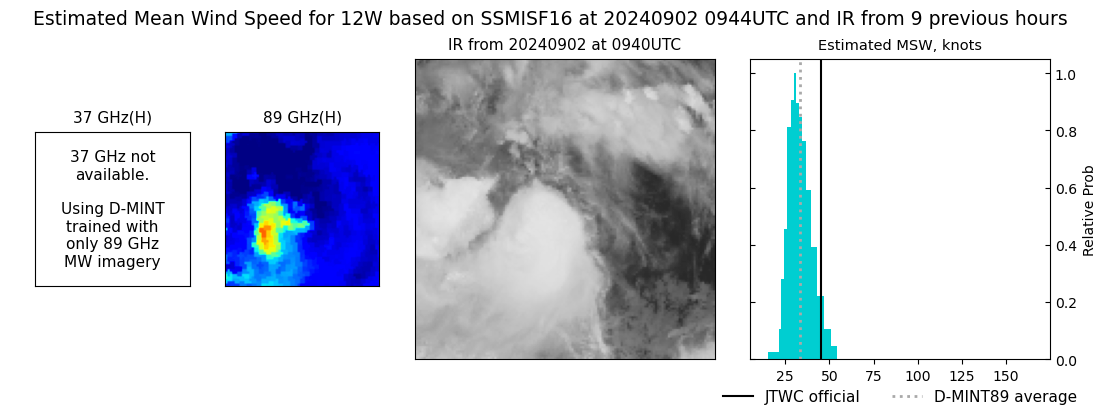 |
| 20240902 | 0731 UTC | SSMISF18 | 994 hPa | 37 kts | 32 kts | 42 kts | 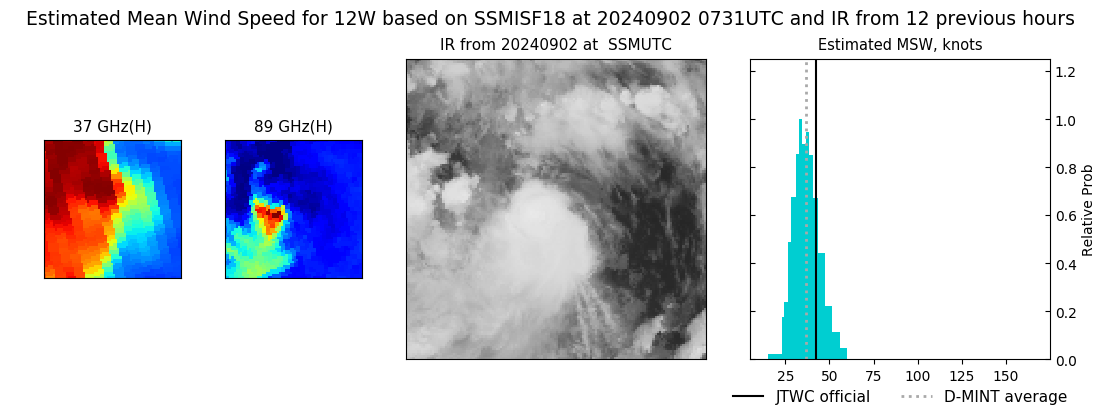 |
| 20240902 | 0524 UTC | ATMS-NPP | 993 hPa | 43 kts | 39 kts | 48 kts | 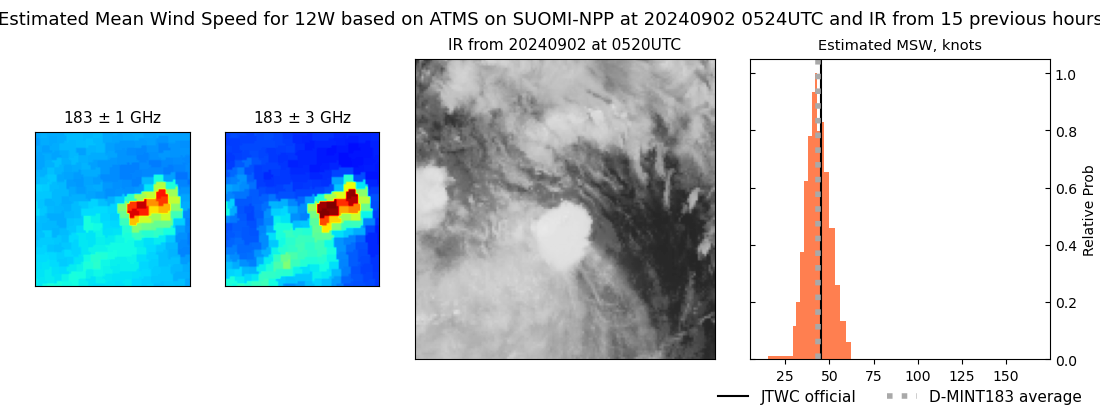 |
| 20240902 | 0500 UTC | ATMS-N21 | 995 hPa | 42 kts | 37 kts | 46 kts | 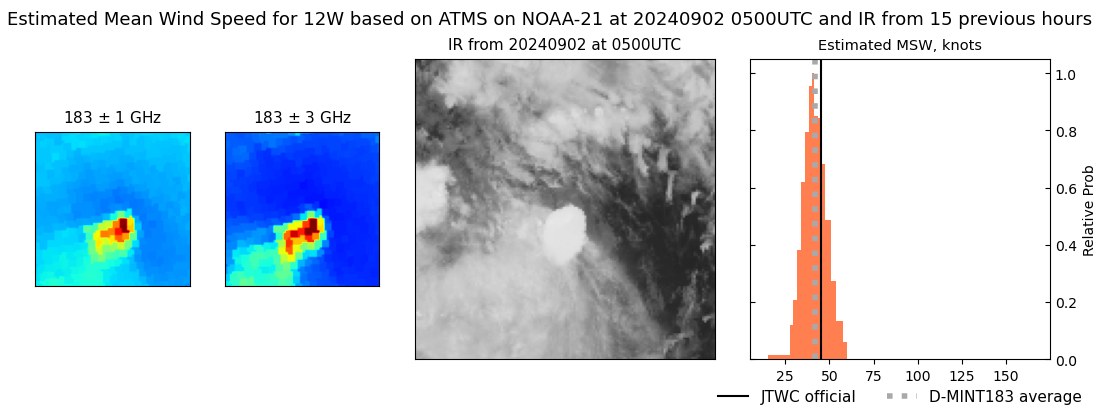 |
| 20240902 | 0459 UTC | ATMS-N21 | 996 hPa | 41 kts | 37 kts | 46 kts | 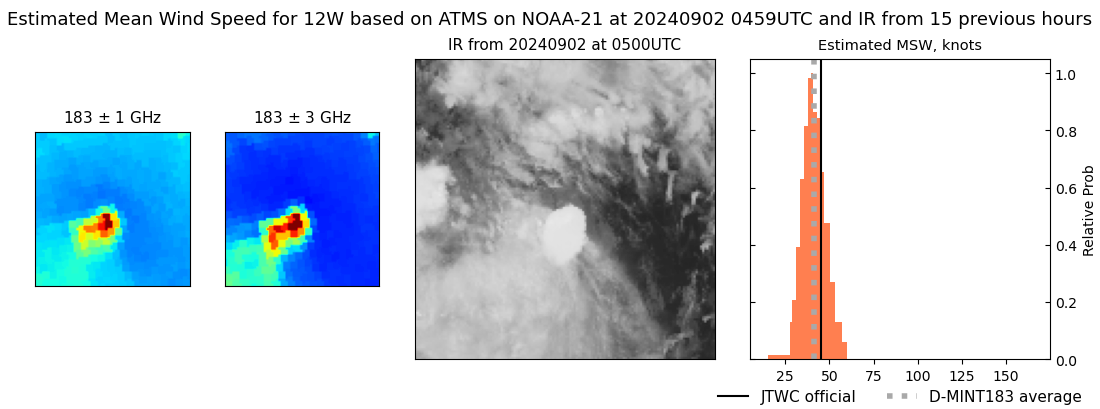 |
| 20240902 | 0314 UTC | TROPICS03 | 991 hPa | 47 kts | 42 kts | 52 kts | 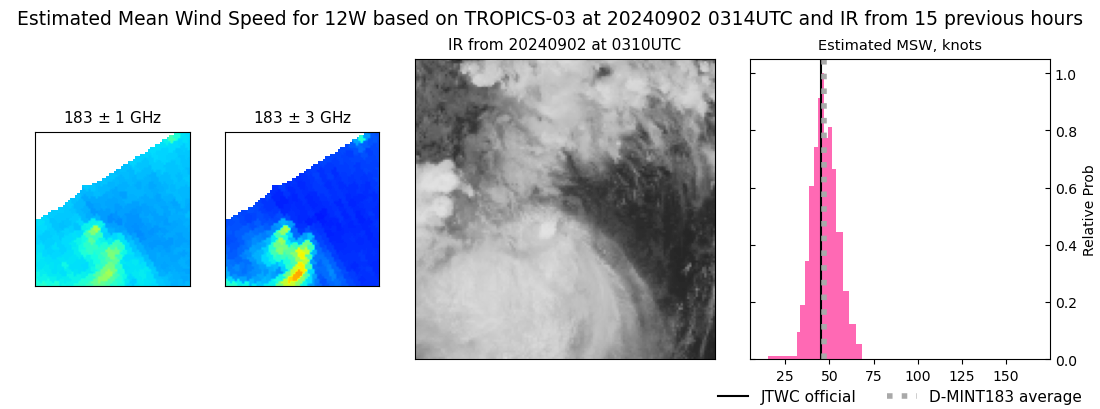 |
| 20240901 | 2021 UTC | SSMISF18 | 995 hPa | 38 kts | 34 kts | 43 kts | 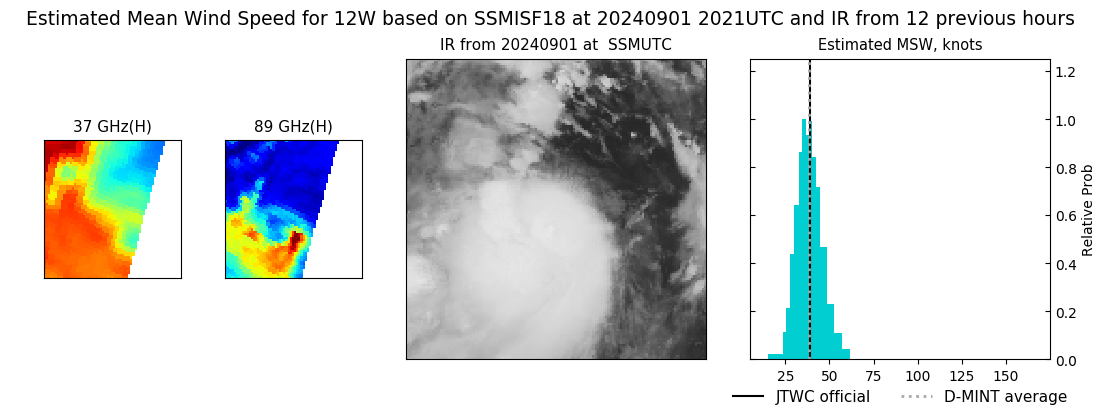 |
| 20240901 | 1751 UTC | ATMS-N21 | 993 hPa | 47 kts | 42 kts | 52 kts | 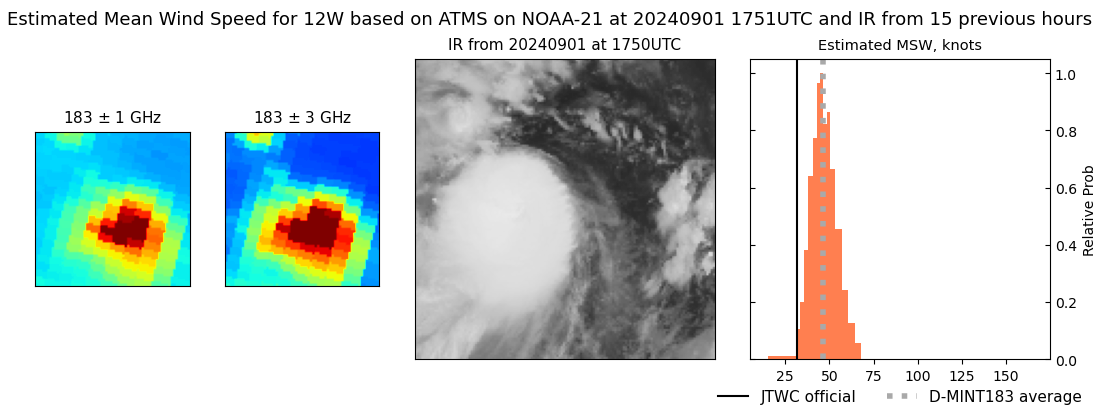 |
| 20240901 | 1729 UTC | AMSR2 | 997 hPa | 36 kts | 31 kts | 40 kts | 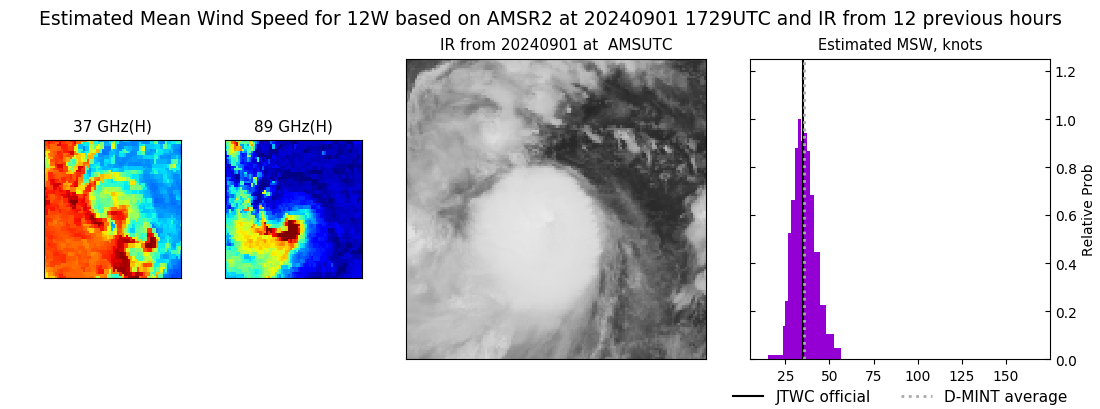 |
| 20240901 | 1700 UTC | ATMS-N20 | 992 hPa | 42 kts | 38 kts | 46 kts | 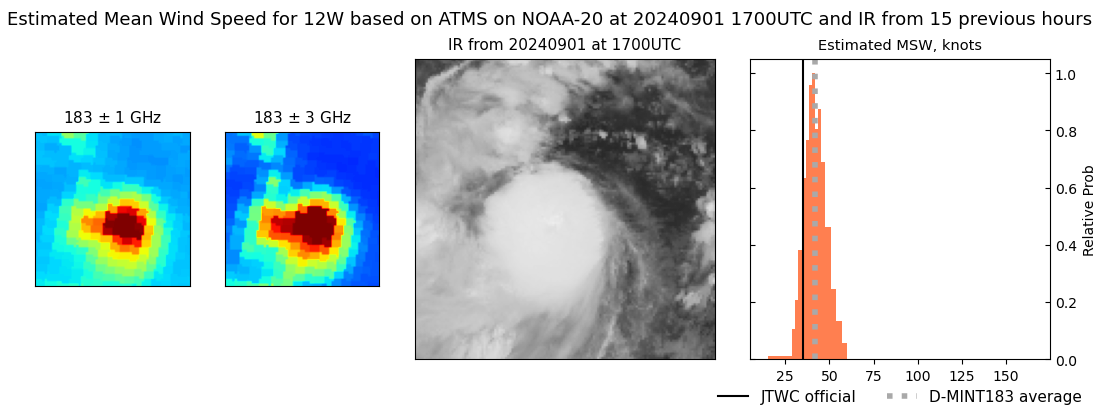 |
| 20240901 | 1659 UTC | ATMS-N20 | 994 hPa | 41 kts | 36 kts | 45 kts | 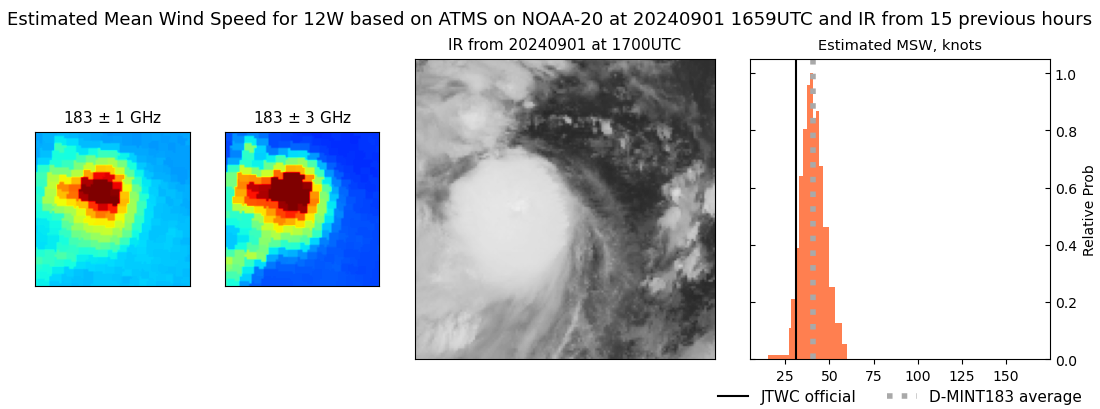 |
| 20240901 | 1538 UTC | GMI | 1001 hPa | 32 kts | 28 kts | 35 kts | 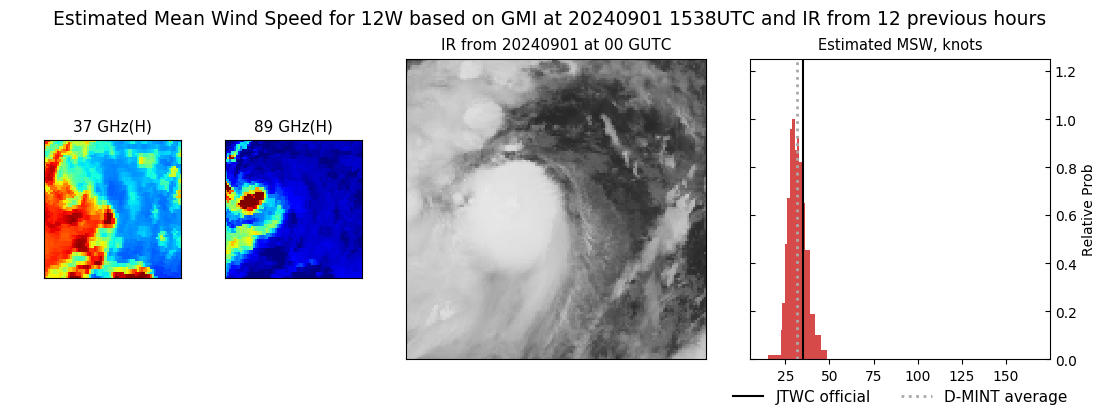 |
|
