|
||
 |
D-MINT HISTORY FILE for 2024_16L
| Date | Time | MW Sensor | MSLP | Vmax (30th-70th percentile average) | Vmax 25th percentile | Vmax 75th percentile | Image |
| 20241022 | 1110 UTC | SSMISF17 | 1005 hPa | 37 kts | 33 kts | 41 kts | 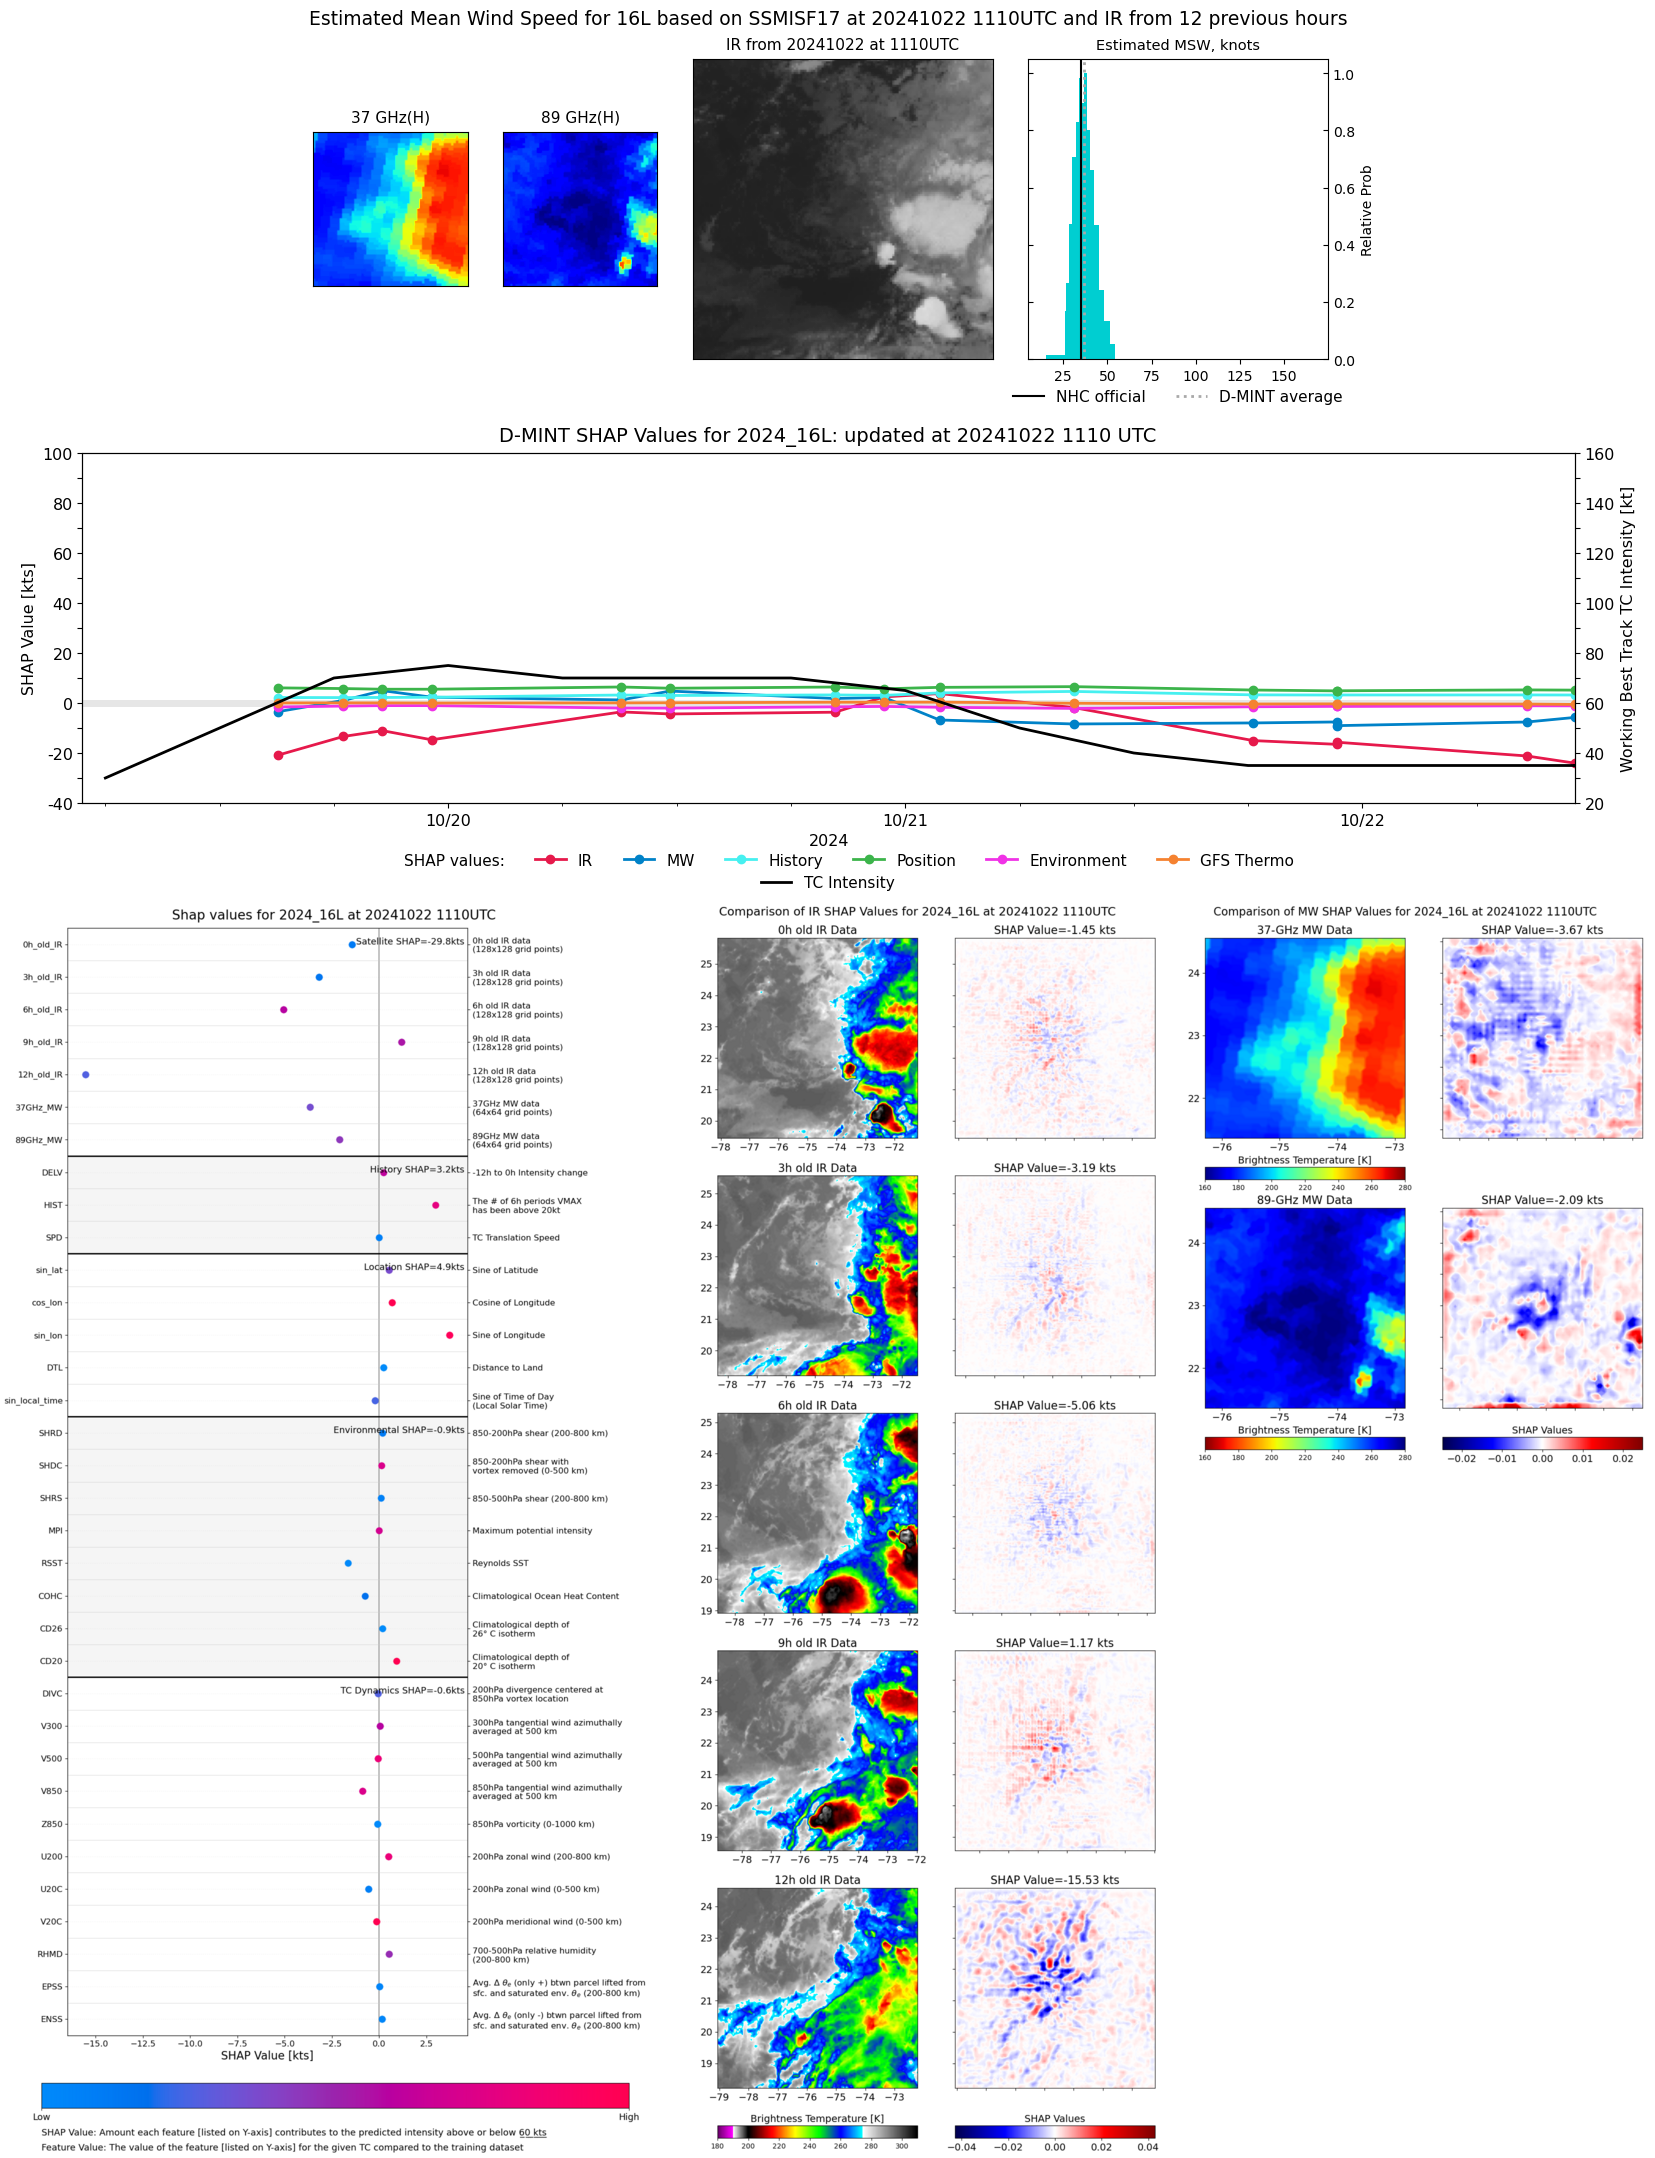 |
| 20241022 | 1059 UTC | SSMISF16 | 1009 hPa | 37 kts | 33 kts | 41 kts | 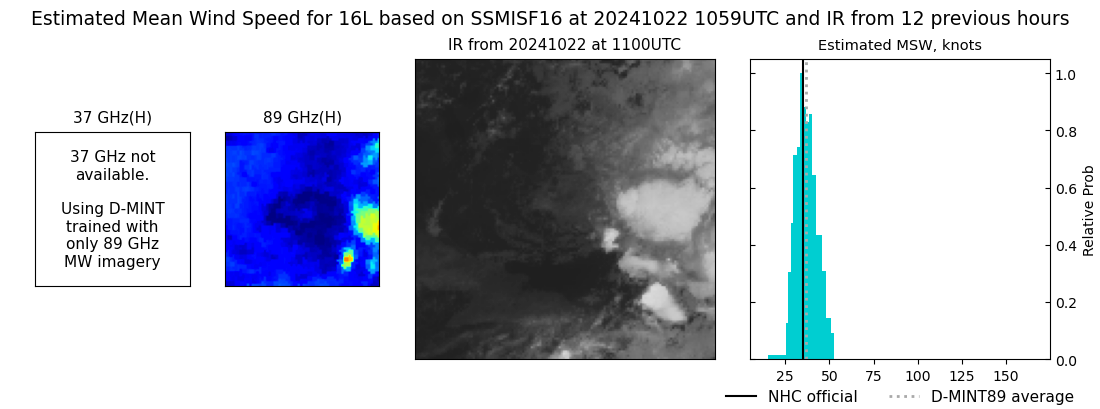 |
| 20241022 | 0838 UTC | SSMISF18 | 1007 hPa | 38 kts | 34 kts | 43 kts |  |
| 20241021 | 2240 UTC | SSMISF17 | 999 hPa | 42 kts | 37 kts | 47 kts | 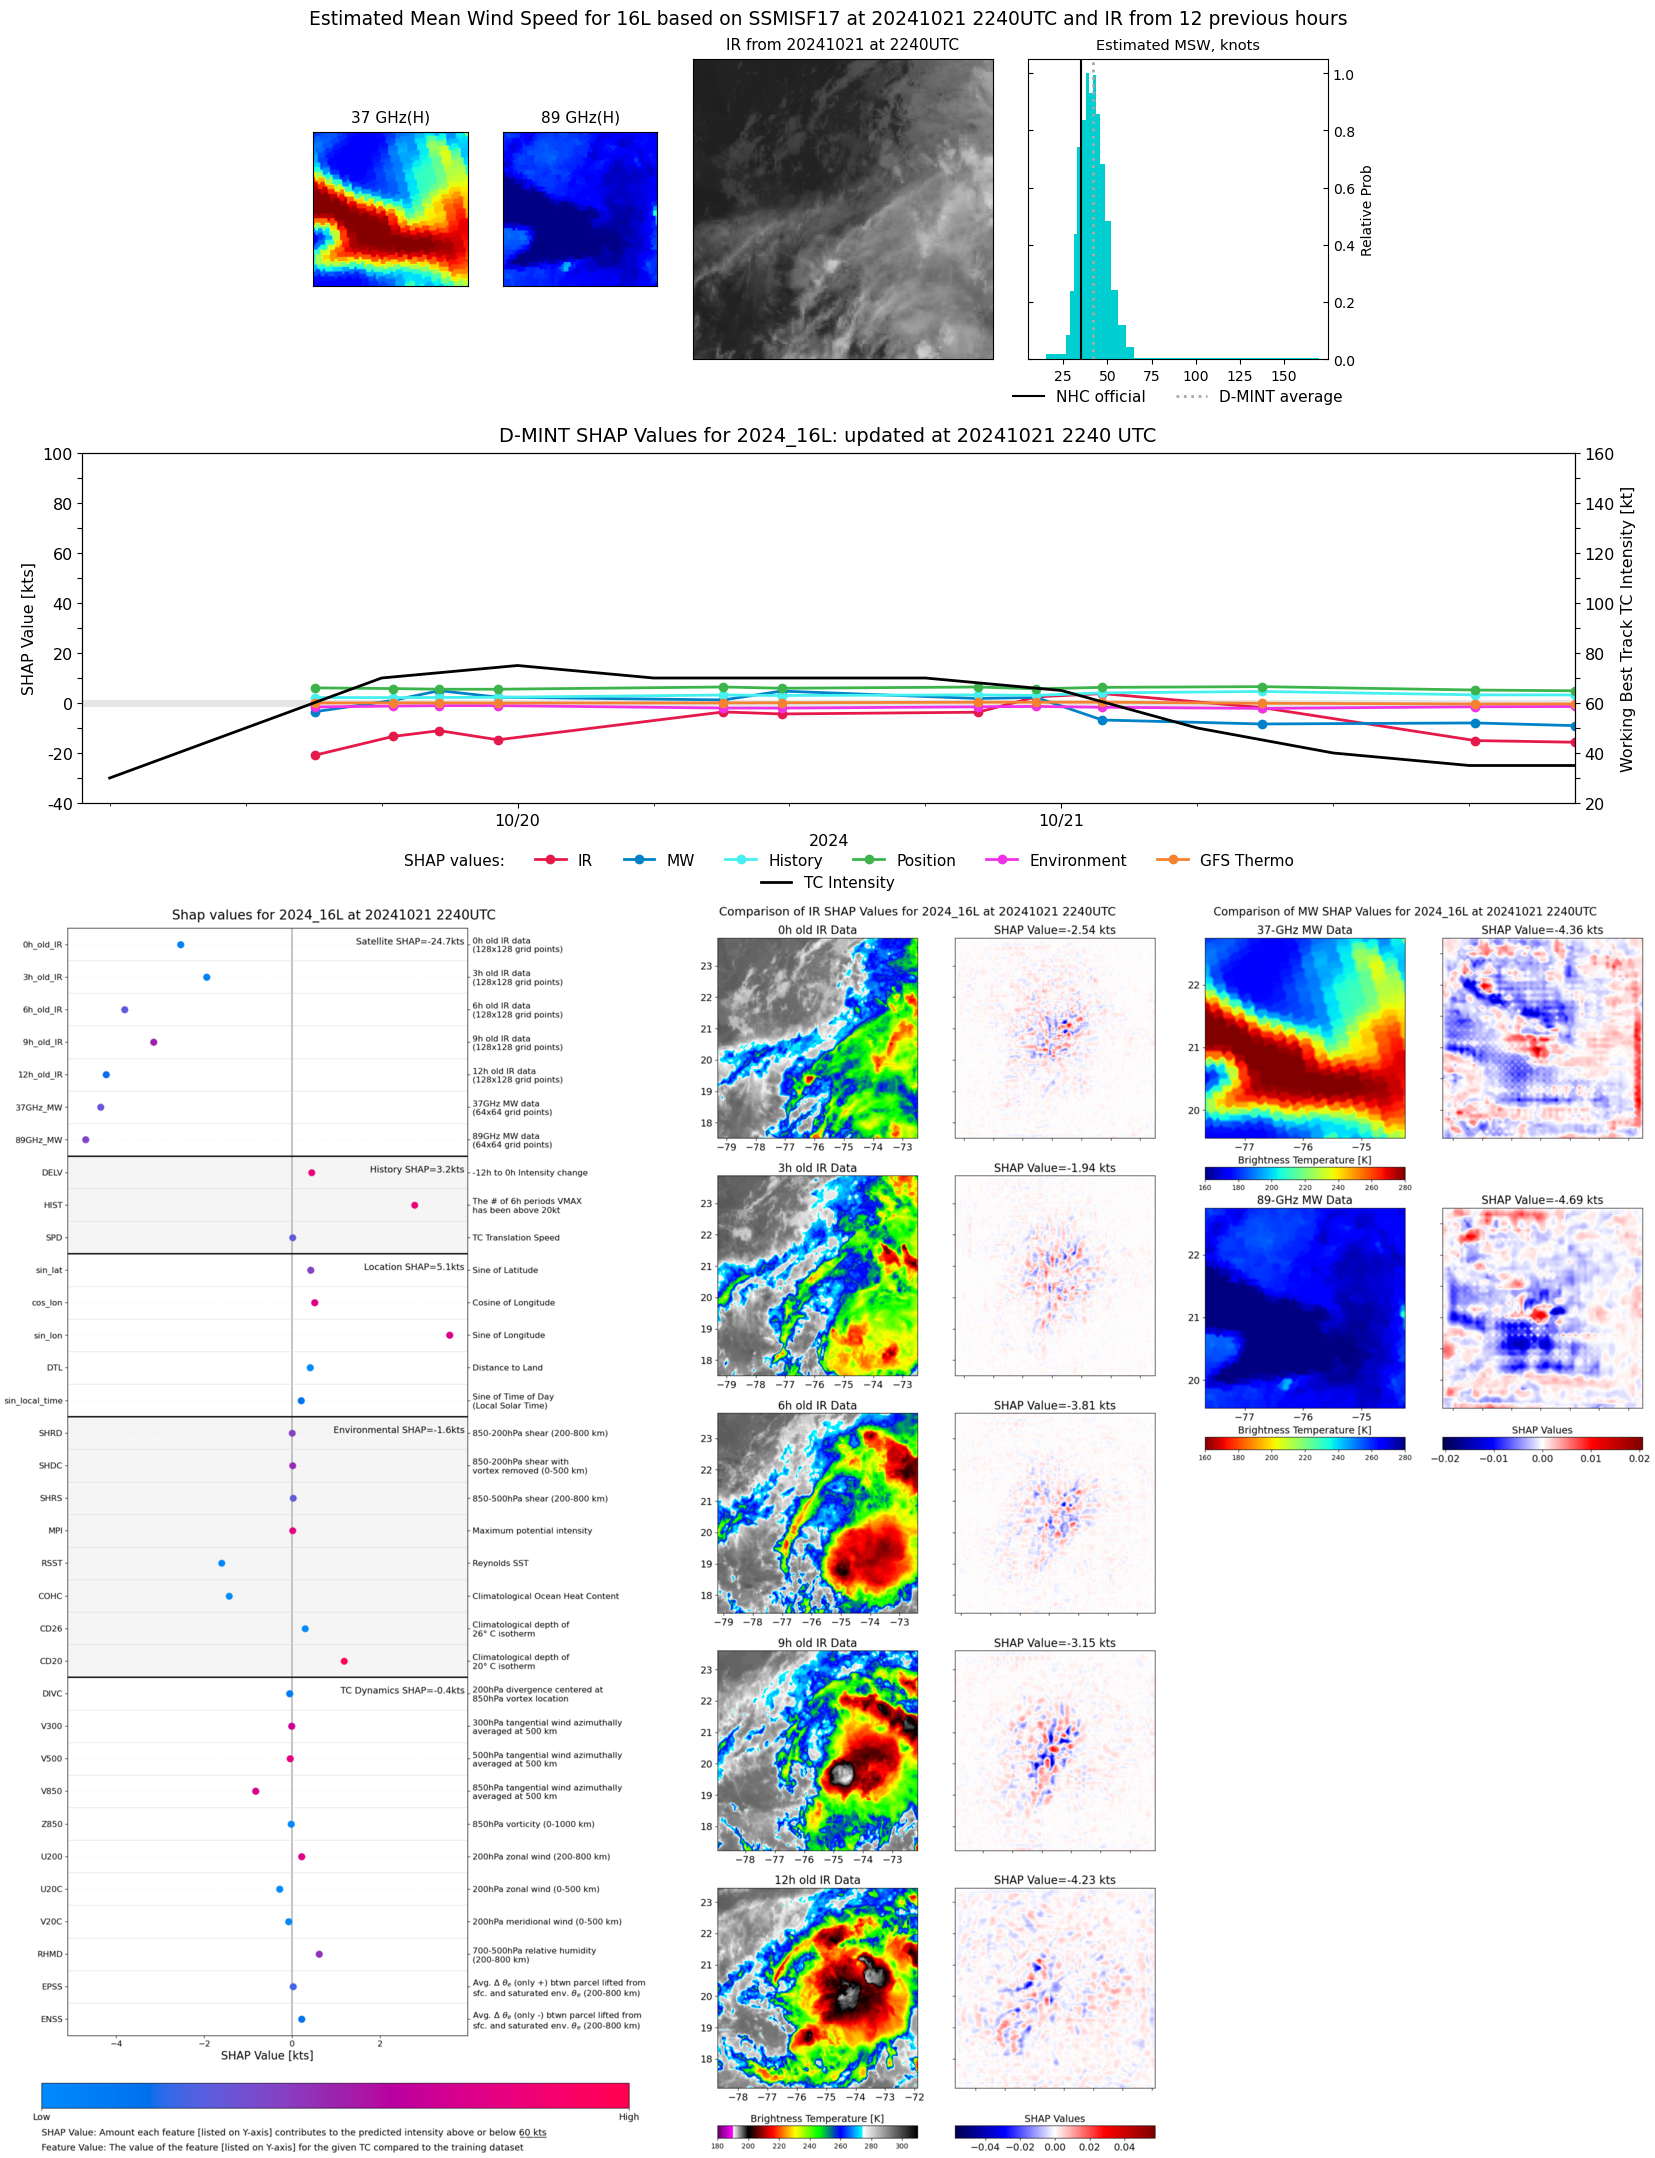 |
| 20241021 | 2239 UTC | SSMISF17 | 999 hPa | 42 kts | 37 kts | 48 kts | 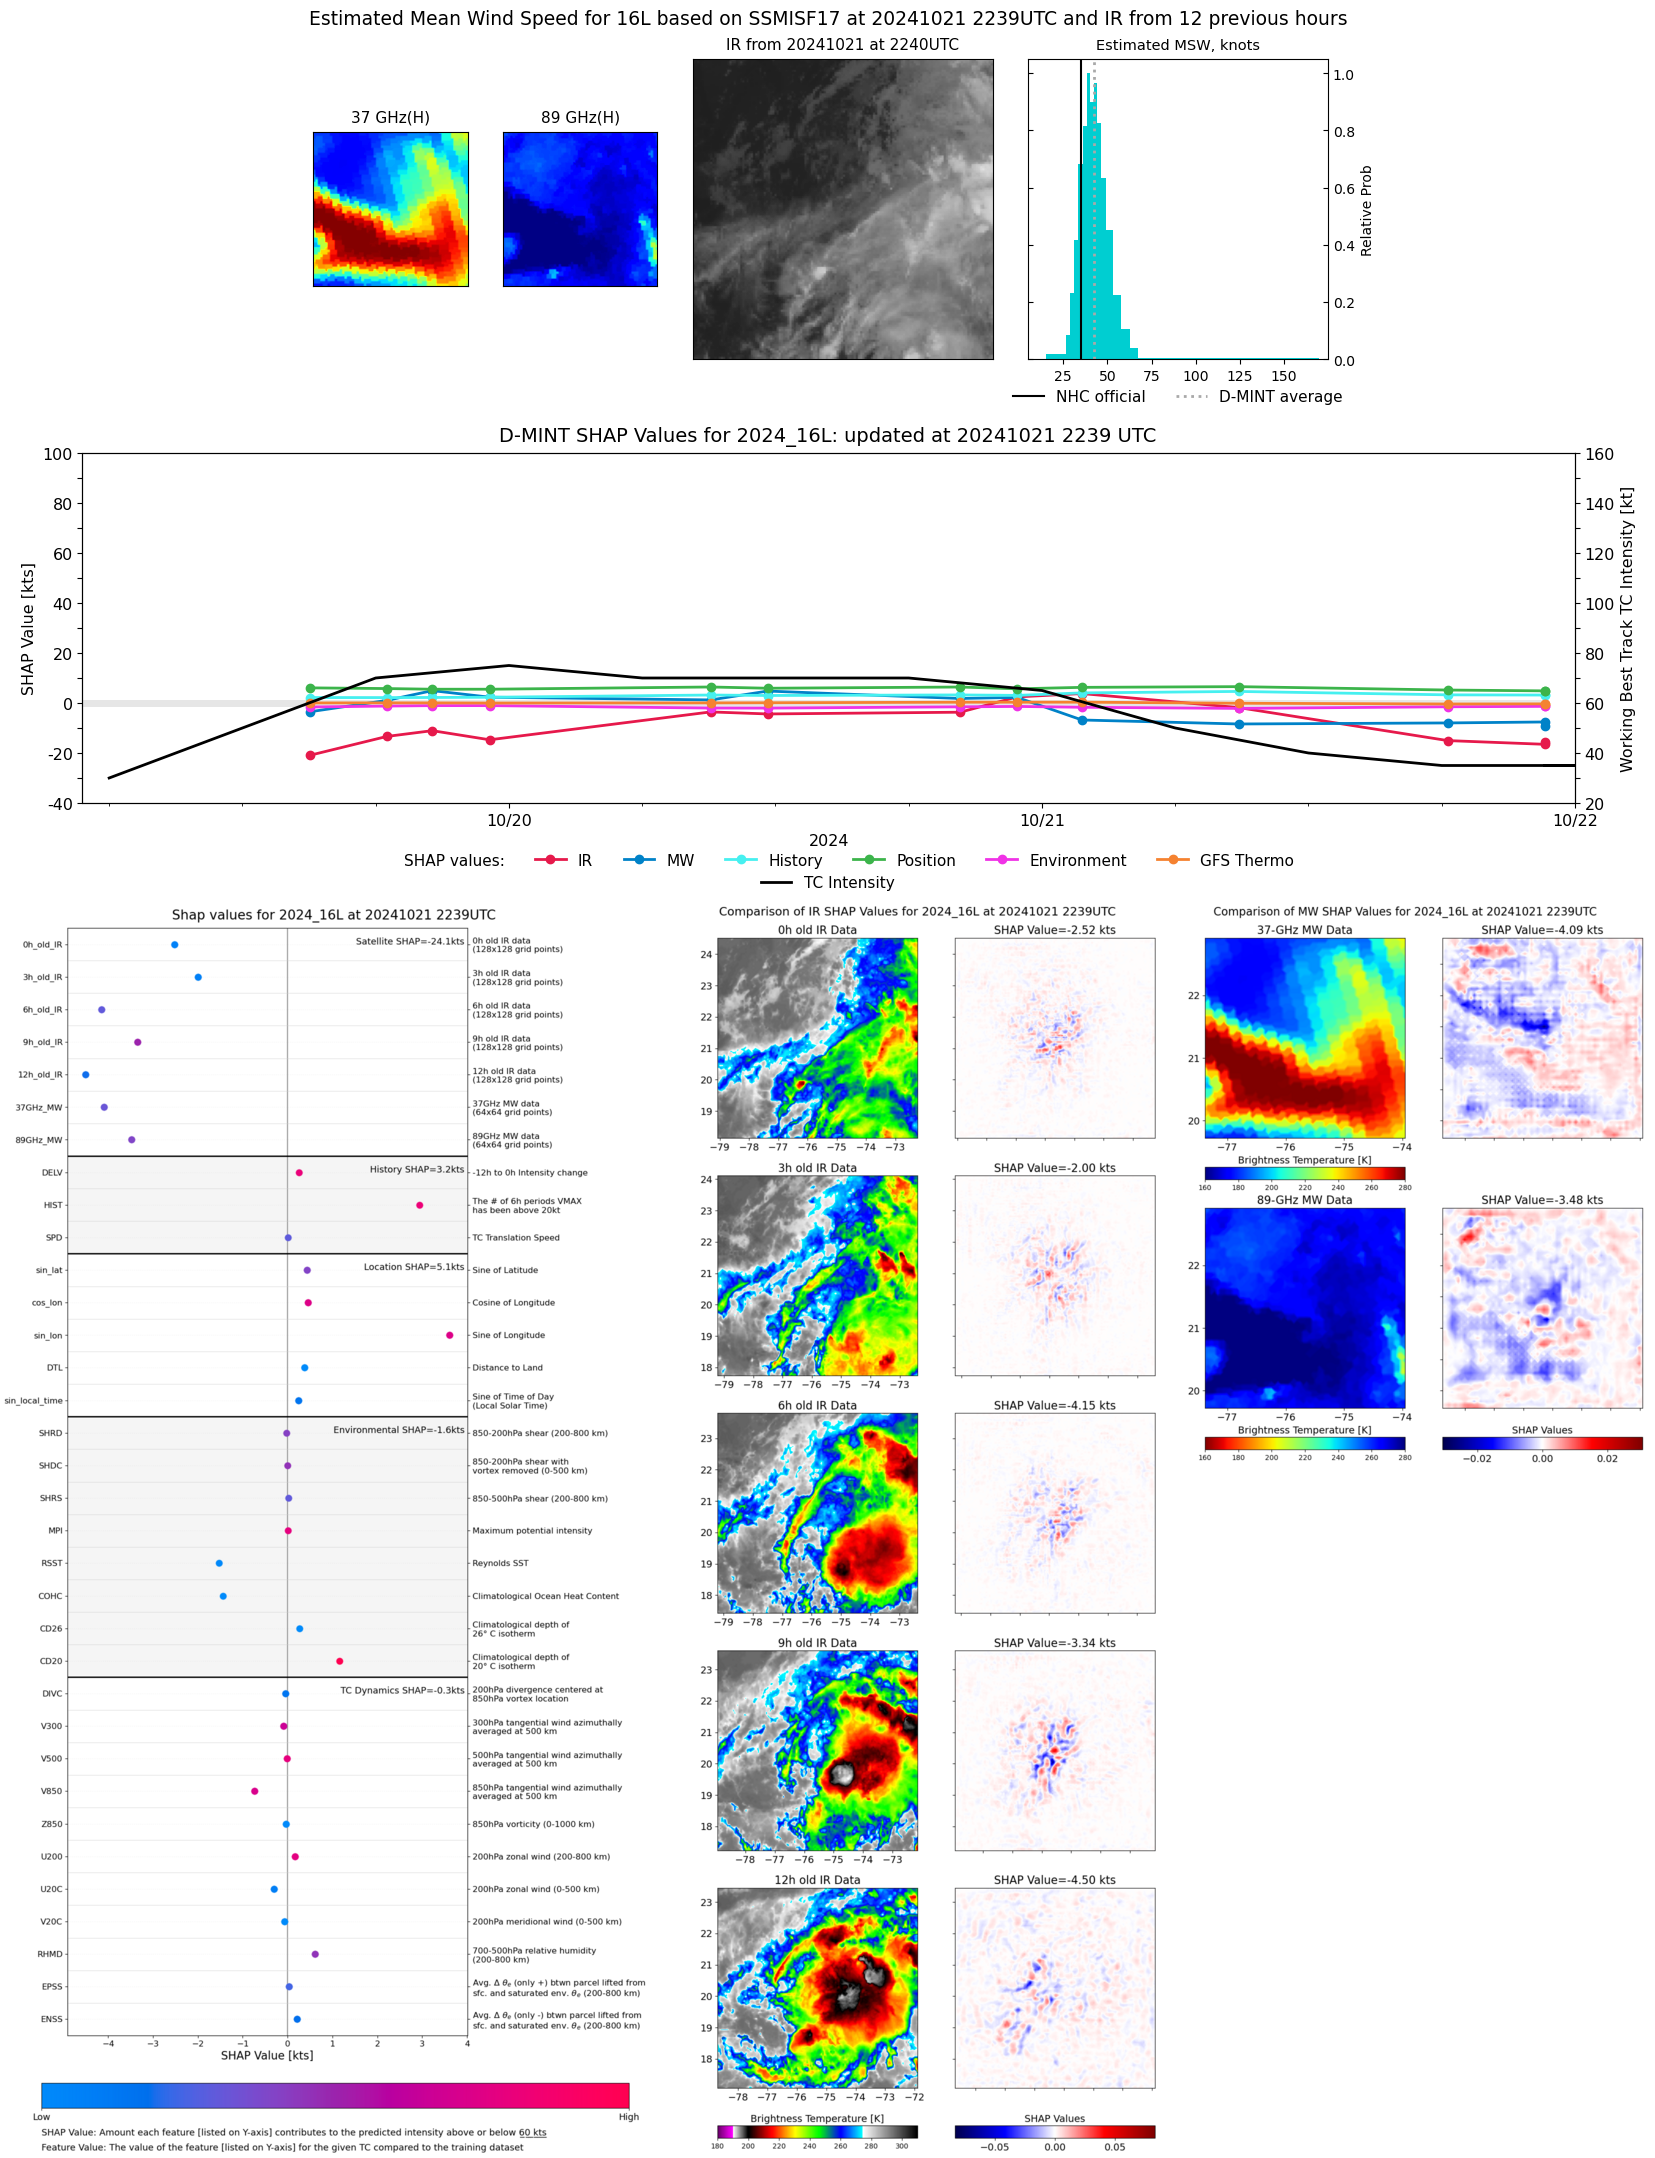 |
| 20241021 | 1838 UTC | ATMS-NPP | 1000 hPa | 44 kts | 39 kts | 49 kts |  |
| 20241021 | 1816 UTC | AMSR2 | 1000 hPa | 44 kts | 38 kts | 49 kts |  |
| 20241021 | 1814 UTC | ATMS-N21 | 999 hPa | 47 kts | 42 kts | 52 kts | 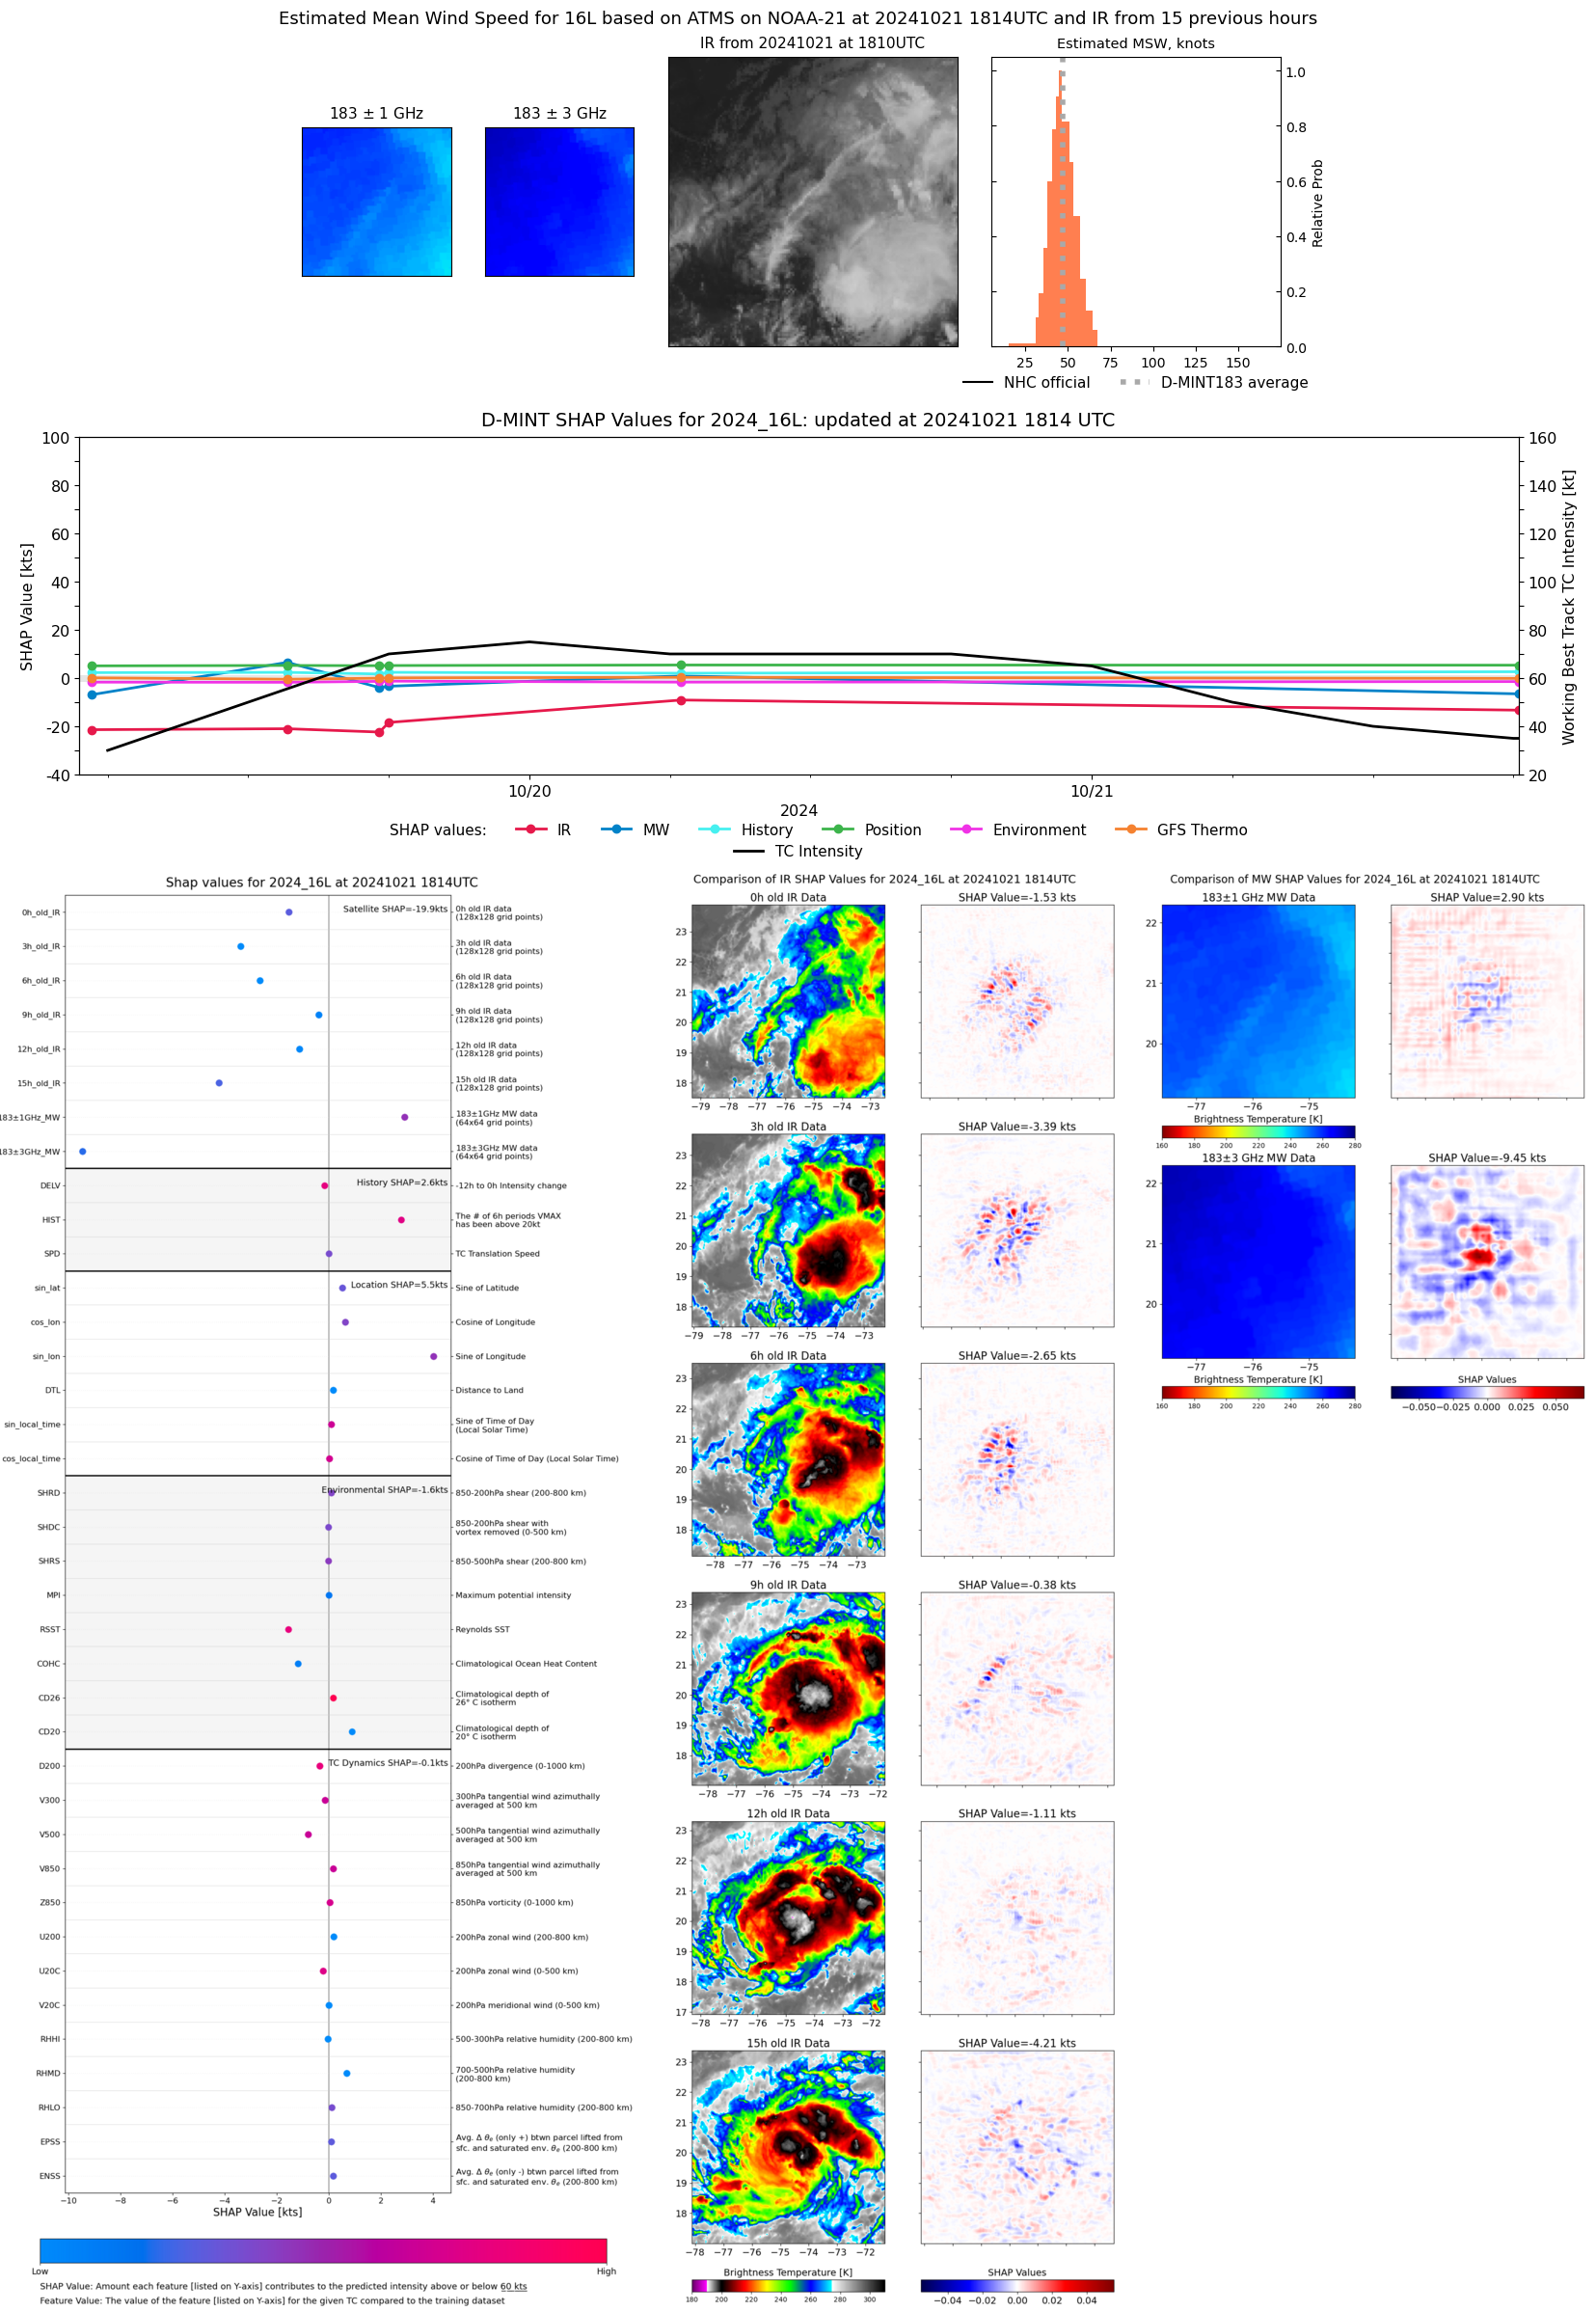 |
| 20241021 | 1513 UTC | GMI | 995 hPa | 50 kts | 44 kts | 56 kts | 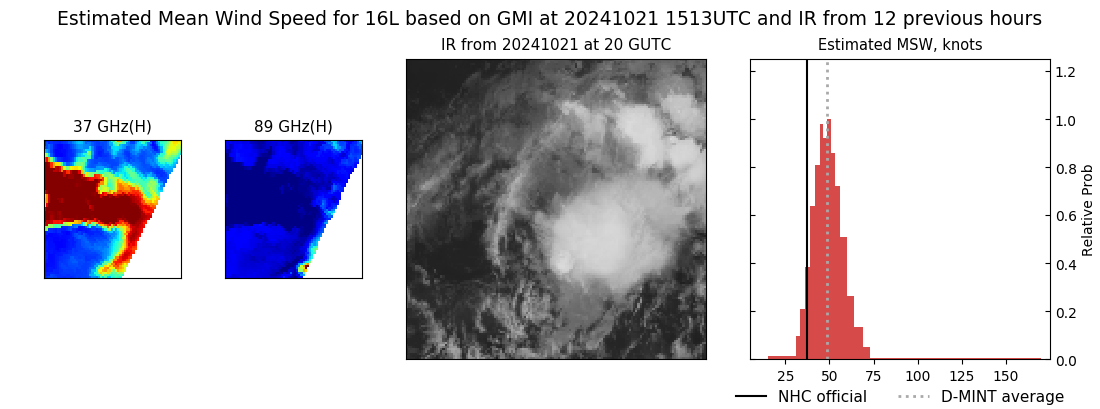 |
| 20241021 | 1112 UTC | SSMISF16 | 992 hPa | 59 kts | 52 kts | 67 kts | 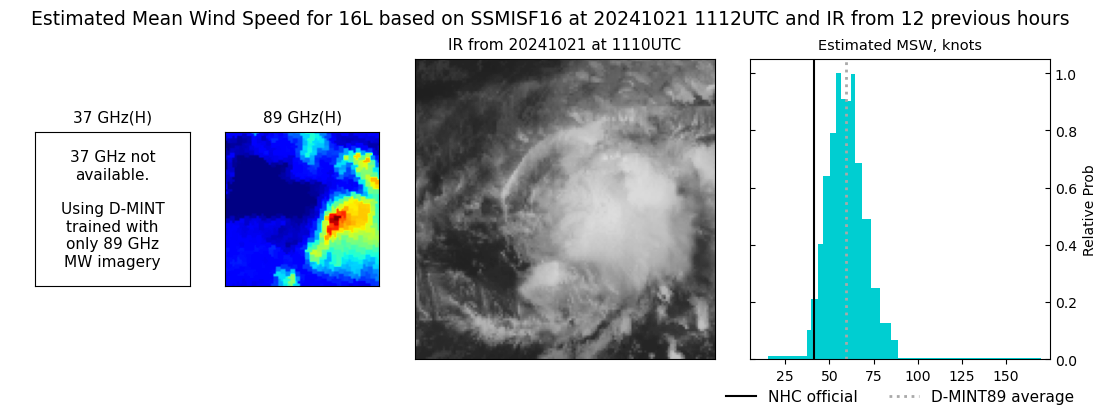 |
| 20241021 | 0851 UTC | SSMISF18 | 990 hPa | 59 kts | 51 kts | 67 kts | 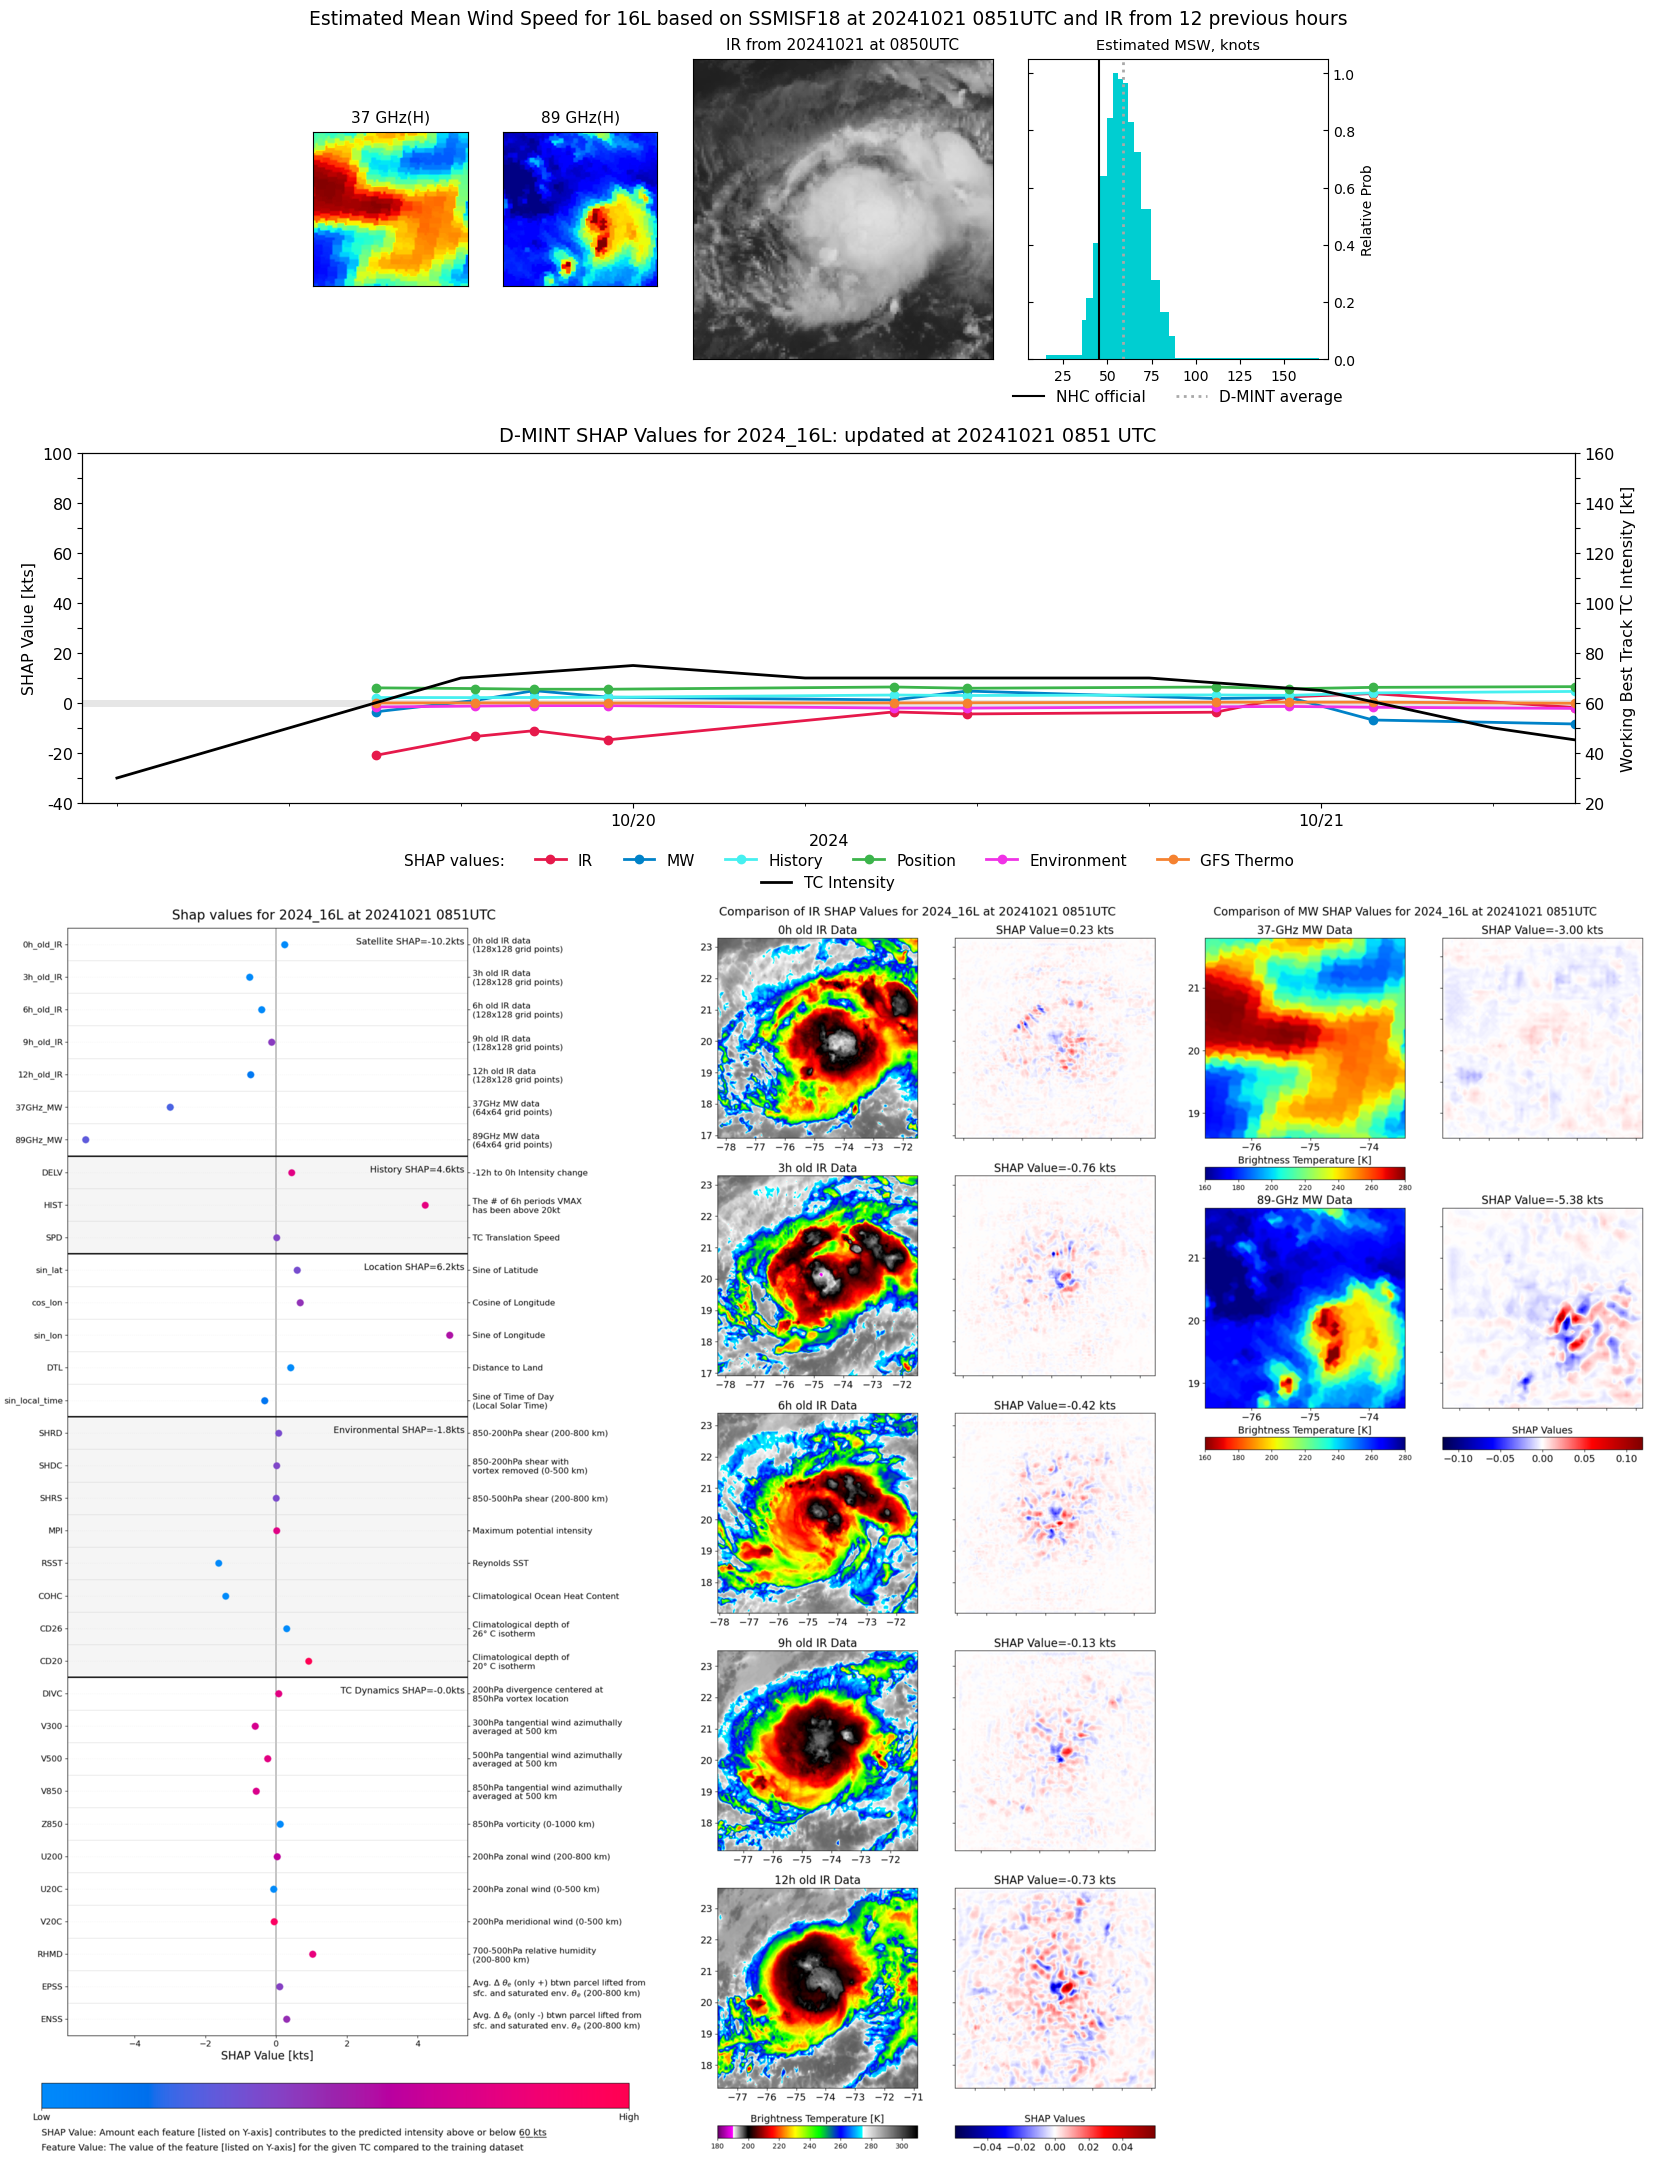 |
| 20241021 | 0148 UTC | GMI | 989 hPa | 66 kts | 58 kts | 74 kts | 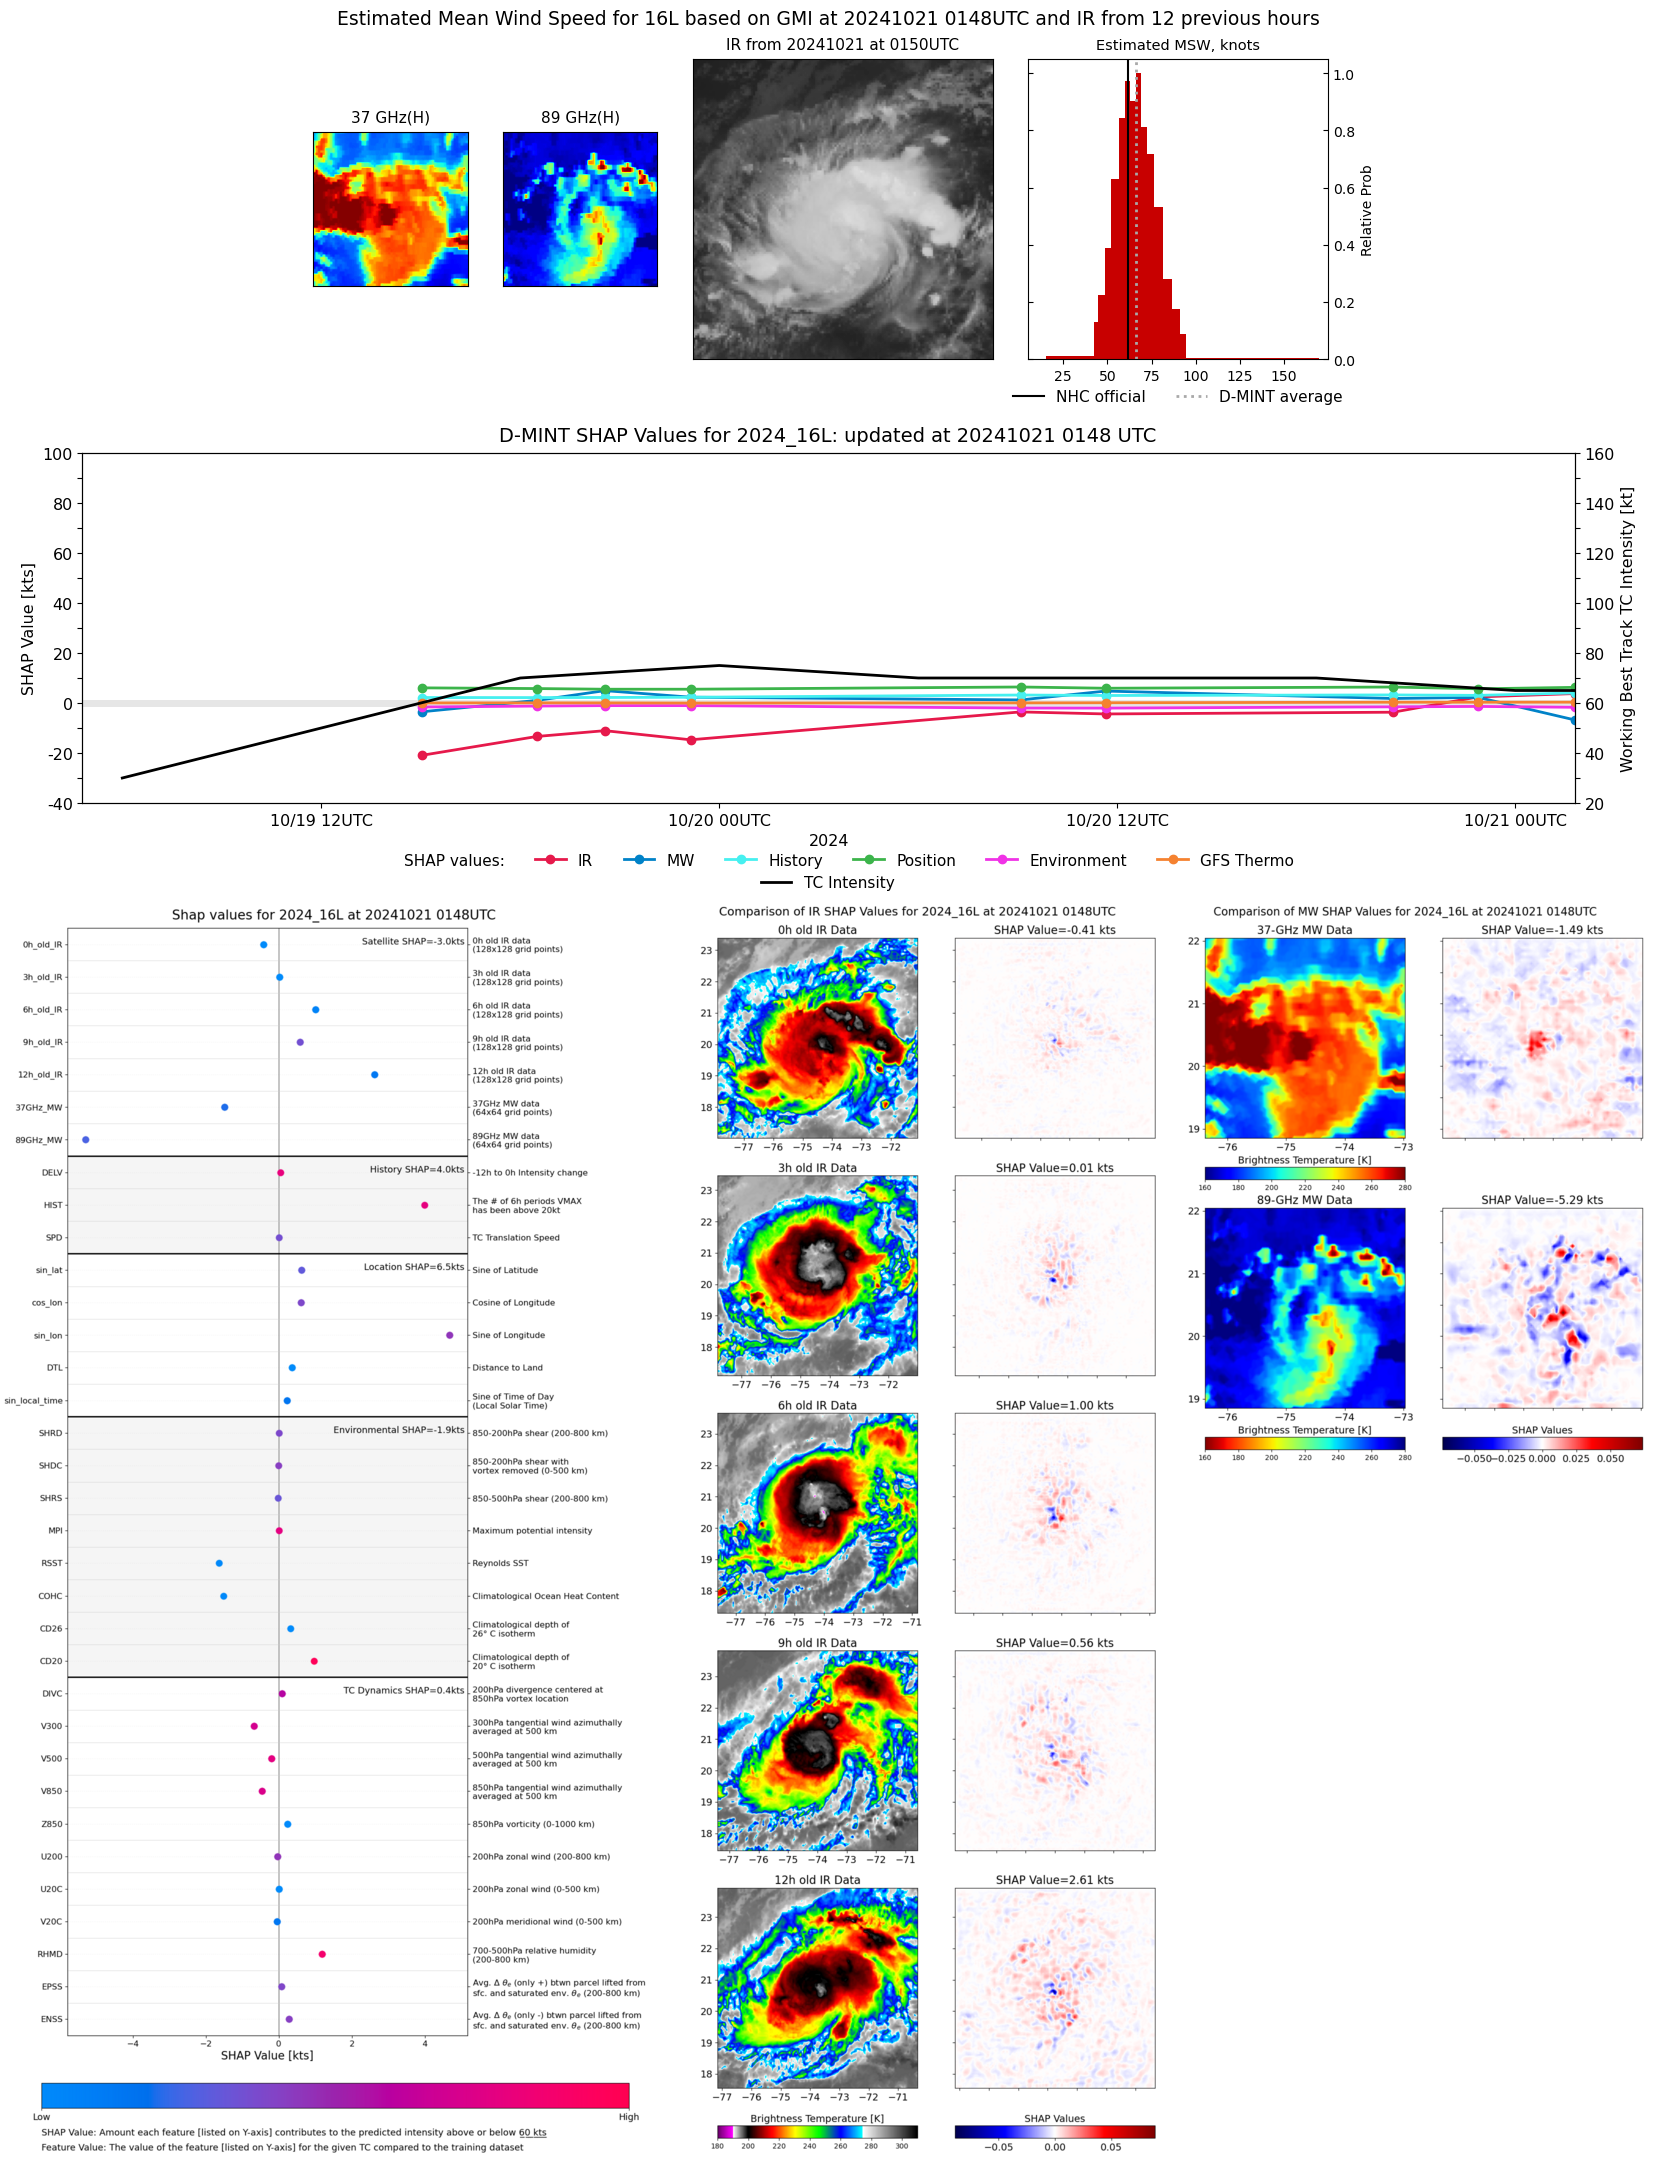 |
| 20241020 | 2253 UTC | SSMISF17 | 985 hPa | 72 kts | 65 kts | 81 kts | 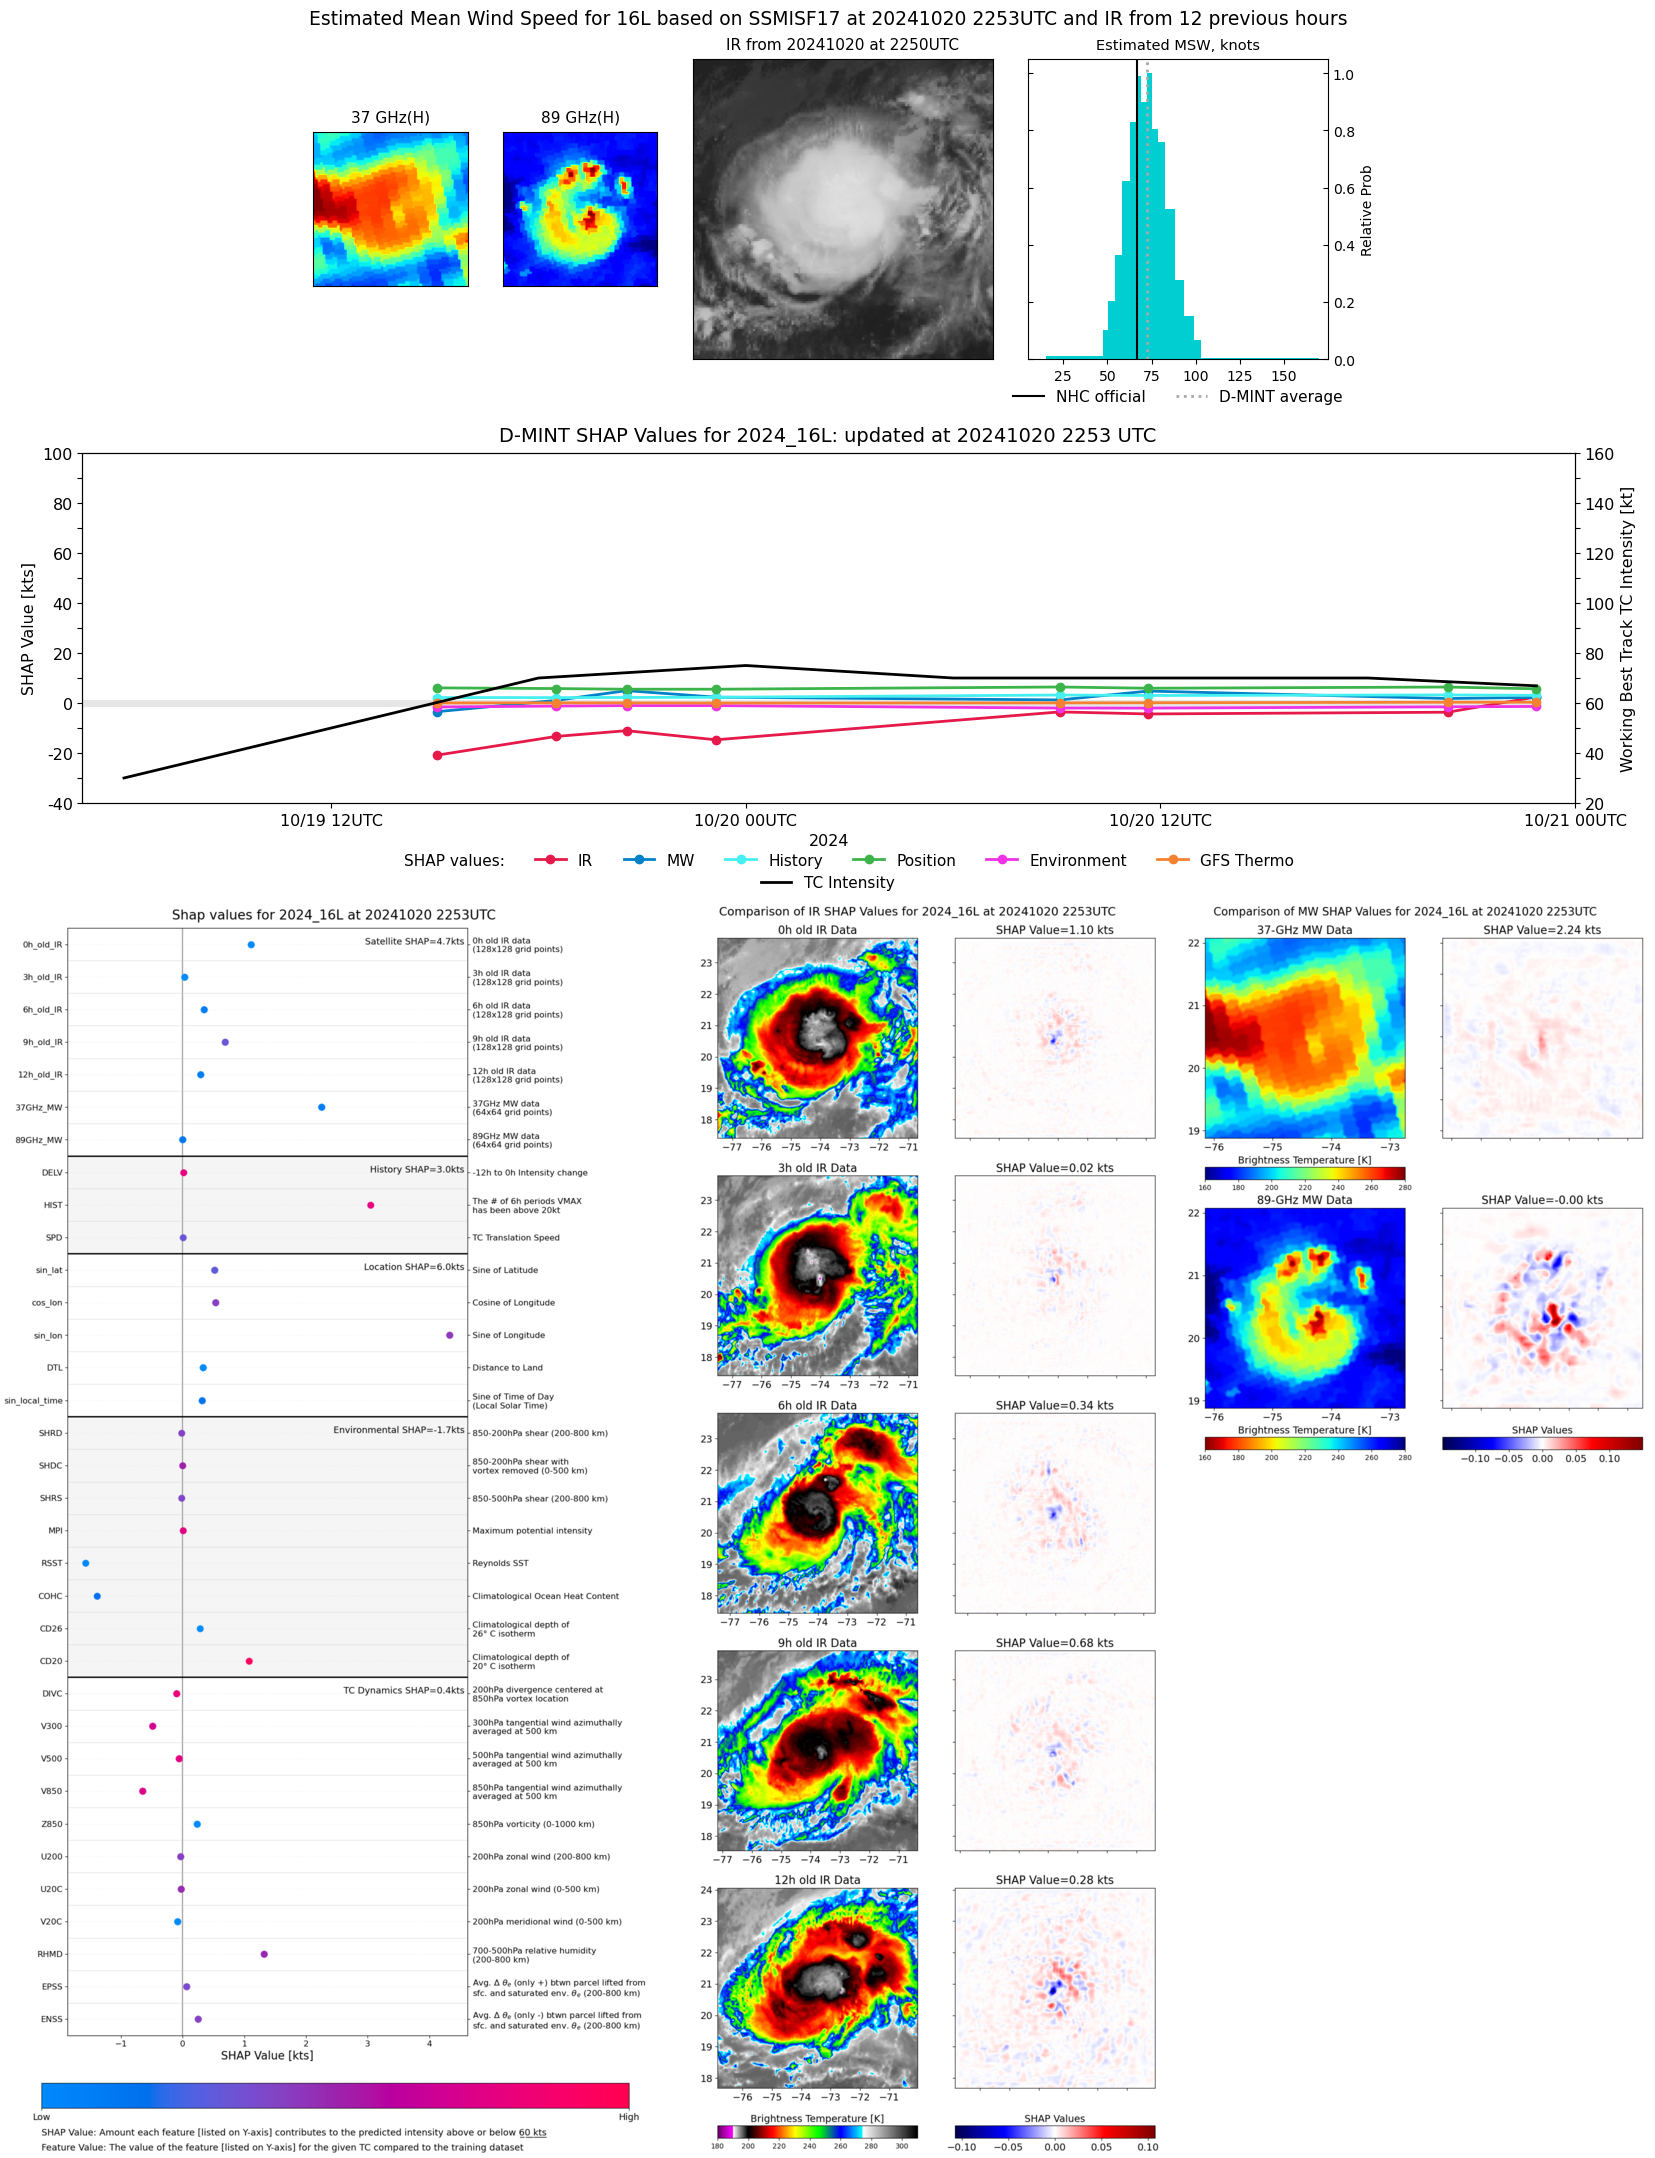 |
| 20241020 | 2240 UTC | SSMISF16 | 986 hPa | 76 kts | 68 kts | 85 kts | 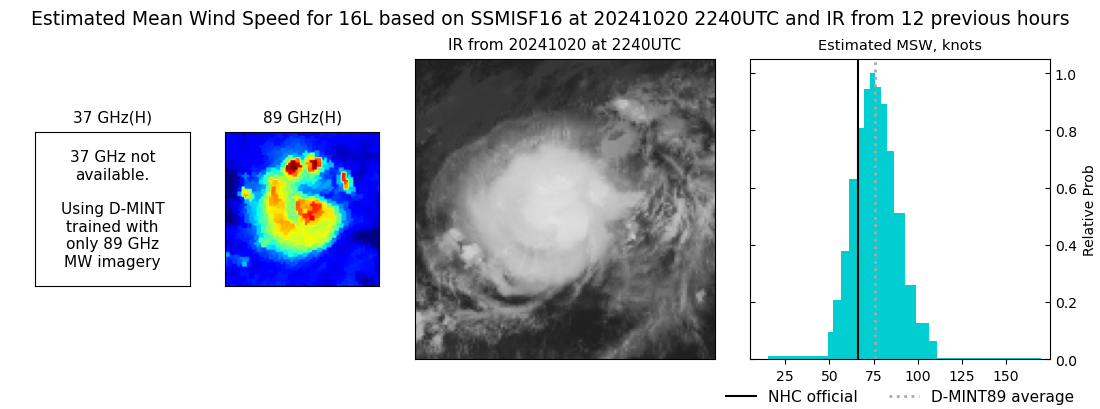 |
| 20241020 | 2019 UTC | SSMISF18 | 987 hPa | 67 kts | 59 kts | 75 kts | 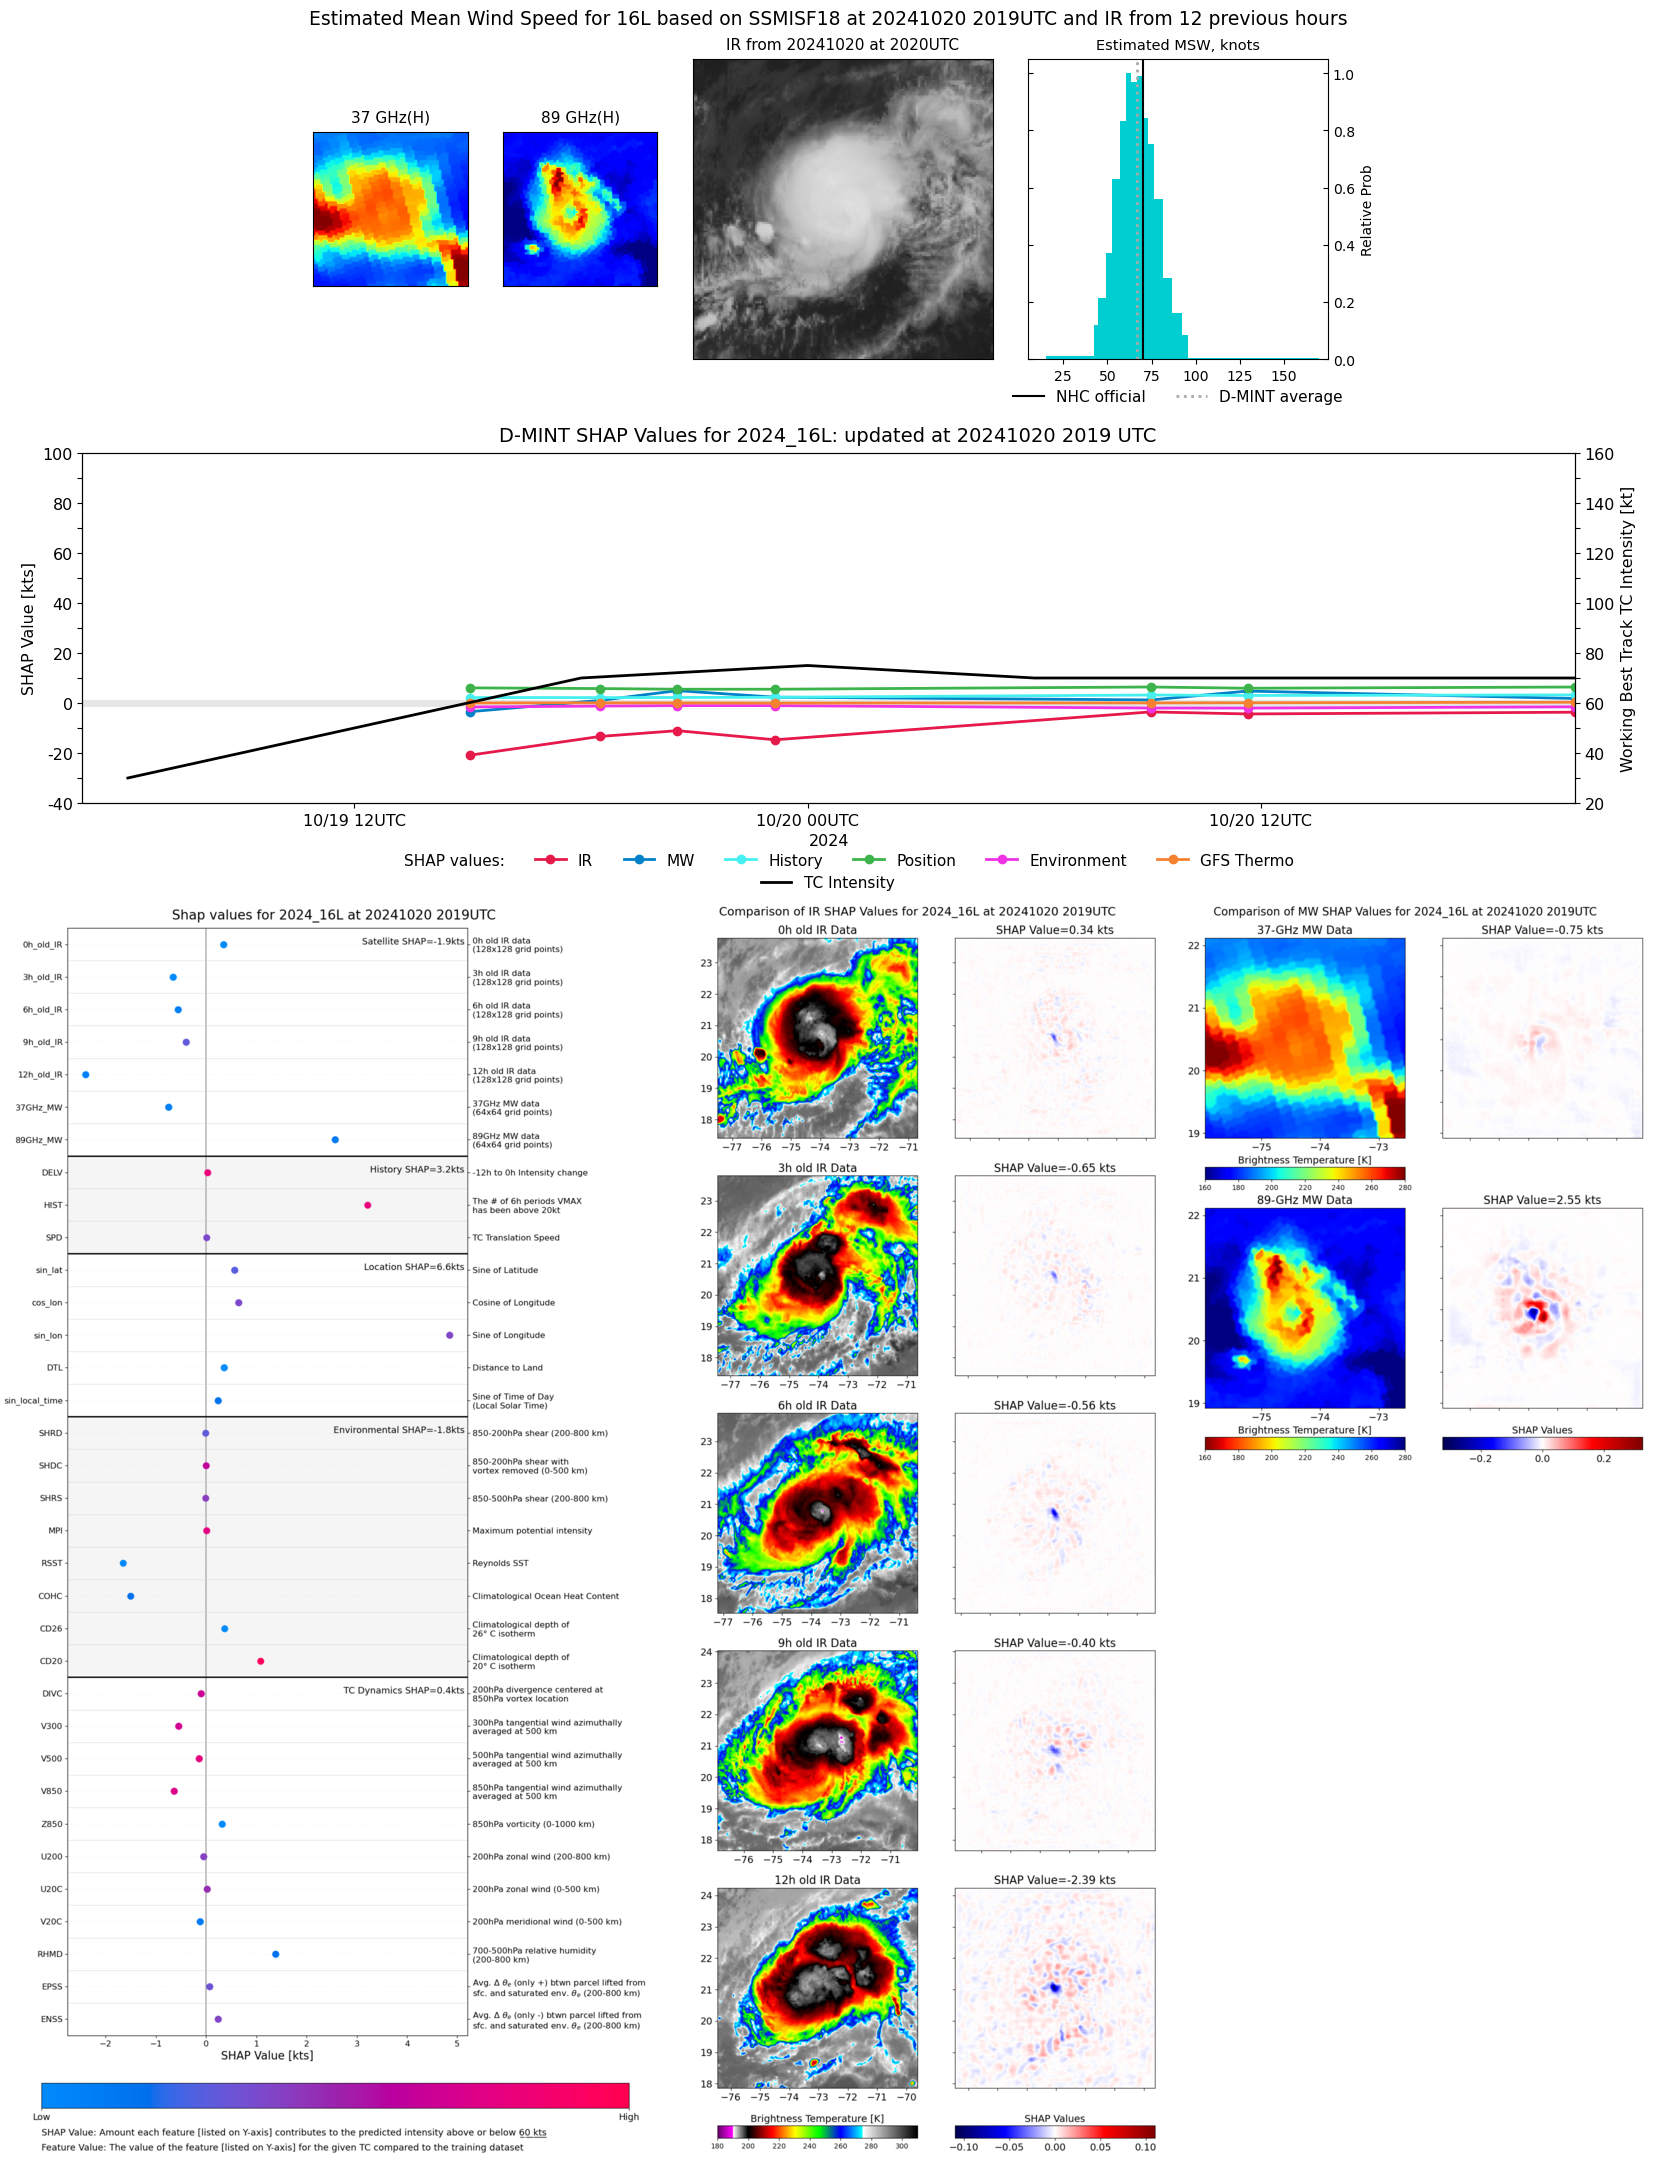 |
| 20241020 | 1139 UTC | SSMISF17 | 989 hPa | 67 kts | 60 kts | 75 kts | 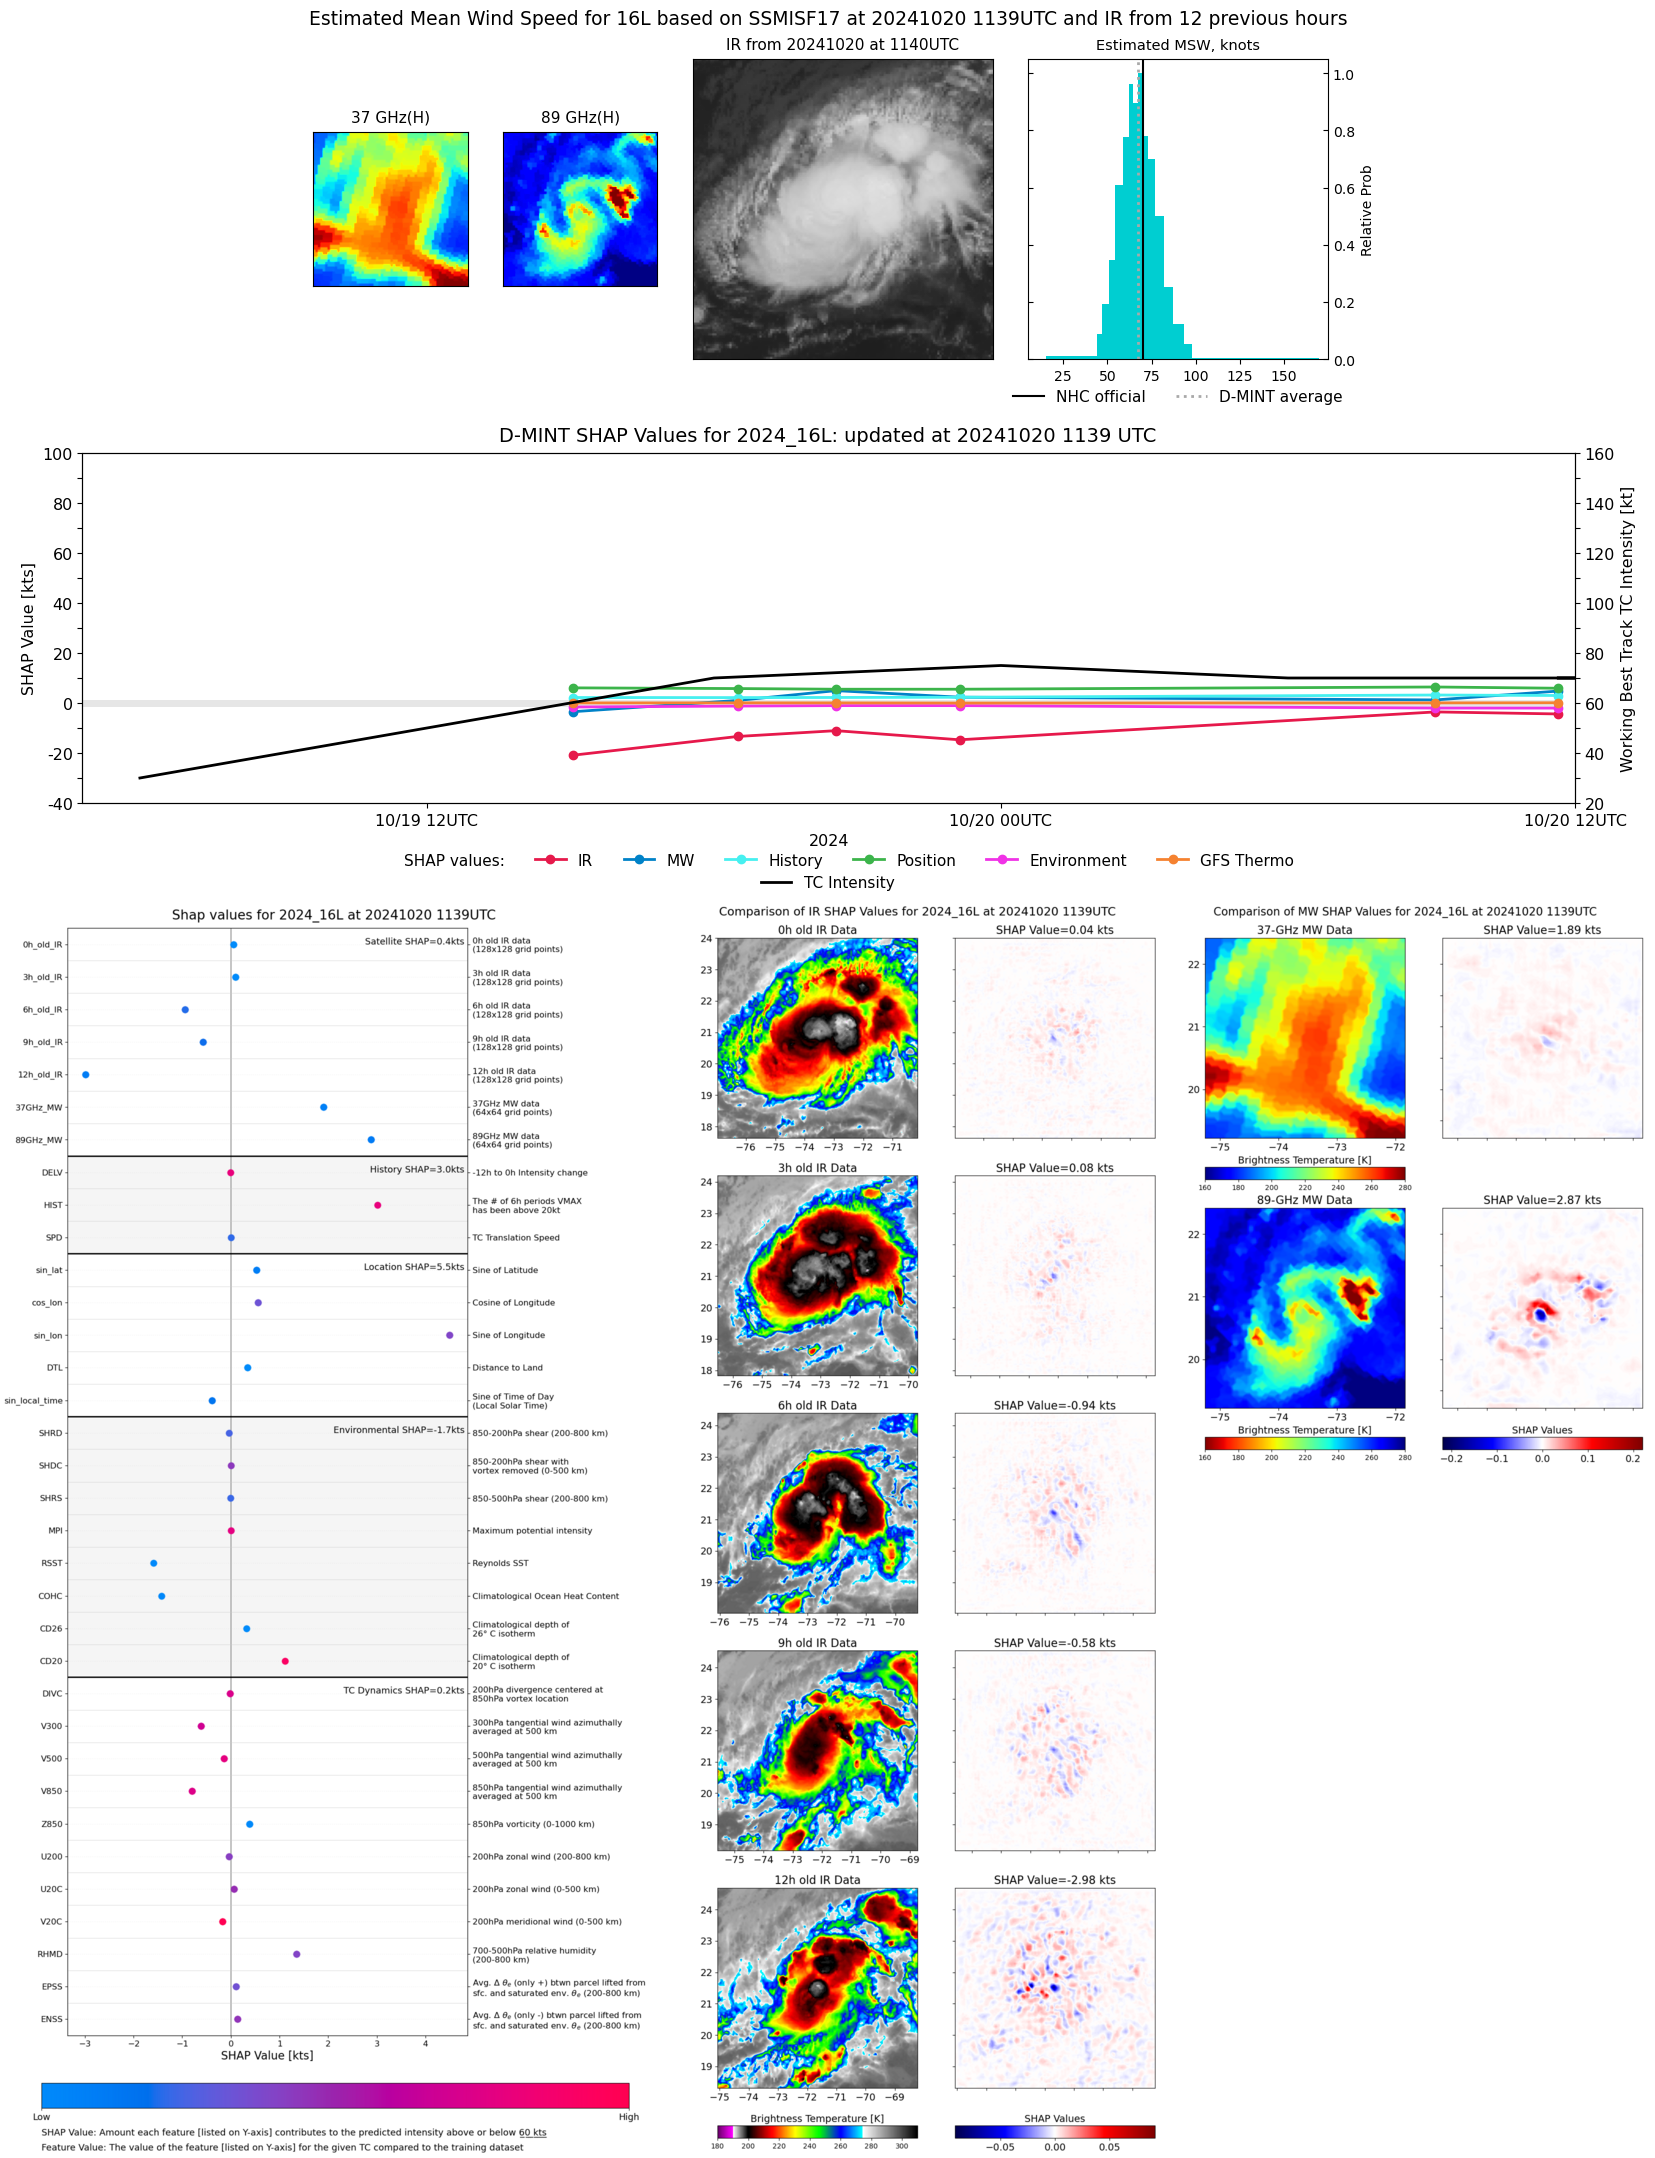 |
| 20241020 | 1125 UTC | SSMISF16 | 995 hPa | 60 kts | 53 kts | 68 kts | 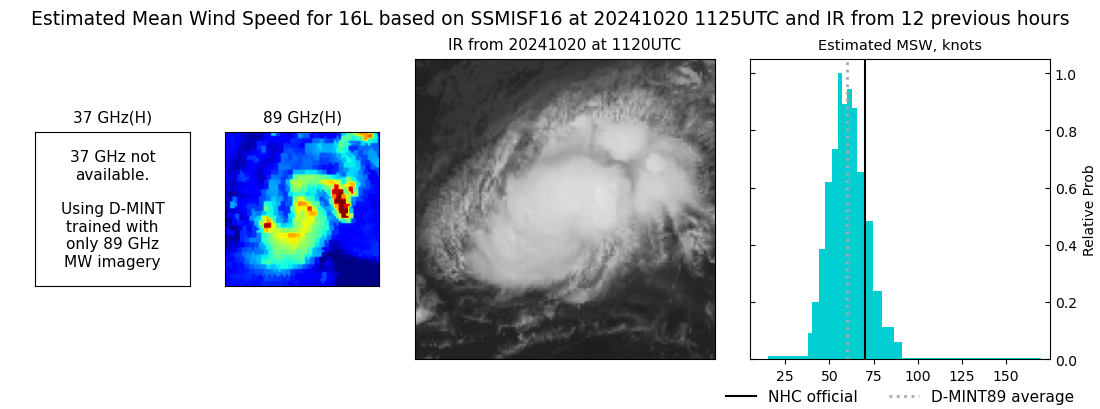 |
| 20241020 | 0905 UTC | SSMISF18 | 993 hPa | 65 kts | 59 kts | 73 kts | 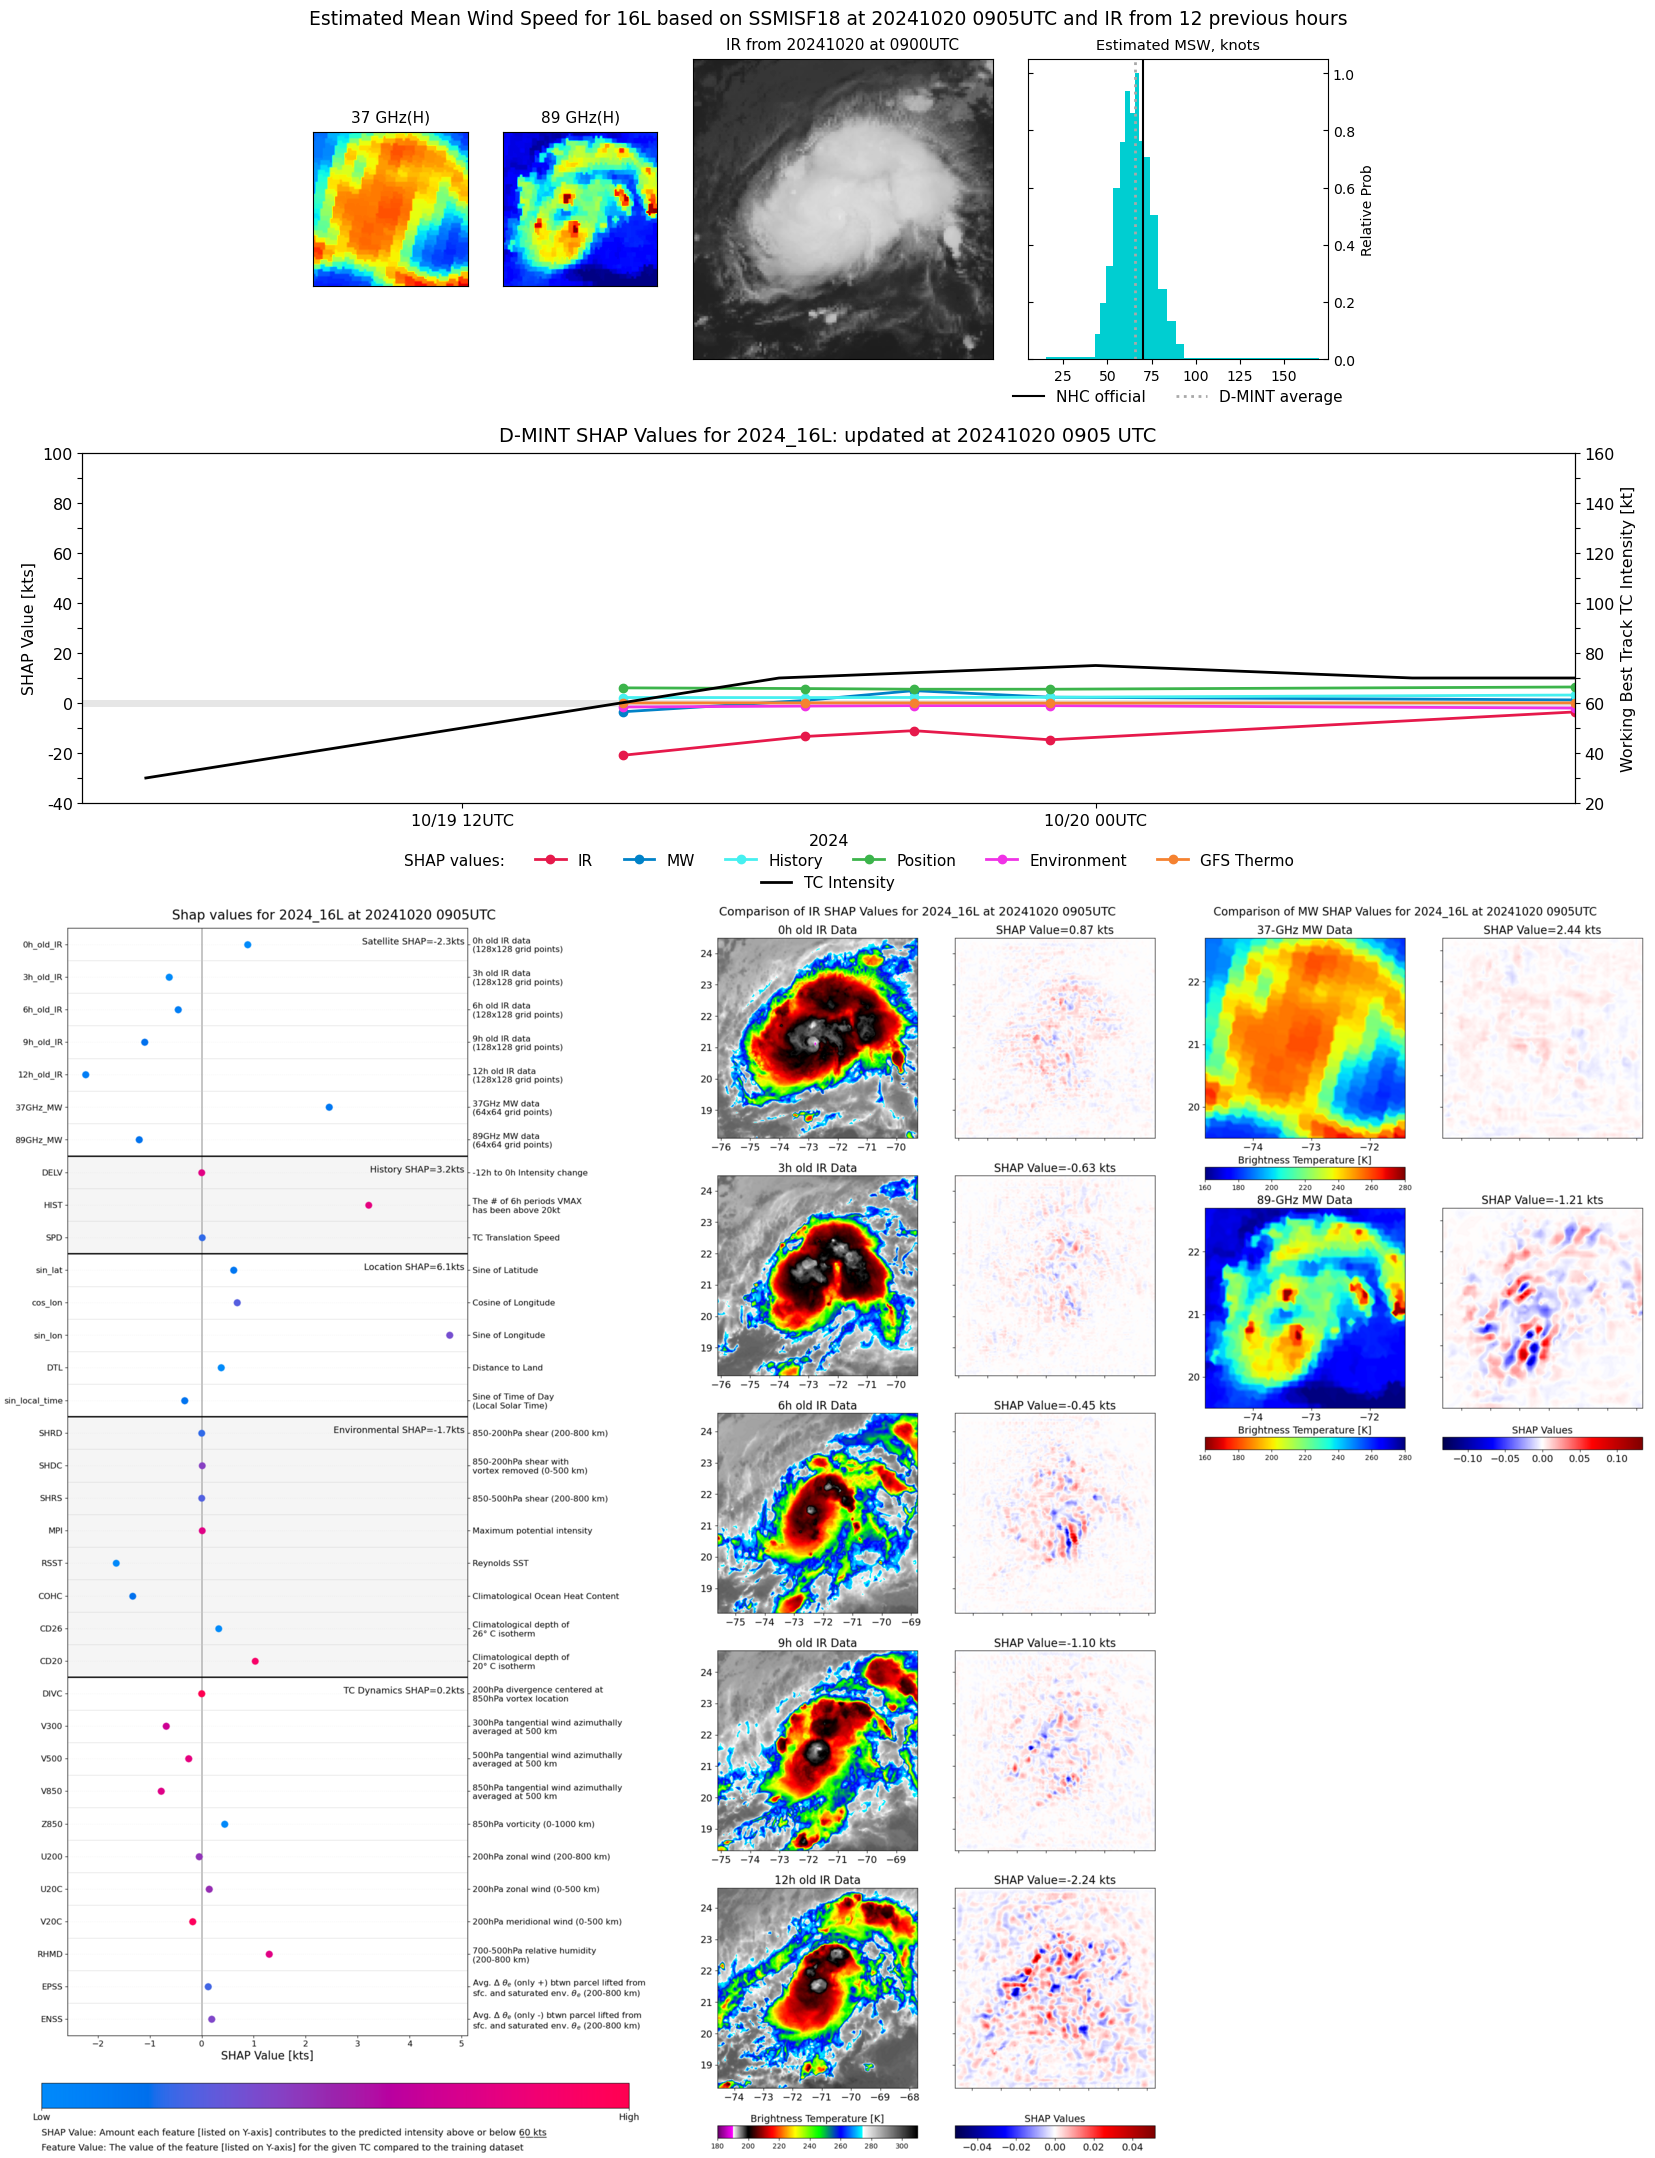 |
| 20241020 | 0639 UTC | AMSR2 | 996 hPa | 63 kts | 57 kts | 69 kts | 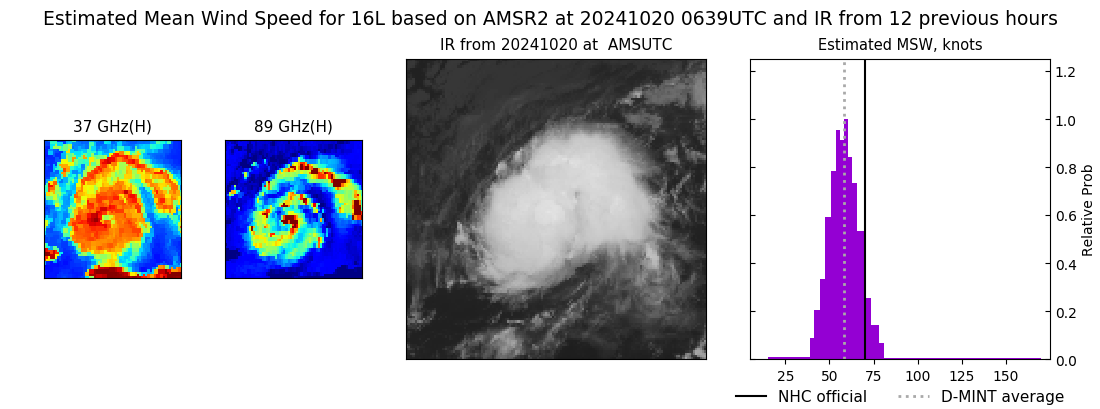 |
| 20241020 | 0629 UTC | ATMS-N20 | 996 hPa | 58 kts | 53 kts | 64 kts | 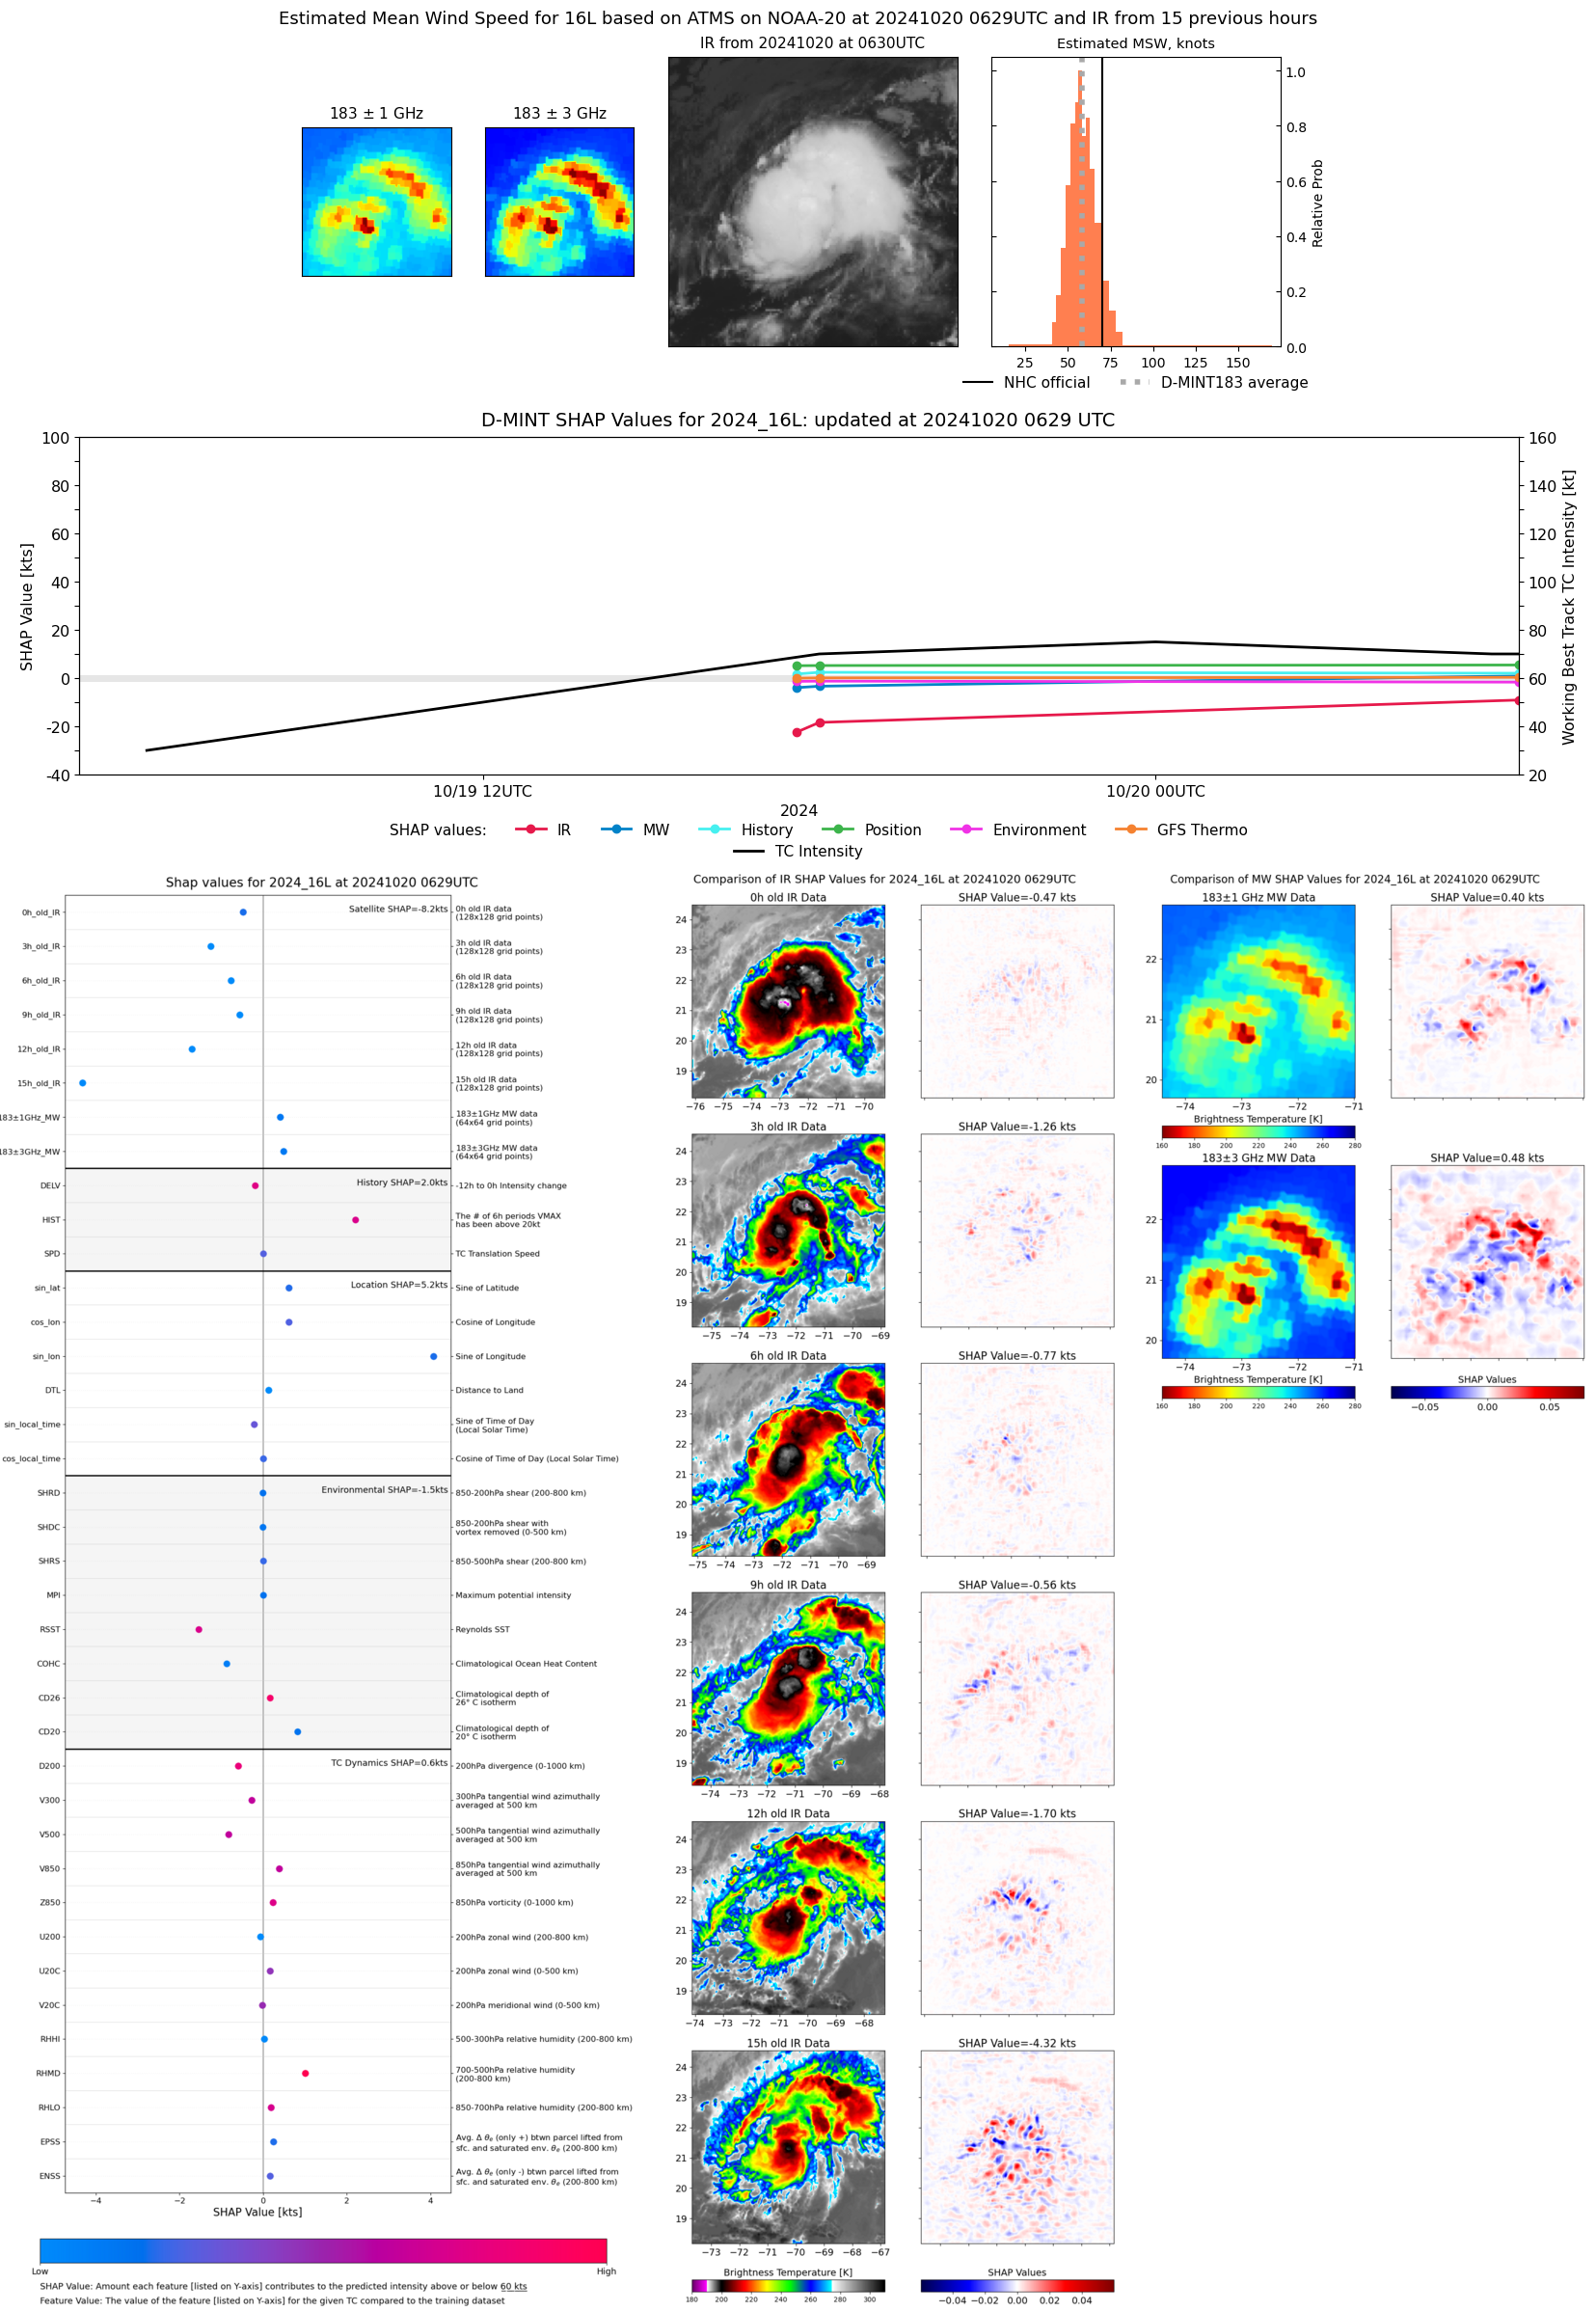 |
| 20241019 | 2308 UTC | SSMISF17 | 996 hPa | 55 kts | 49 kts | 60 kts |  |
| 20241019 | 2254 UTC | SSMISF16 | 1001 hPa | 45 kts | 40 kts | 50 kts | 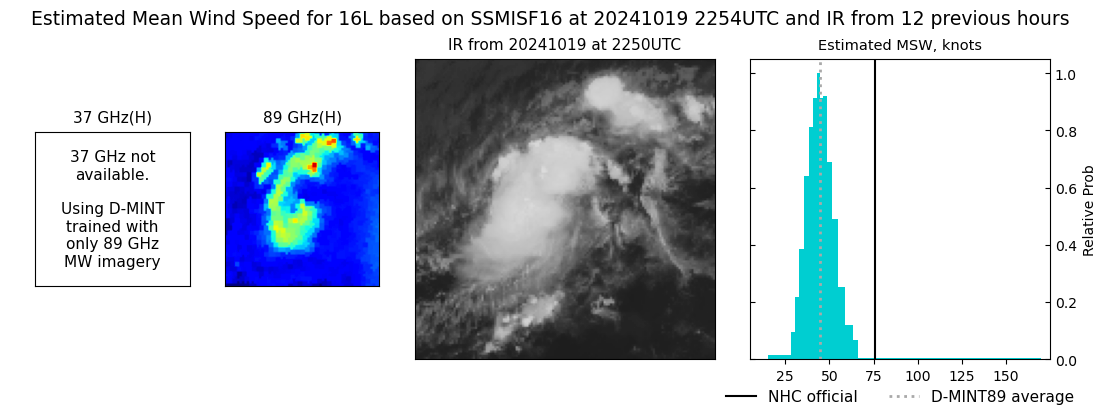 |
| 20241019 | 2033 UTC | SSMISF18 | 997 hPa | 61 kts | 55 kts | 67 kts | 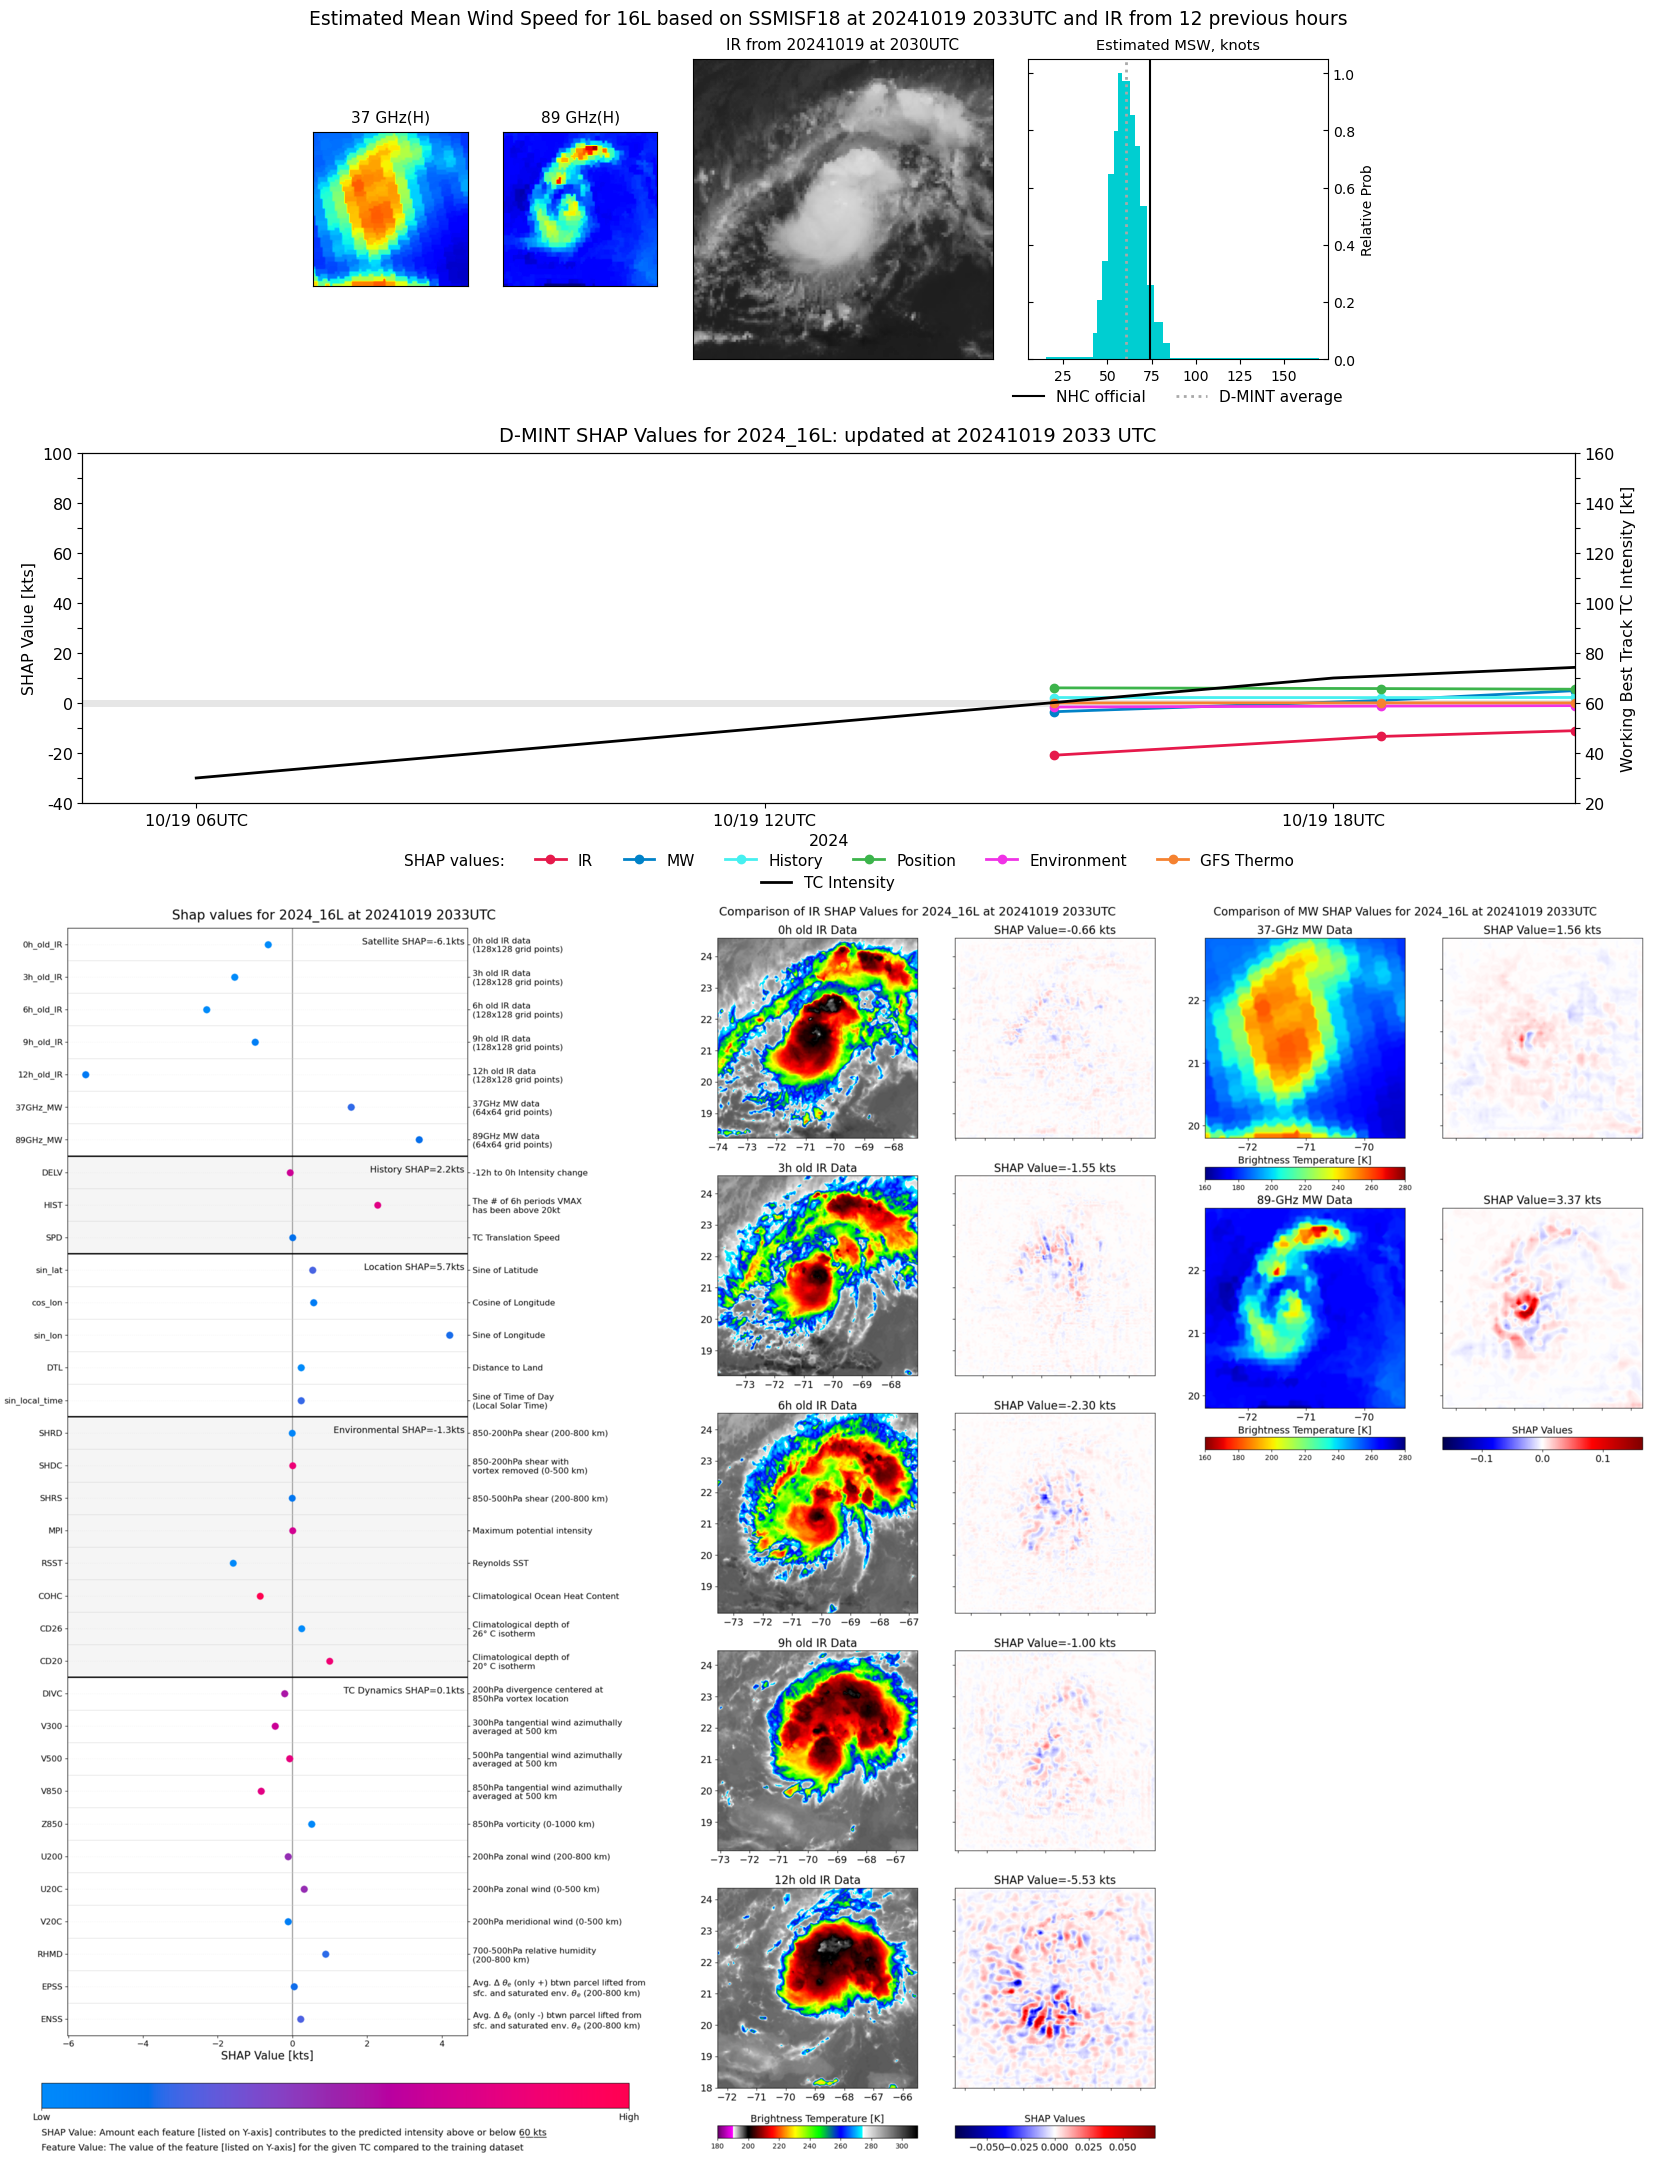 |
| 20241019 | 1830 UTC | AMSR2 | 998 hPa | 55 kts | 49 kts | 60 kts | 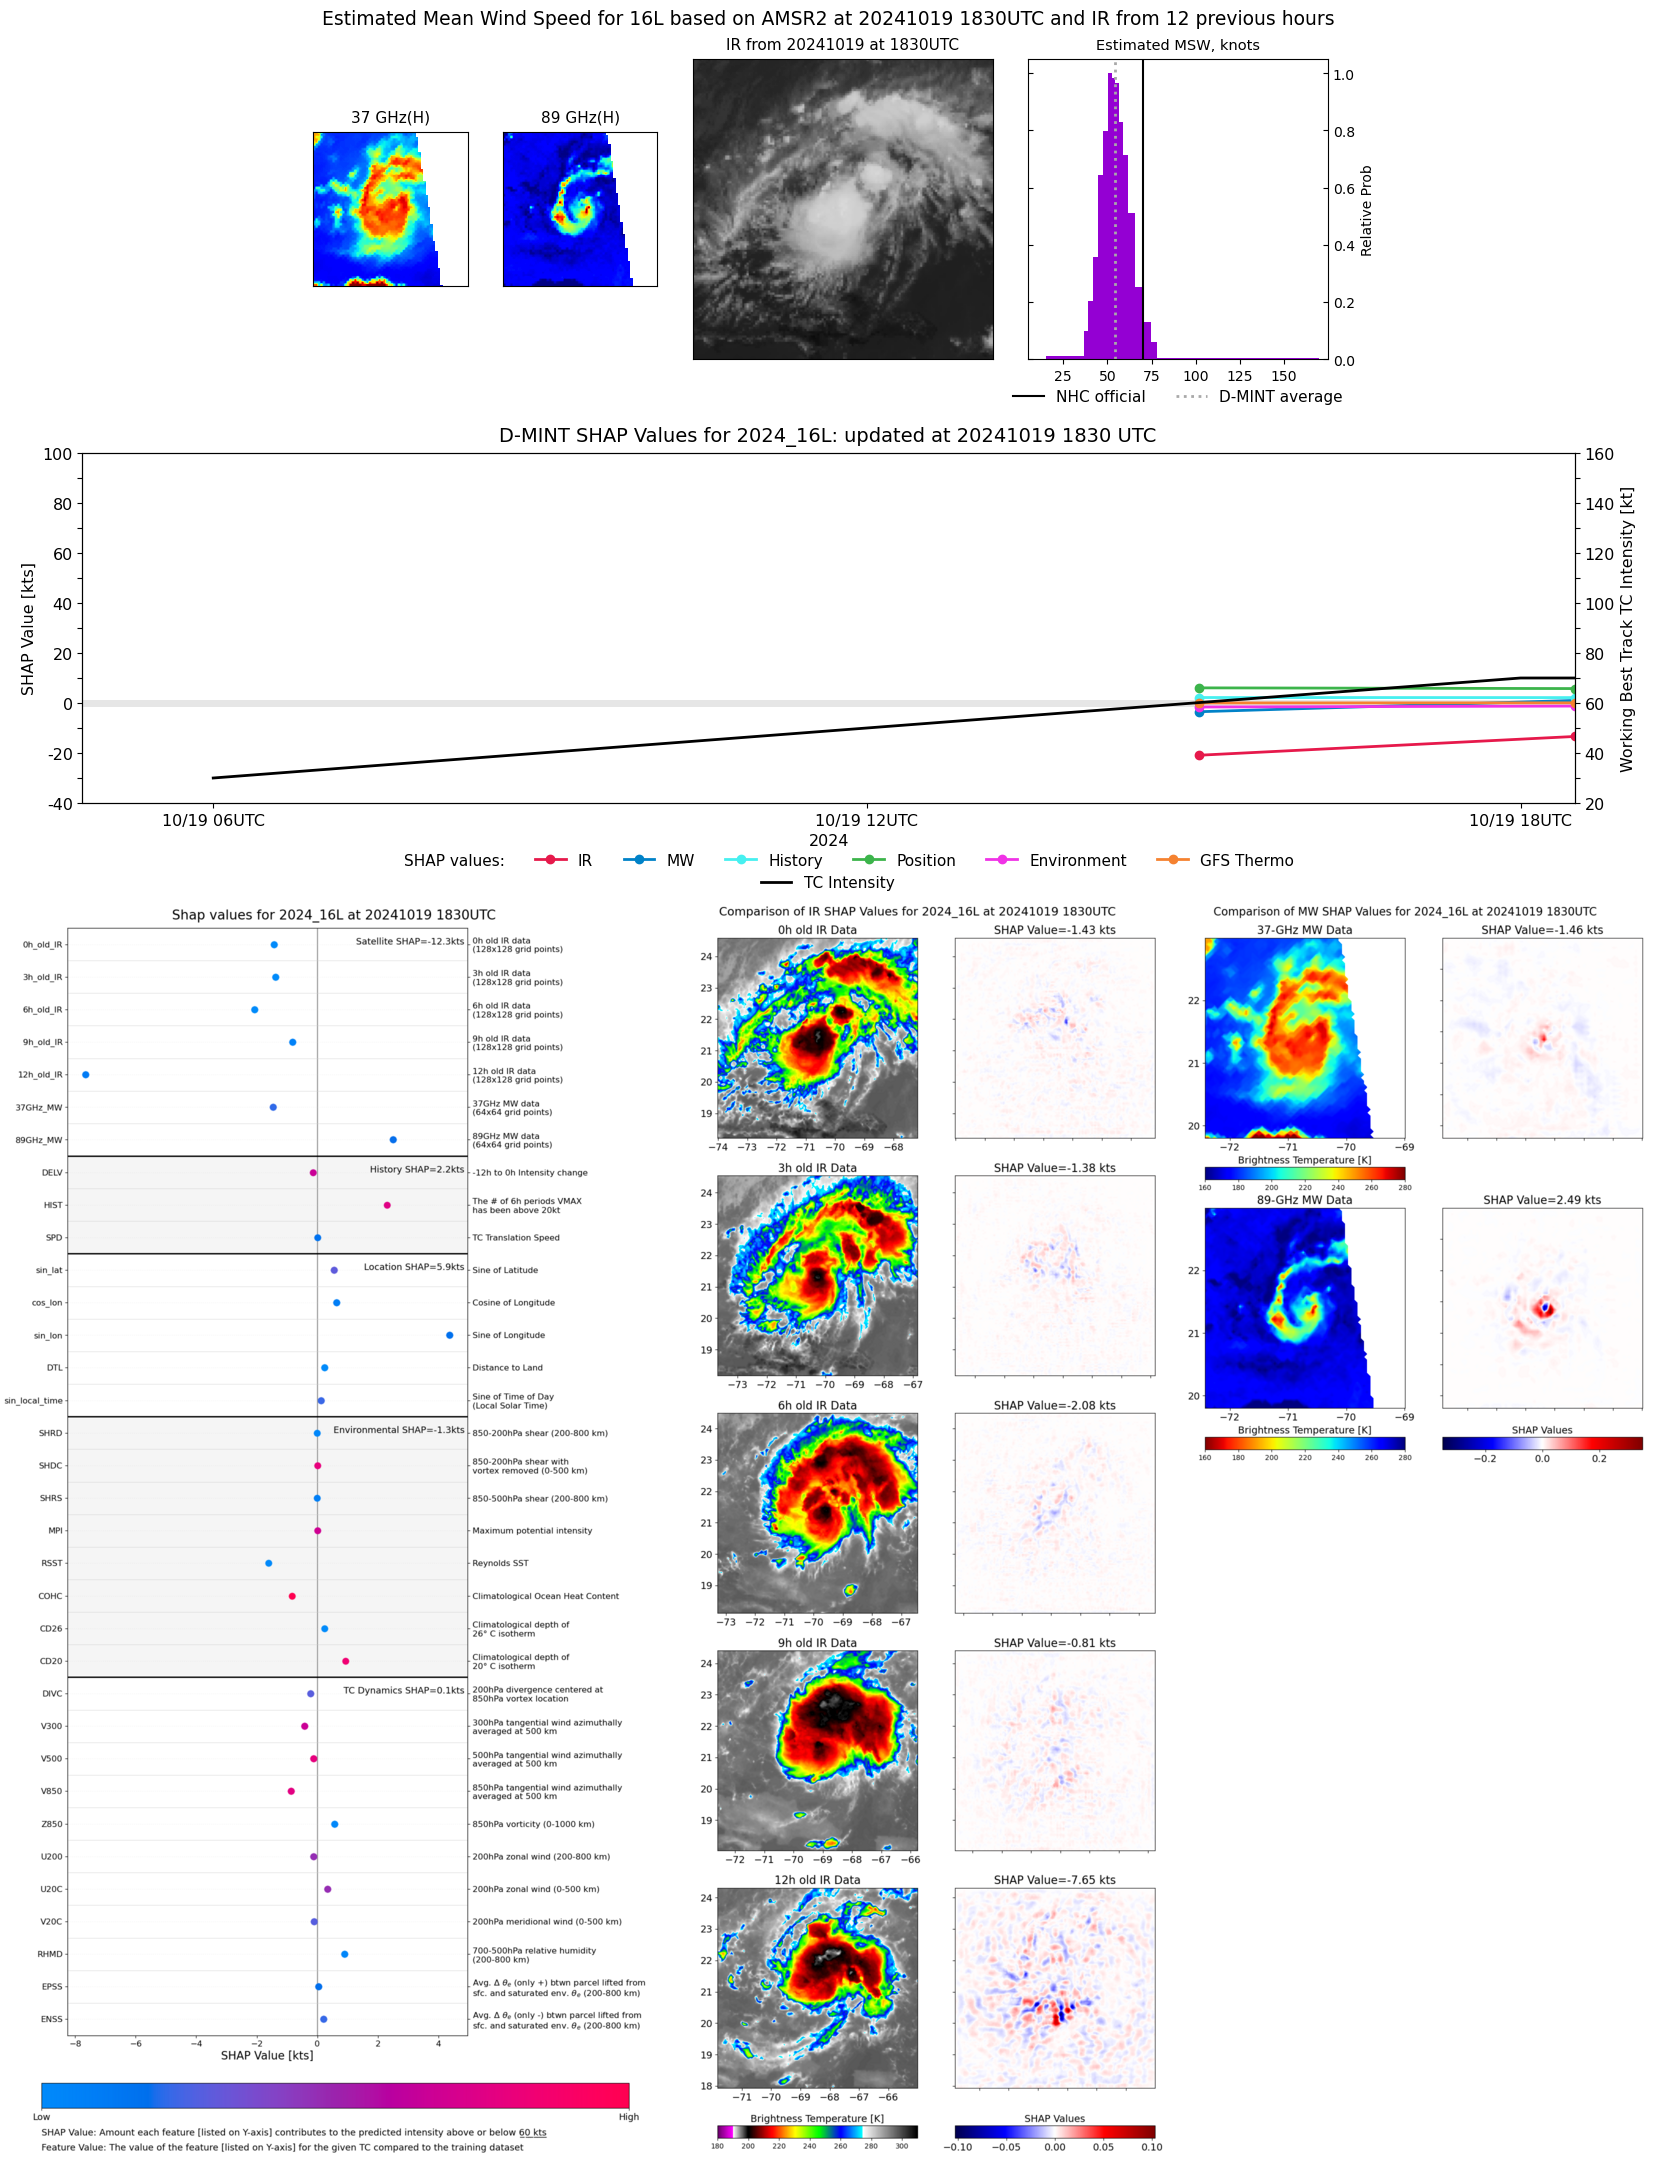 |
| 20241019 | 1800 UTC | ATMS-N20 | 1002 hPa | 45 kts | 41 kts | 49 kts | 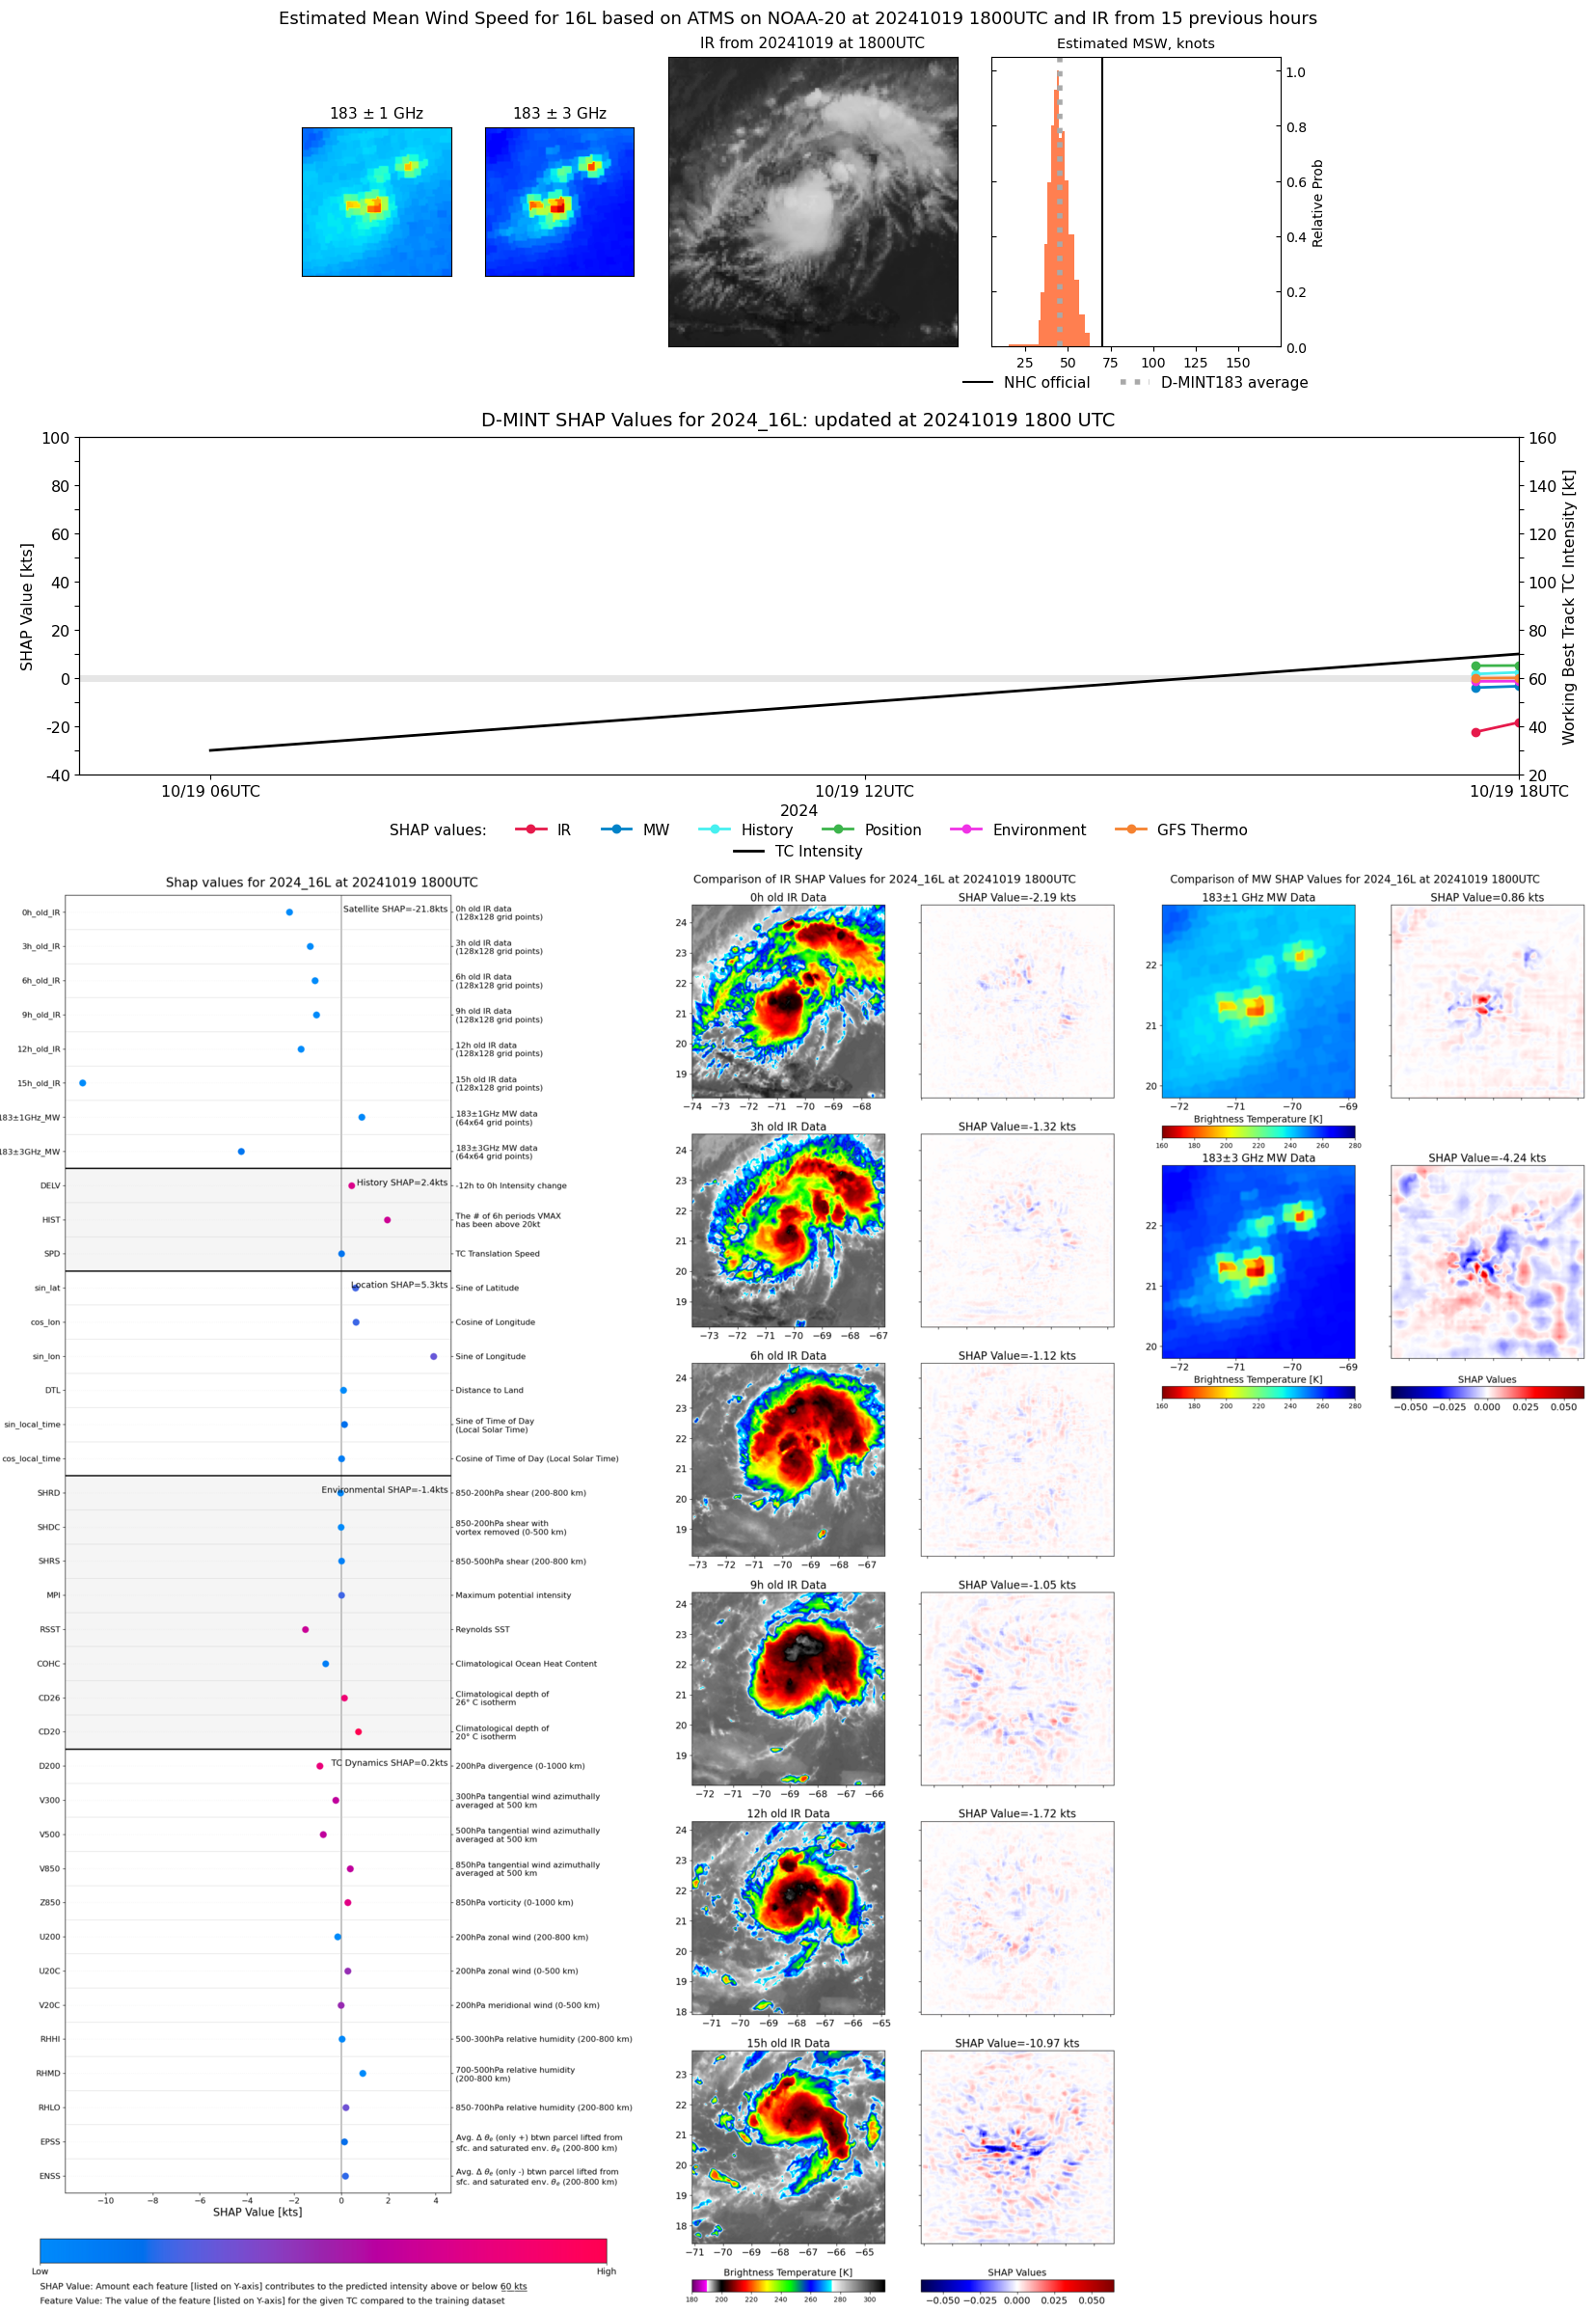 |
| 20241019 | 1736 UTC | ATMS-NPP | 1006 hPa | 39 kts | 36 kts | 43 kts |  |
| 20241019 | 1503 UTC | GMI | 1003 hPa | 42 kts | 38 kts | 47 kts | 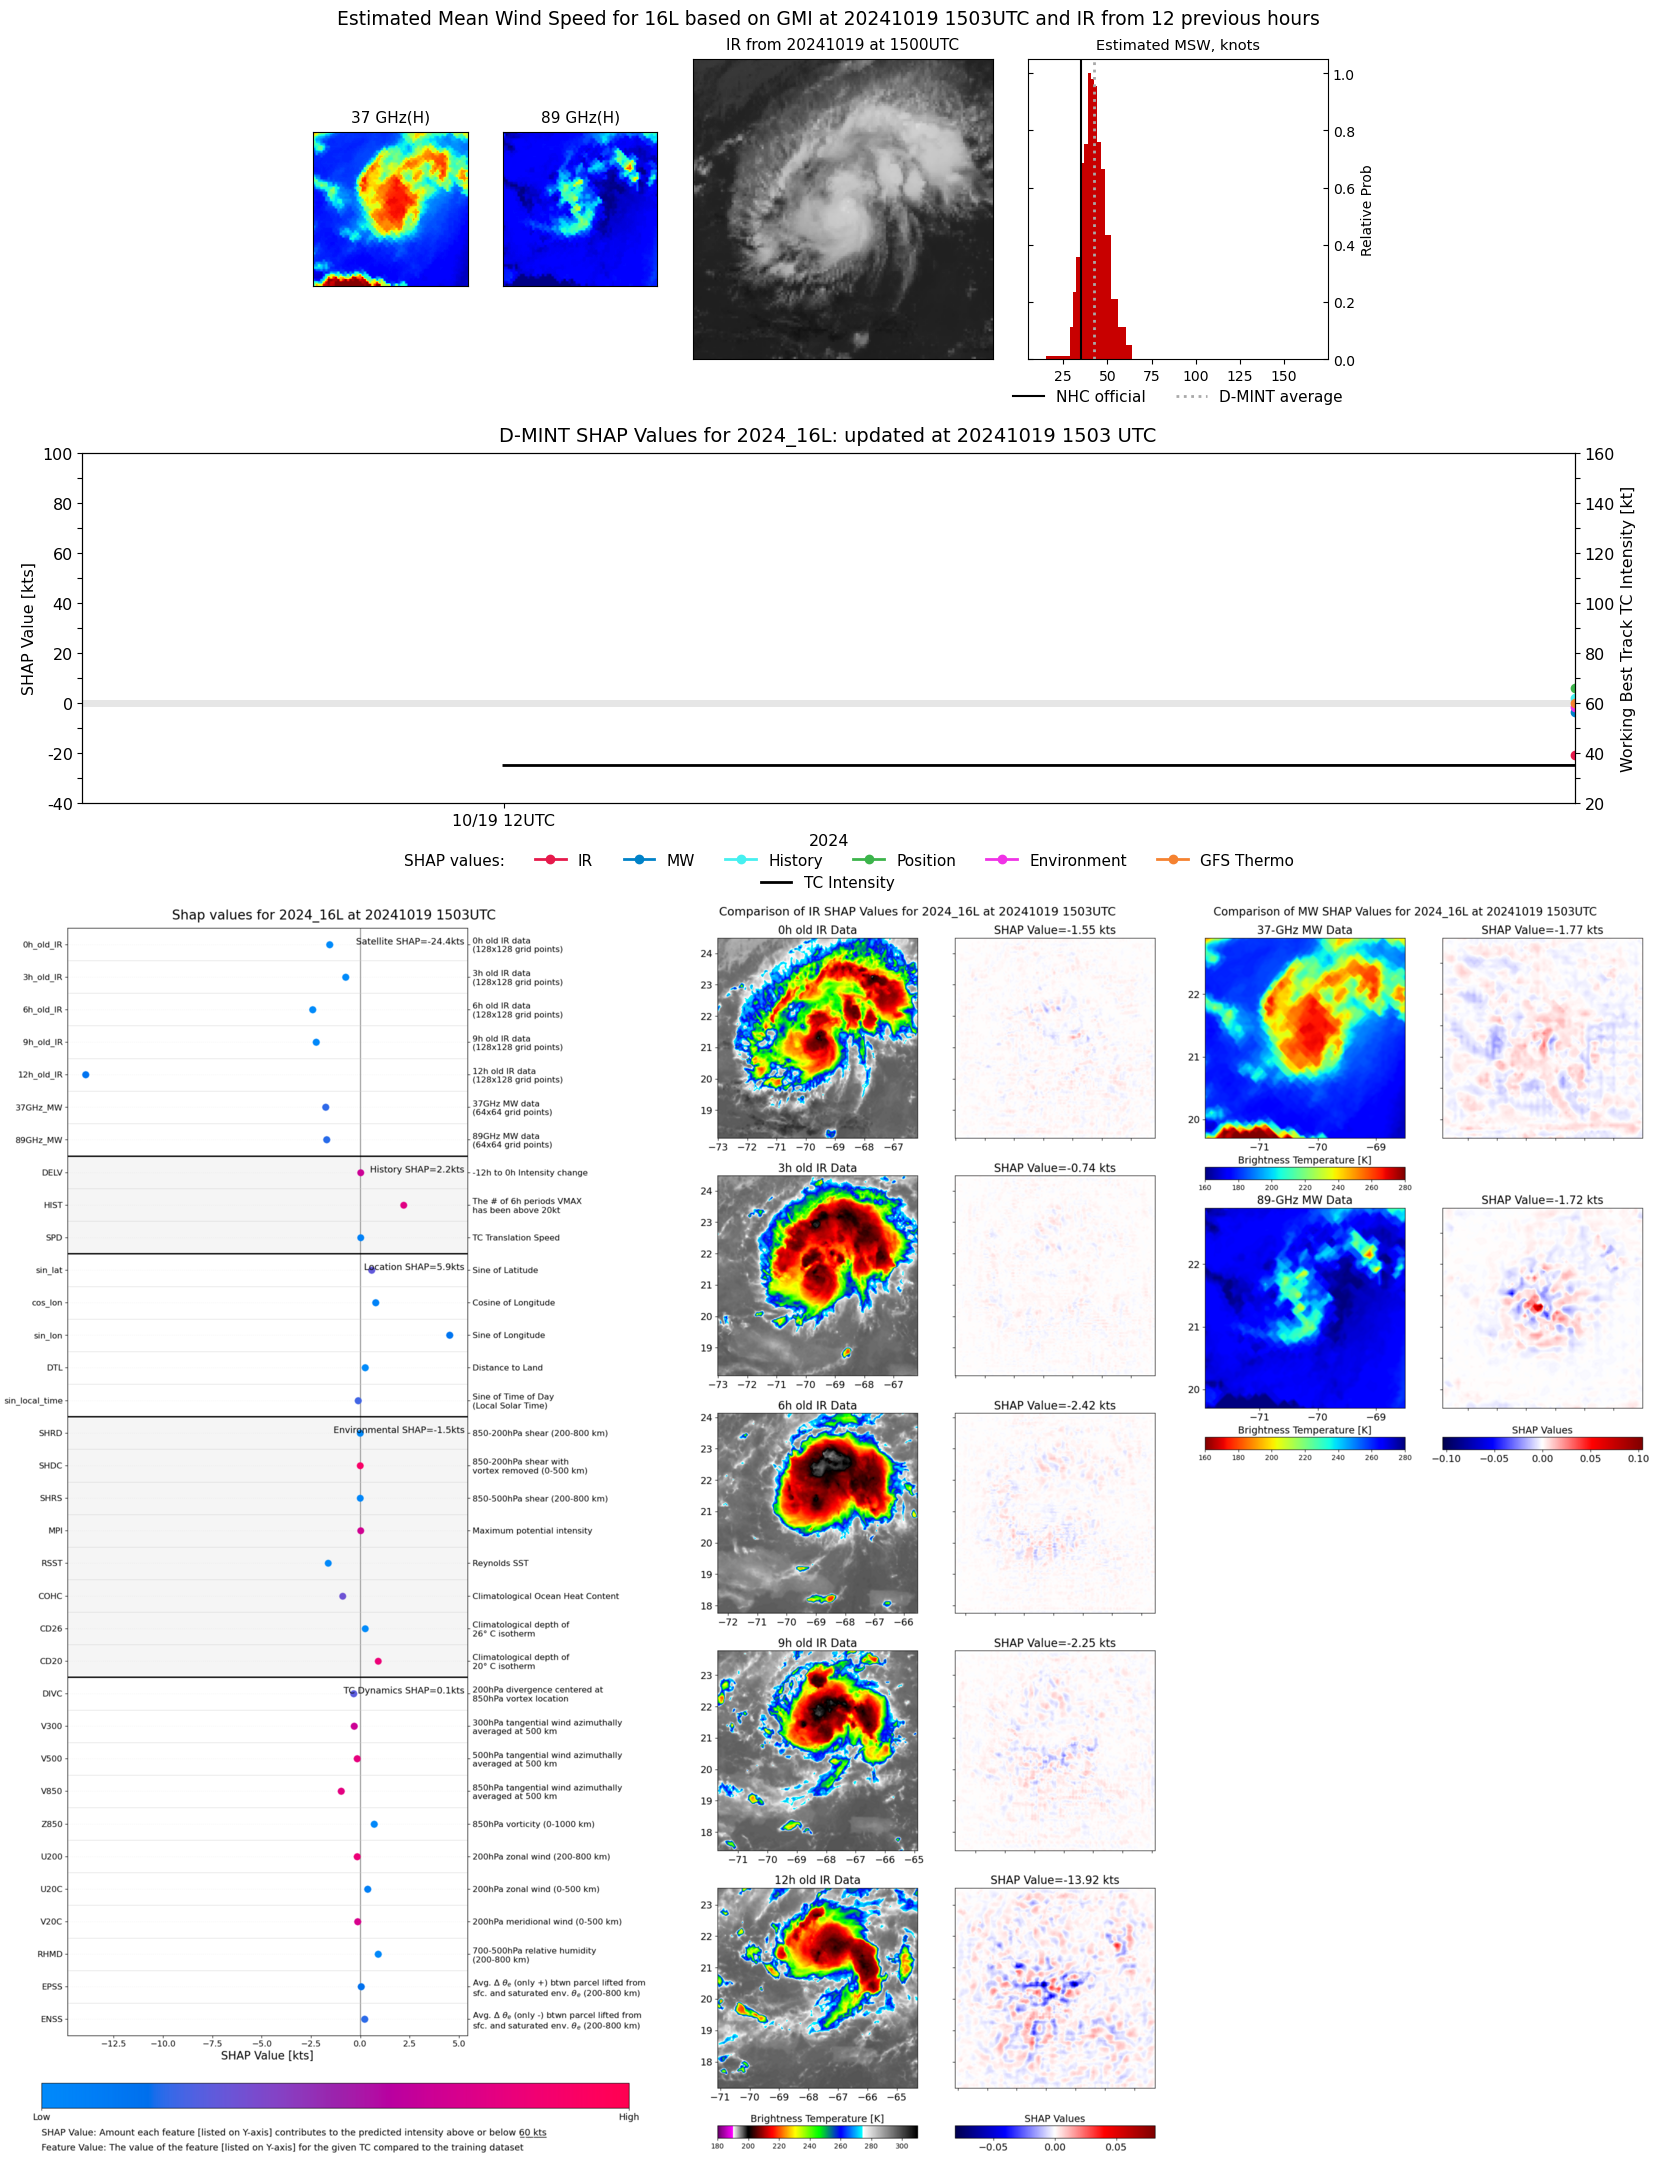 |
| 20241019 | 0600 UTC | ATMS-N21 | 1009 hPa | 37 kts | 34 kts | 41 kts |  |
| 20241019 | 0556 UTC | AMSR2 | NaN hPa | 29 kts | 26 kts | 32 kts |  |
| 20241019 | 0520 UTC | TROPICS06 | 1008 hPa | 38 kts | 34 kts | 42 kts | 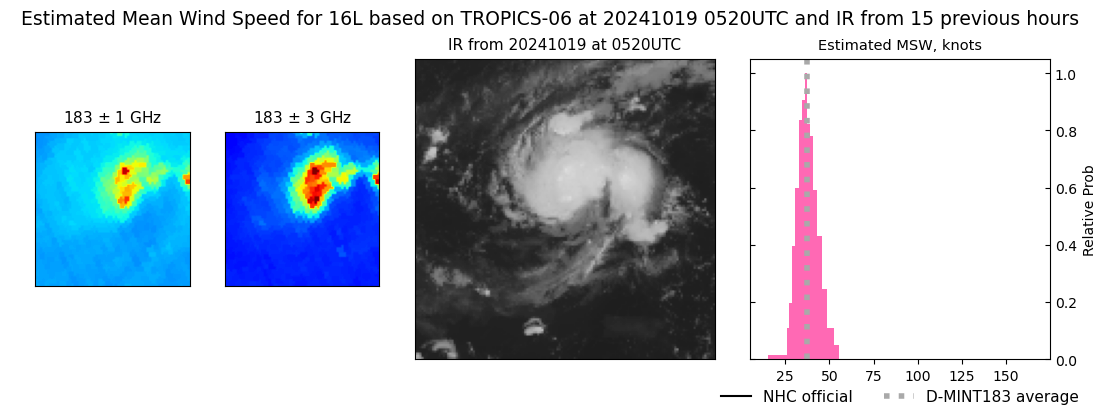 |
| 20241019 | 0142 UTC | GMI | NaN hPa | 26 kts | 24 kts | 29 kts |  |
| 20241018 | 1745 UTC | AMSR2 | NaN hPa | 25 kts | 22 kts | 28 kts |  |
| 20241018 | 1026 UTC | SSMISF17 | NaN hPa | 28 kts | 25 kts | 32 kts |  |
| 20241018 | 1012 UTC | SSMISF16 | NaN hPa | 25 kts | 22 kts | 29 kts |  |
| 20241018 | 0752 UTC | SSMISF18 | NaN hPa | 26 kts | 23 kts | 29 kts |  |
| 20241017 | 2152 UTC | SSMISF17 | NaN hPa | 39 kts | 35 kts | 43 kts | 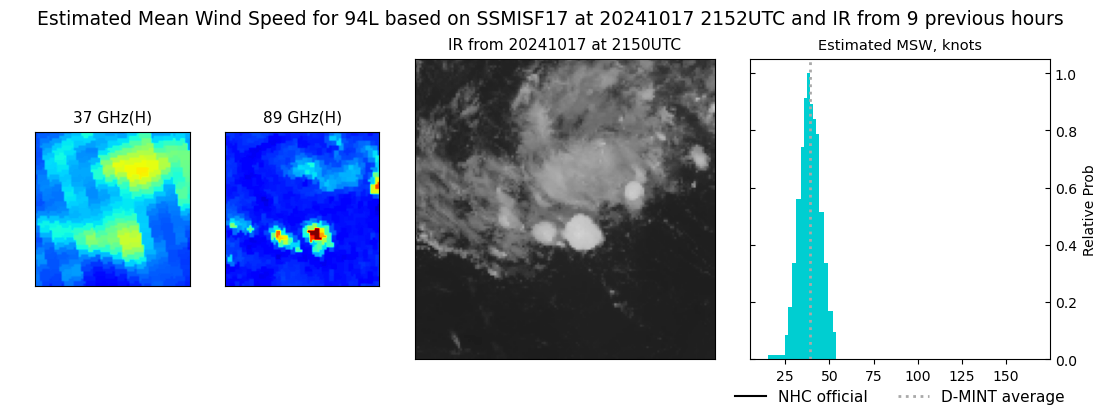 |
| 20241017 | 2138 UTC | SSMISF16 | NaN hPa | 27 kts | 24 kts | 30 kts |  |
| 20241017 | 1918 UTC | SSMISF18 | NaN hPa | 30 kts | 27 kts | 34 kts |  |
| 20241017 | 1701 UTC | AMSR2 | NaN hPa | 24 kts | 22 kts | 26 kts |  |
| 20241017 | 1456 UTC | GMI | NaN hPa | 26 kts | 24 kts | 29 kts |  |
| 20241017 | 1026 UTC | SSMISF16 | NaN hPa | 24 kts | 21 kts | 27 kts |  |
| 20241017 | 0806 UTC | SSMISF18 | NaN hPa | 28 kts | 25 kts | 31 kts |  |
| 20241017 | 0134 UTC | GMI | NaN hPa | 26 kts | 24 kts | 29 kts |  |
| 20241016 | 2152 UTC | SSMISF16 | NaN hPa | 29 kts | 25 kts | 33 kts |  |
| 20241016 | 1931 UTC | SSMISF18 | NaN hPa | 25 kts | 22 kts | 28 kts |  |
| 20241016 | 1618 UTC | AMSR2 | NaN hPa | 24 kts | 22 kts | 27 kts | 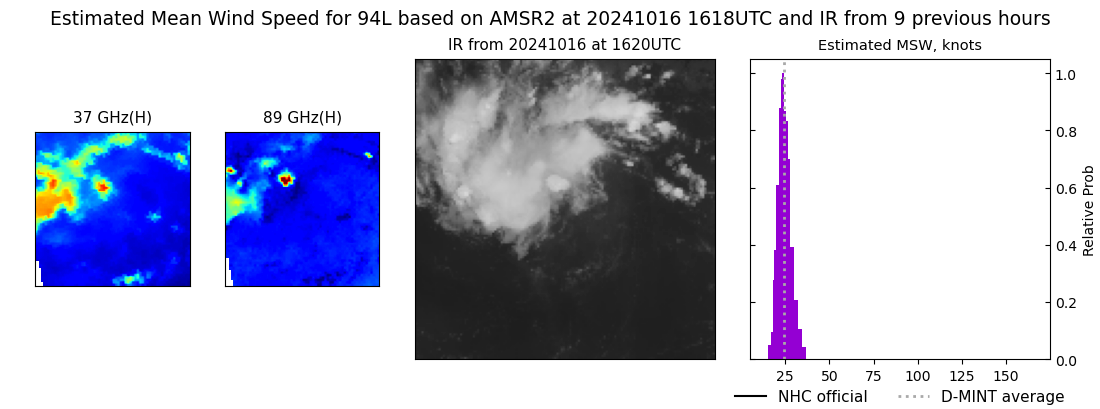 |
| 20241016 | 0913 UTC | SSMISF17 | NaN hPa | 26 kts | 23 kts | 29 kts |  |
| 20241015 | 2039 UTC | SSMISF17 | NaN hPa | 33 kts | 29 kts | 37 kts | 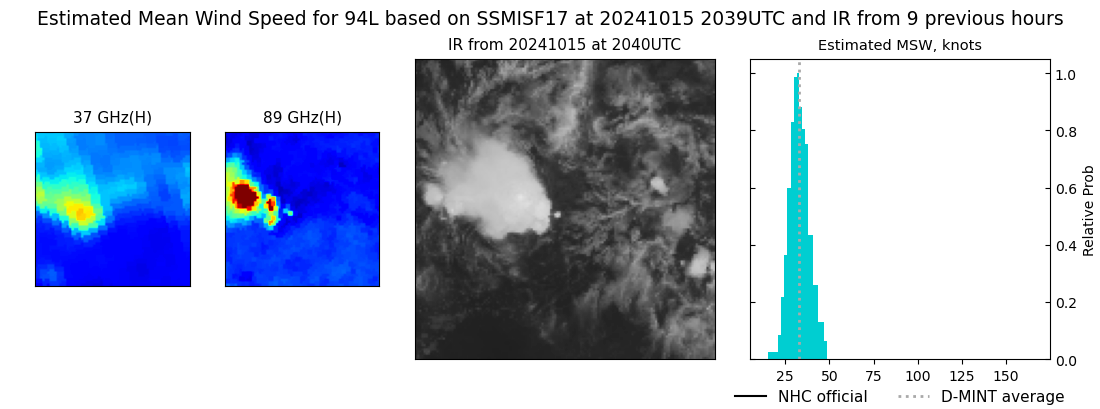 |
| 20241015 | 0927 UTC | SSMISF17 | NaN hPa | 34 kts | 30 kts | 37 kts |  |
| 20241015 | 0910 UTC | SSMISF16 | NaN hPa | 31 kts | 27 kts | 35 kts |  |
| 20241015 | 0651 UTC | SSMISF18 | NaN hPa | 34 kts | 30 kts | 38 kts |  |
| 20241015 | 0442 UTC | AMSR2 | NaN hPa | 30 kts | 28 kts | 33 kts |  |
| 20241015 | 0125 UTC | GMI | NaN hPa | 30 kts | 27 kts | 33 kts |  |
| 20241014 | 2053 UTC | SSMISF17 | NaN hPa | 29 kts | 27 kts | 32 kts |  |
| 20241014 | 2037 UTC | SSMISF16 | NaN hPa | 28 kts | 25 kts | 31 kts |  |
| 20241014 | 1816 UTC | SSMISF18 | NaN hPa | 28 kts | 26 kts | 30 kts | 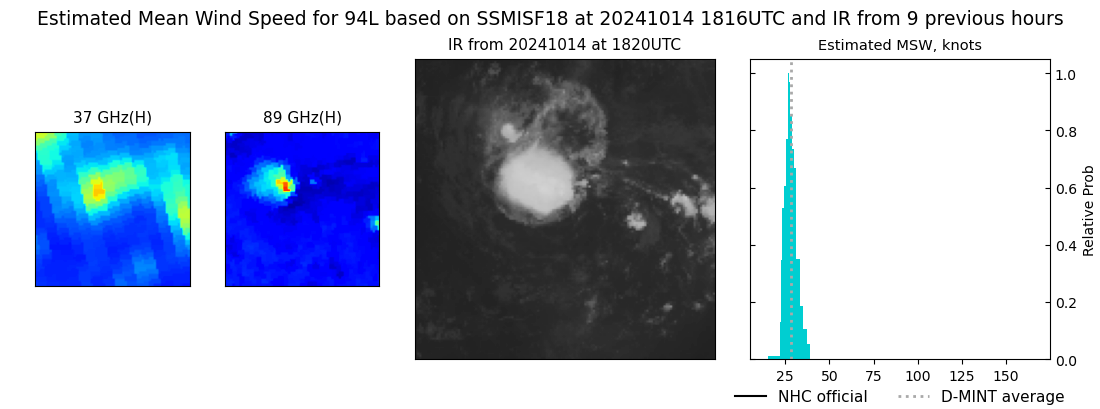 |
| 20241014 | 0706 UTC | SSMISF18 | NaN hPa | 26 kts | 24 kts | 29 kts |  |
| 20241014 | 0359 UTC | AMSR2 | NaN hPa | 26 kts | 24 kts | 29 kts |  |
| 20241013 | 2052 UTC | SSMISF16 | NaN hPa | 30 kts | 26 kts | 33 kts |  |
| 20241013 | 1832 UTC | SSMISF18 | NaN hPa | 30 kts | 27 kts | 33 kts |  |
| 20241013 | 1547 UTC | AMSR2 | NaN hPa | 25 kts | 23 kts | 28 kts |  |
| 20241013 | 1438 UTC | GMI | NaN hPa | 28 kts | 26 kts | 30 kts |  |
| 20241013 | 0813 UTC | SSMISF17 | NaN hPa | 33 kts | 30 kts | 37 kts |  |
| 20241013 | 0115 UTC | GMI | NaN hPa | 29 kts | 26 kts | 32 kts | 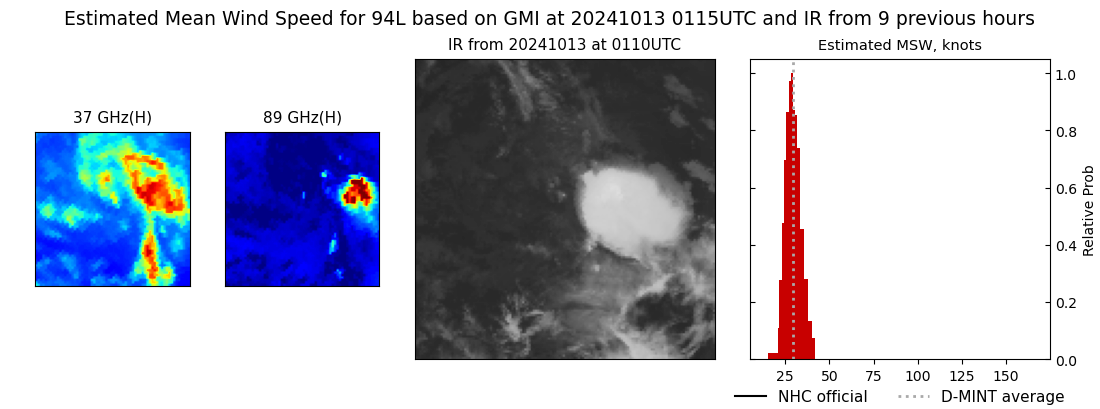 |
| 20241012 | 1939 UTC | SSMISF17 | NaN hPa | 33 kts | 30 kts | 37 kts |  |
| 20241012 | 0827 UTC | SSMISF17 | NaN hPa | 33 kts | 30 kts | 37 kts |  |
| 20241012 | 0809 UTC | SSMISF16 | NaN hPa | 30 kts | 26 kts | 33 kts |  |
| 20241012 | 0551 UTC | SSMISF18 | NaN hPa | 33 kts | 30 kts | 37 kts |  |
| 20241011 | 1952 UTC | SSMISF17 | NaN hPa | 33 kts | 28 kts | 37 kts |  |
| 20241011 | 1935 UTC | SSMISF16 | NaN hPa | 30 kts | 27 kts | 34 kts |  |
| 20241011 | 1716 UTC | SSMISF18 | NaN hPa | 35 kts | 31 kts | 40 kts |  |
| 20241011 | 1427 UTC | GMI | NaN hPa | 30 kts | 27 kts | 33 kts |  |
| 20241011 | 0605 UTC | SSMISF18 | NaN hPa | 30 kts | 27 kts | 34 kts |  |
| 20241011 | 0329 UTC | AMSR2 | NaN hPa | 31 kts | 27 kts | 34 kts |  |
| 20241011 | 0104 UTC | GMI | NaN hPa | 28 kts | 25 kts | 32 kts |  |
| 20241010 | 1949 UTC | SSMISF16 | NaN hPa | 25 kts | 22 kts | 29 kts |  |
| 20241010 | 1729 UTC | SSMISF18 | NaN hPa | 30 kts | 26 kts | 34 kts |  |