|
||

 |
D-MINT HISTORY FILE for 2025_01B
| Date | Time | MW Sensor | MSLP | Vmax (30th-70th percentile average) | Vmax 25th percentile | Vmax 75th percentile | Image |
| 20251002 | 1652 UTC | TMS06 | 993 hPa | 37 kts | 33 kts | 41 kts |  |
| 20251002 | 0725 UTC | ATMS-N20 | 993 hPa | 35 kts | 32 kts | 38 kts |  |
| 20251002 | 0721 UTC | AMSR2 | 999 hPa | 35 kts | 31 kts | 40 kts |  |
| 20251002 | 0506 UTC | TMS02 | 995 hPa | 31 kts | 28 kts | 35 kts | 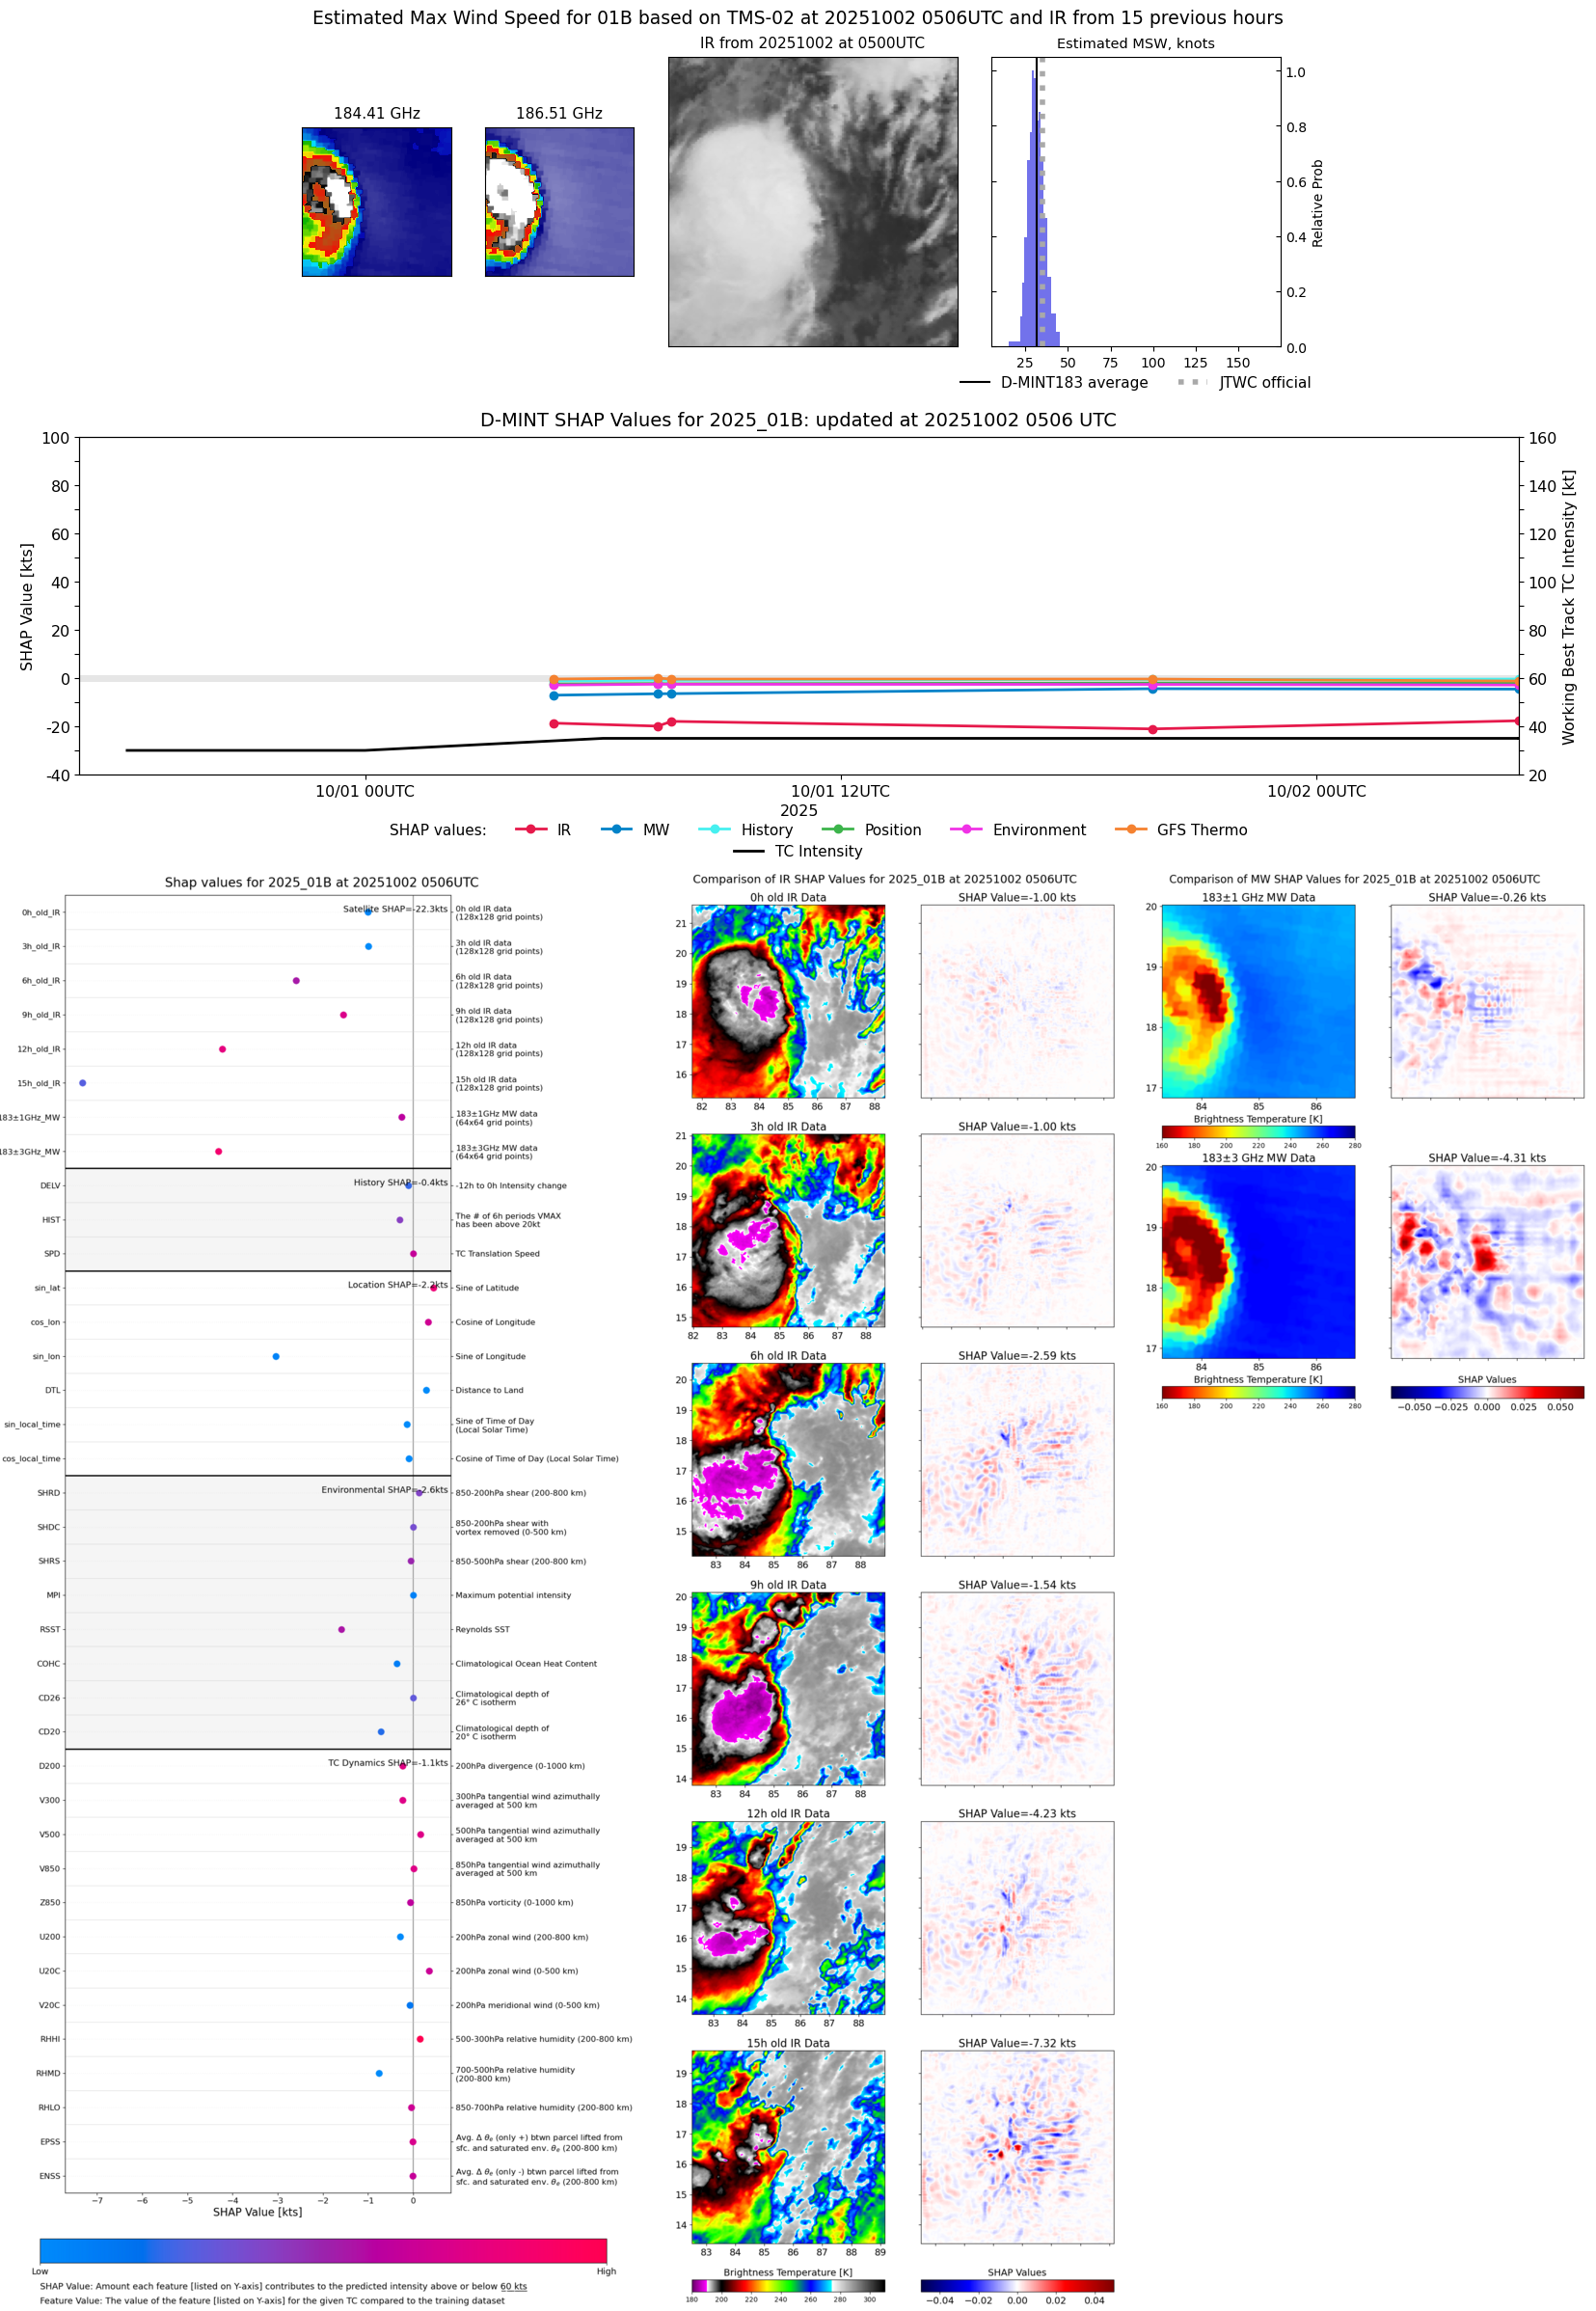 |
| 20251002 | 0455 UTC | AWS | 995 hPa | 31 kts | 28 kts | 35 kts |  |
| 20251002 | 0422 UTC | TMS05 | 995 hPa | 32 kts | 29 kts | 36 kts | 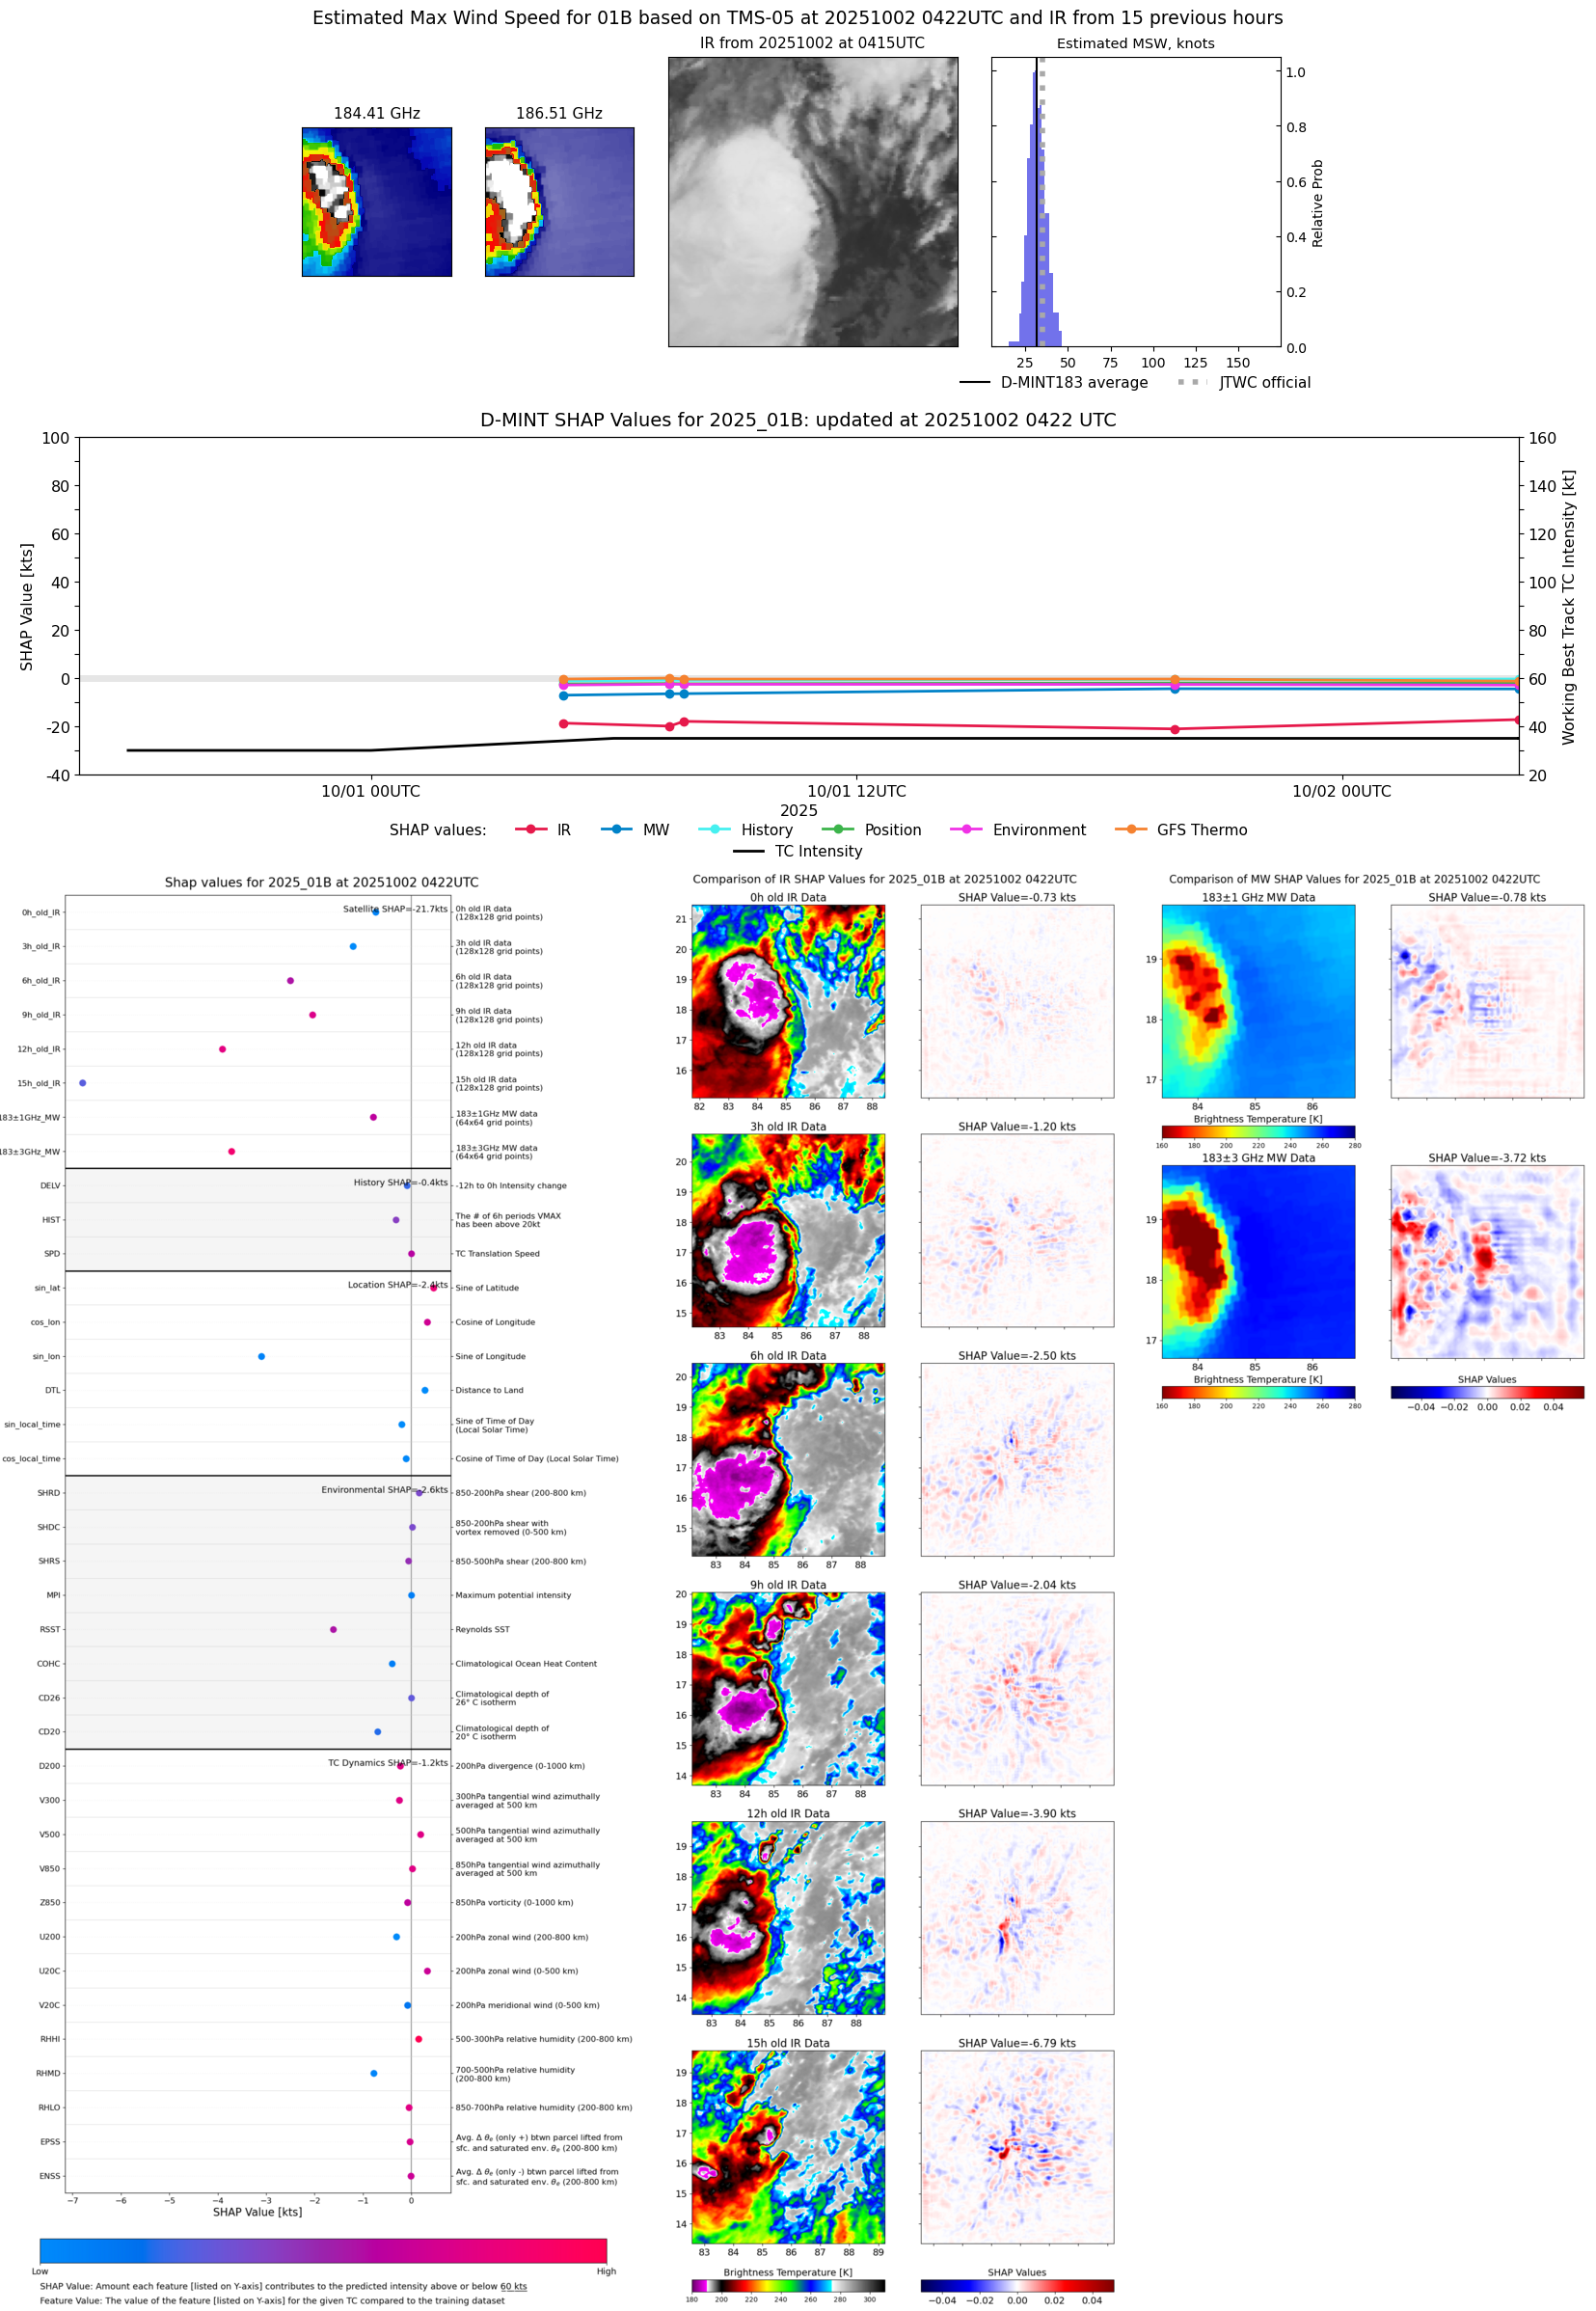 |
| 20251002 | 0033 UTC | GMI | 1001 hPa | 28 kts | 26 kts | 32 kts |  |
| 20251001 | 2028 UTC | AMSR2 | 1001 hPa | 29 kts | 25 kts | 32 kts |  |
| 20251001 | 1952 UTC | TMS07 | 996 hPa | 29 kts | 26 kts | 32 kts |  |
| 20251001 | 1249 UTC | SSMISF16 | 999 hPa | 26 kts | 24 kts | 29 kts | 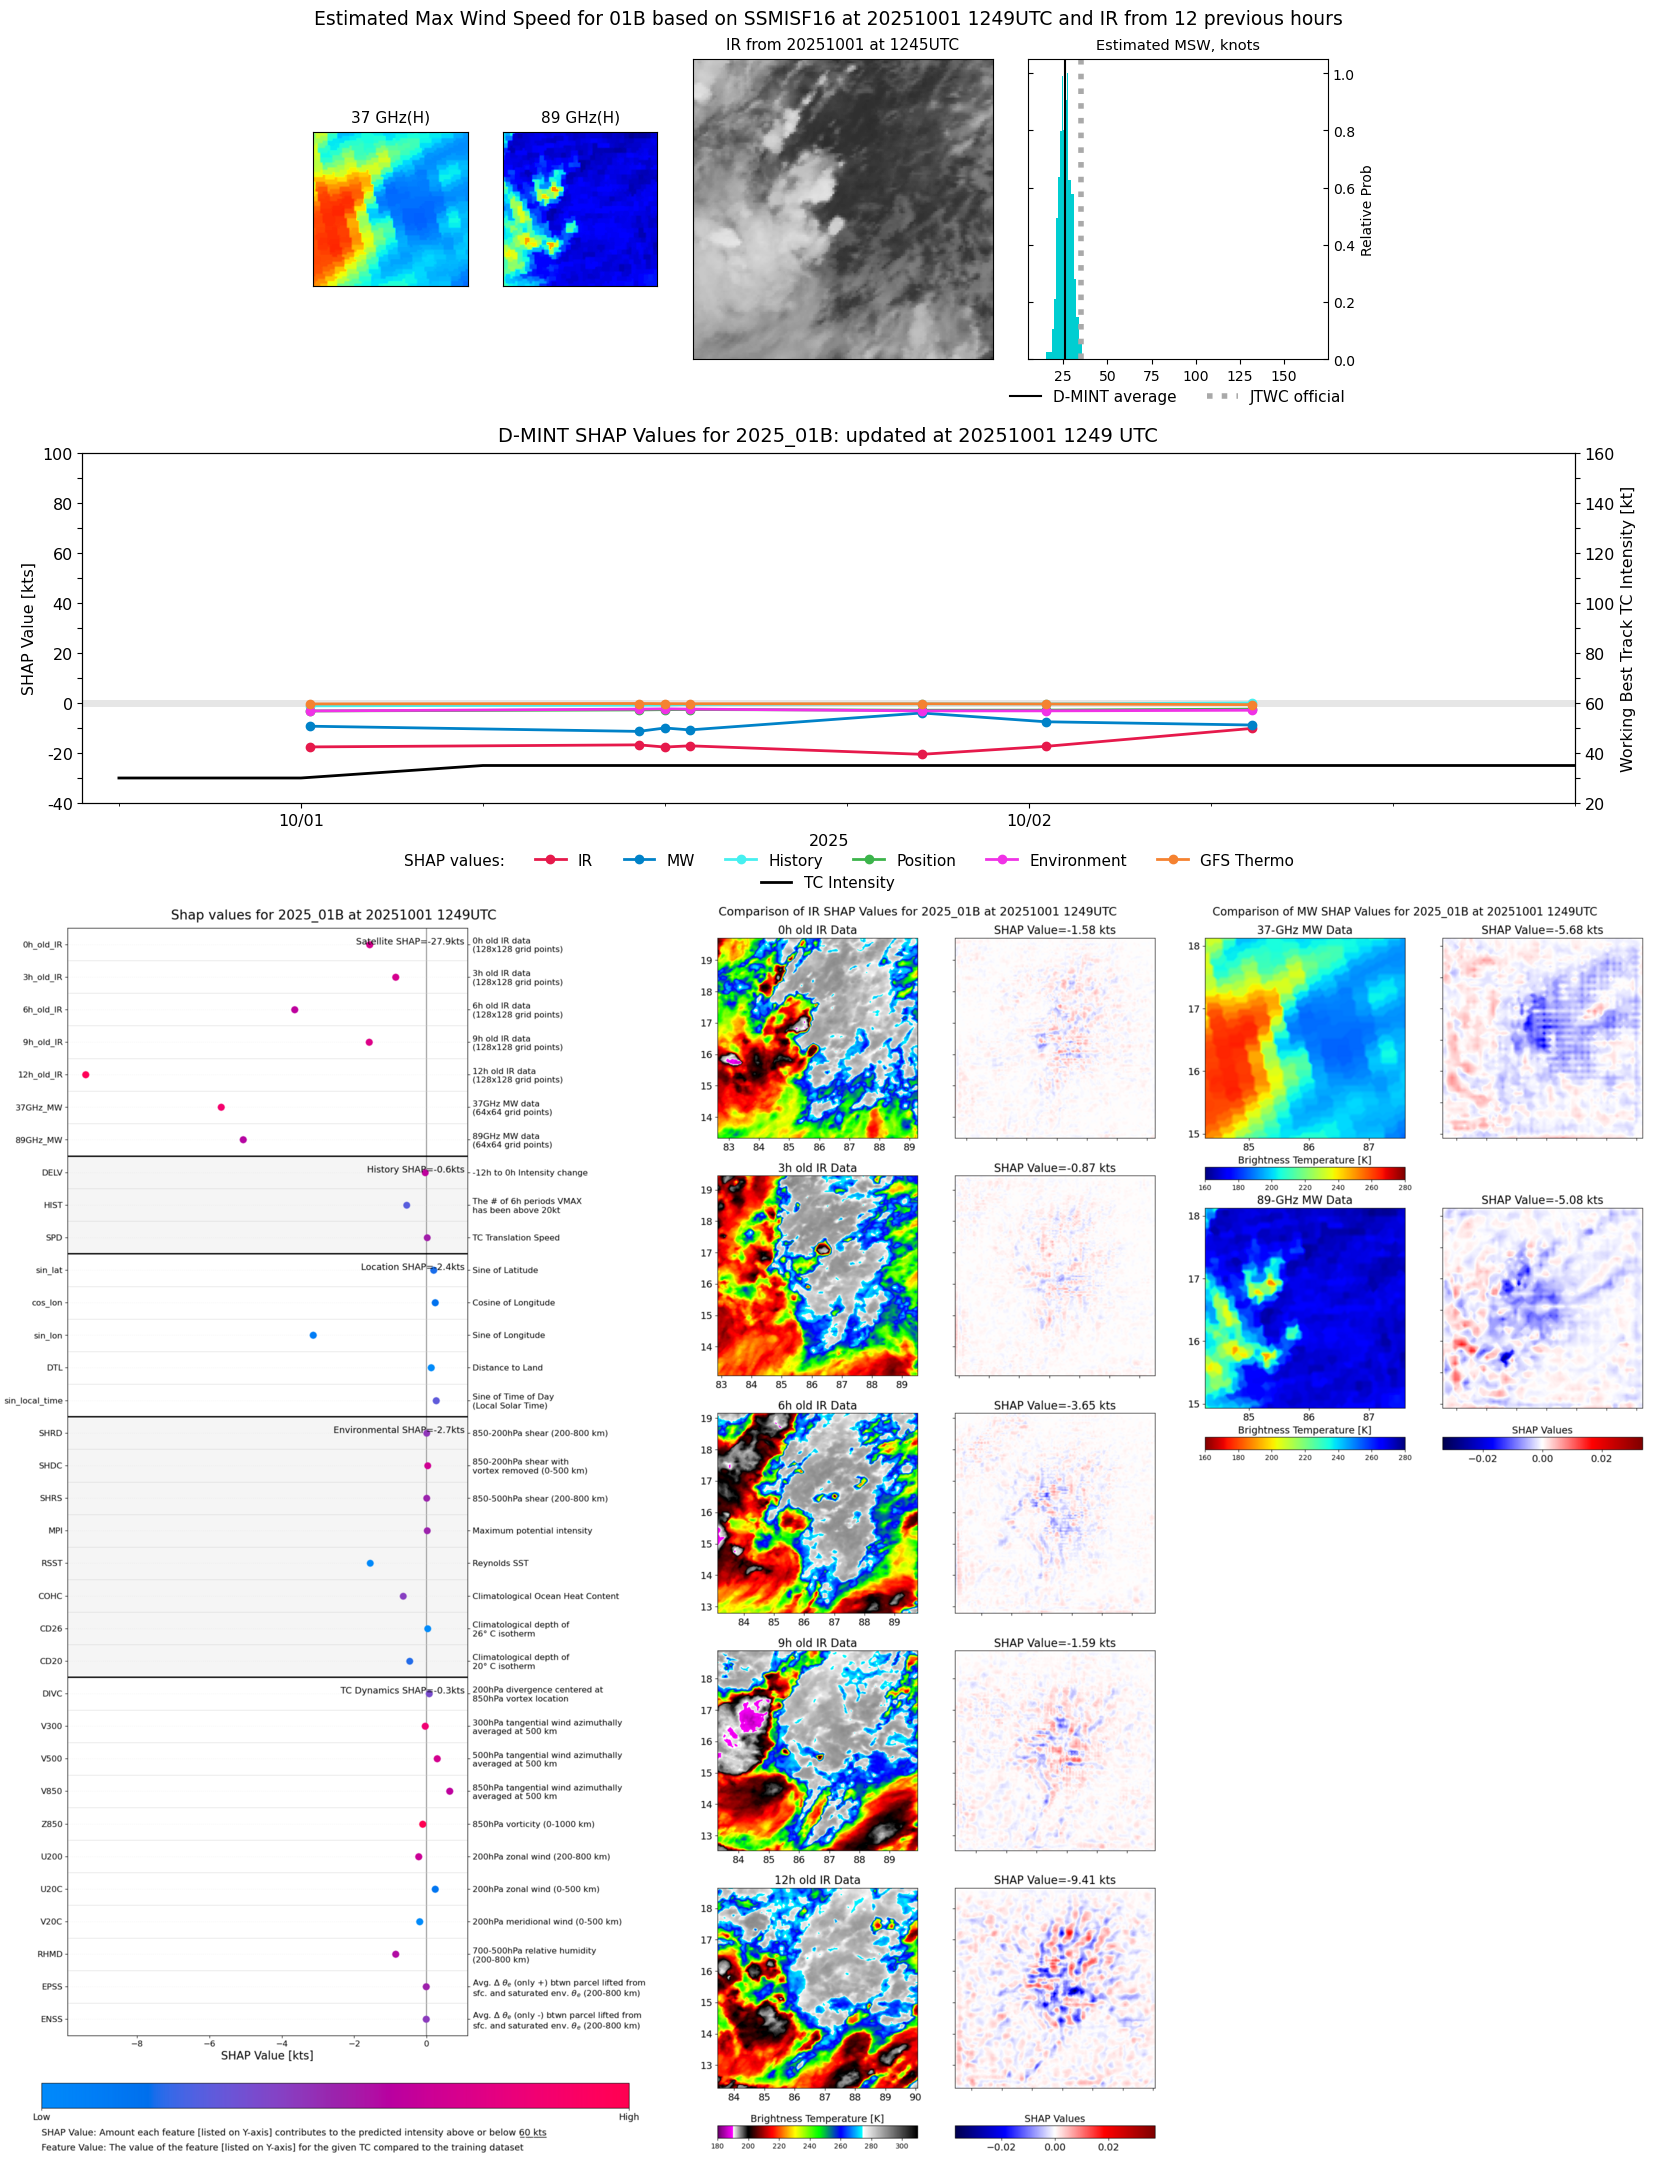 |
| 20251001 | 1200 UTC | SSMISF17 | 998 hPa | 26 kts | 24 kts | 29 kts | 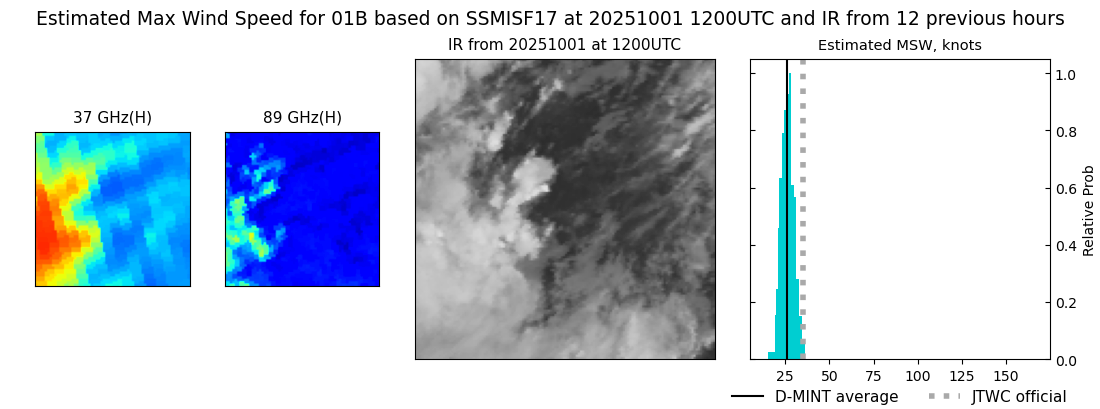 |
| 20251001 | 1108 UTC | GMI | 1000 hPa | 26 kts | 23 kts | 28 kts | 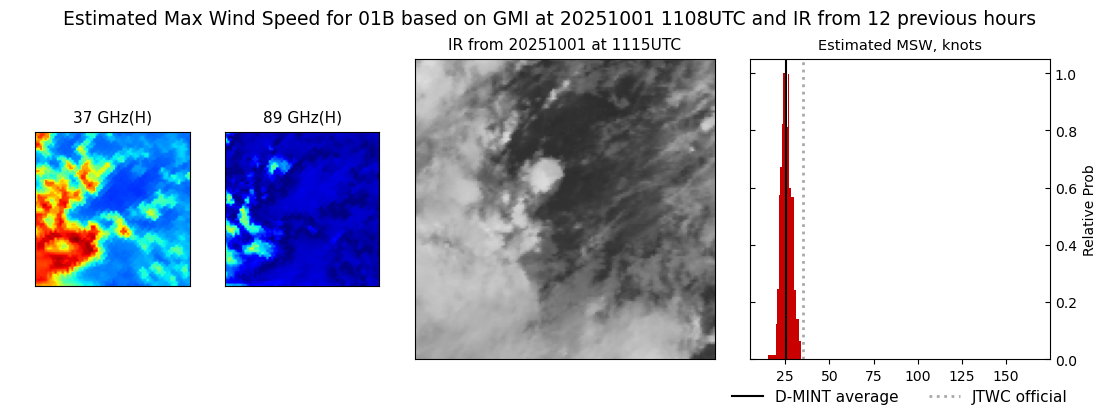 |
| 20251001 | 0744 UTC | ATMS-N20 | 996 hPa | 29 kts | 26 kts | 33 kts |  |
| 20251001 | 0723 UTC | ATMS-NPP | 995 hPa | 28 kts | 25 kts | 31 kts |  |
| 20251001 | 0445 UTC | AWS | 996 hPa | 27 kts | 25 kts | 30 kts | 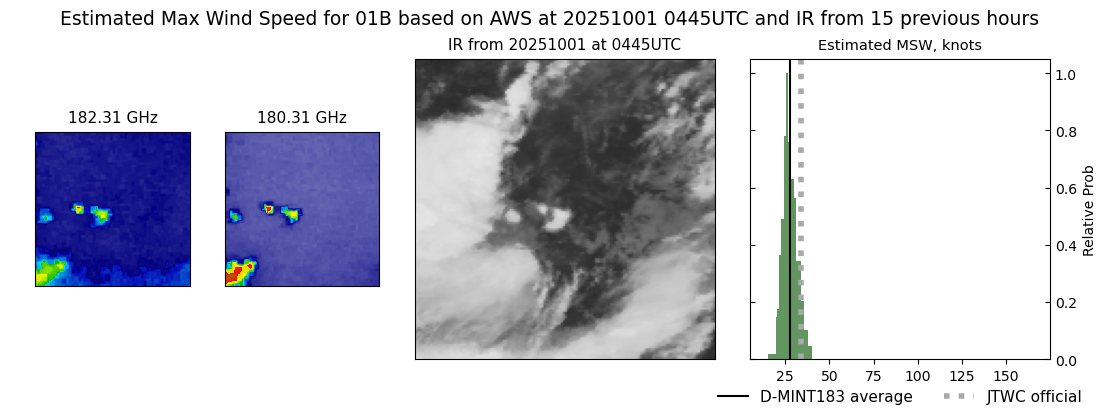 |
| 20251001 | 0017 UTC | WSFM01 | 999 hPa | 25 kts | 23 kts | 28 kts |  |