|
||

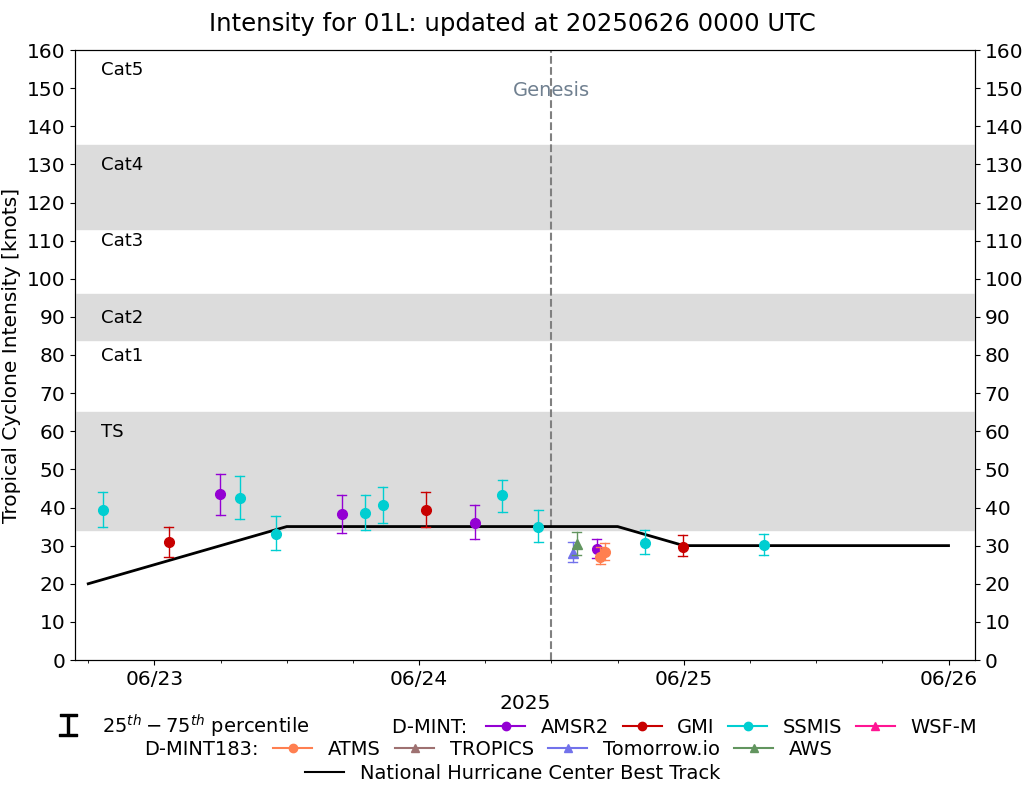 |
D-MINT HISTORY FILE for 2025_01L
| Date | Time | MW Sensor | MSLP | Vmax (30th-70th percentile average) | Vmax 25th percentile | Vmax 75th percentile | Image |
| 20250625 | 0715 UTC | SSMISF18 | 1012 hPa | 30 kts | 28 kts | 33 kts | 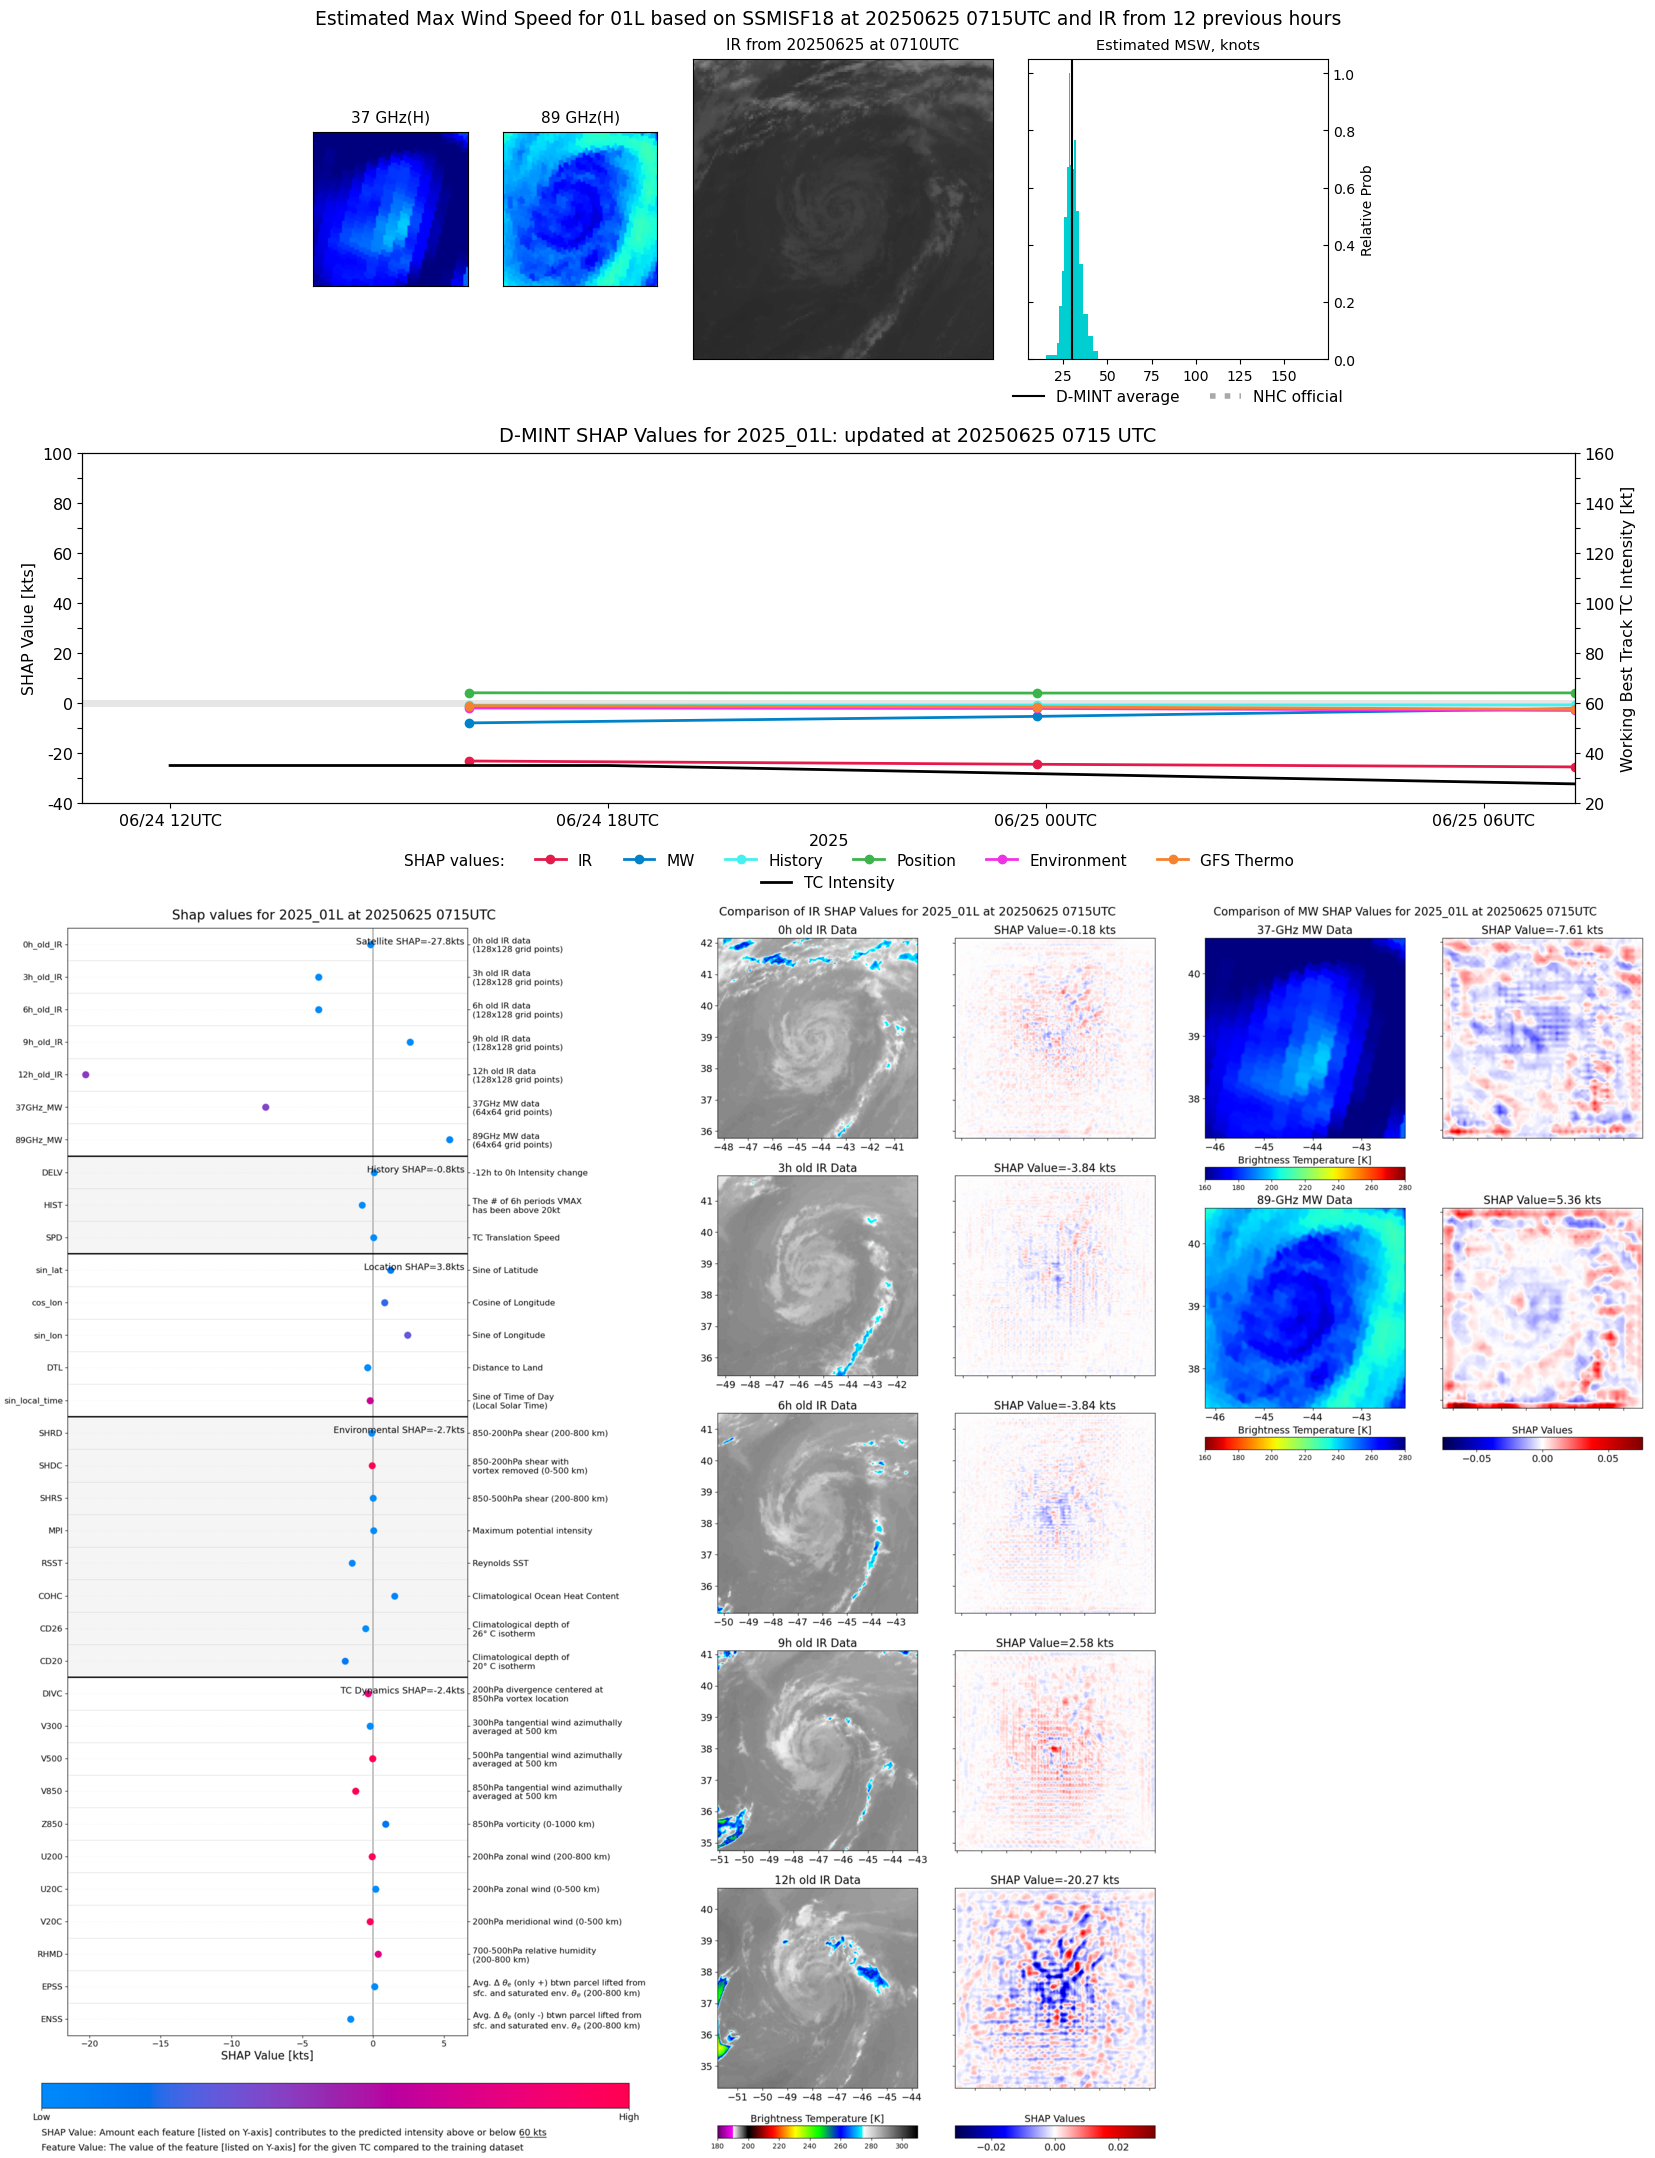 |
| 20250624 | 2353 UTC | GMI | 1012 hPa | 30 kts | 27 kts | 33 kts |  |
| 20250624 | 2027 UTC | SSMISF17 | 1012 hPa | 31 kts | 28 kts | 34 kts | 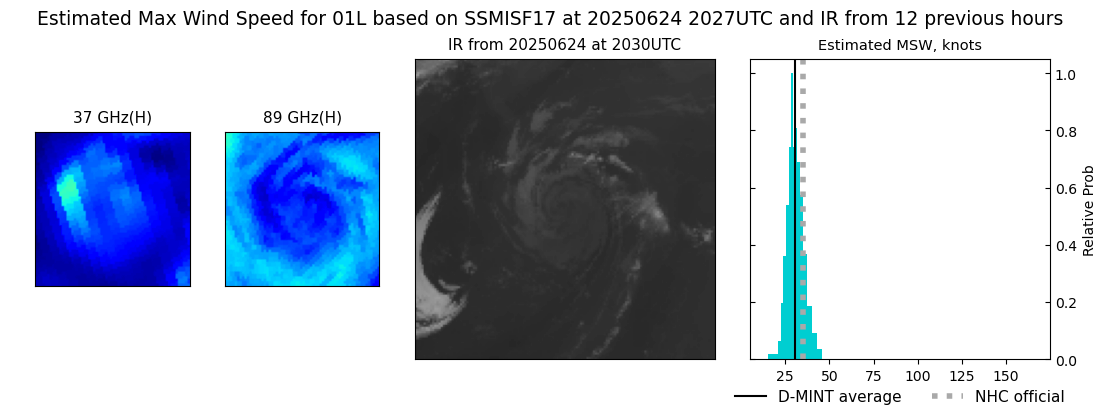 |
| 20250624 | 1651 UTC | ATMS-N20 | 1017 hPa | 28 kts | 26 kts | 31 kts | 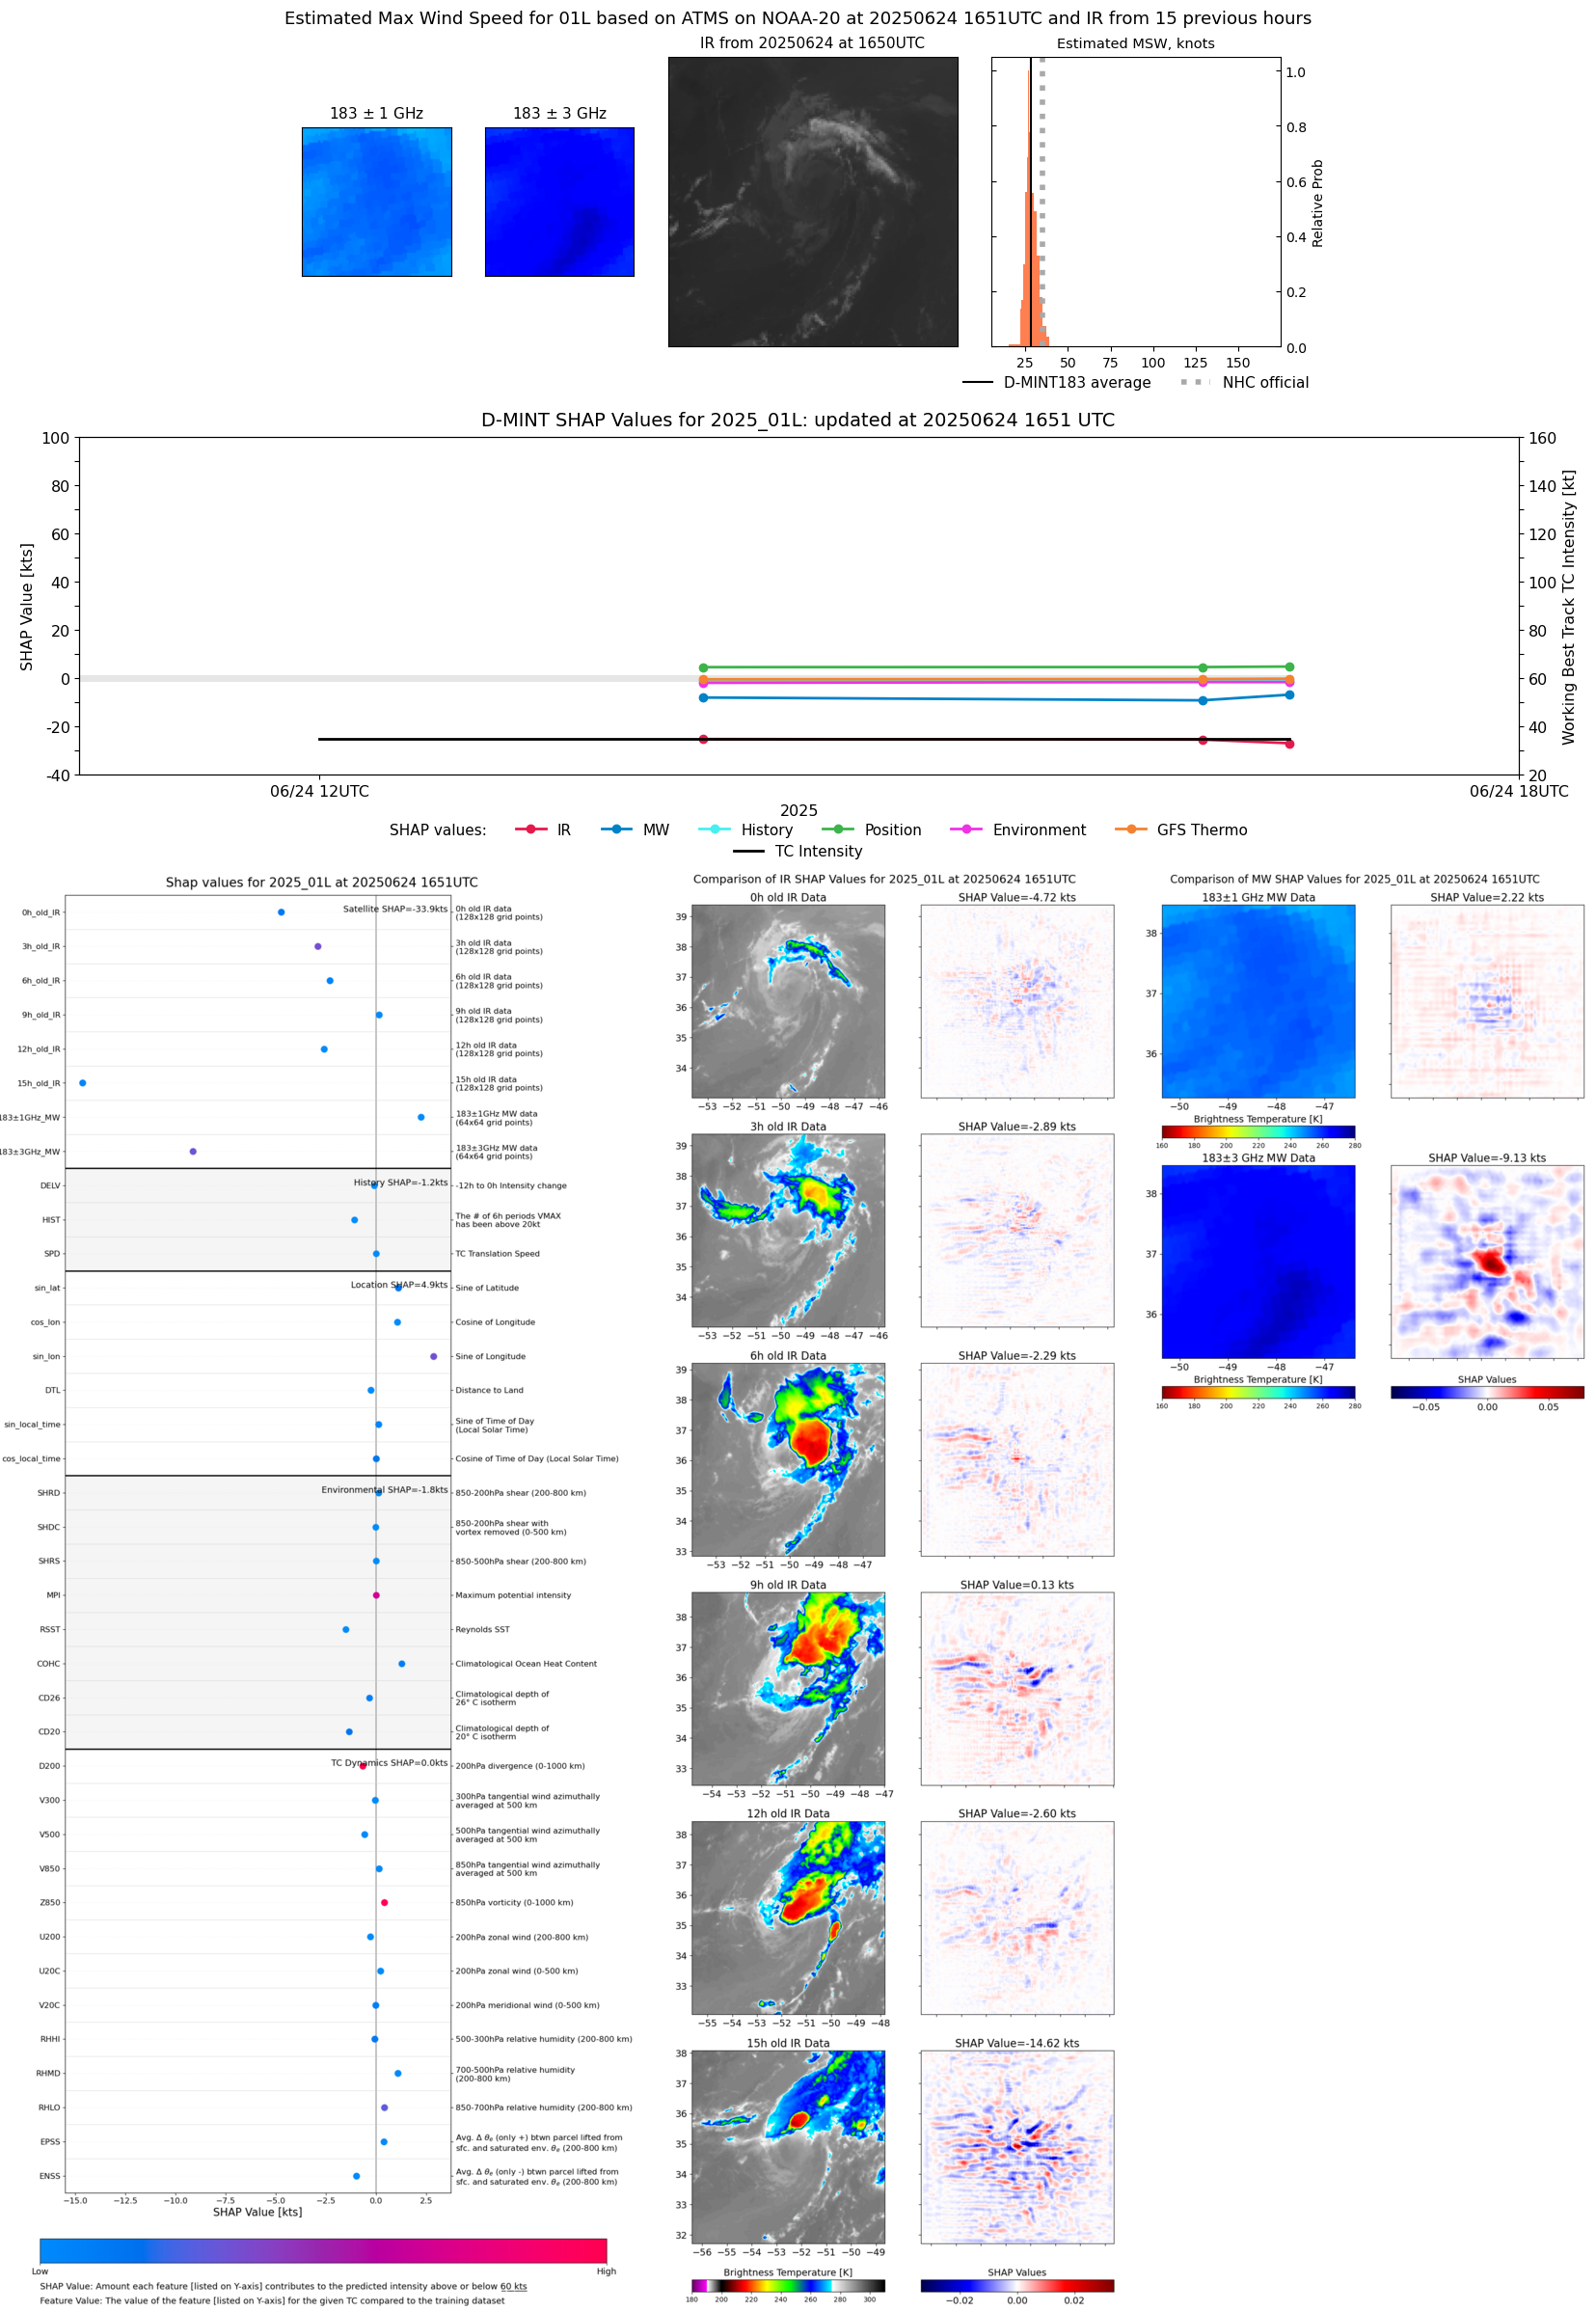 |
| 20250624 | 1625 UTC | ATMS-N20 | 1017 hPa | 27 kts | 25 kts | 30 kts |  |
| 20250624 | 1606 UTC | AMSR2 | 1016 hPa | 29 kts | 27 kts | 32 kts |  |
| 20250624 | 1417 UTC | AWS | 1016 hPa | 30 kts | 28 kts | 33 kts |  |
| 20250624 | 1355 UTC | TMS02 | 1017 hPa | 28 kts | 26 kts | 31 kts |  |
| 20250624 | 1047 UTC | SSMISF16 | NaN hPa | 35 kts | 31 kts | 39 kts | 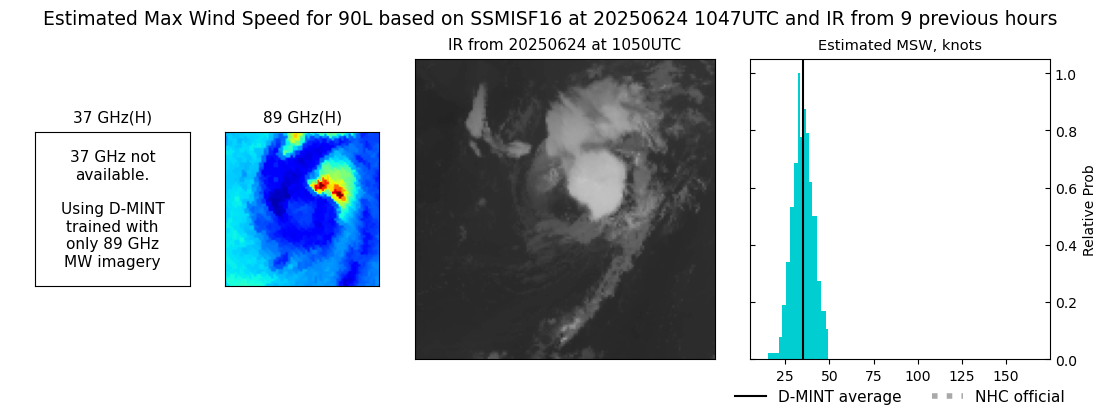 |
| 20250624 | 0731 UTC | SSMISF18 | NaN hPa | 43 kts | 39 kts | 47 kts | 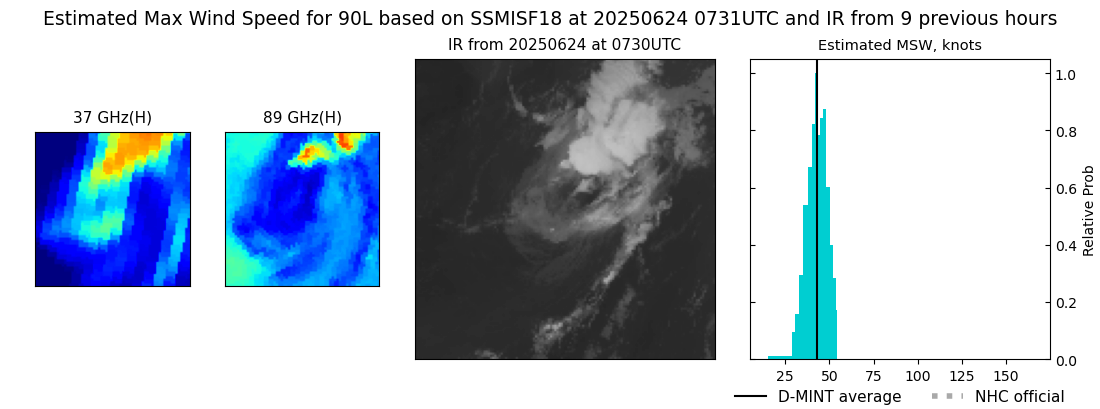 |
| 20250624 | 0503 UTC | AMSR2 | NaN hPa | 36 kts | 32 kts | 41 kts | 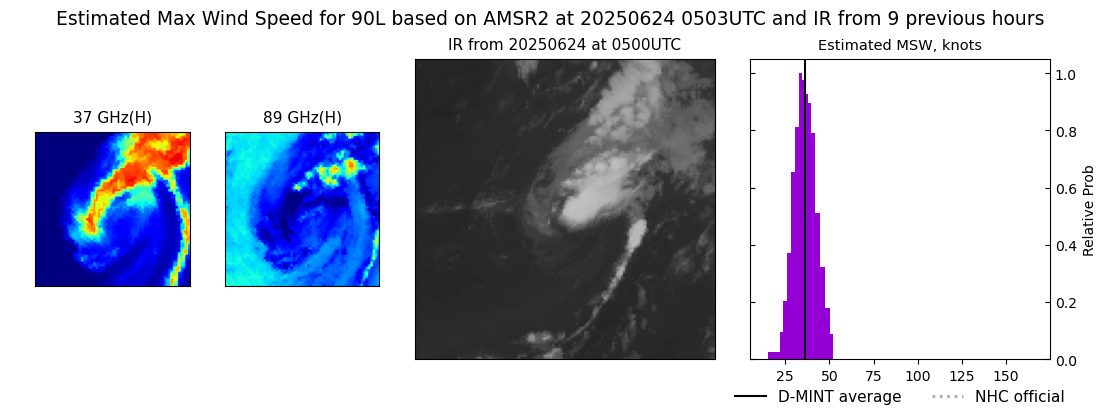 |
| 20250624 | 0037 UTC | GMI | NaN hPa | 39 kts | 35 kts | 44 kts | 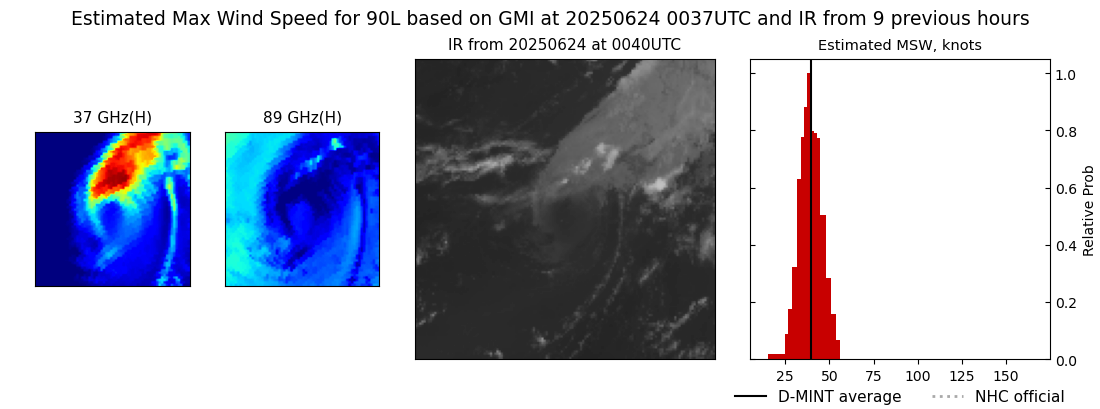 |
| 20250623 | 2041 UTC | SSMISF17 | NaN hPa | 41 kts | 36 kts | 45 kts | 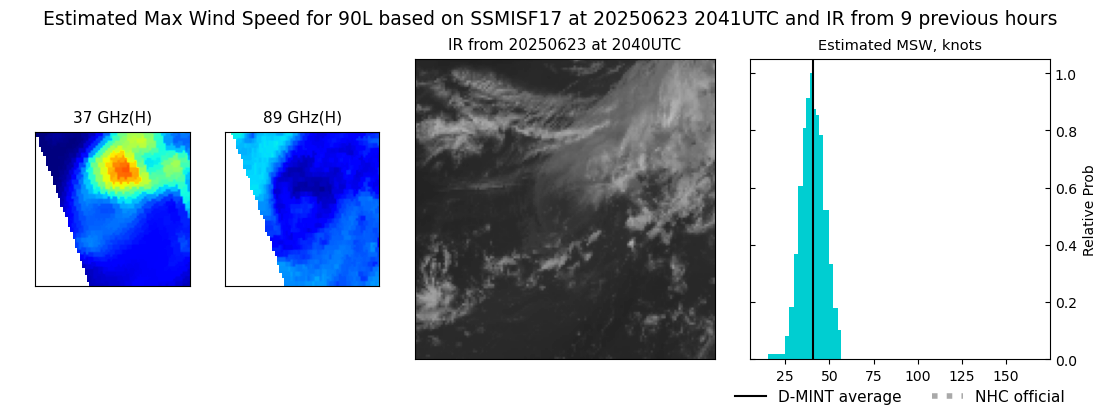 |
| 20250623 | 1906 UTC | SSMISF18 | NaN hPa | 39 kts | 34 kts | 43 kts | 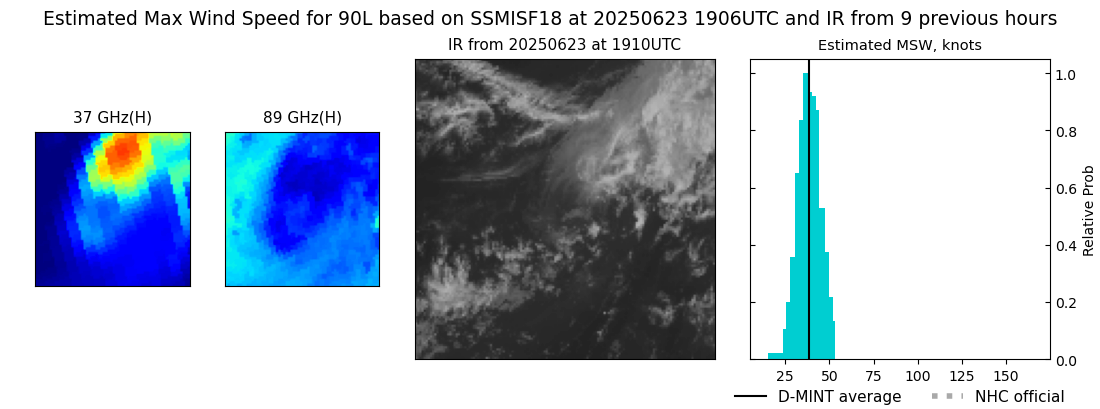 |
| 20250623 | 1700 UTC | AMSR2 | NaN hPa | 38 kts | 33 kts | 43 kts | 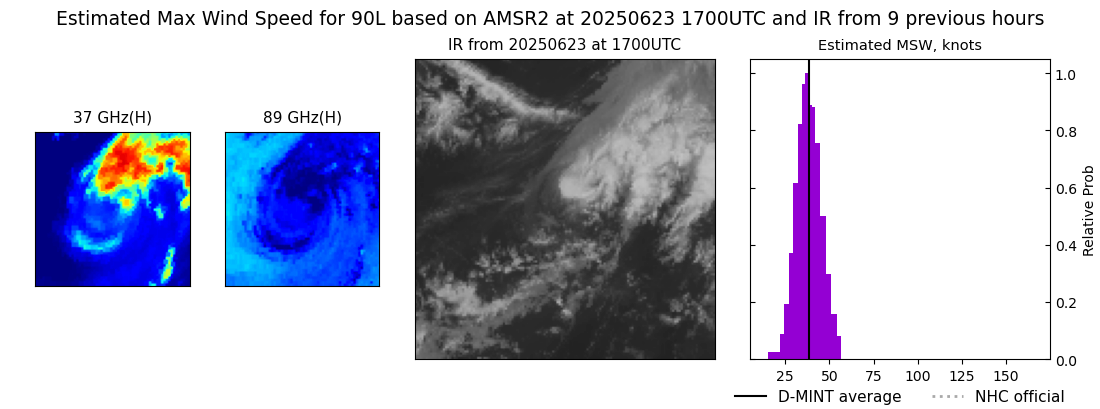 |
| 20250623 | 1101 UTC | SSMISF16 | NaN hPa | 33 kts | 29 kts | 38 kts | 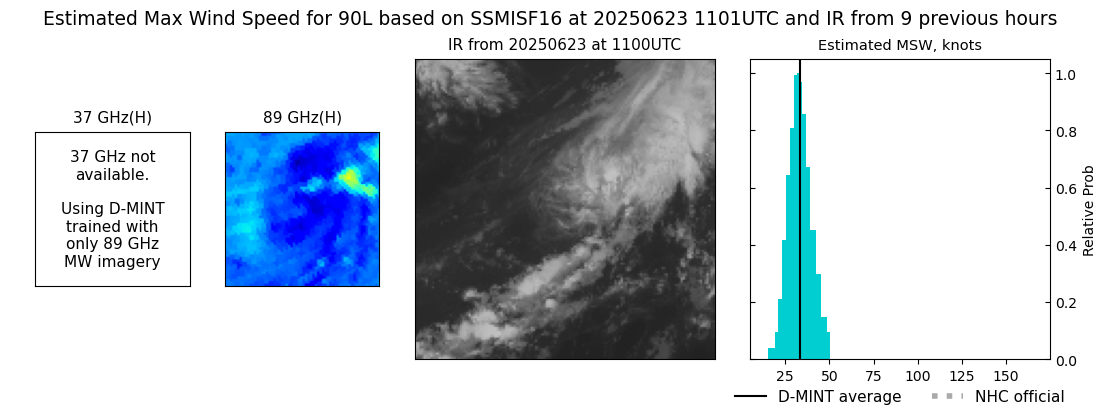 |
| 20250623 | 0745 UTC | SSMISF18 | NaN hPa | 42 kts | 37 kts | 48 kts | 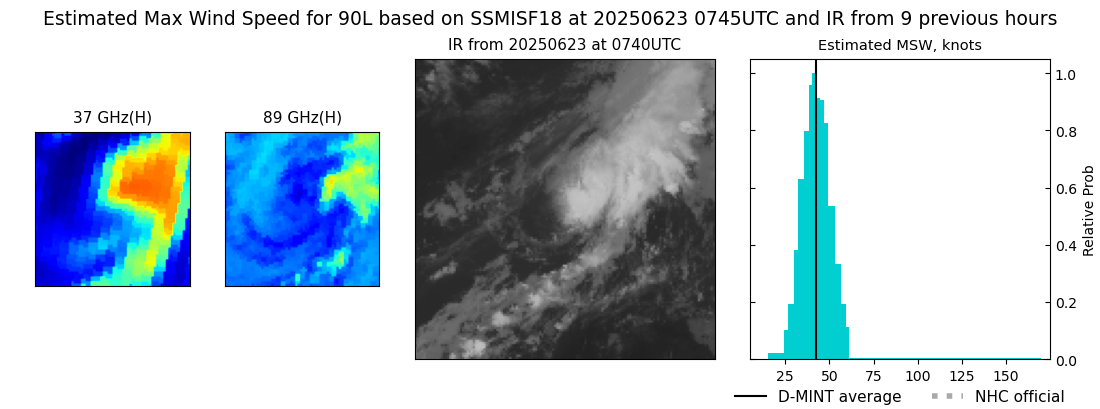 |
| 20250623 | 0559 UTC | AMSR2 | NaN hPa | 43 kts | 38 kts | 49 kts | 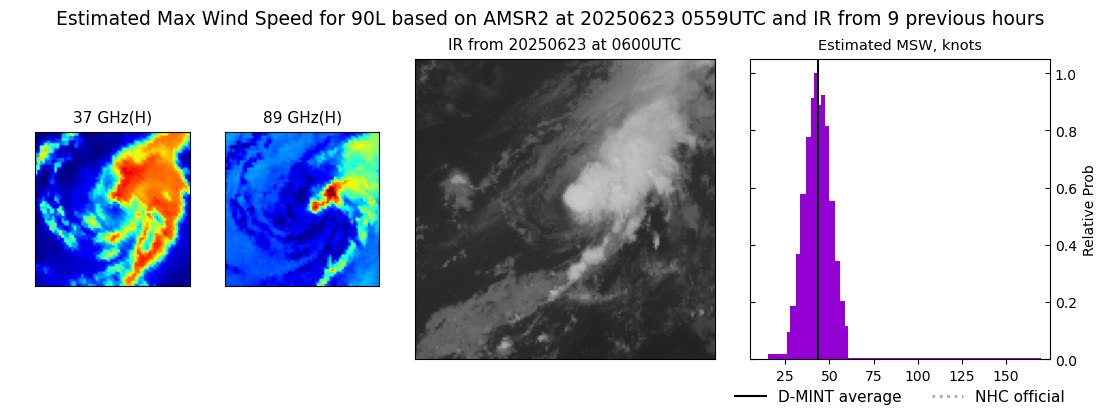 |
| 20250623 | 0119 UTC | GMI | NaN hPa | 31 kts | 27 kts | 35 kts | 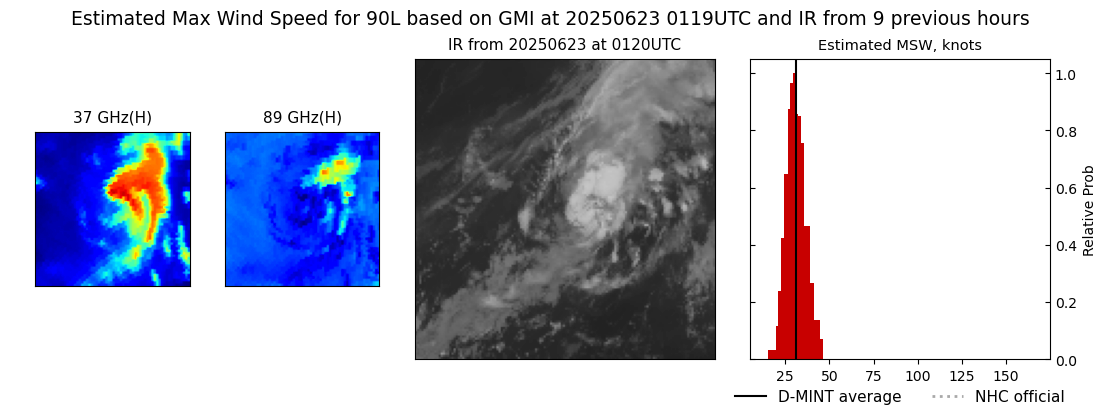 |
| 20250622 | 1920 UTC | SSMISF18 | NaN hPa | 39 kts | 35 kts | 44 kts |  |