|
||

 |
D-MINT HISTORY FILE for 2025_02L
| Date | Time | MW Sensor | MSLP | Vmax (30th-70th percentile average) | Vmax 25th percentile | Vmax 75th percentile | Image |
| 20250630 | 0818 UTC | ATMS-N20 | 1006 hPa | 37 kts | 33 kts | 41 kts |  |
| 20250630 | 0444 UTC | TMS02 | 1005 hPa | 35 kts | 31 kts | 39 kts |  |
| 20250630 | 0016 UTC | SSMISF17 | 1004 hPa | 32 kts | 28 kts | 37 kts |  |
| 20250629 | 2244 UTC | SSMISF18 | 1006 hPa | 31 kts | 27 kts | 35 kts |  |
| 20250629 | 1949 UTC | ATMS-N20 | 1008 hPa | 30 kts | 27 kts | 34 kts |  |
| 20250629 | 1937 UTC | AMSR2 | 1007 hPa | 34 kts | 30 kts | 39 kts | 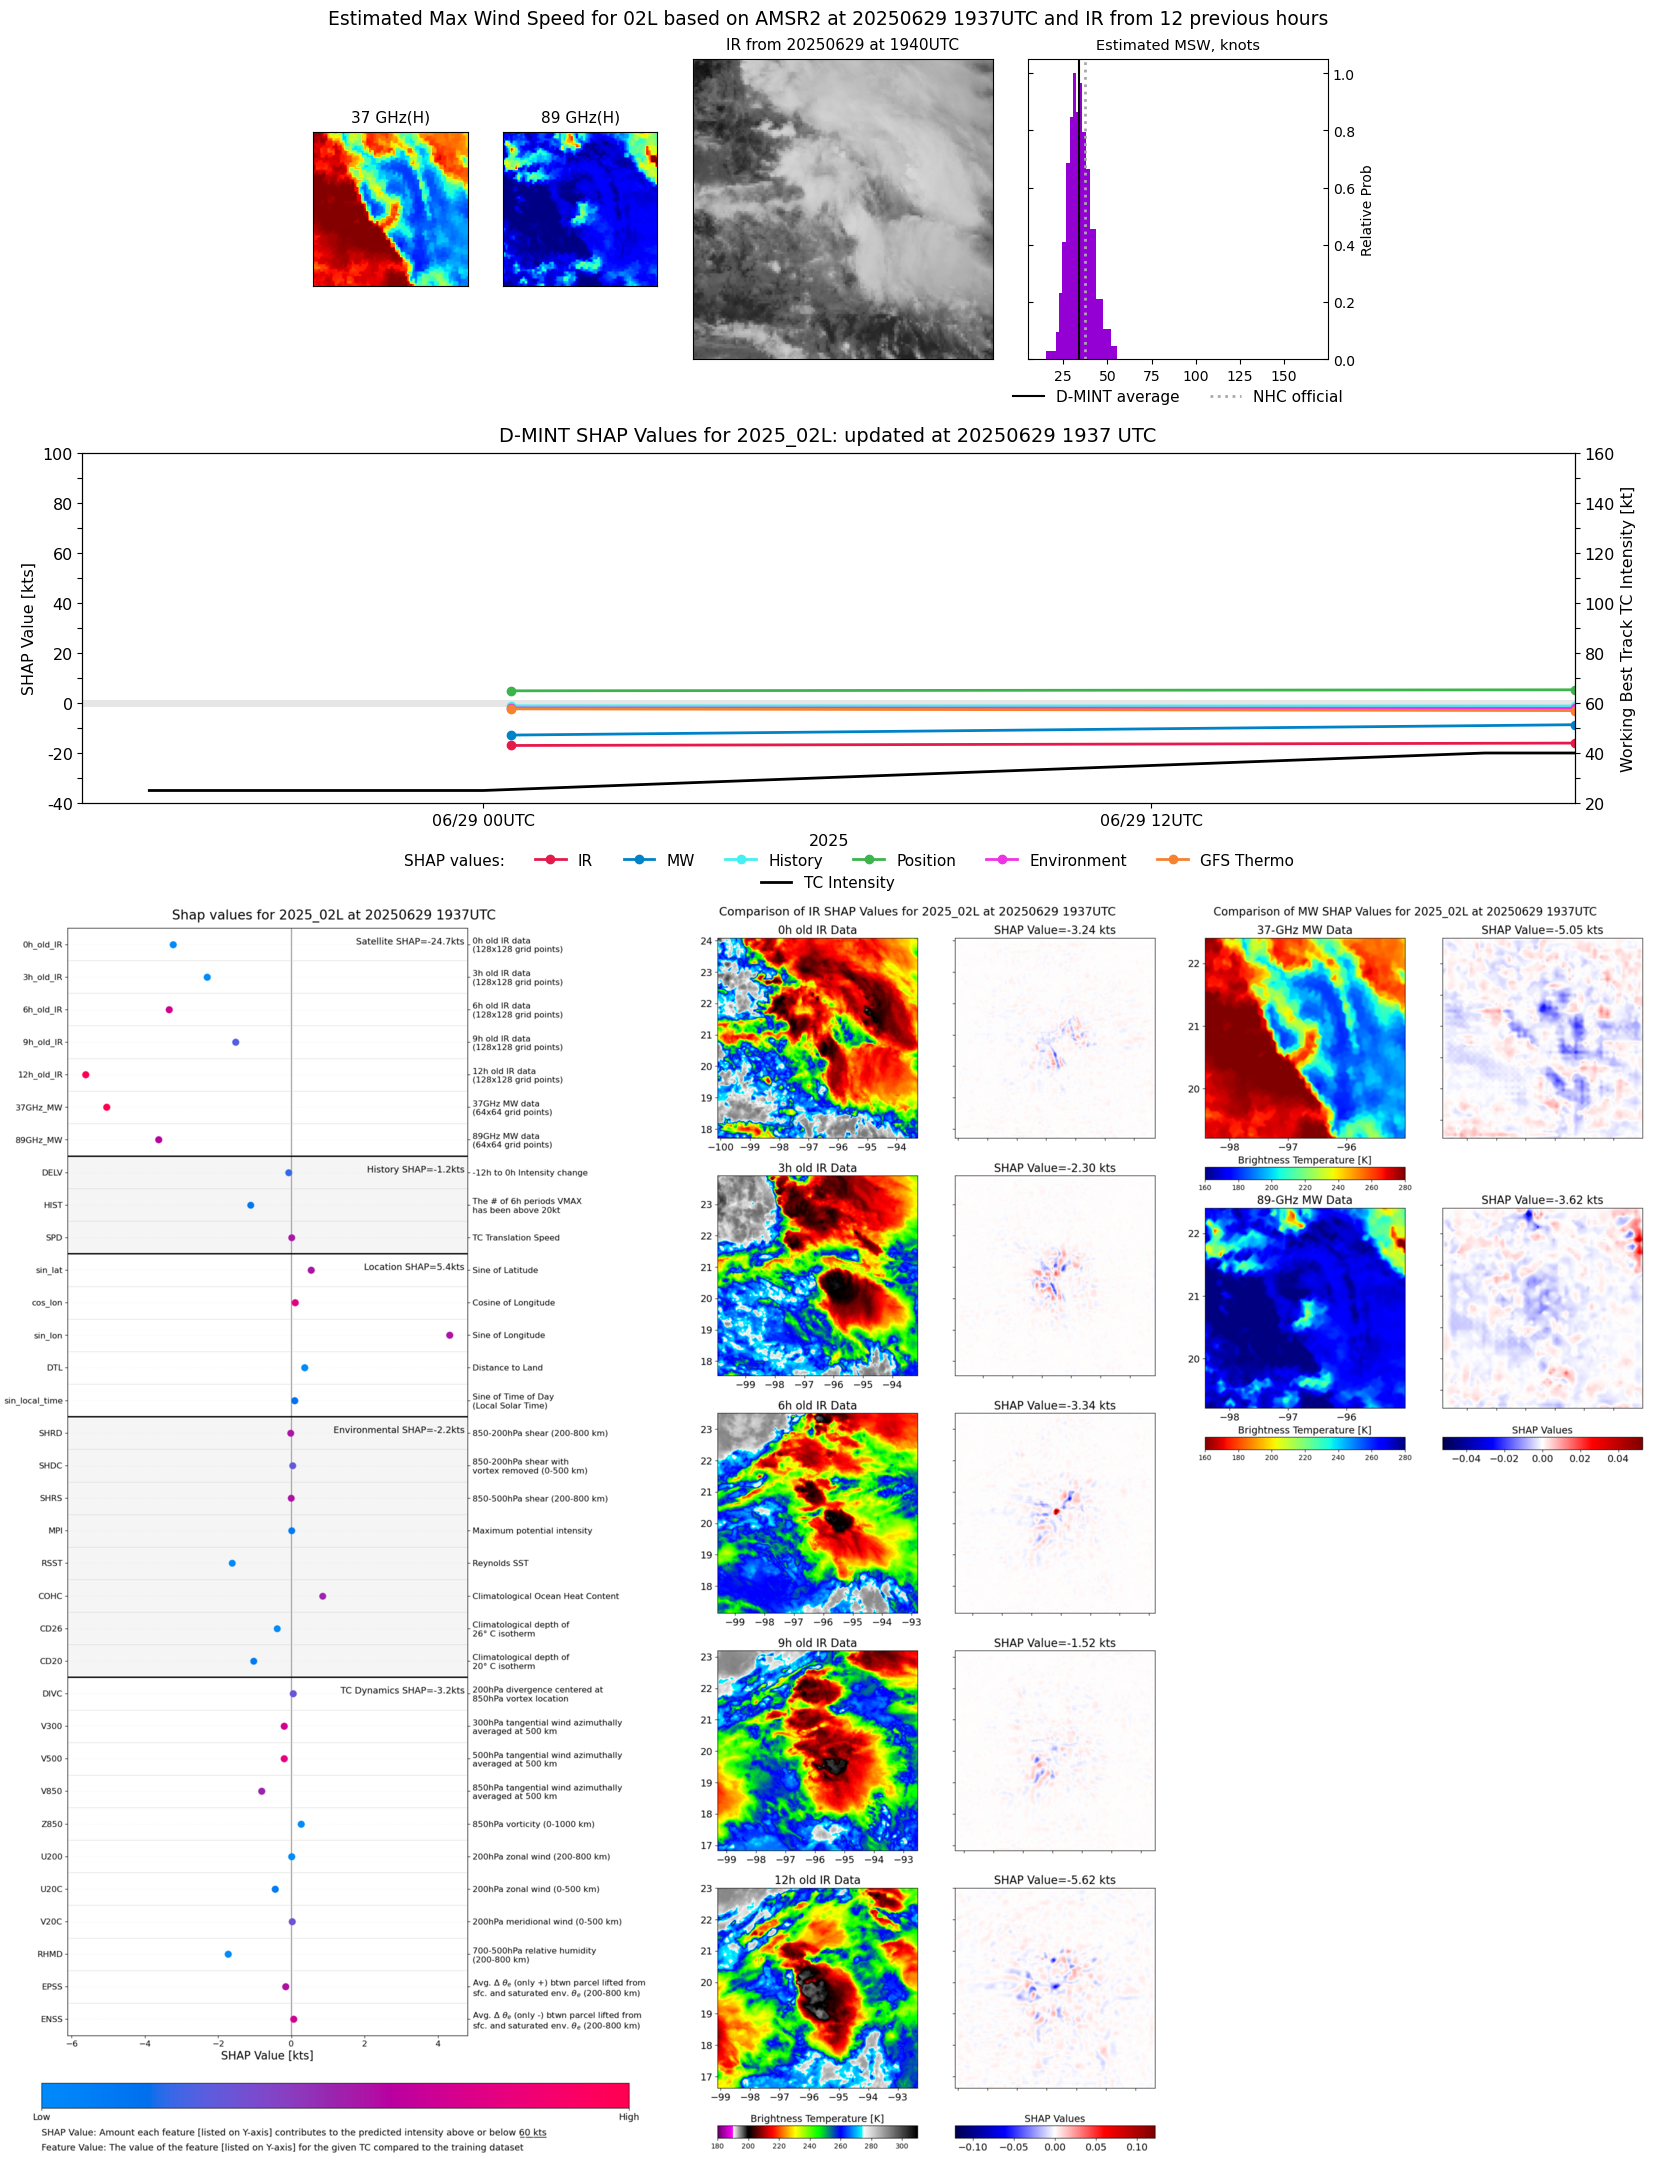 |
| 20250629 | 1302 UTC | SSMISF17 | 1007 hPa | 31 kts | 27 kts | 35 kts |  |
| 20250629 | 0232 UTC | TMS03 | 1009 hPa | 29 kts | 27 kts | 33 kts |  |
| 20250629 | 0033 UTC | SSMISF16 | 1011 hPa | 26 kts | 23 kts | 30 kts | 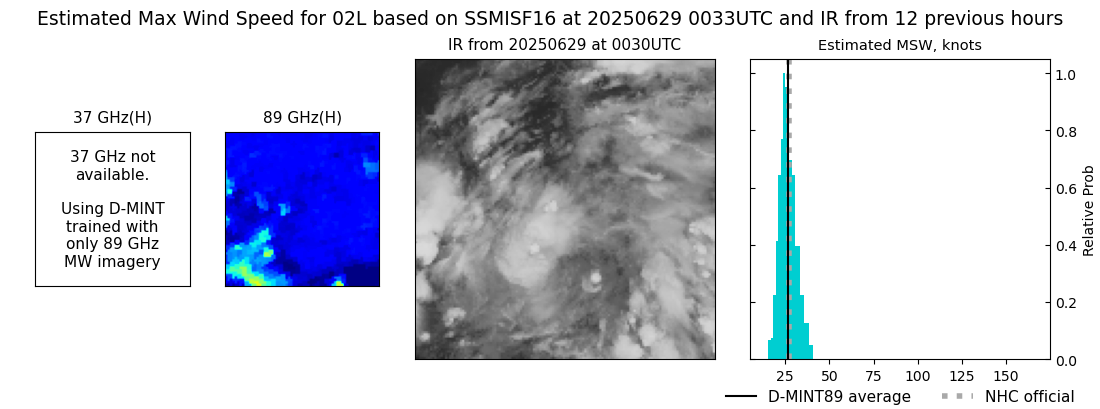 |
| 20250629 | 0030 UTC | SSMISF17 | 1010 hPa | 30 kts | 26 kts | 33 kts |  |
| 20250628 | 1600 UTC | GMI | NaN hPa | 23 kts | 20 kts | 26 kts | 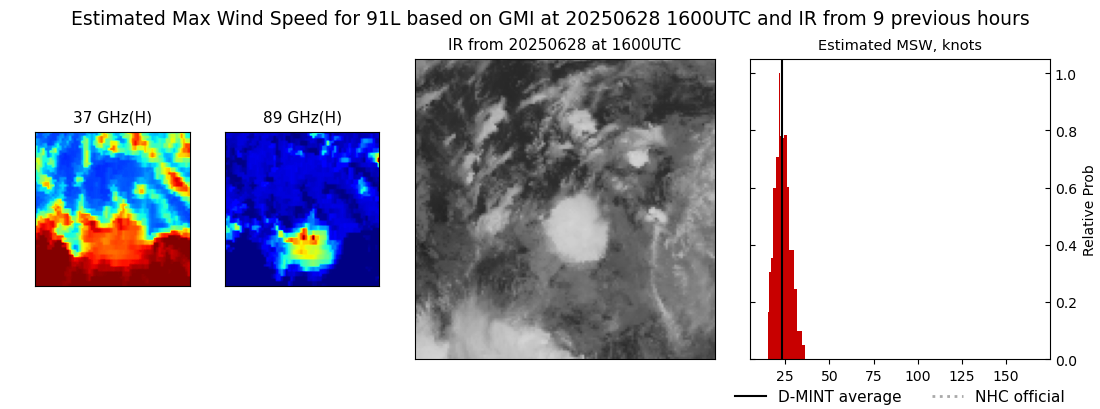 |
| 20250628 | 1320 UTC | SSMISF16 | NaN hPa | 23 kts | 20 kts | 27 kts | 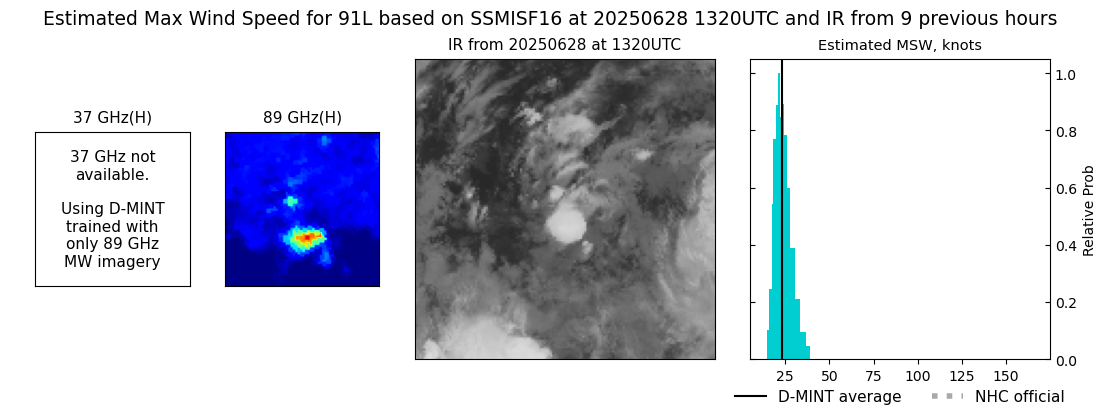 |
| 20250628 | 0800 UTC | AMSR2 | NaN hPa | 25 kts | 22 kts | 29 kts | 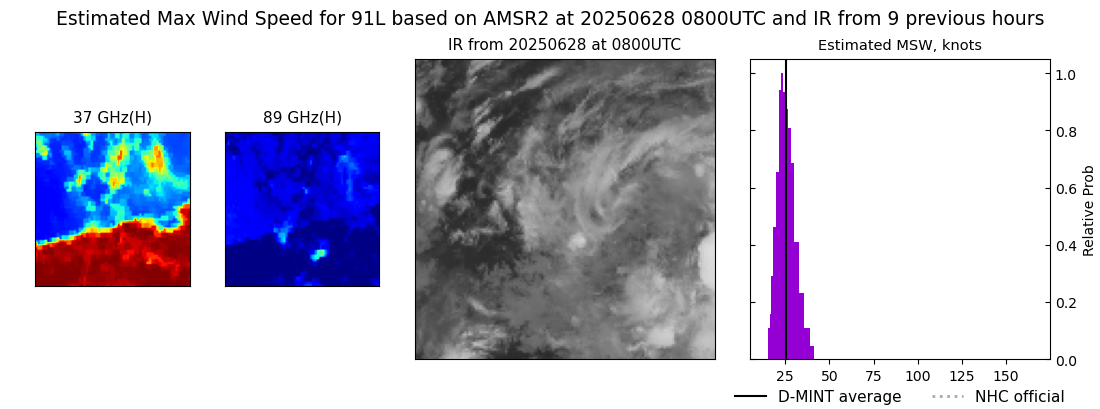 |
| 20250628 | 0236 UTC | GMI | NaN hPa | 23 kts | 20 kts | 26 kts | 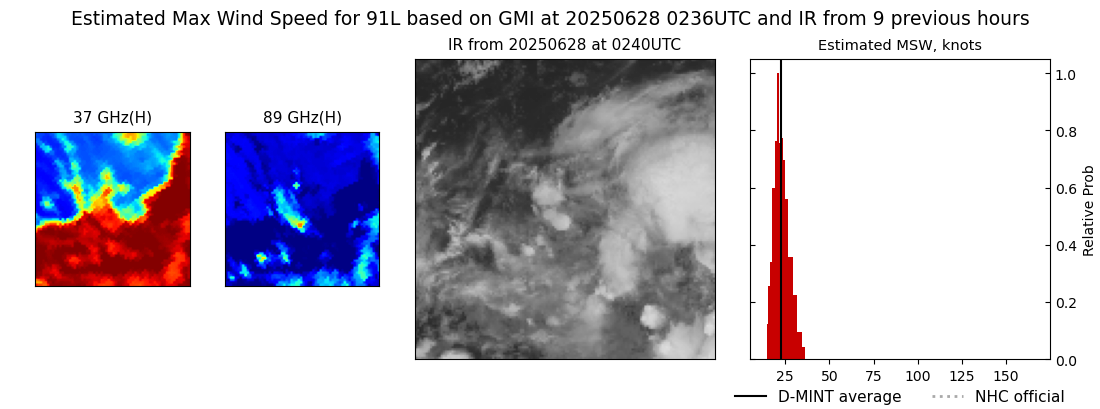 |
| 20250627 | 1949 UTC | AMSR2 | NaN hPa | 24 kts | 21 kts | 28 kts | 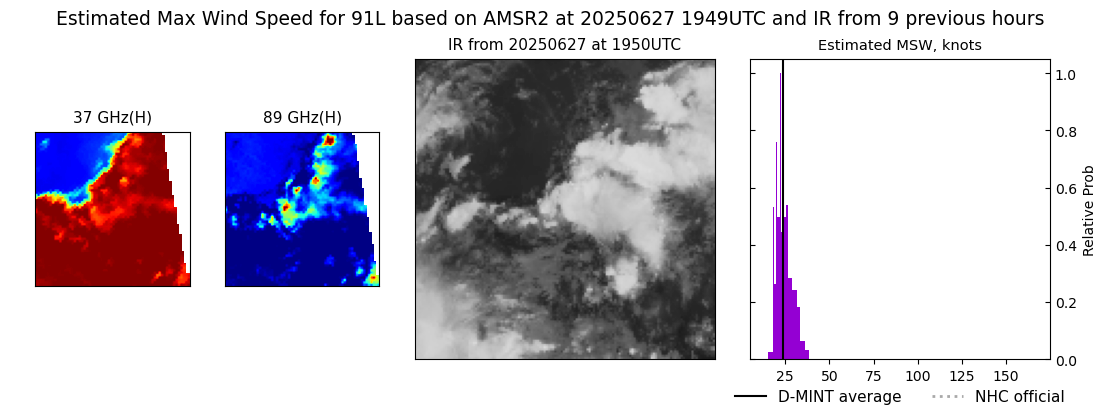 |