|
||

 |
D-MINT HISTORY FILE for 2025_03B
| Date | Time | MW Sensor | MSLP | Vmax (30th-70th percentile average) | Vmax 25th percentile | Vmax 75th percentile | Image |
| 20251030 | 0751 UTC | ATMS-N21 | 996 hPa | 26 kts | 23 kts | 30 kts | 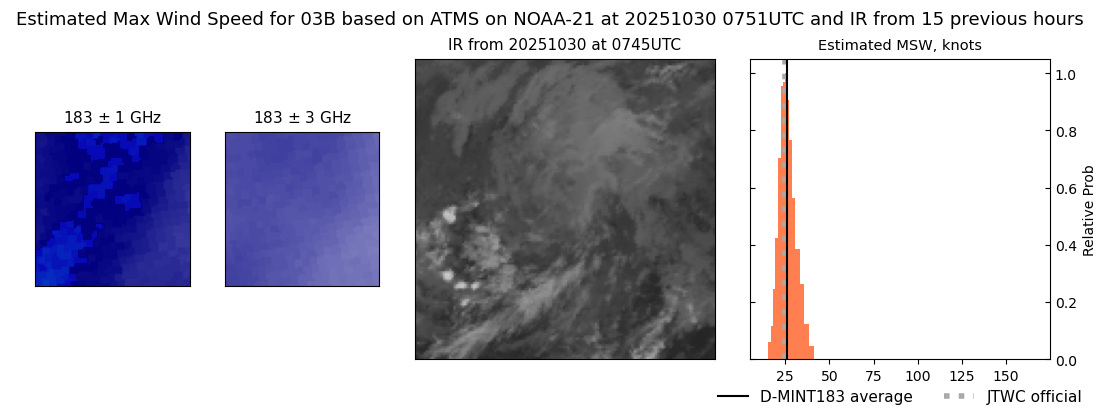 |
| 20251030 | 0505 UTC | AWS | 996 hPa | 27 kts | 24 kts | 31 kts | 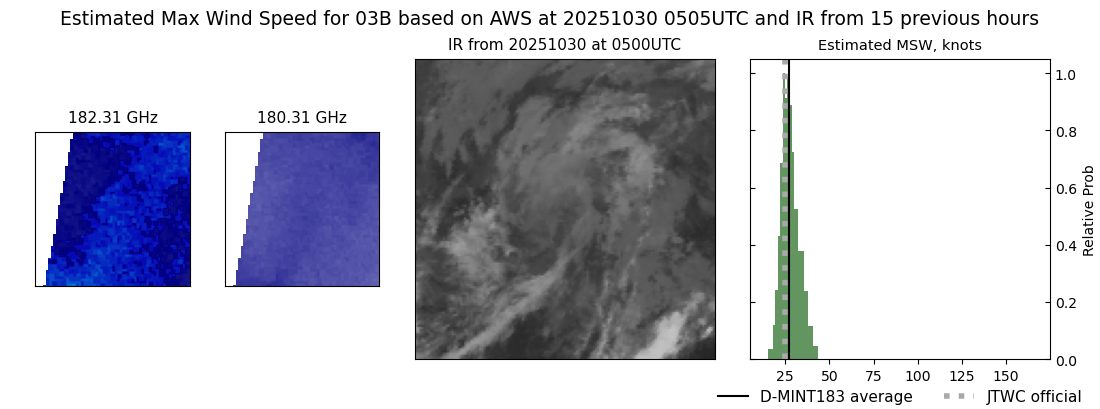 |
| 20251029 | 1211 UTC | WSFM01 | 999 hPa | 30 kts | 27 kts | 33 kts |  |
| 20251029 | 0810 UTC | ATMS-N21 | 994 hPa | 35 kts | 31 kts | 39 kts | 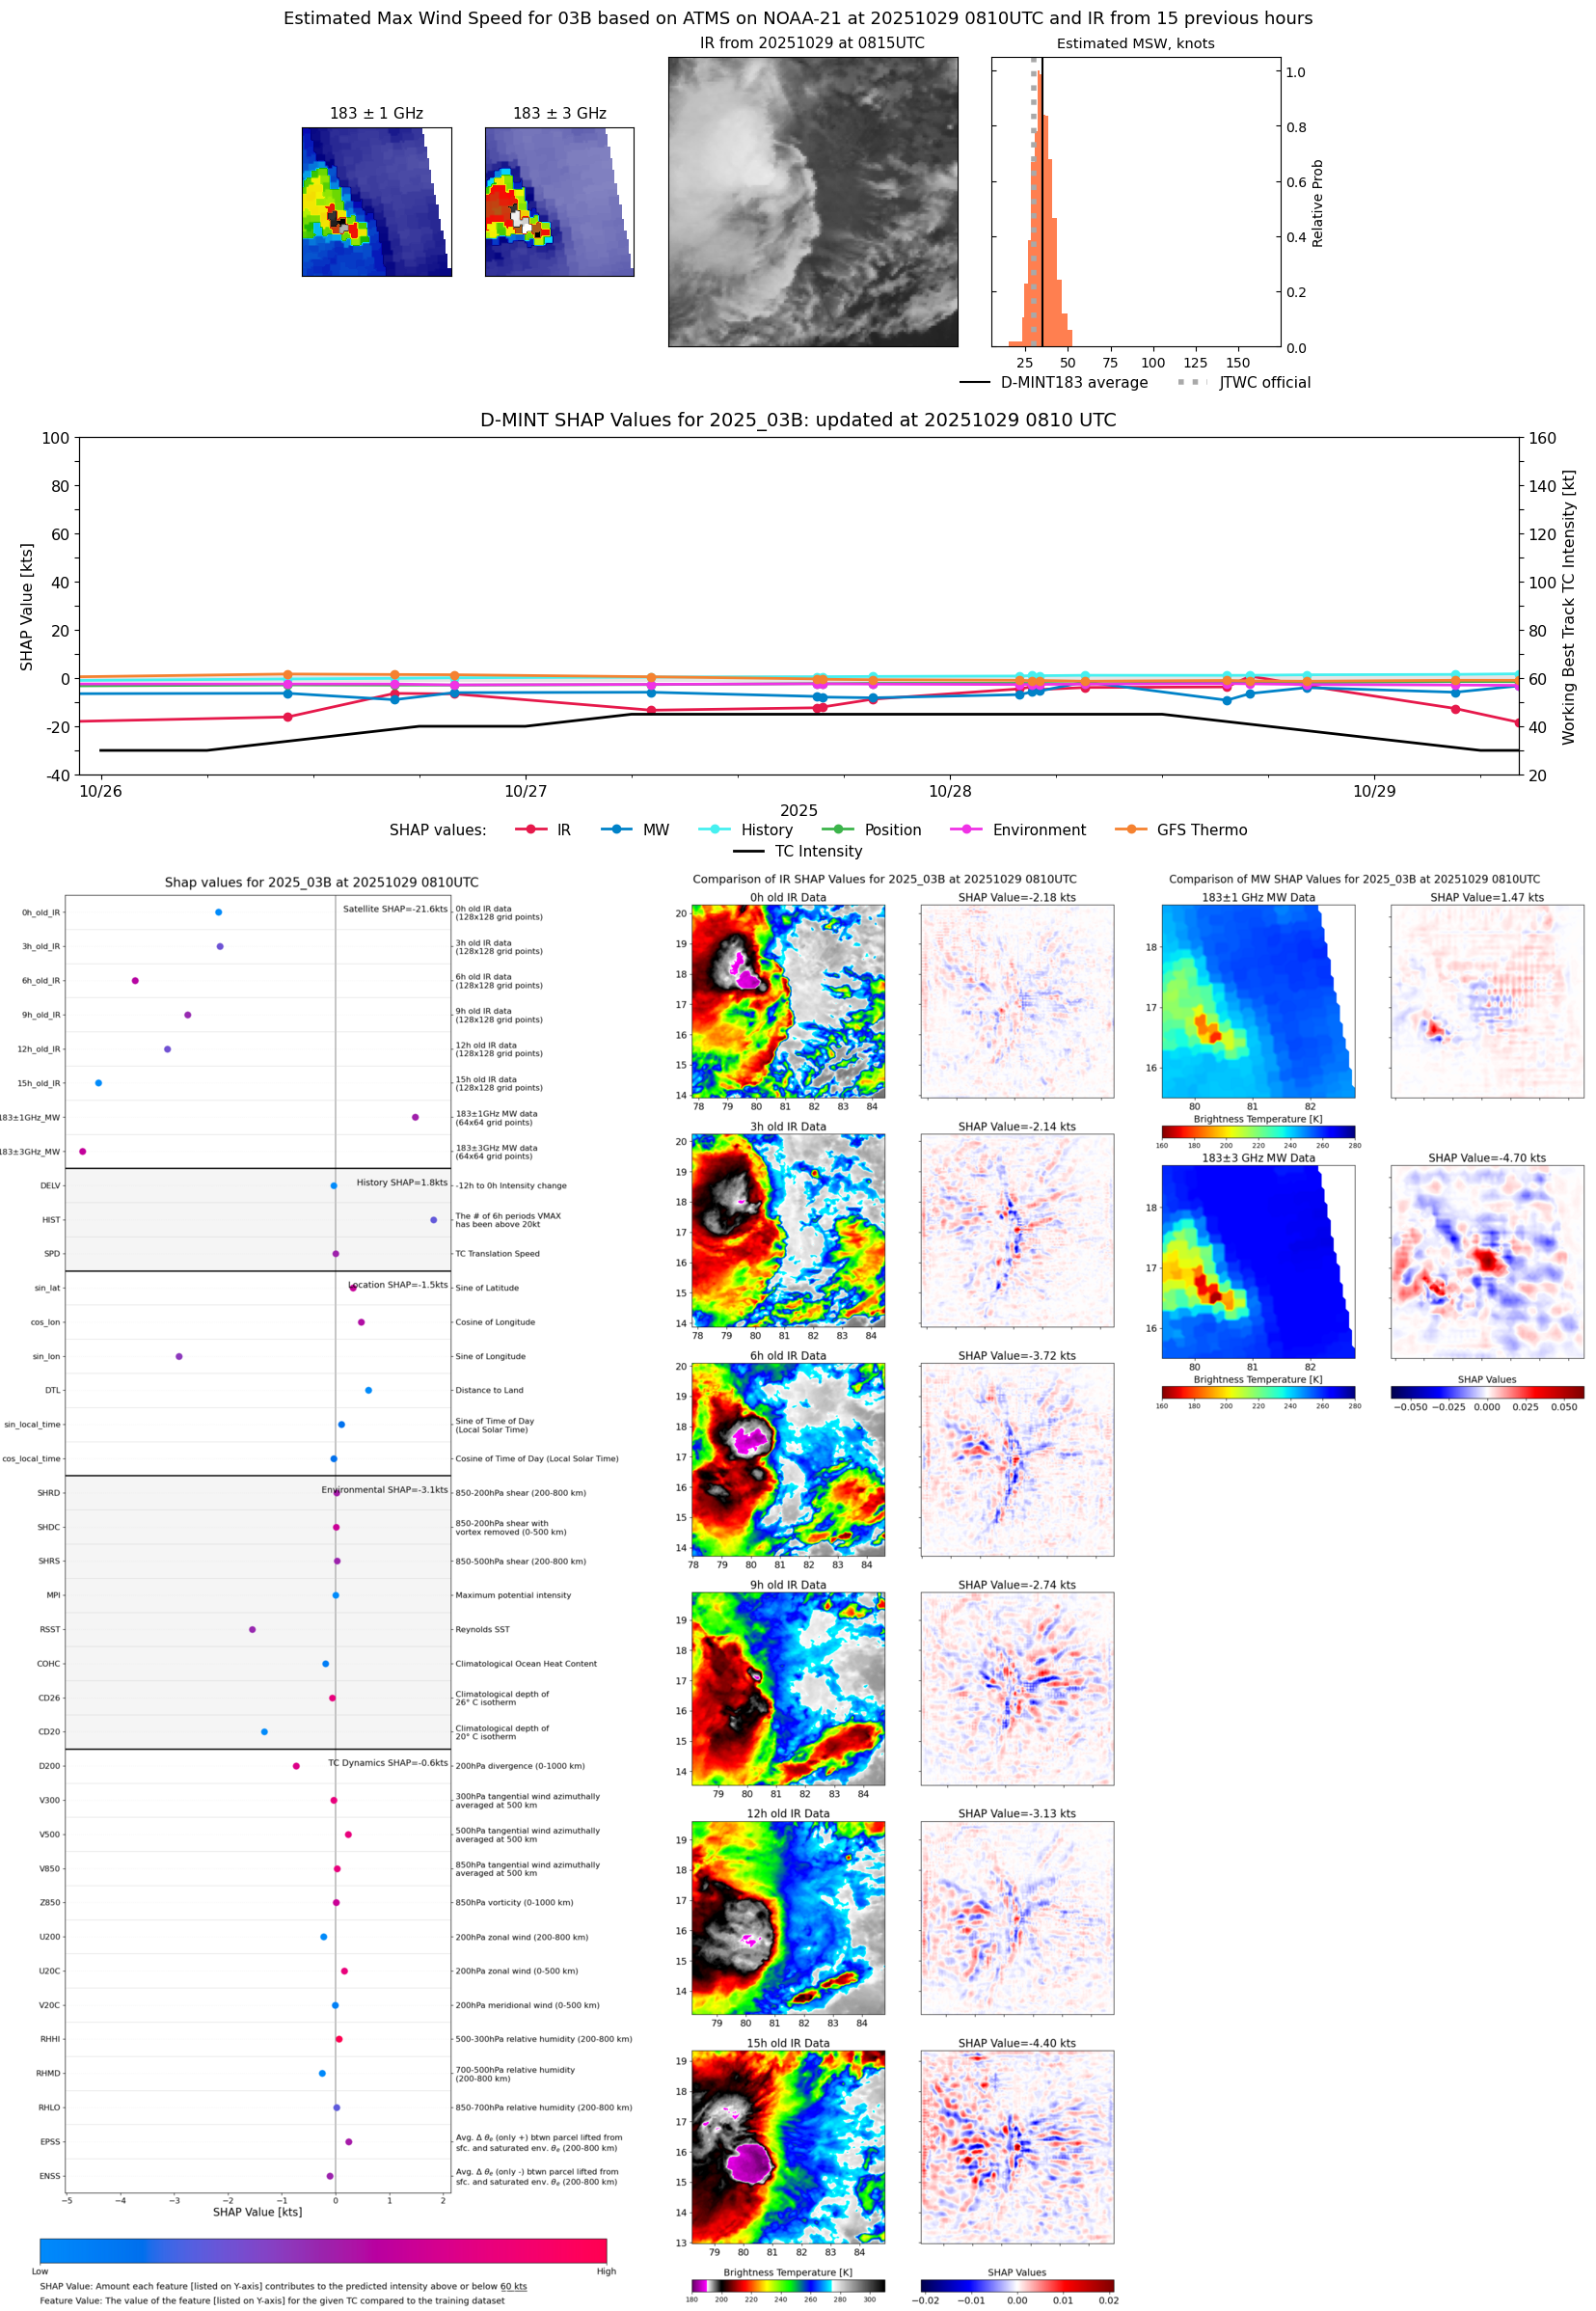 |
| 20251029 | 0434 UTC | TMS05 | 994 hPa | 38 kts | 34 kts | 43 kts |  |
| 20251029 | 0157 UTC | SSMISF16 | 997 hPa | 38 kts | 32 kts | 44 kts |  |
| 20251029 | 0101 UTC | WSFM01 | 997 hPa | 39 kts | 34 kts | 46 kts | 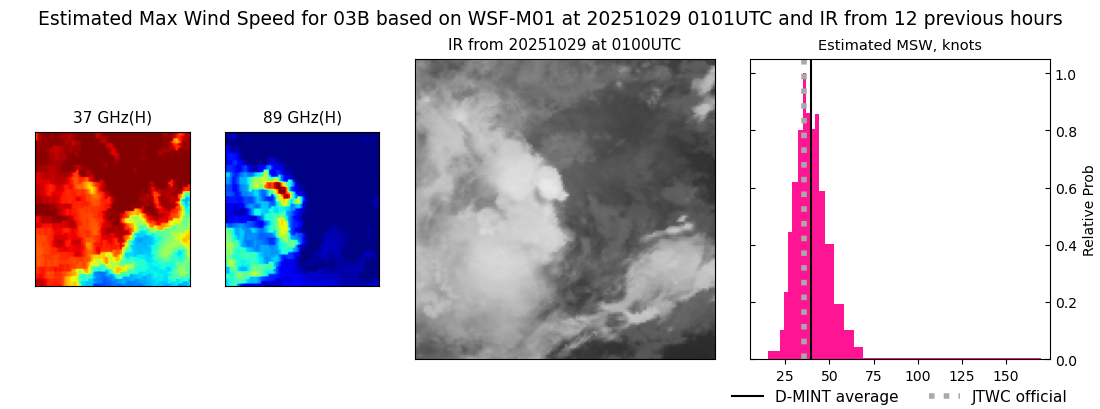 |
| 20251029 | 0054 UTC | SSMISF17 | 996 hPa | 41 kts | 35 kts | 47 kts | 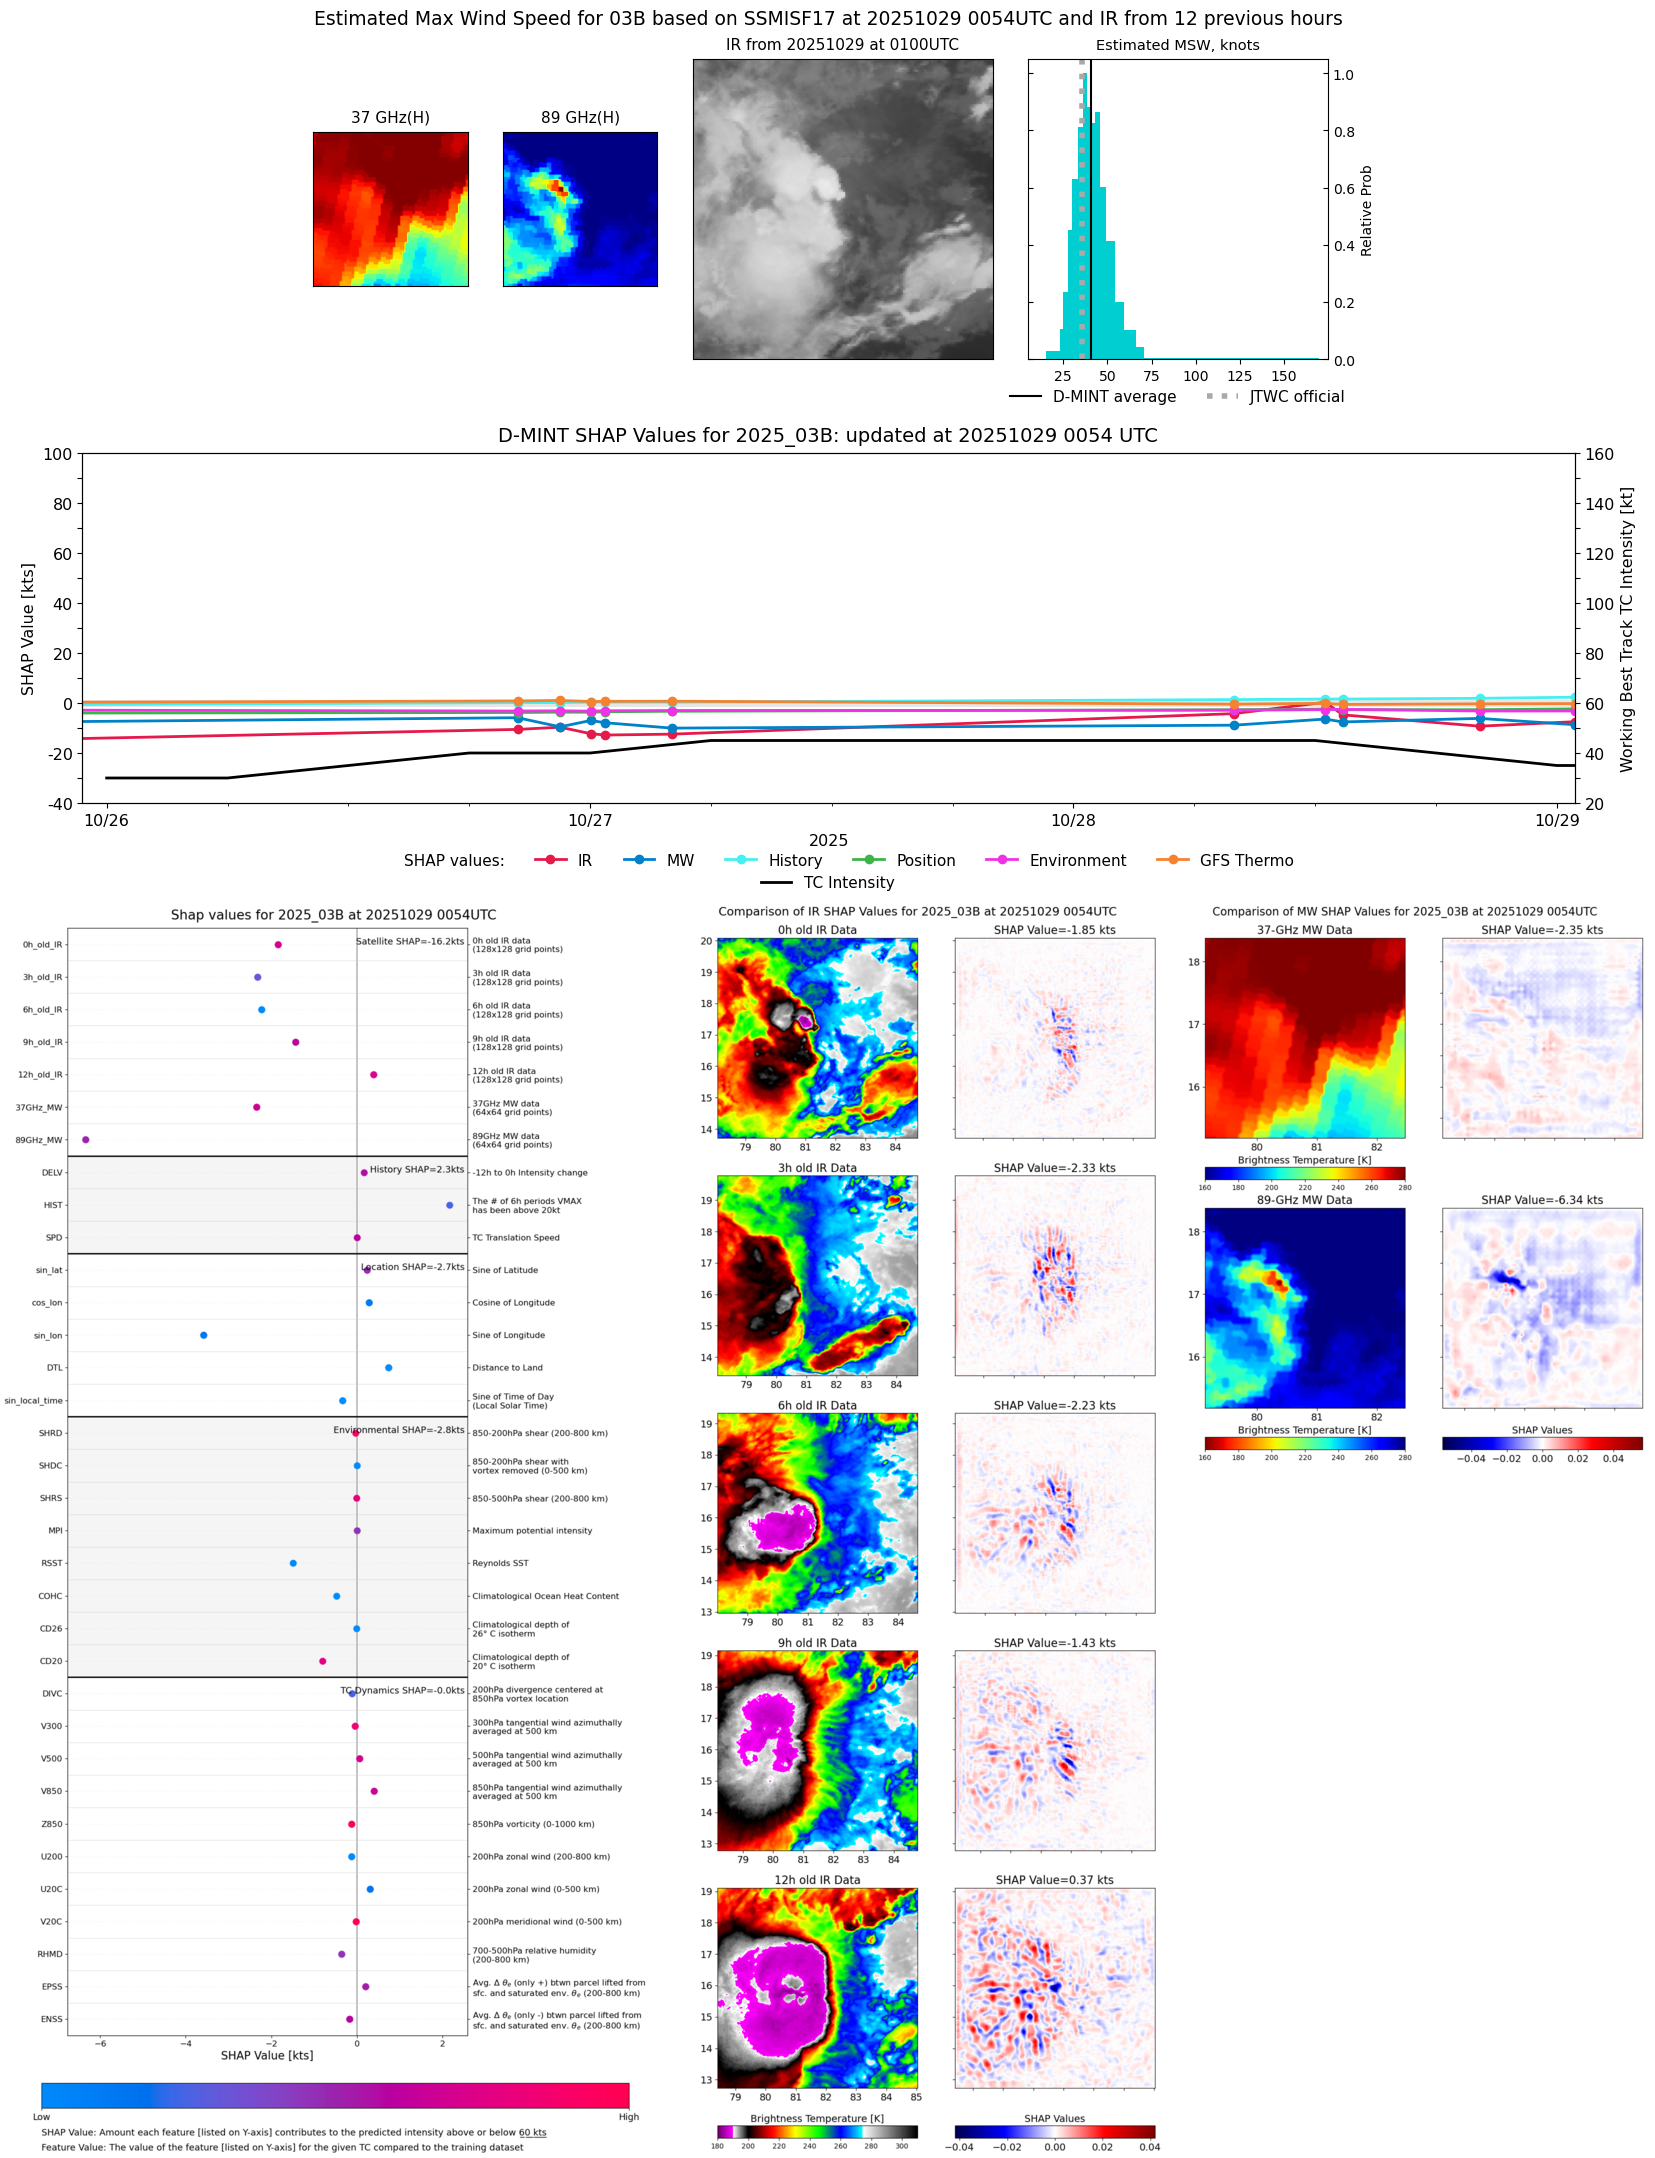 |
| 20251028 | 2010 UTC | AMSR2 | 995 hPa | 40 kts | 35 kts | 46 kts | 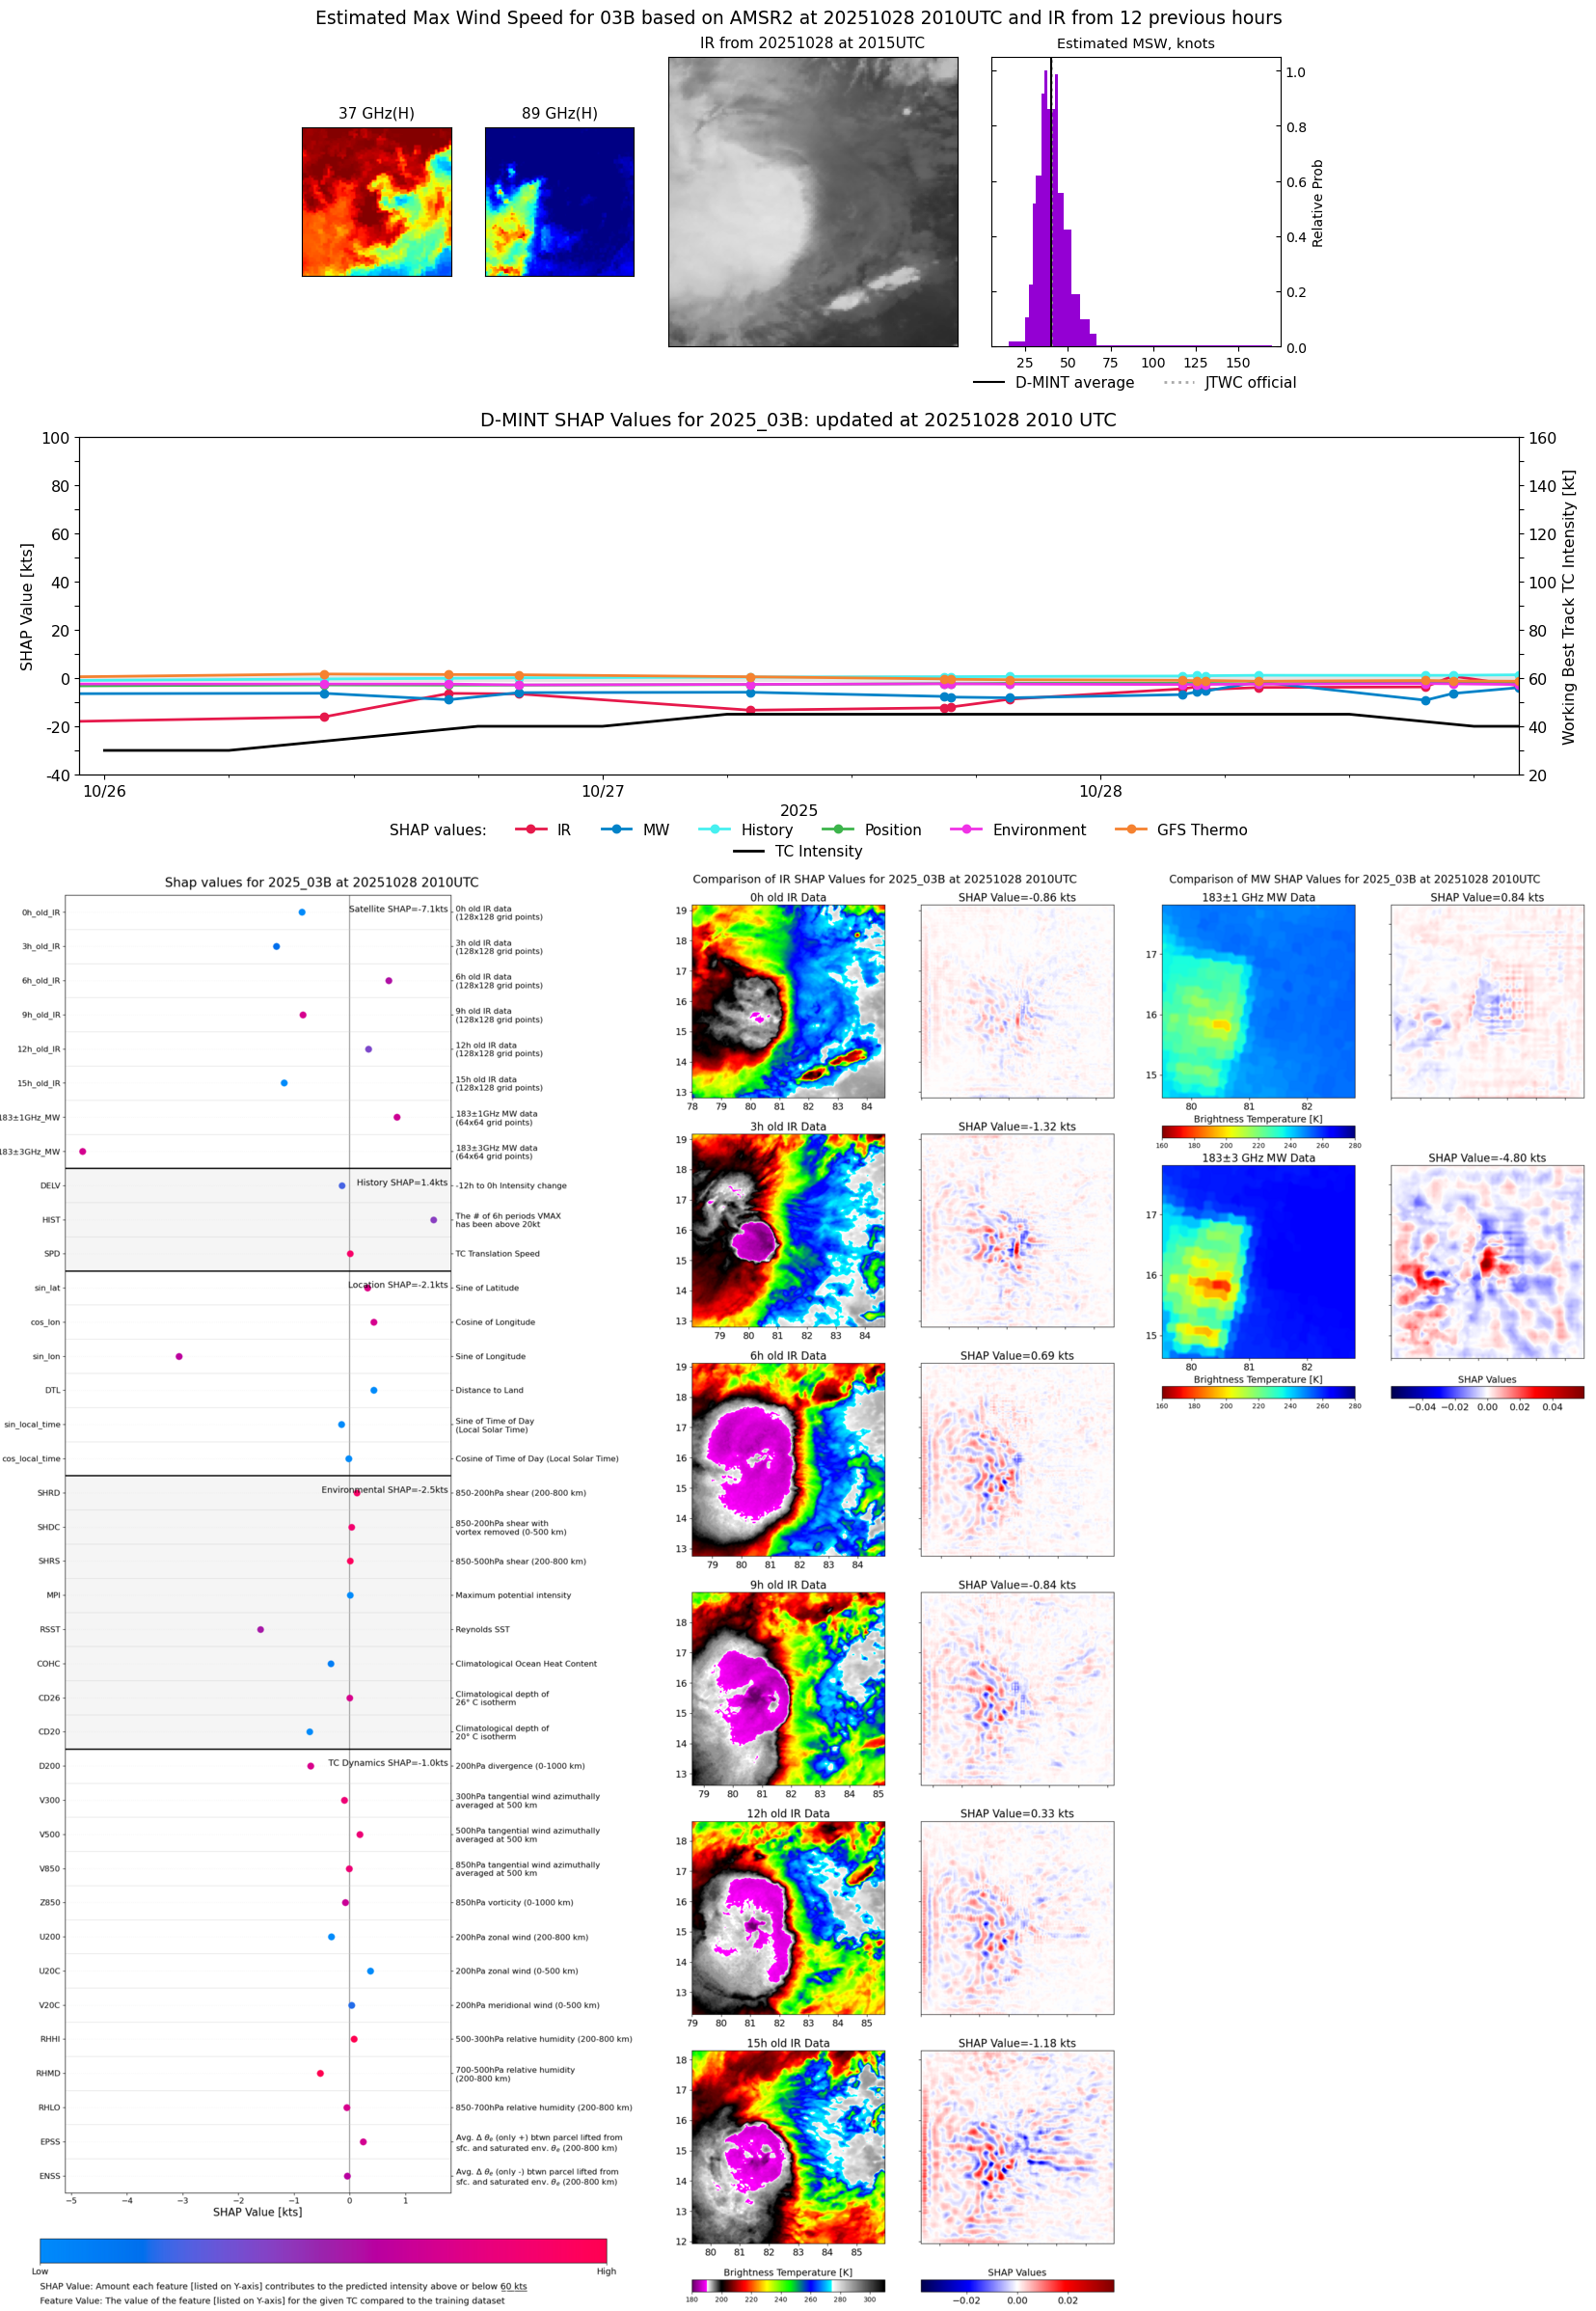 |
| 20251028 | 2010 UTC | ATMS-N20 | 987 hPa | 49 kts | 44 kts | 54 kts | 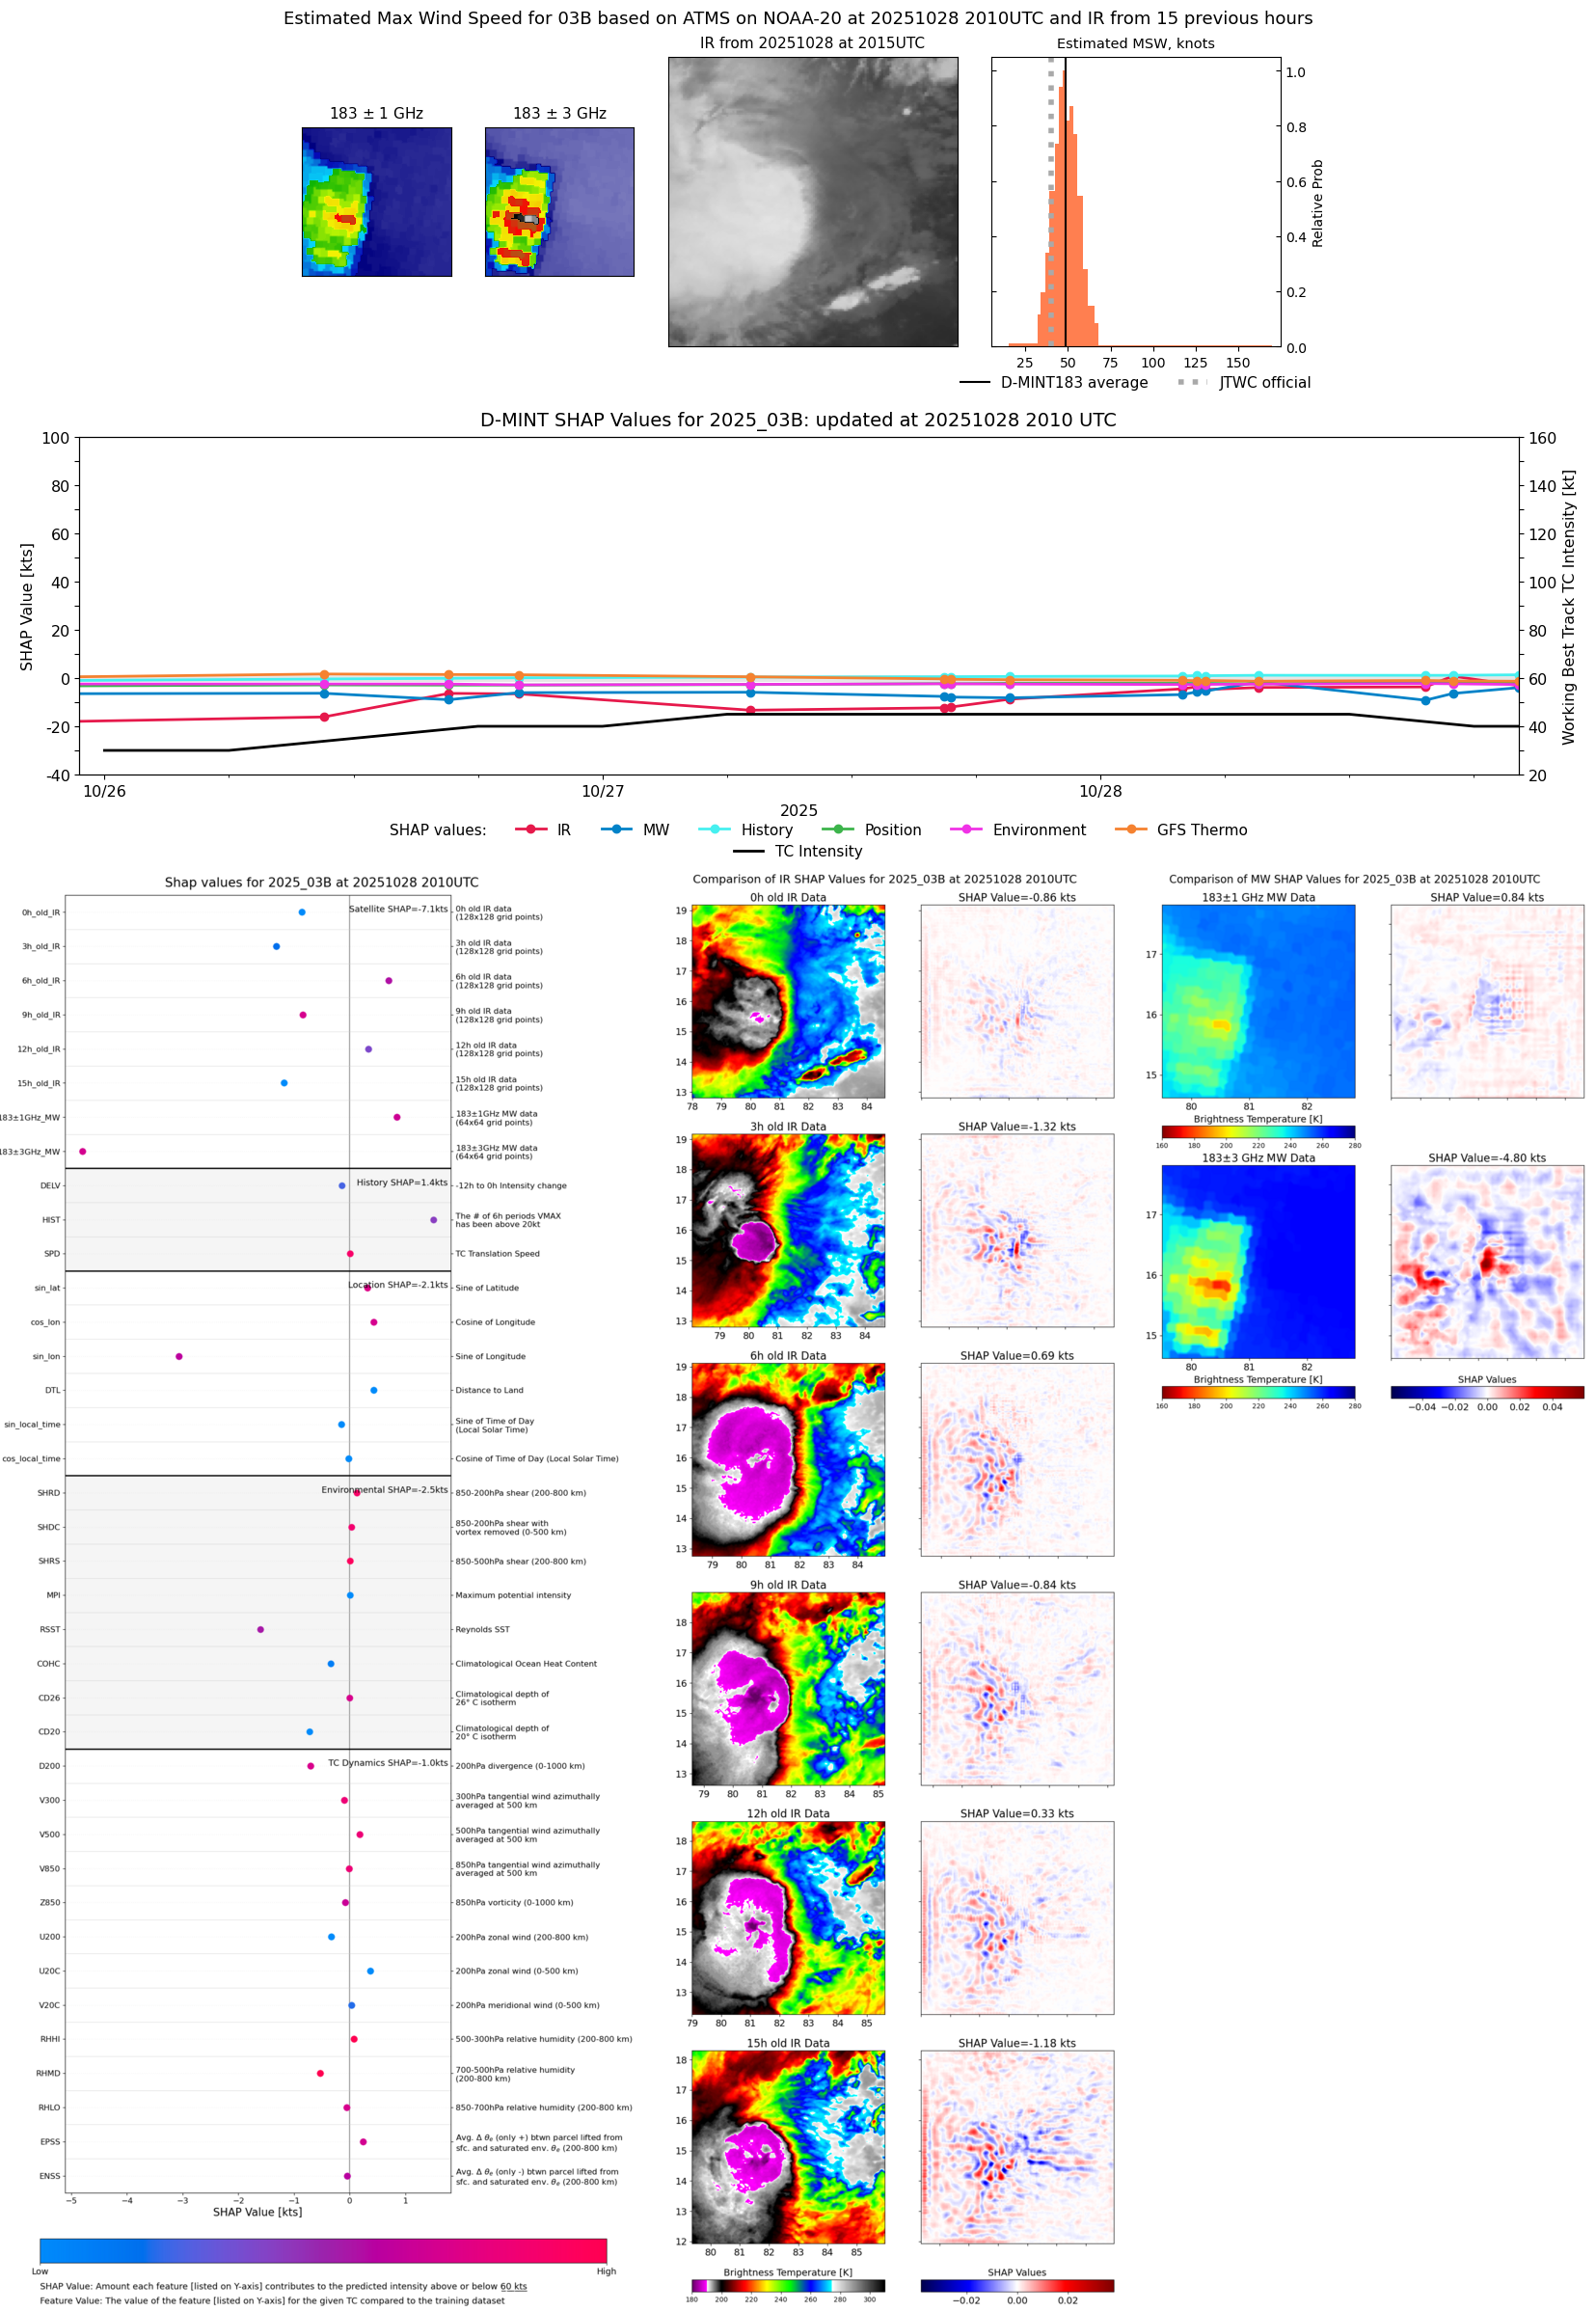 |
| 20251028 | 1659 UTC | AWS | 989 hPa | 50 kts | 45 kts | 56 kts | 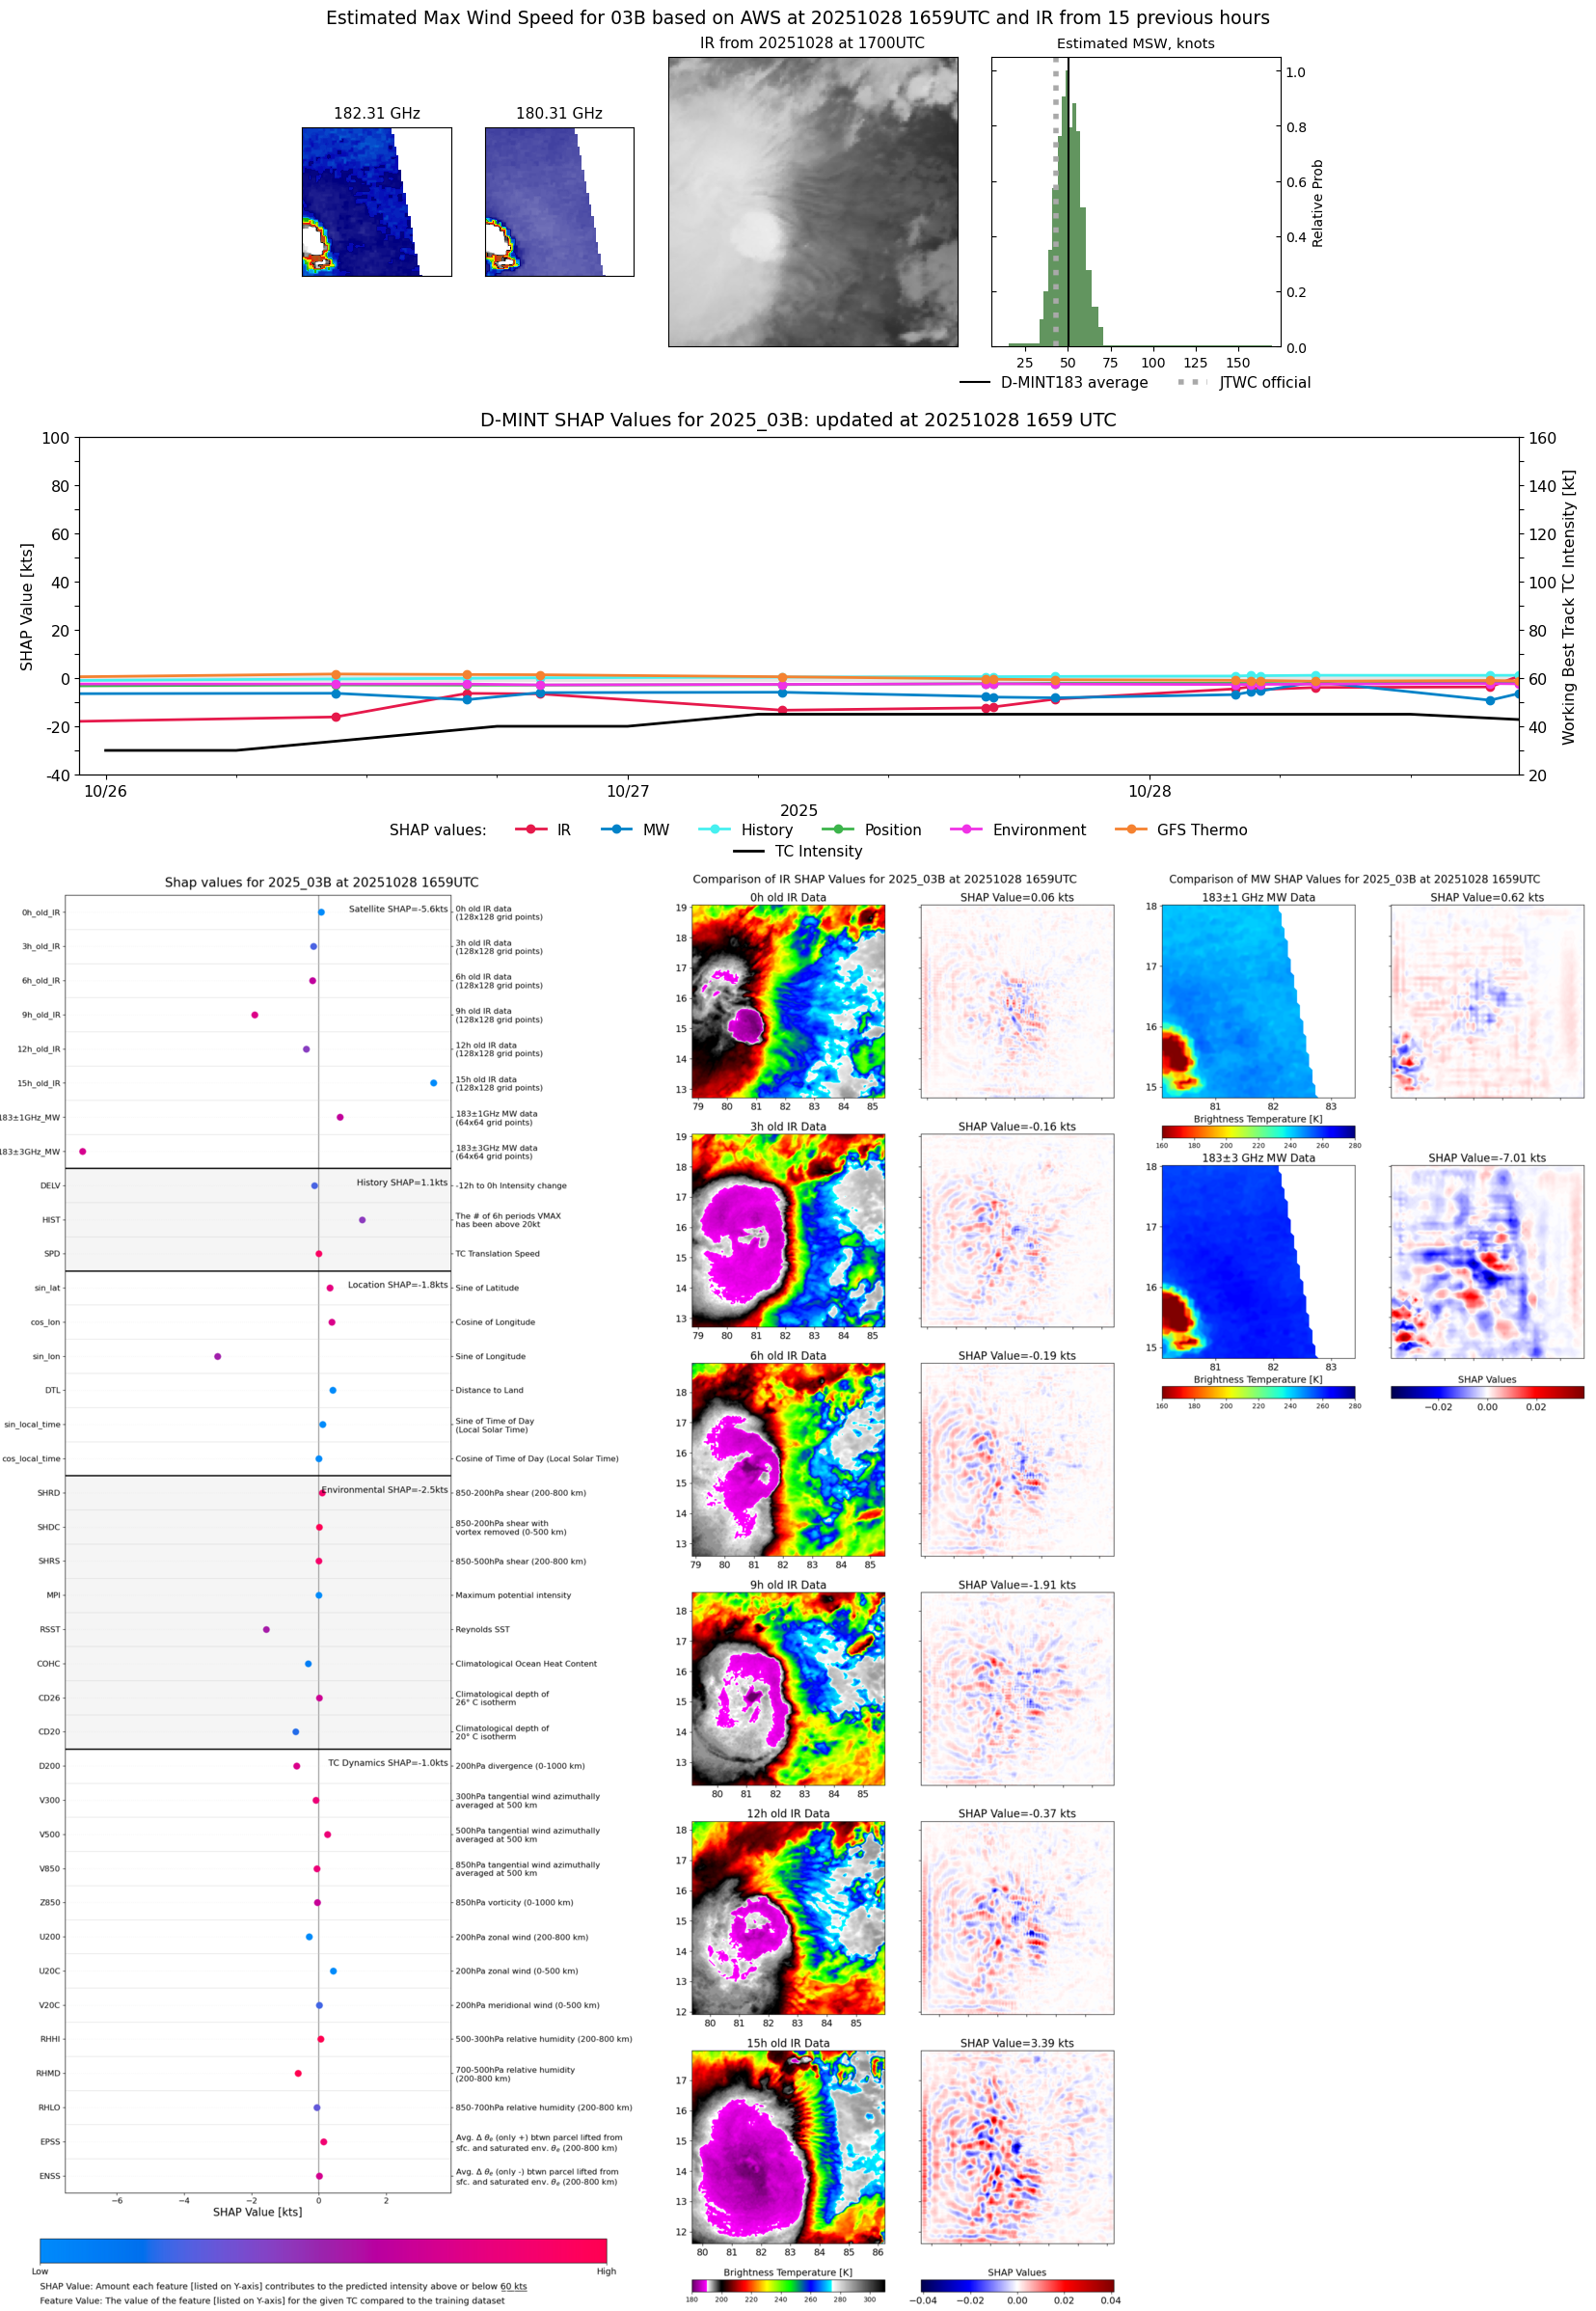 |
| 20251028 | 1638 UTC | GMI | 996 hPa | 37 kts | 32 kts | 42 kts | 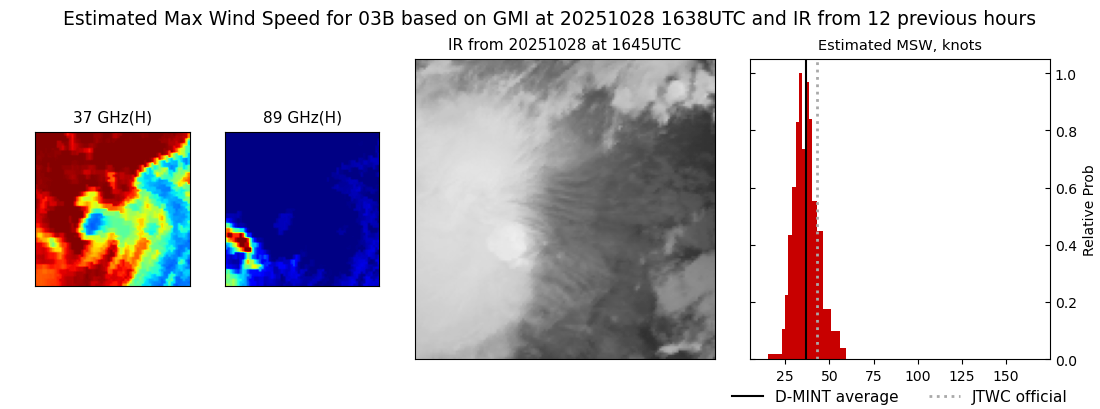 |
| 20251028 | 1540 UTC | TROPICS03 | 989 hPa | 44 kts | 39 kts | 48 kts |  |
| 20251028 | 1322 UTC | SSMISF16 | 993 hPa | 44 kts | 38 kts | 50 kts | 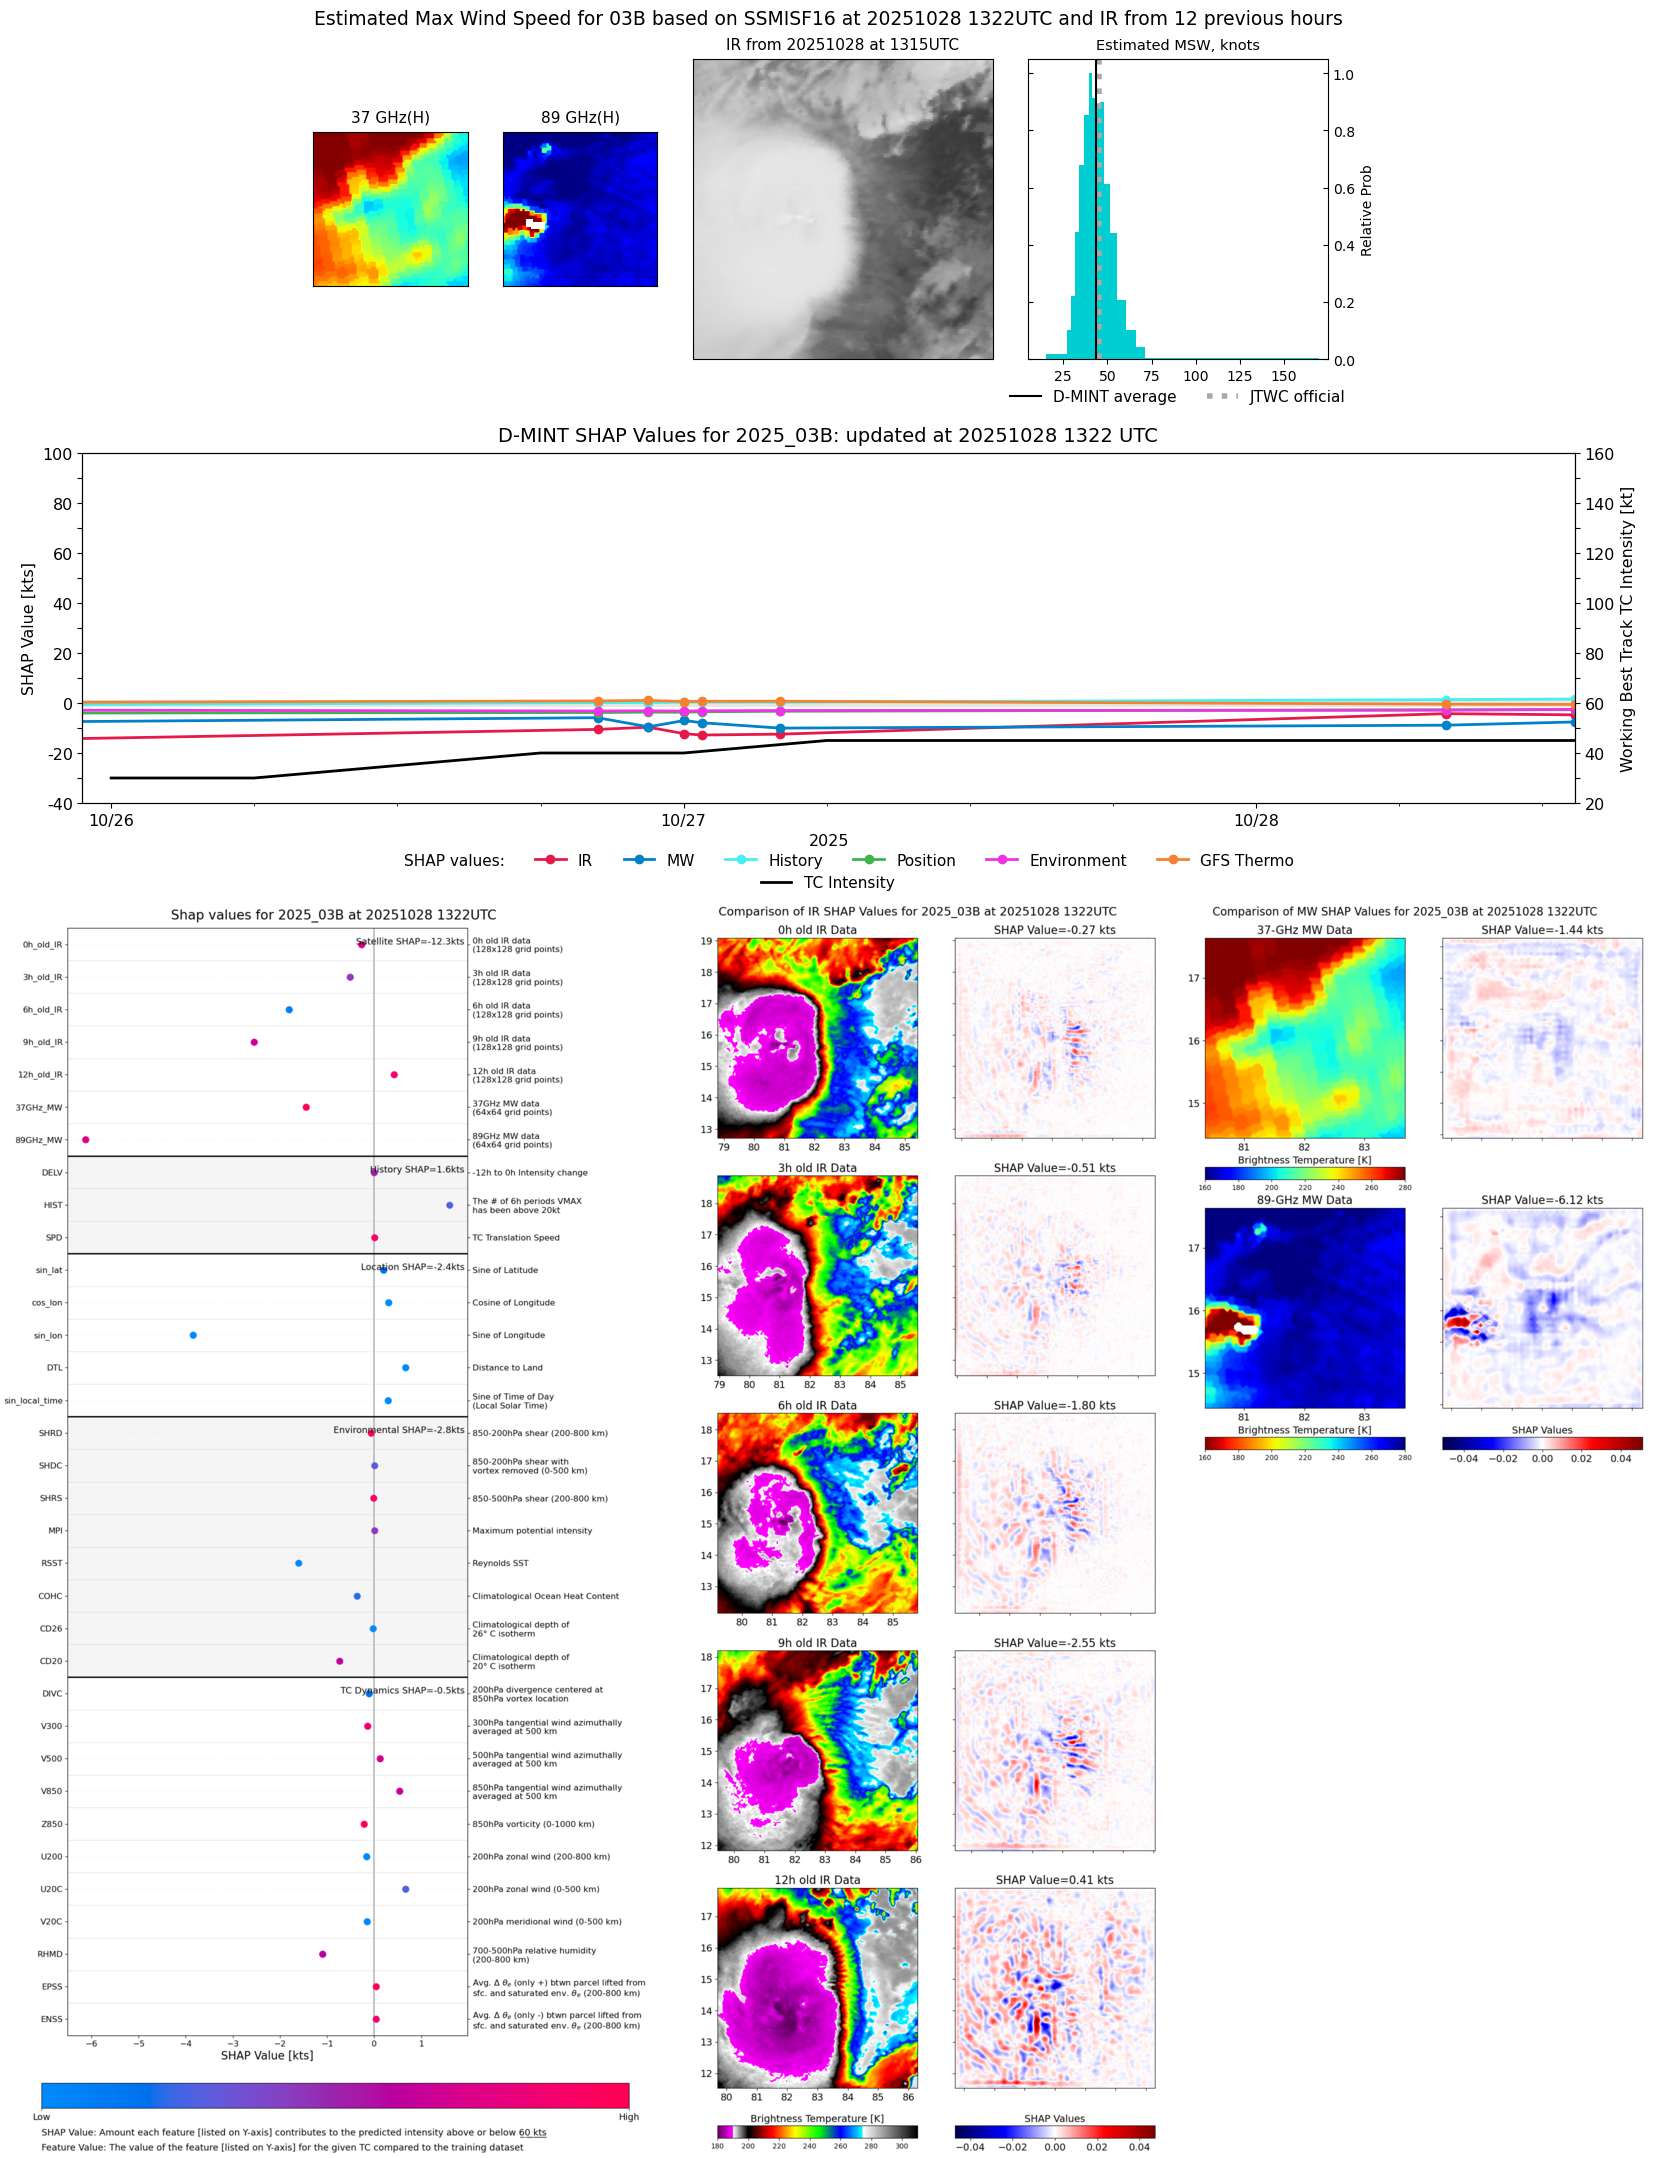 |
| 20251028 | 1230 UTC | WSFM01 | 993 hPa | 50 kts | 44 kts | 57 kts | 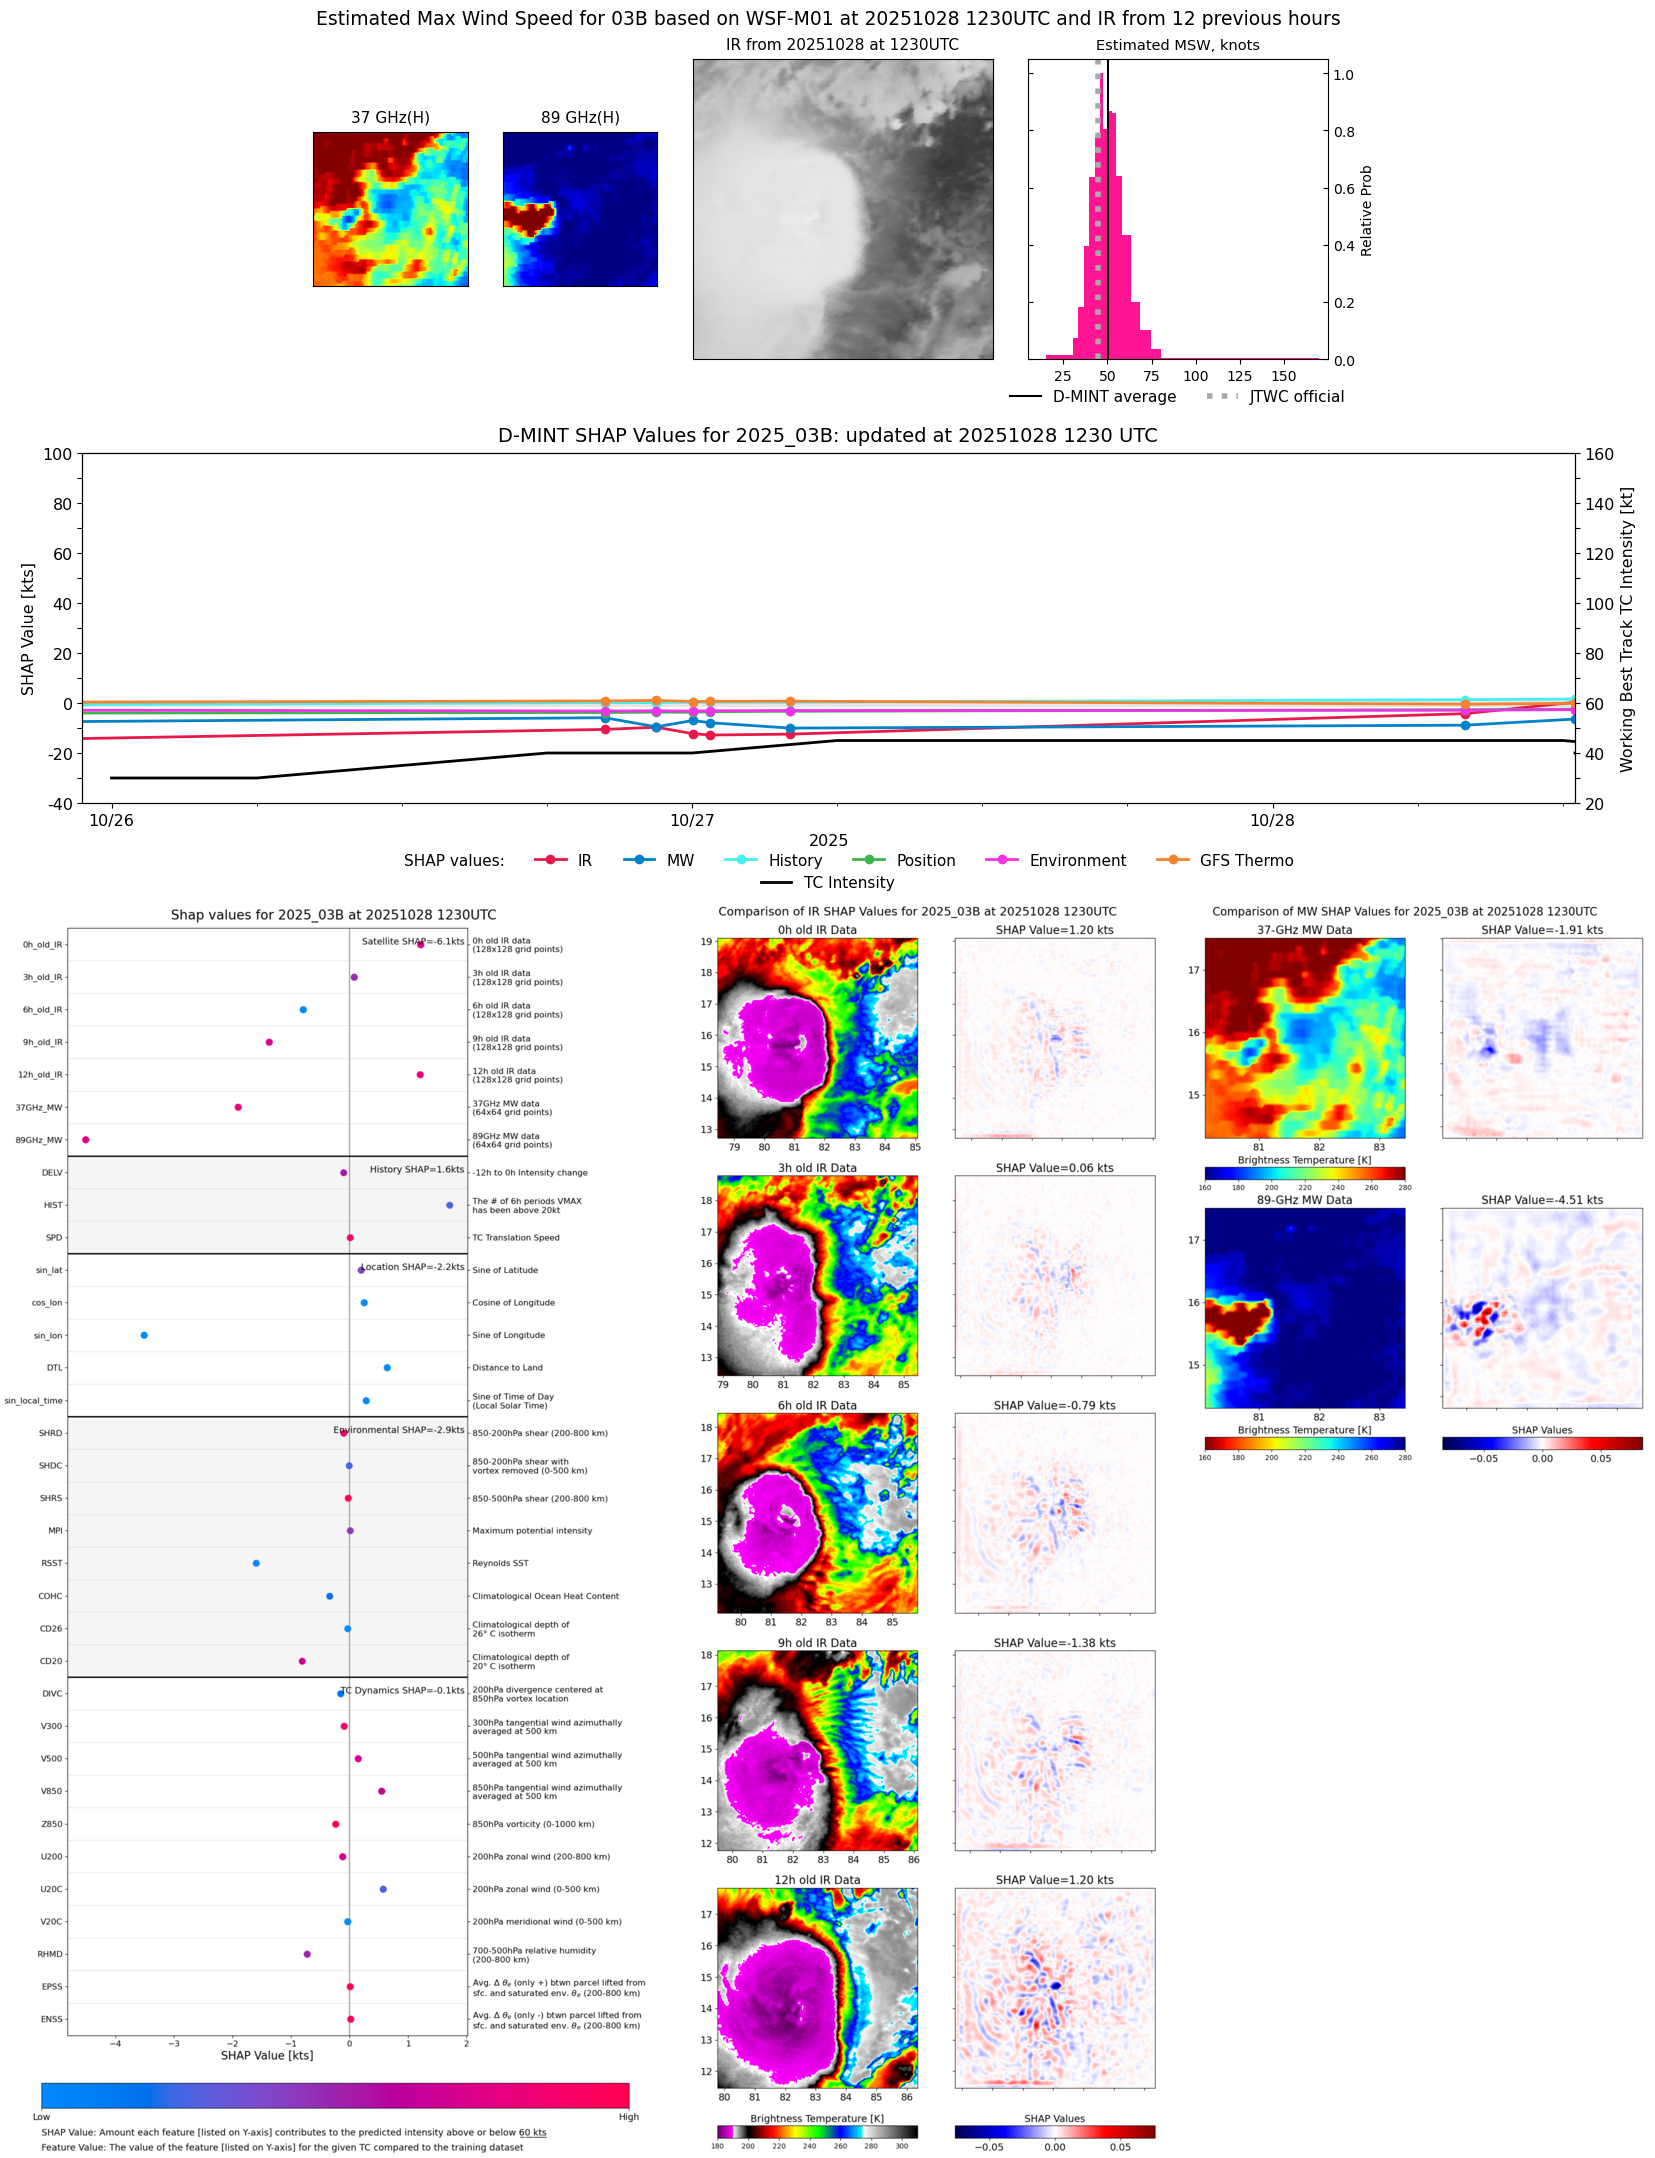 |
| 20251028 | 1219 UTC | SSMISF17 | 992 hPa | 52 kts | 45 kts | 59 kts |  |
| 20251028 | 0757 UTC | AMSR2 | 997 hPa | 42 kts | 37 kts | 48 kts |  |
| 20251028 | 0738 UTC | ATMS-N20 | 992 hPa | 50 kts | 45 kts | 55 kts | 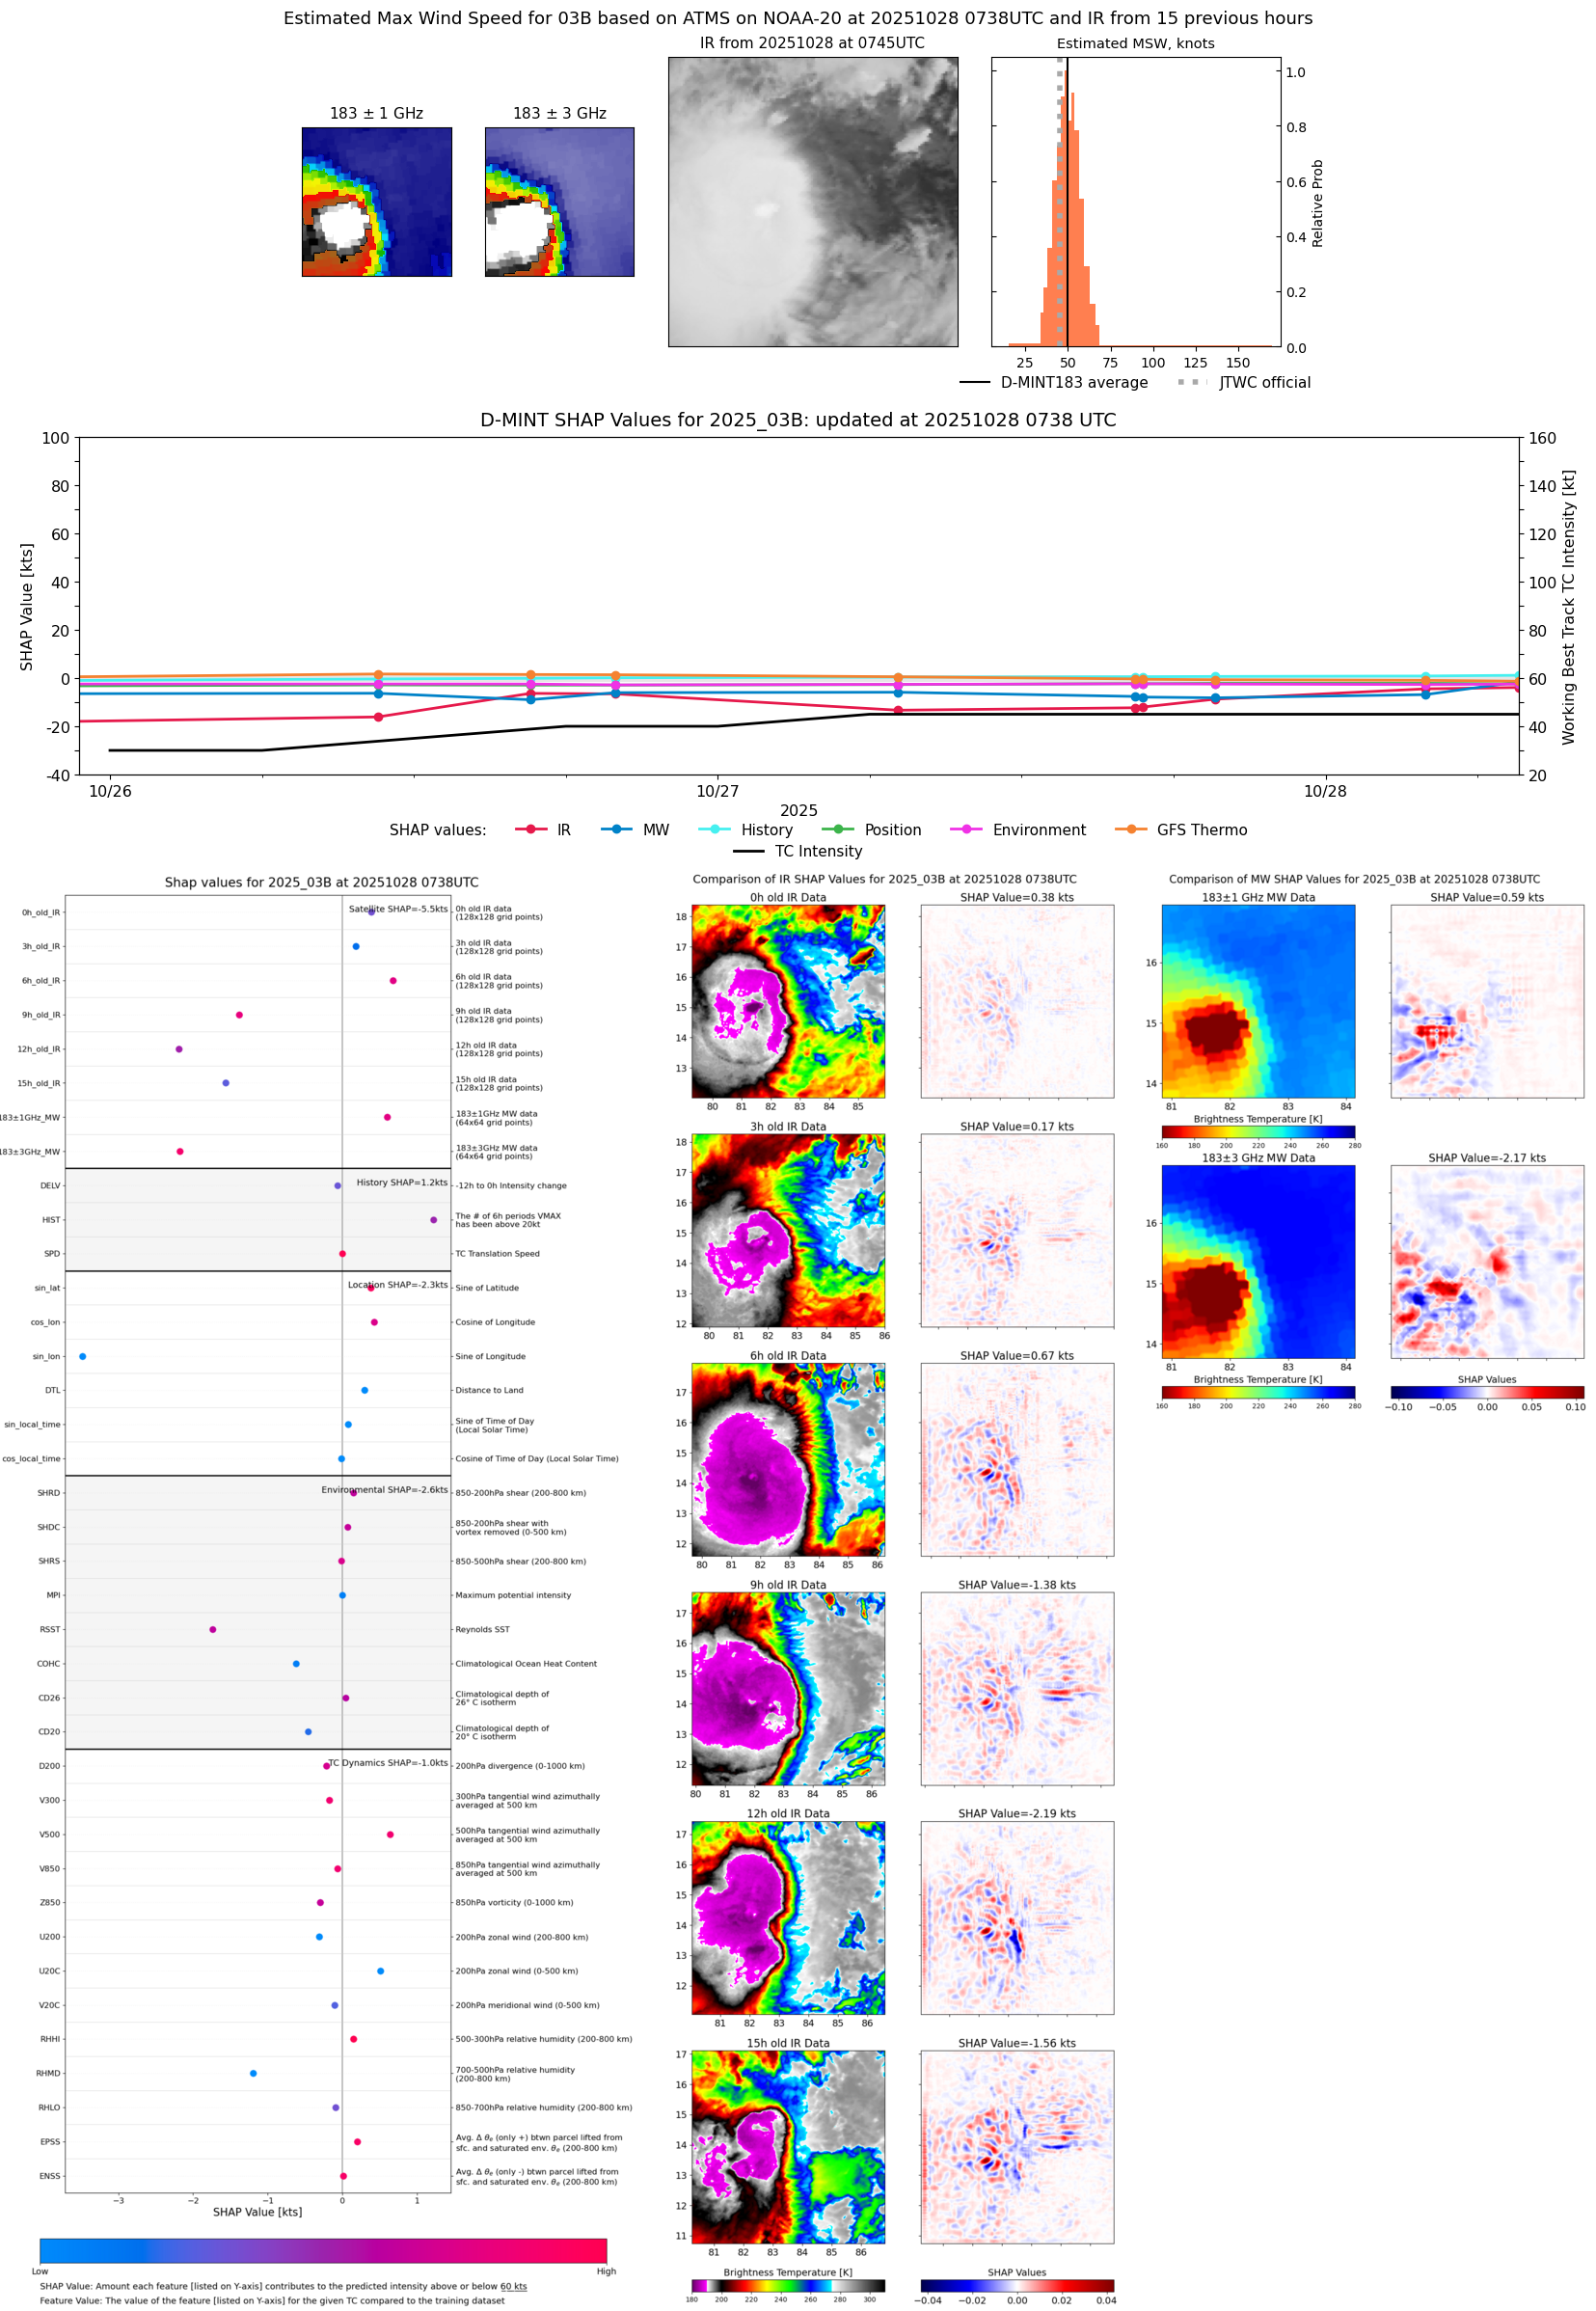 |
| 20251028 | 0505 UTC | TMS02 | 995 hPa | 46 kts | 41 kts | 50 kts | 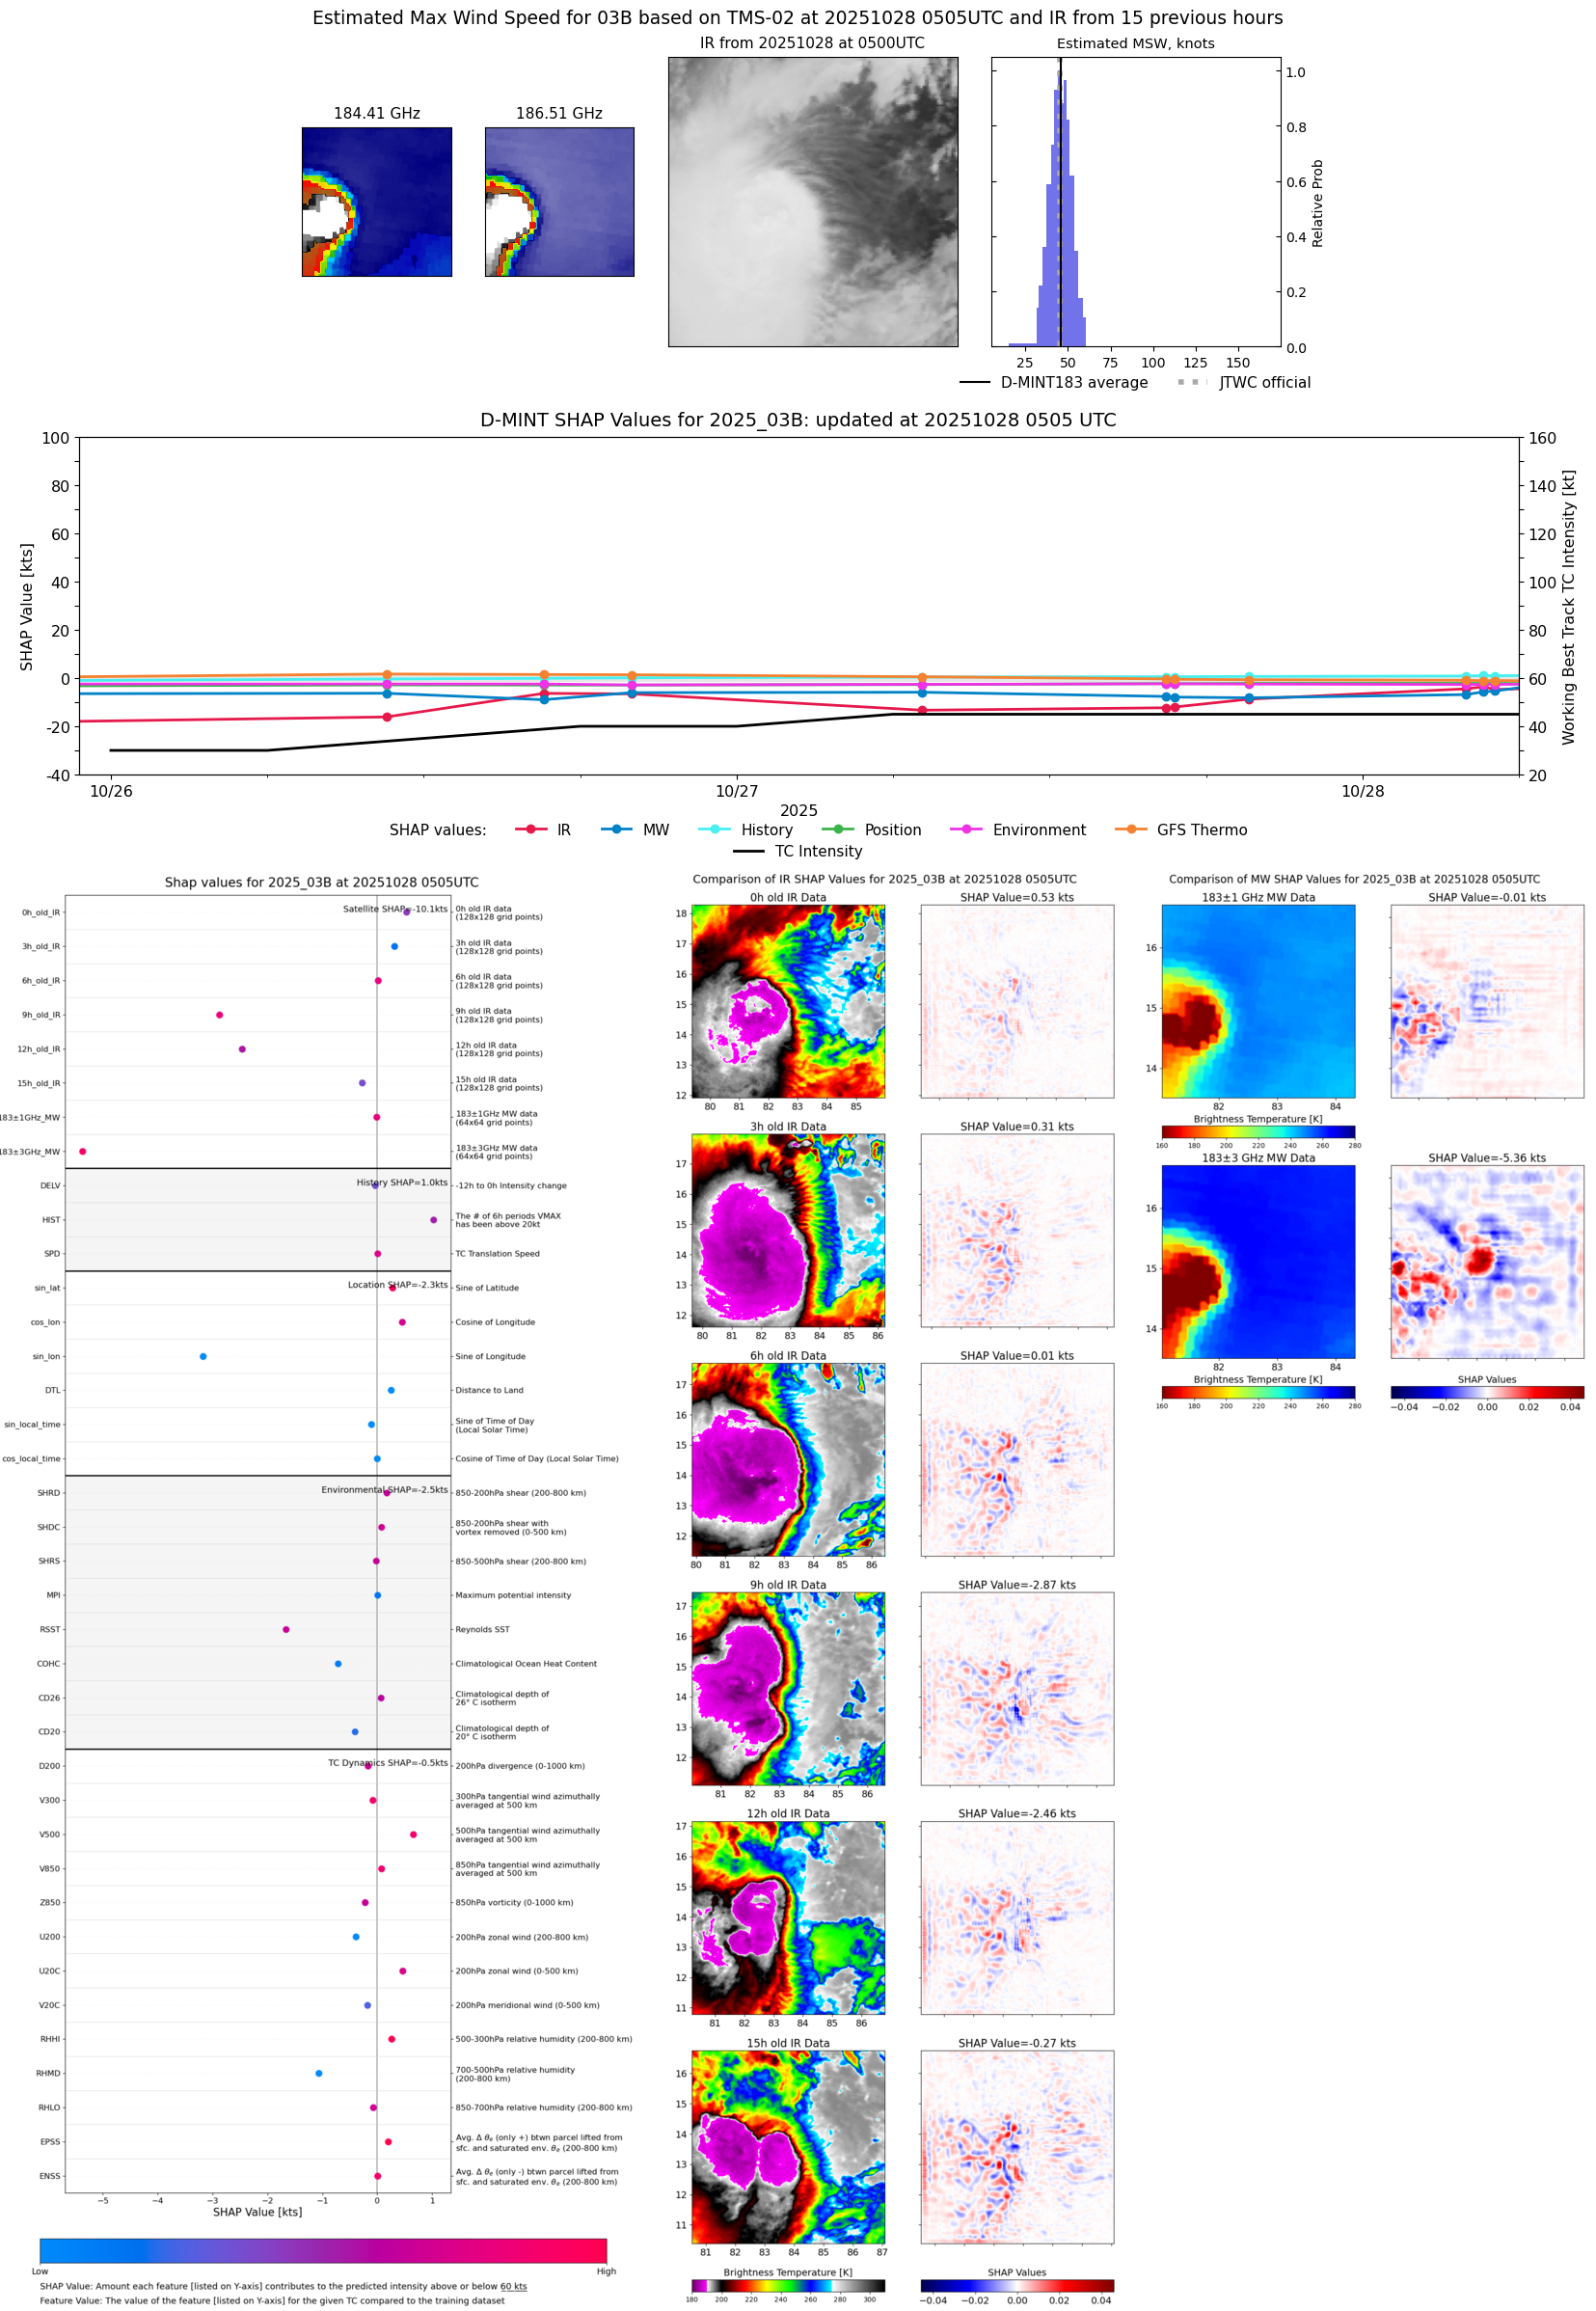 |
| 20251028 | 0439 UTC | TMS05 | 995 hPa | 46 kts | 42 kts | 51 kts | 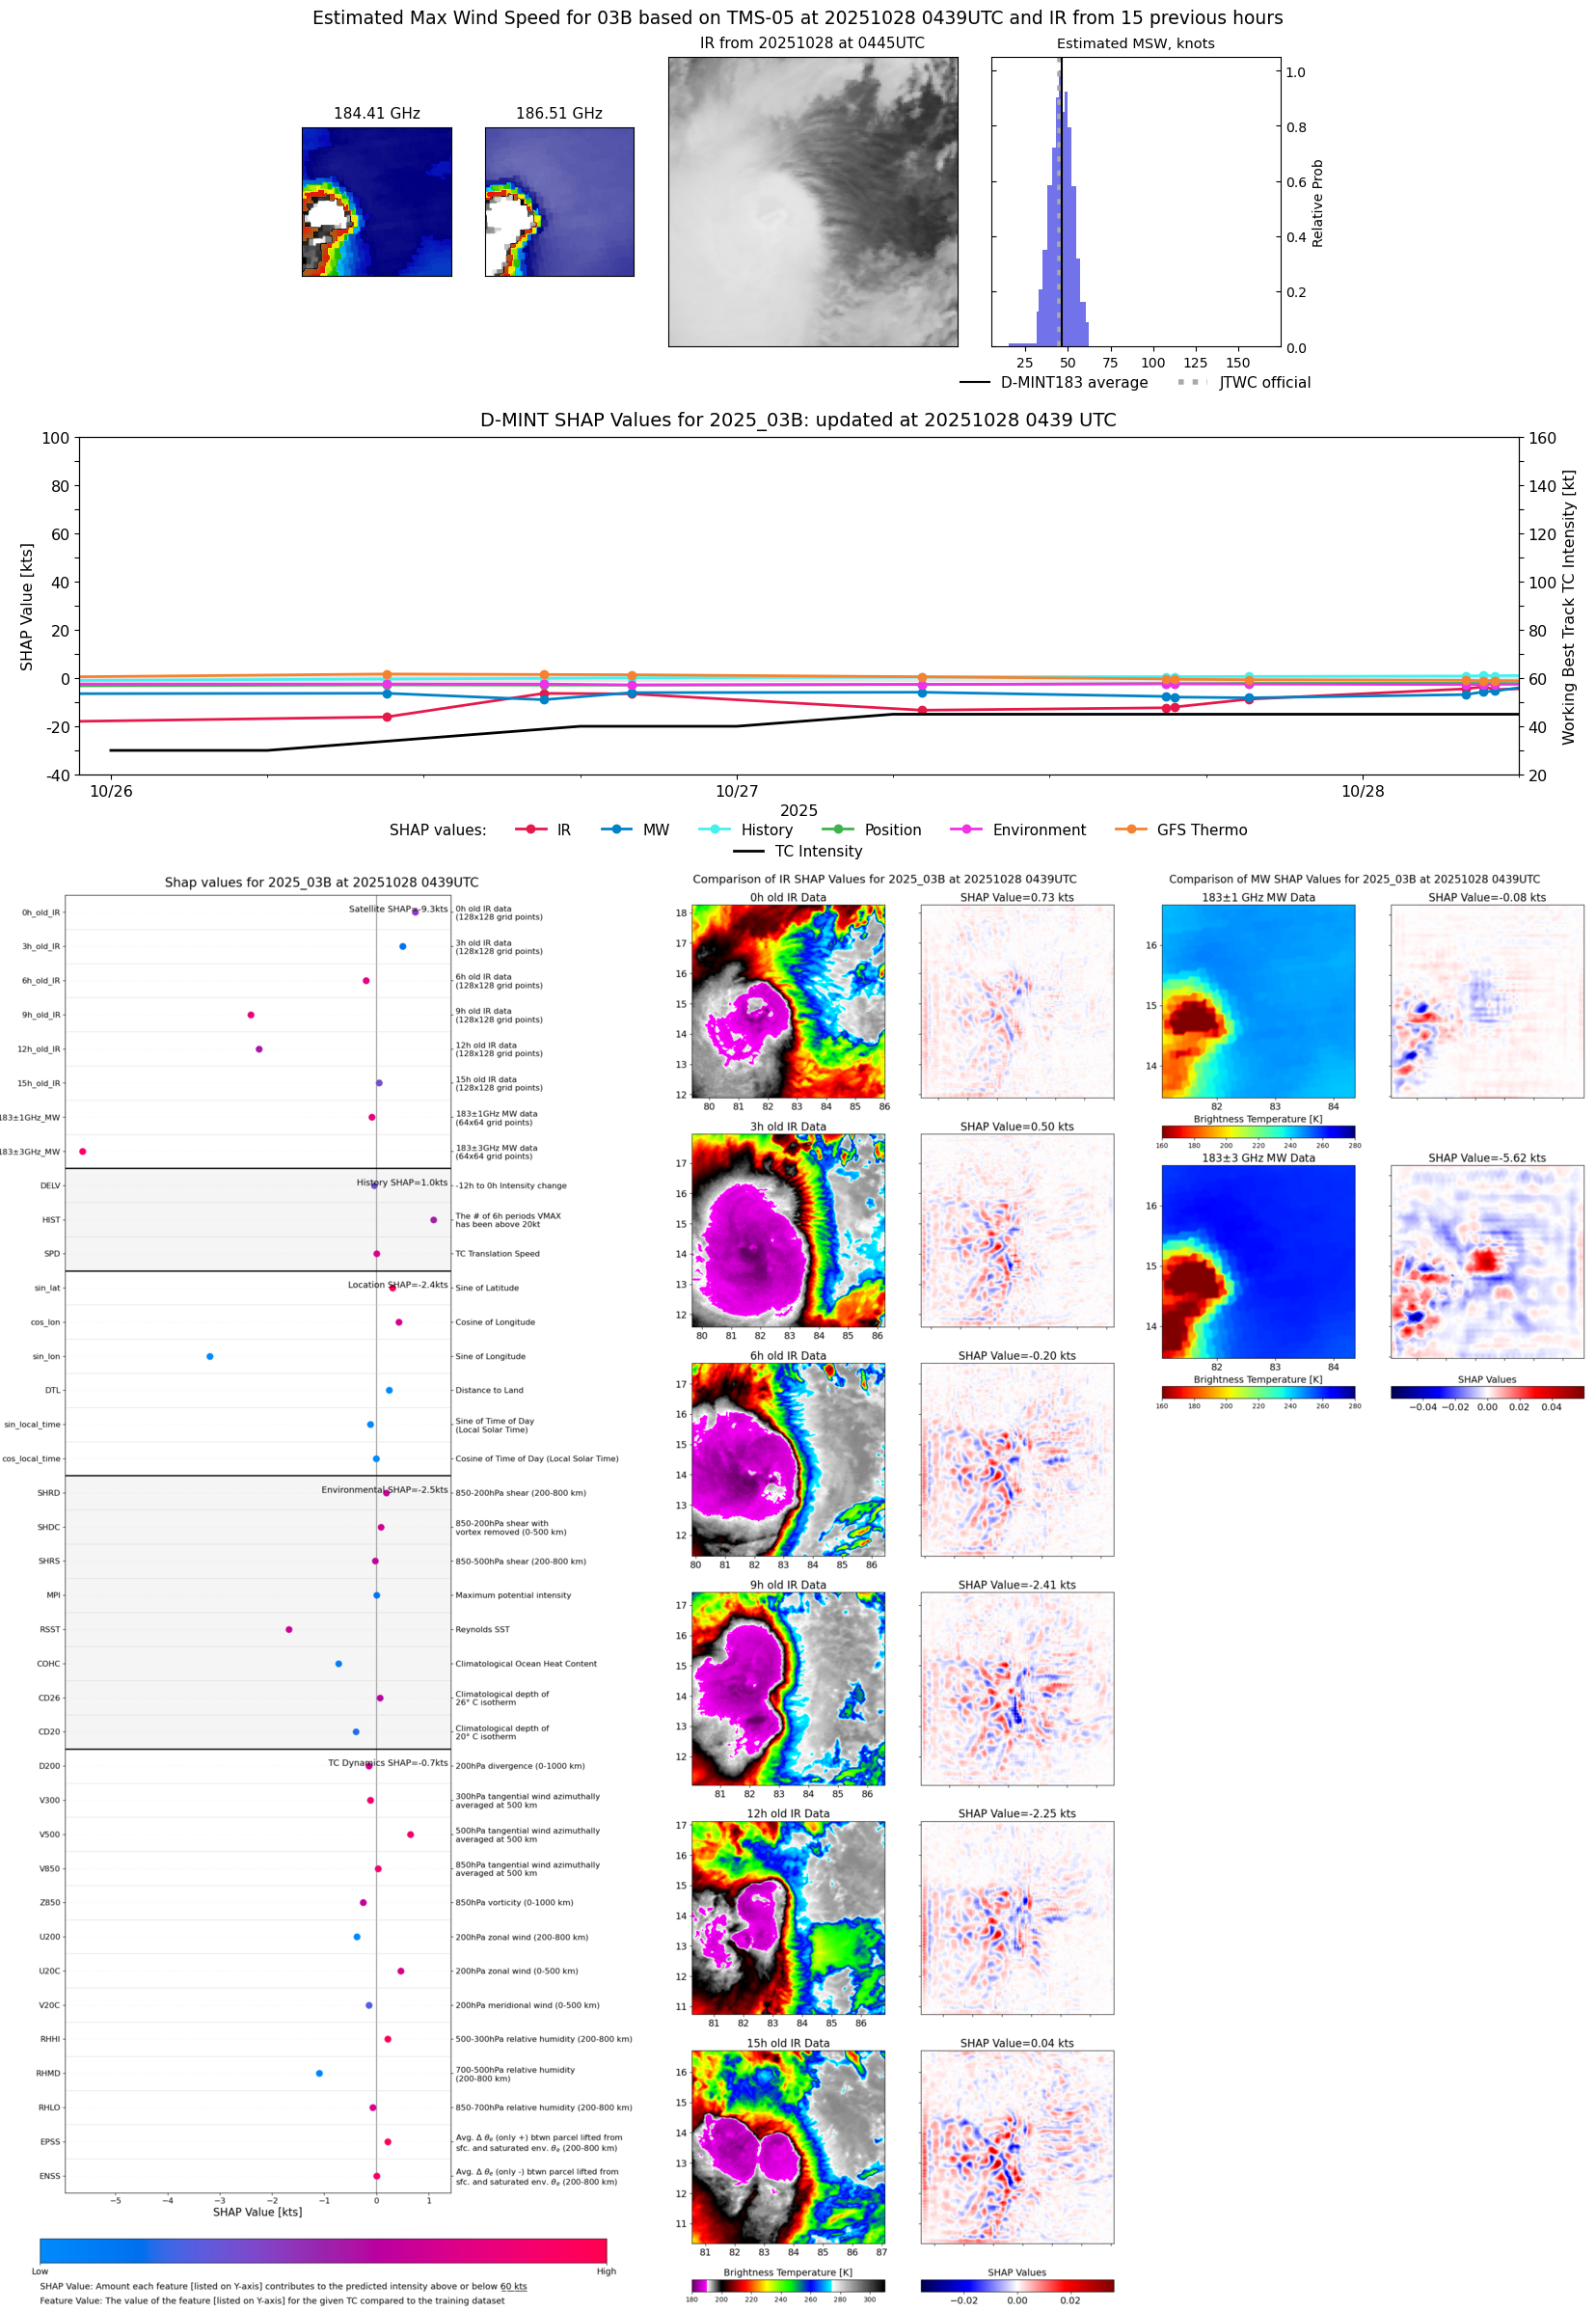 |
| 20251028 | 0357 UTC | TROPICS05 | 994 hPa | 44 kts | 40 kts | 48 kts | 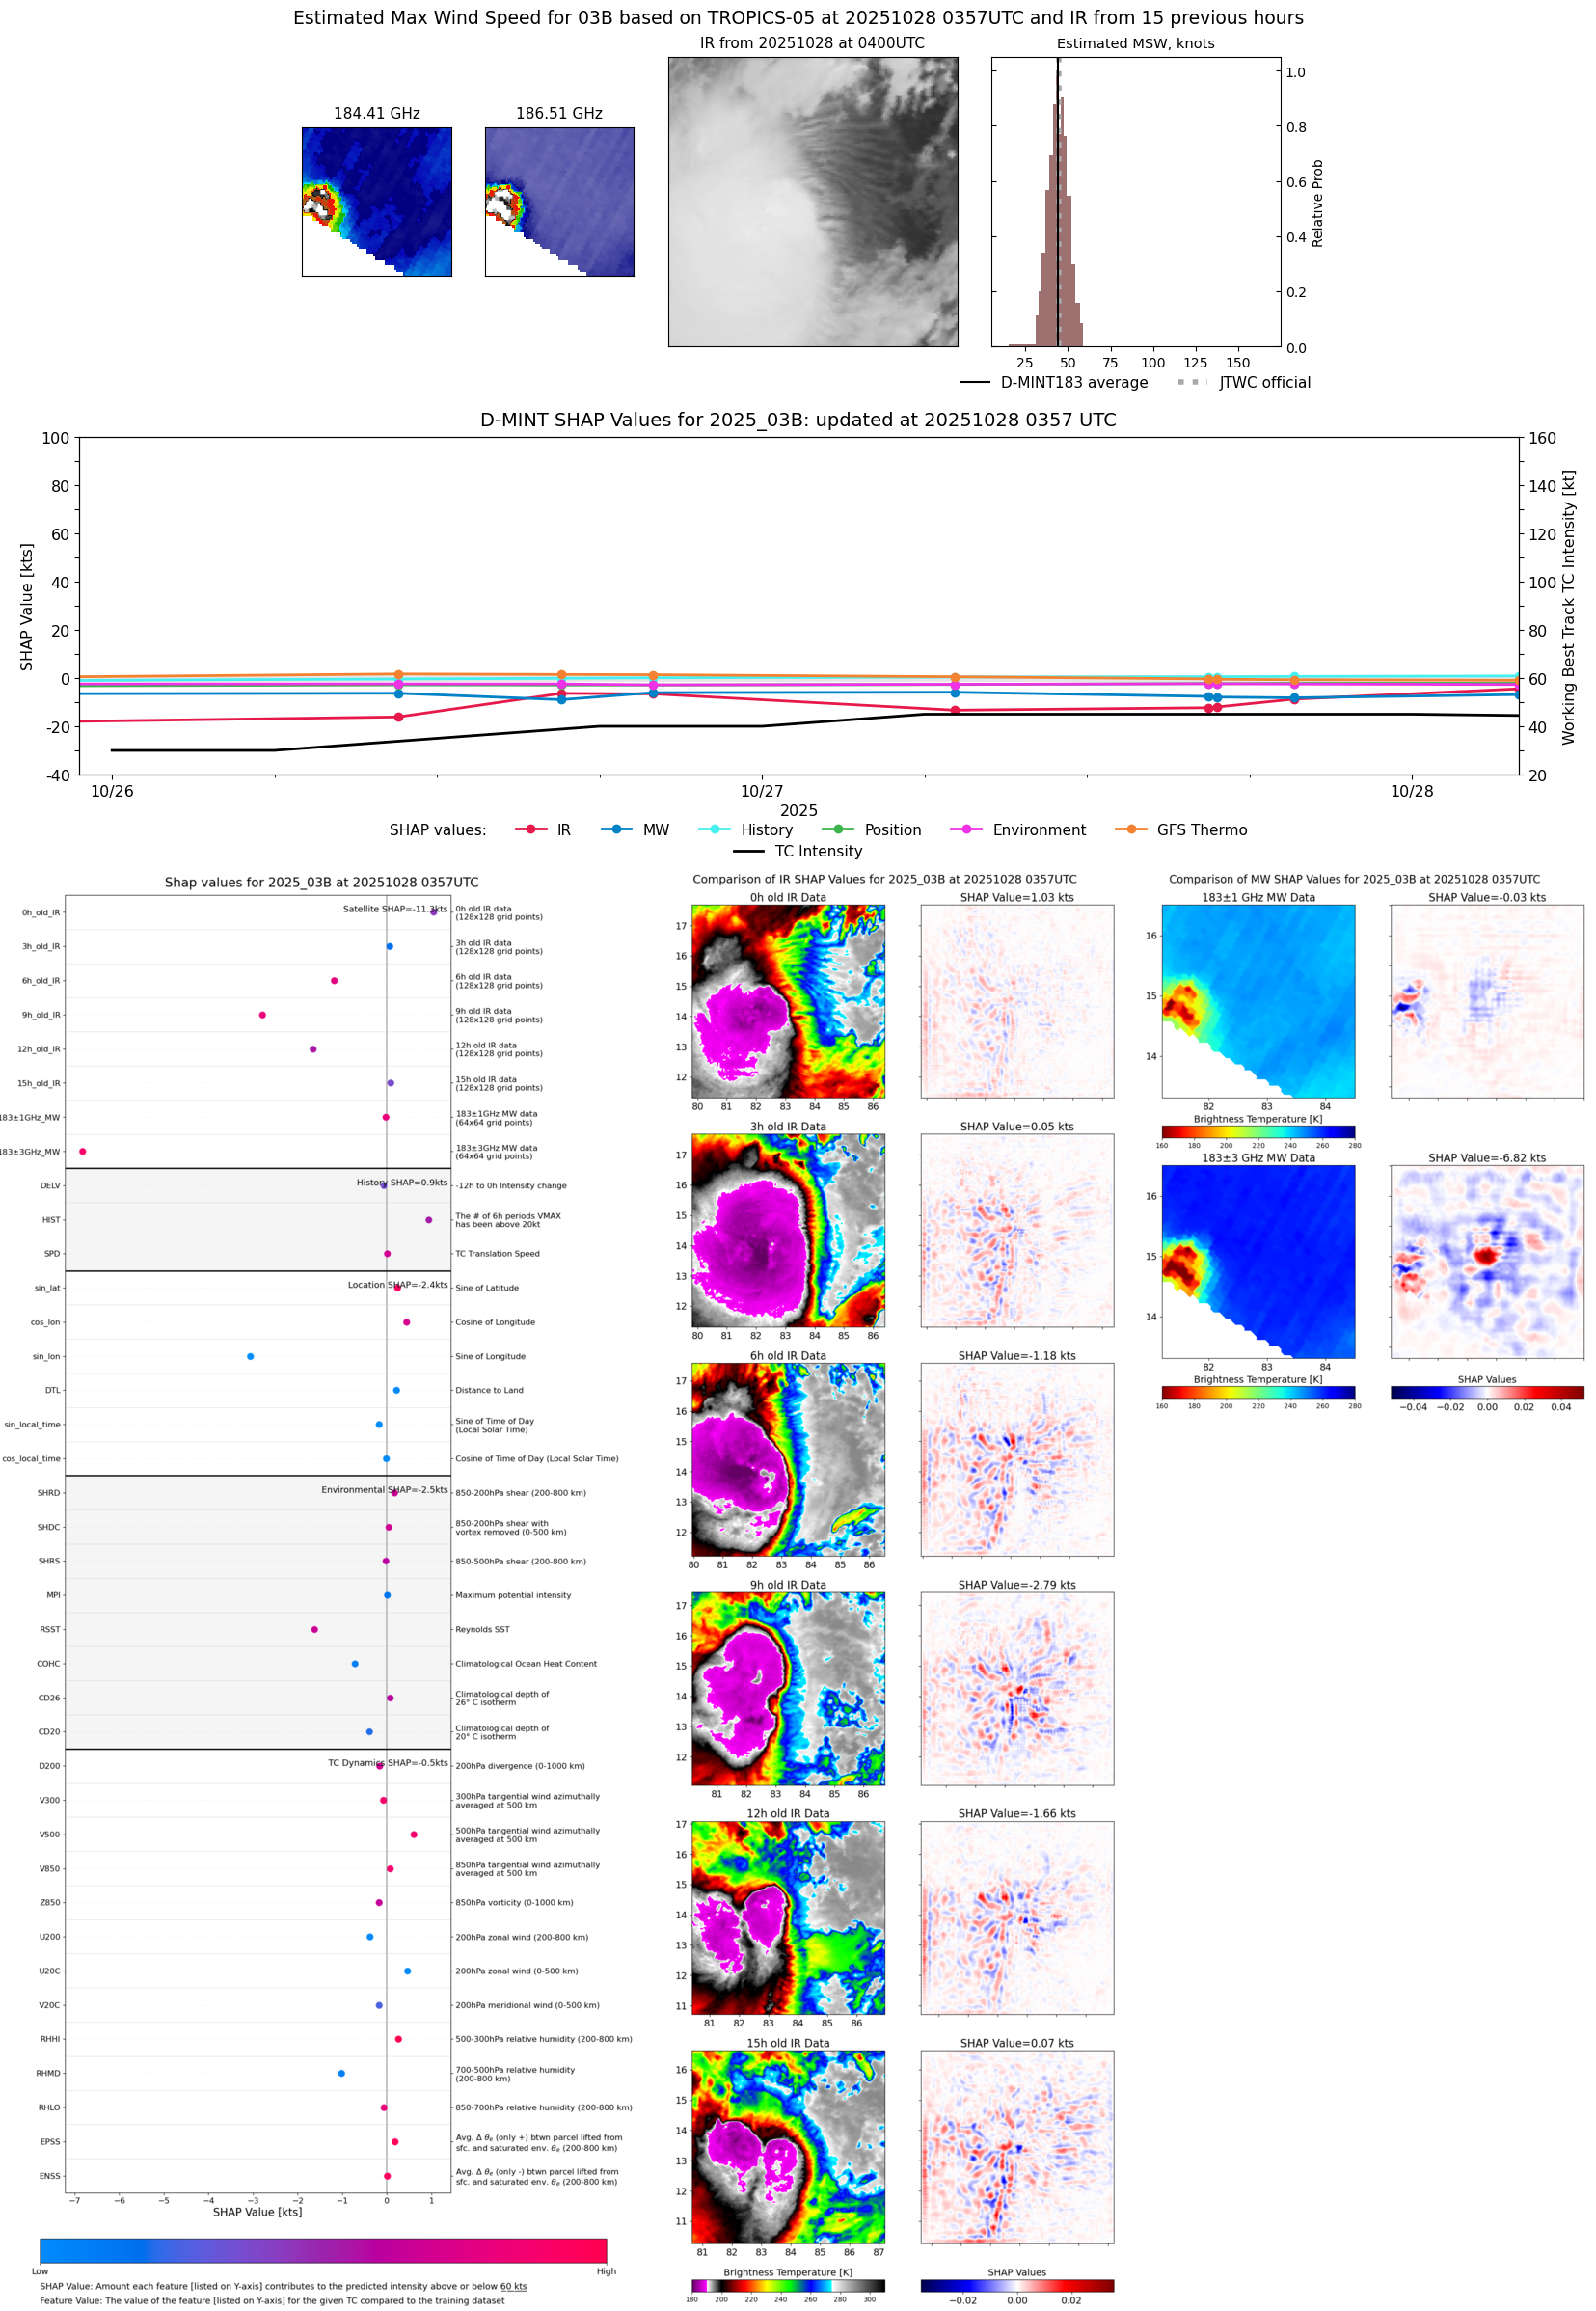 |
| 20251028 | 0110 UTC | SSMISF17 | 994 hPa | 42 kts | 37 kts | 48 kts | 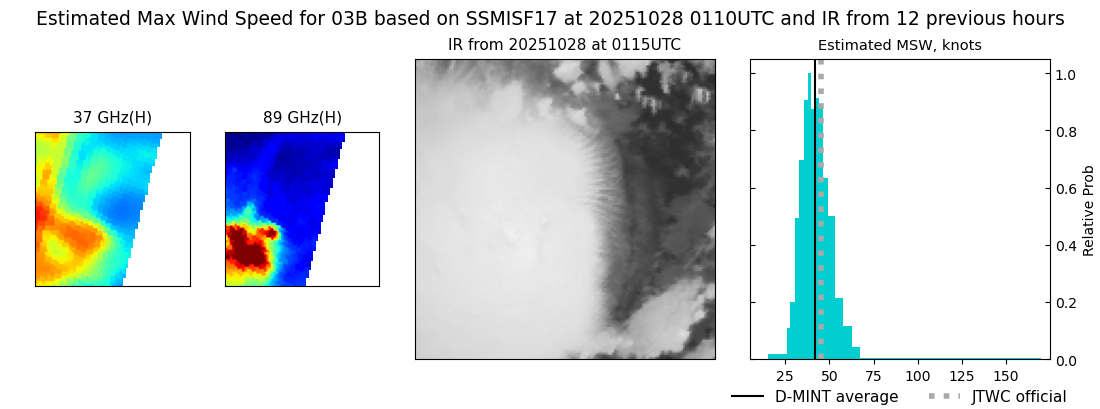 |
| 20251027 | 1939 UTC | ATMS-N21 | 996 hPa | 39 kts | 35 kts | 43 kts | 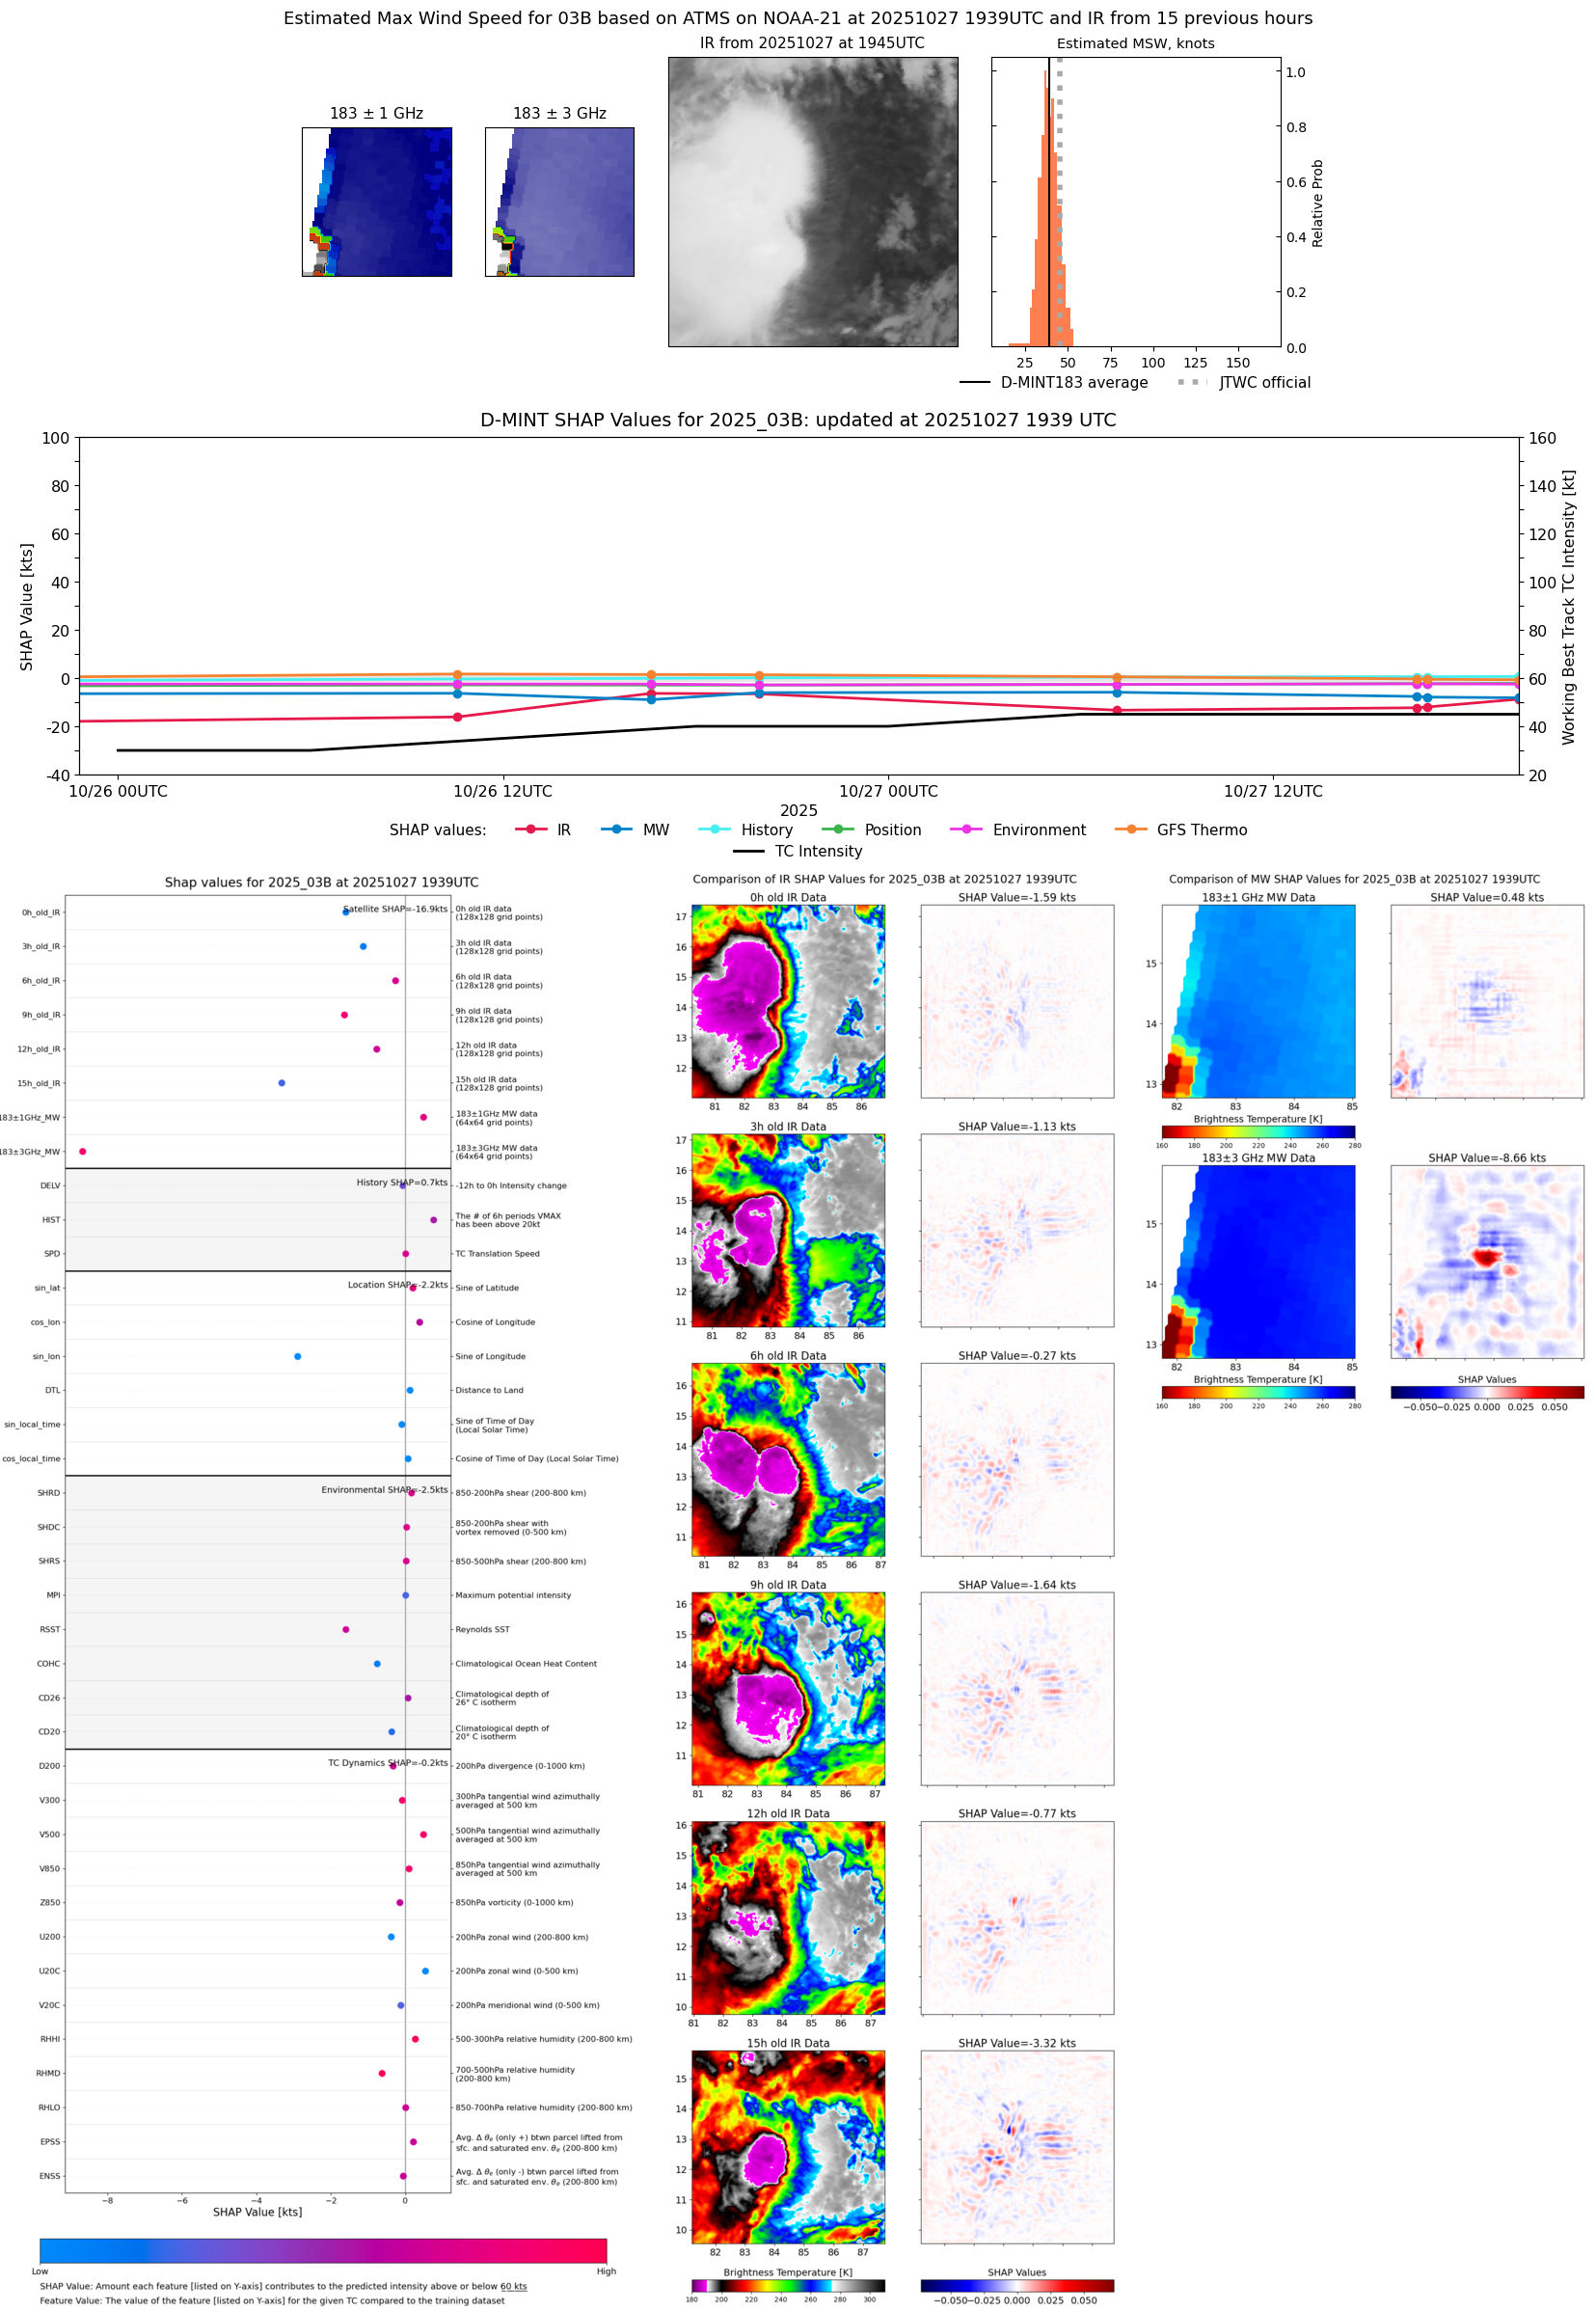 |
| 20251027 | 1648 UTC | AWS | 994 hPa | 36 kts | 33 kts | 39 kts |  |
| 20251027 | 1628 UTC | TMS05 | 995 hPa | 36 kts | 33 kts | 39 kts | 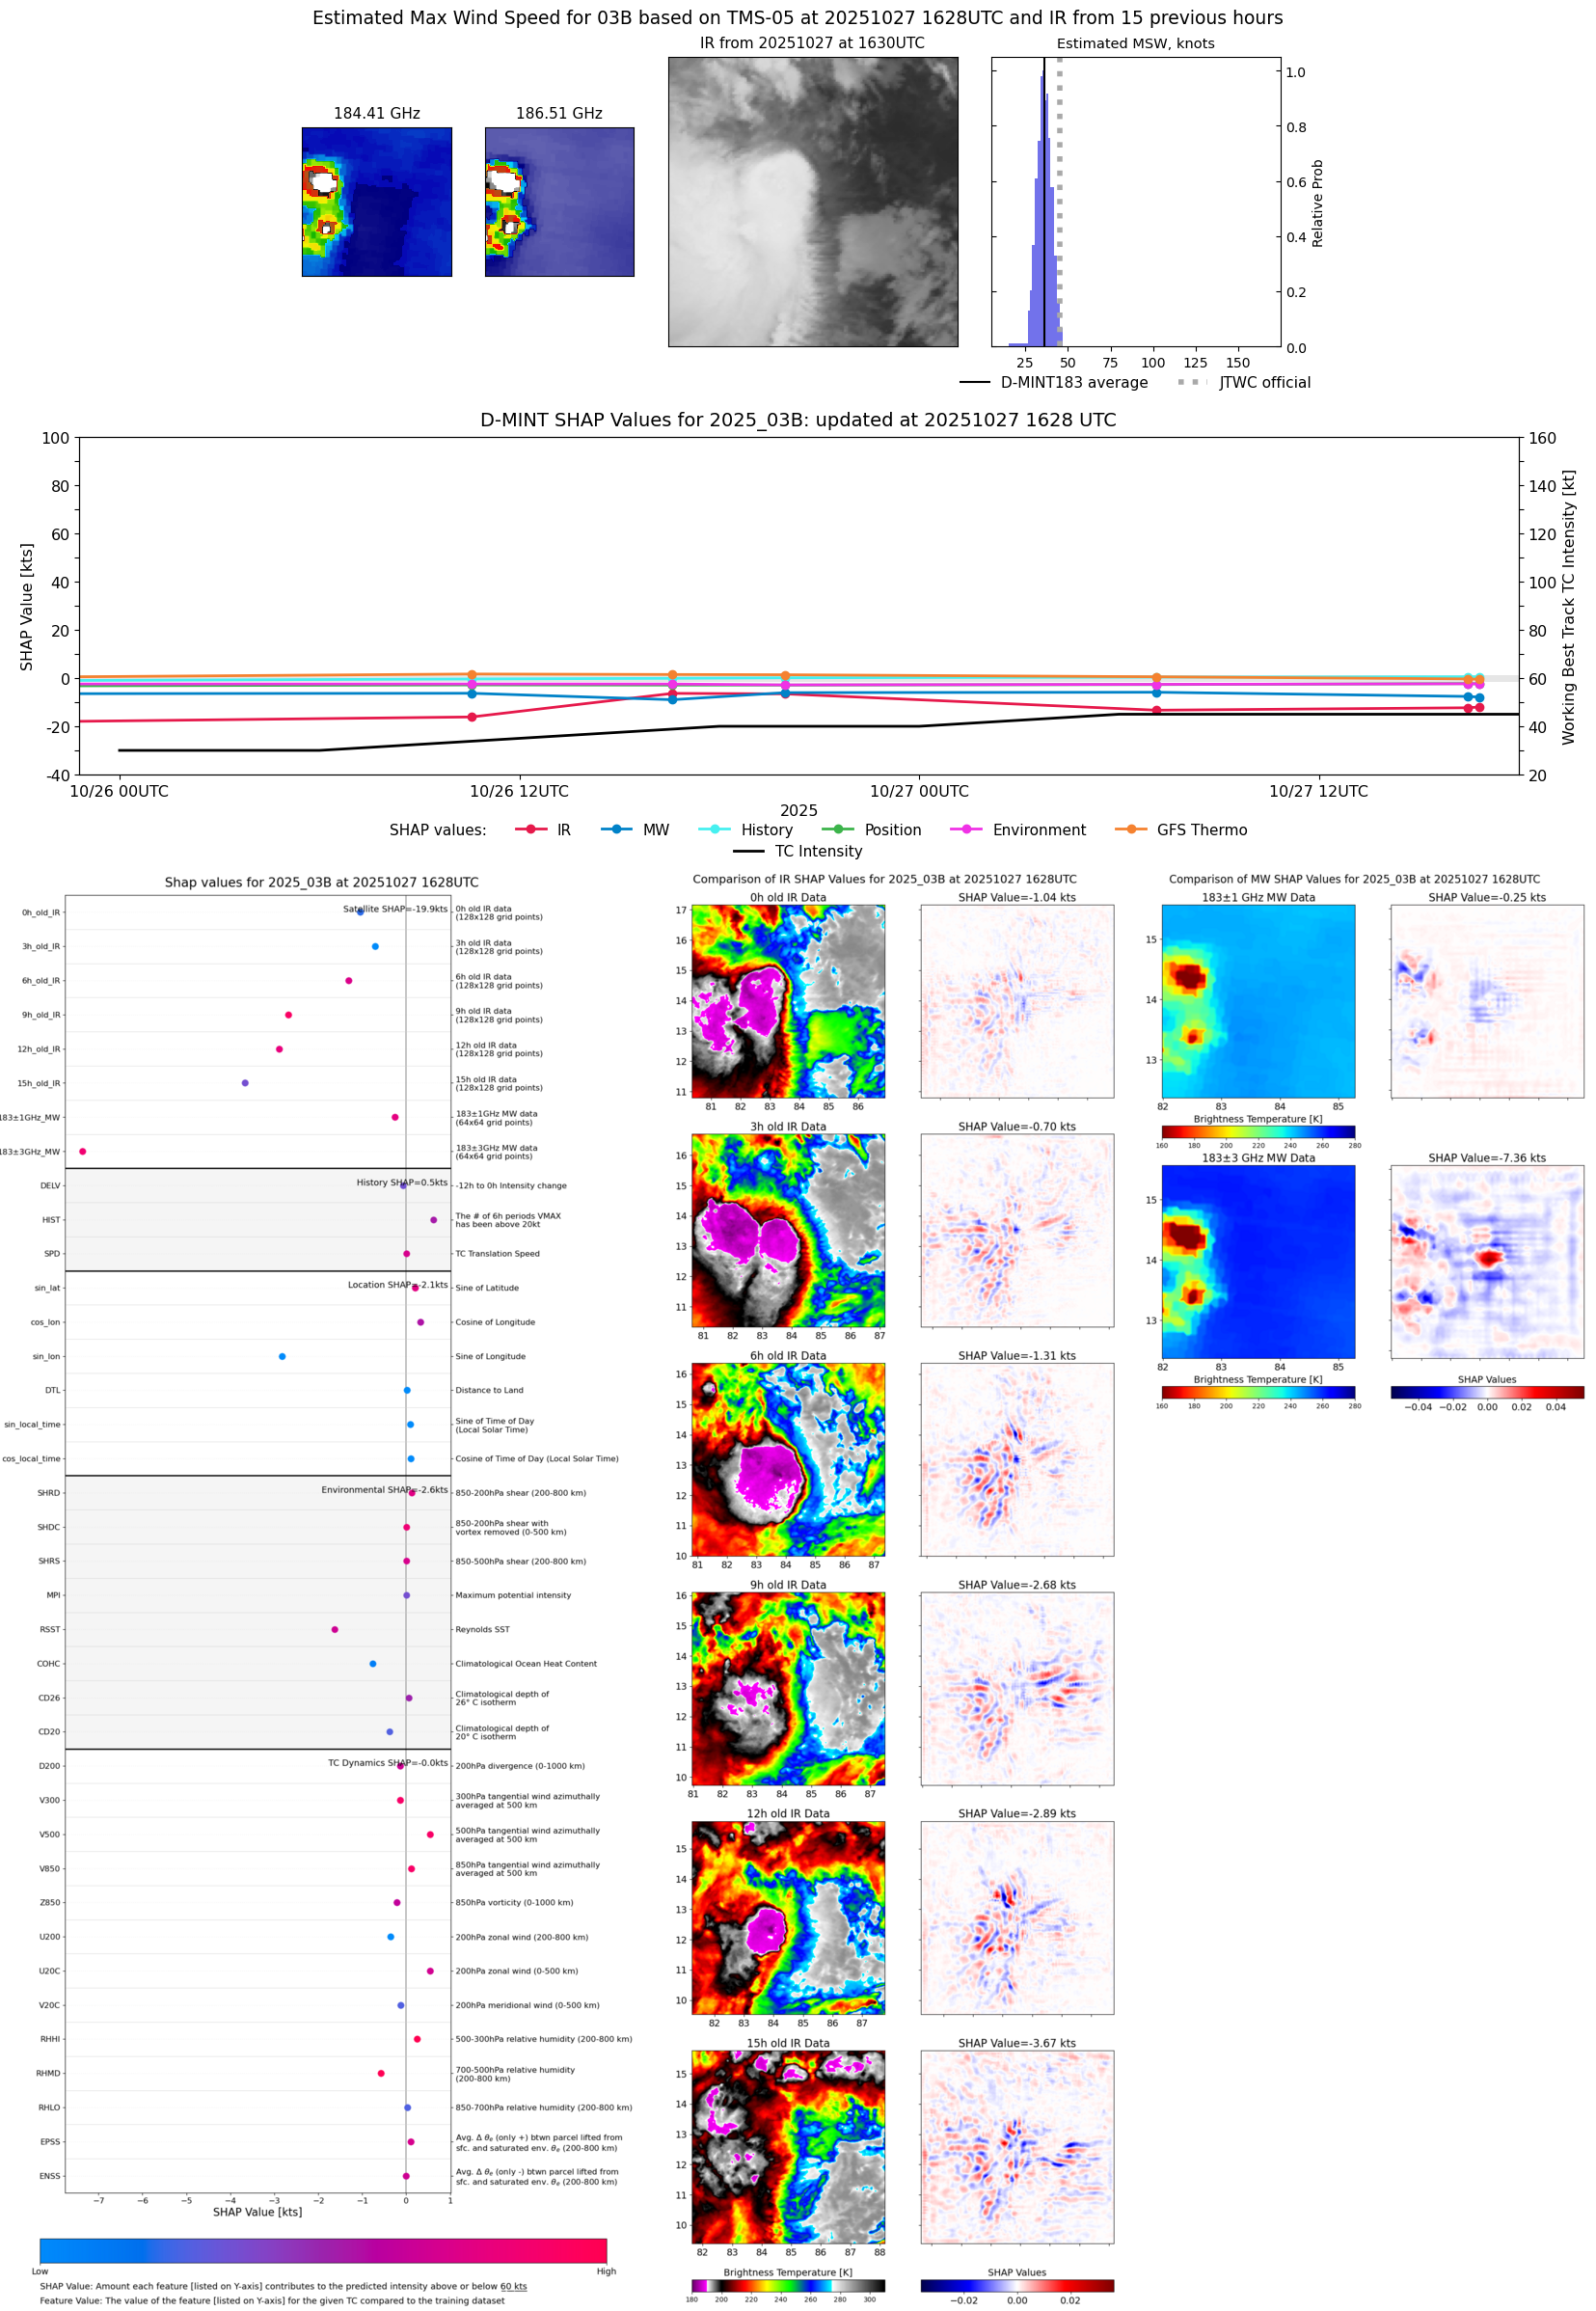 |
| 20251027 | 0755 UTC | ATMS-N20 | 997 hPa | 41 kts | 37 kts | 45 kts | 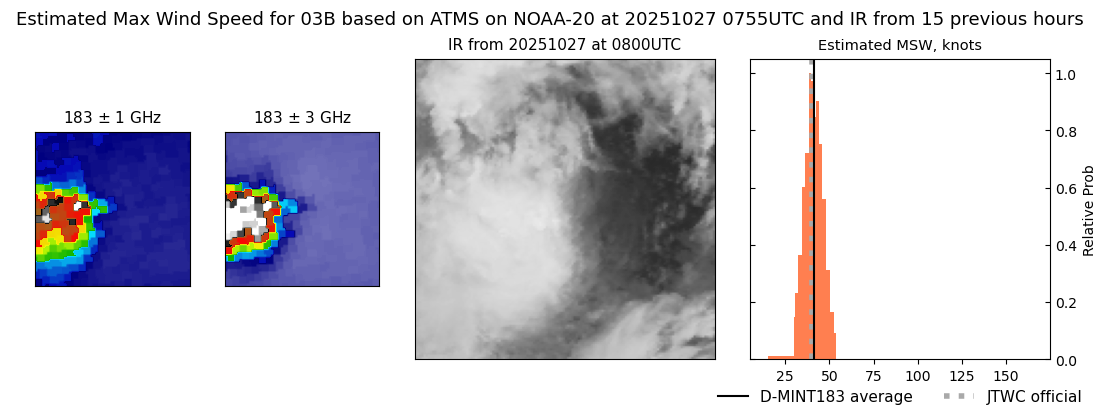 |
| 20251027 | 0707 UTC | TROPICS03 | 995 hPa | 37 kts | 34 kts | 40 kts |  |
| 20251027 | 0403 UTC | GMI | 1003 hPa | 32 kts | 30 kts | 35 kts |  |
| 20251027 | 0045 UTC | SSMISF16 | 999 hPa | 34 kts | 30 kts | 37 kts | 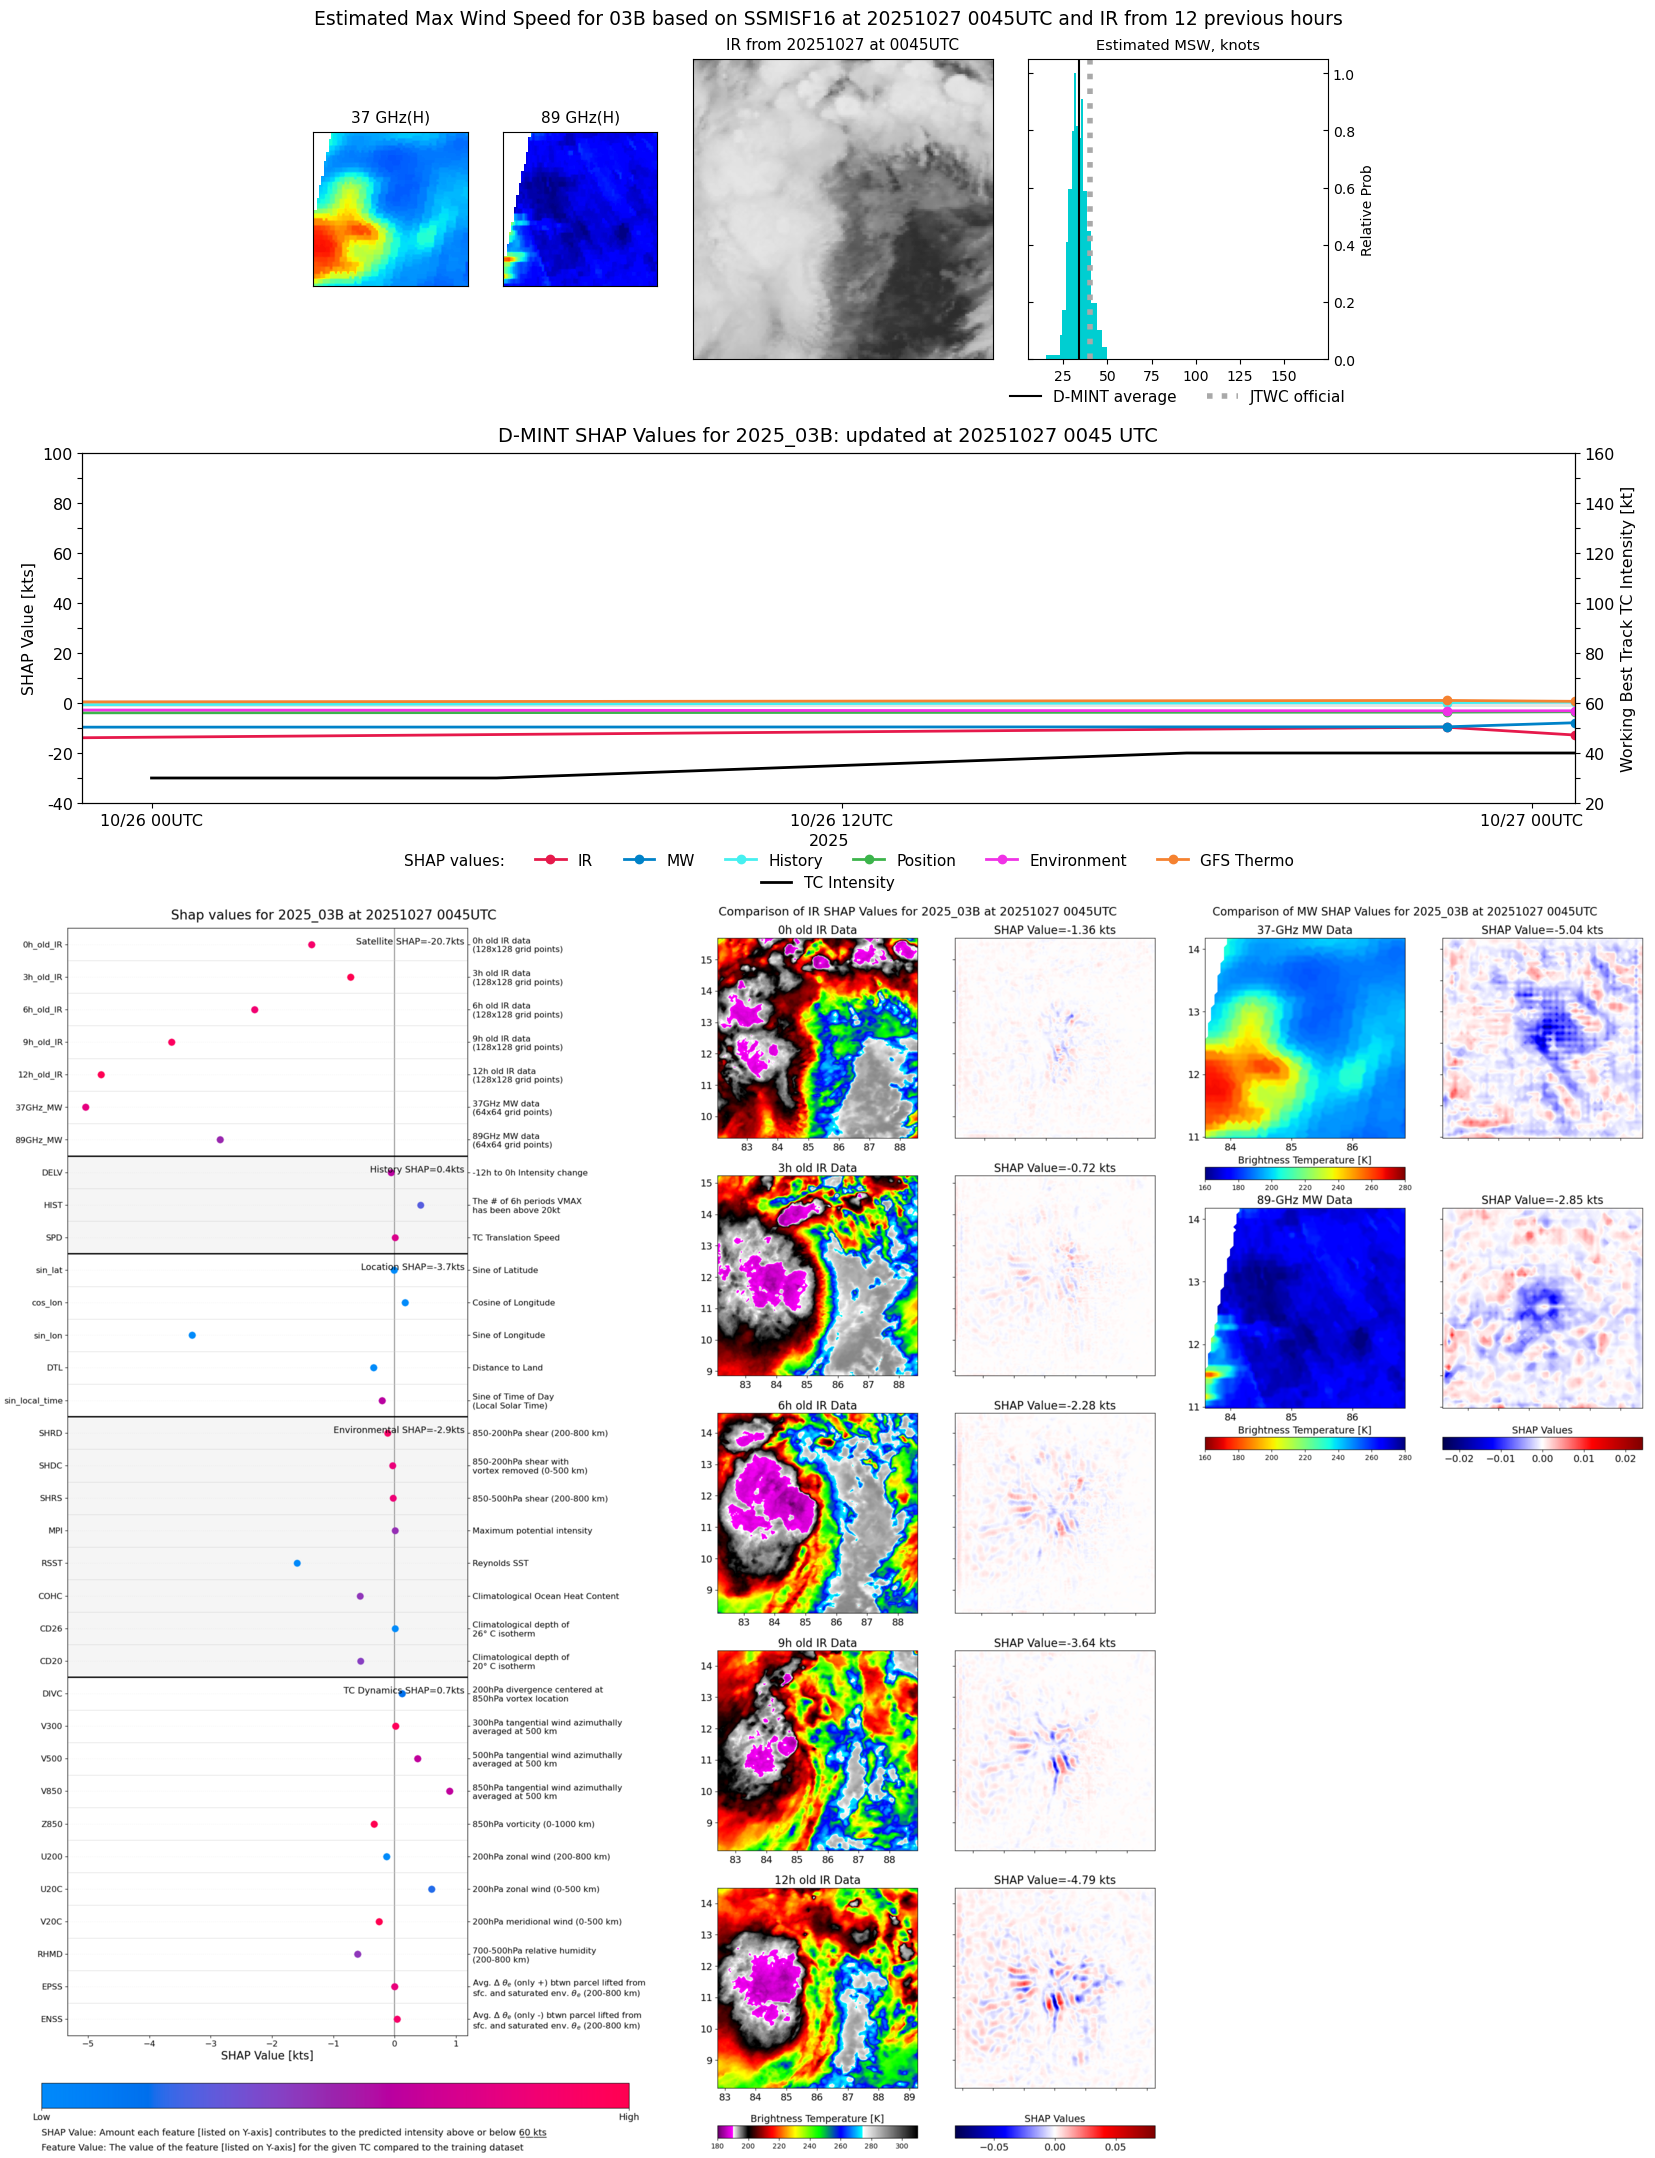 |
| 20251027 | 0002 UTC | WSFM01 | 997 hPa | 35 kts | 31 kts | 39 kts |  |
| 20251026 | 2231 UTC | SSMISF18 | 1000 hPa | 35 kts | 32 kts | 39 kts | 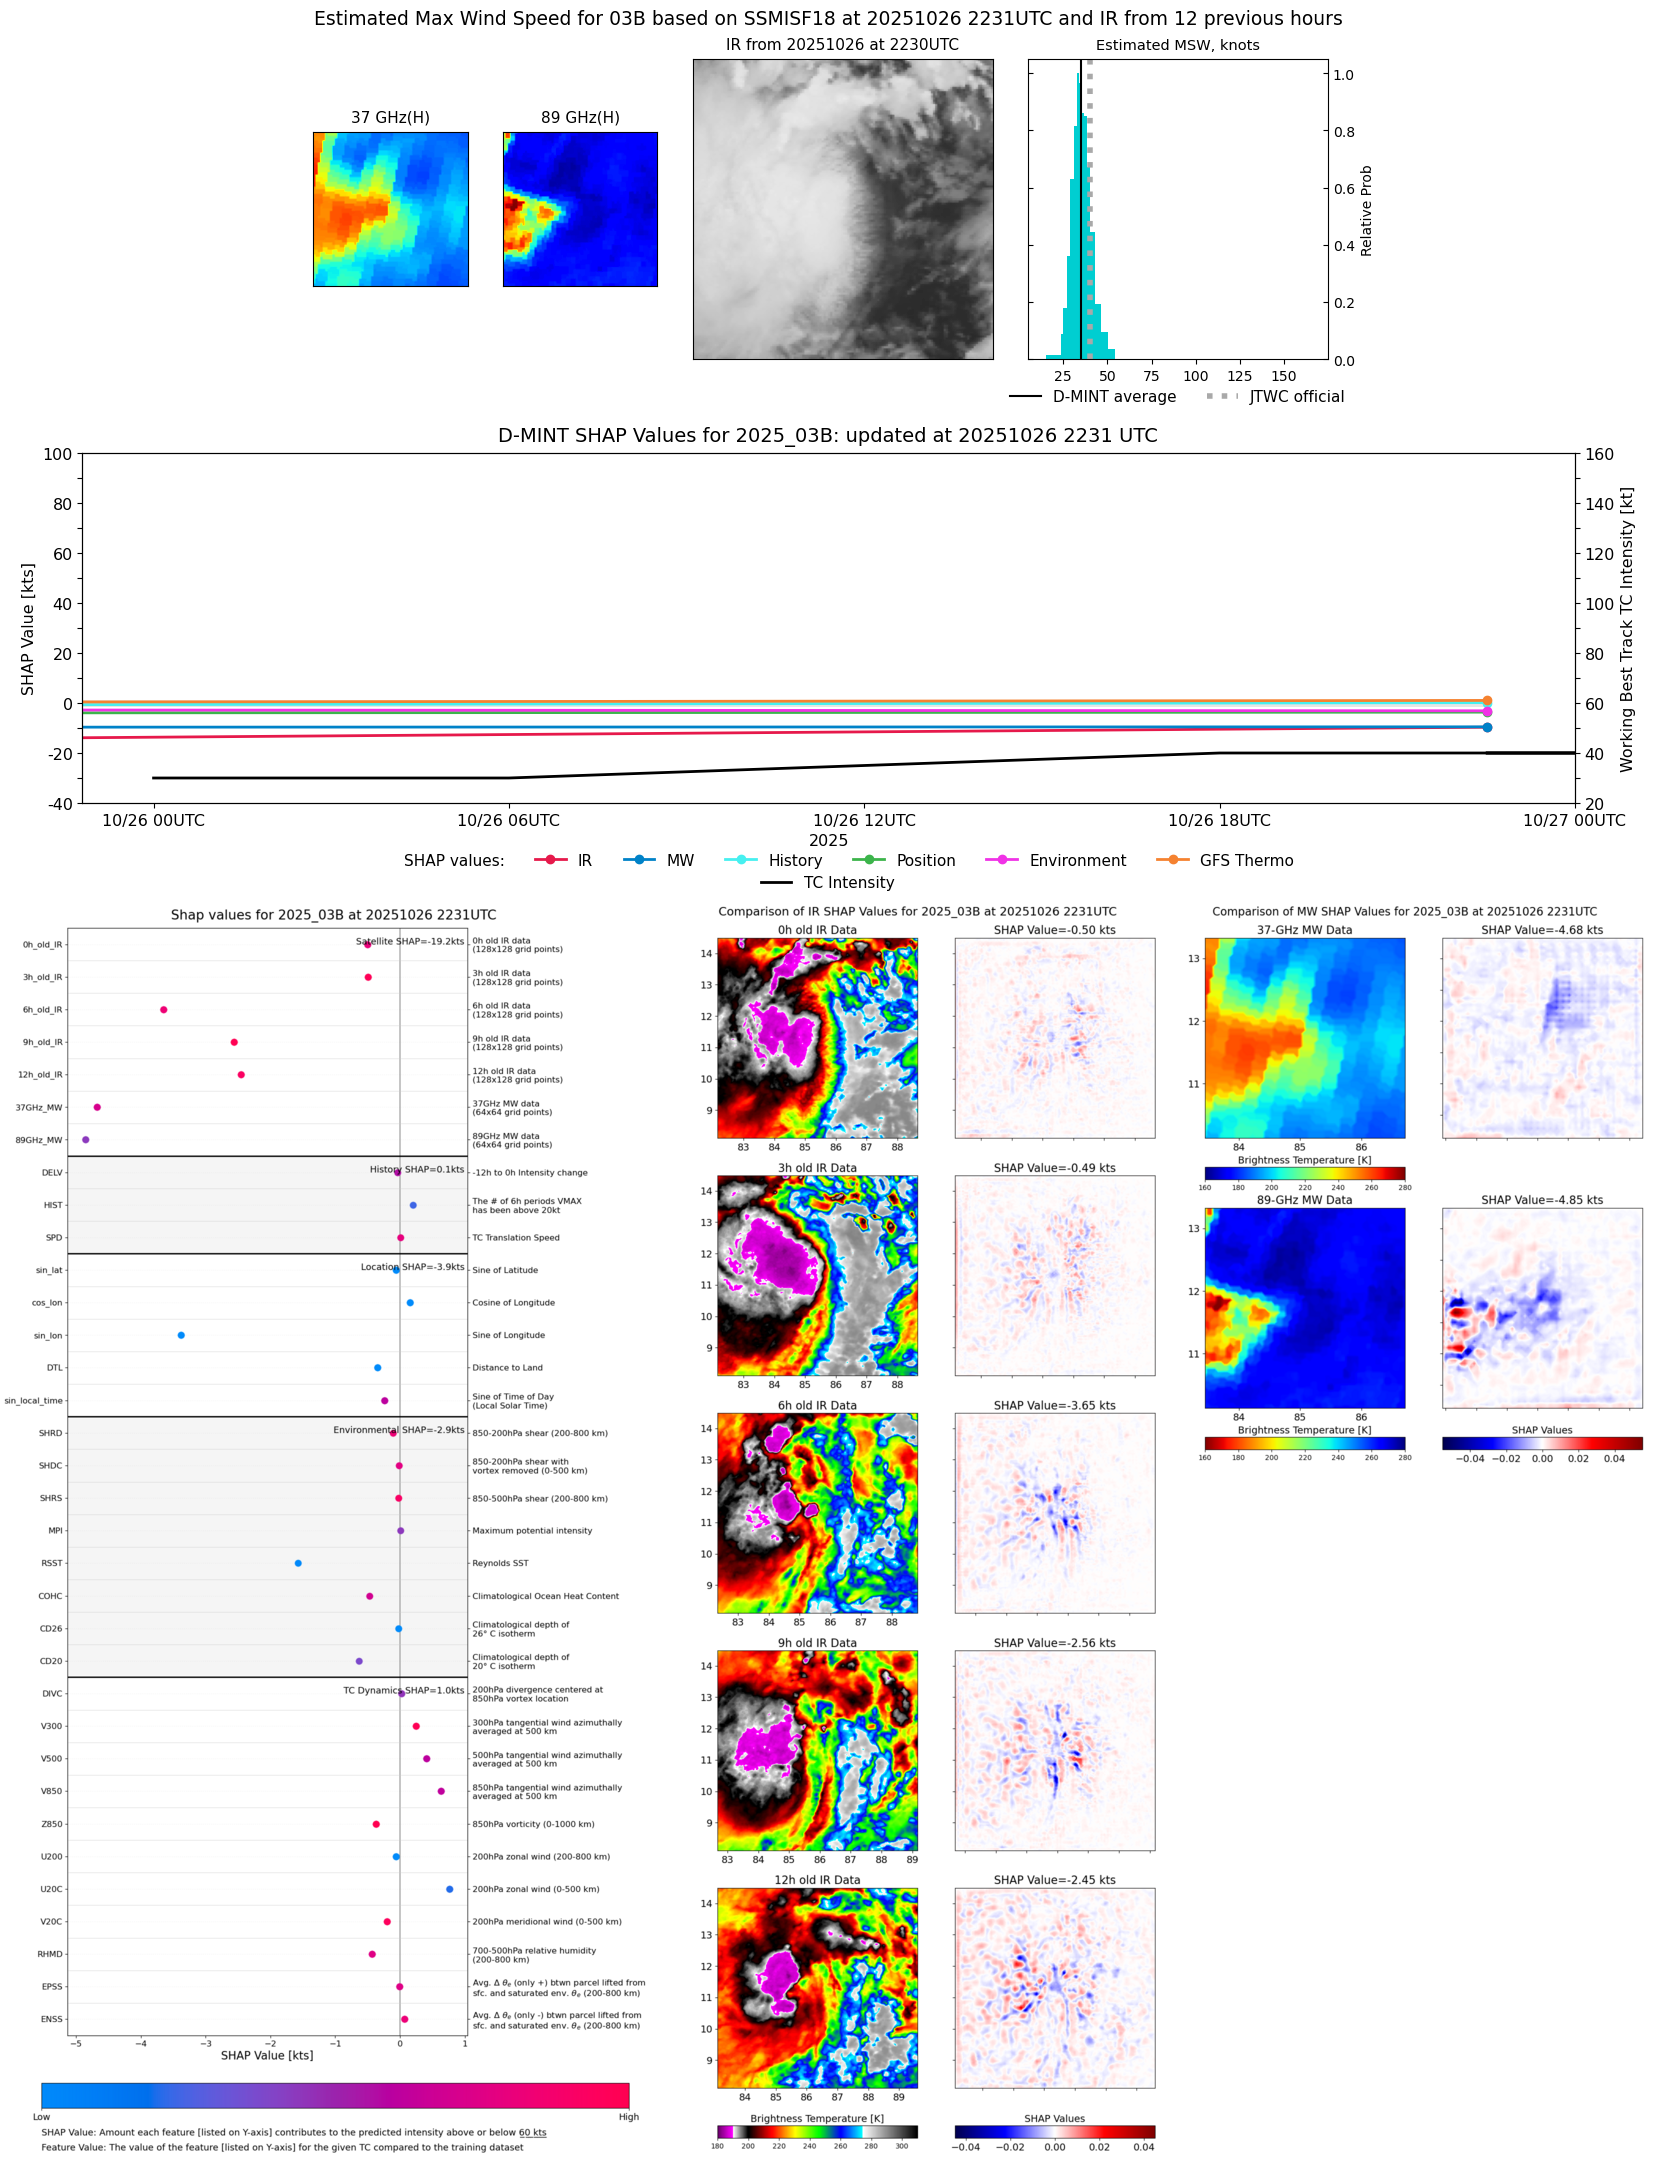 |
| 20251026 | 2024 UTC | AMSR2 | 999 hPa | 38 kts | 33 kts | 42 kts |  |
| 20251026 | 1958 UTC | ATMS-N21 | 994 hPa | 43 kts | 39 kts | 48 kts | 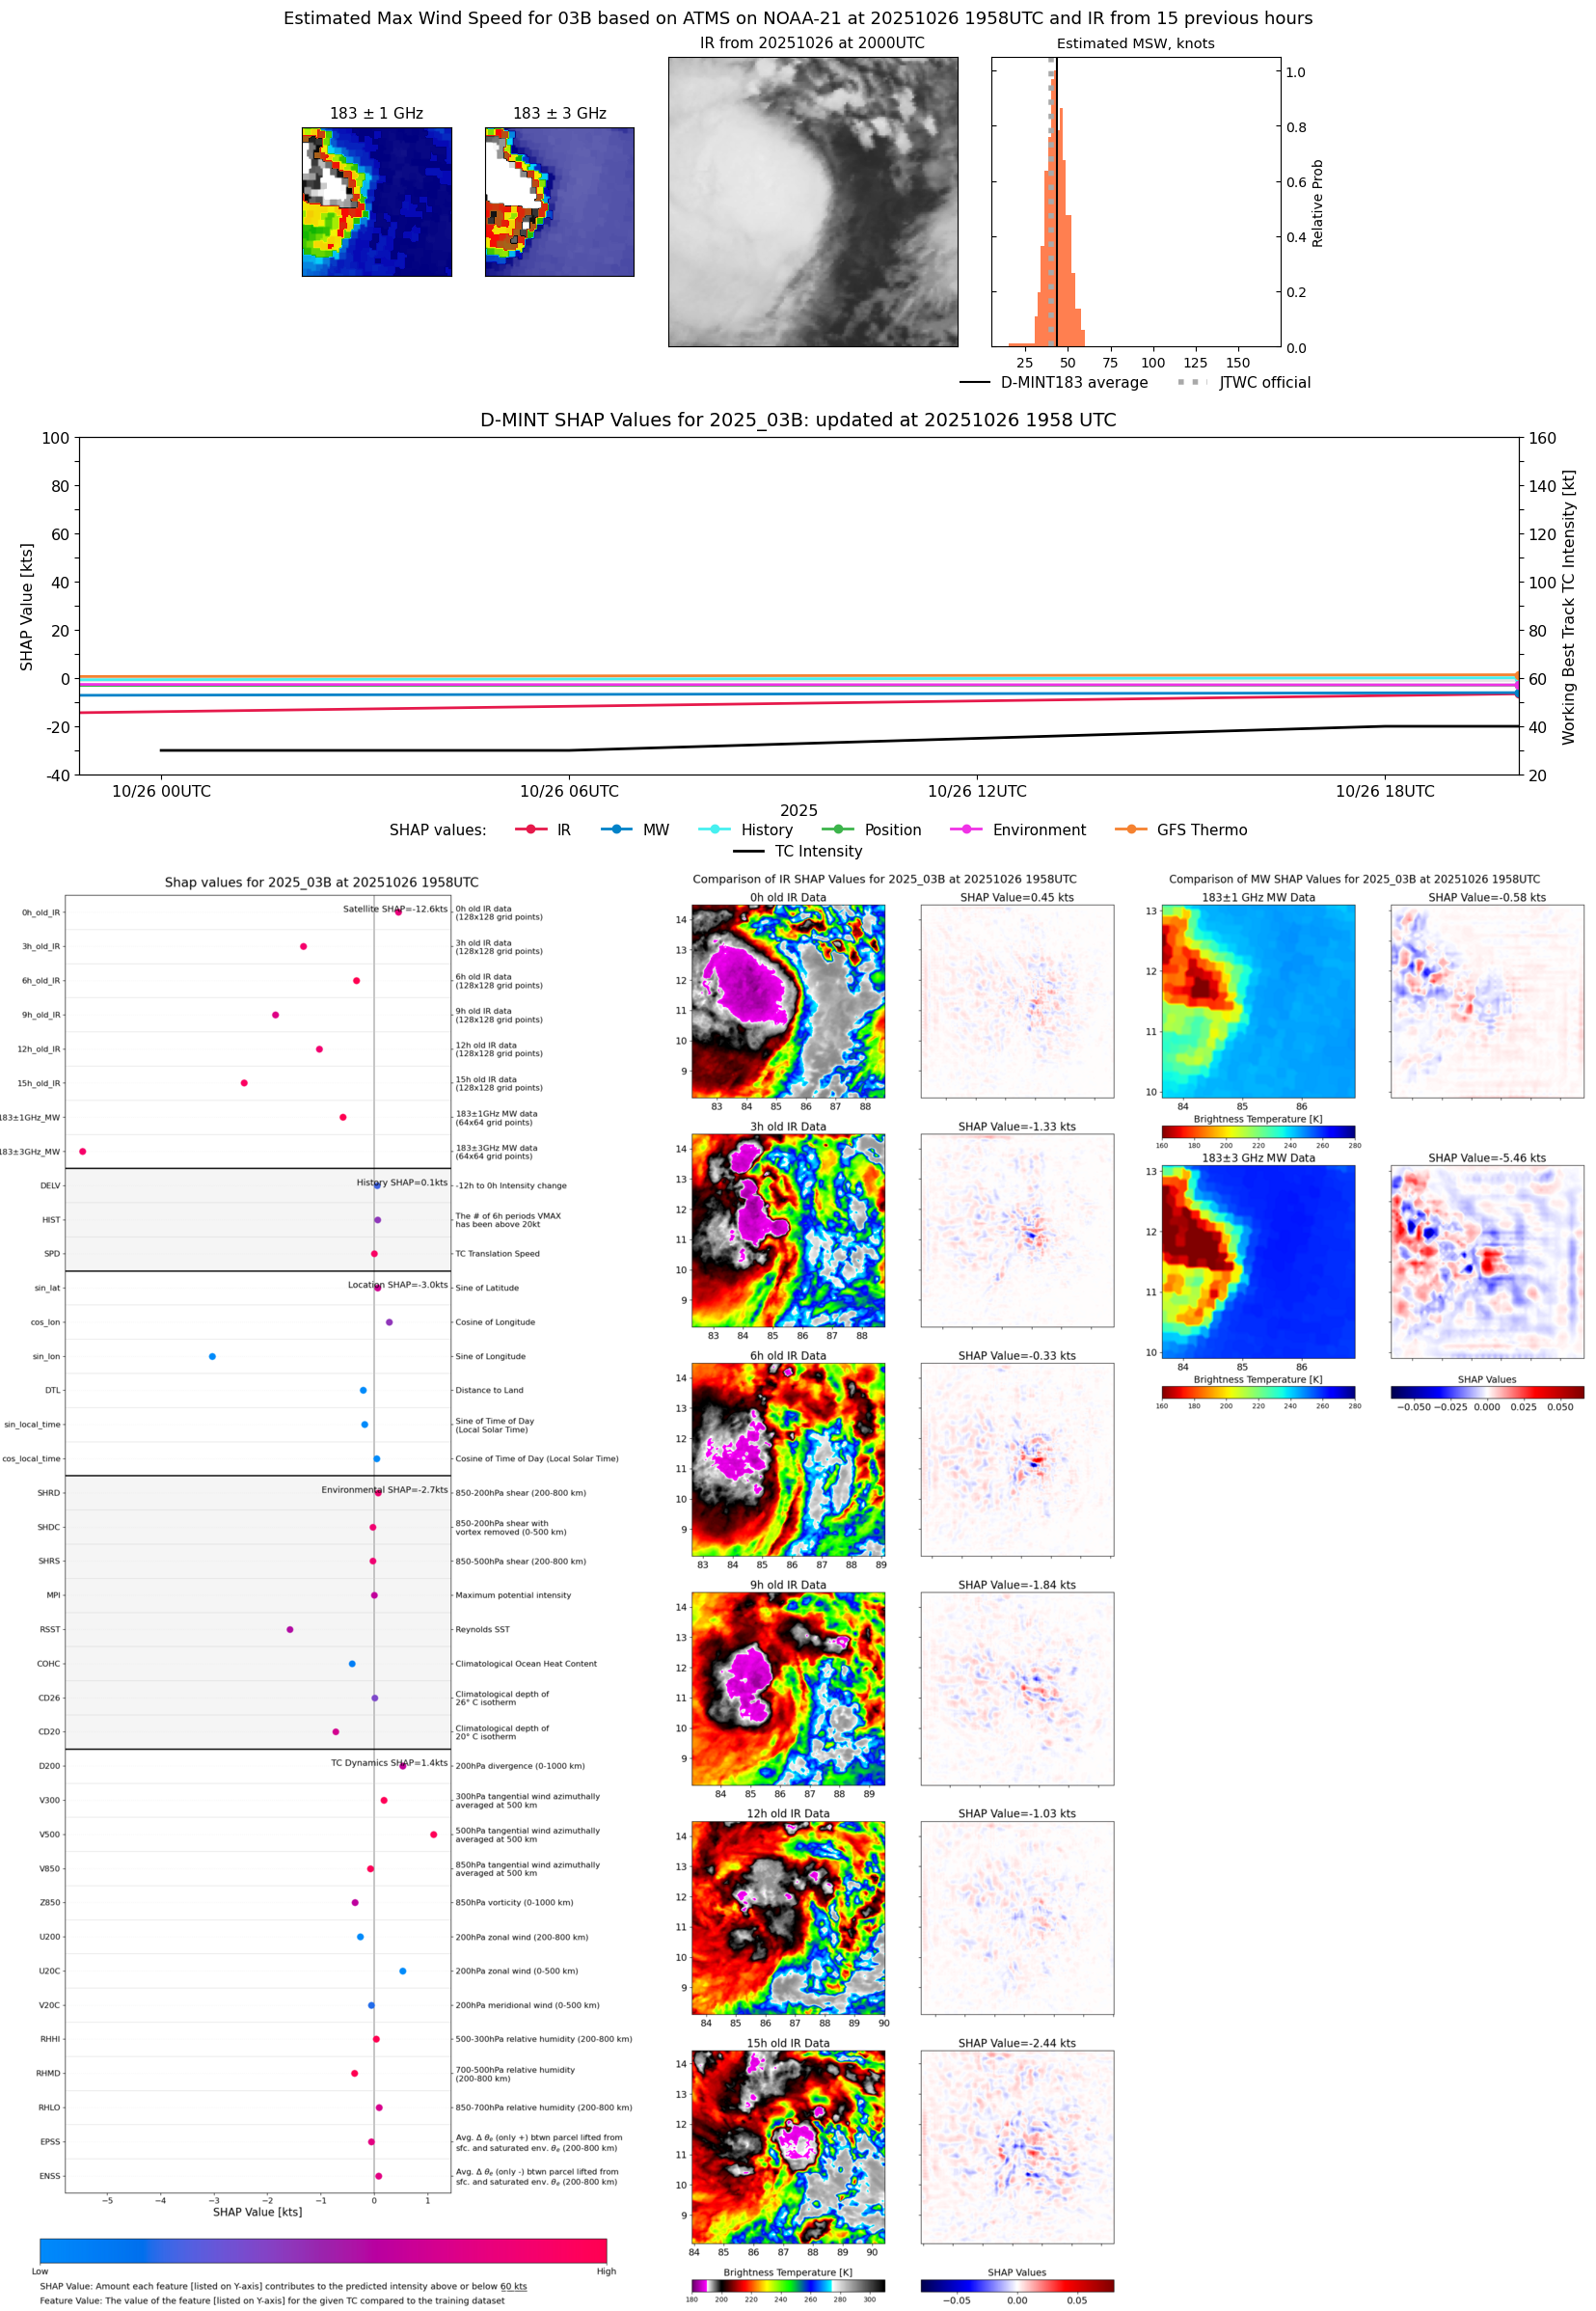 |
| 20251026 | 1636 UTC | AWS | 994 hPa | 41 kts | 37 kts | 45 kts | 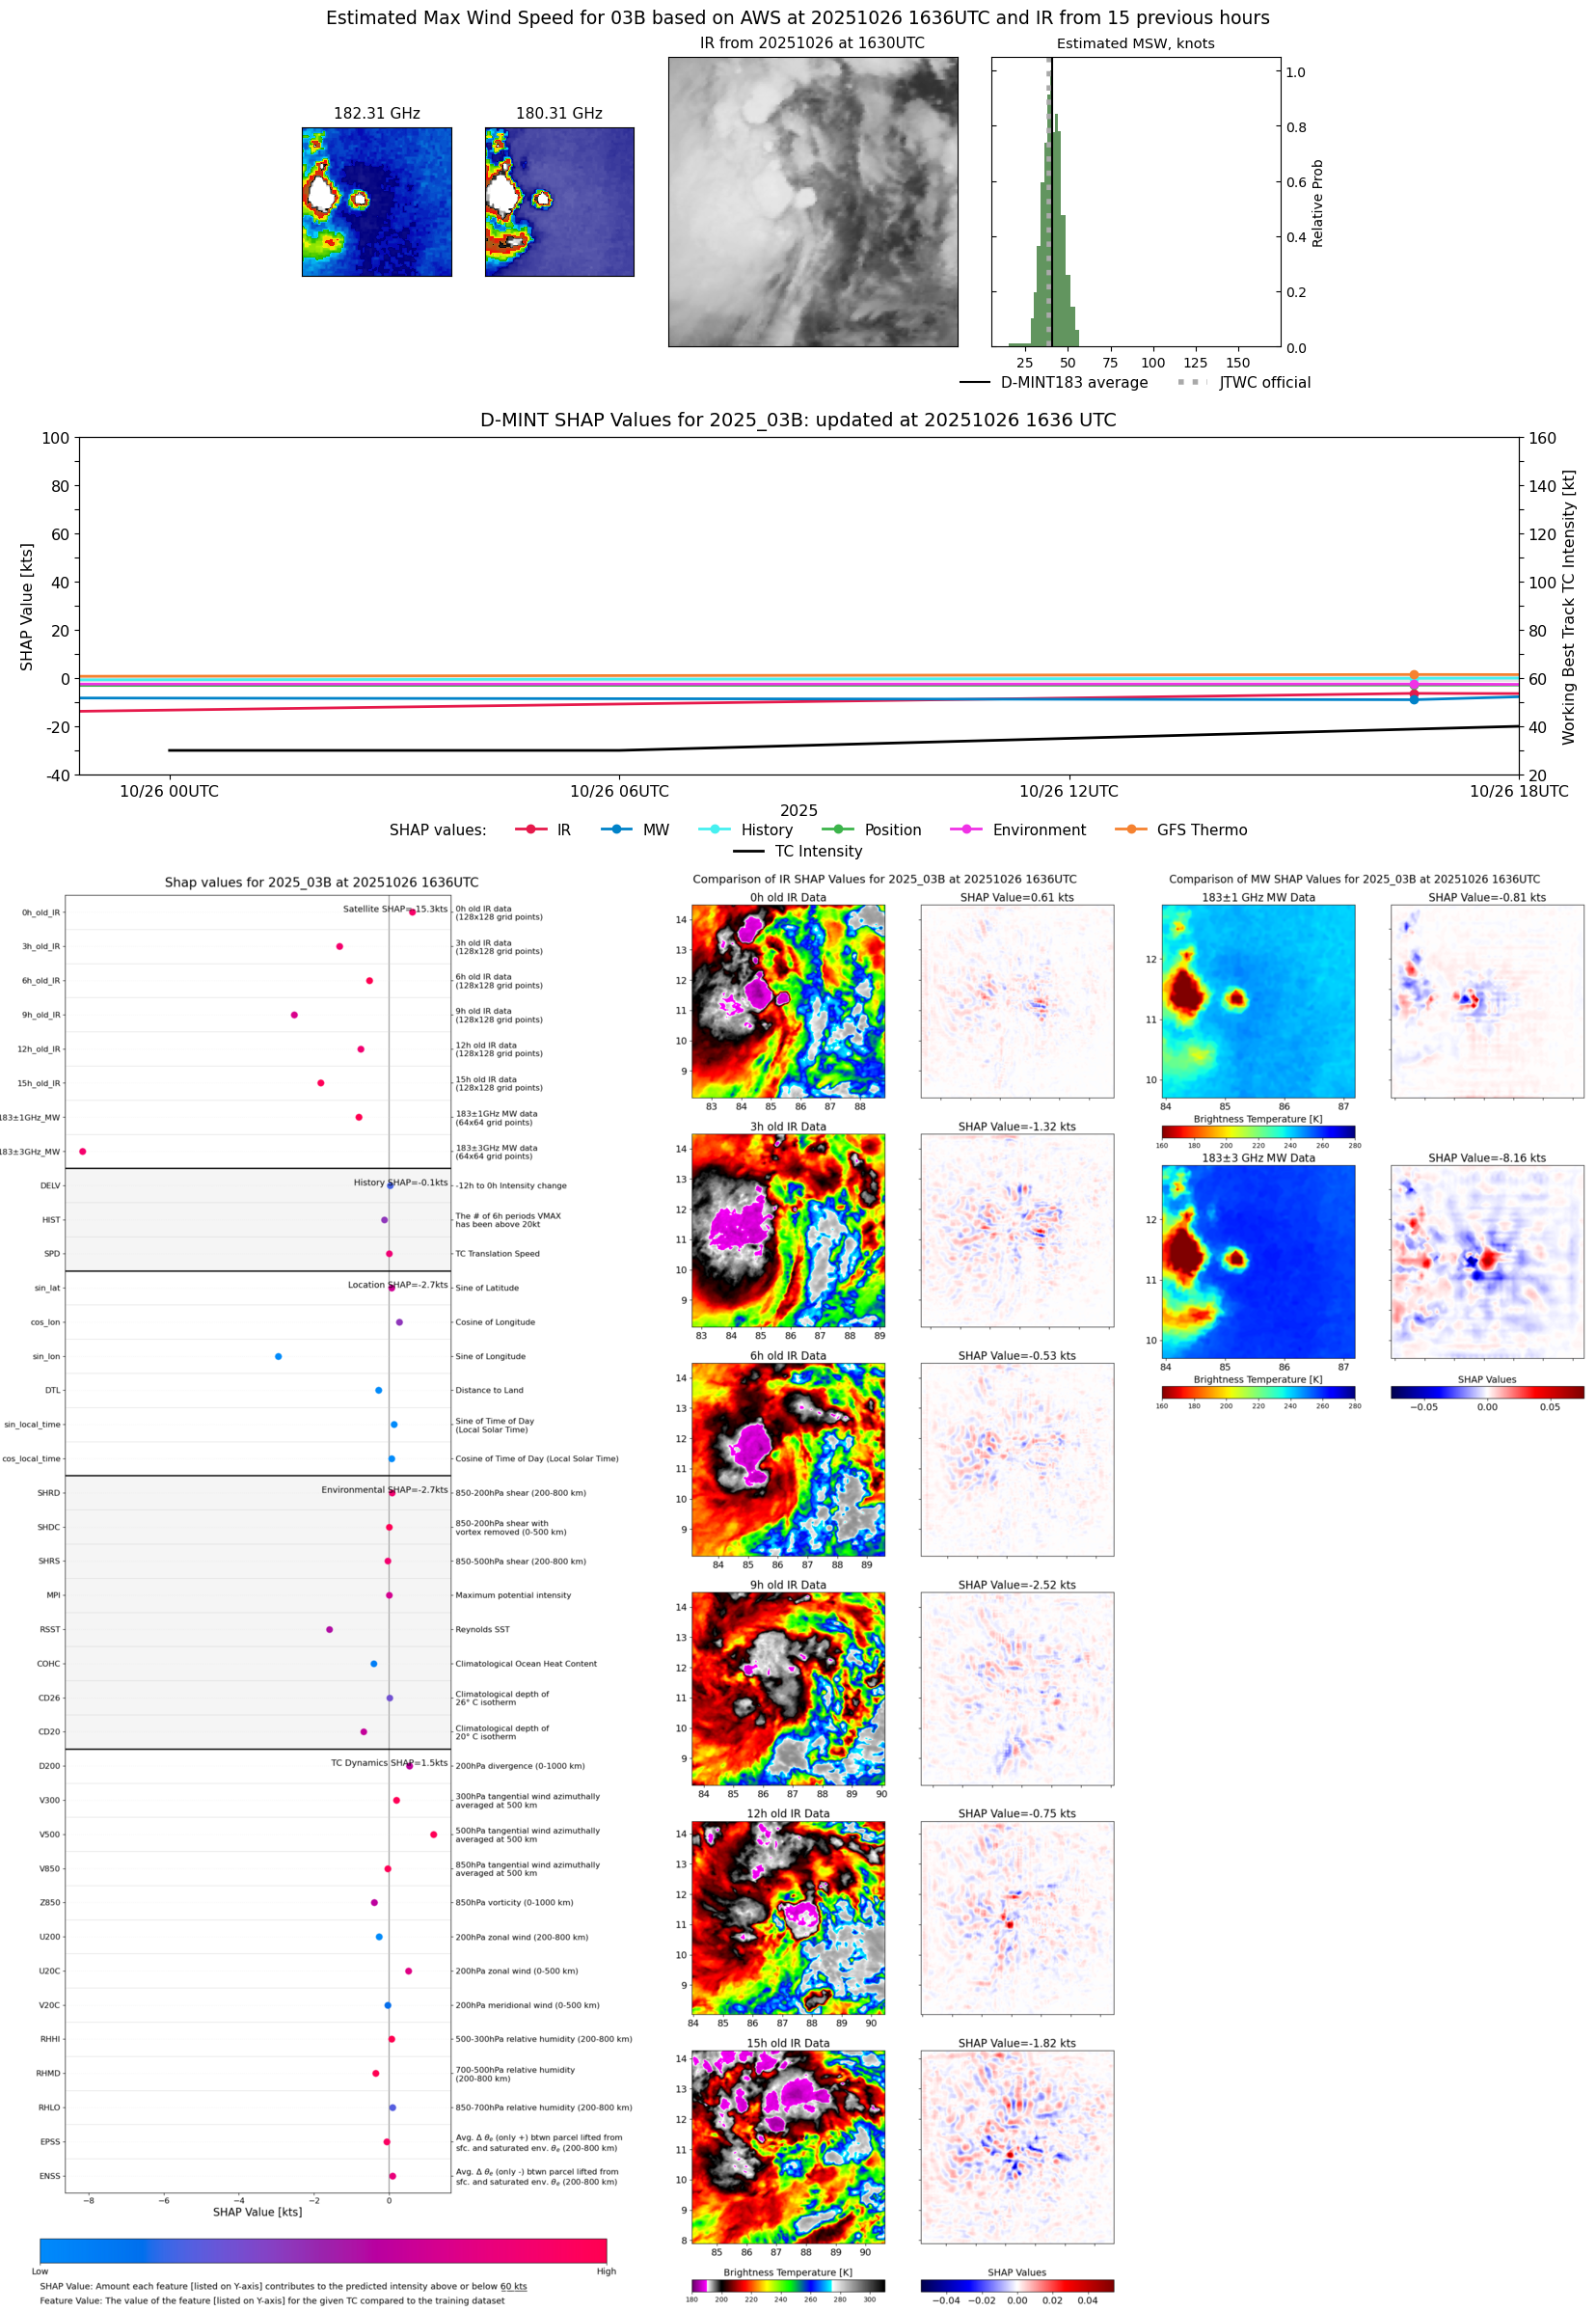 |
| 20251026 | 1034 UTC | TMS07 | 995 hPa | 34 kts | 32 kts | 37 kts | 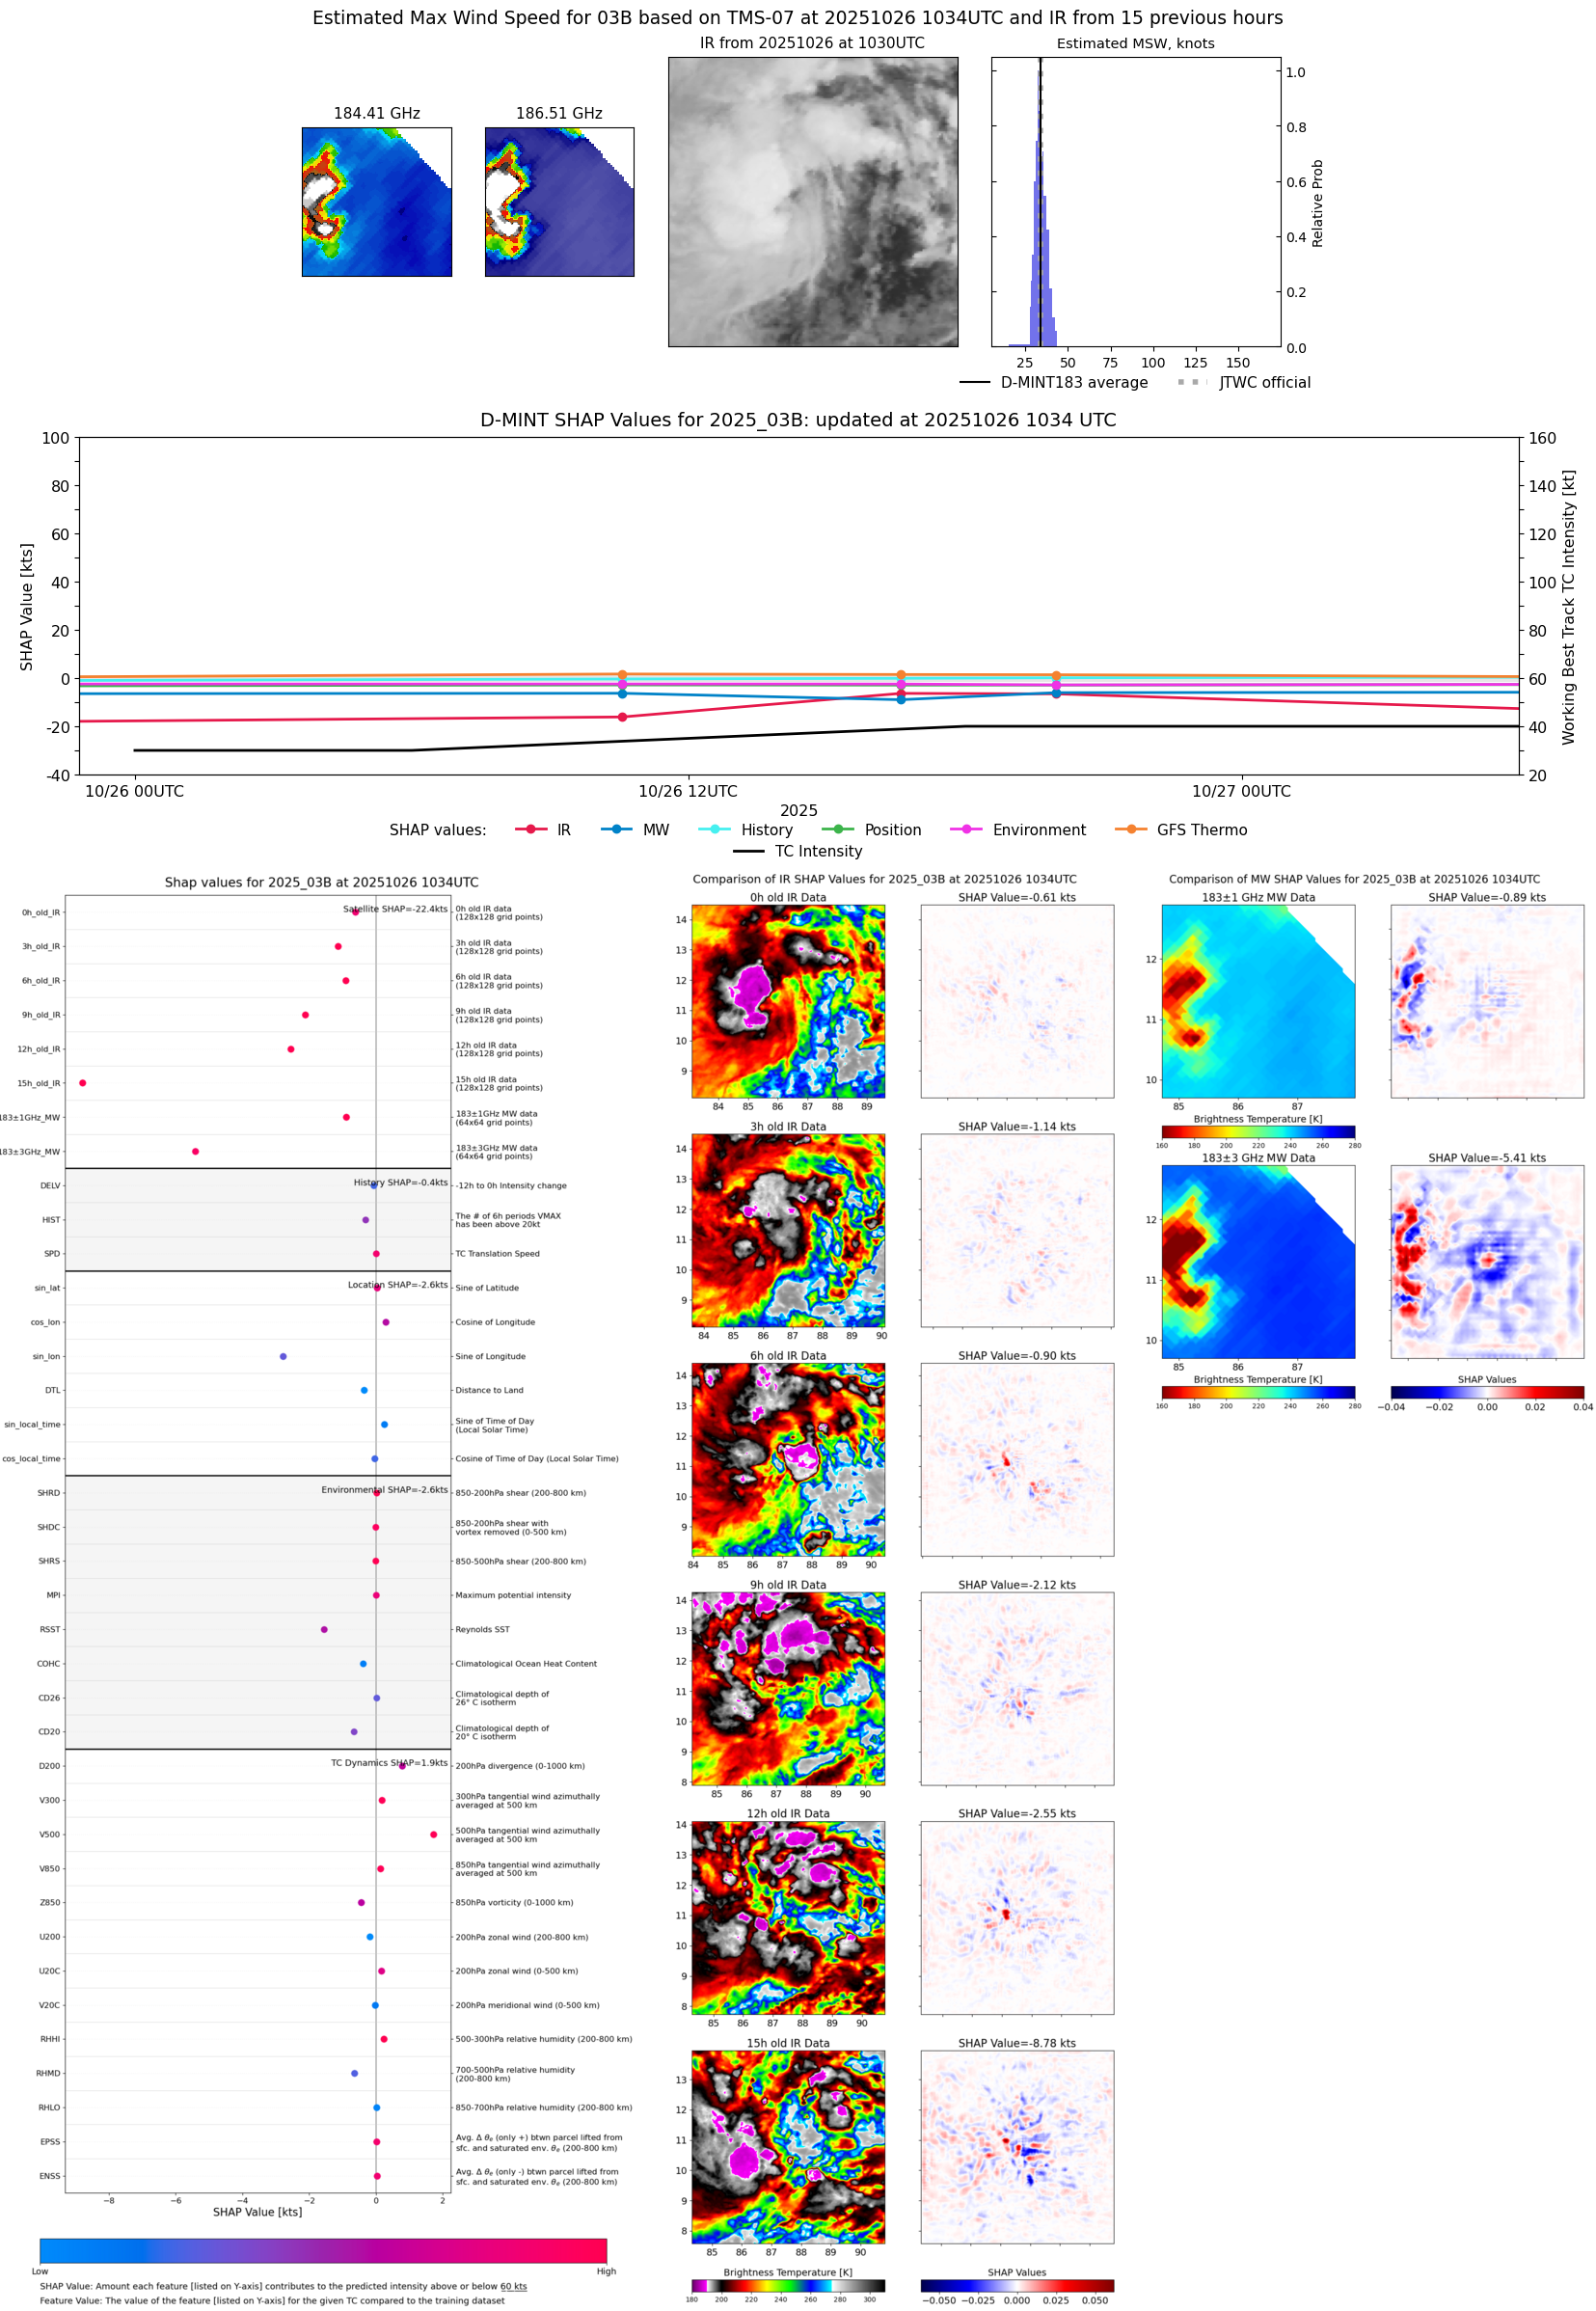 |
| 20251026 | 0022 UTC | WSFM01 | 1004 hPa | 28 kts | 26 kts | 31 kts | 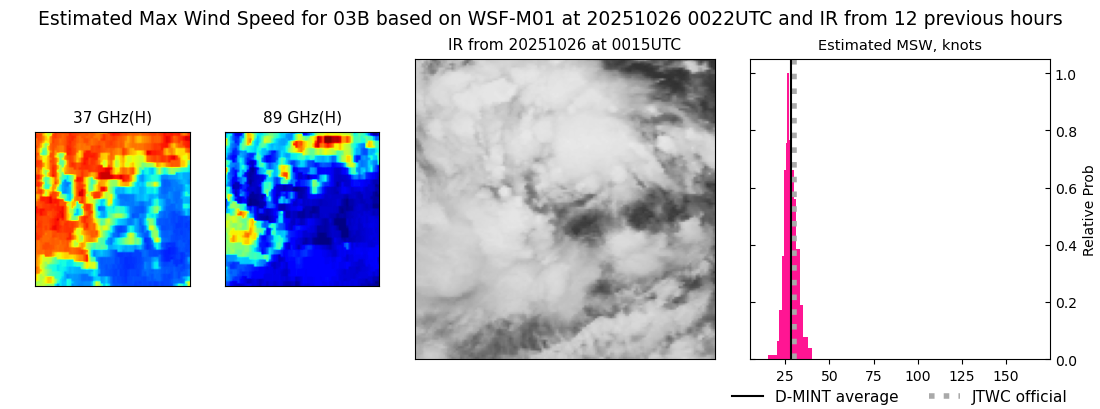 |
| 20251025 | 1625 UTC | AWS | 1000 hPa | 27 kts | 25 kts | 31 kts |  |
| 20251025 | 1148 UTC | WSFM01 | 1002 hPa | 28 kts | 26 kts | 31 kts | 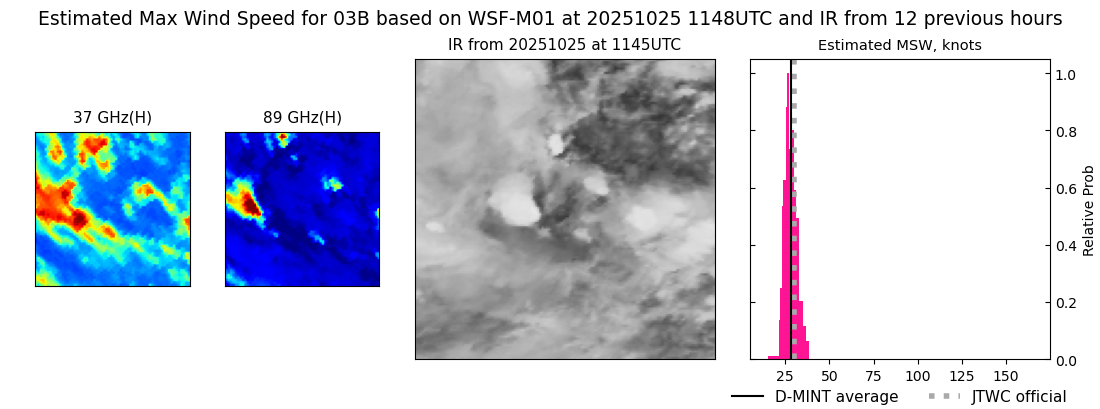 |
| 20251025 | 1034 UTC | TMS07 | 1000 hPa | 27 kts | 25 kts | 29 kts | 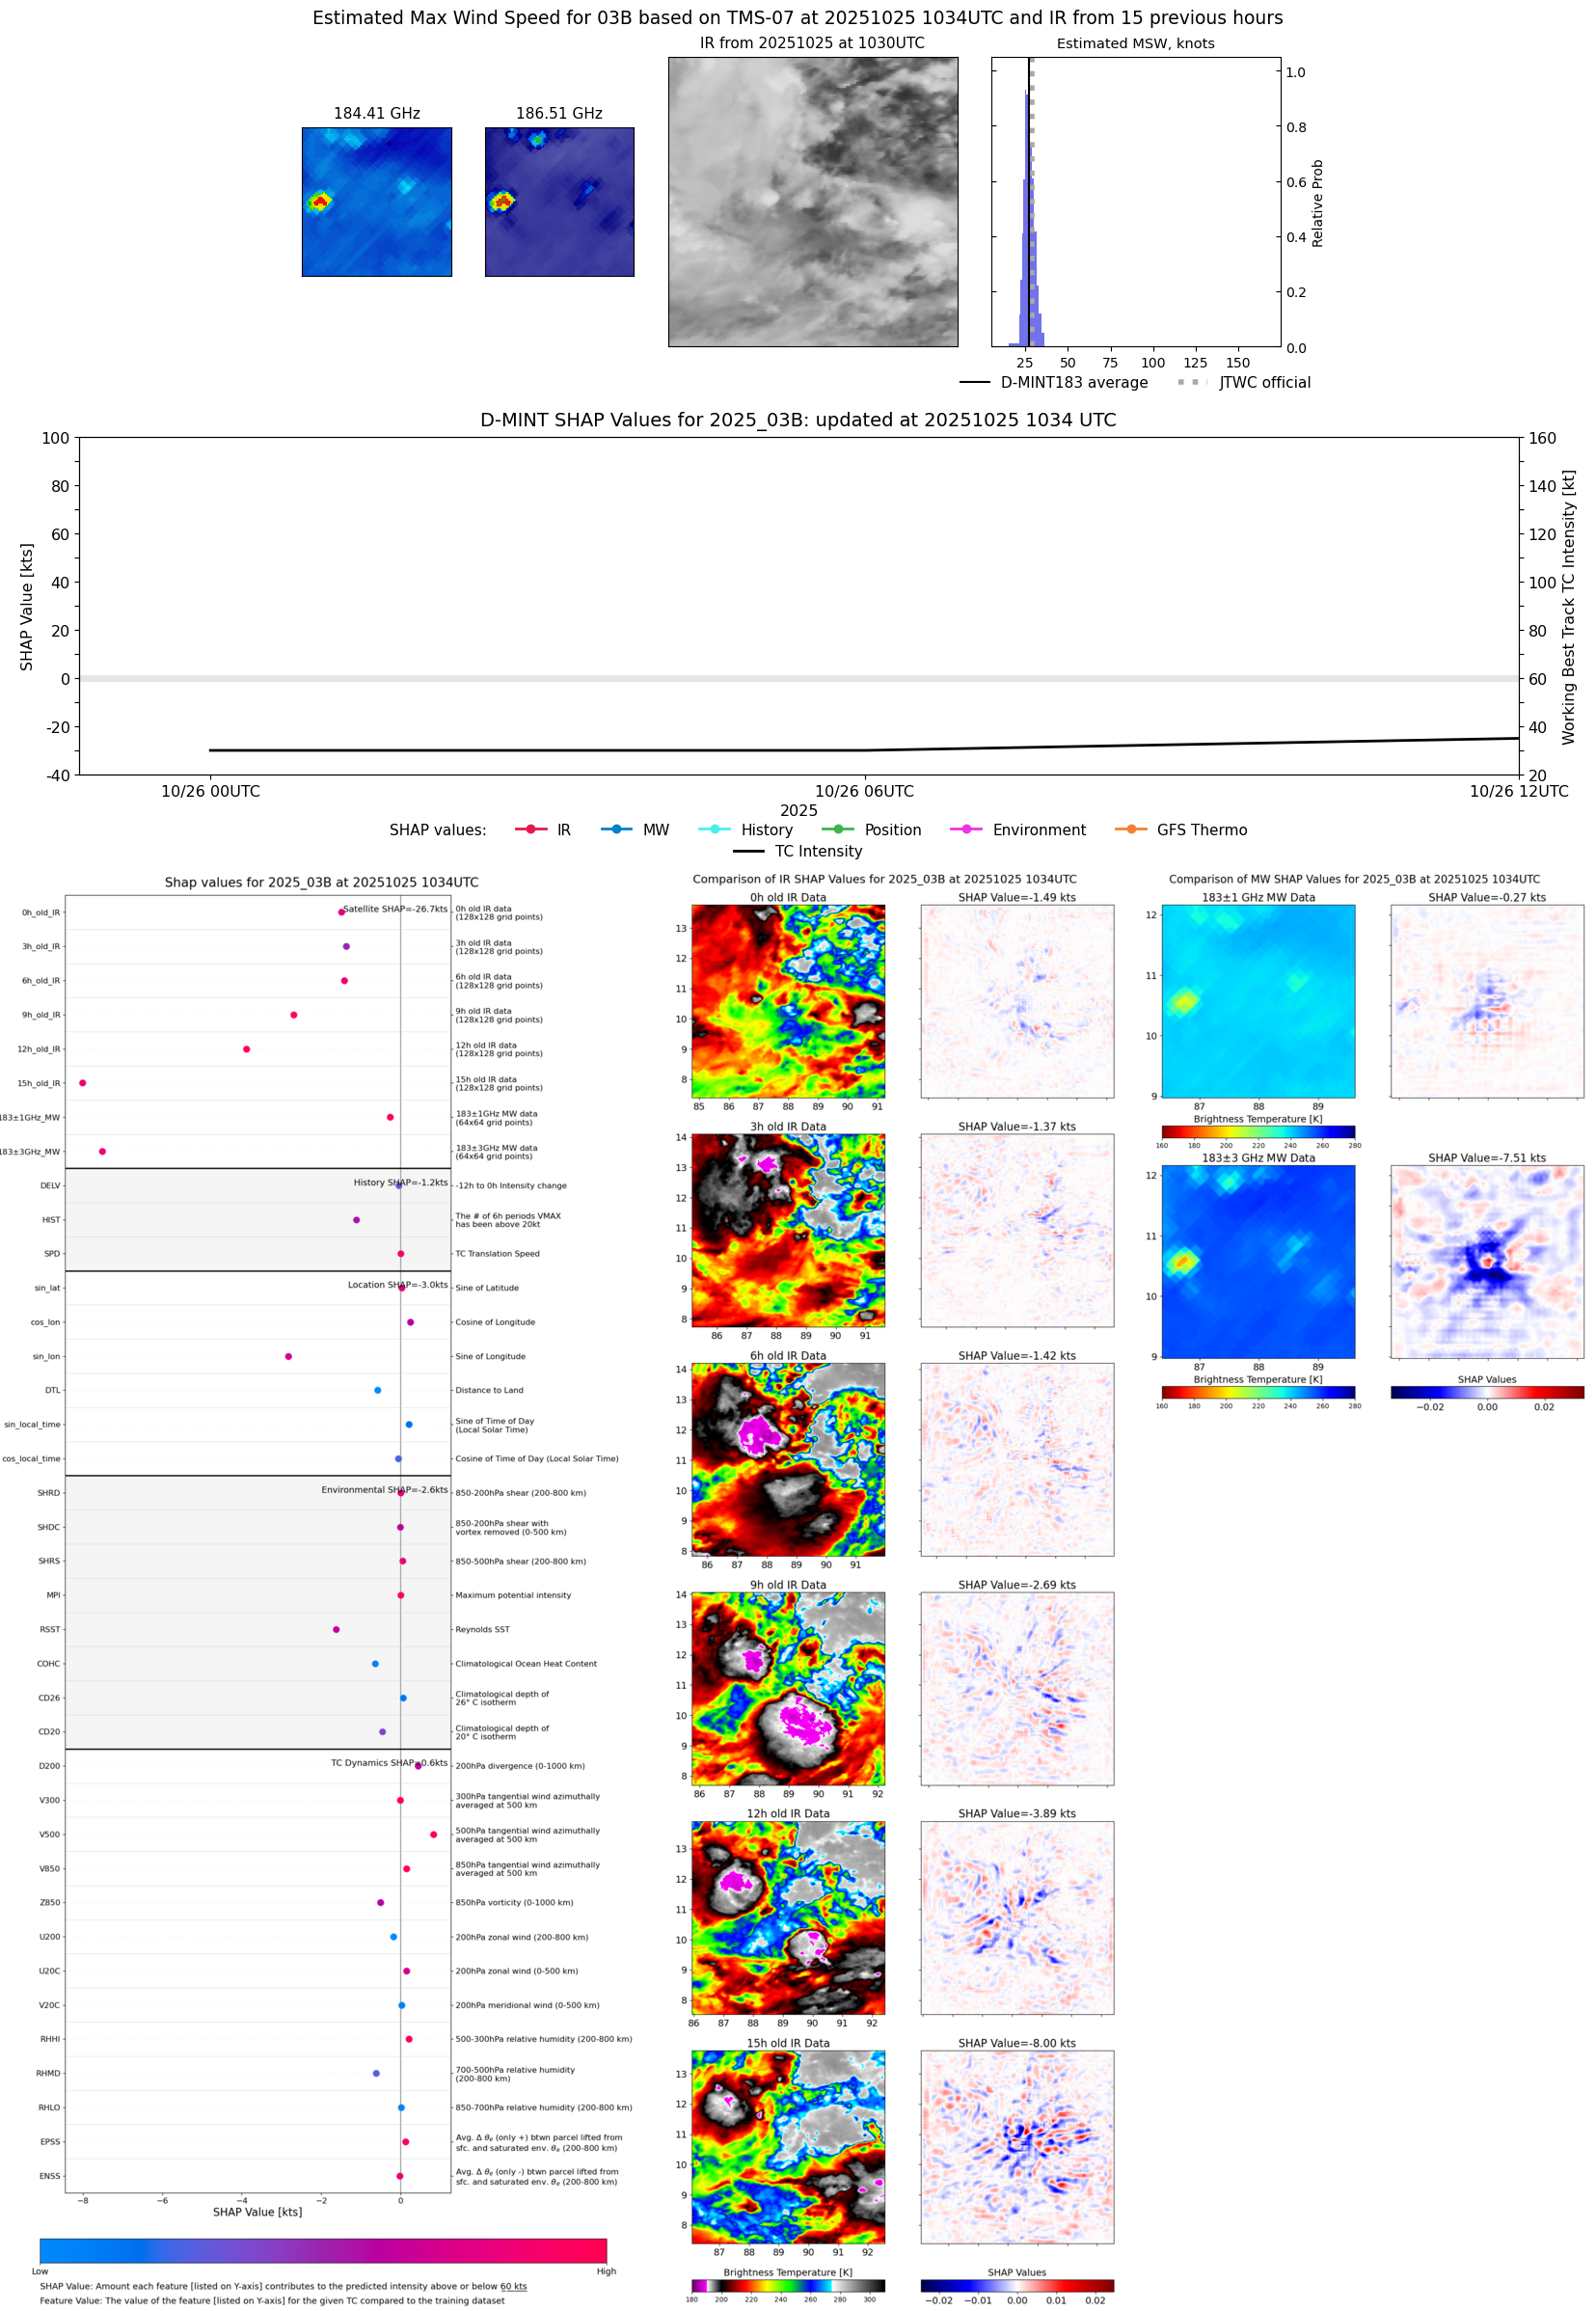 |
| 20251025 | 0751 UTC | TROPICS03 | 1001 hPa | 24 kts | 22 kts | 27 kts | 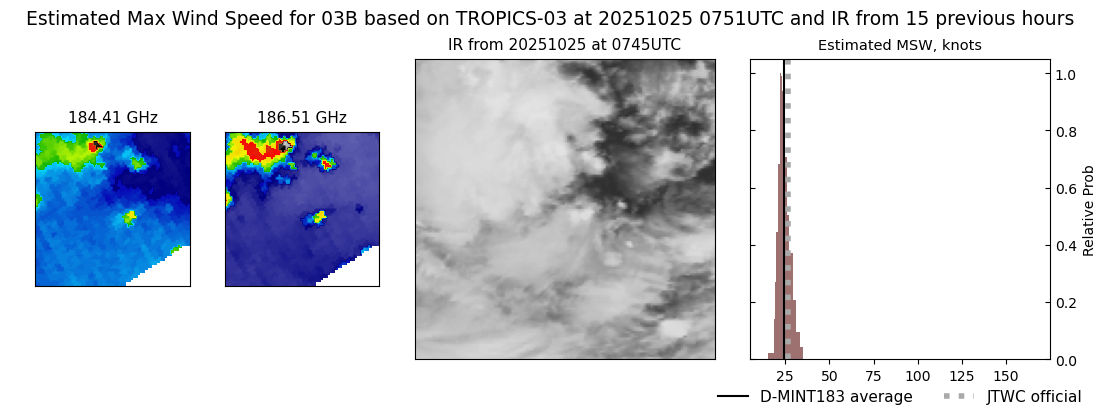 |
| 20251025 | 0551 UTC | TROPICS05 | 1004 hPa | 24 kts | 22 kts | 27 kts | 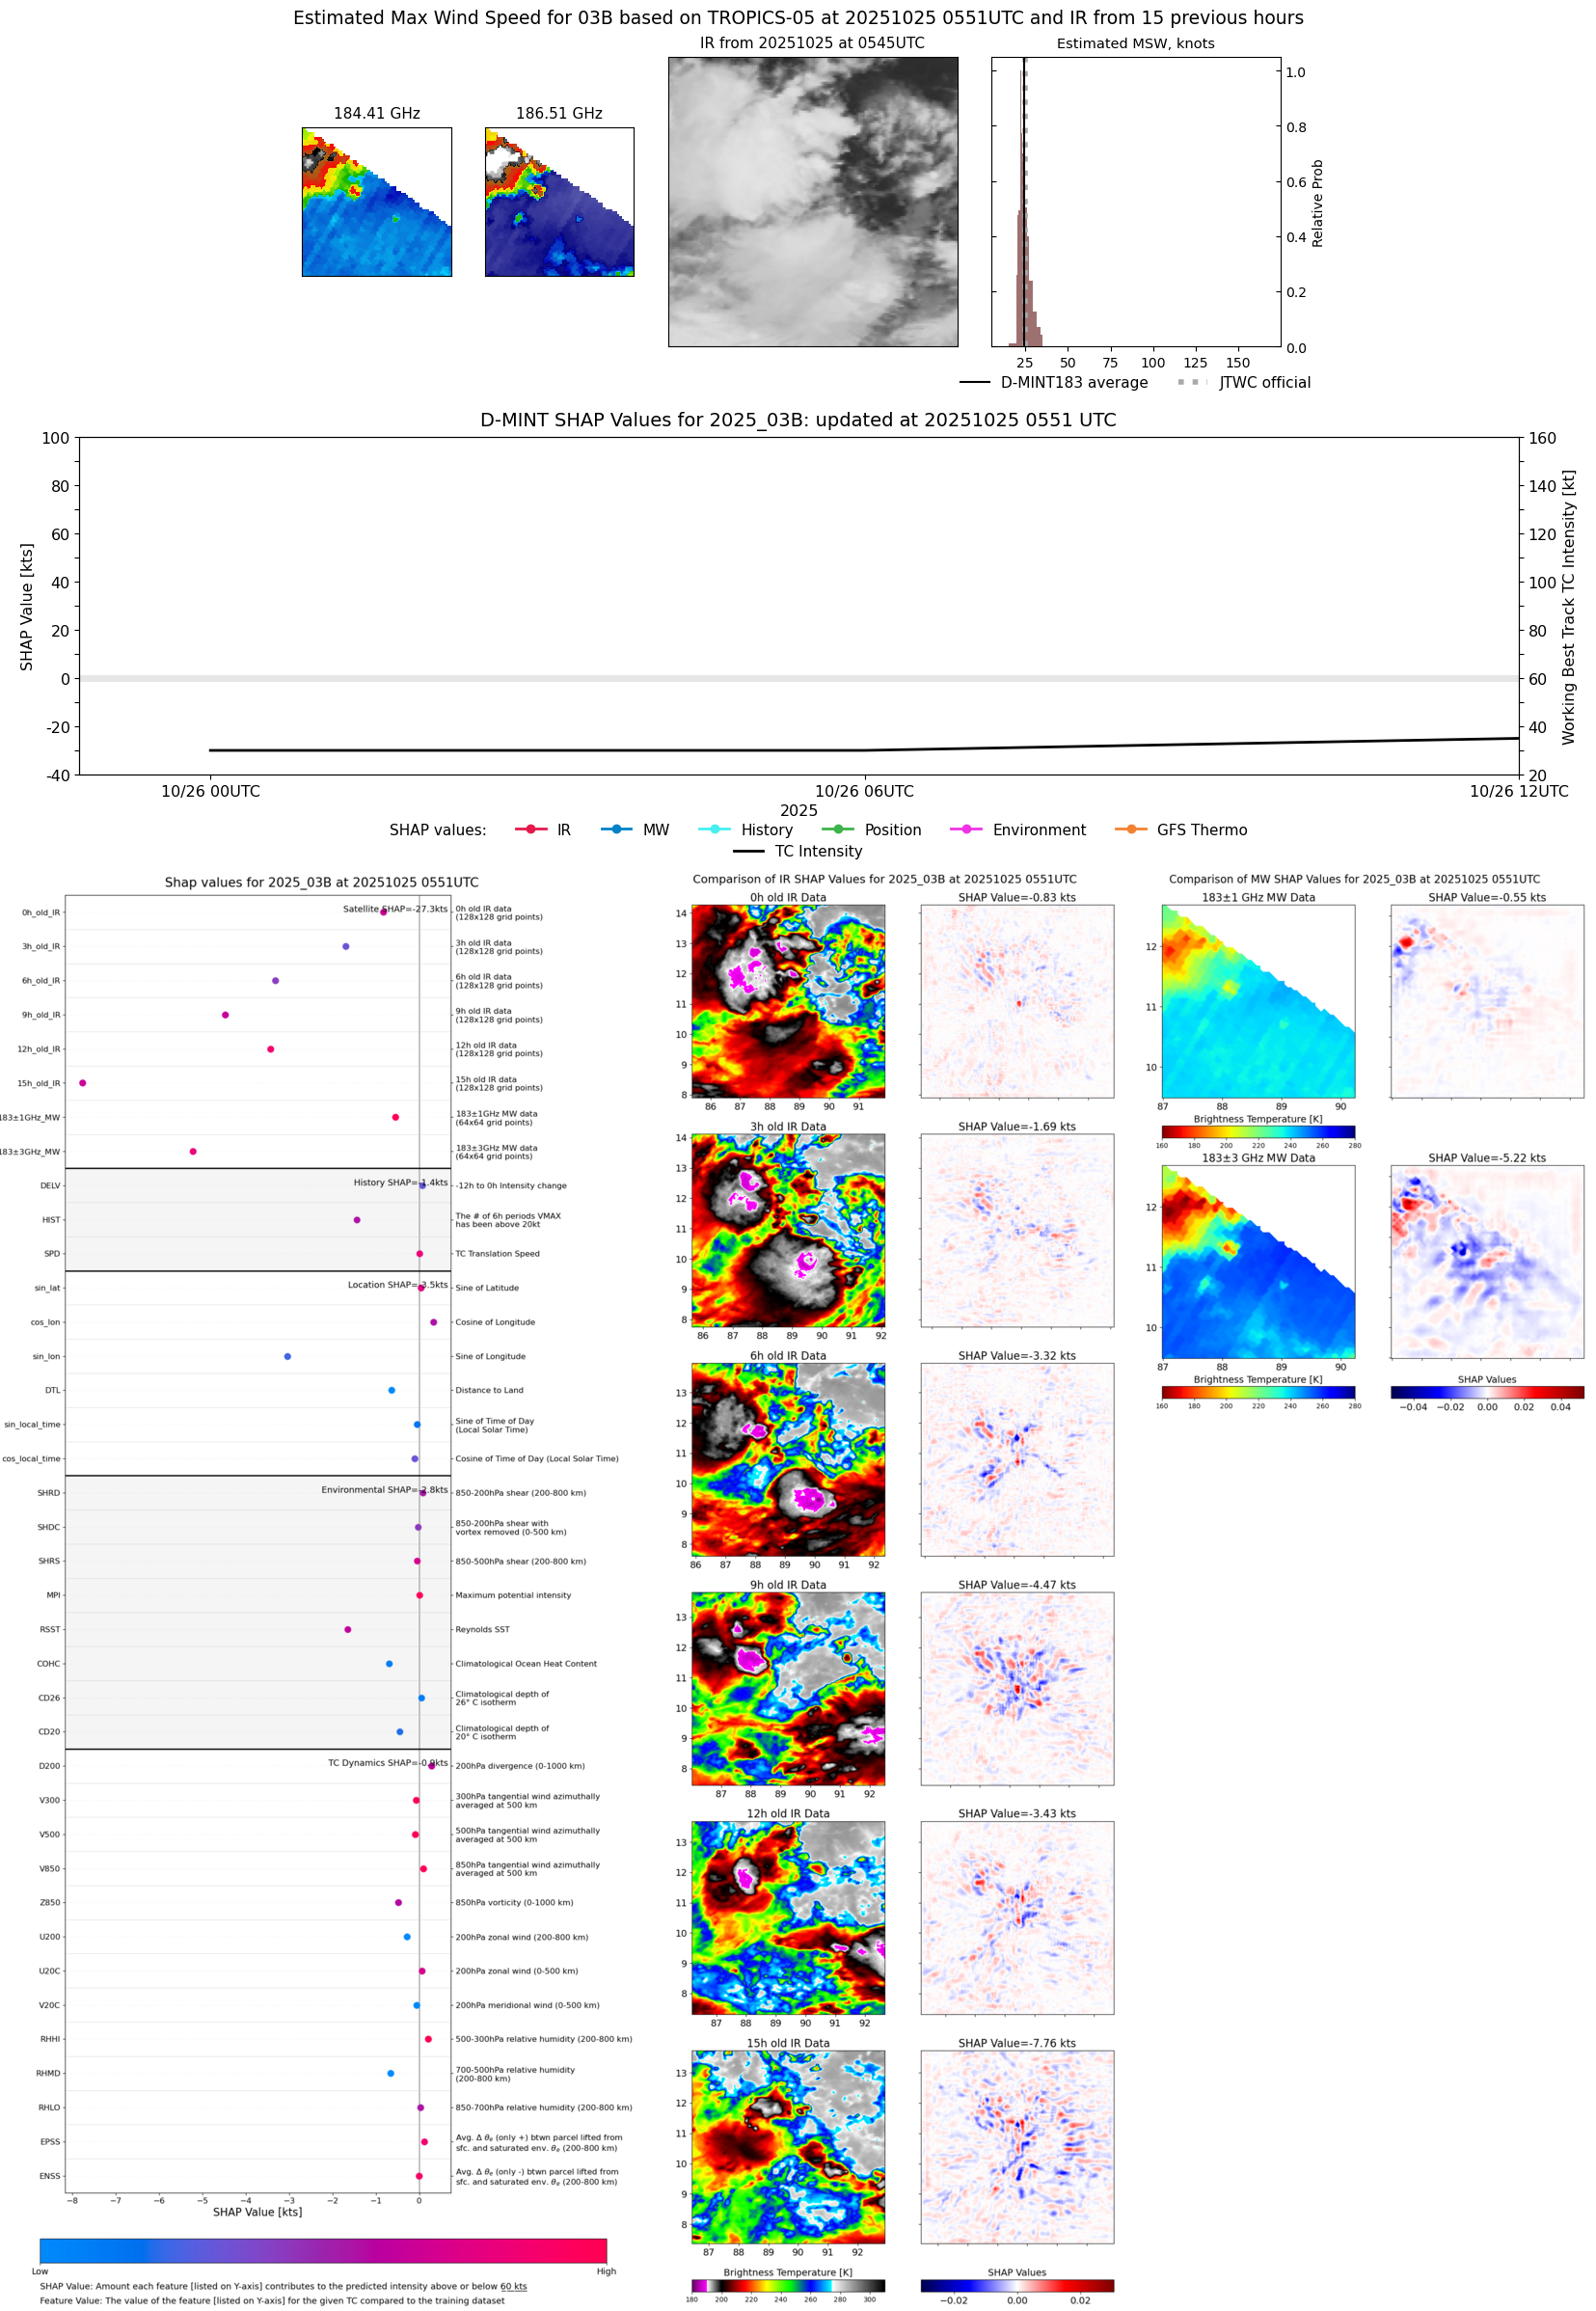 |
| 20251025 | 0008 UTC | TMS07 | 1003 hPa | 23 kts | 22 kts | 25 kts | 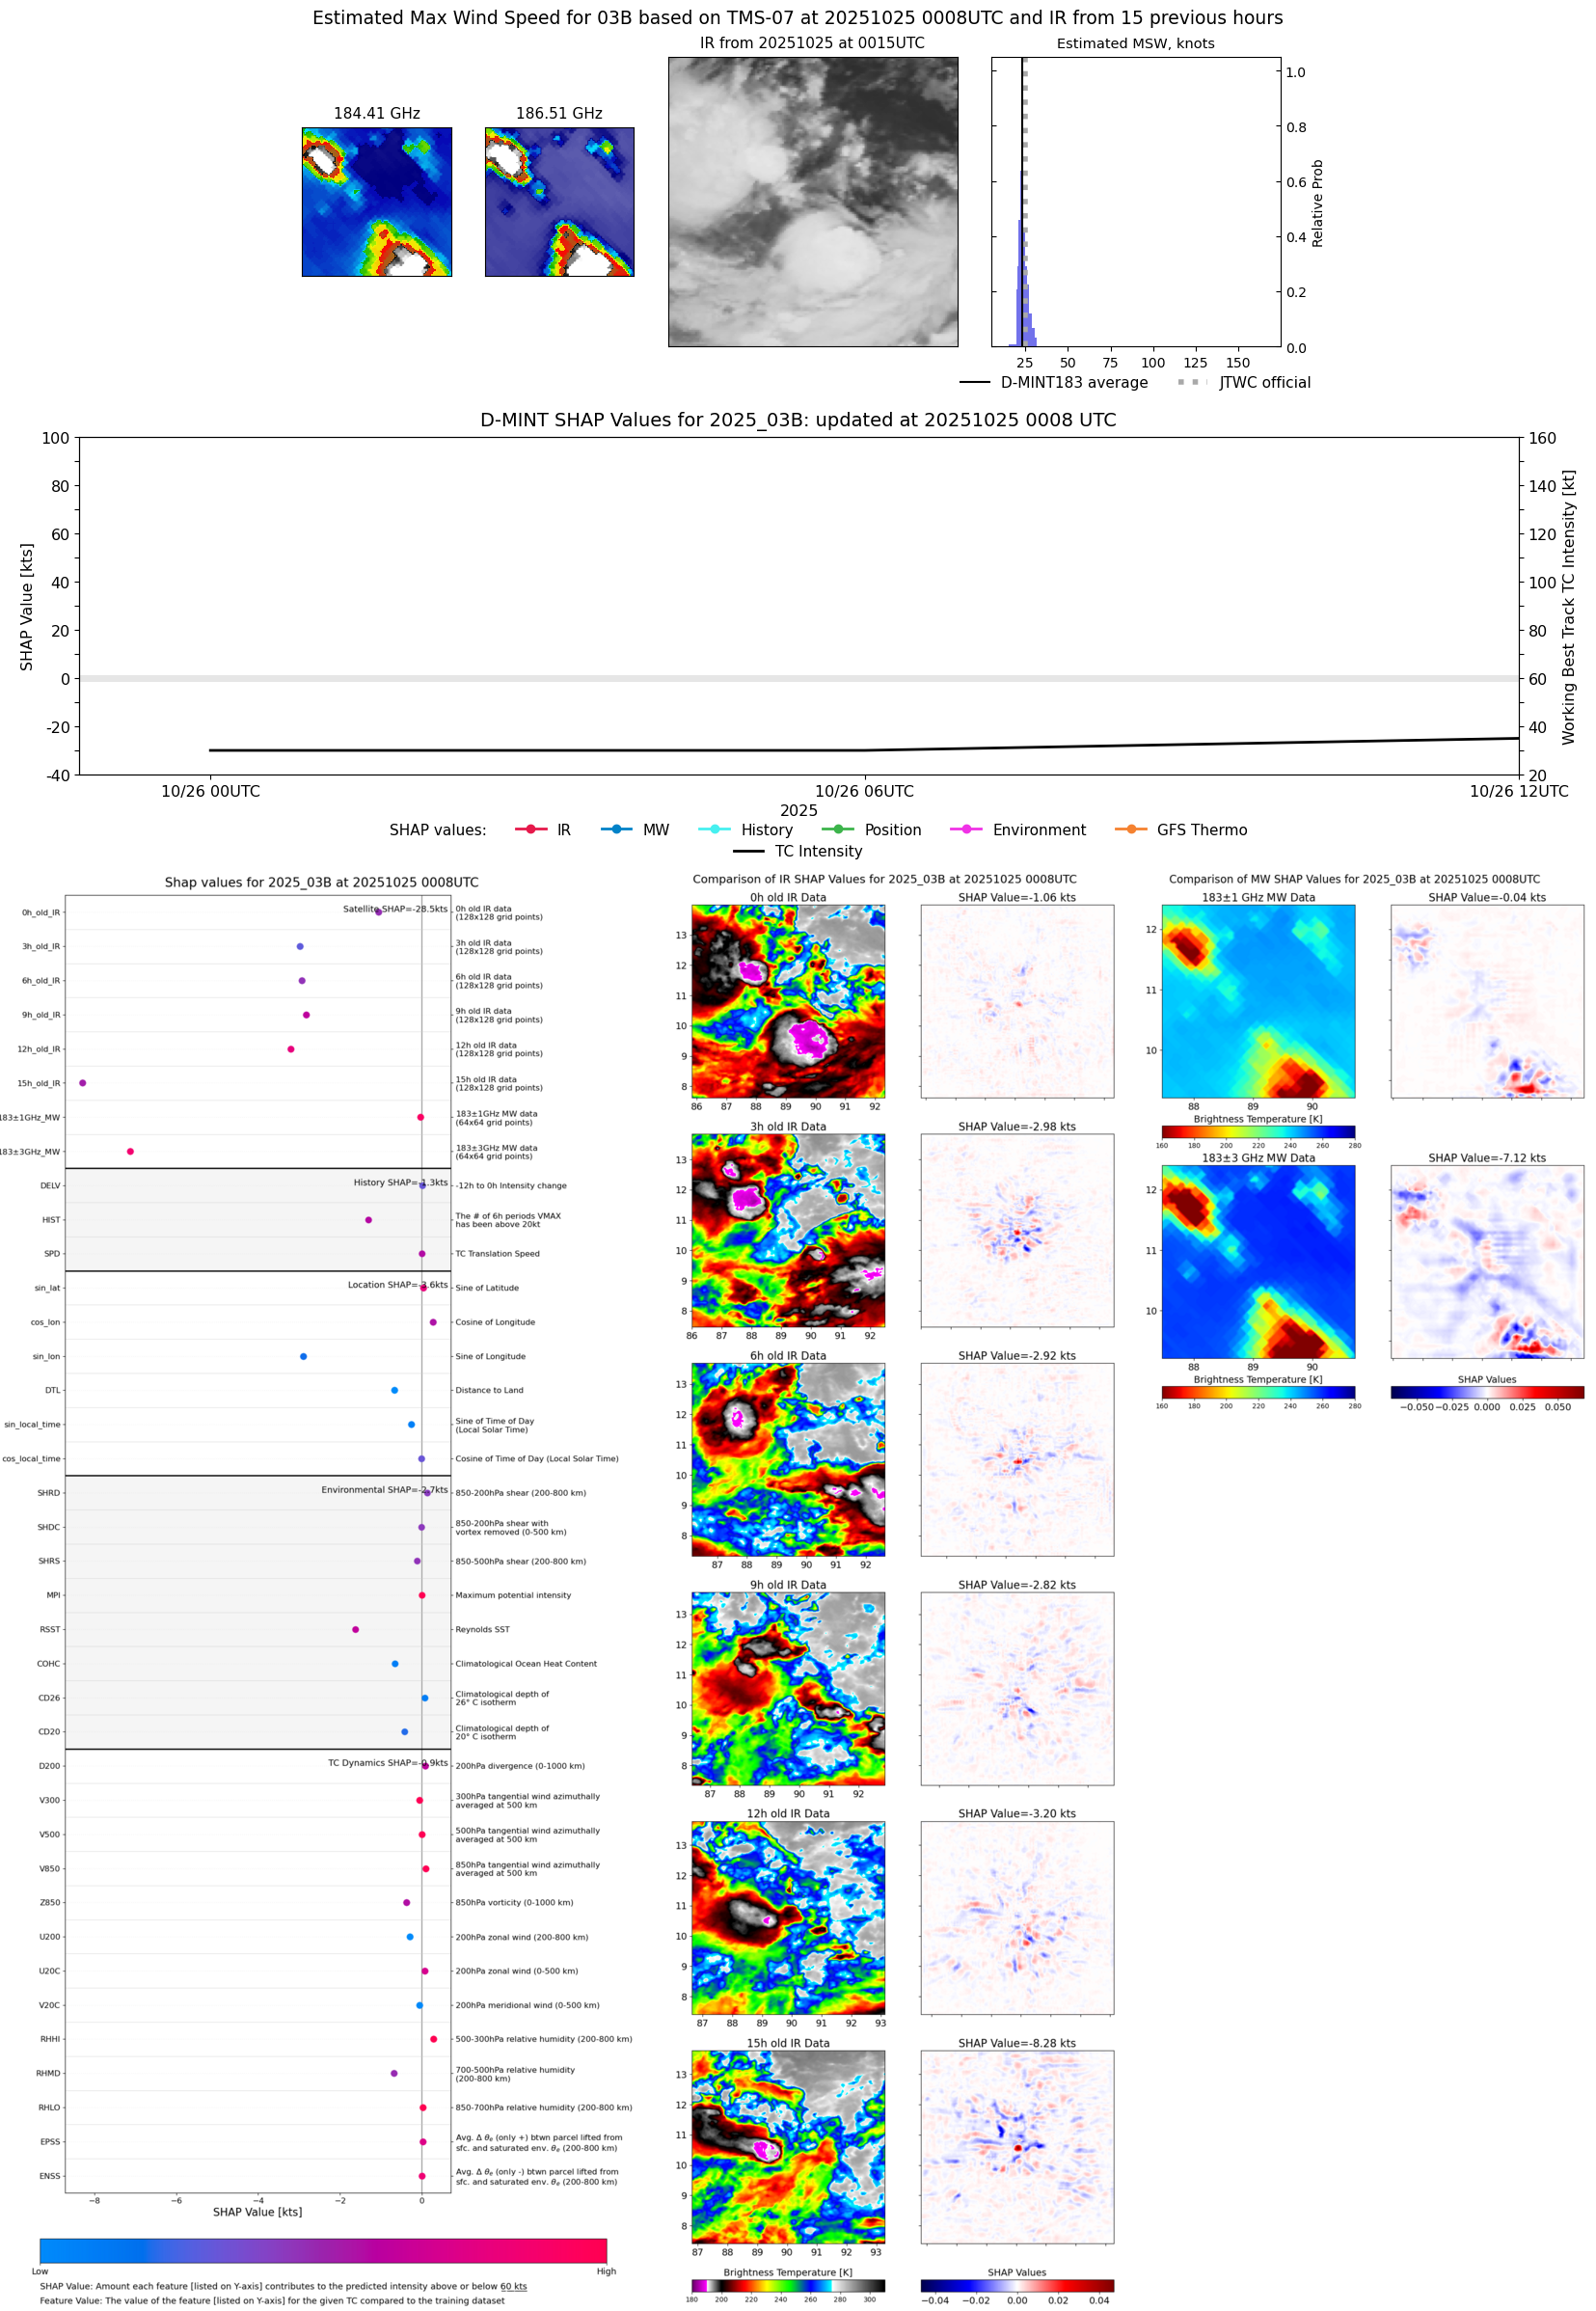 |
| 20251024 | 2006 UTC | TROPICS05 | 1003 hPa | 22 kts | 21 kts | 24 kts |  |
| 20251024 | 1208 UTC | WSFM01 | 1004 hPa | 21 kts | 20 kts | 22 kts | 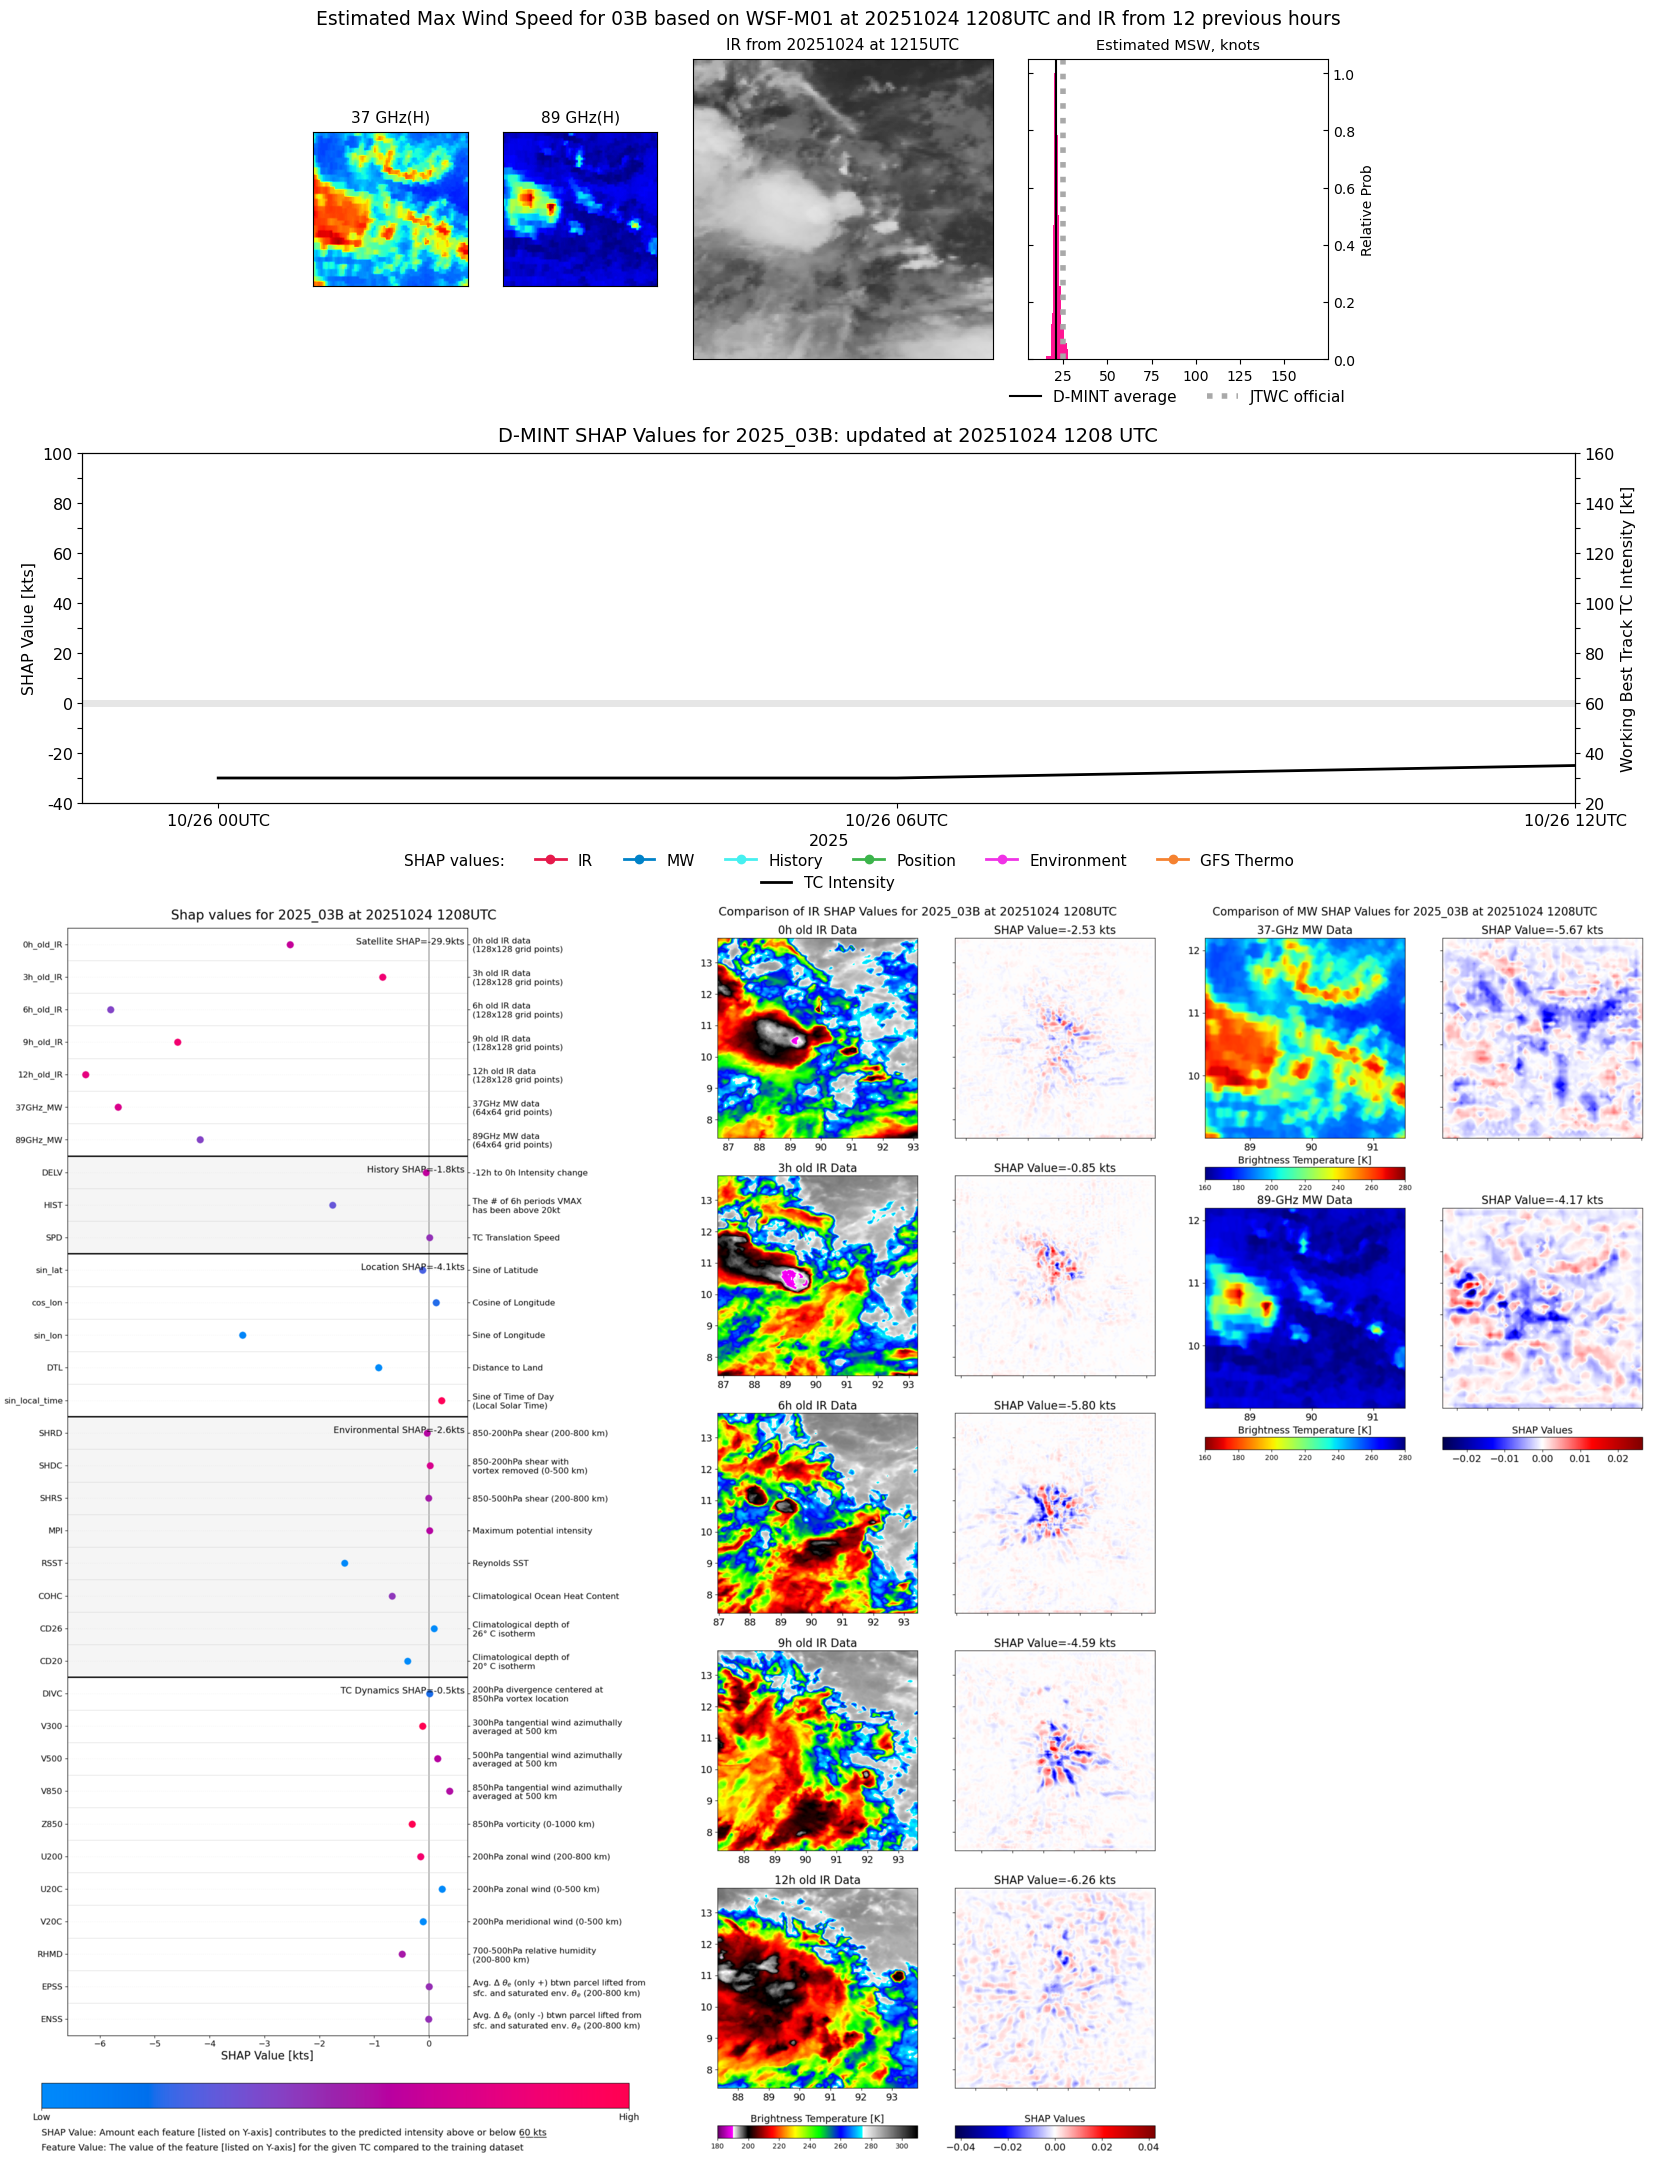 |
| 20251024 | 0025 UTC | SSMISF17 | NaN hPa | 21 kts | 17 kts | 25 kts | 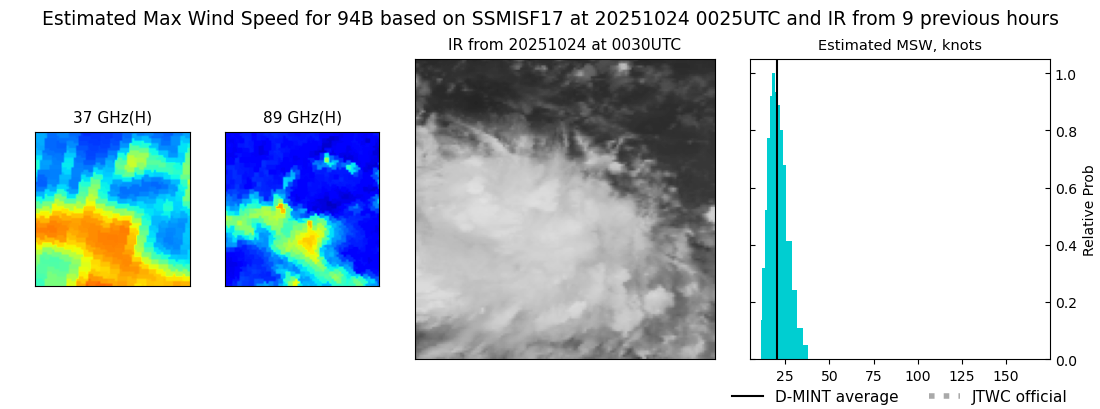 |