|
||

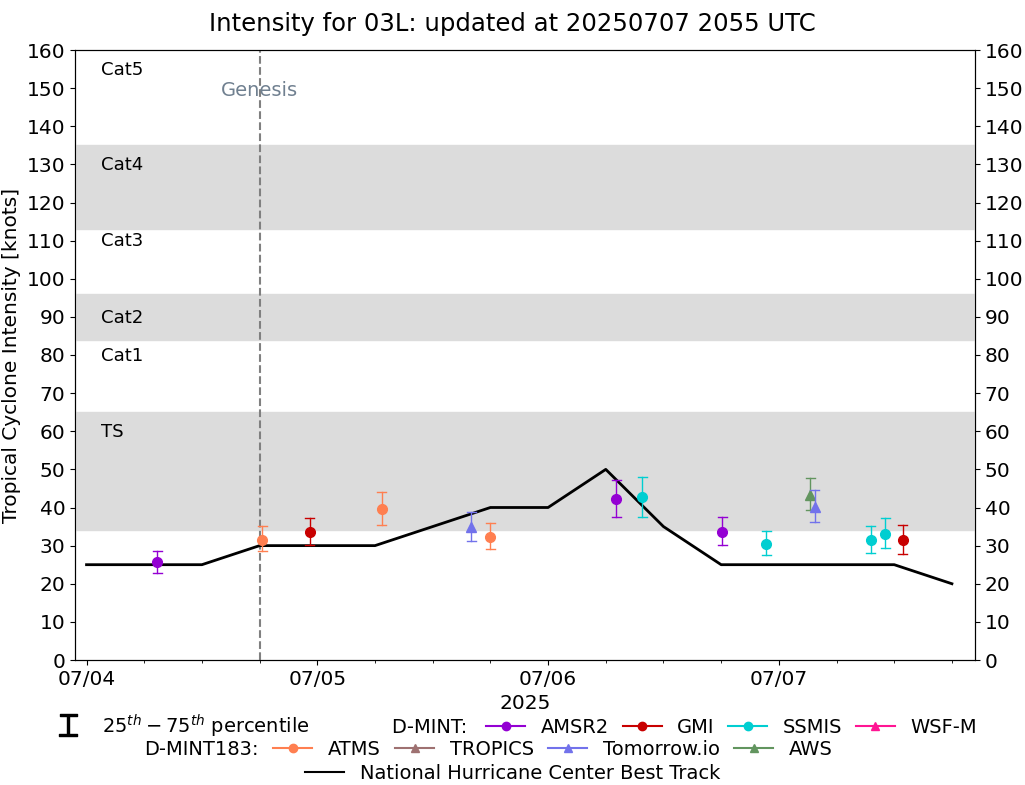 |
D-MINT HISTORY FILE for 2025_03L
| Date | Time | MW Sensor | MSLP | Vmax (30th-70th percentile average) | Vmax 25th percentile | Vmax 75th percentile | Image |
| 20250707 | 1253 UTC | GMI | 1007 hPa | 31 kts | 28 kts | 35 kts | 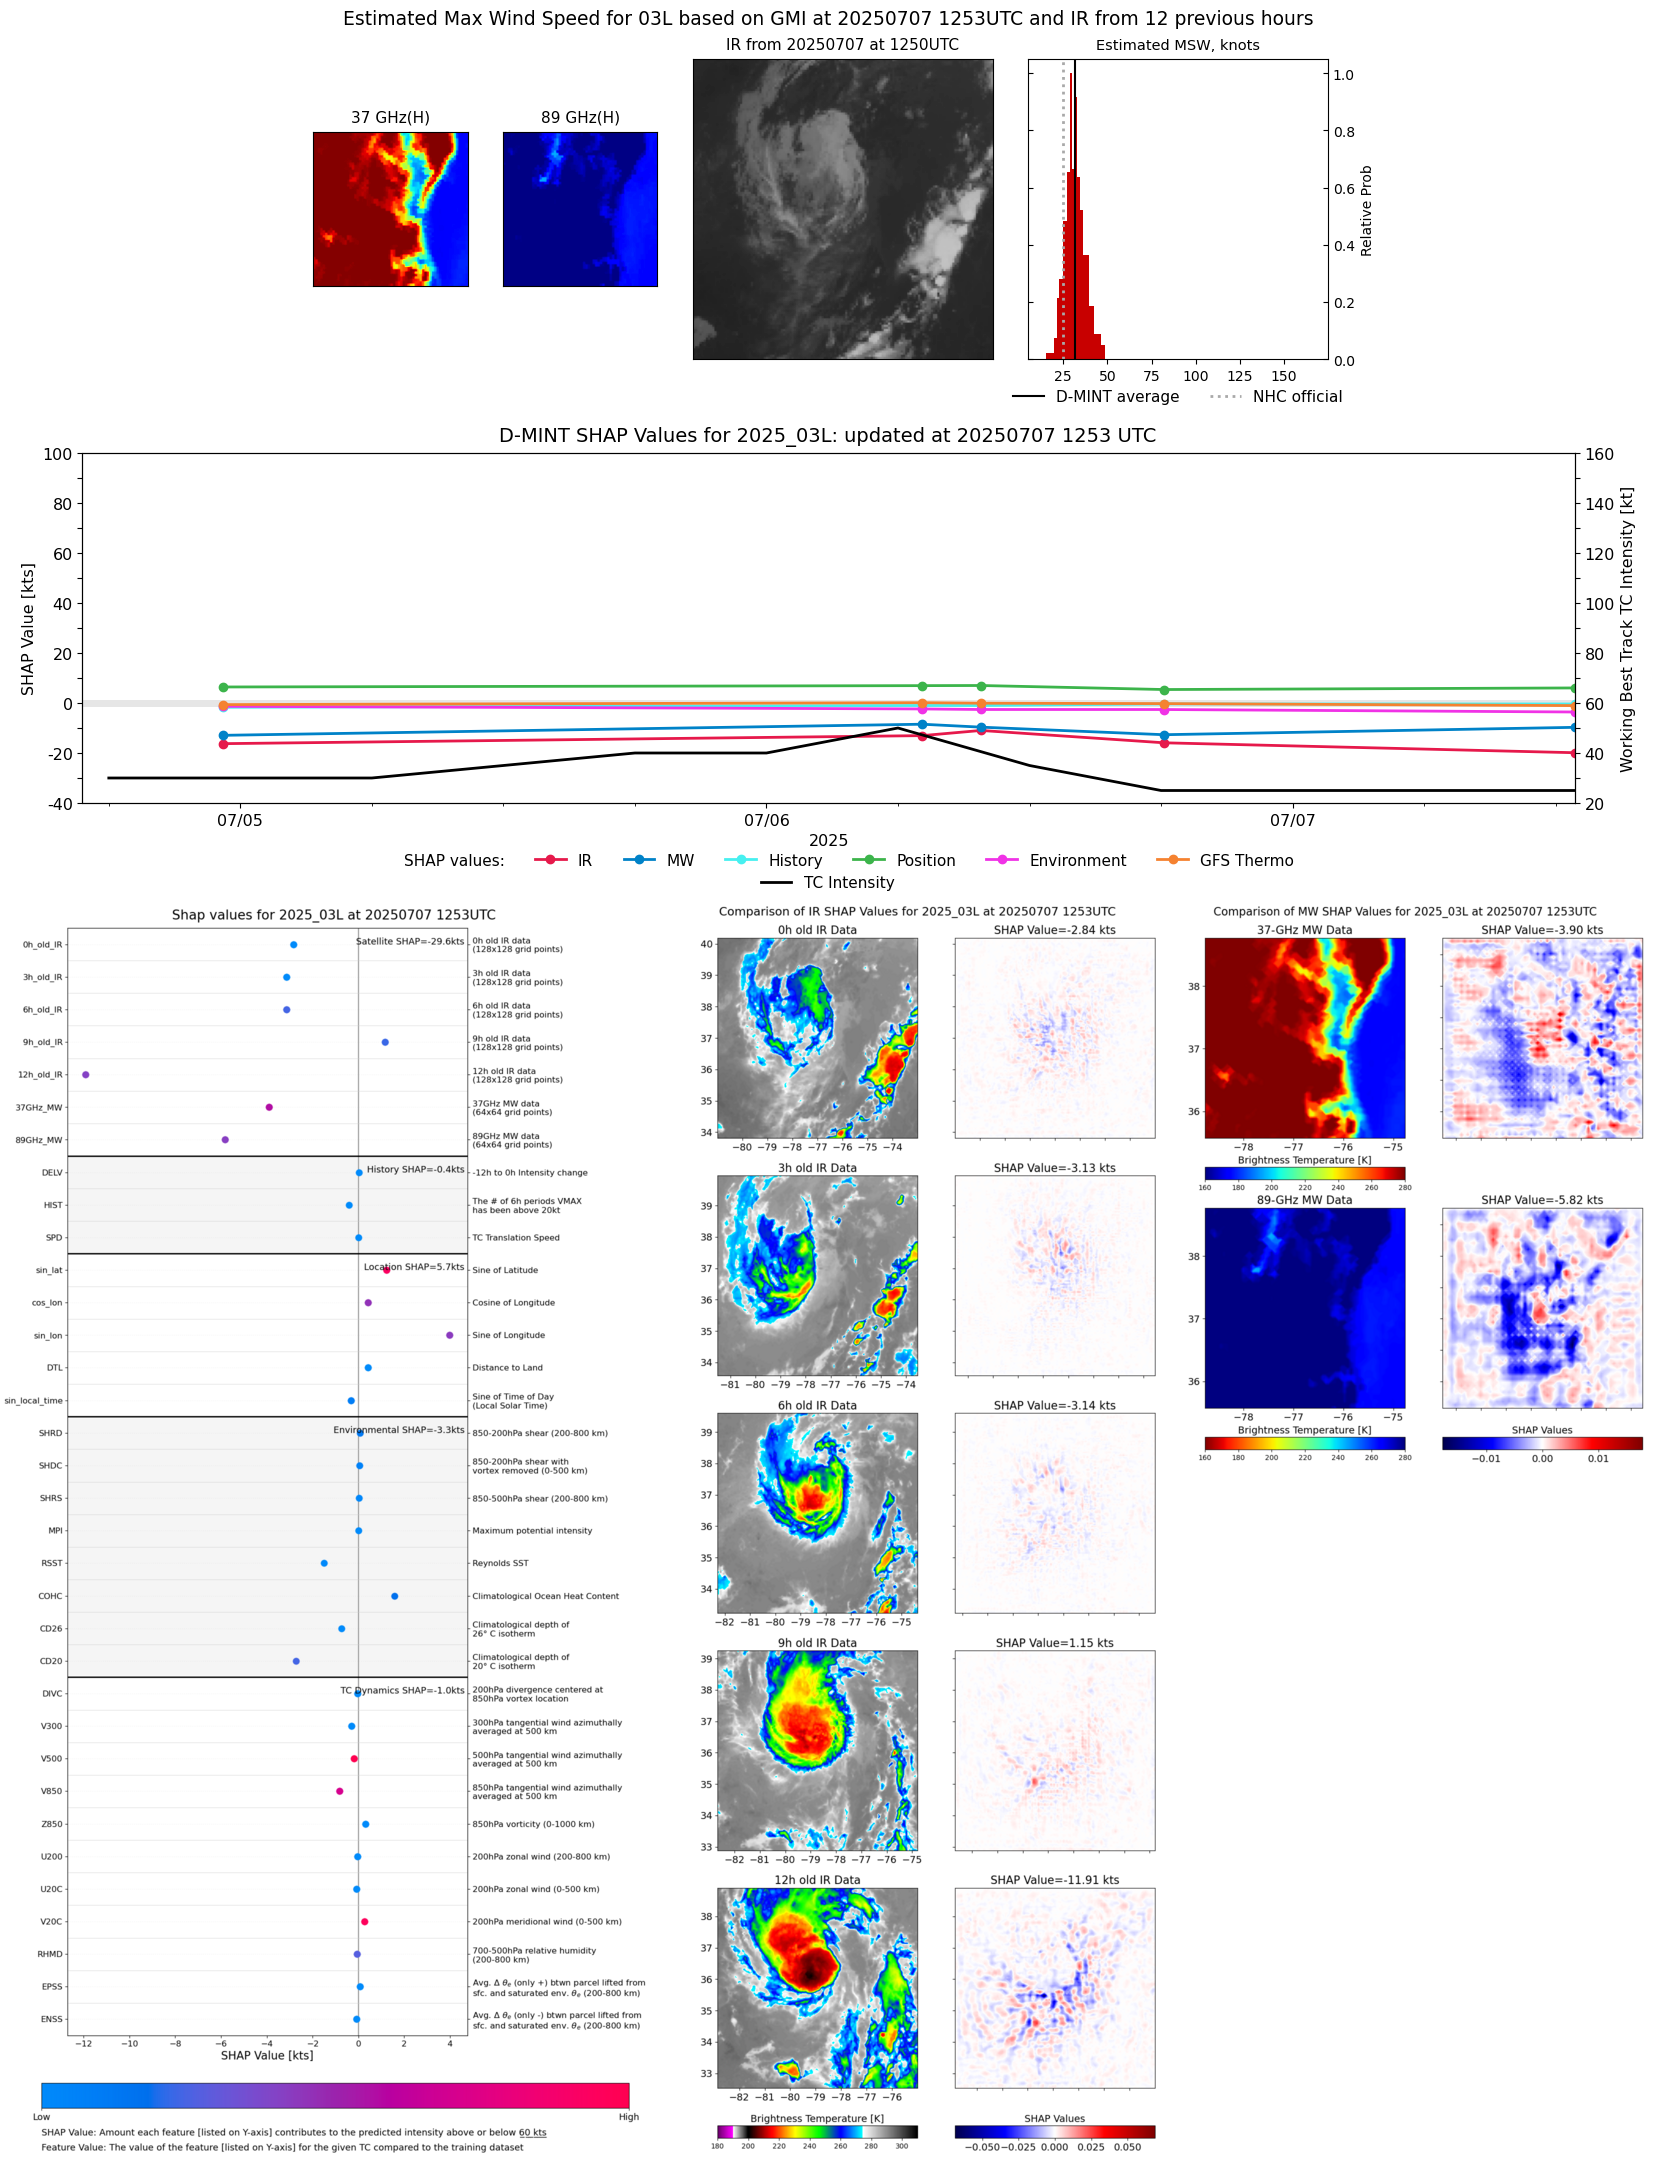 |
| 20250707 | 1104 UTC | SSMISF17 | 1009 hPa | 33 kts | 29 kts | 37 kts | 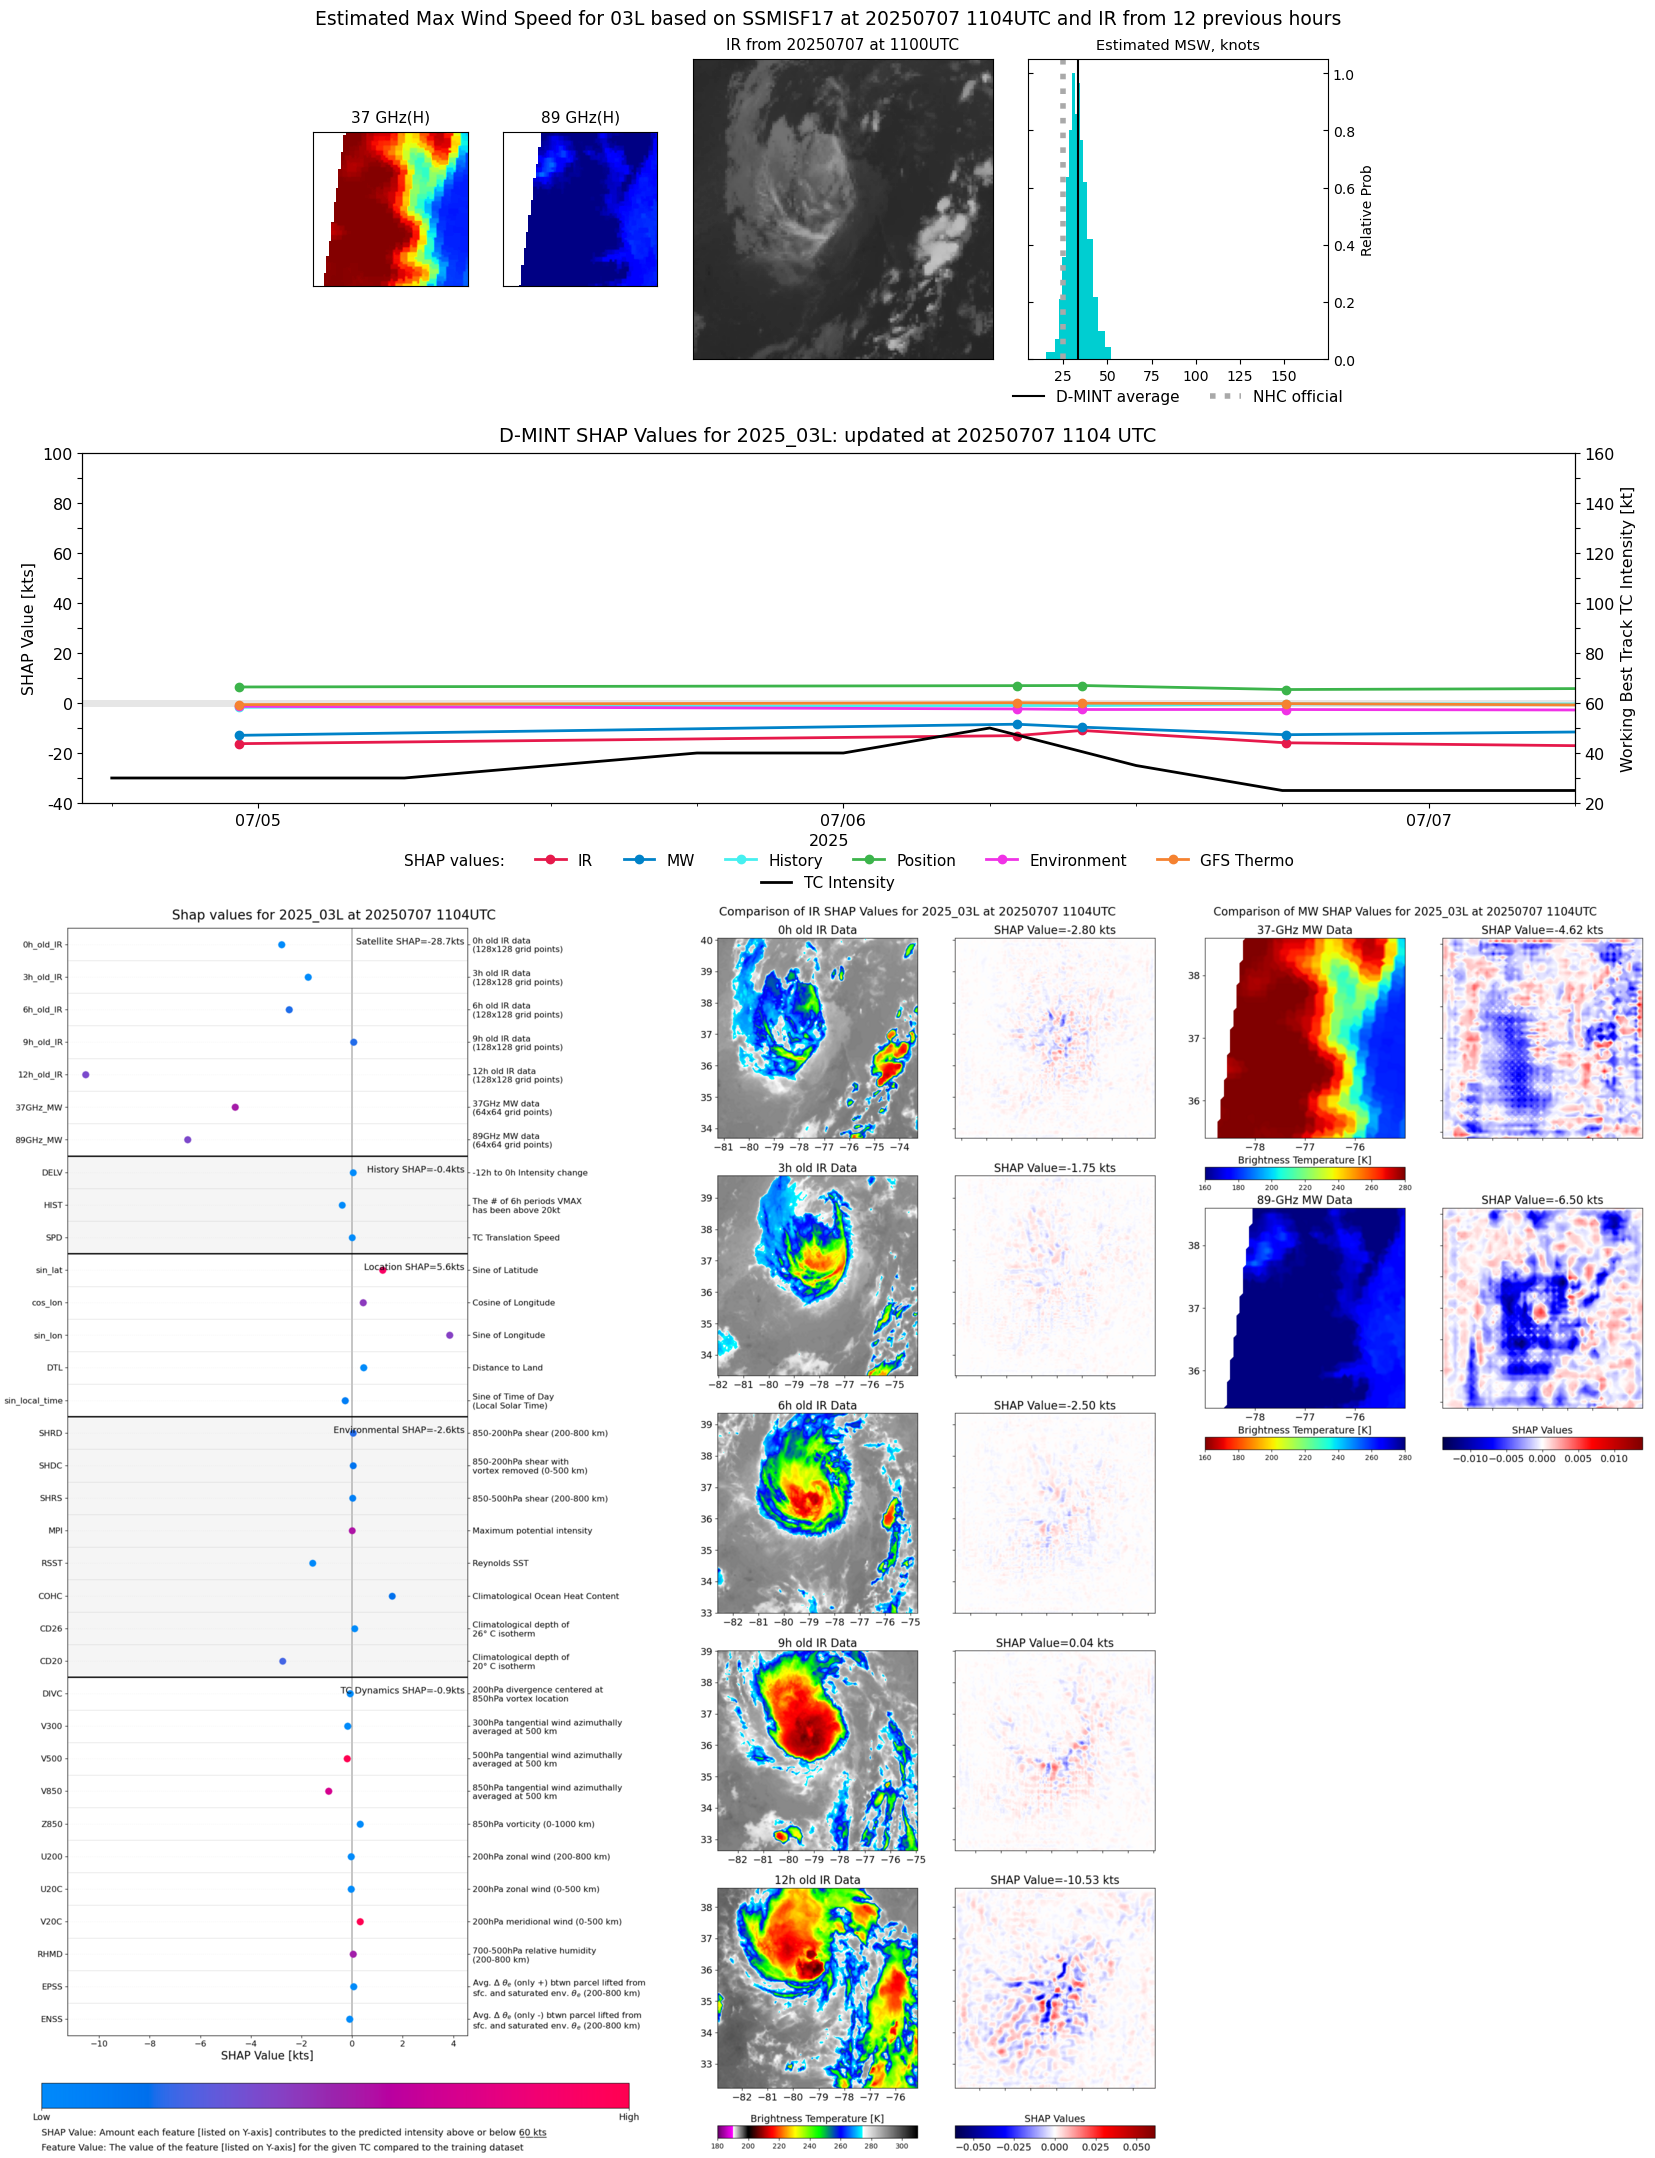 |
| 20250707 | 0932 UTC | SSMISF18 | 1006 hPa | 31 kts | 28 kts | 35 kts | 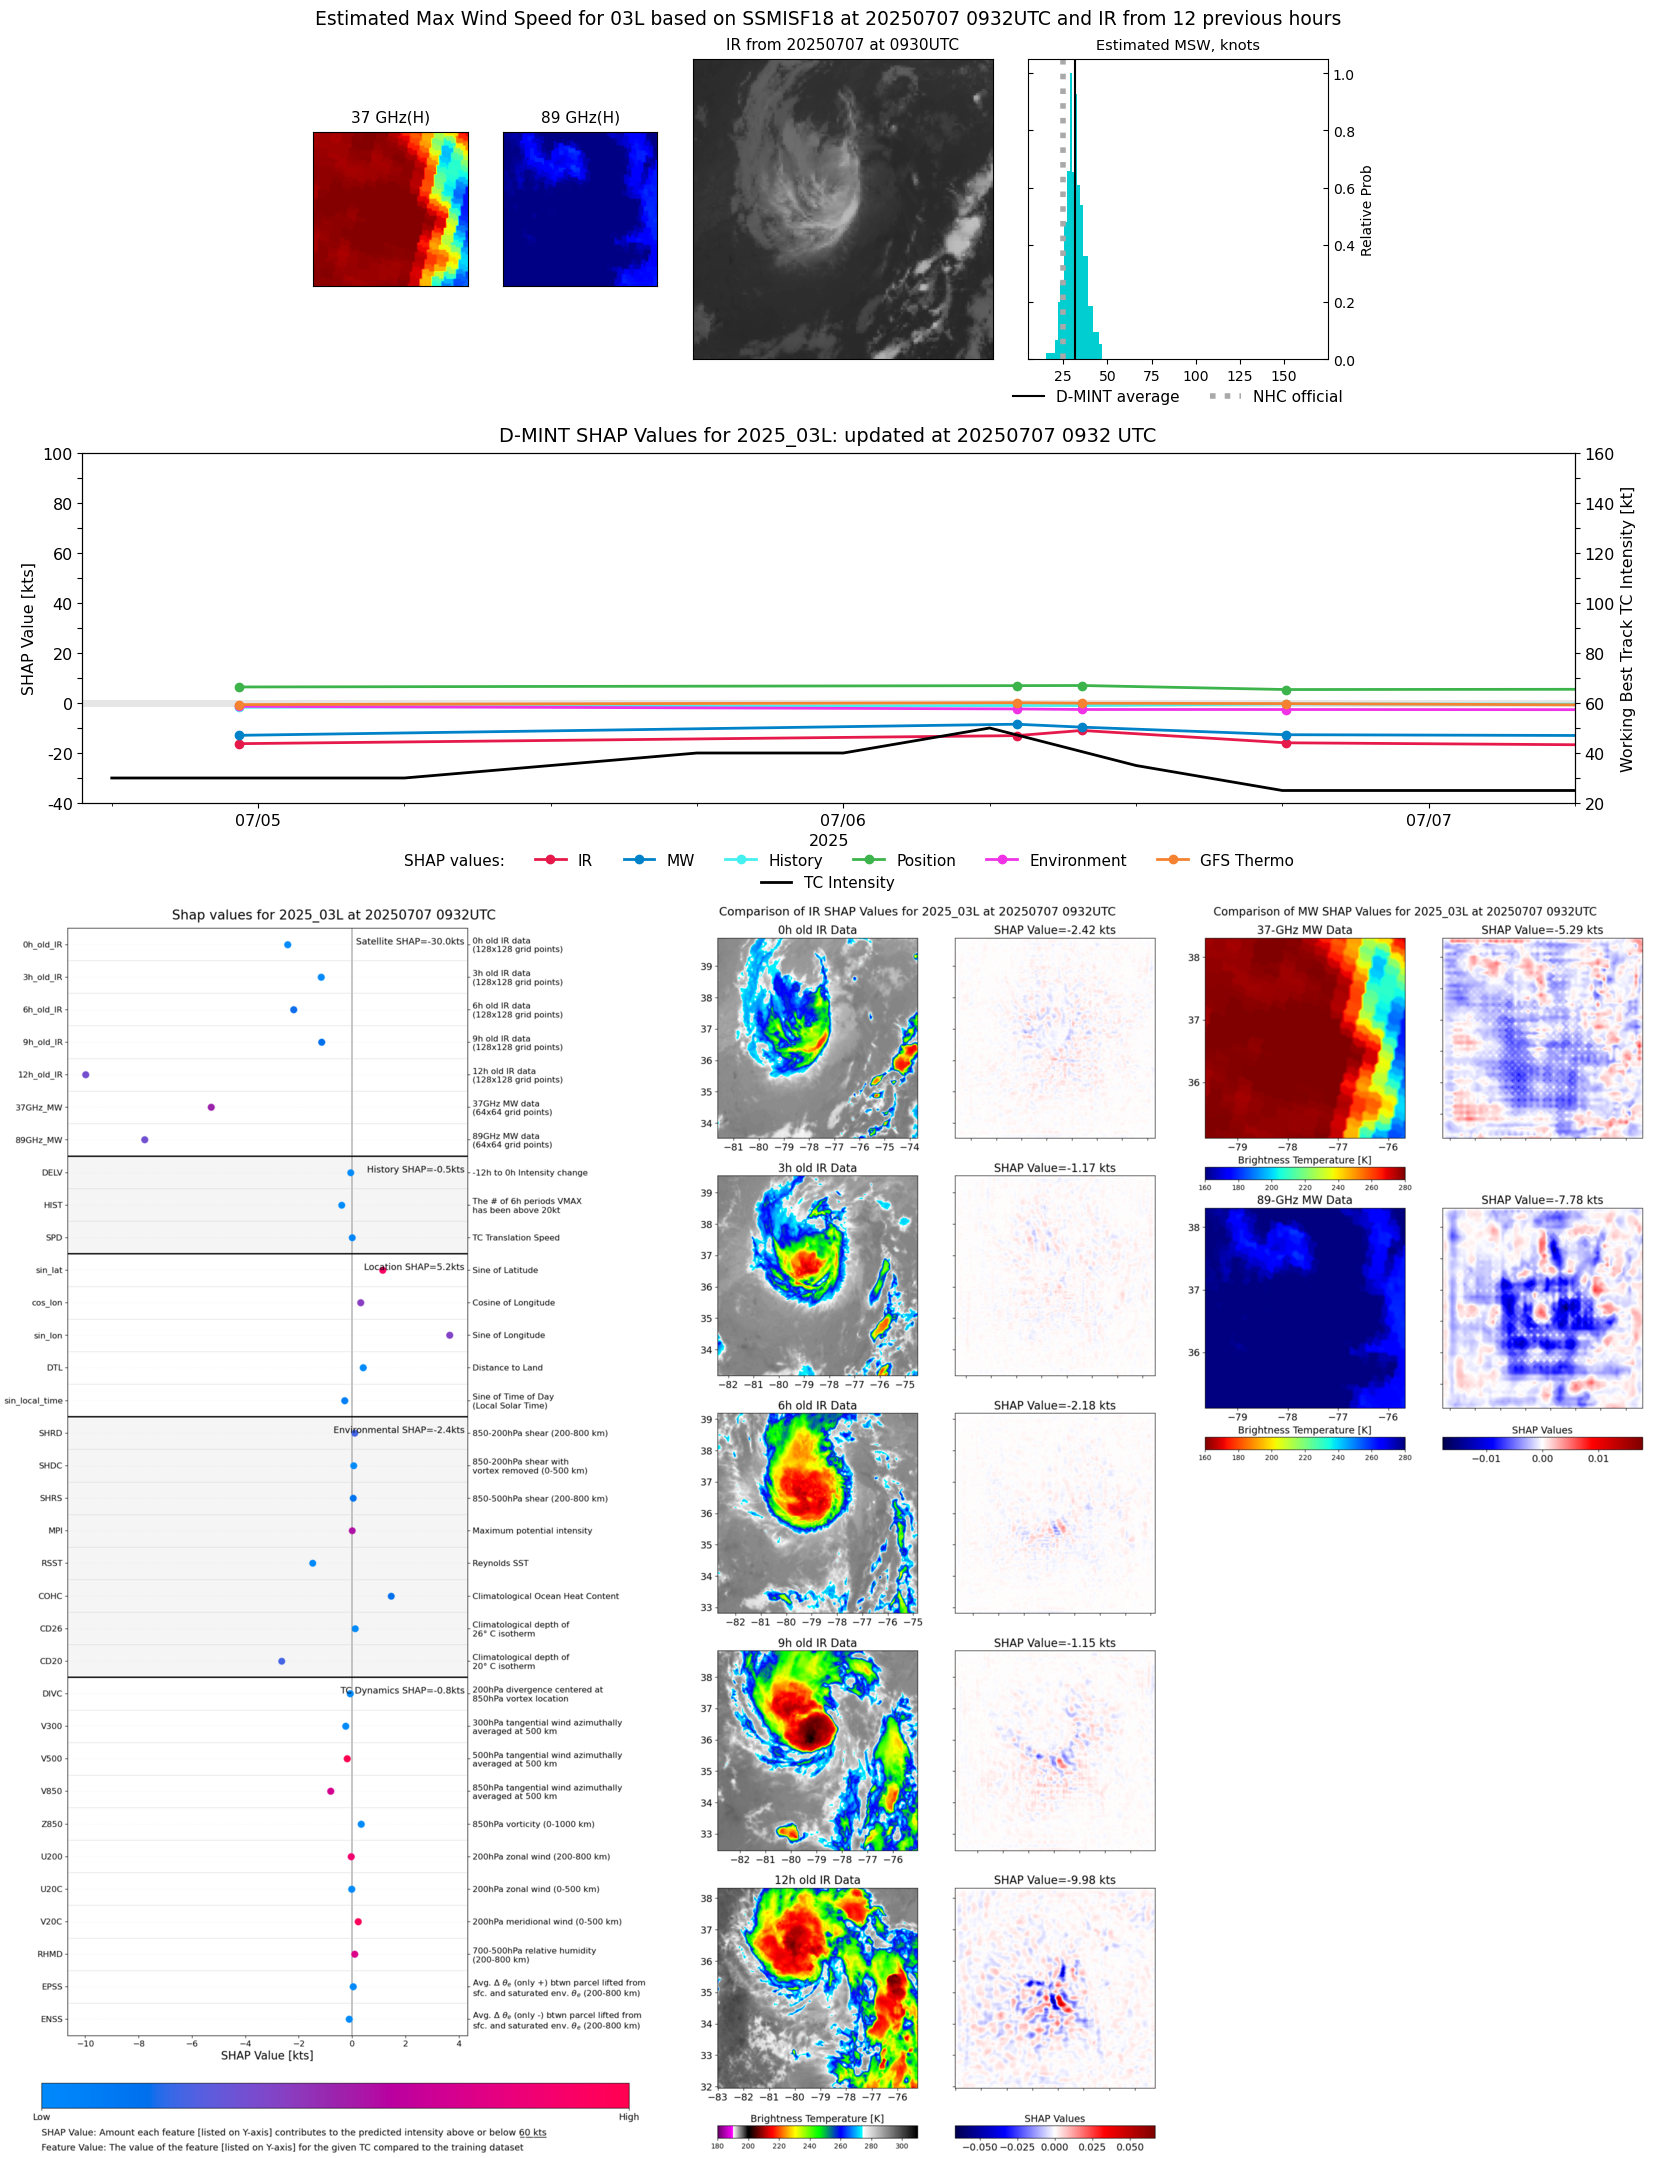 |
| 20250707 | 0345 UTC | TMS02 | 1005 hPa | 40 kts | 36 kts | 45 kts | 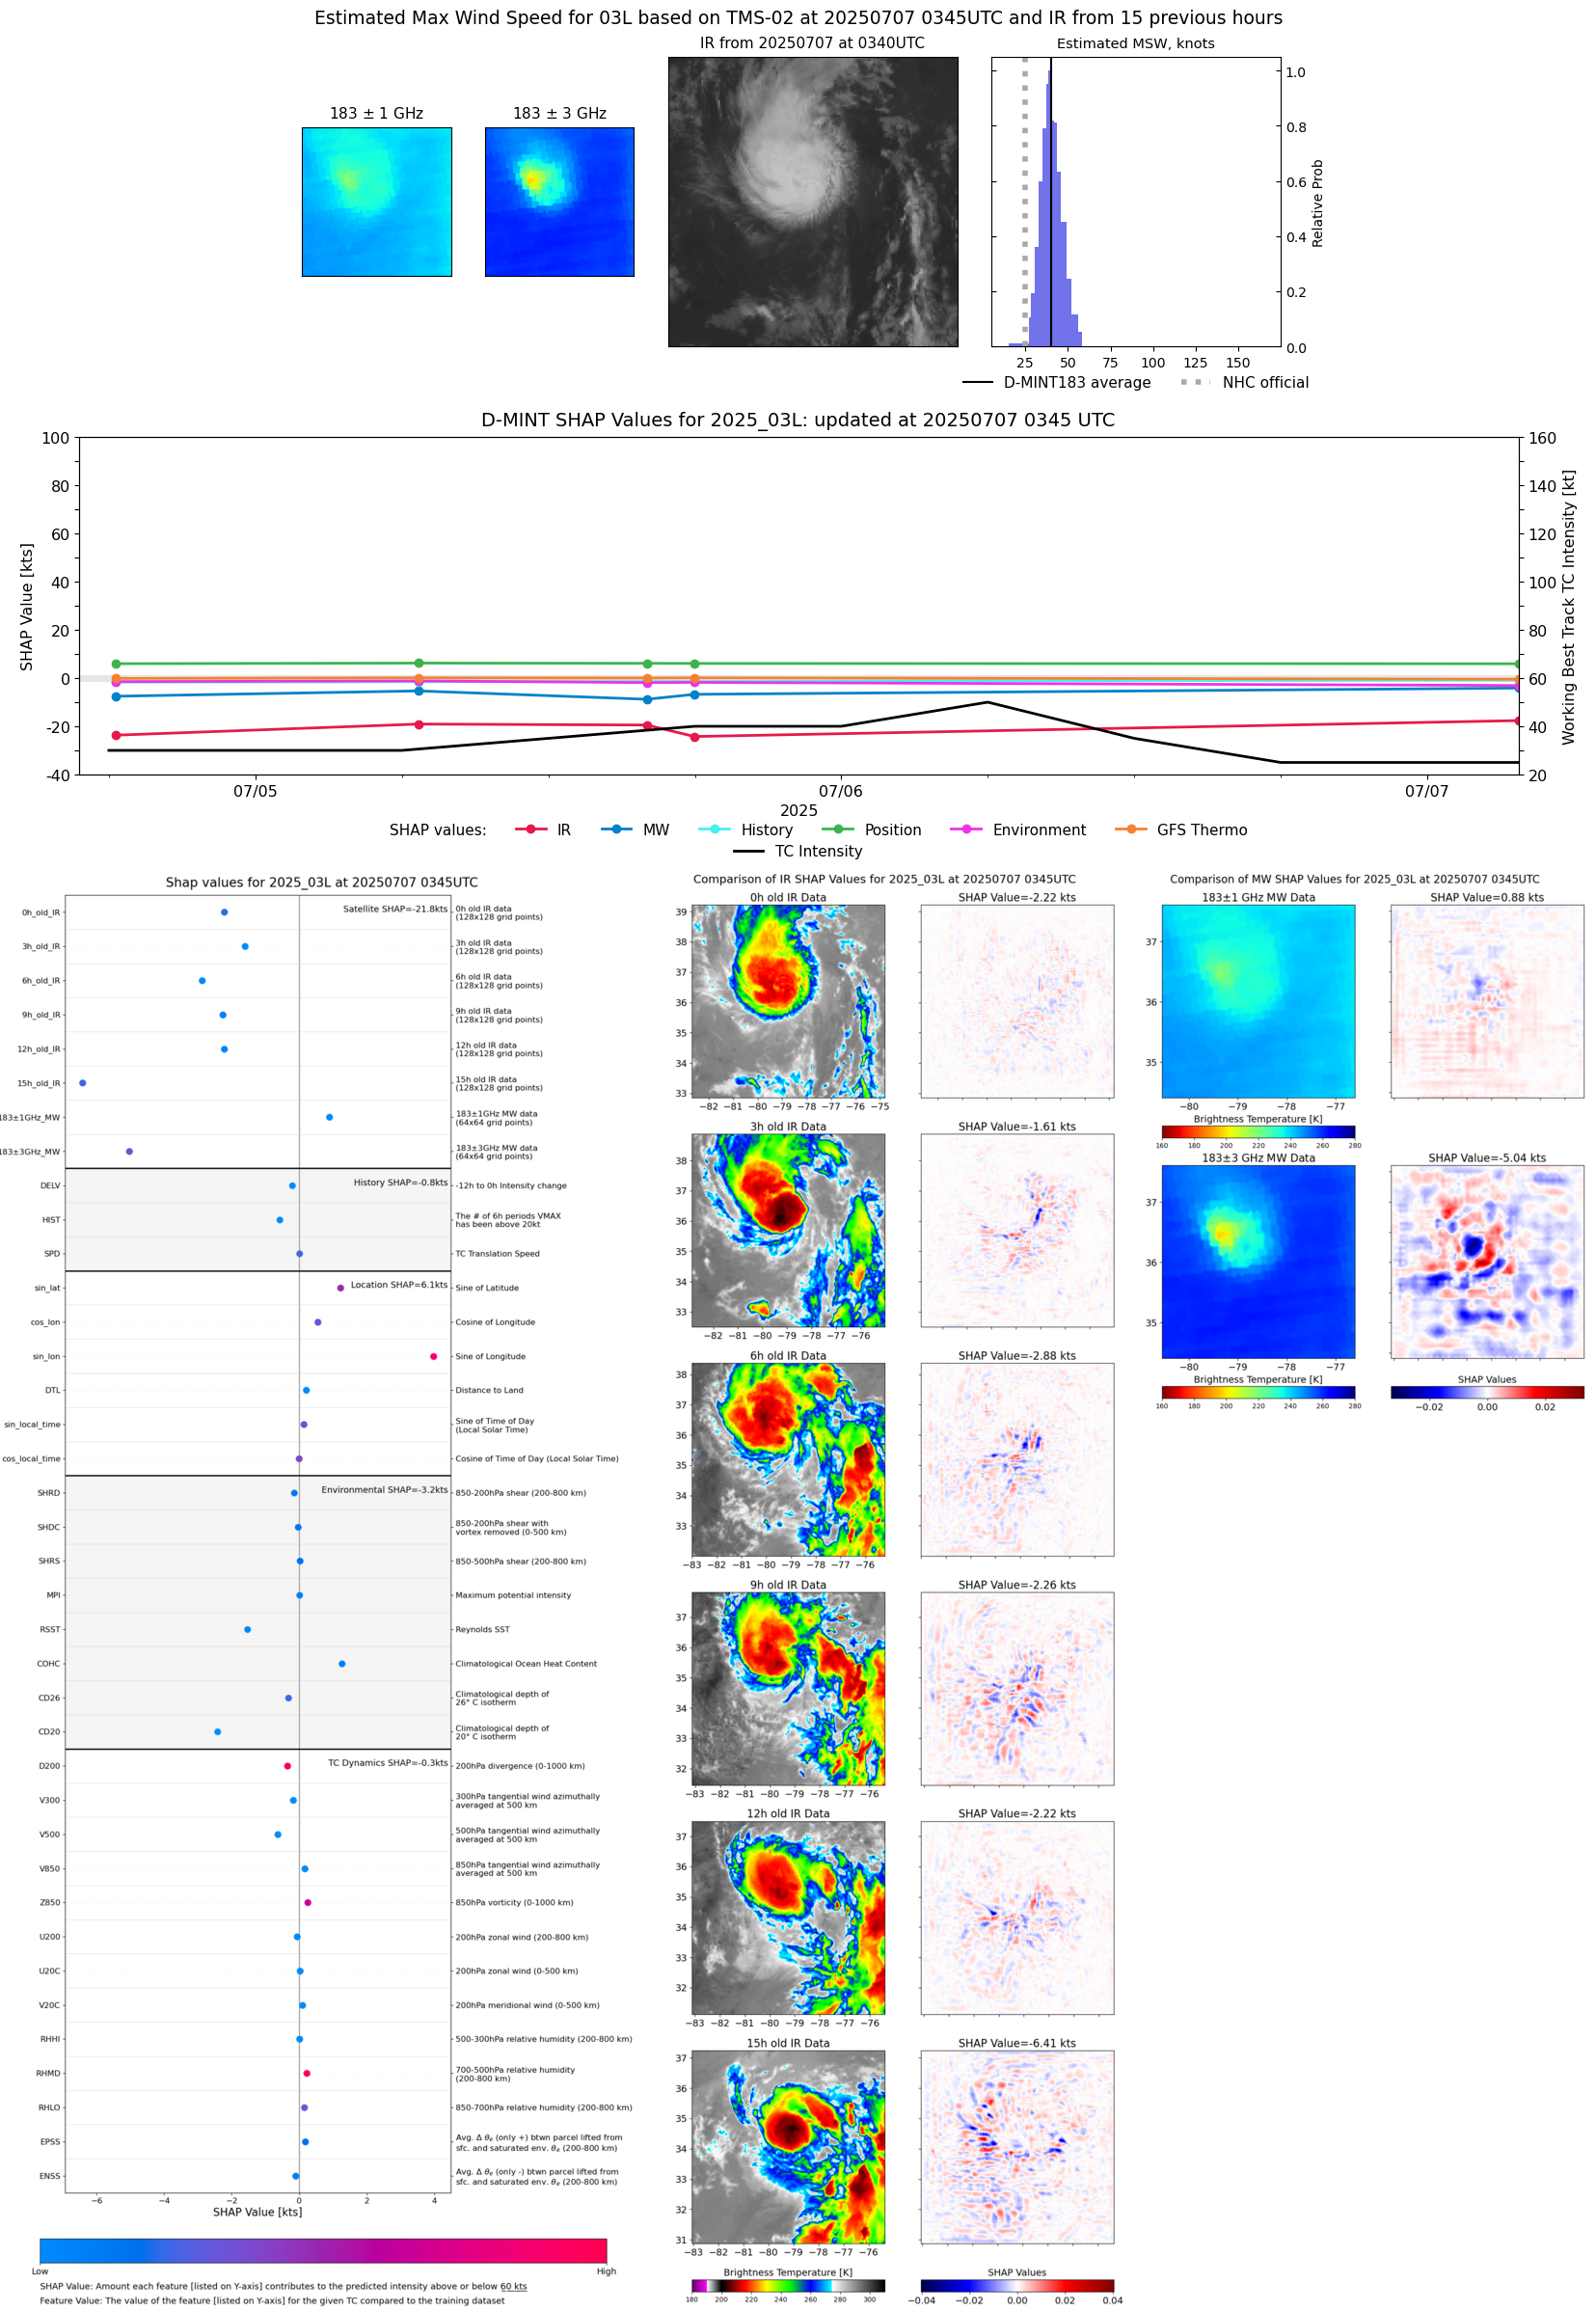 |
| 20250707 | 0315 UTC | AWS | 1004 hPa | 43 kts | 39 kts | 48 kts | 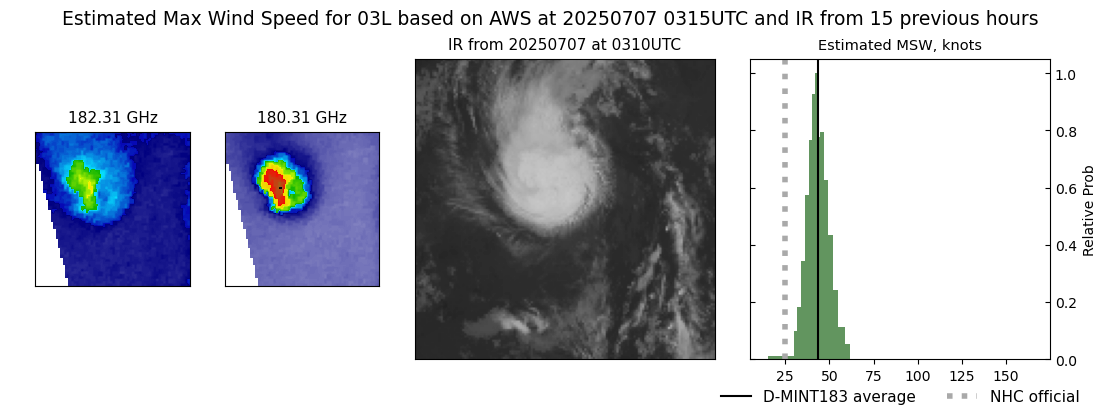 |
| 20250706 | 2240 UTC | SSMISF17 | 1004 hPa | 30 kts | 27 kts | 34 kts |  |
| 20250706 | 1808 UTC | AMSR2 | 1005 hPa | 34 kts | 30 kts | 37 kts |  |
| 20250706 | 0947 UTC | SSMISF18 | 1004 hPa | 43 kts | 38 kts | 48 kts | 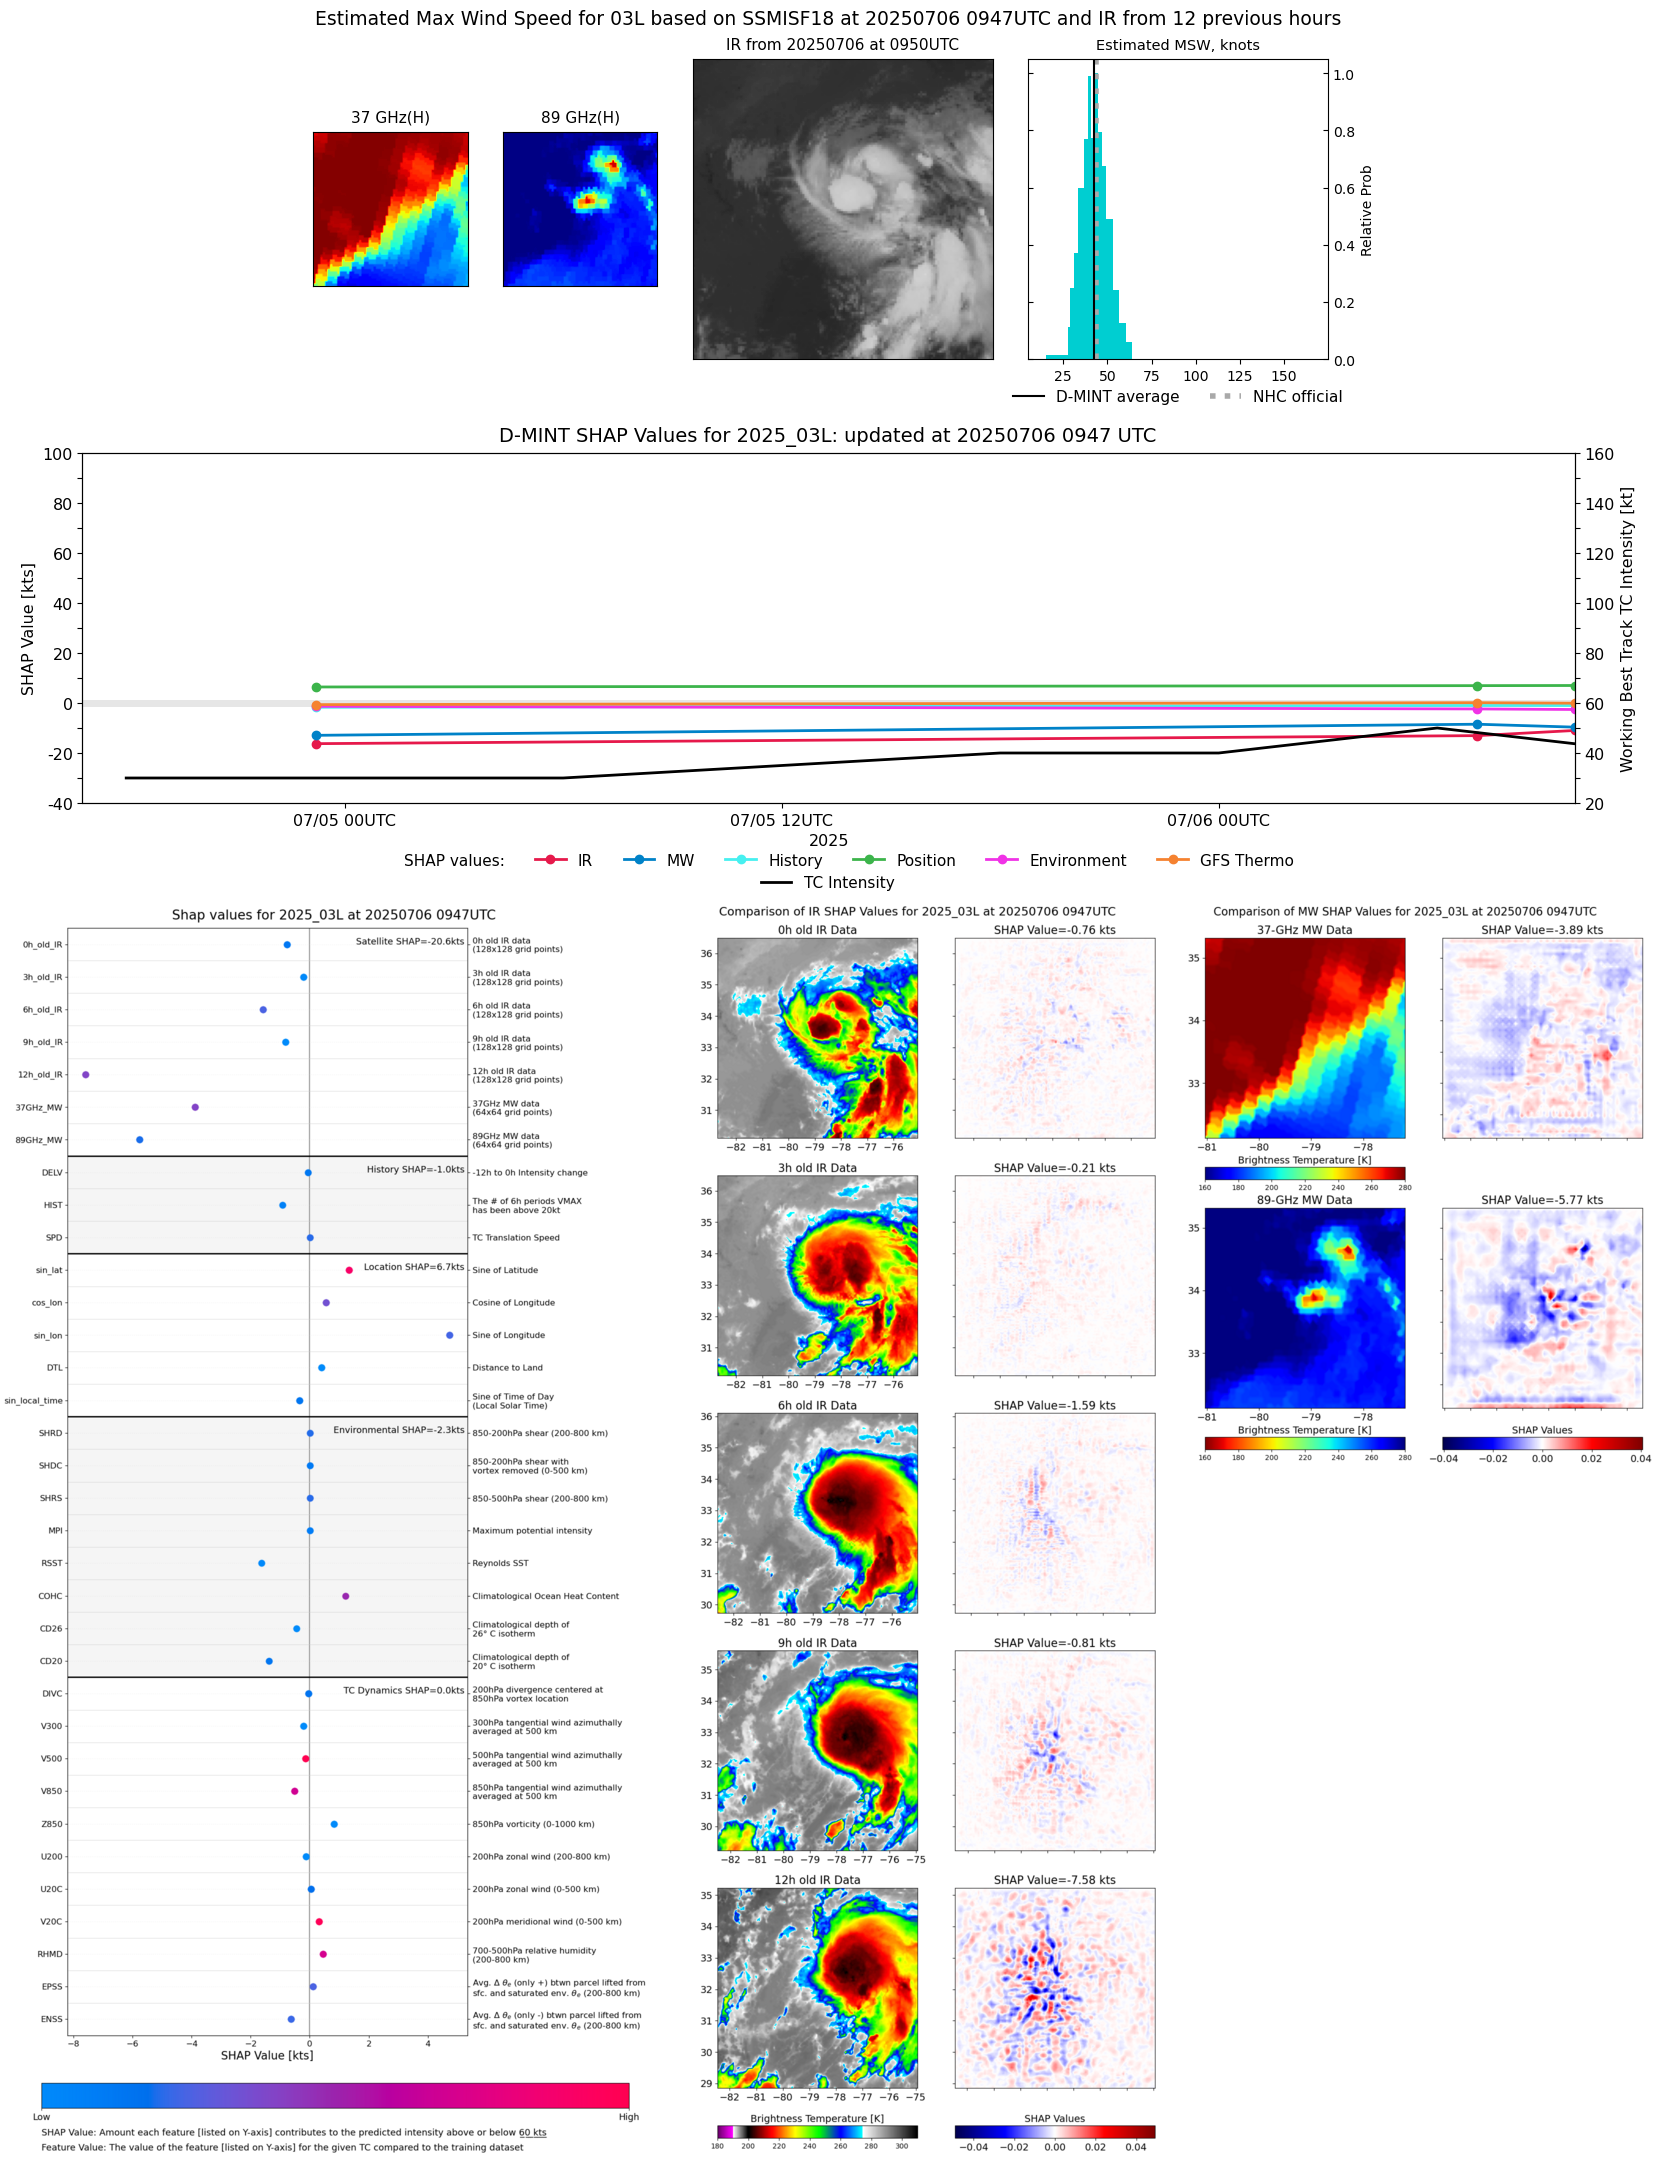 |
| 20250706 | 0706 UTC | AMSR2 | 1003 hPa | 42 kts | 37 kts | 47 kts |  |
| 20250705 | 1759 UTC | ATMS-N21 | 1010 hPa | 32 kts | 29 kts | 36 kts |  |
| 20250705 | 1602 UTC | TMS02 | 1008 hPa | 35 kts | 31 kts | 39 kts |  |
| 20250705 | 0641 UTC | ATMS-N21 | 1007 hPa | 40 kts | 35 kts | 44 kts | 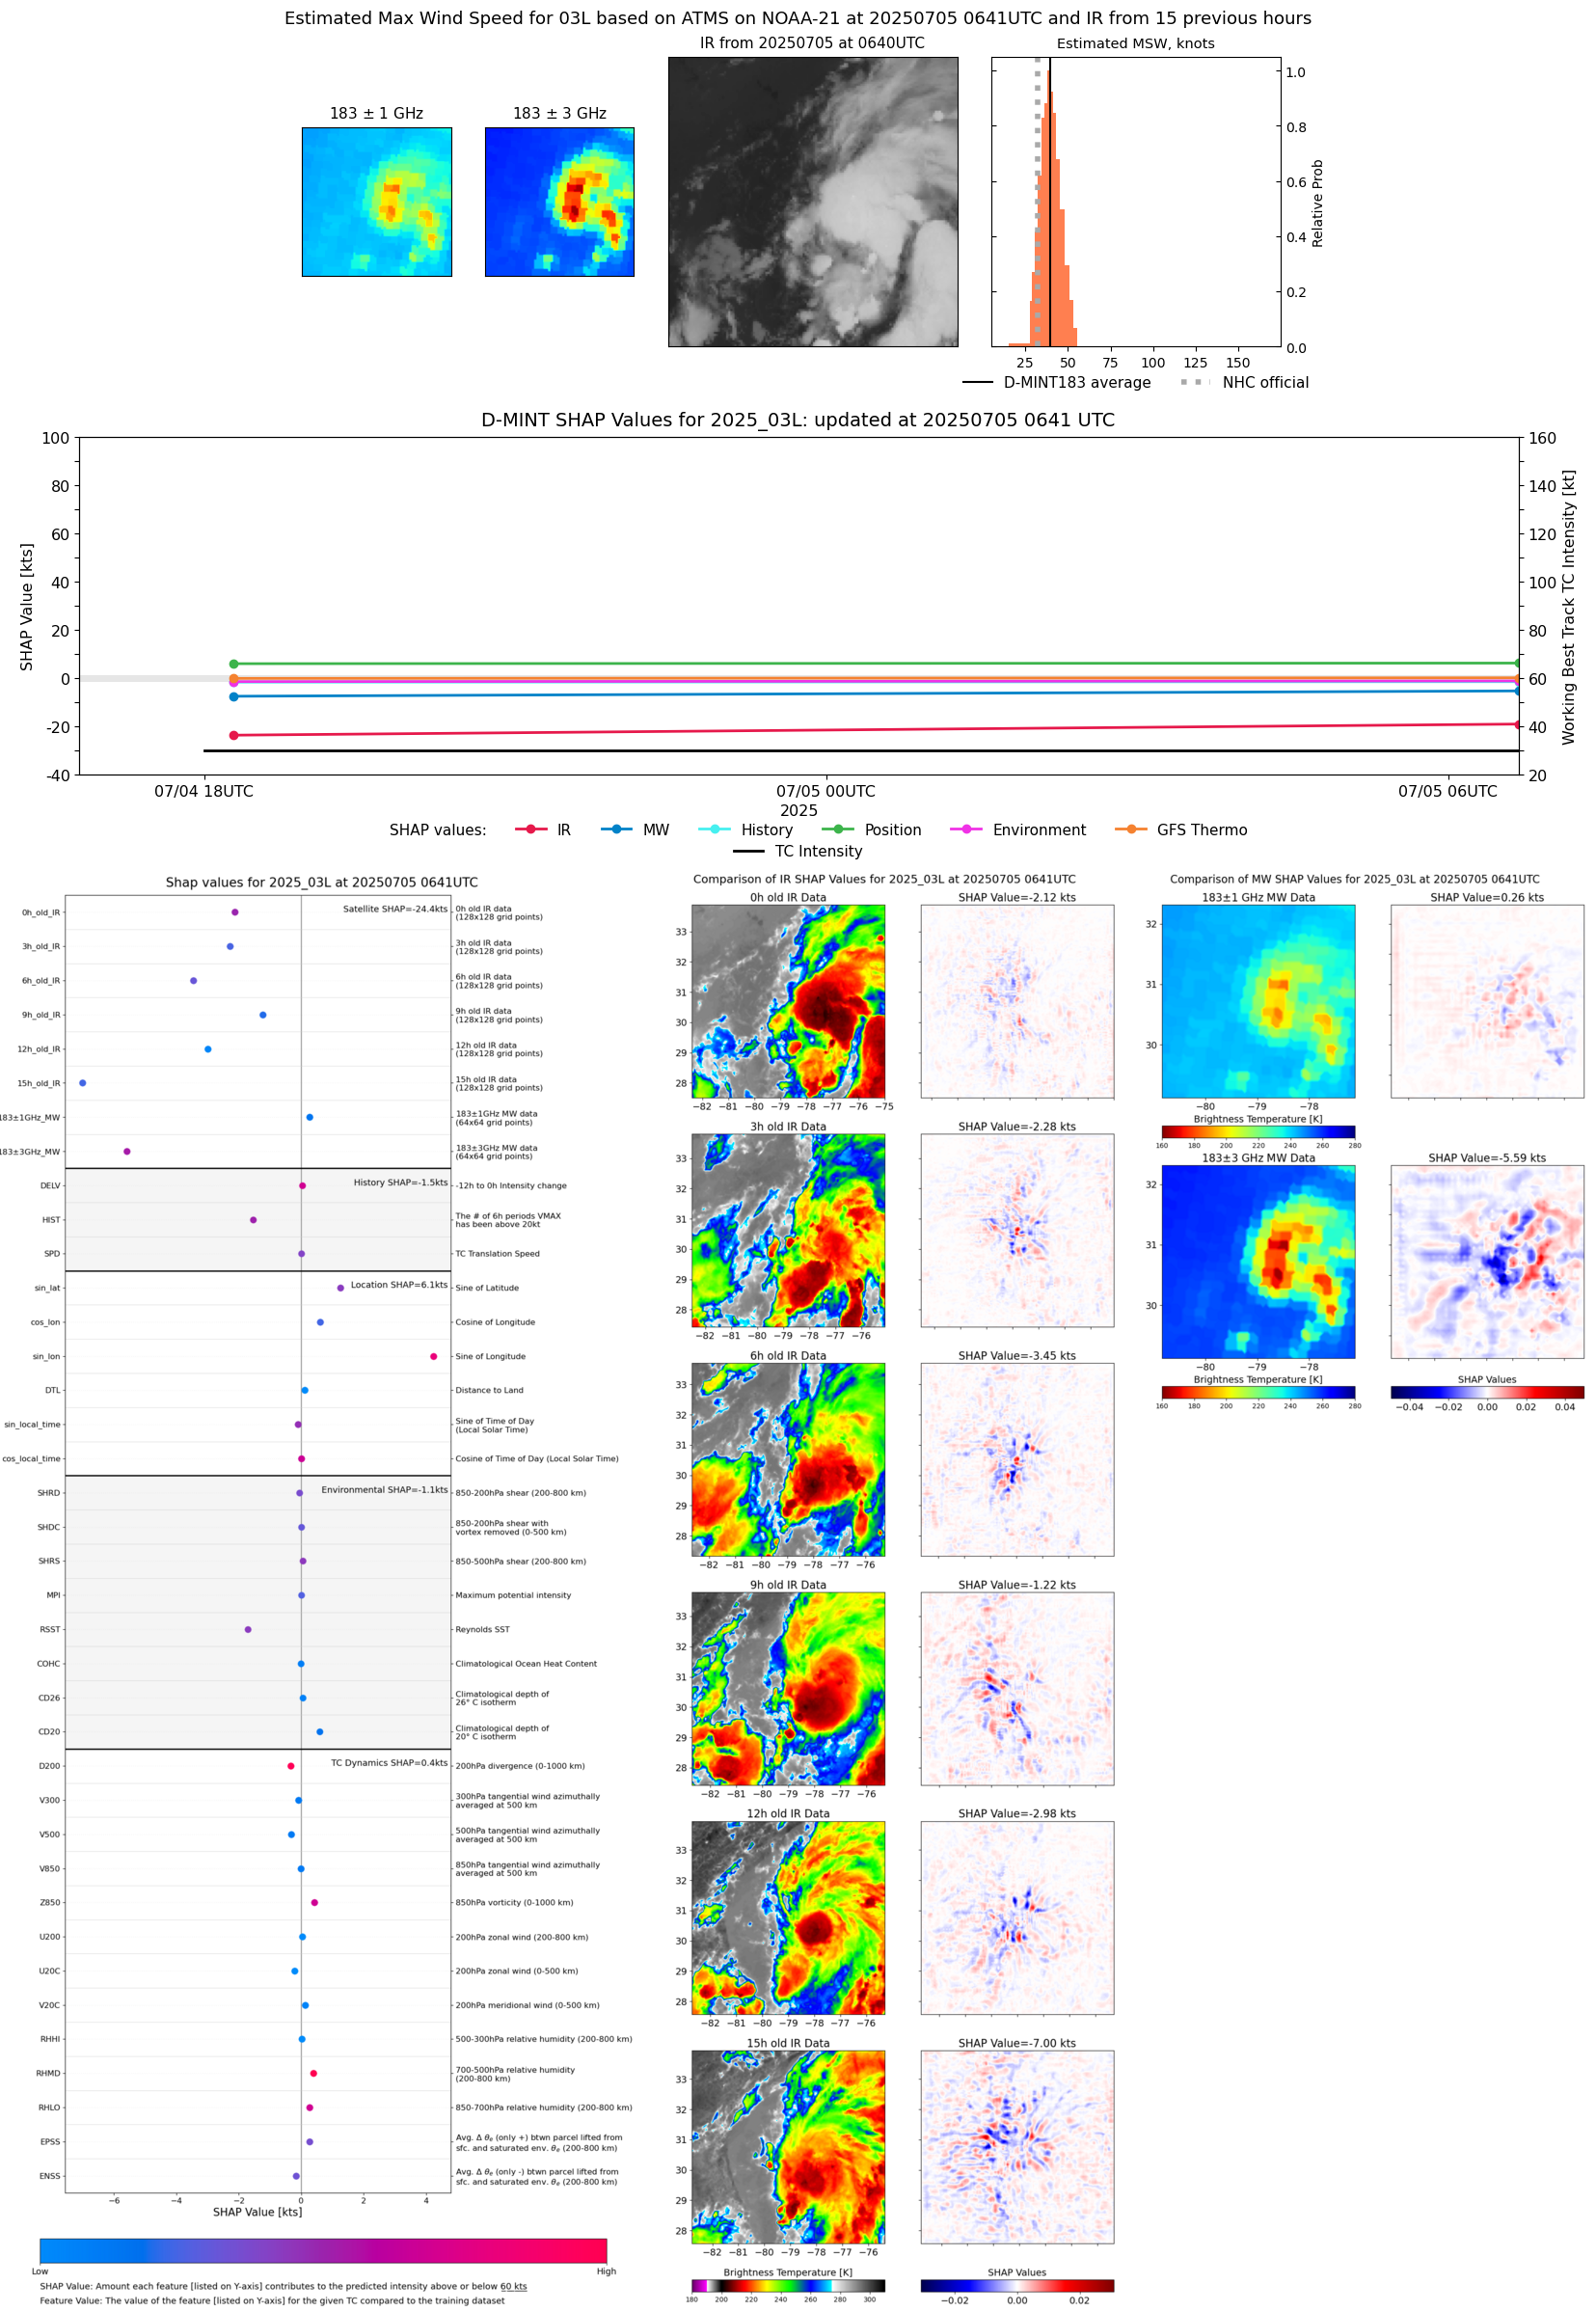 |
| 20250704 | 2313 UTC | GMI | 1010 hPa | 34 kts | 30 kts | 37 kts |  |
| 20250704 | 1817 UTC | ATMS-N21 | 1009 hPa | 32 kts | 28 kts | 35 kts |  |
| 20250704 | 0720 UTC | AMSR2 | NaN hPa | 26 kts | 23 kts | 29 kts | 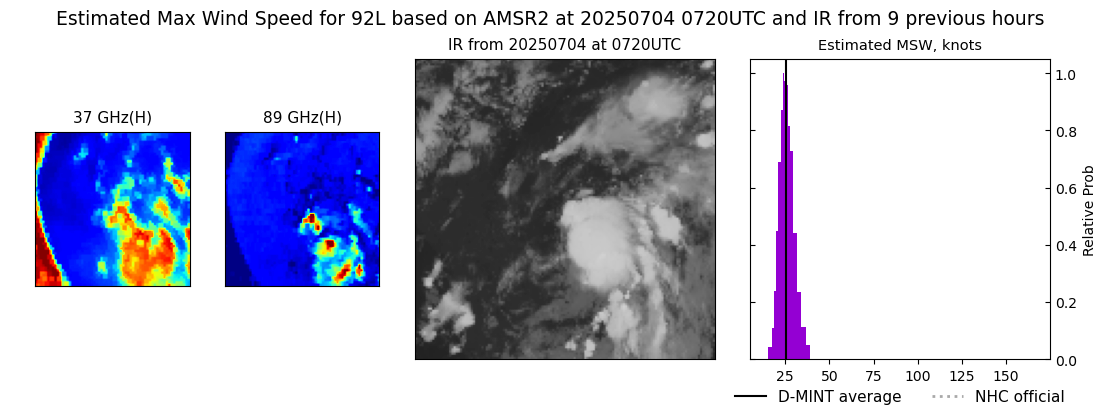 |