|
||

 |
D-MINT HISTORY FILE for 2025_04B
| Date | Time | MW Sensor | MSLP | Vmax (30th-70th percentile average) | Vmax 25th percentile | Vmax 75th percentile | Image |
| 20251128 | 1852 UTC | ATMS-N20 | 999 hPa | 39 kts | 34 kts | 44 kts |  |
| 20251128 | 1505 UTC | TMS05 | 998 hPa | 36 kts | 32 kts | 41 kts | 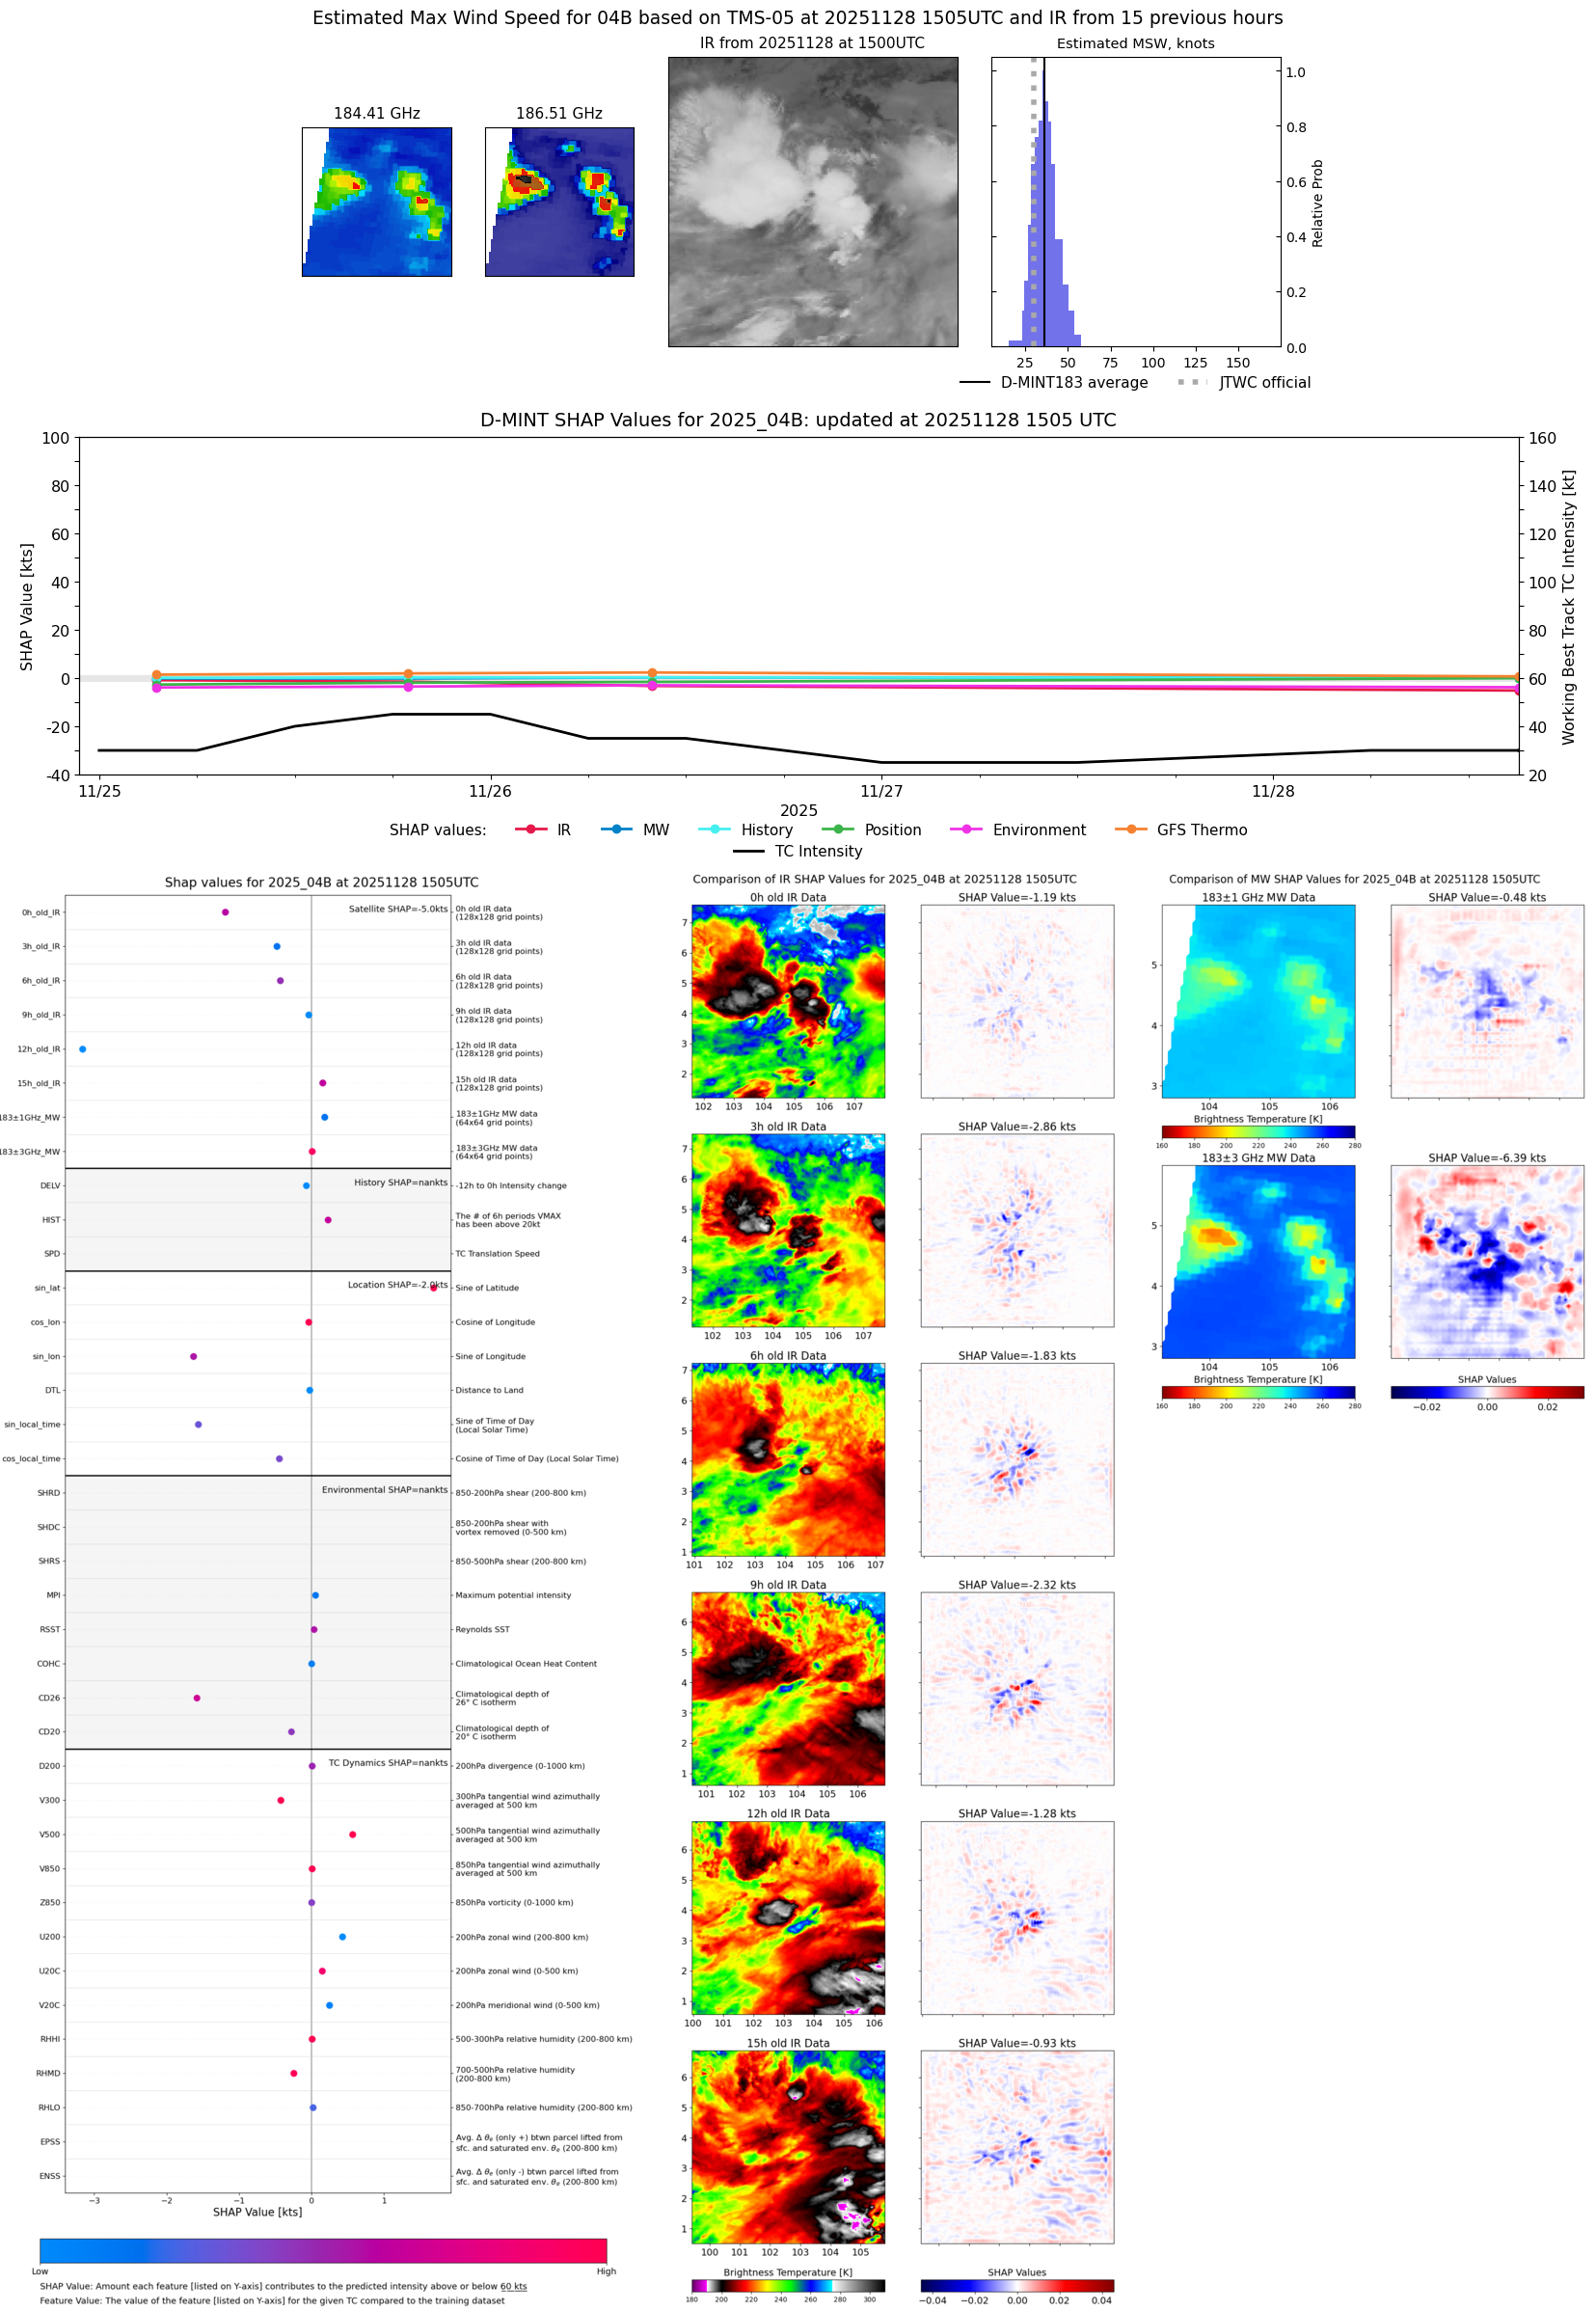 |
| 20251128 | 0613 UTC | ATMS-N20 | 1003 hPa | 31 kts | 27 kts | 35 kts | 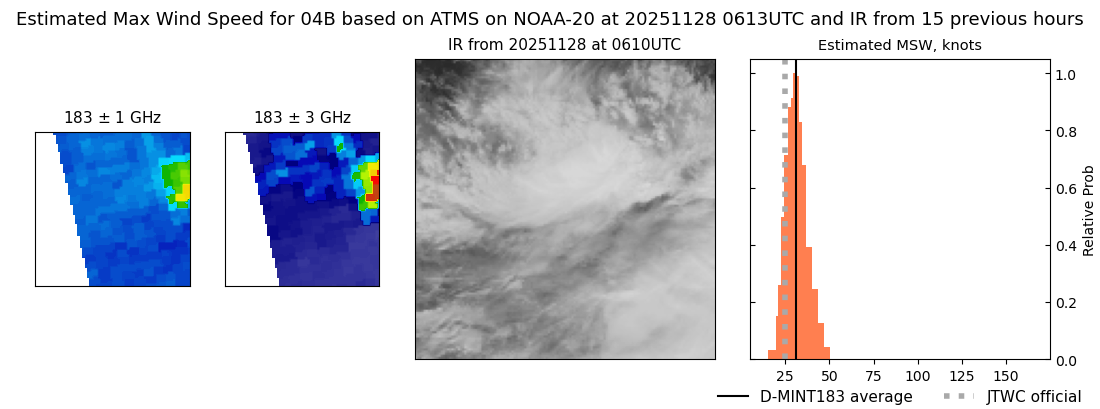 |
| 20251128 | 0608 UTC | GMI | 1001 hPa | 34 kts | 30 kts | 39 kts | 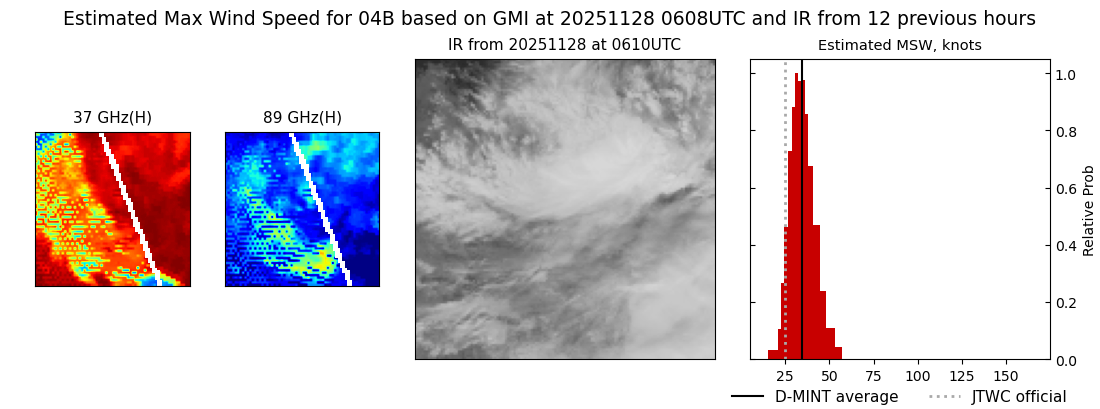 |
| 20251128 | 0323 UTC | TMS05 | 1004 hPa | 29 kts | 25 kts | 33 kts | 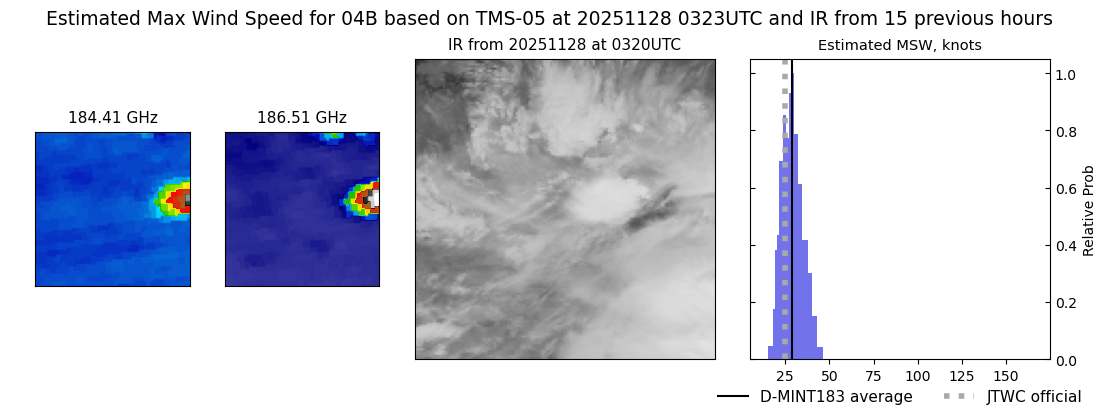 |
| 20251128 | 0009 UTC | SSMISF16 | 999 hPa | 36 kts | 31 kts | 42 kts |  |
| 20251127 | 2327 UTC | WSFM01 | 1000 hPa | 37 kts | 32 kts | 42 kts |  |
| 20251127 | 1515 UTC | TMS05 | 1001 hPa | 32 kts | 28 kts | 36 kts | 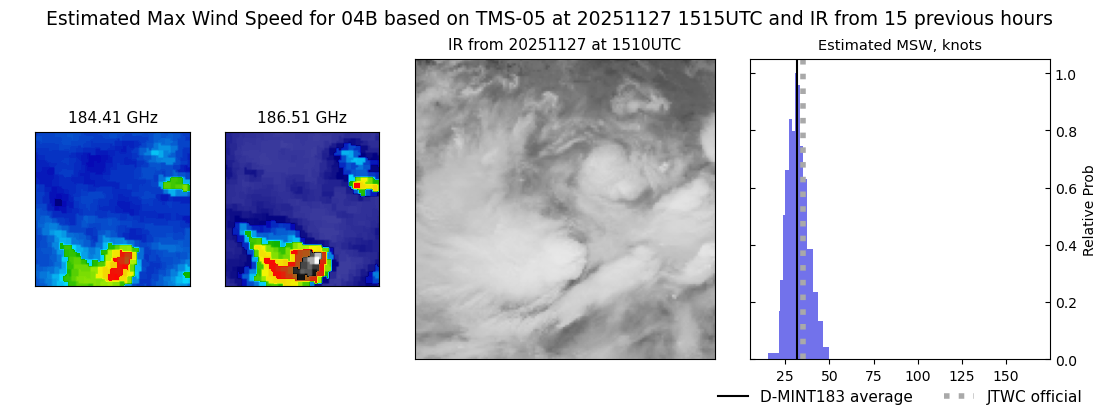 |
| 20251127 | 1050 UTC | WSFM01 | 994 hPa | 41 kts | 35 kts | 48 kts | 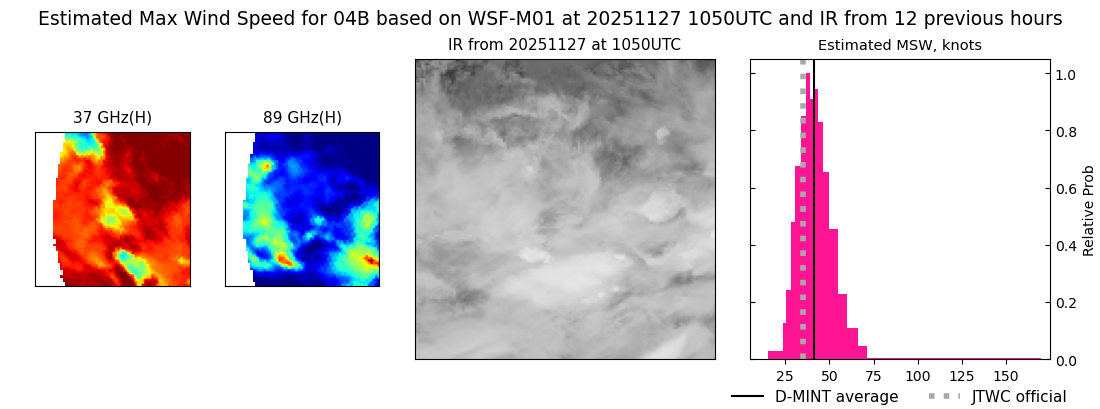 |
| 20251127 | 0632 UTC | ATMS-N20 | 995 hPa | 39 kts | 34 kts | 44 kts | 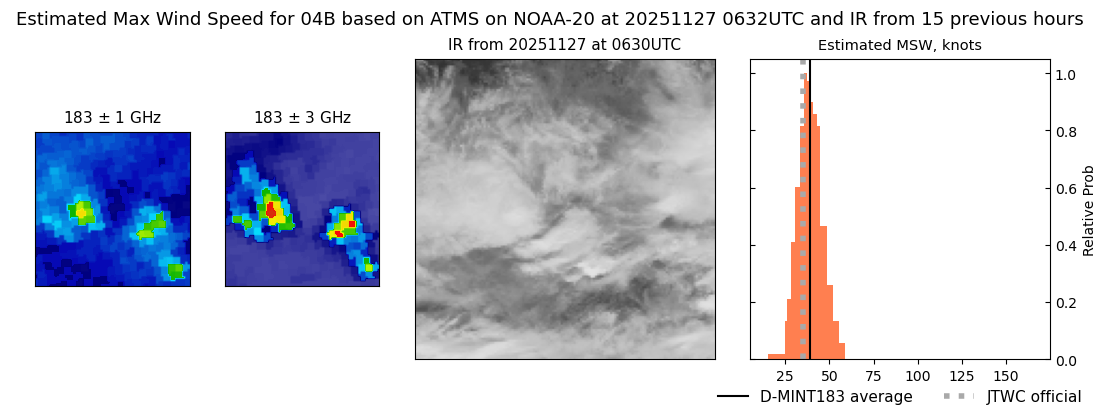 |
| 20251127 | 0344 UTC | AWS | 993 hPa | 37 kts | 32 kts | 42 kts |  |
| 20251127 | 0341 UTC | TMS05 | 994 hPa | 36 kts | 31 kts | 41 kts |  |
| 20251126 | 2348 UTC | WSFM01 | 1001 hPa | 33 kts | 27 kts | 38 kts | 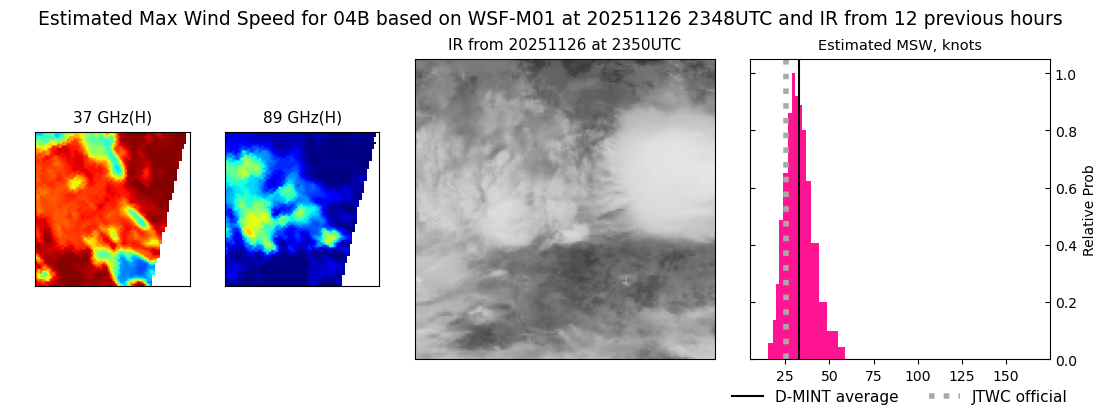 |
| 20251126 | 2348 UTC | WSFM01 | 1001 hPa | 30 kts | 26 kts | 35 kts | 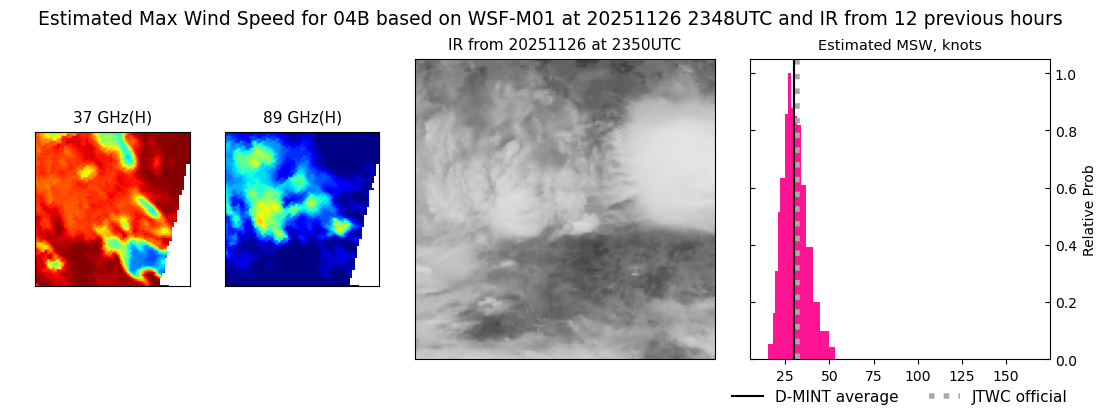 |
| 20251126 | 2307 UTC | SSMISF17 | 999 hPa | 33 kts | 28 kts | 38 kts | 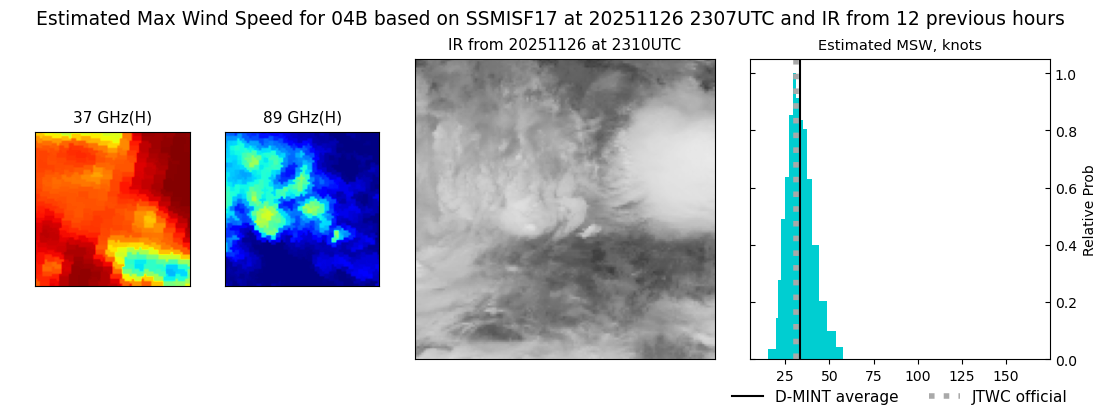 |
| 20251126 | 1839 UTC | ATMS-N21 | 992 hPa | 34 kts | 29 kts | 39 kts | 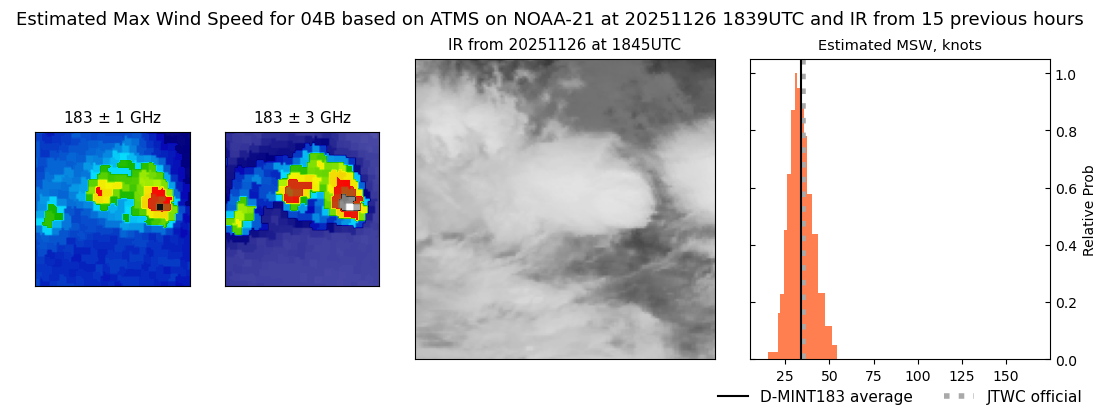 |
| 20251126 | 1541 UTC | AWS | 992 hPa | 41 kts | 36 kts | 45 kts | 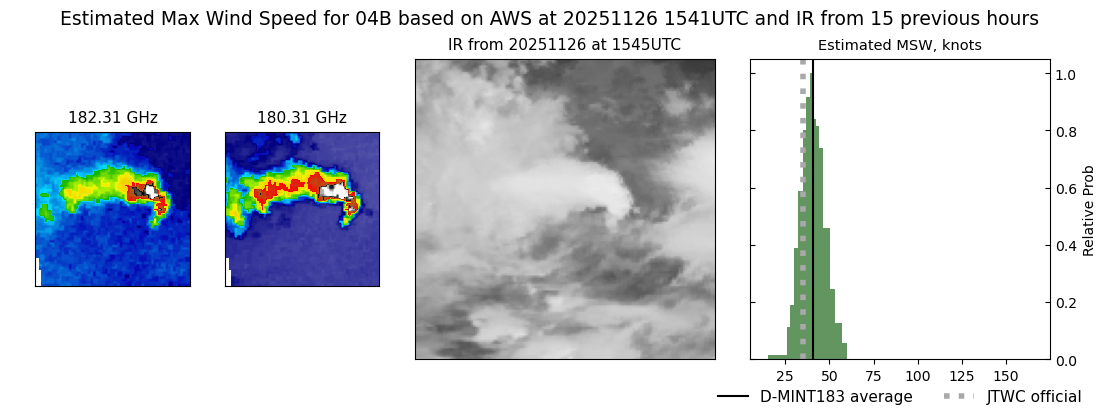 |
| 20251126 | 1540 UTC | TMS05 | 992 hPa | 40 kts | 36 kts | 45 kts |  |
| 20251126 | 1109 UTC | WSFM01 | 995 hPa | 37 kts | 32 kts | 43 kts | 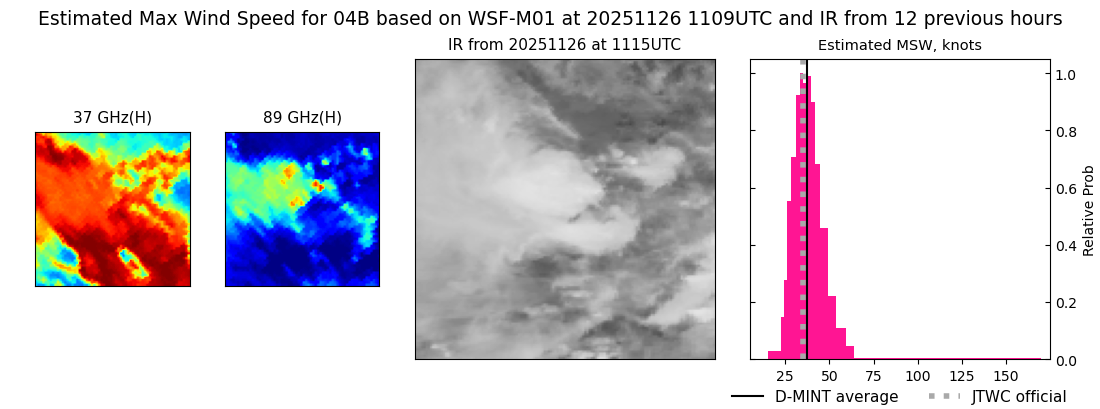 |
| 20251126 | 0953 UTC | TMS07 | 994 hPa | 43 kts | 37 kts | 49 kts |  |
| 20251126 | 0724 UTC | AMSR2 | 987 hPa | 45 kts | 39 kts | 51 kts | 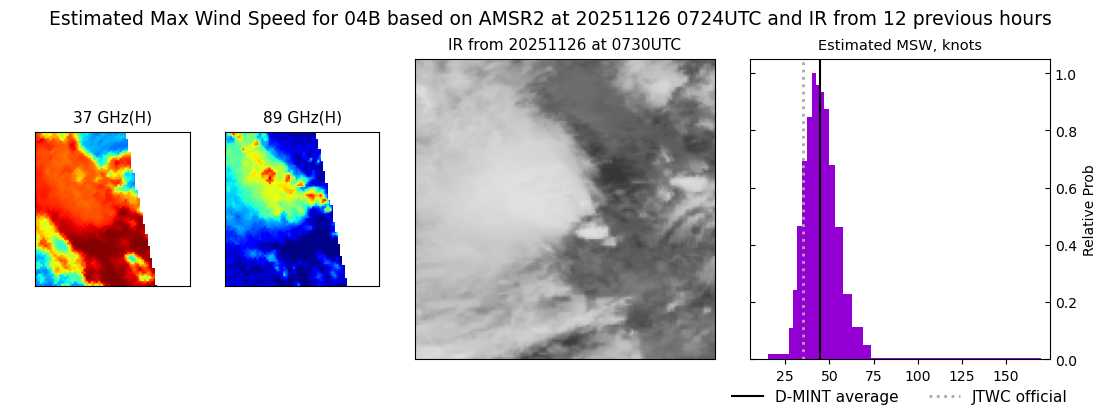 |
| 20251126 | 0651 UTC | ATMS-N20 | 991 hPa | 48 kts | 42 kts | 54 kts |  |
| 20251125 | 2321 UTC | SSMISF17 | 989 hPa | 42 kts | 37 kts | 48 kts | 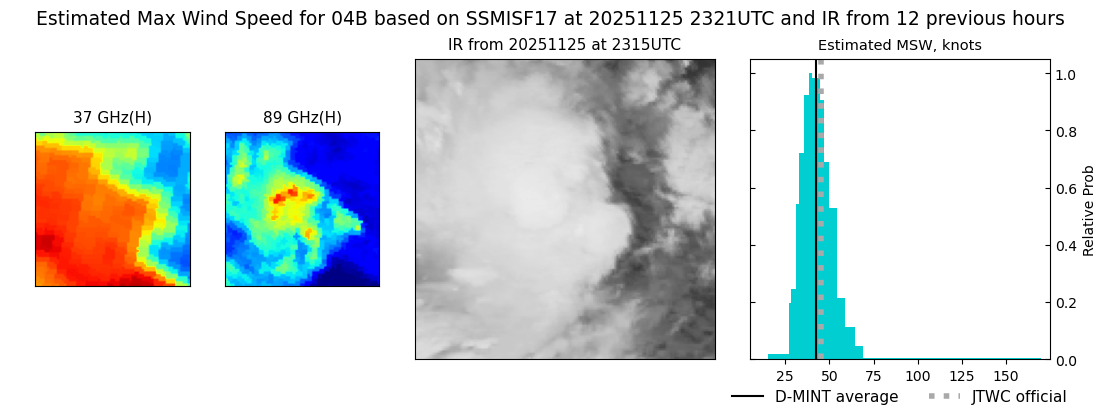 |
| 20251125 | 1859 UTC | AMSR2 | 986 hPa | 49 kts | 43 kts | 56 kts | 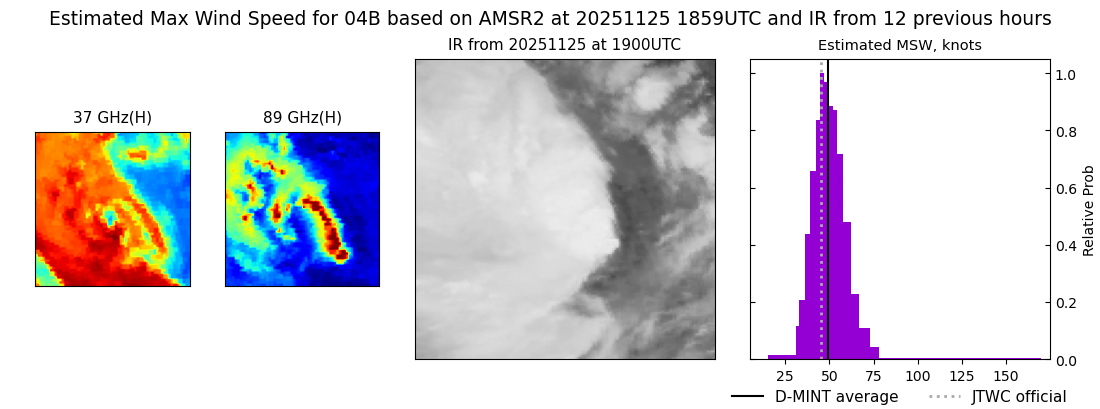 |
| 20251125 | 1858 UTC | ATMS-N21 | 991 hPa | 51 kts | 46 kts | 57 kts |  |
| 20251125 | 1609 UTC | TMS02 | 987 hPa | 52 kts | 47 kts | 57 kts | 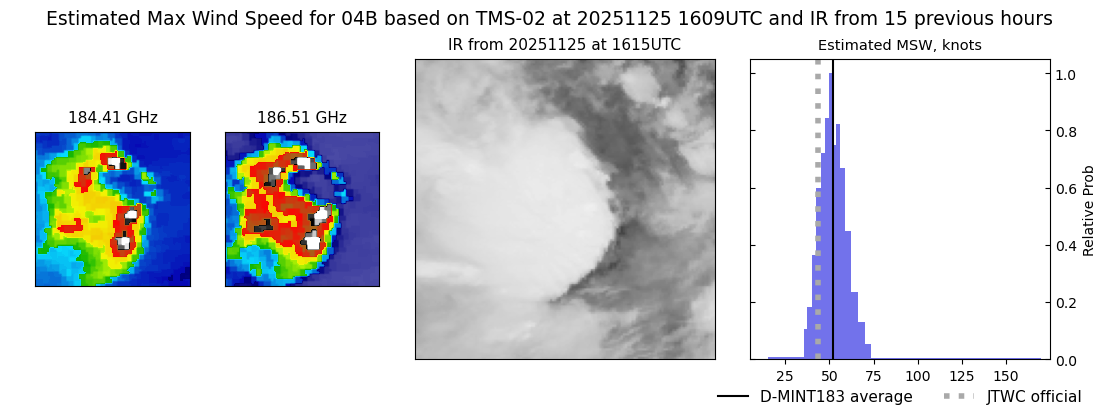 |
| 20251125 | 1157 UTC | SSMISF16 | 993 hPa | 43 kts | 38 kts | 49 kts |  |
| 20251125 | 1129 UTC | WSFM01 | 993 hPa | 47 kts | 41 kts | 52 kts |  |
| 20251125 | 0619 UTC | ATMS-N21 | 995 hPa | 41 kts | 37 kts | 46 kts |  |
| 20251125 | 0404 UTC | TMS02 | 992 hPa | 41 kts | 36 kts | 46 kts | 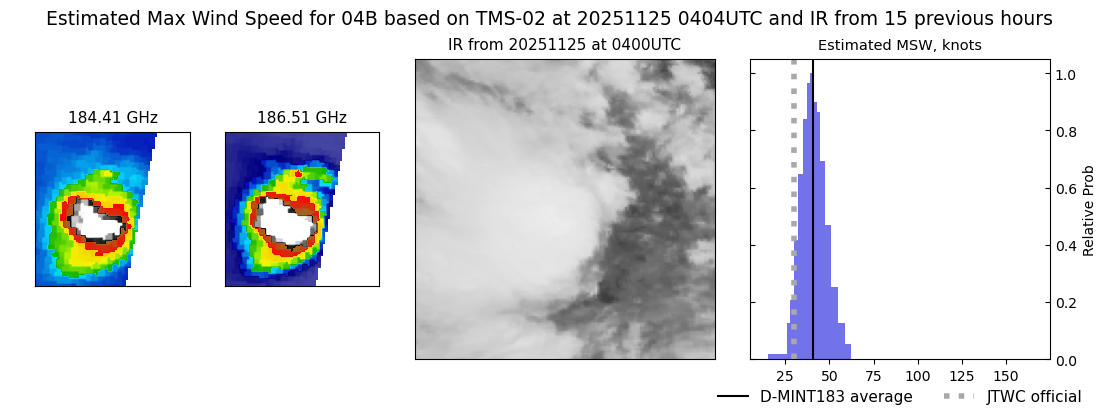 |
| 20251125 | 0330 UTC | TMS06 | 994 hPa | 37 kts | 33 kts | 42 kts |  |