|
||

 |
D-MINT HISTORY FILE for 2025_05B
| Date | Time | MW Sensor | MSLP | Vmax (30th-70th percentile average) | Vmax 25th percentile | Vmax 75th percentile | Image |
| 20251202 | 2042 UTC | AMSR2 | 1002 hPa | 29 kts | 25 kts | 34 kts |  |
| 20251202 | 0731 UTC | ATMS-N21 | 1003 hPa | 25 kts | 22 kts | 28 kts |  |
| 20251201 | 2025 UTC | ATMS-N21 | 999 hPa | 34 kts | 30 kts | 38 kts | 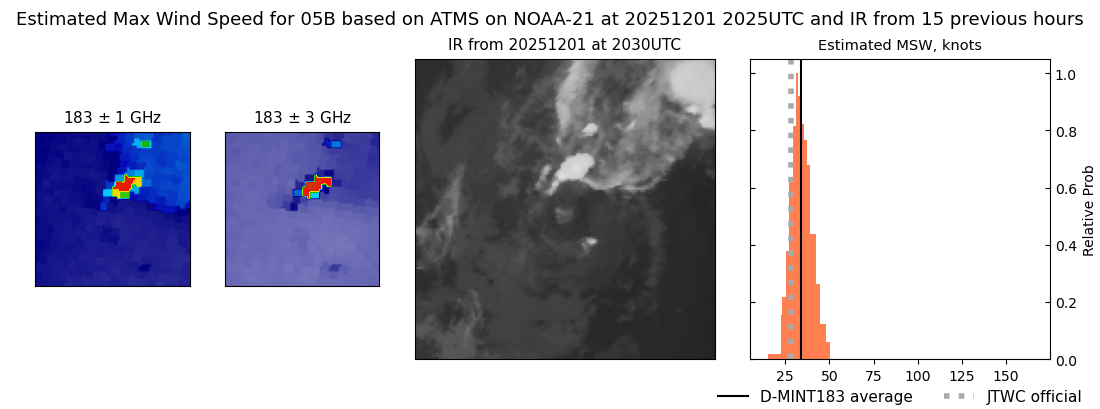 |
| 20251201 | 0750 UTC | ATMS-N21 | 1006 hPa | 30 kts | 26 kts | 34 kts | 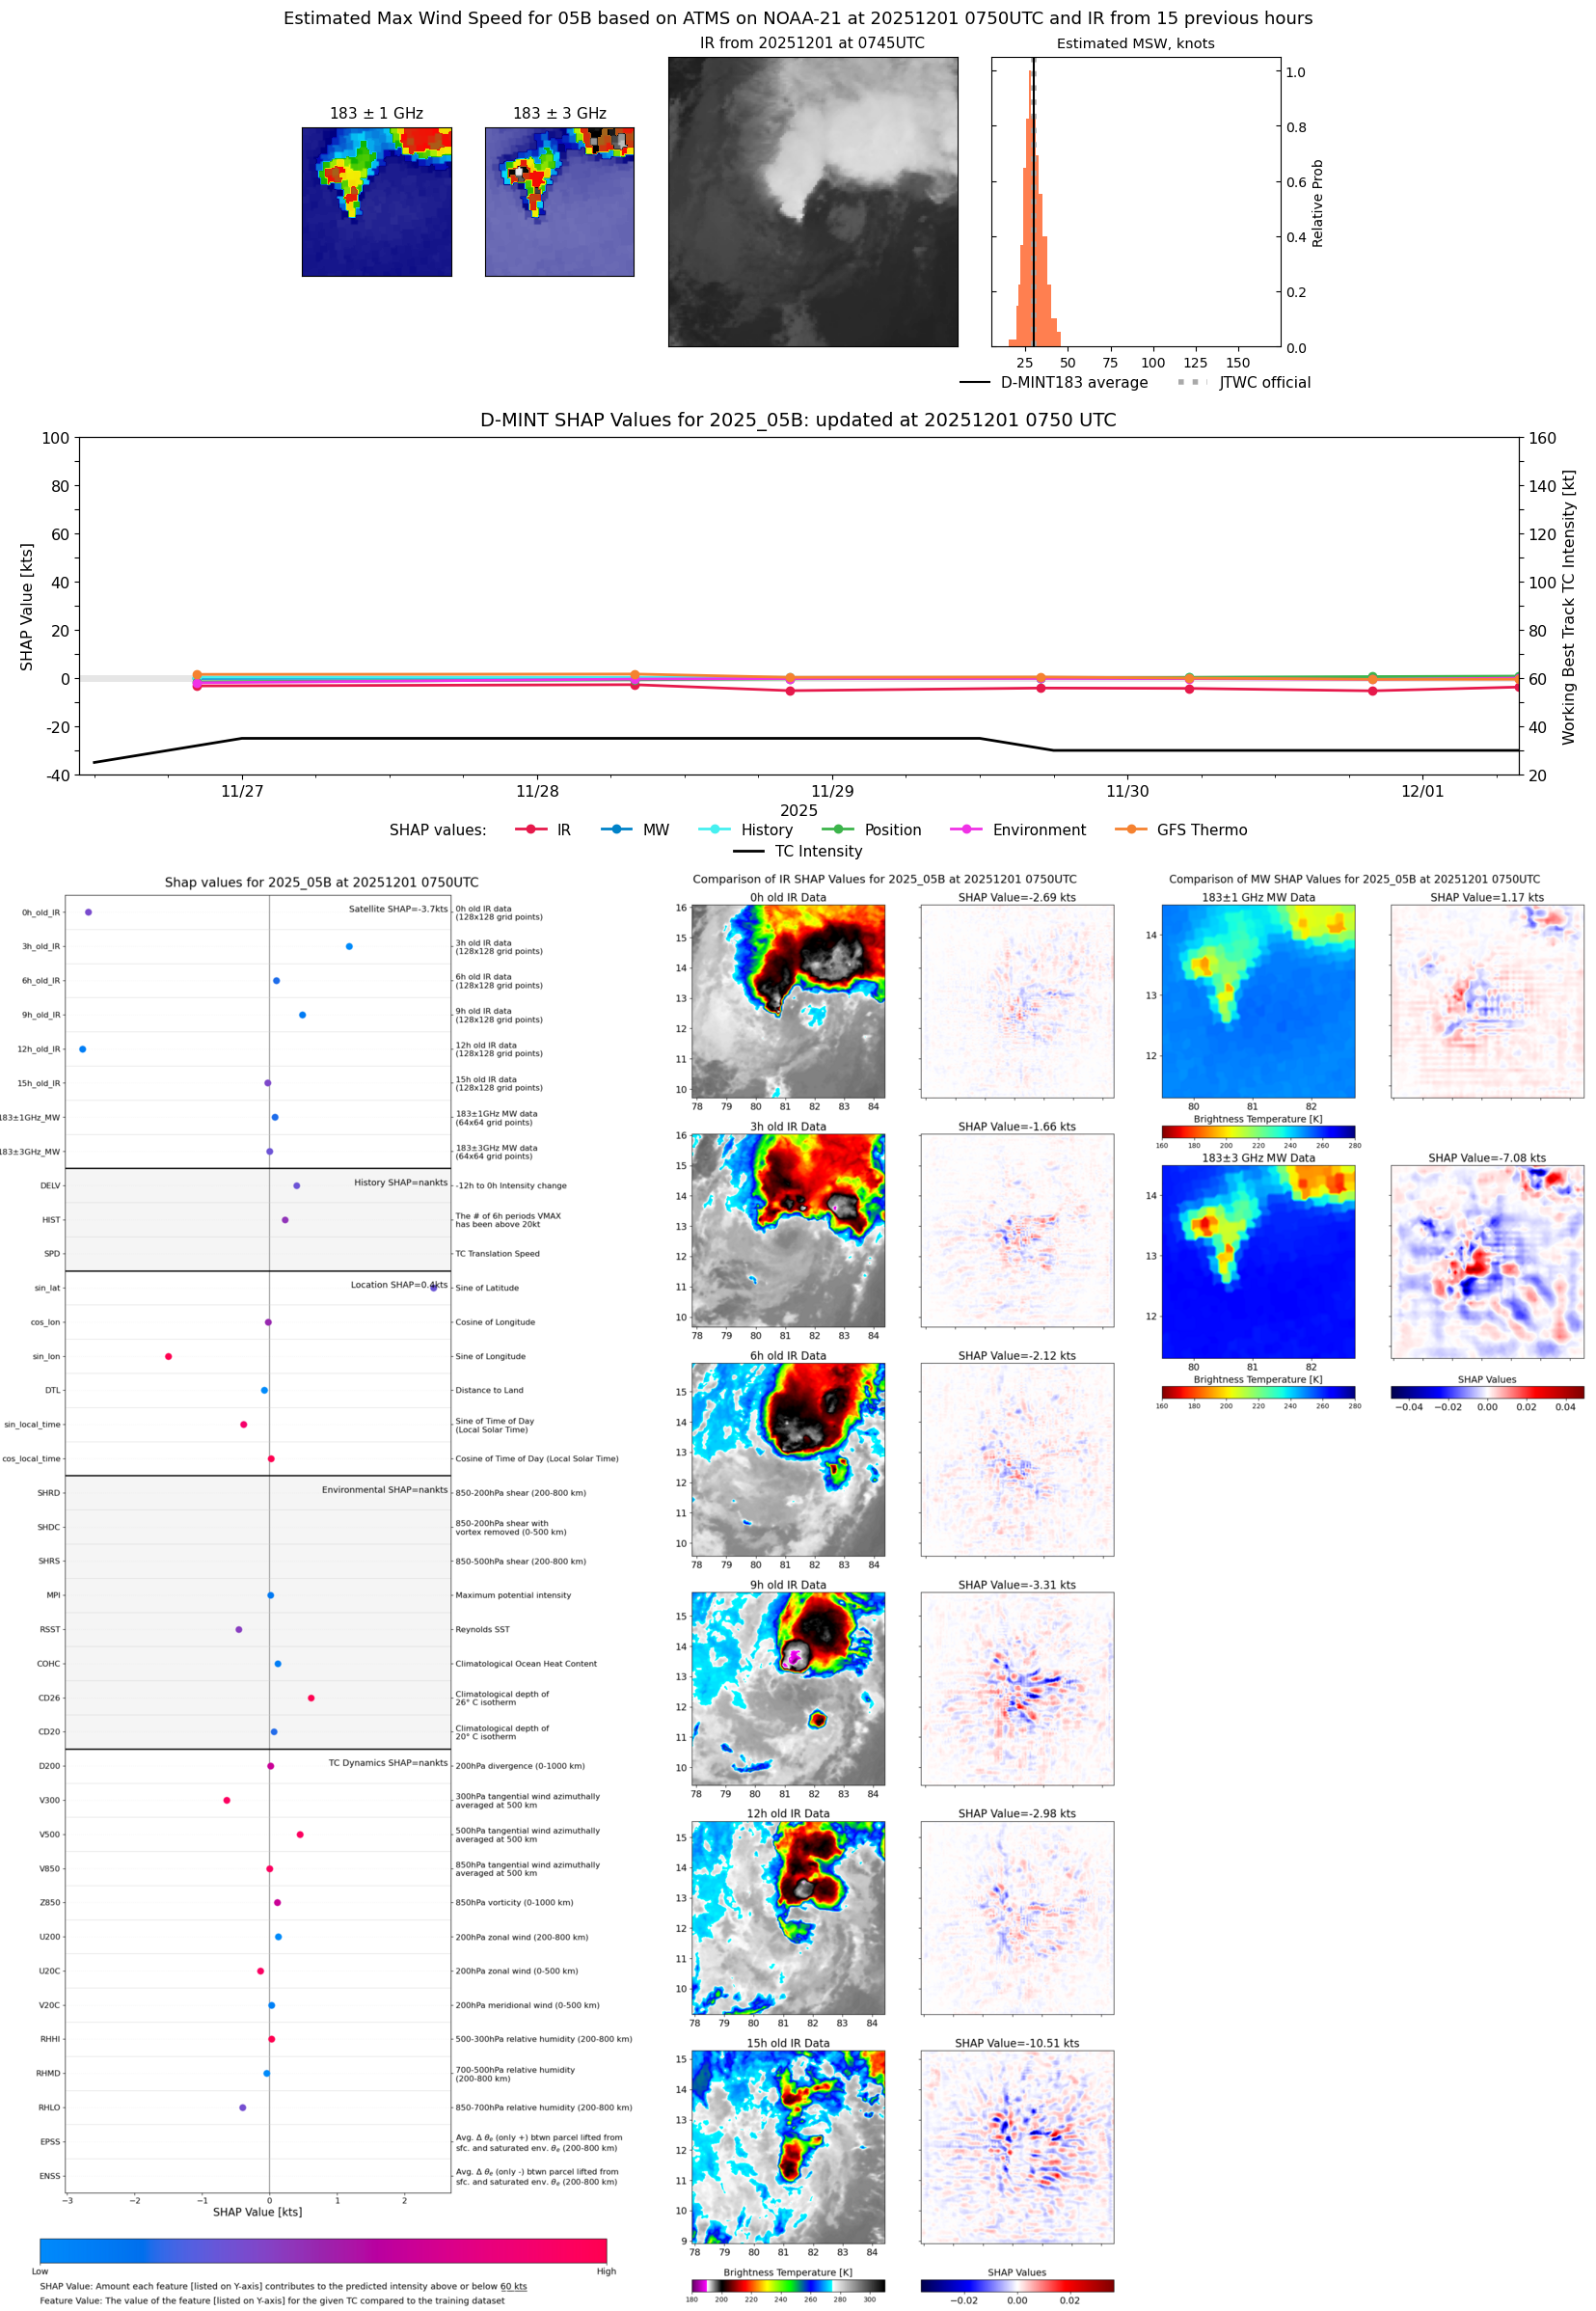 |
| 20251130 | 1953 UTC | ATMS-N20 | 1003 hPa | 27 kts | 25 kts | 30 kts |  |
| 20251130 | 1705 UTC | TMS02 | 1003 hPa | 30 kts | 27 kts | 33 kts | 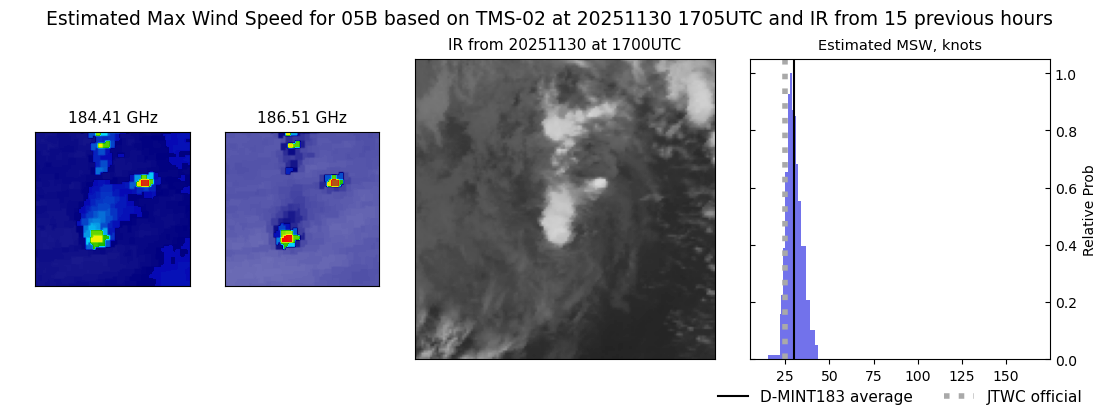 |
| 20251130 | 1642 UTC | TMS06 | 1003 hPa | 30 kts | 27 kts | 33 kts | 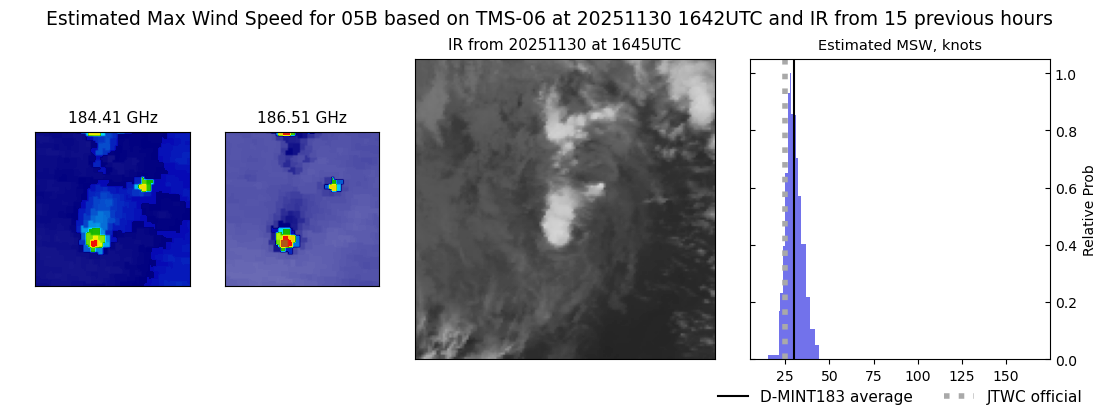 |
| 20251130 | 1007 UTC | SSMISF18 | 1001 hPa | 29 kts | 25 kts | 32 kts | 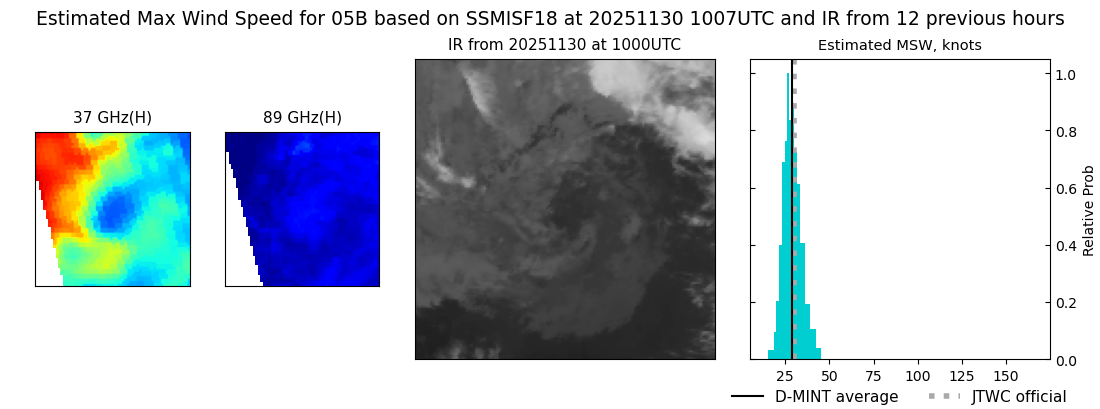 |
| 20251130 | 0809 UTC | ATMS-N21 | 1003 hPa | 28 kts | 25 kts | 31 kts | 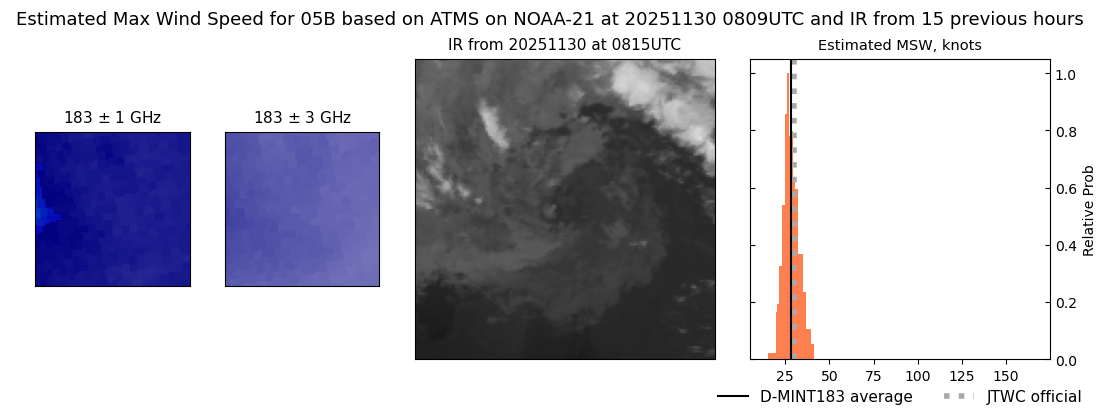 |
| 20251130 | 0501 UTC | TMS02 | 1001 hPa | 31 kts | 28 kts | 35 kts |  |
| 20251130 | 0122 UTC | SSMISF16 | 1001 hPa | 32 kts | 28 kts | 36 kts |  |
| 20251129 | 2257 UTC | SSMISF18 | 1001 hPa | 33 kts | 29 kts | 37 kts |  |
| 20251129 | 2012 UTC | ATMS-N20 | 999 hPa | 30 kts | 27 kts | 34 kts | 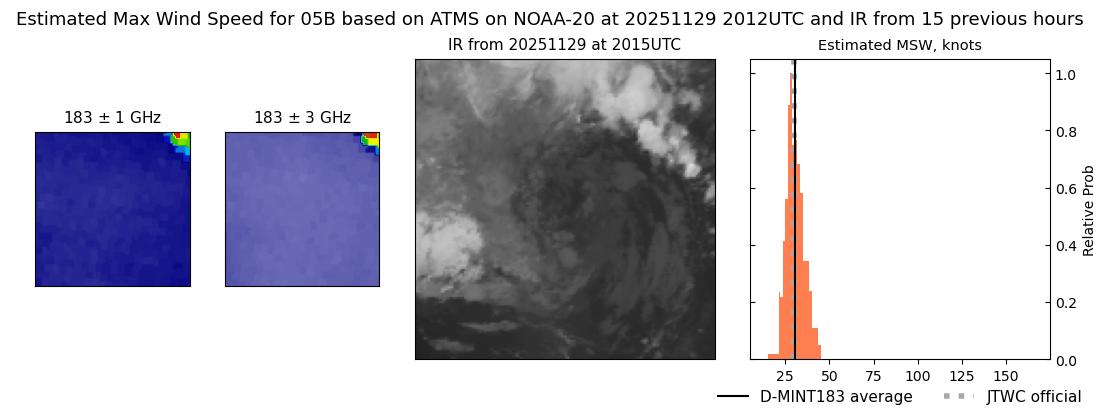 |
| 20251129 | 2011 UTC | AMSR2 | 1001 hPa | 31 kts | 28 kts | 35 kts |  |
| 20251129 | 1833 UTC | GMI | 1001 hPa | 32 kts | 28 kts | 36 kts |  |
| 20251129 | 1658 UTC | TMS06 | 1000 hPa | 32 kts | 29 kts | 36 kts |  |
| 20251129 | 0950 UTC | TMS07 | 1003 hPa | 32 kts | 29 kts | 37 kts | 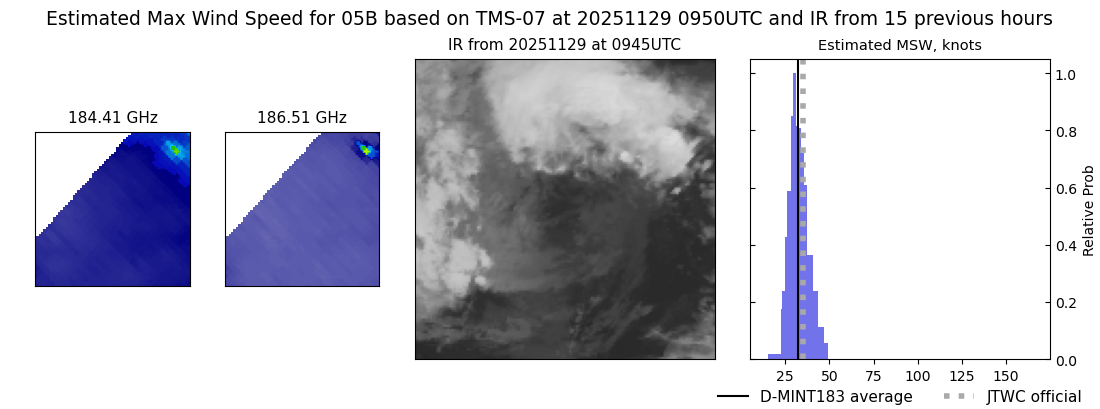 |
| 20251129 | 0756 UTC | AMSR2 | 1003 hPa | 31 kts | 28 kts | 35 kts | 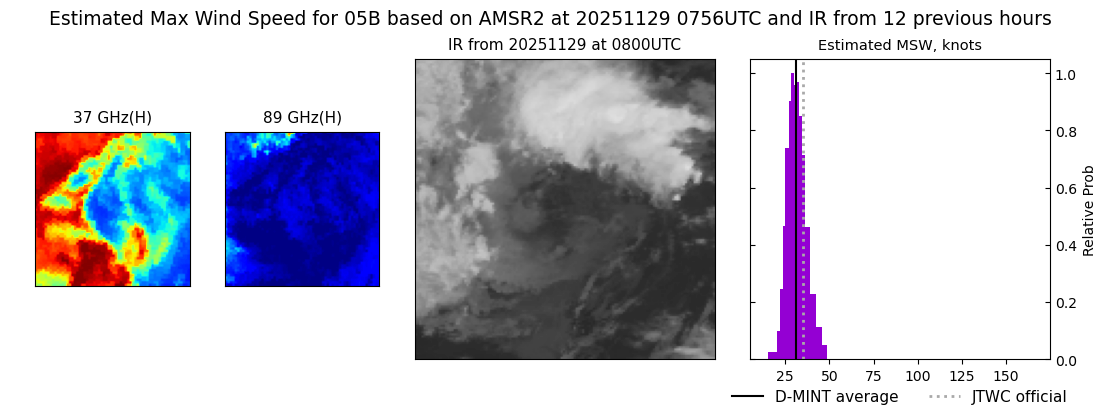 |
| 20251129 | 0737 UTC | ATMS-N20 | 1002 hPa | 33 kts | 29 kts | 37 kts | 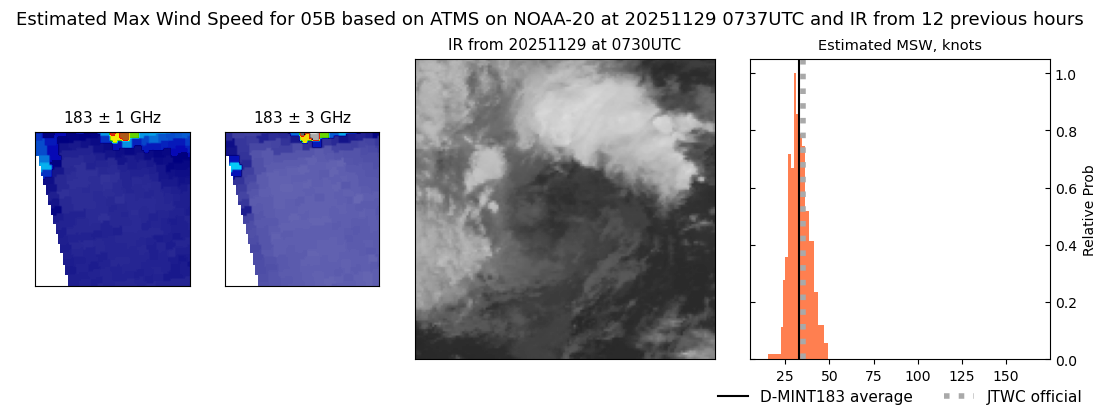 |
| 20251129 | 0431 UTC | TMS05 | 1001 hPa | 34 kts | 30 kts | 39 kts |  |
| 20251129 | 0136 UTC | SSMISF16 | 1001 hPa | 34 kts | 29 kts | 40 kts |  |
| 20251129 | 0046 UTC | WSFM01 | 1000 hPa | 38 kts | 33 kts | 42 kts |  |
| 20251129 | 0019 UTC | SSMISF17 | 998 hPa | 37 kts | 33 kts | 42 kts | 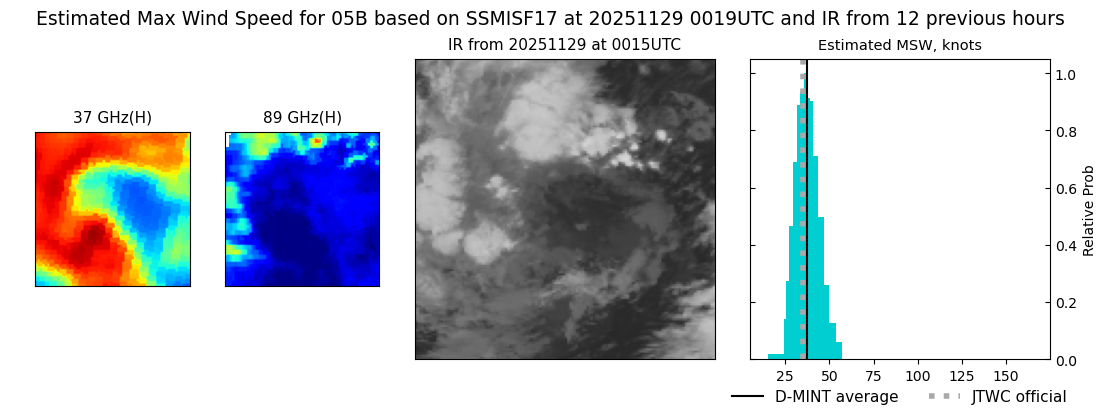 |
| 20251128 | 2032 UTC | ATMS-N20 | 996 hPa | 40 kts | 35 kts | 44 kts | 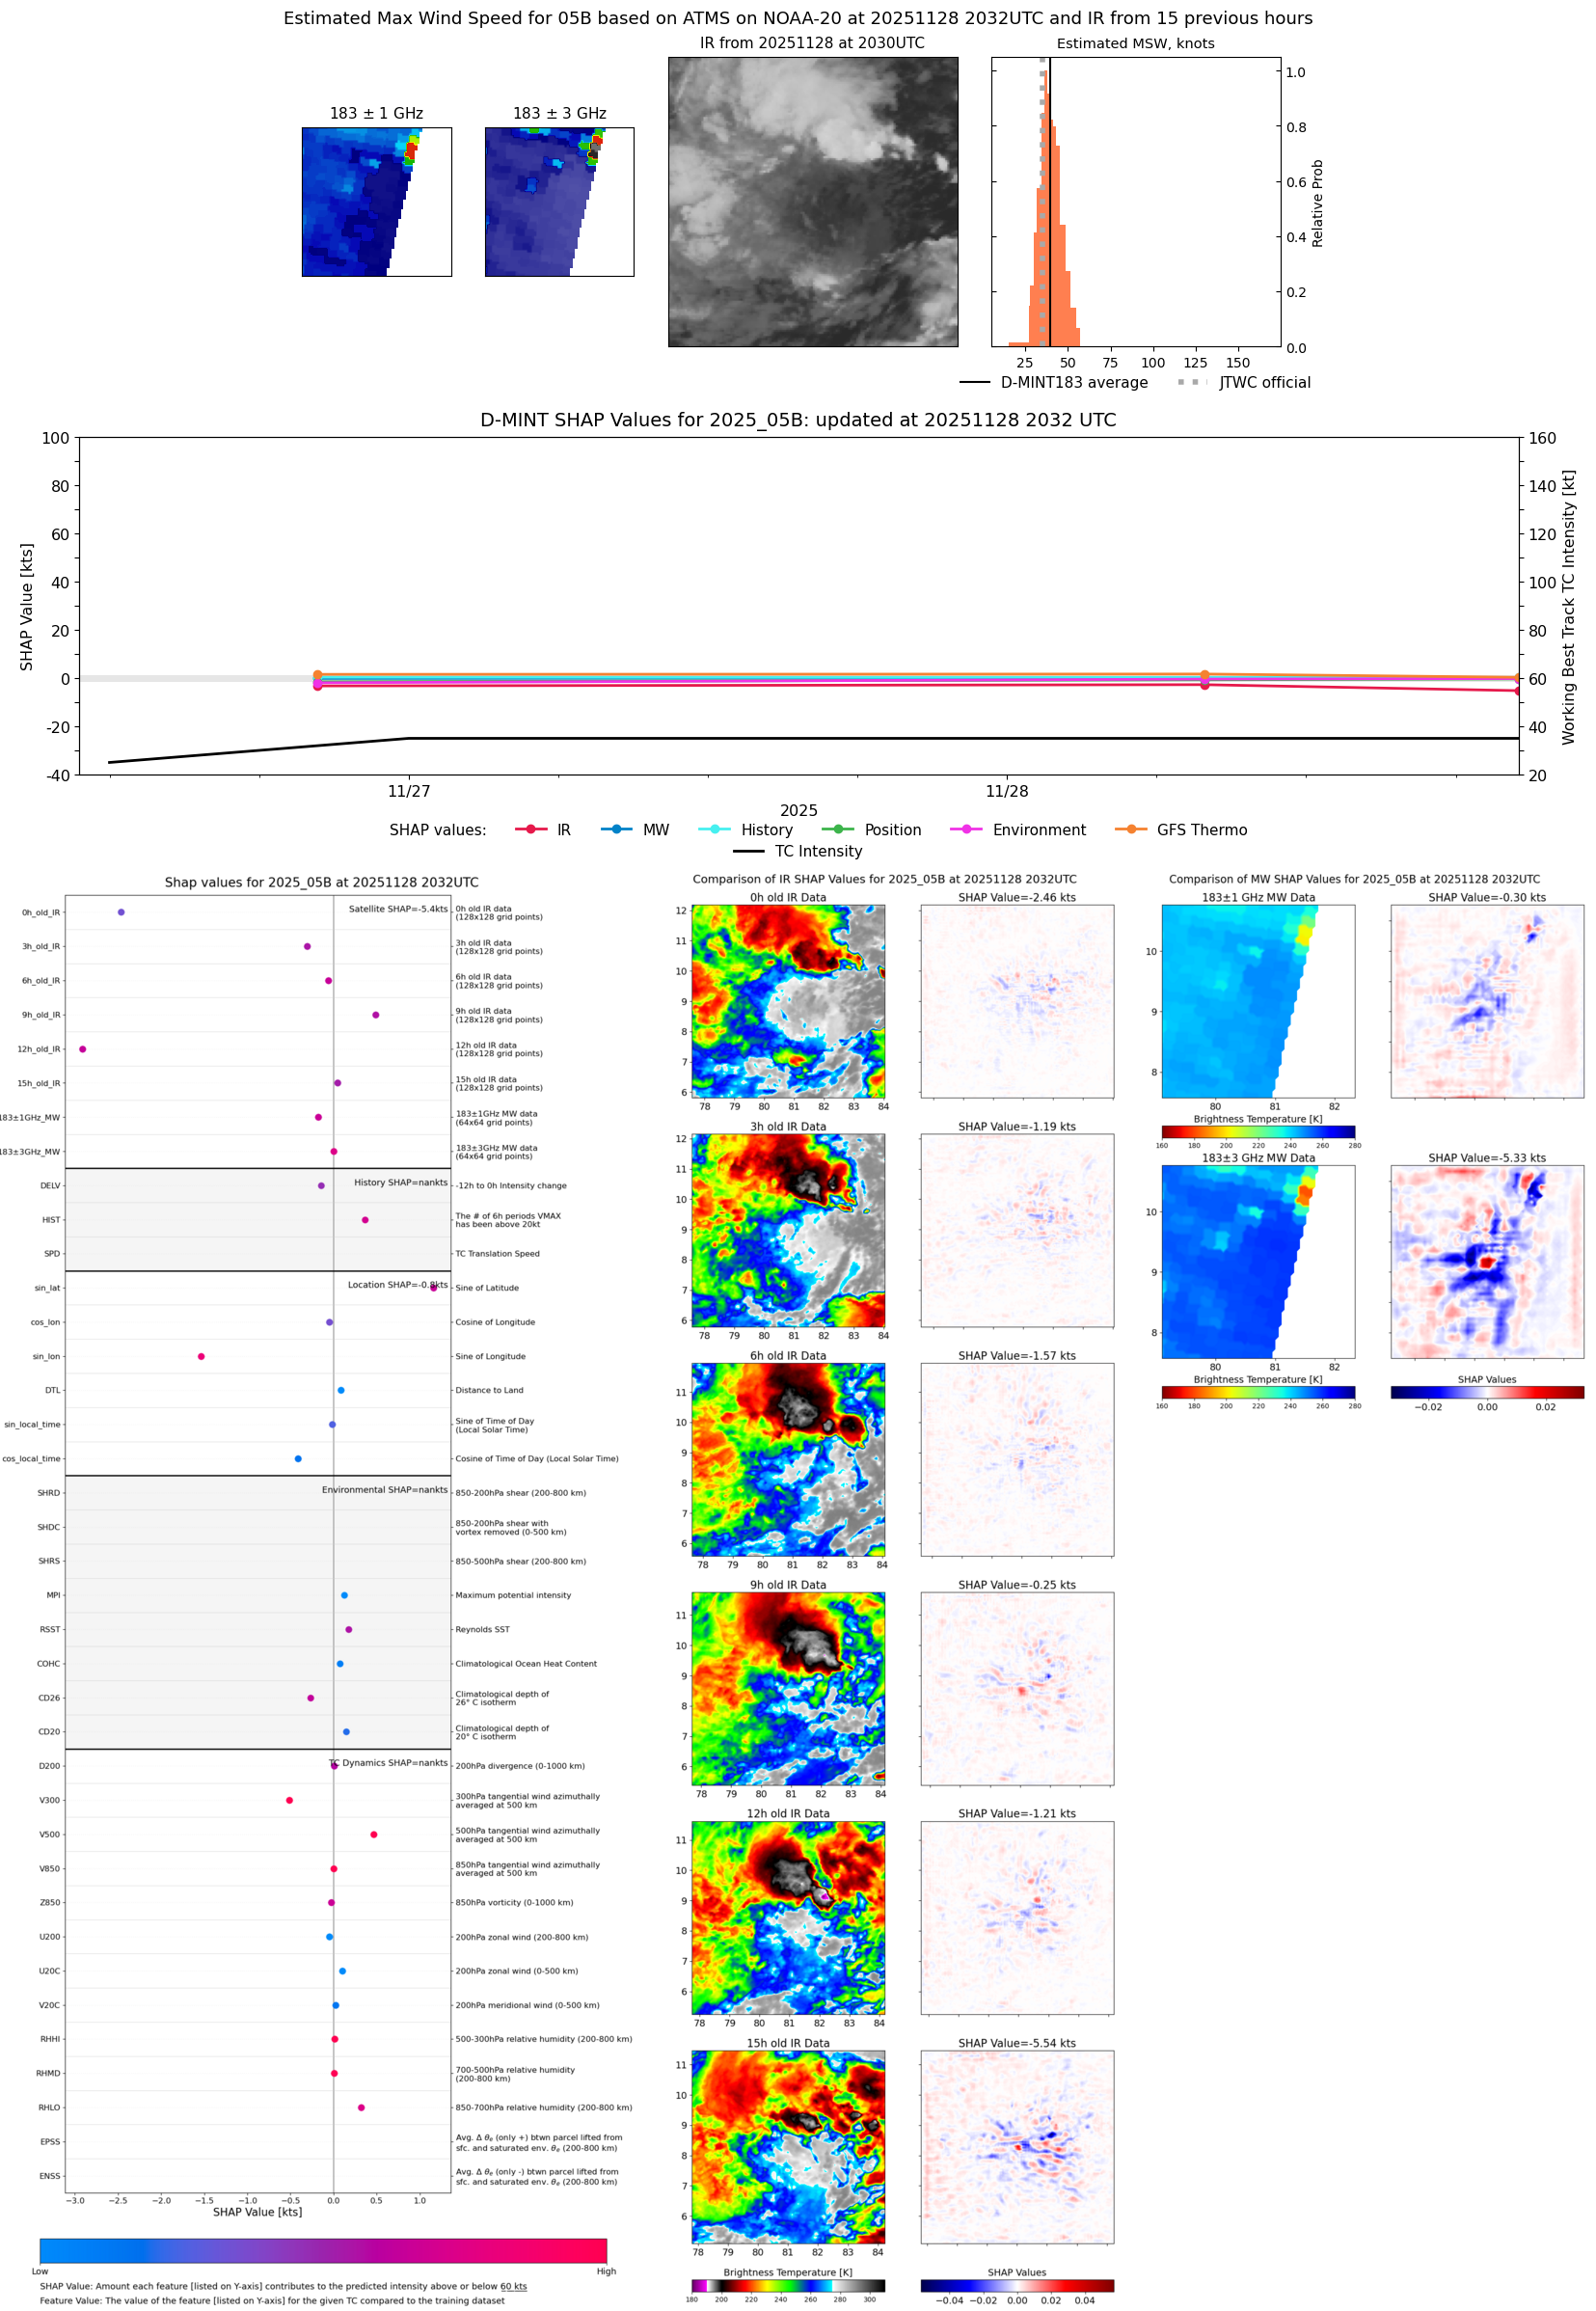 |
| 20251128 | 1913 UTC | GMI | 1000 hPa | 36 kts | 32 kts | 41 kts | 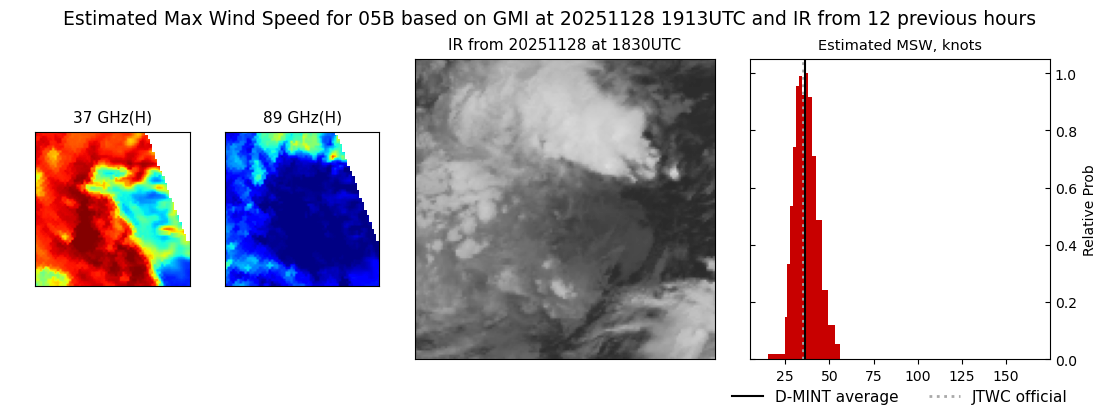 |
| 20251128 | 1212 UTC | WSFM01 | 999 hPa | 39 kts | 34 kts | 43 kts | 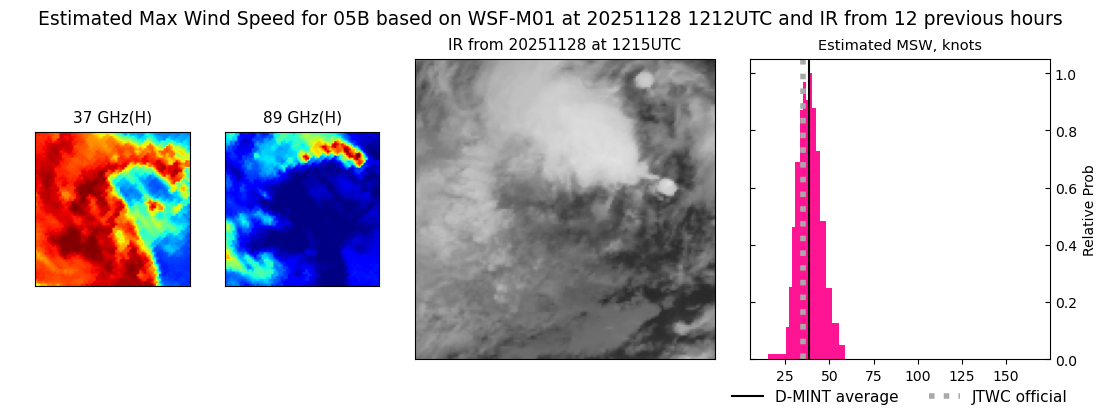 |
| 20251128 | 0755 UTC | ATMS-N20 | 999 hPa | 40 kts | 36 kts | 45 kts | 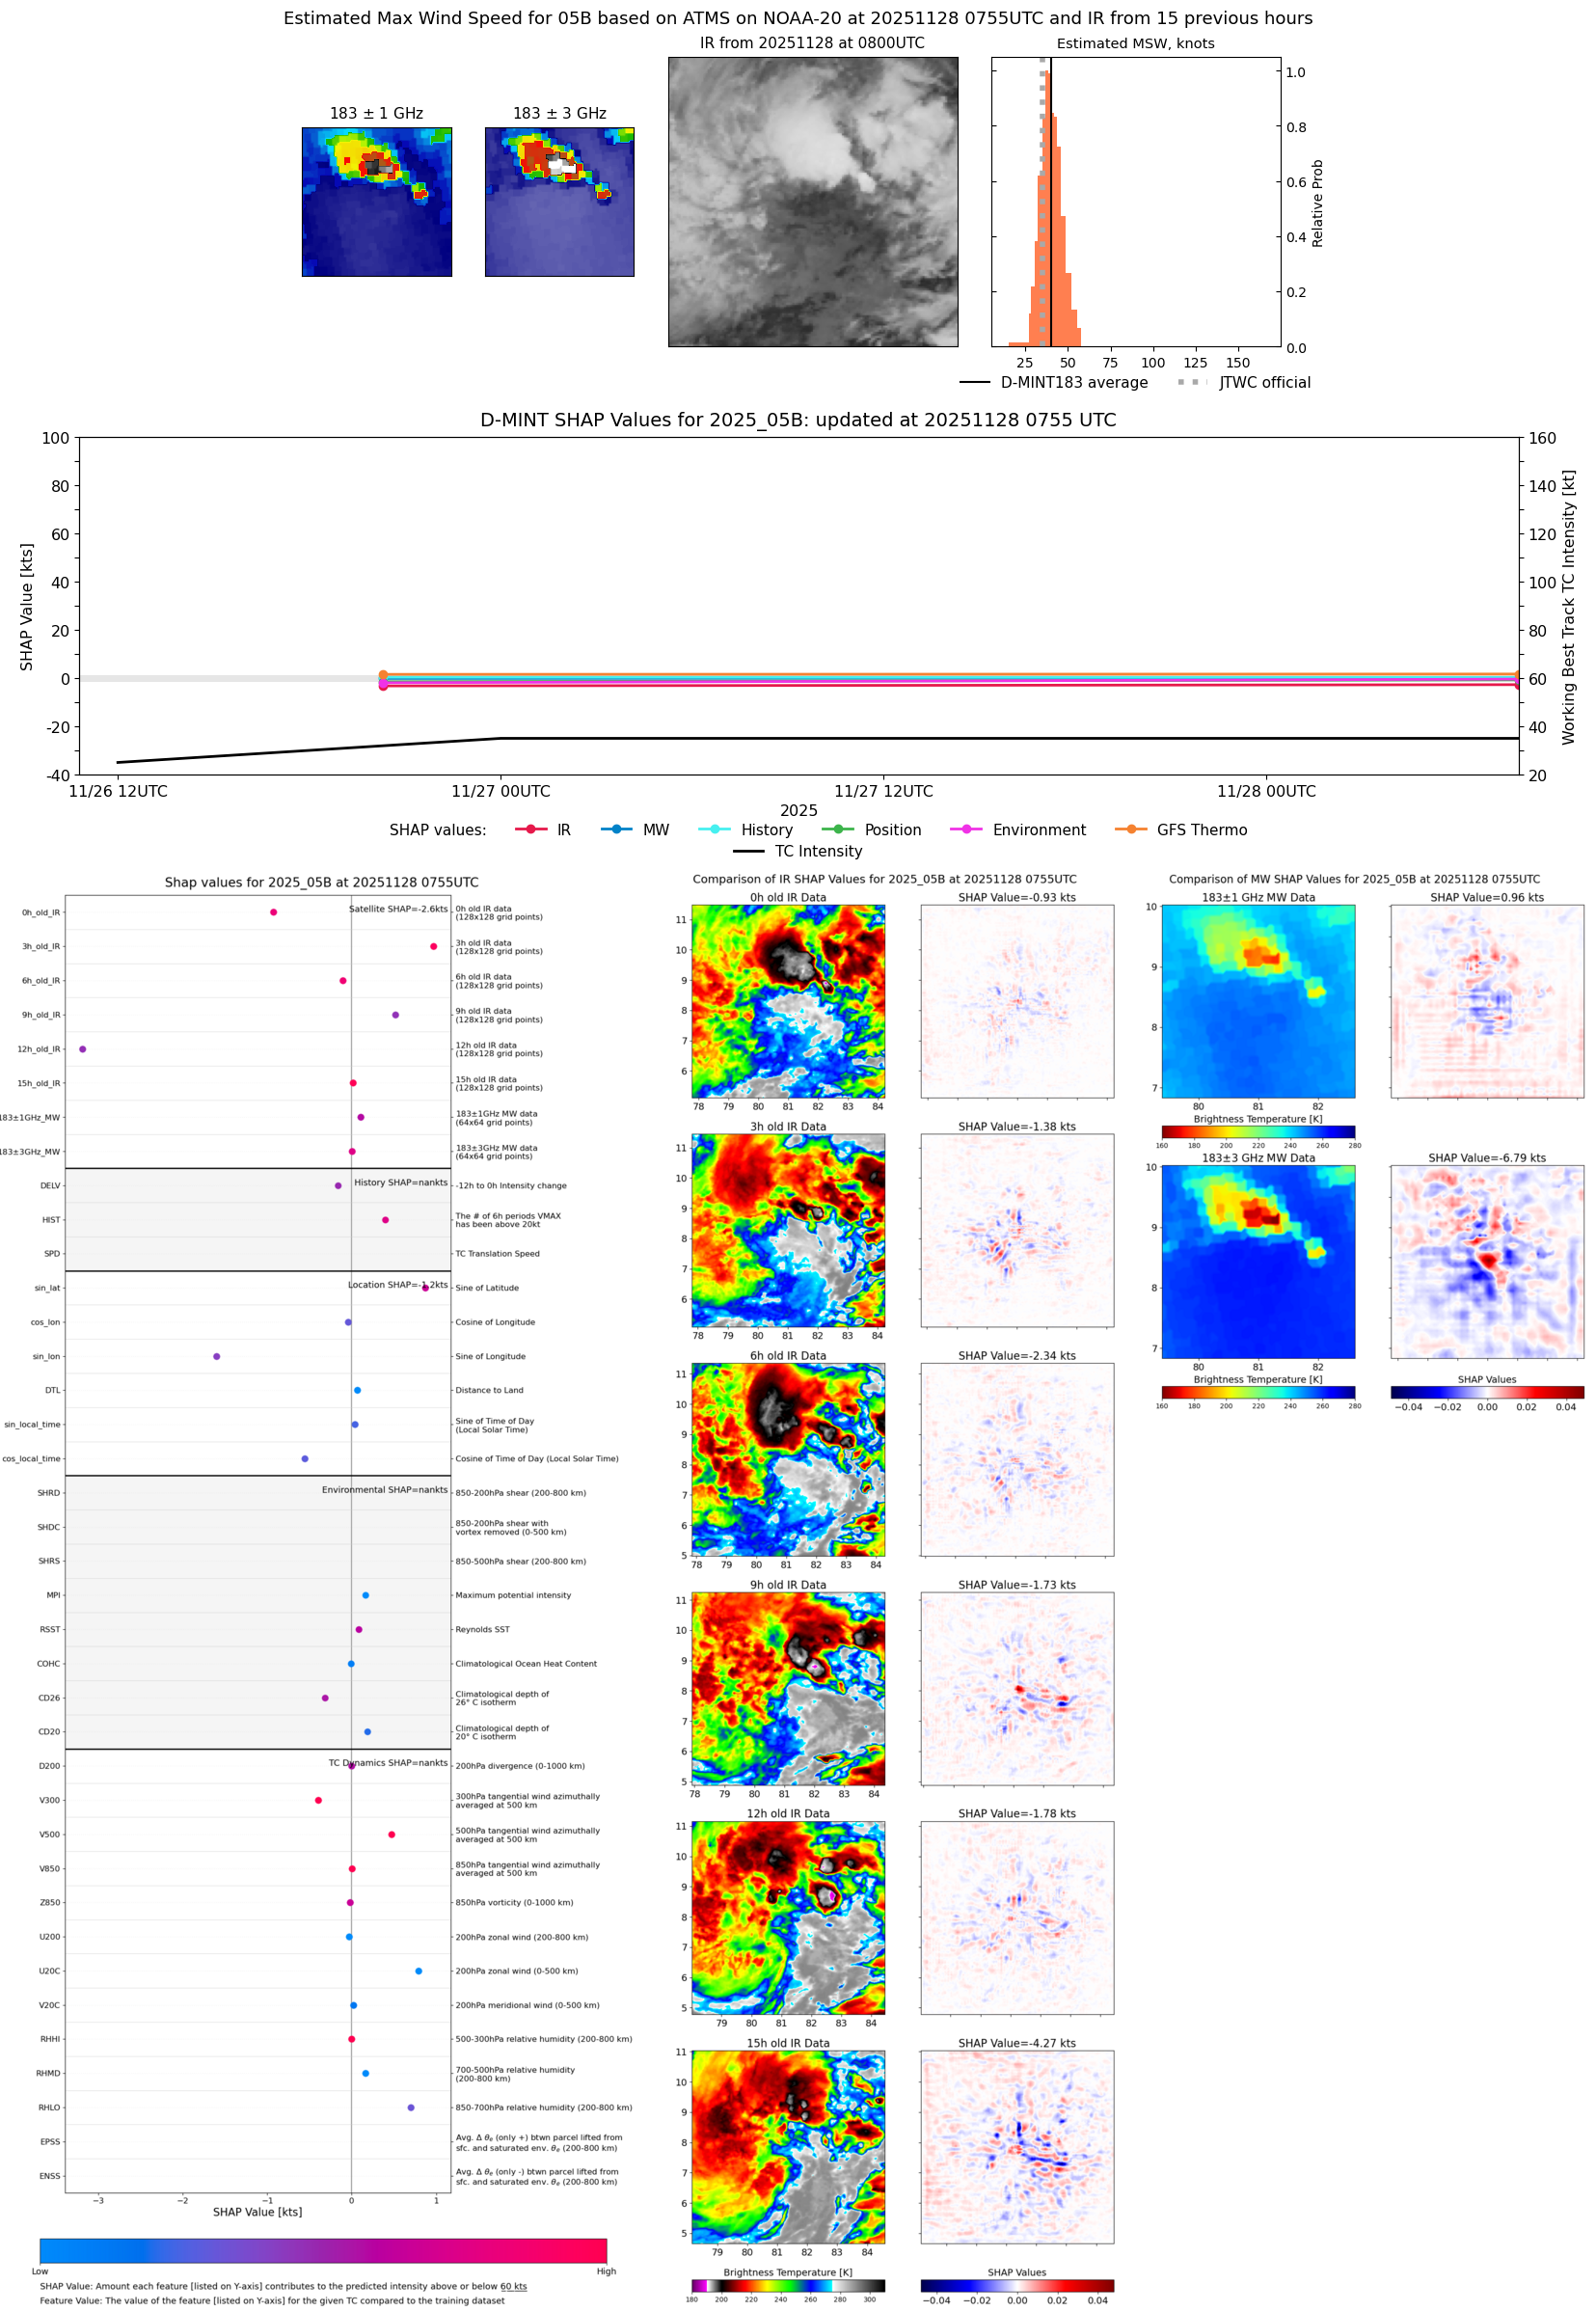 |
| 20251128 | 0738 UTC | GMI | 1002 hPa | 35 kts | 31 kts | 39 kts |  |
| 20251128 | 0151 UTC | SSMISF16 | 1001 hPa | 37 kts | 33 kts | 42 kts |  |
| 20251128 | 0108 UTC | WSFM01 | 1001 hPa | 37 kts | 33 kts | 42 kts |  |
| 20251128 | 0033 UTC | SSMISF17 | 1000 hPa | 36 kts | 31 kts | 41 kts | 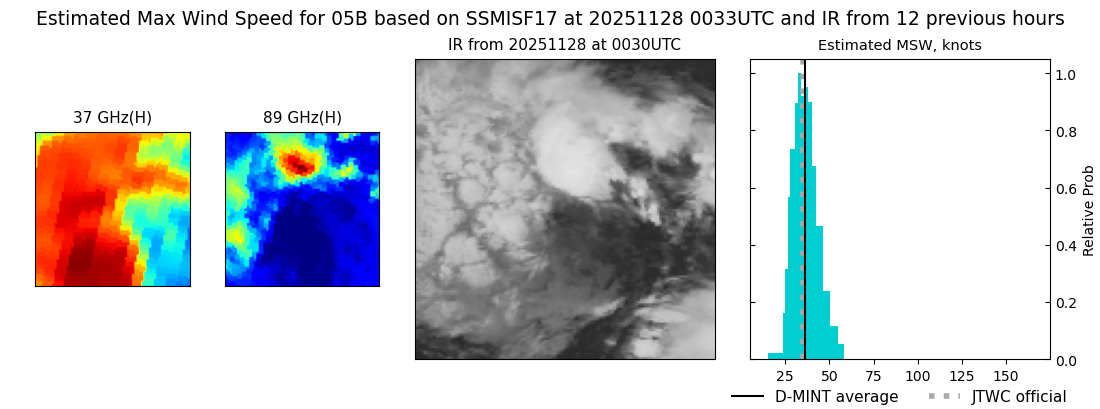 |
| 20251127 | 2143 UTC | TMS07 | 996 hPa | 37 kts | 33 kts | 42 kts |  |
| 20251127 | 2024 UTC | AMSR2 | 996 hPa | 41 kts | 37 kts | 46 kts | 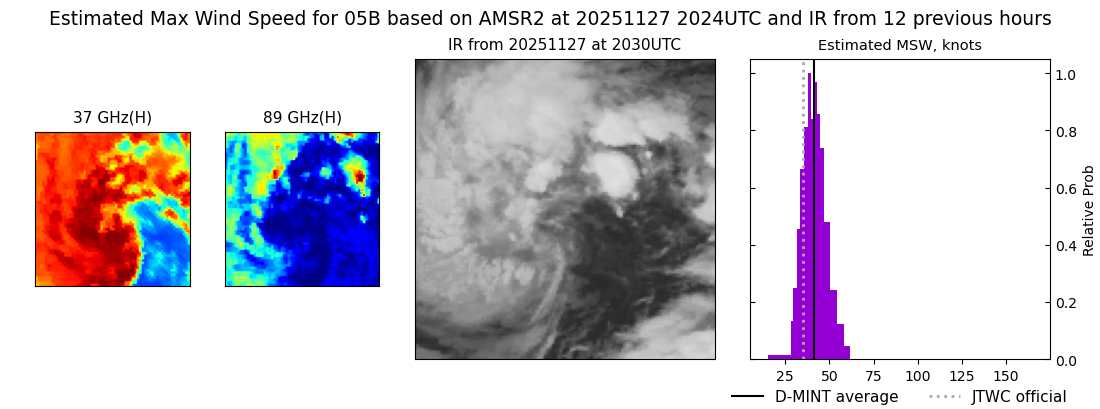 |
| 20251127 | 2000 UTC | ATMS-N21 | 995 hPa | 42 kts | 37 kts | 46 kts | 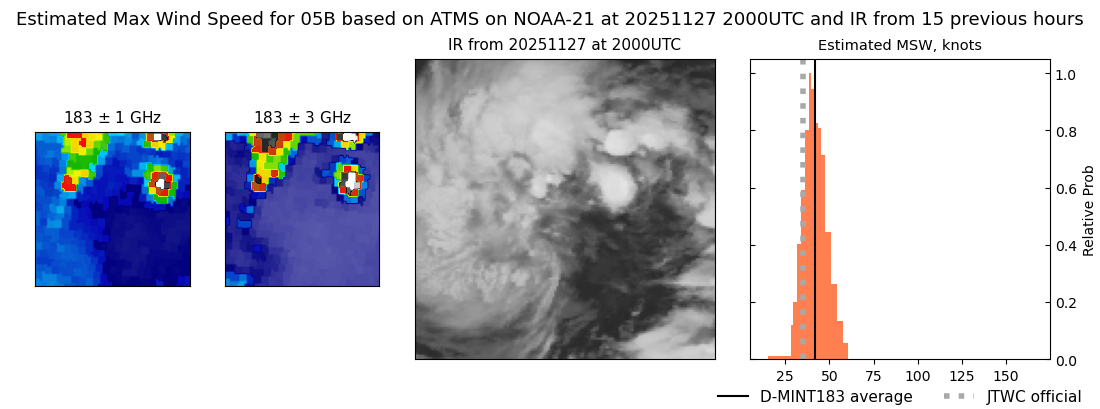 |
| 20251127 | 1311 UTC | SSMISF16 | 995 hPa | 44 kts | 39 kts | 50 kts |  |
| 20251127 | 1231 UTC | WSFM01 | 994 hPa | 46 kts | 41 kts | 51 kts | 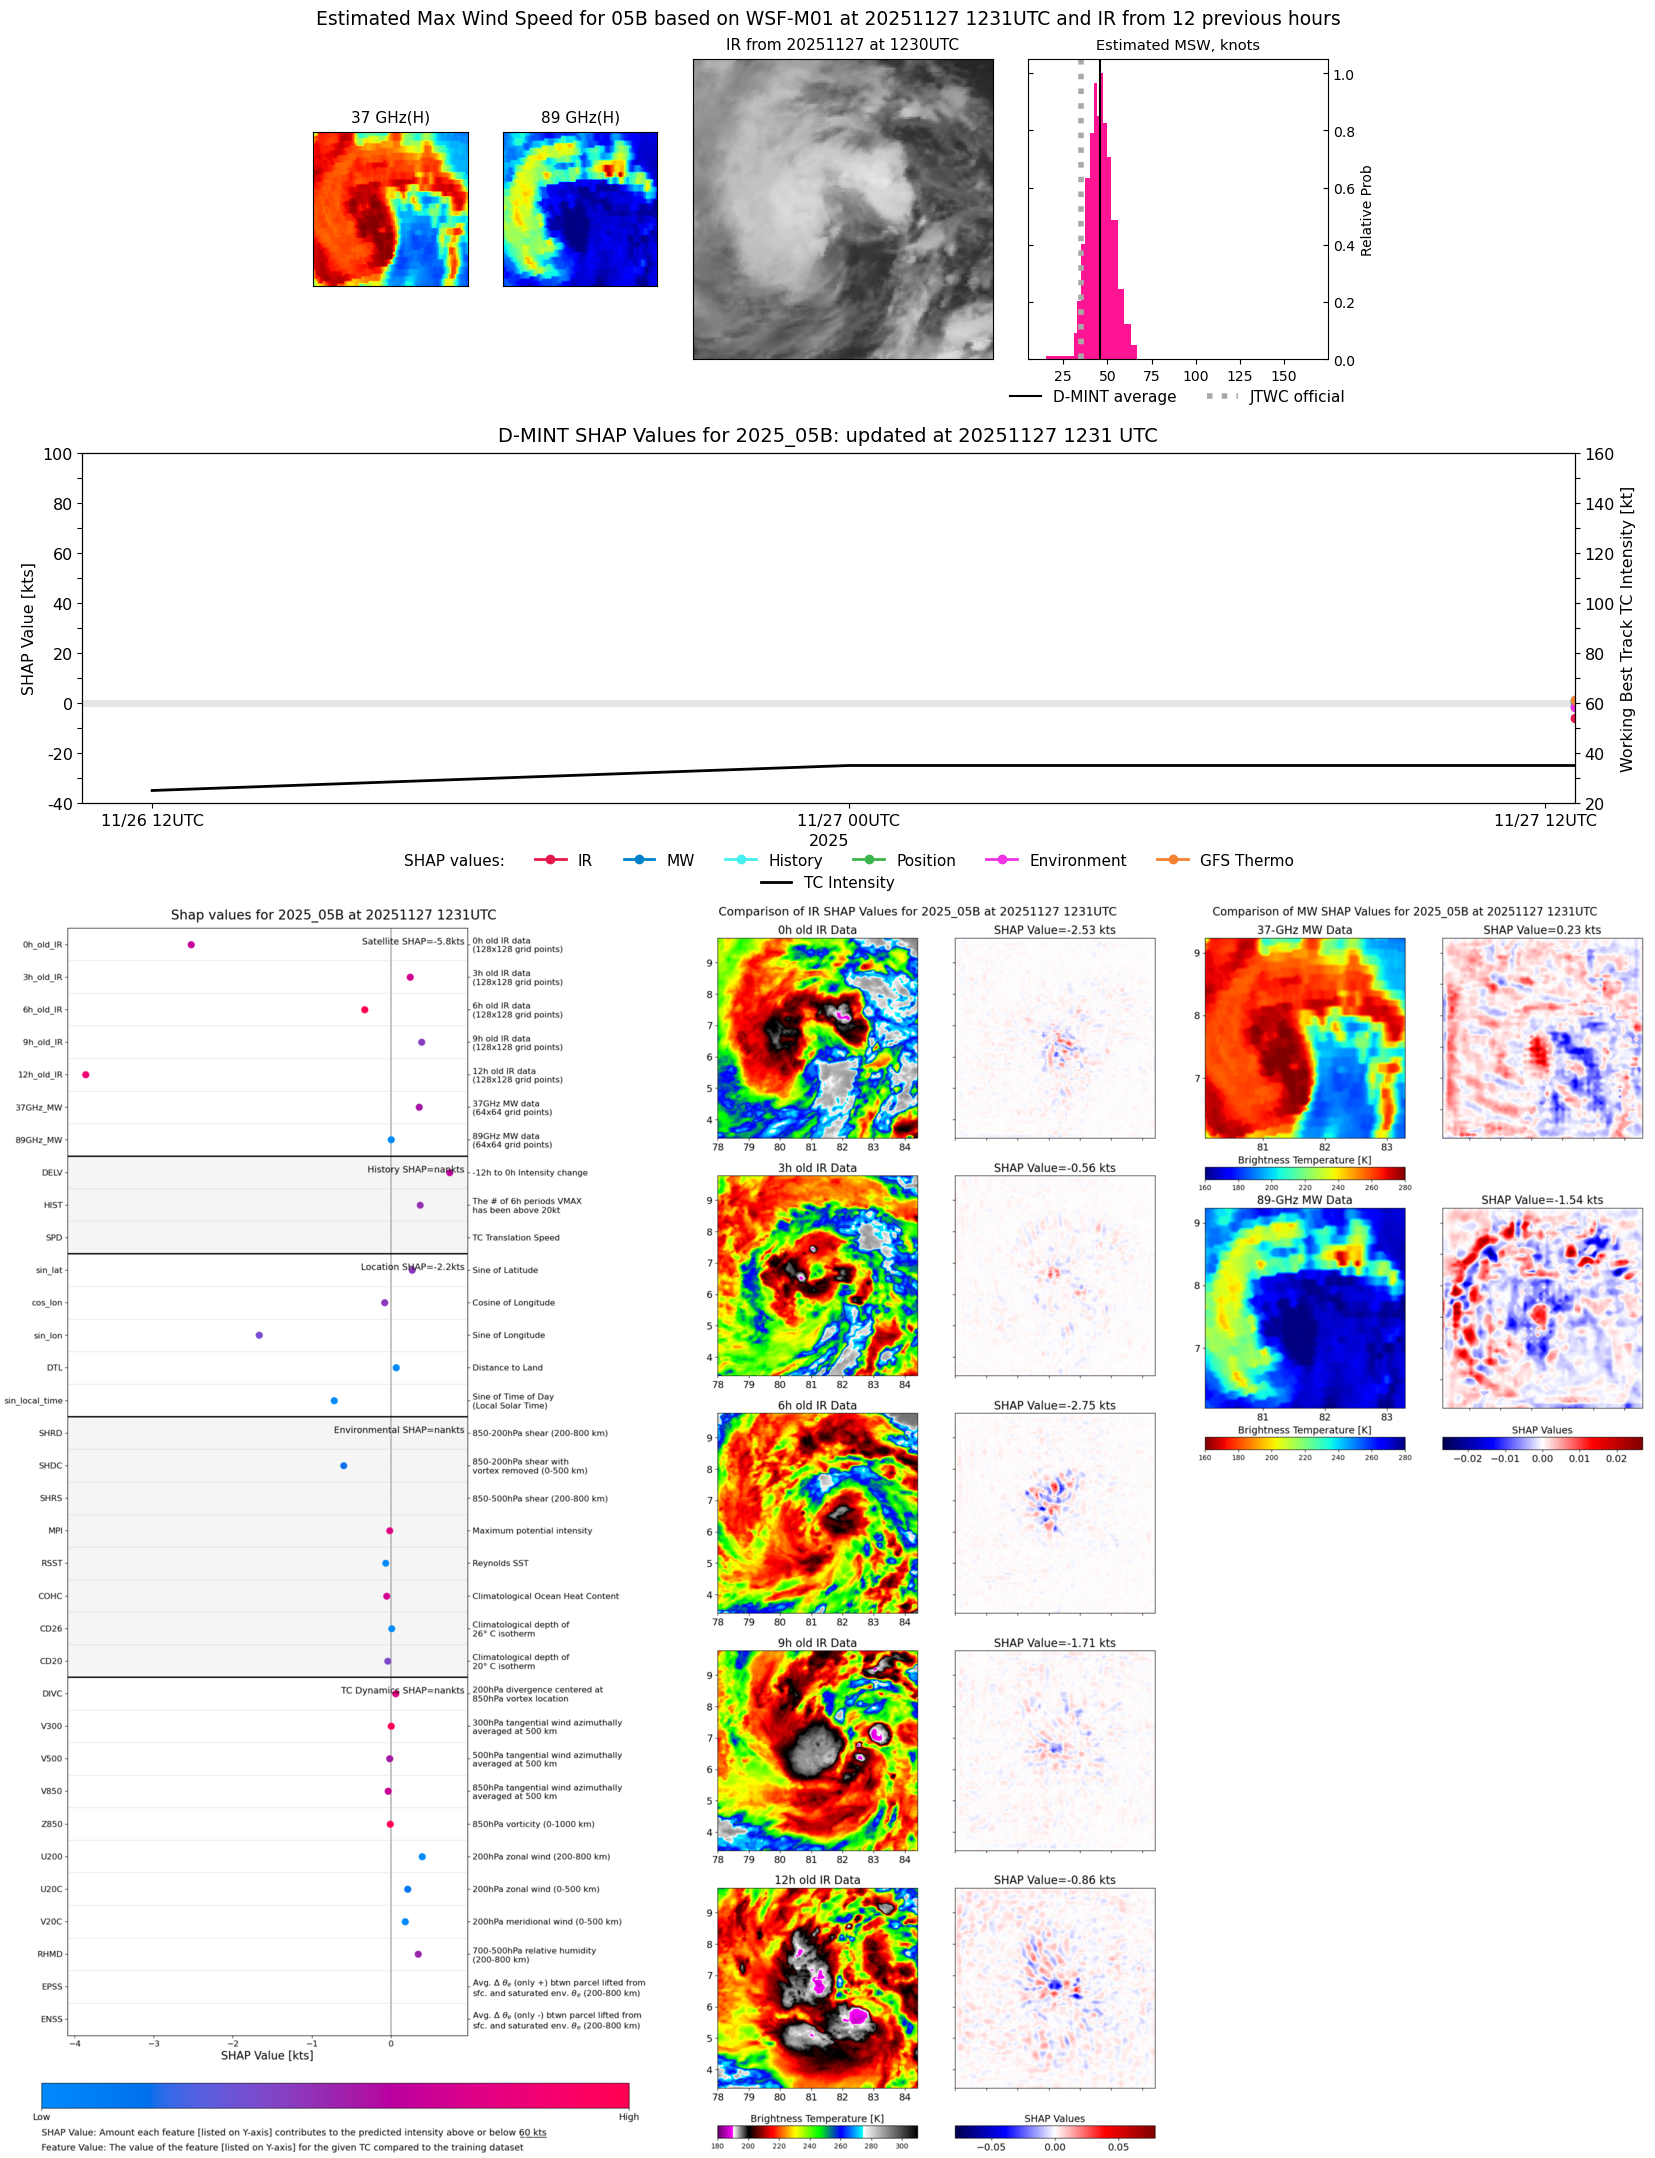 |
| 20251127 | 1047 UTC | SSMISF18 | 996 hPa | 44 kts | 39 kts | 50 kts |  |
| 20251127 | 0814 UTC | ATMS-N20 | 999 hPa | 41 kts | 37 kts | 46 kts |  |
| 20251126 | 2019 UTC | ATMS-N21 | 1003 hPa | 29 kts | 27 kts | 32 kts | 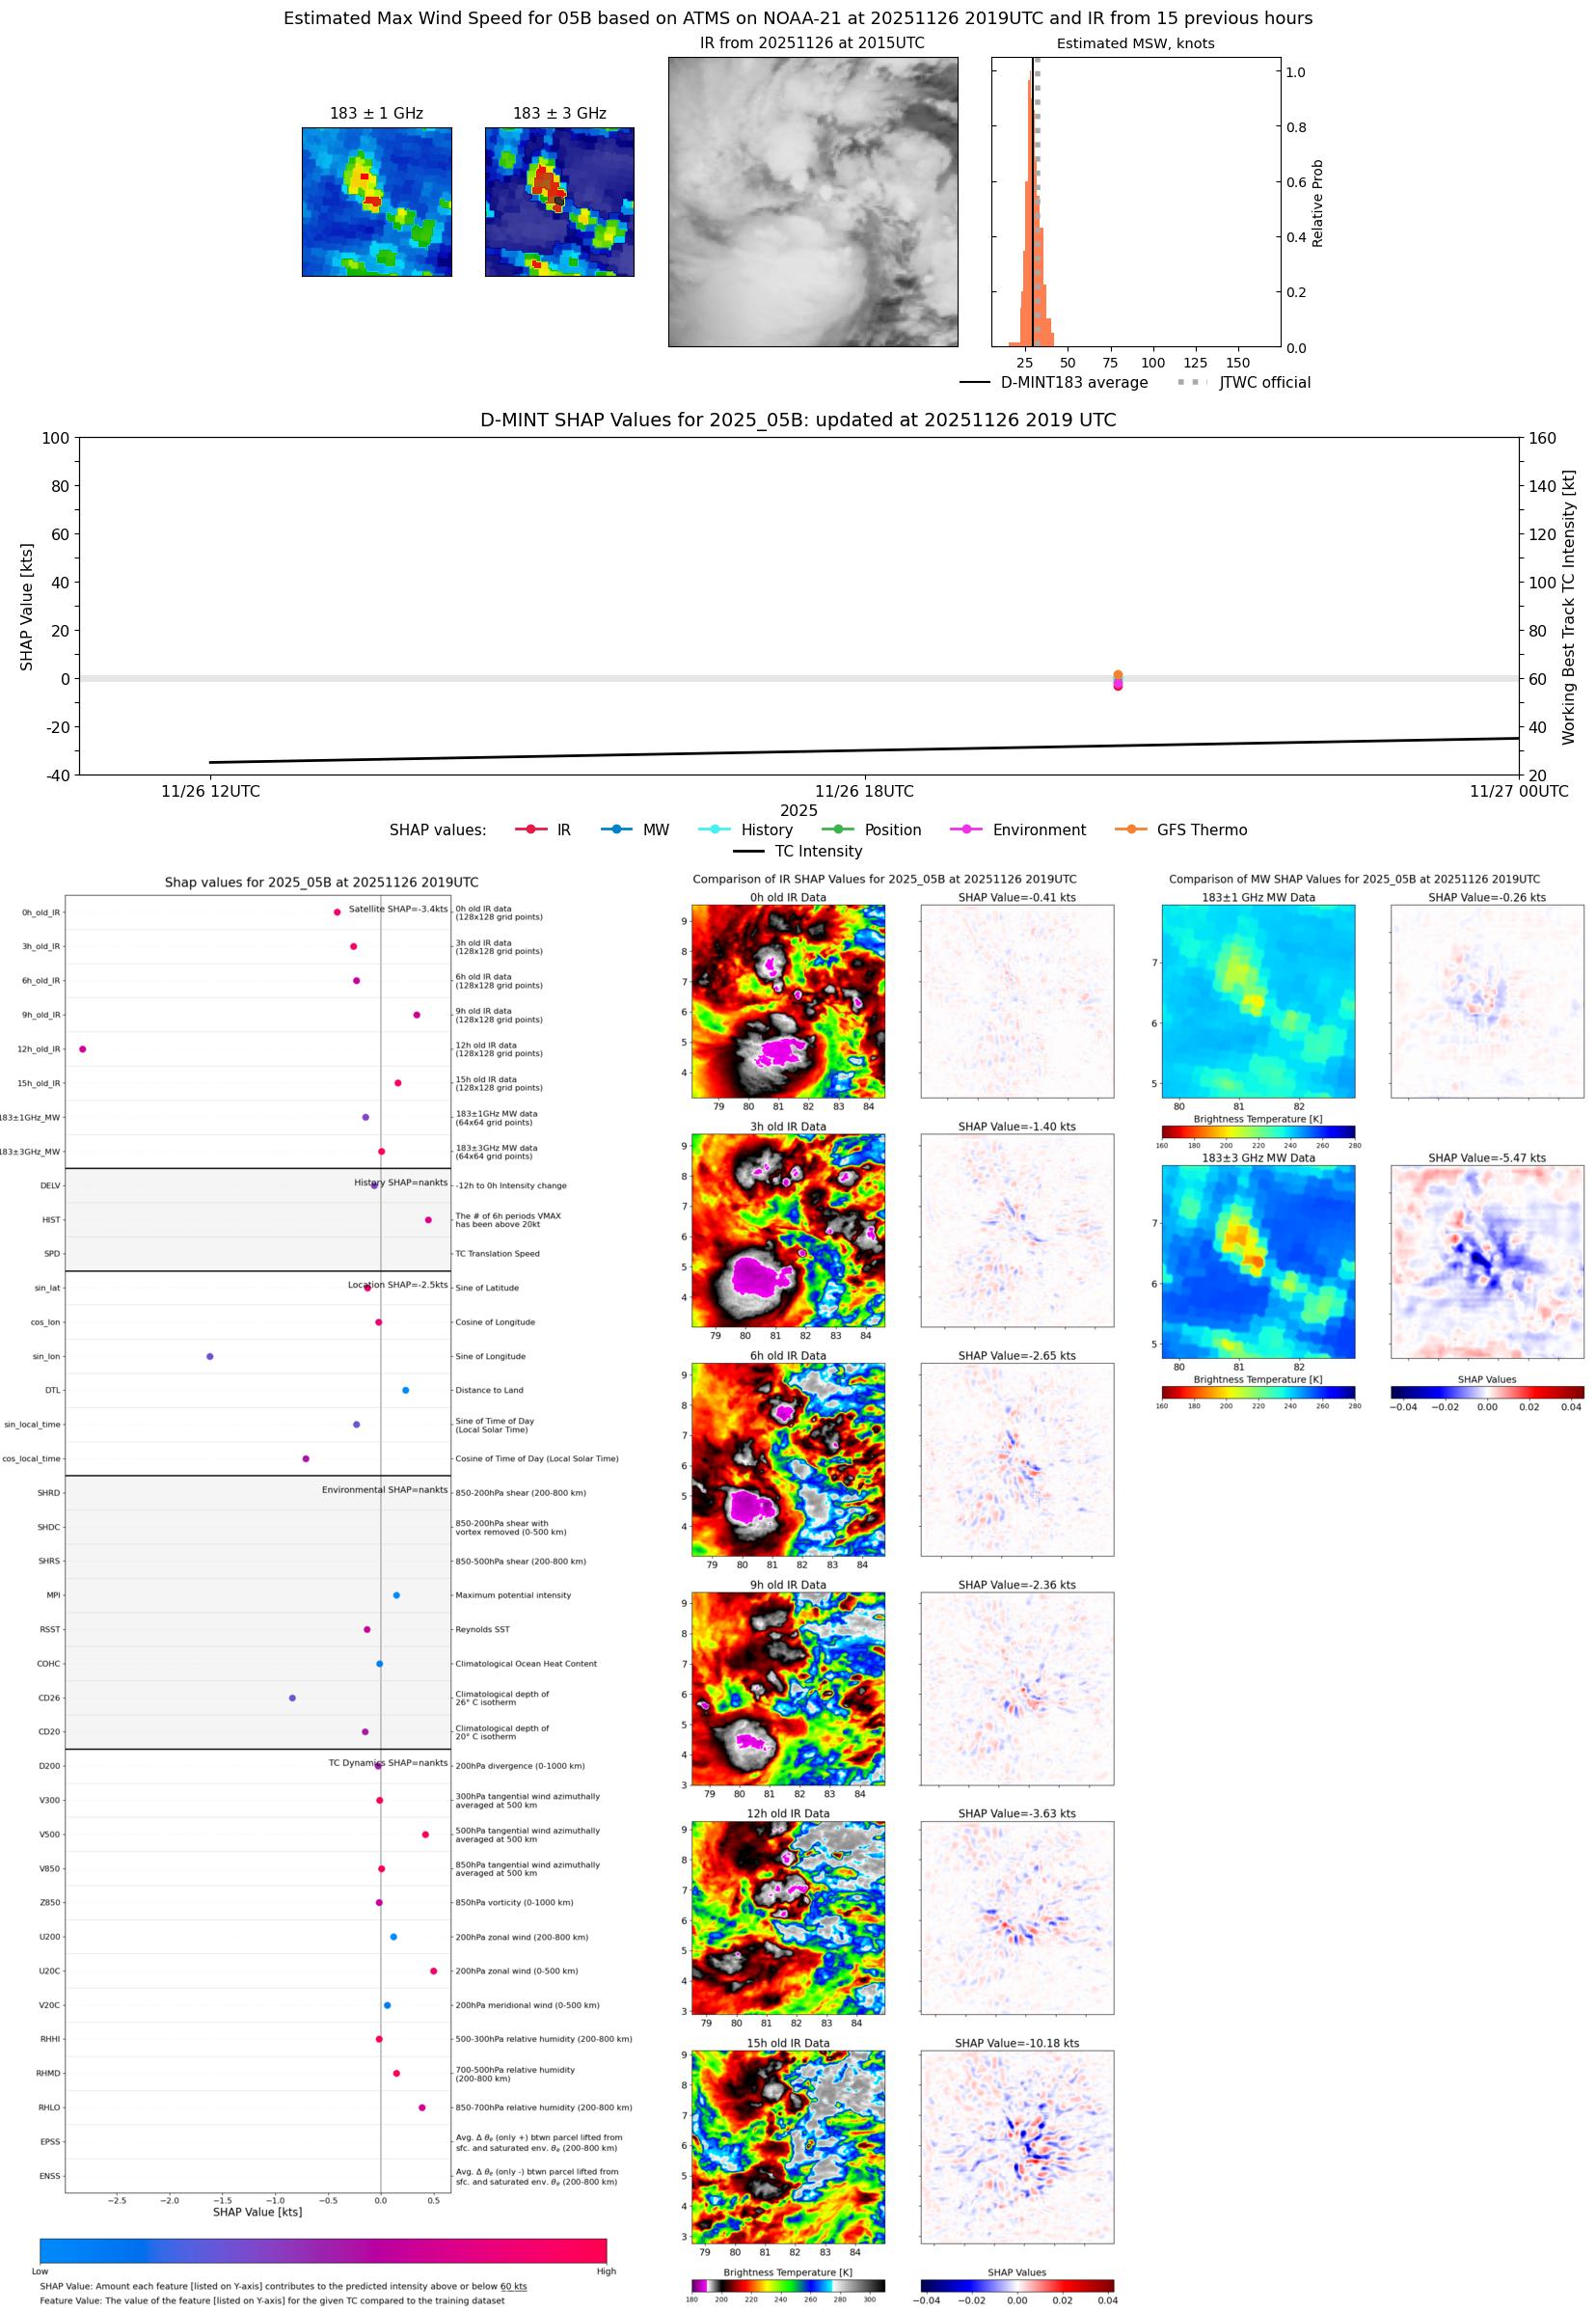 |
| 20251126 | 1251 UTC | WSFM01 | 1005 hPa | 26 kts | 24 kts | 29 kts |  |