|
||

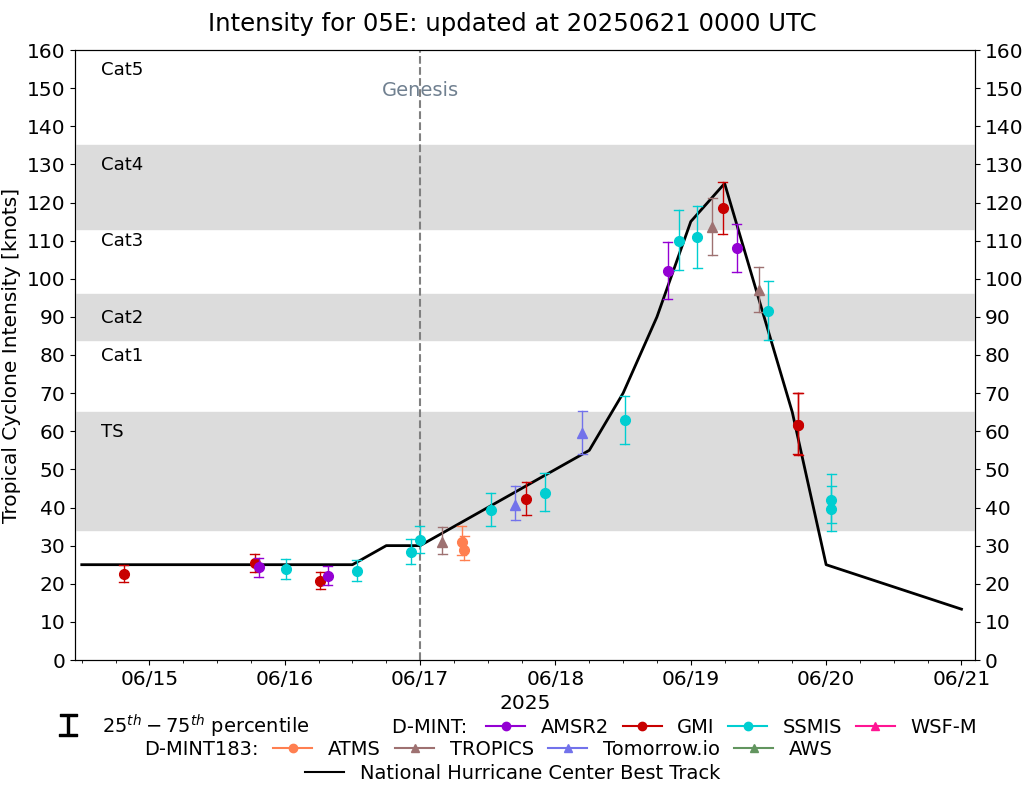 |
D-MINT HISTORY FILE for 2025_05E
| Date | Time | MW Sensor | MSLP | Vmax (30th-70th percentile average) | Vmax 25th percentile | Vmax 75th percentile | Image |
| 20250620 | 0056 UTC | SSMISF17 | 1001 hPa | 42 kts | 36 kts | 49 kts | 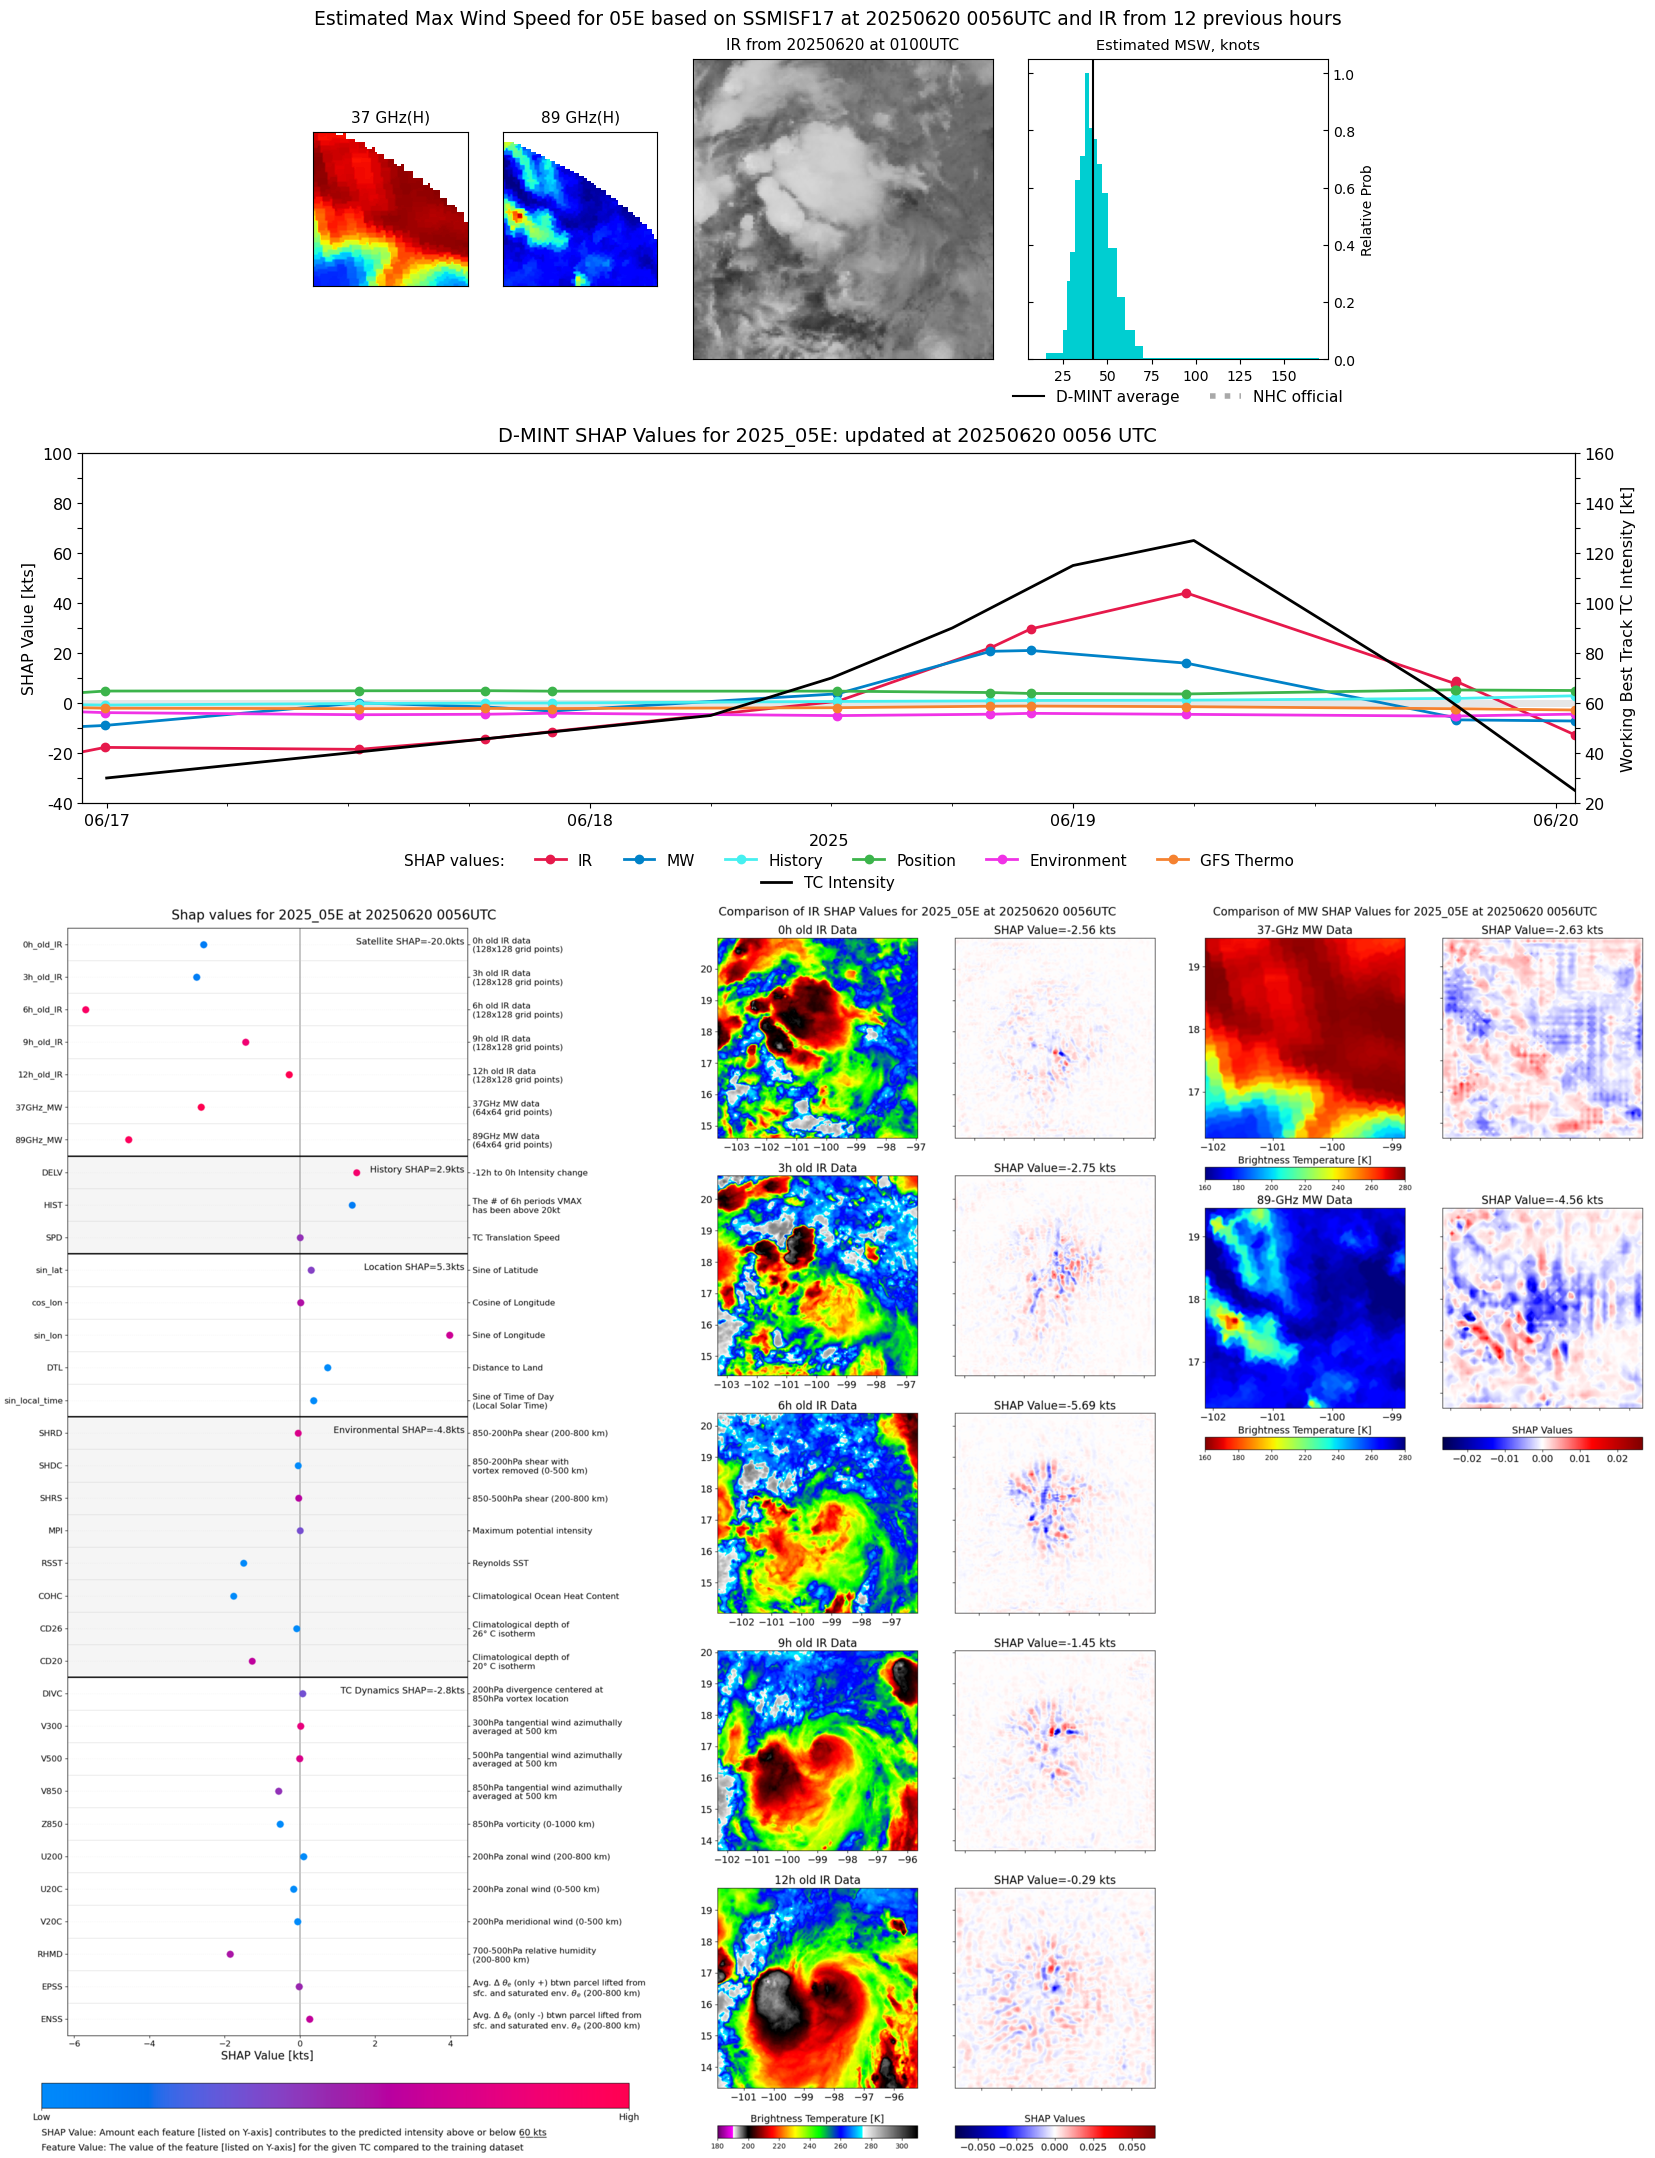 |
| 20250620 | 0056 UTC | SSMISF17 | 1002 hPa | 41 kts | 35 kts | 48 kts | 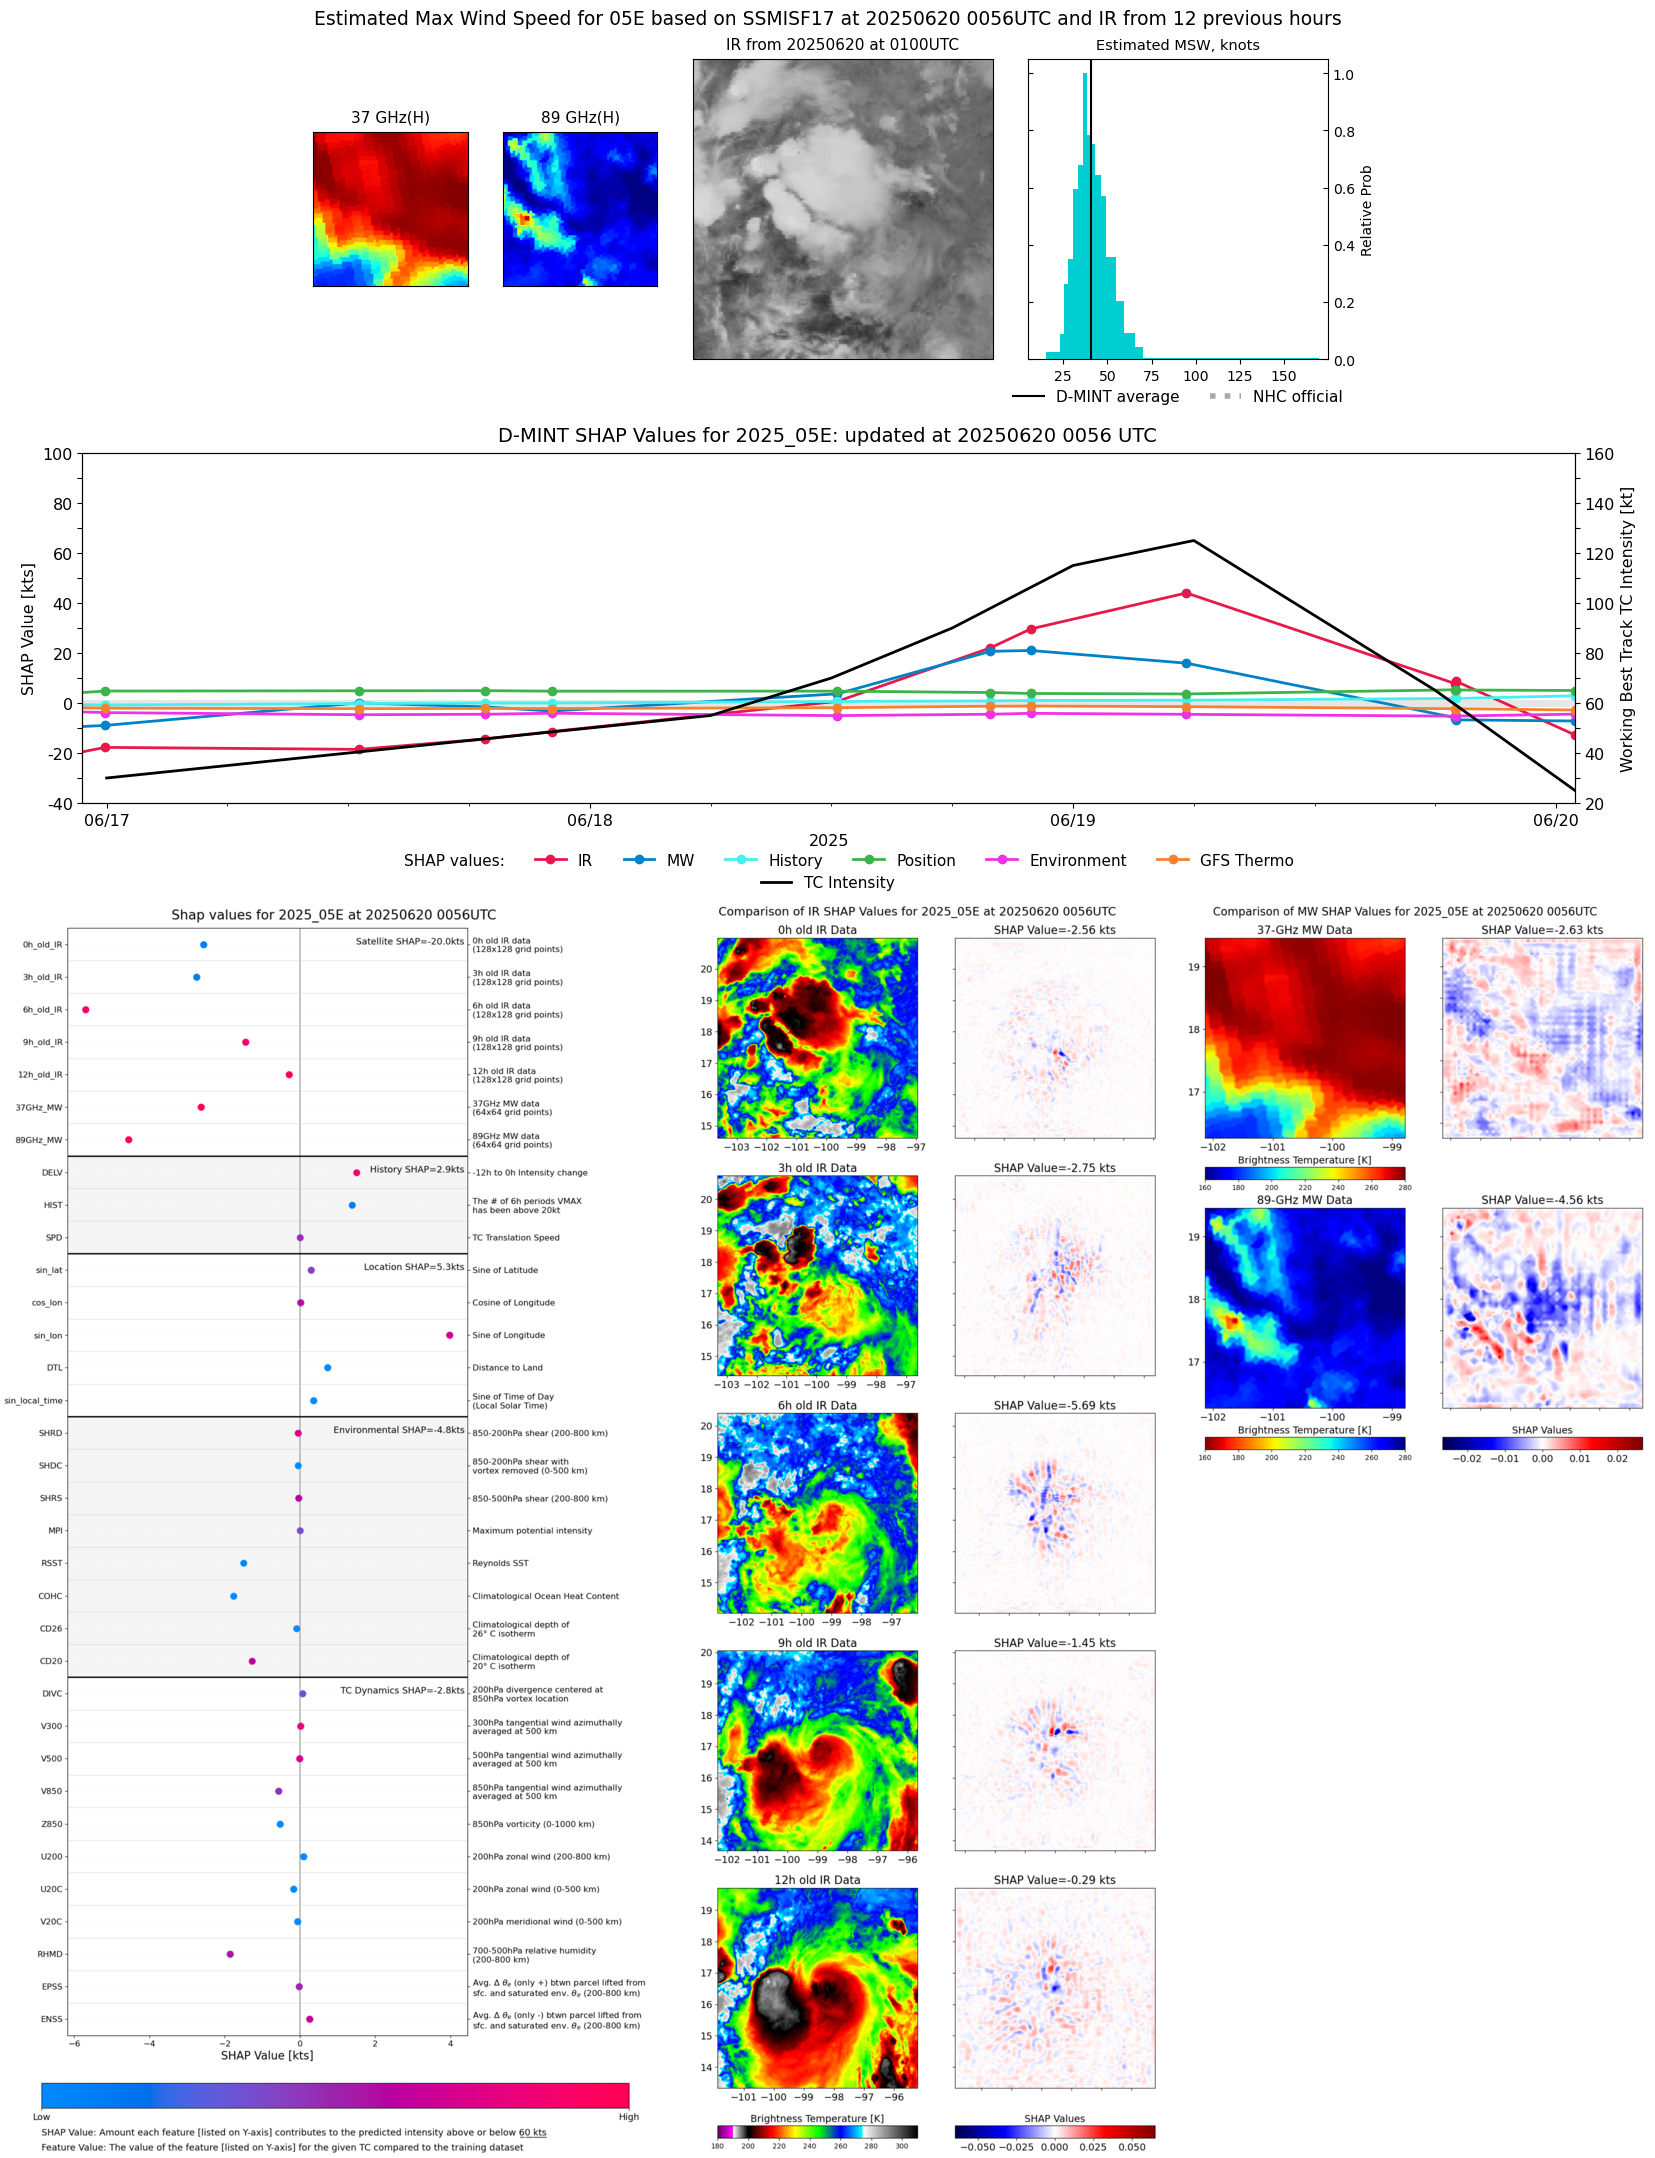 |
| 20250620 | 0055 UTC | SSMISF16 | 1000 hPa | 40 kts | 34 kts | 46 kts |  |
| 20250619 | 1902 UTC | GMI | 992 hPa | 62 kts | 54 kts | 70 kts | 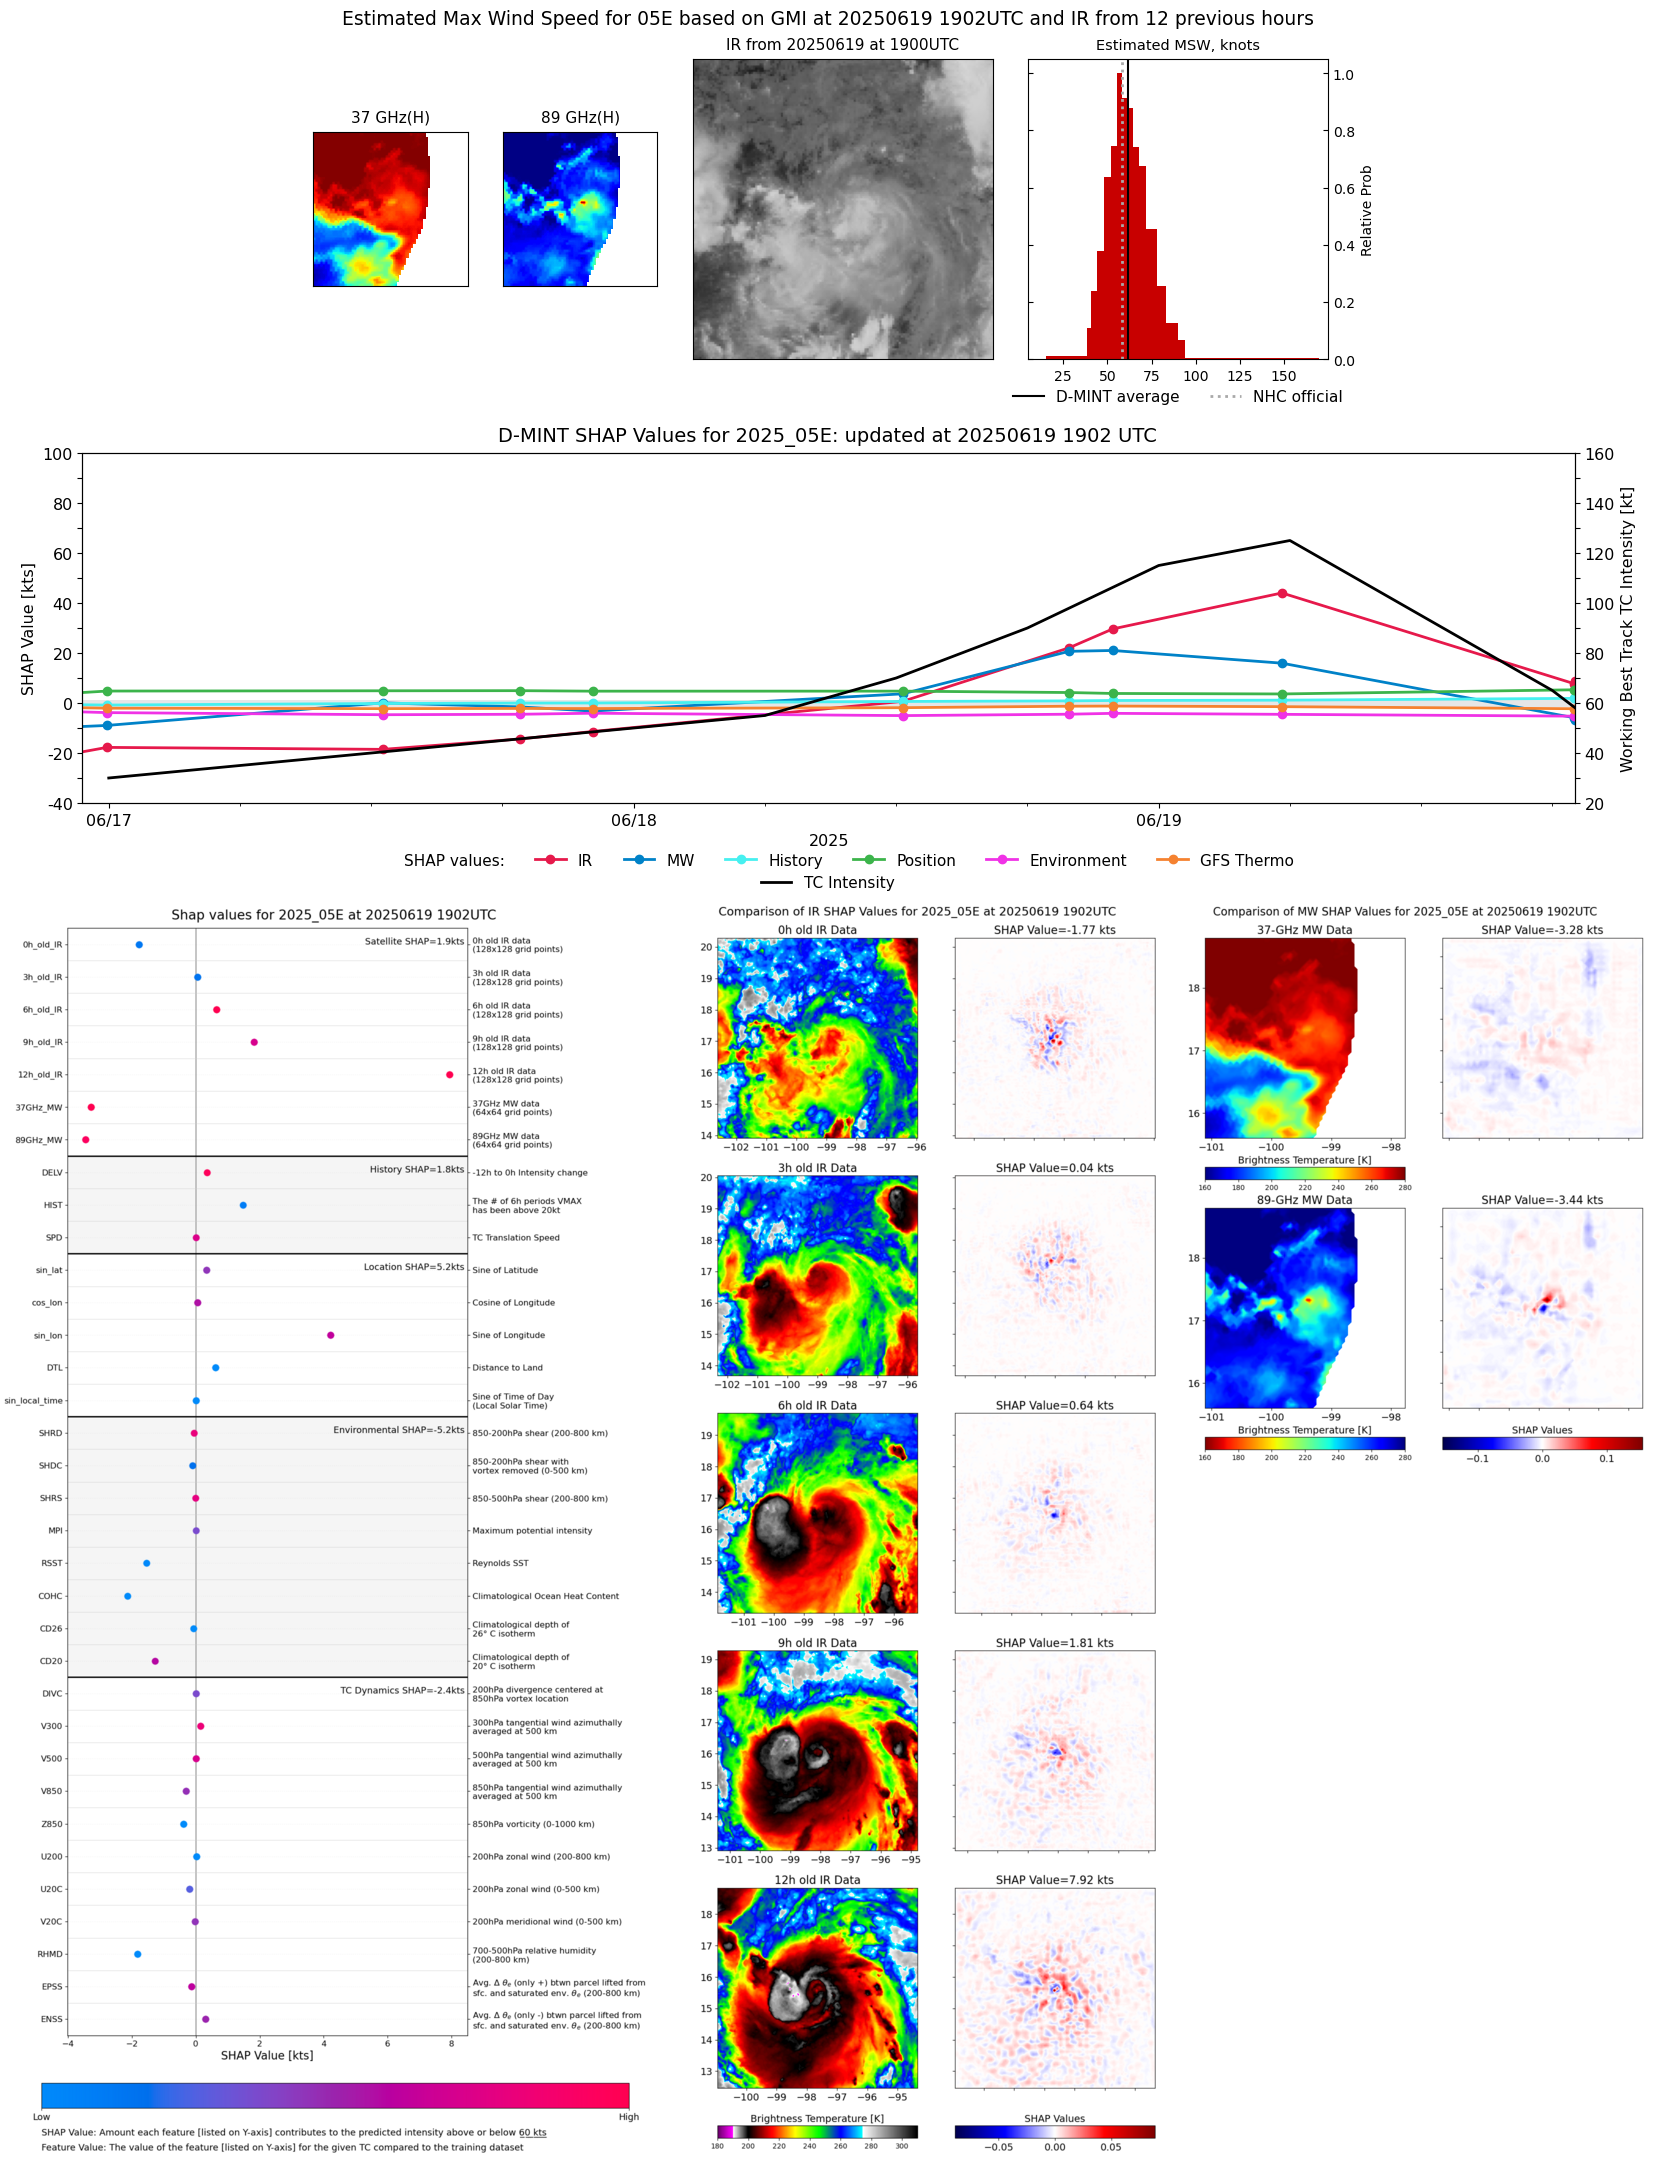 |
| 20250619 | 1858 UTC | GMI | 993 hPa | 62 kts | 54 kts | 70 kts | 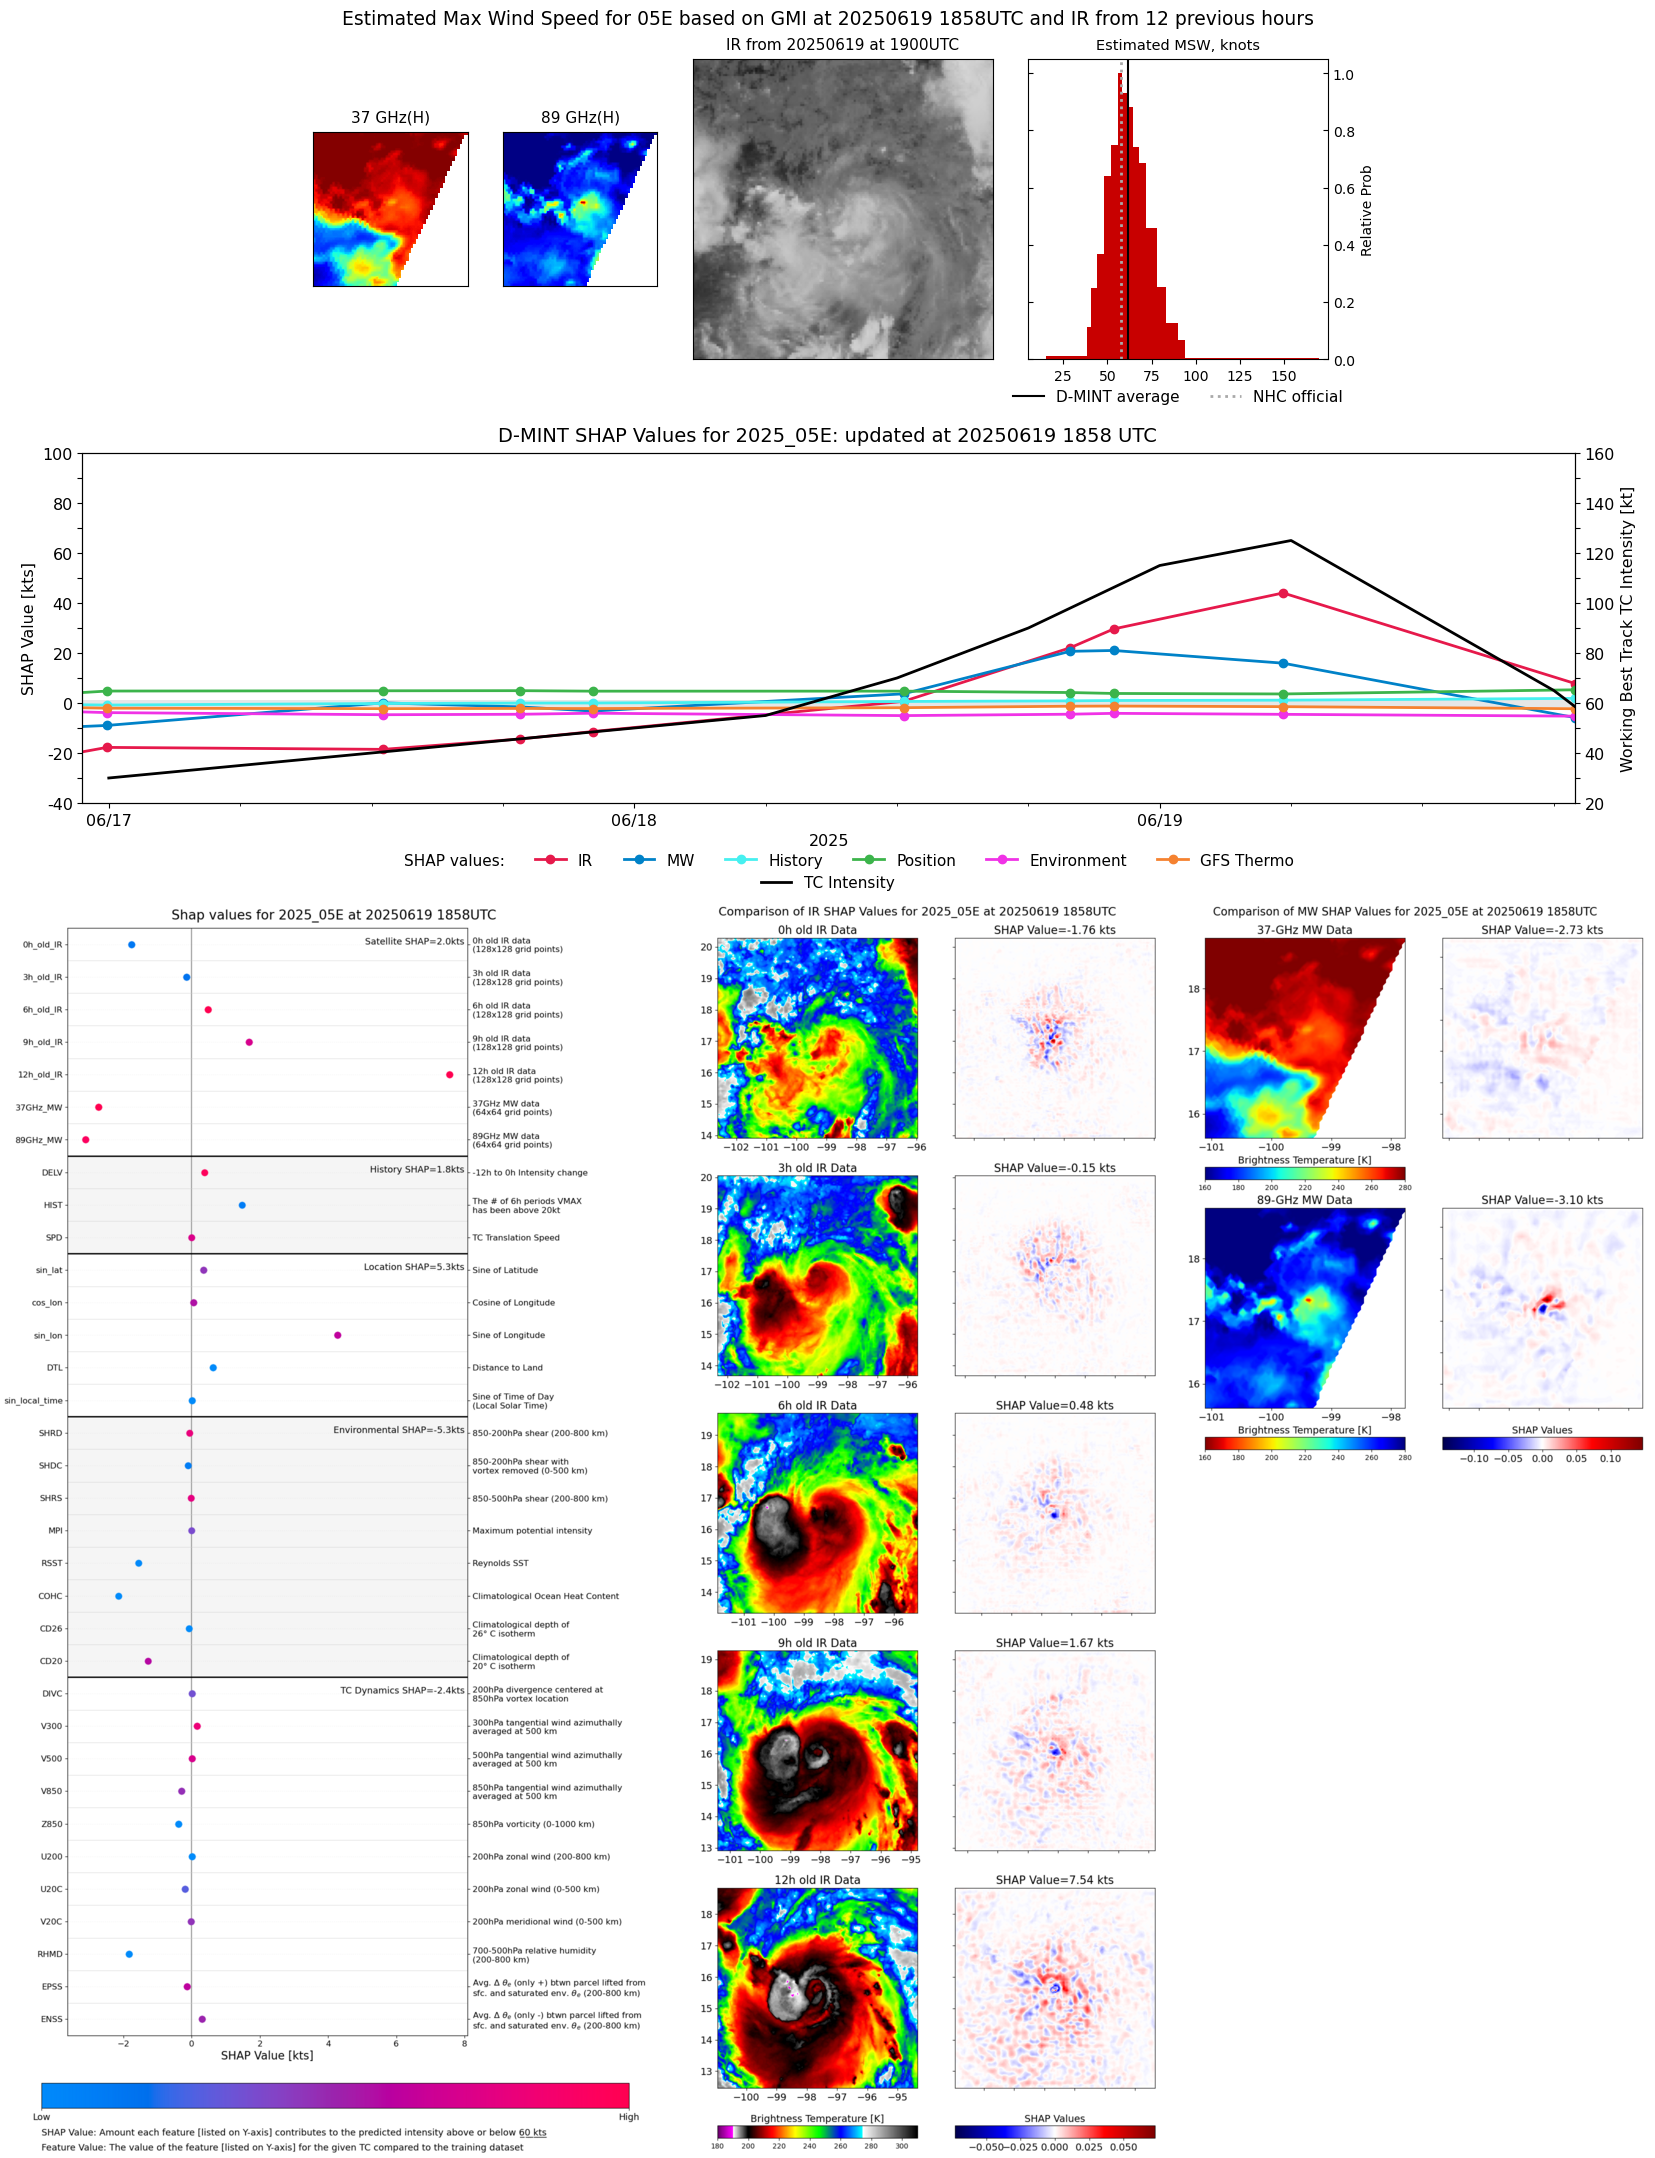 |
| 20250619 | 1343 UTC | SSMISF16 | 974 hPa | 92 kts | 84 kts | 99 kts | 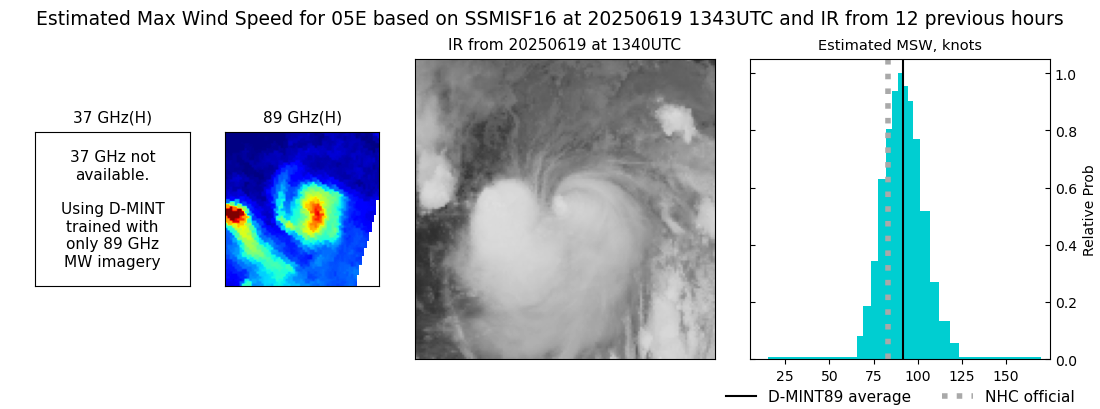 |
| 20250619 | 1202 UTC | TROPICS05 | 967 hPa | 97 kts | 91 kts | 103 kts | 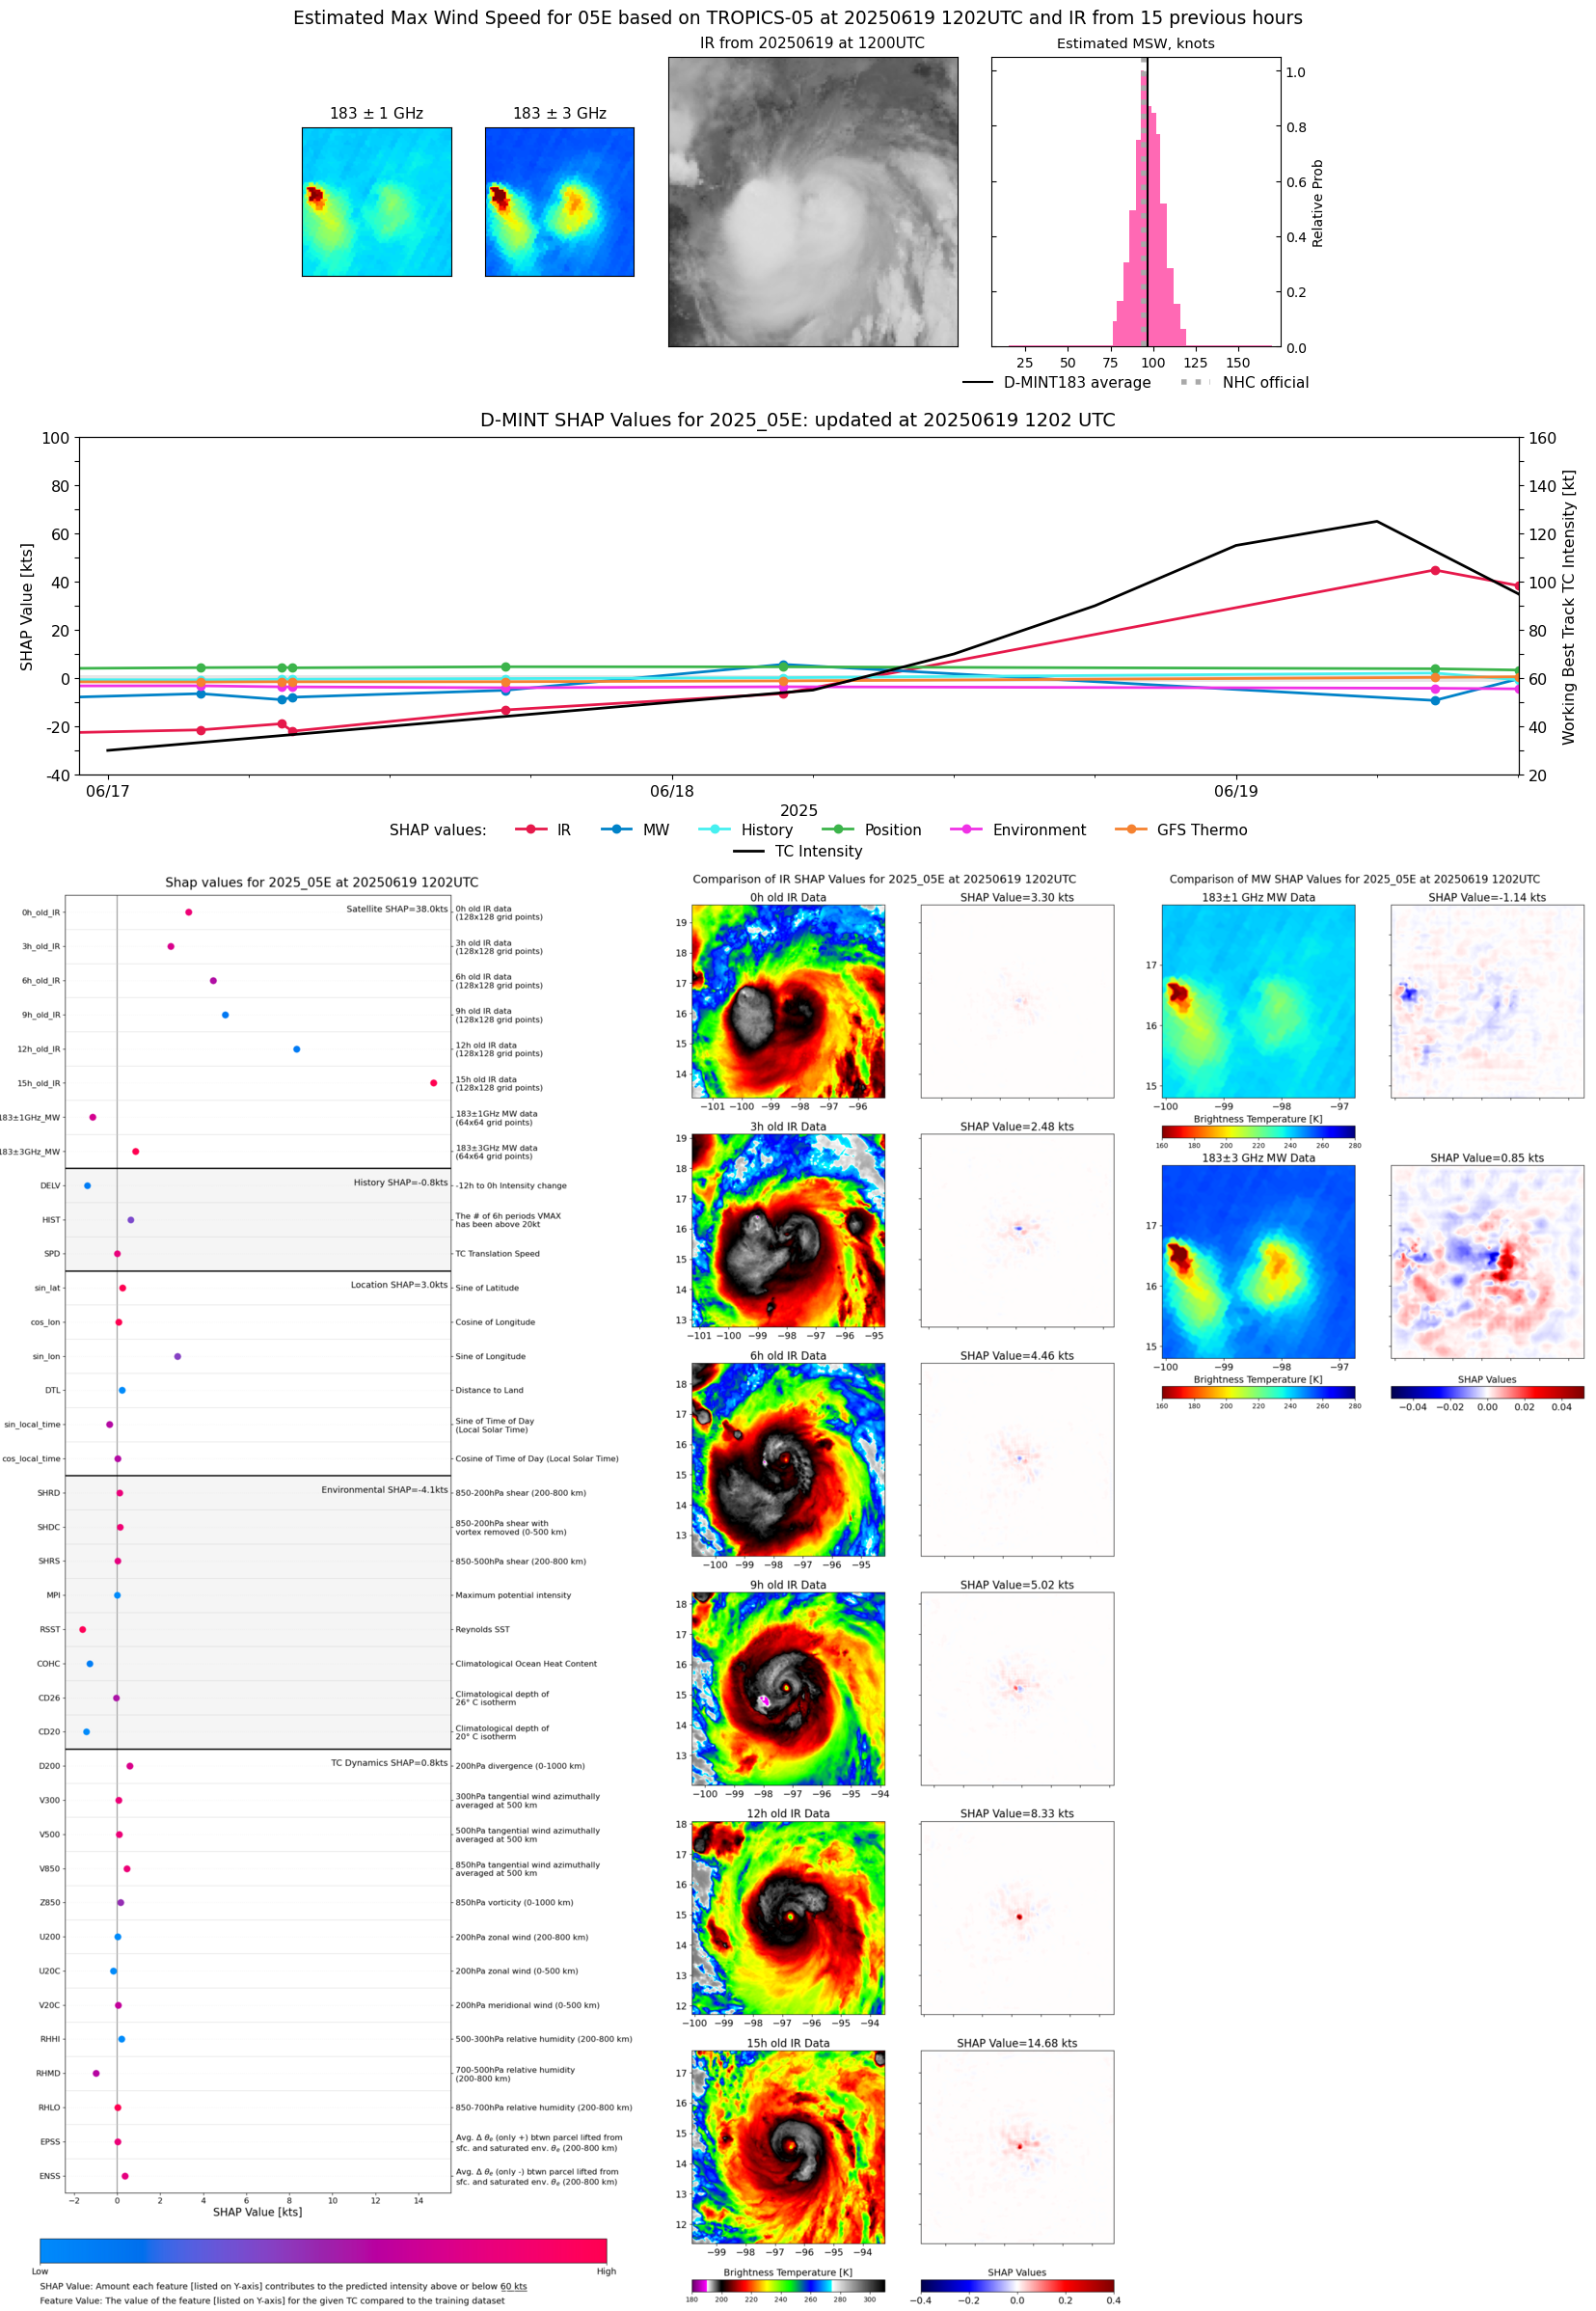 |
| 20250619 | 0827 UTC | ATMS-N20 | 965 hPa | 0 kts | 0 kts | 0 kts | 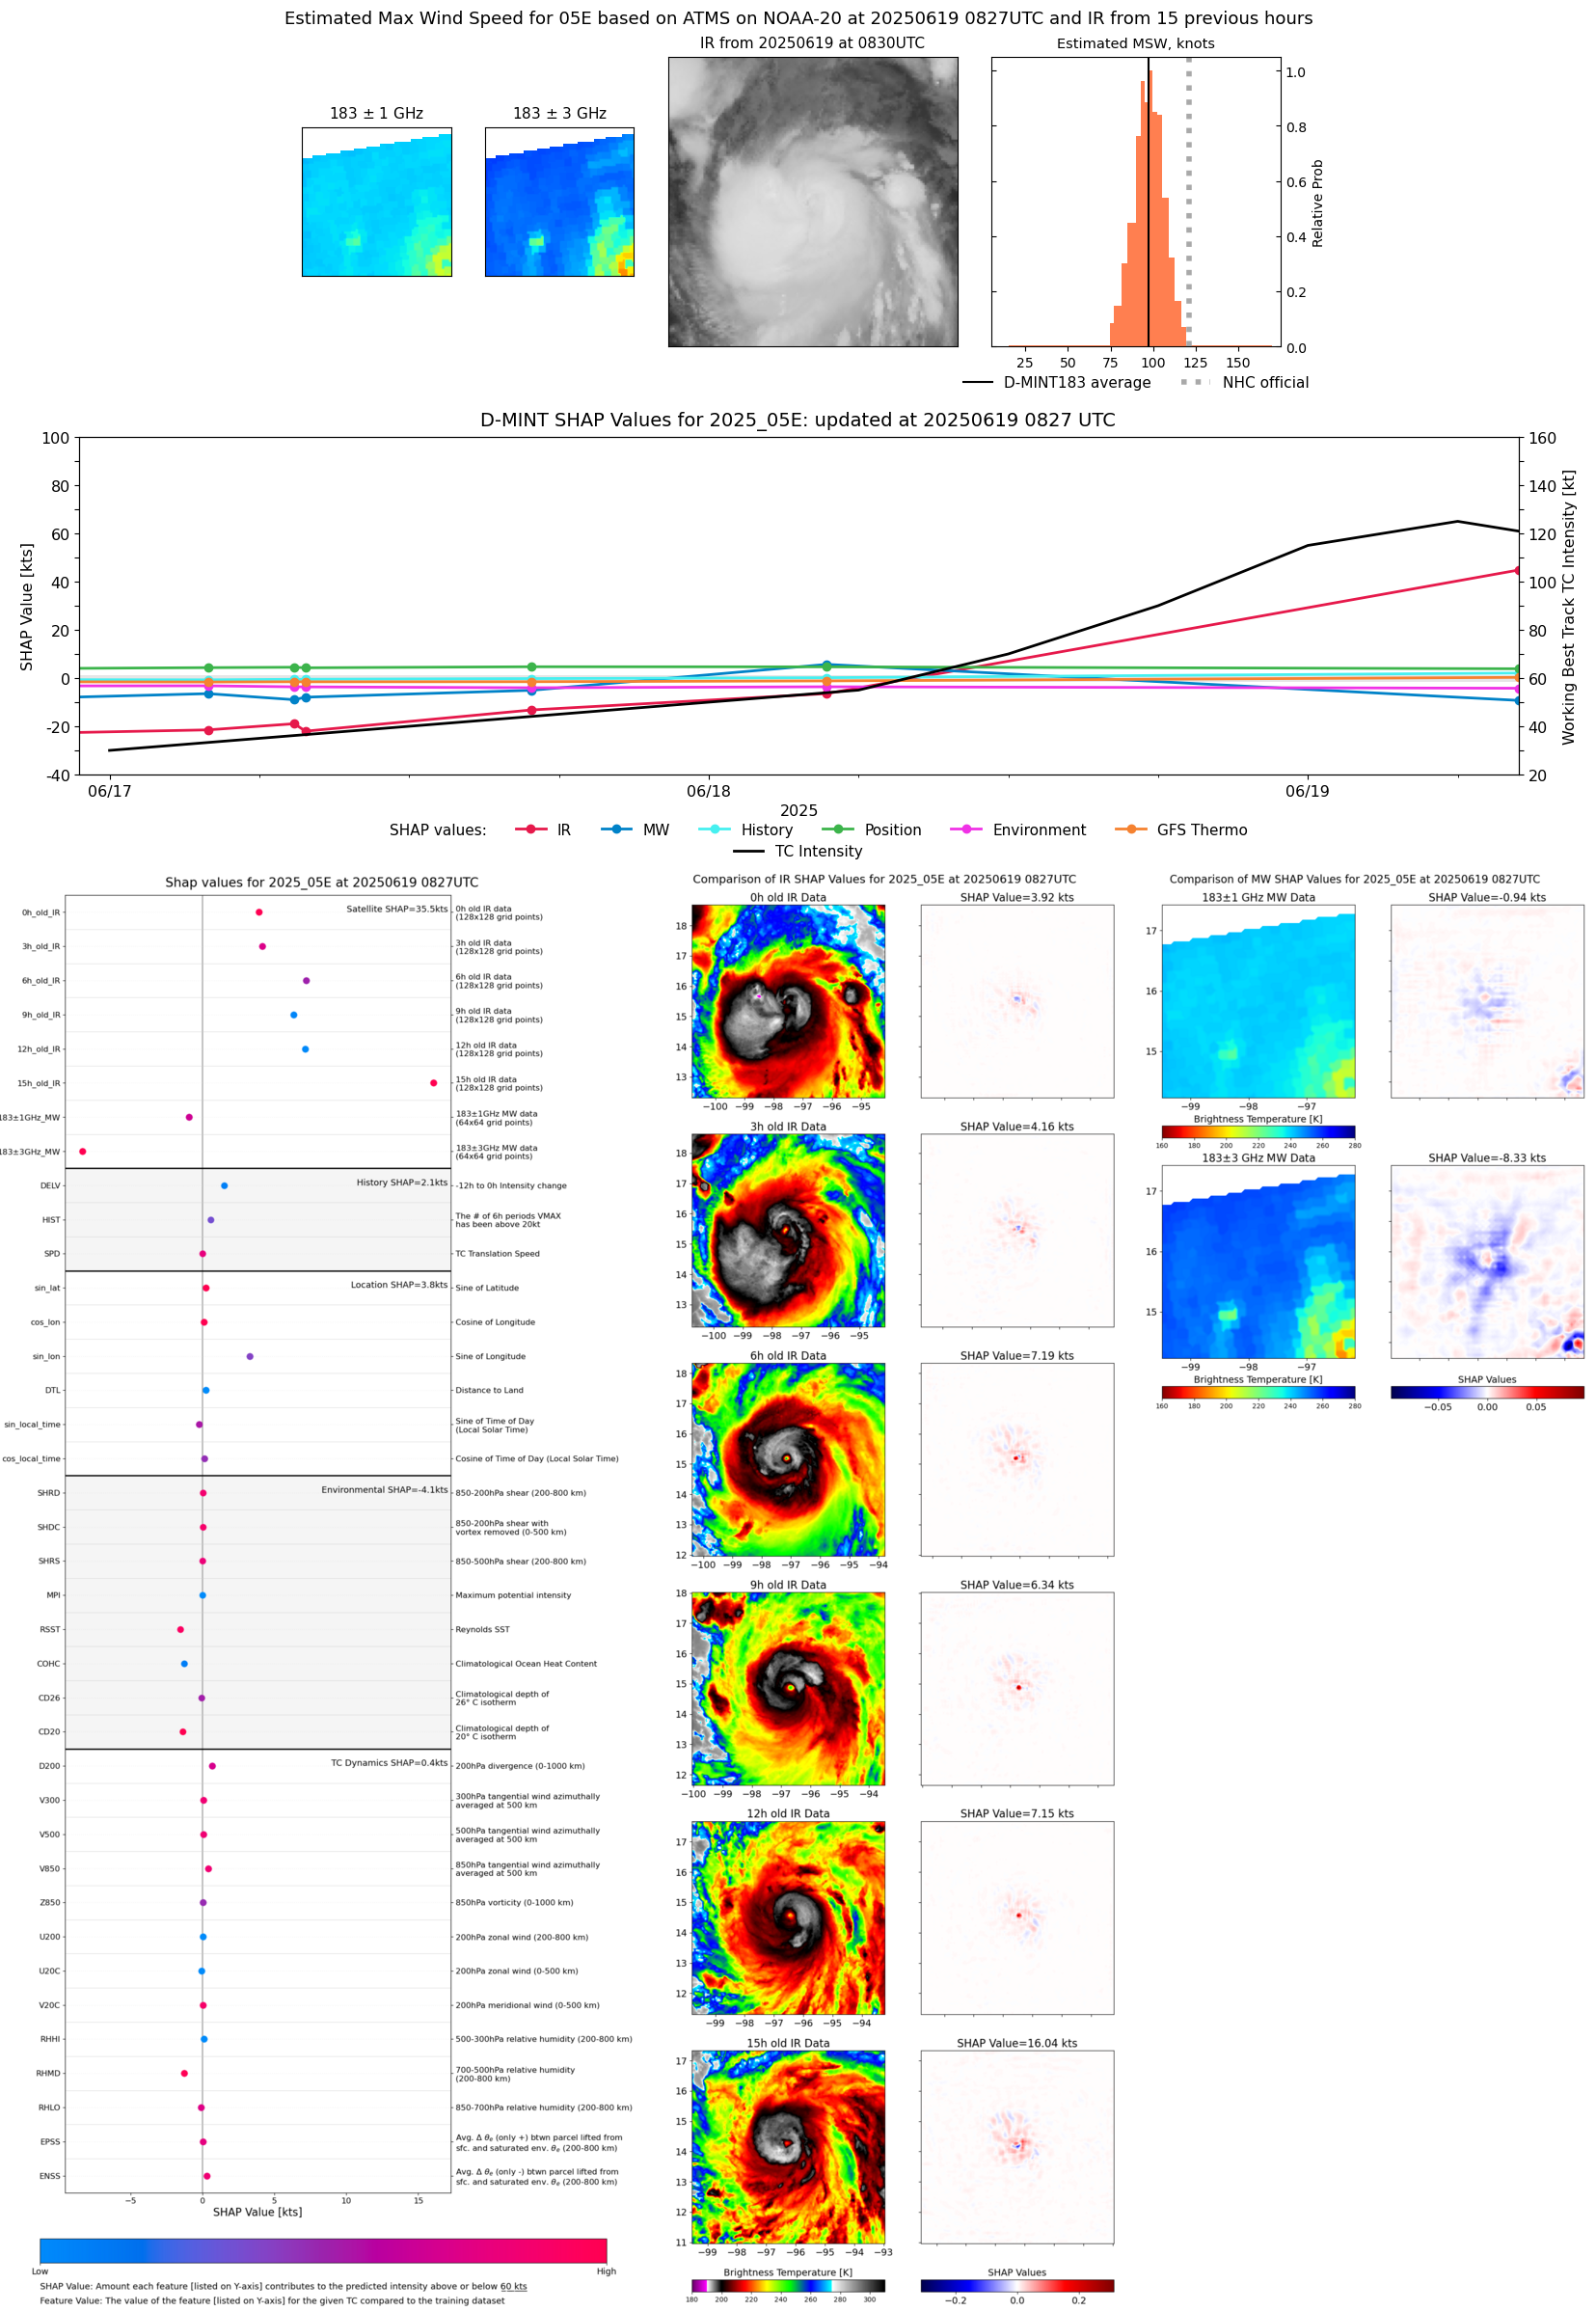 |
| 20250619 | 0807 UTC | AMSR2 | 951 hPa | 108 kts | 102 kts | 114 kts | 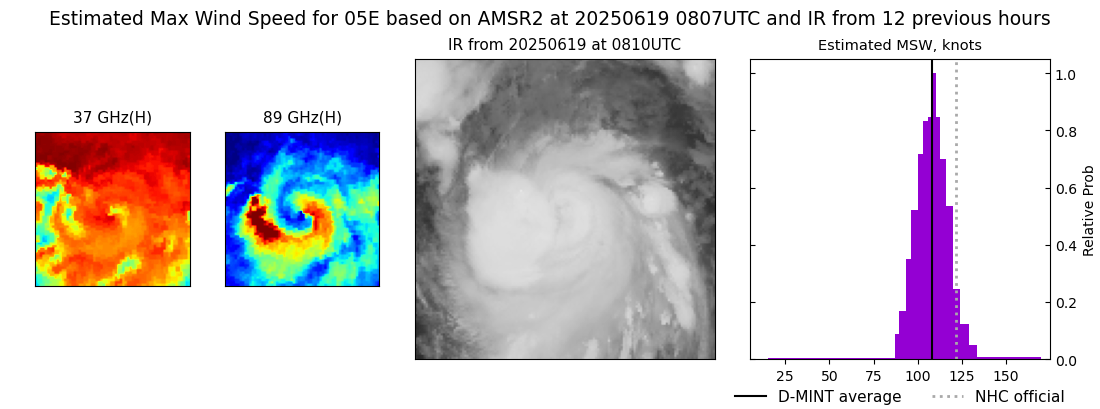 |
| 20250619 | 0538 UTC | GMI | 943 hPa | 119 kts | 112 kts | 125 kts | 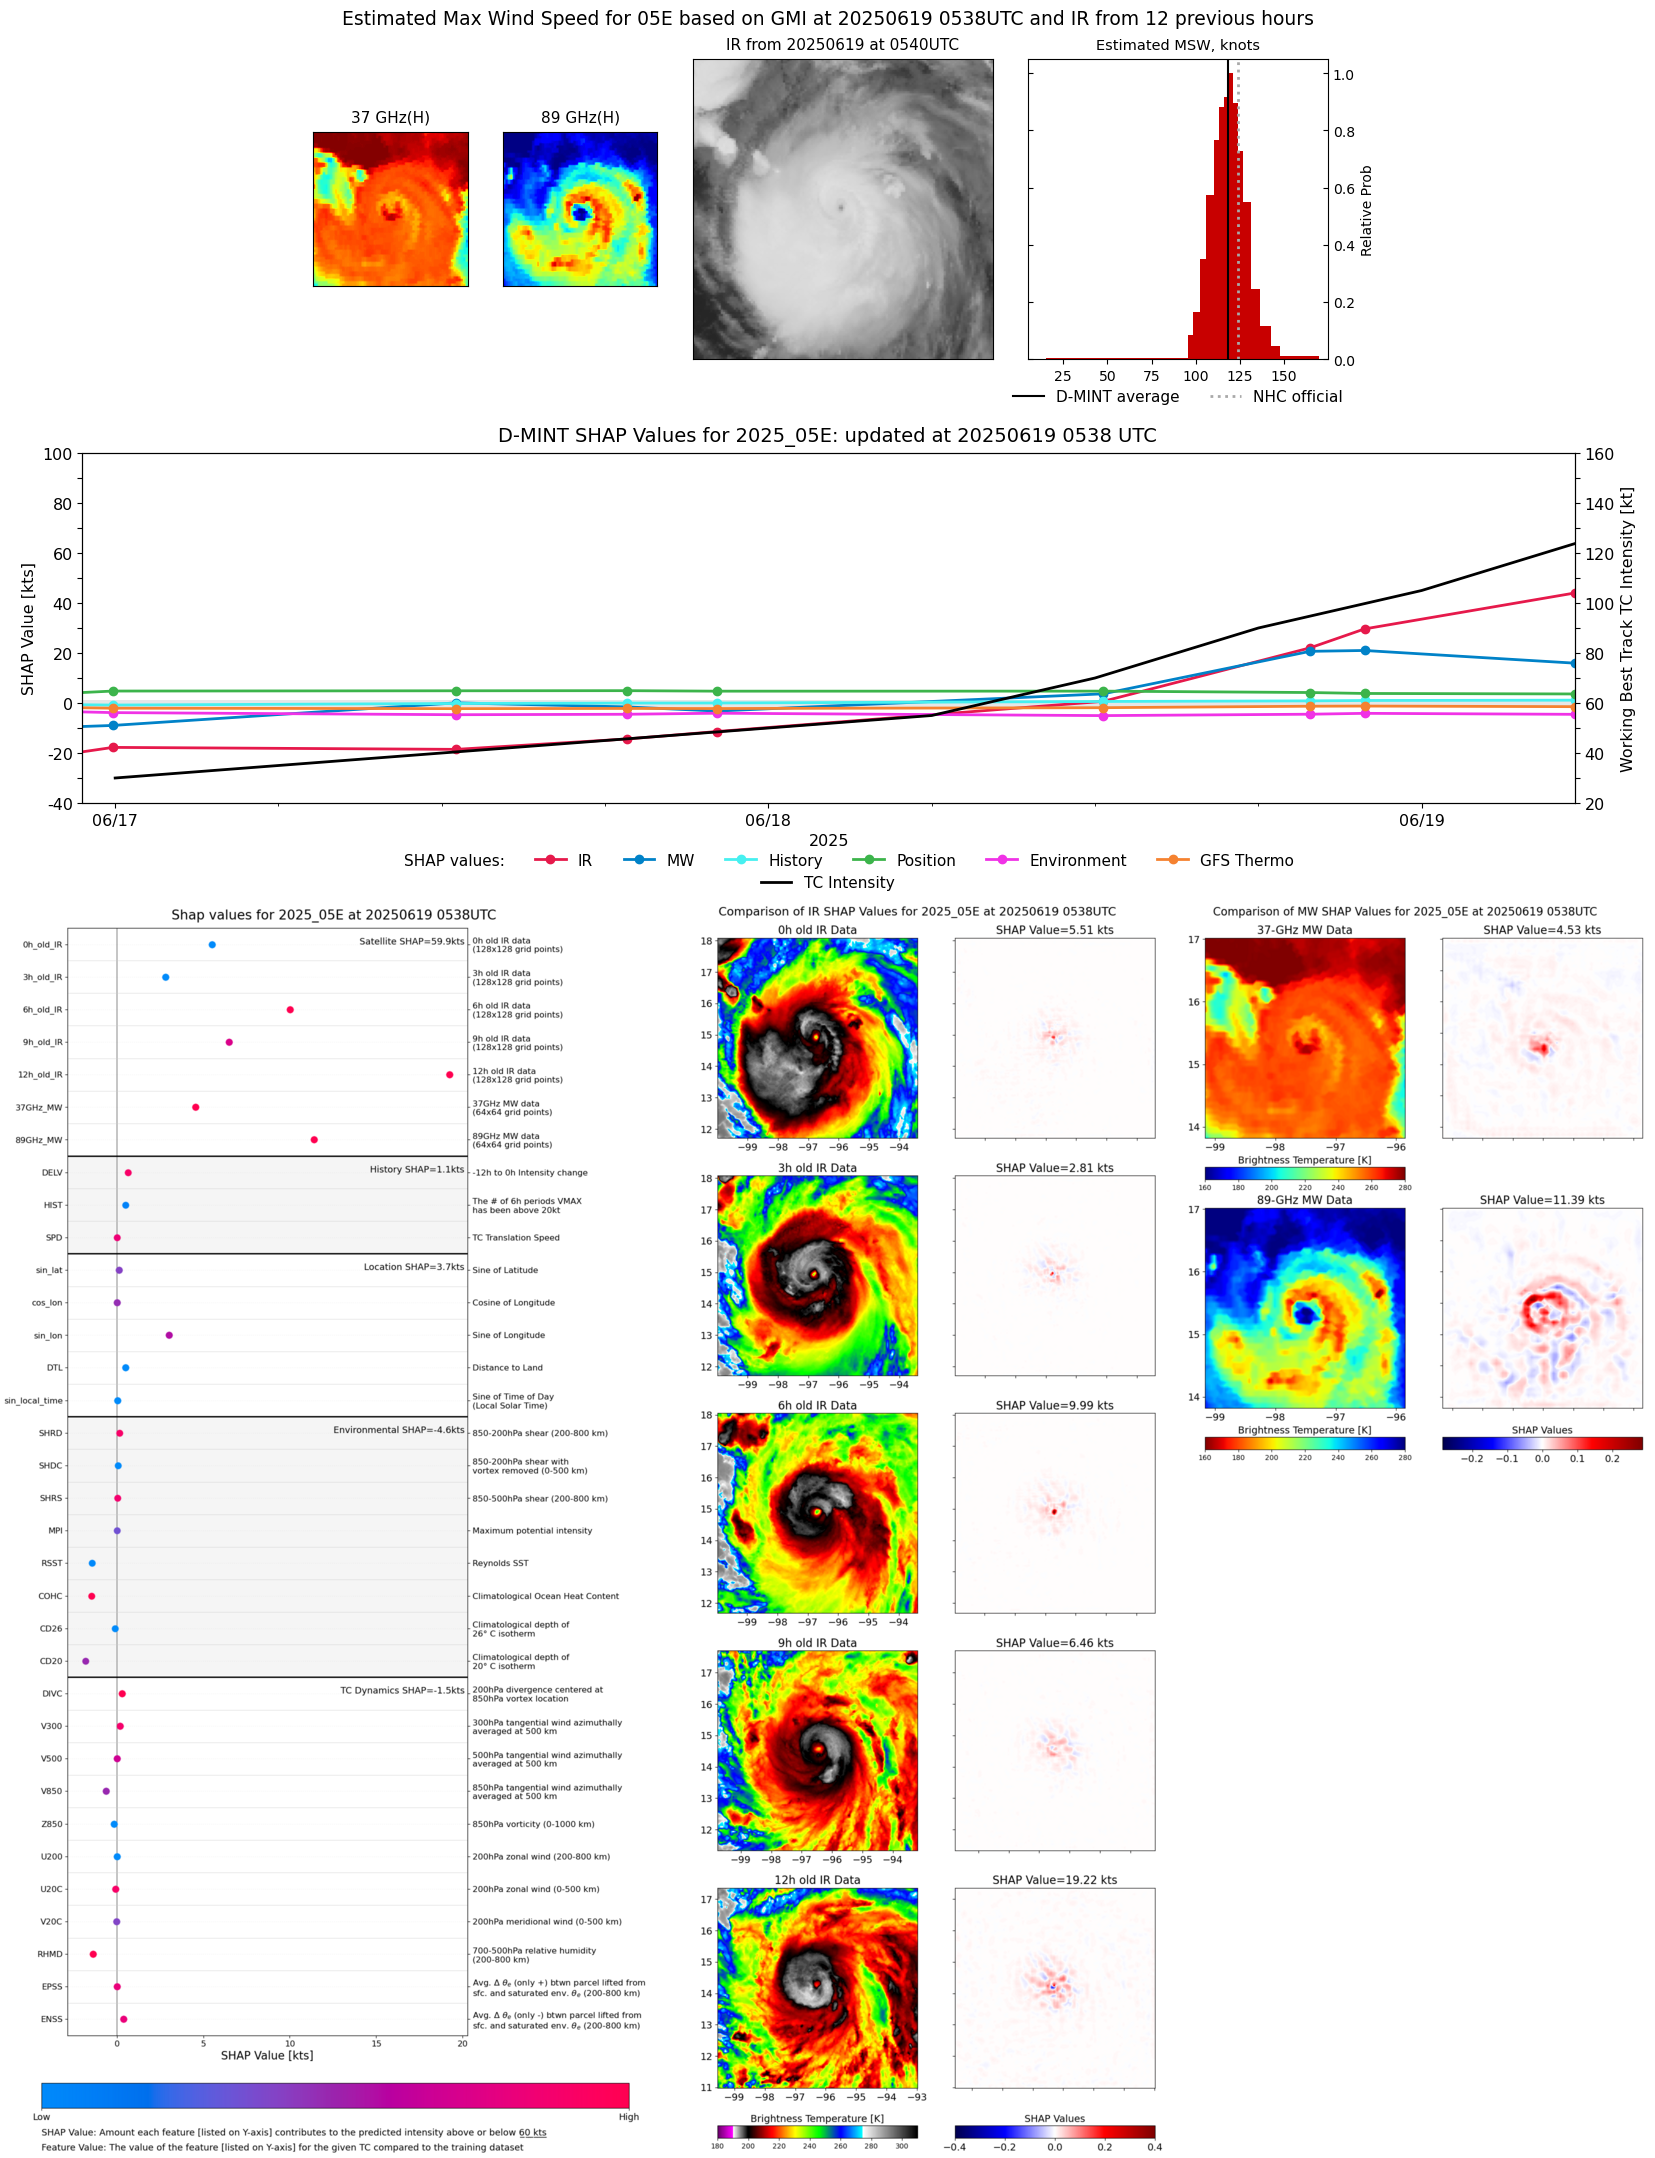 |
| 20250619 | 0349 UTC | TROPICS05 | 950 hPa | 114 kts | 106 kts | 121 kts | 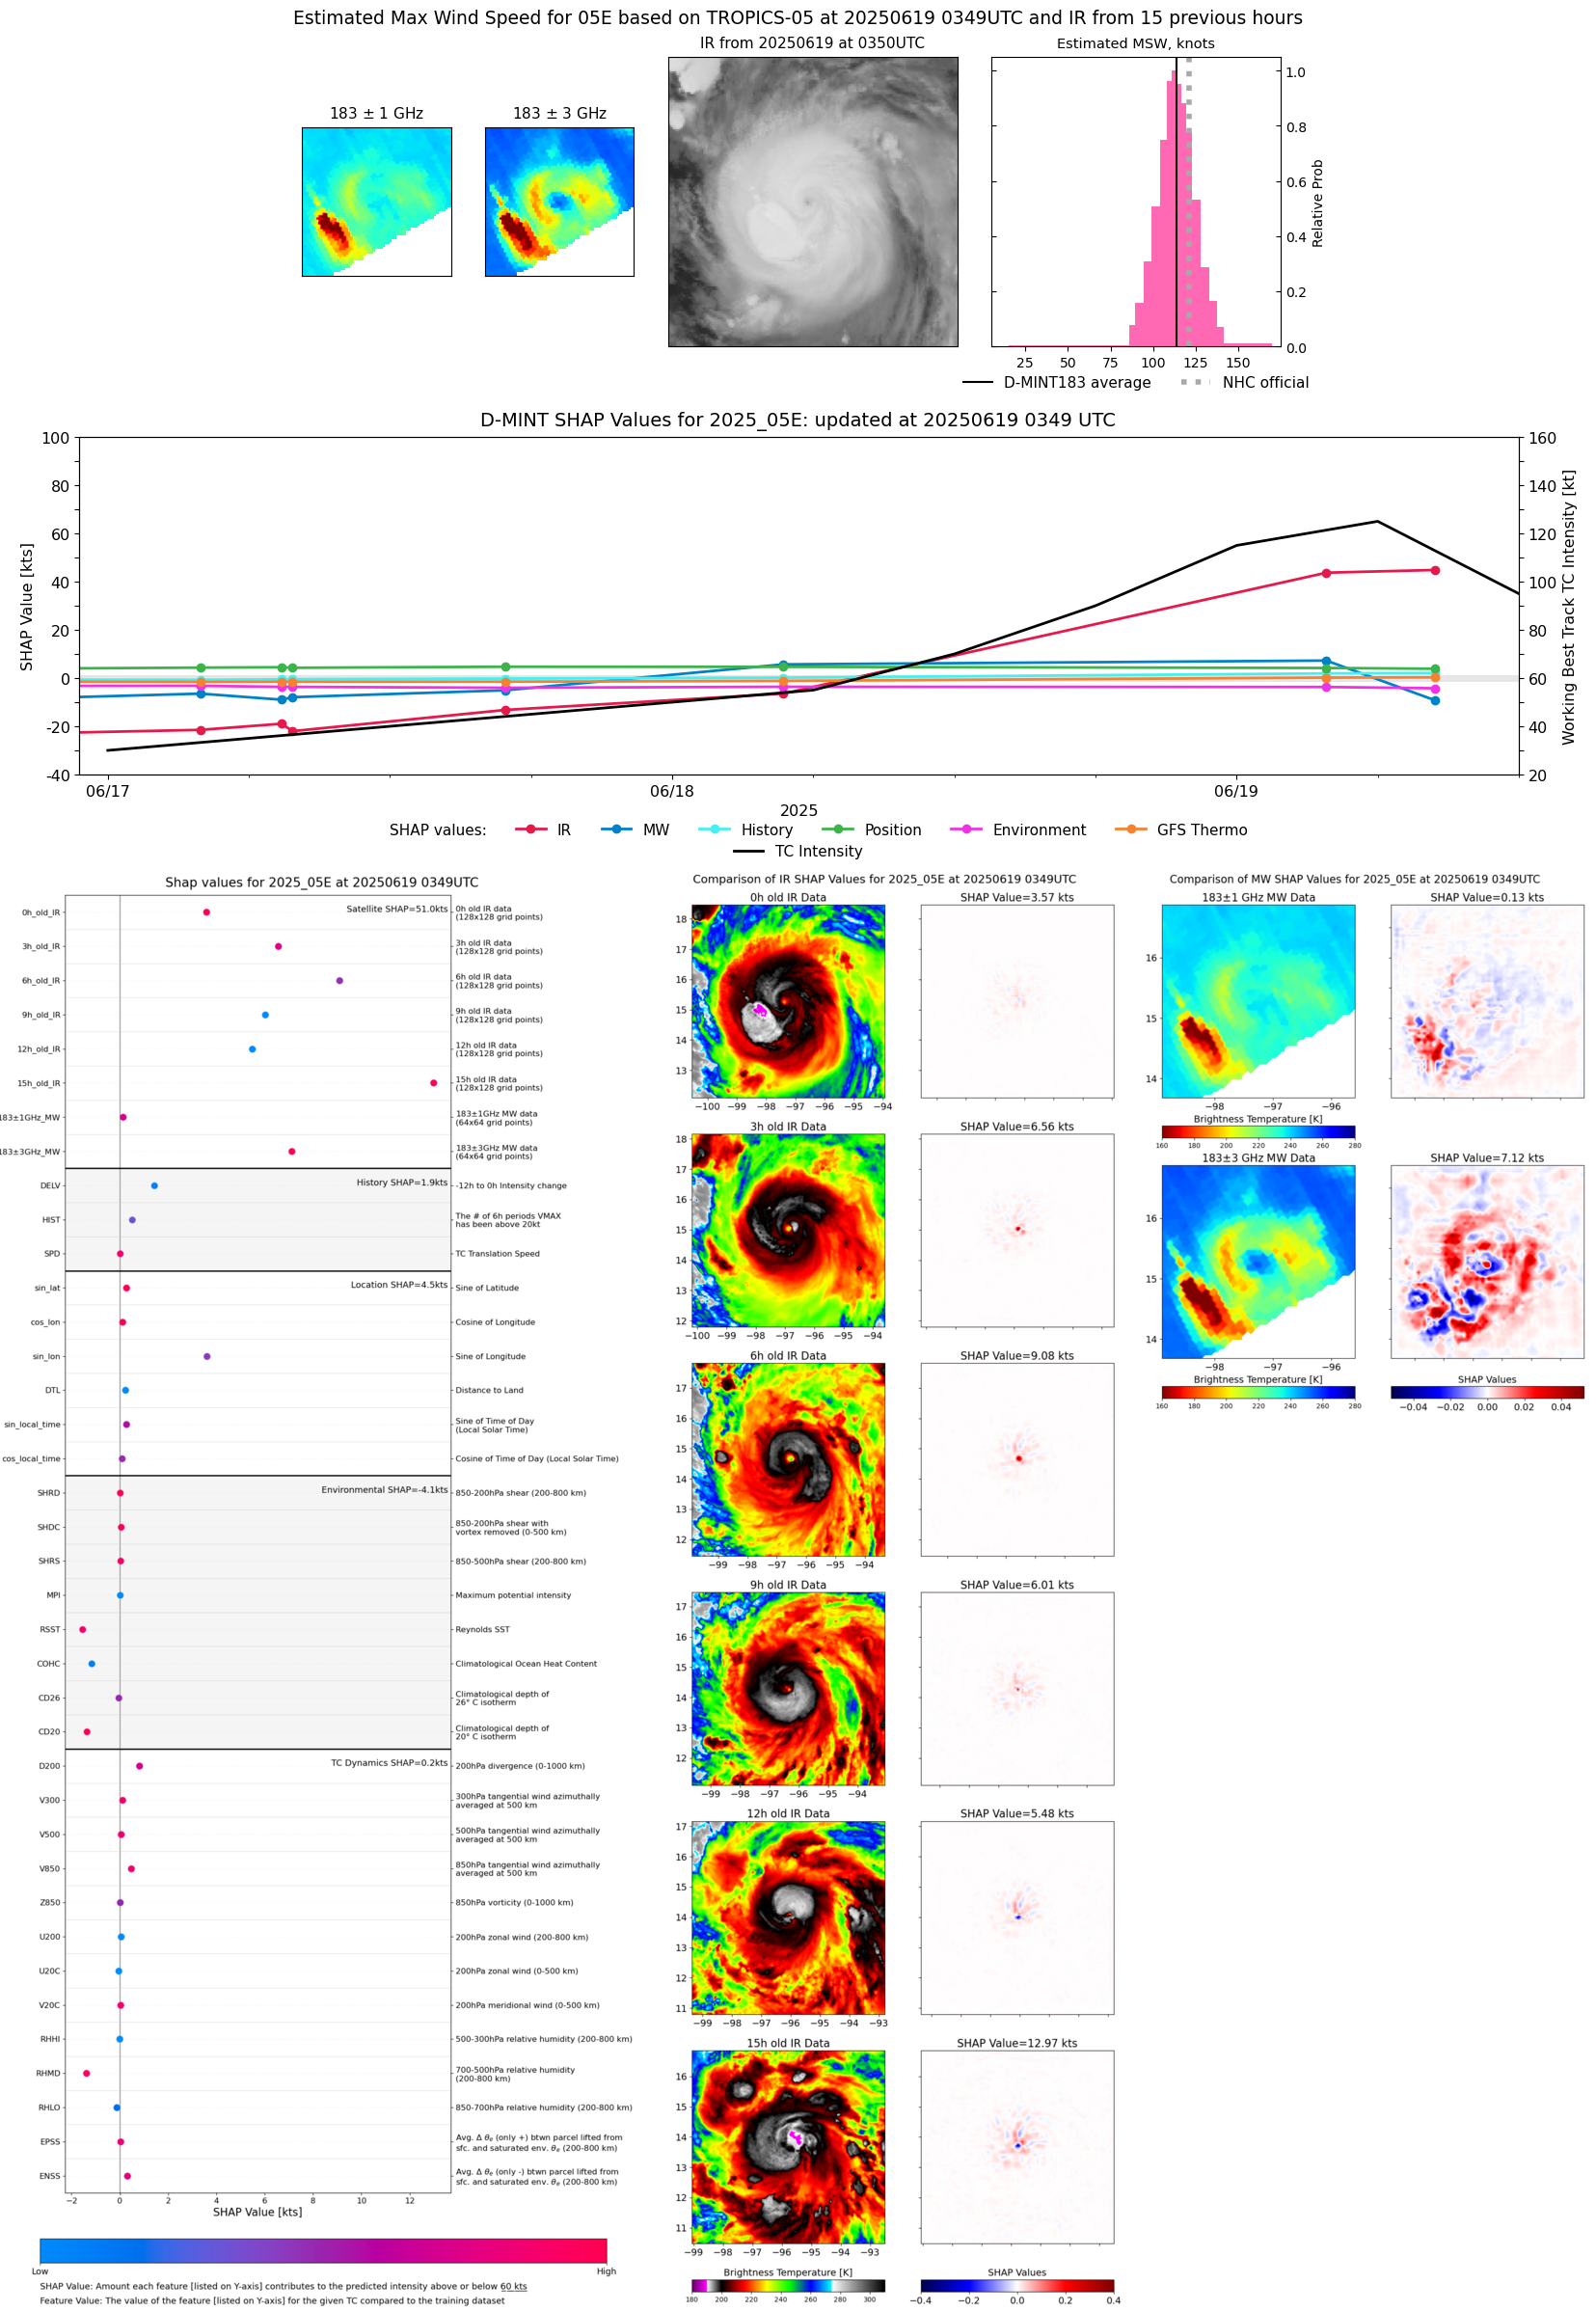 |
| 20250619 | 0109 UTC | SSMISF16 | 945 hPa | 111 kts | 103 kts | 119 kts |  |
| 20250618 | 2154 UTC | SSMISF18 | 954 hPa | 110 kts | 102 kts | 118 kts | 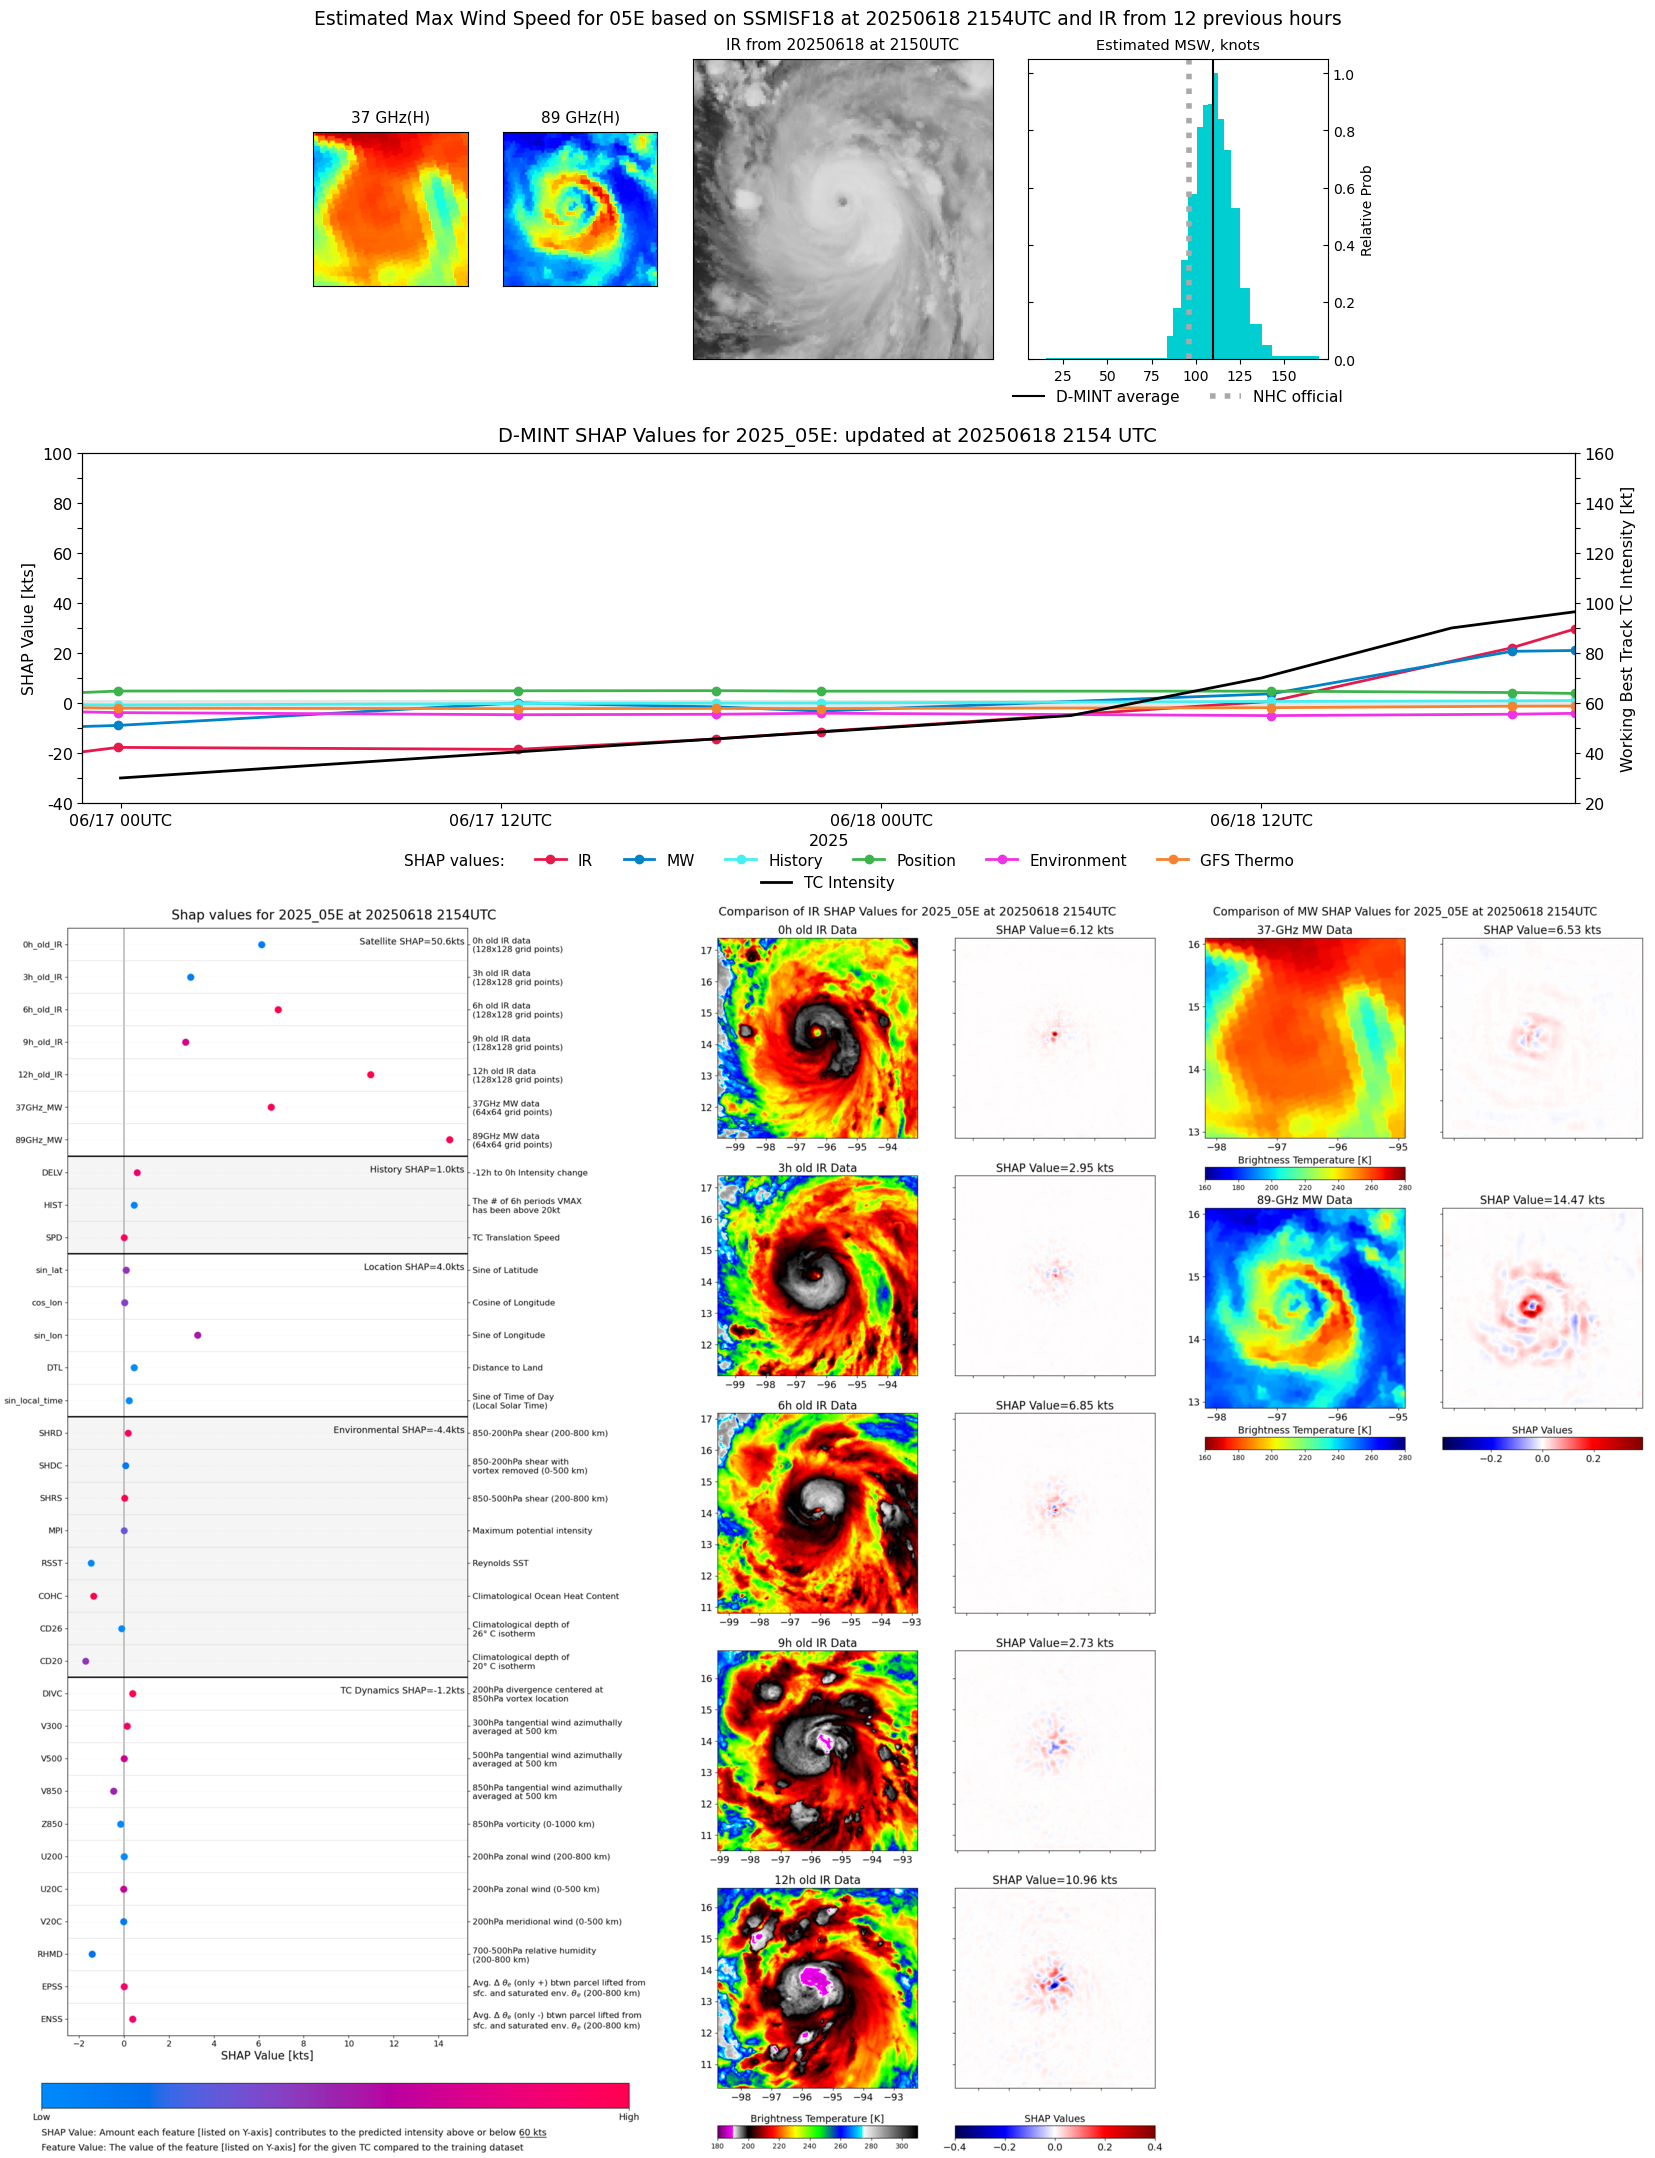 |
| 20250618 | 1954 UTC | AMSR2 | 961 hPa | 102 kts | 95 kts | 110 kts | 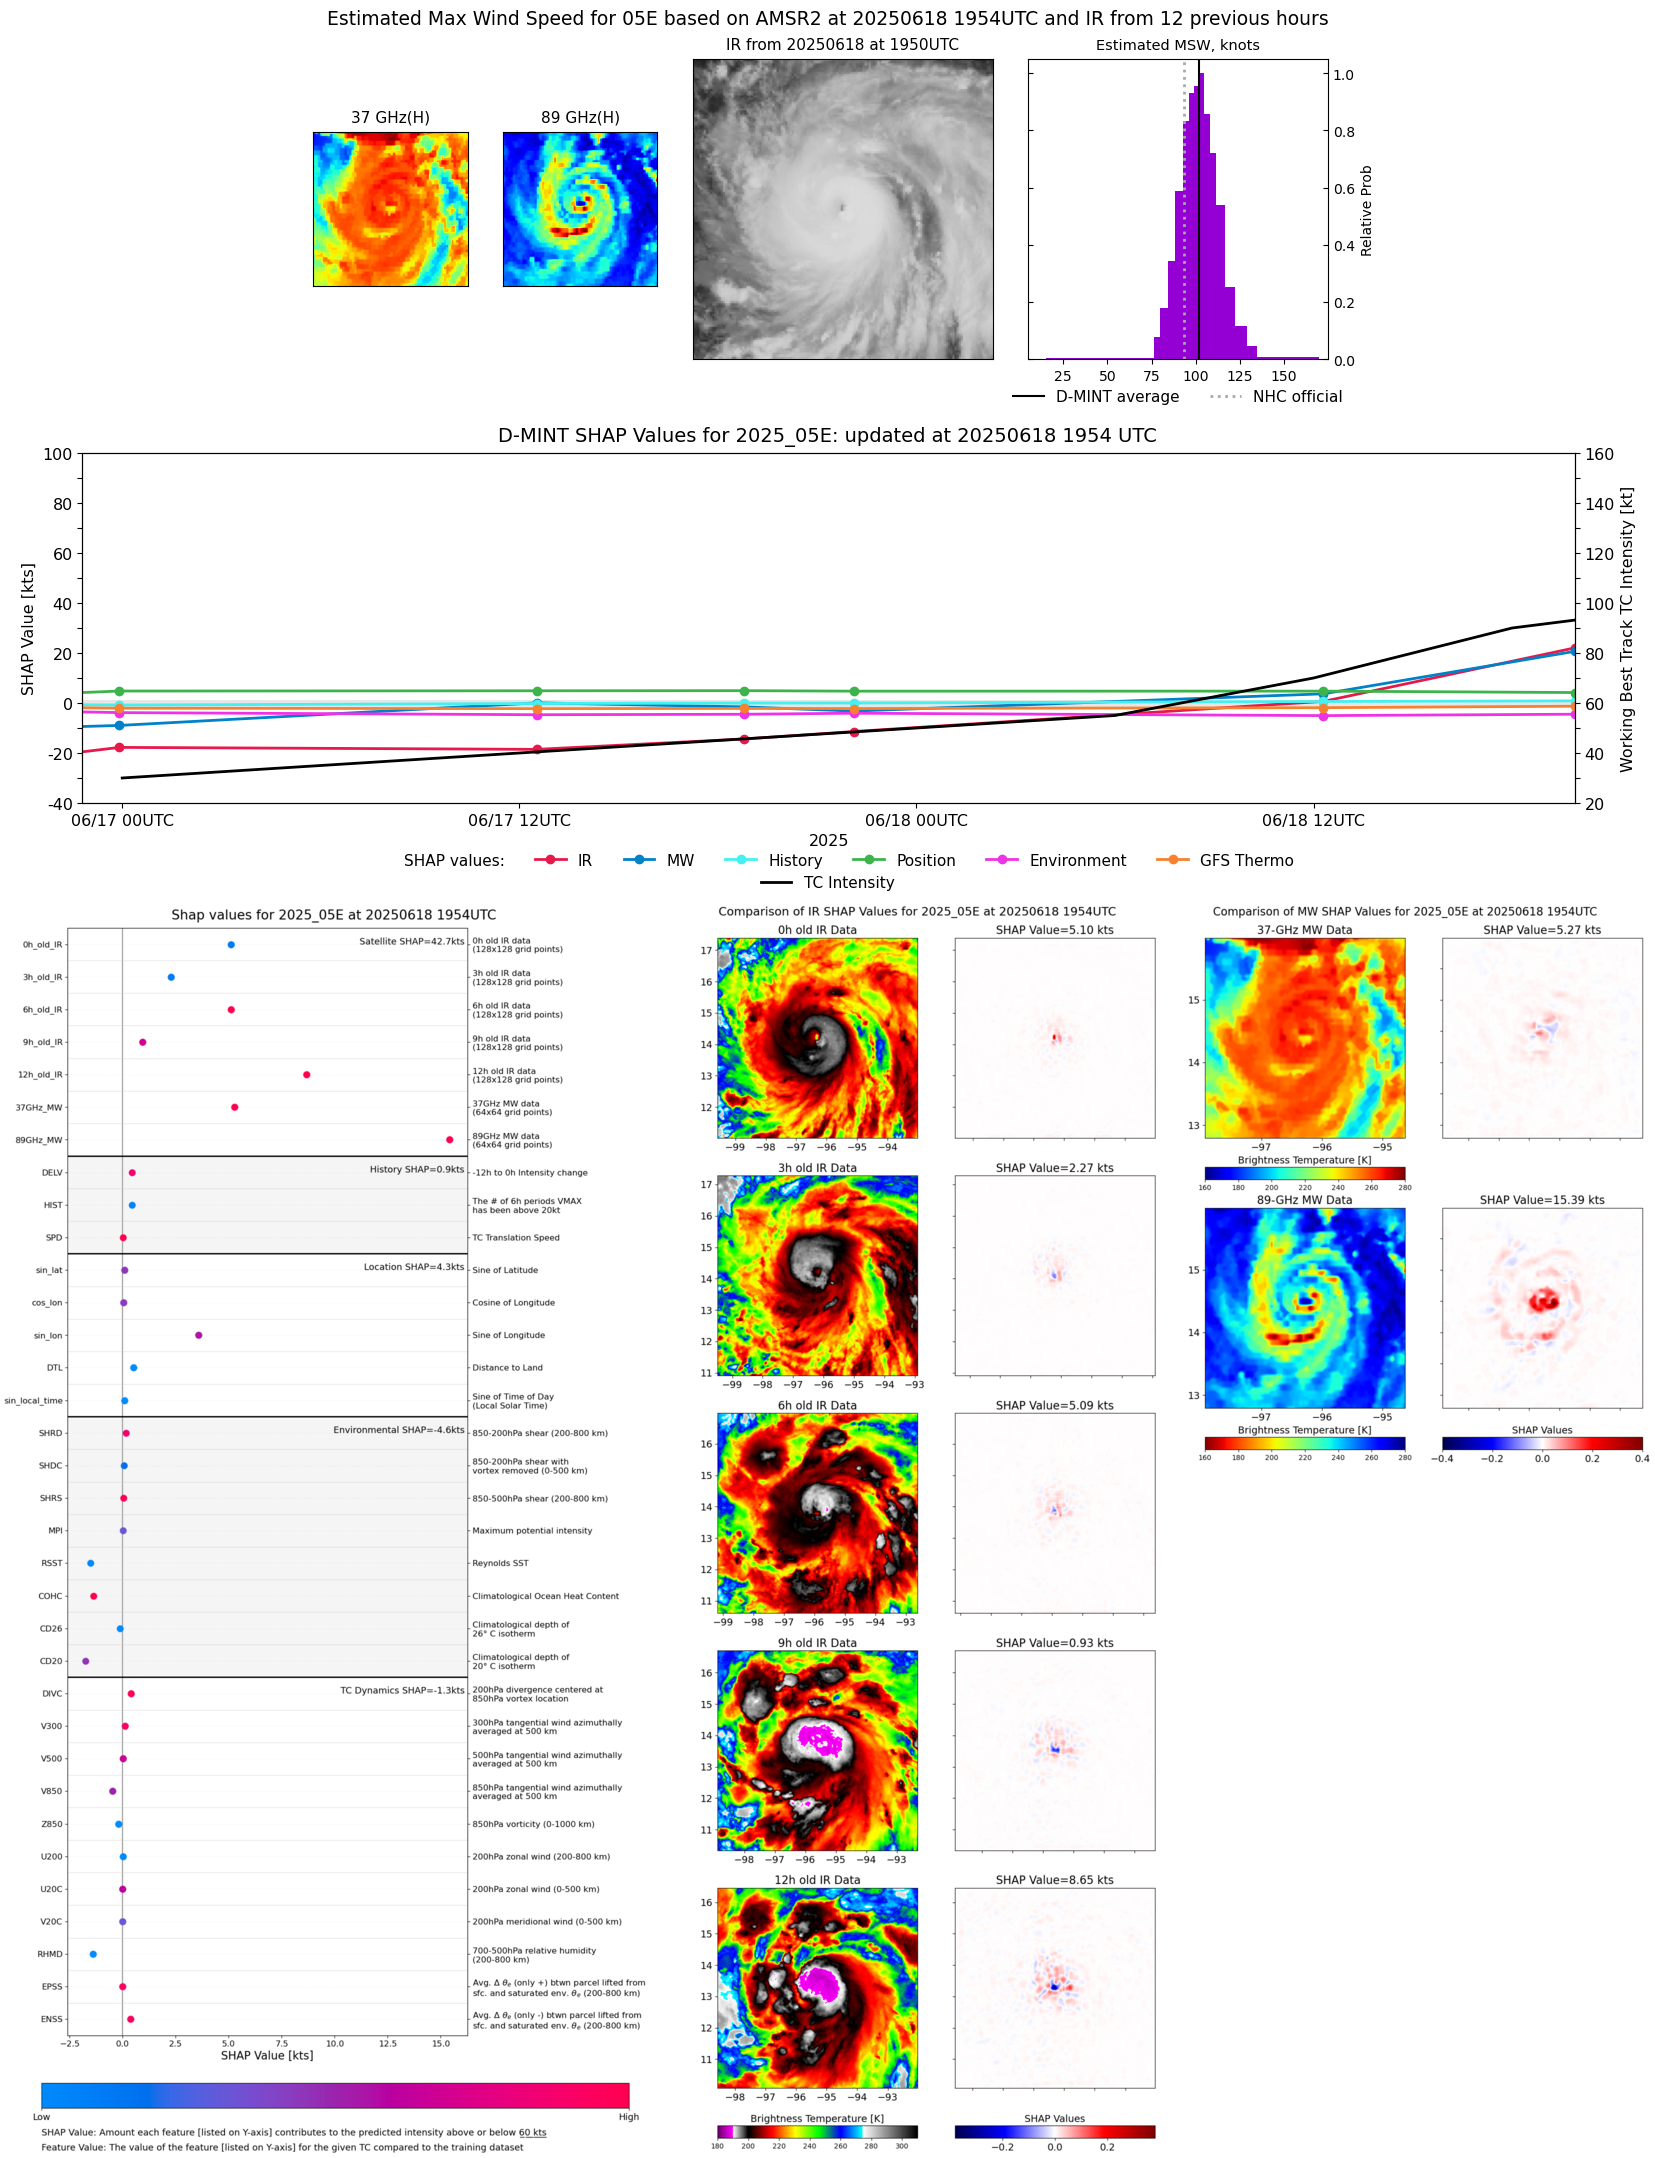 |
| 20250618 | 1218 UTC | SSMISF17 | 986 hPa | 63 kts | 57 kts | 69 kts | 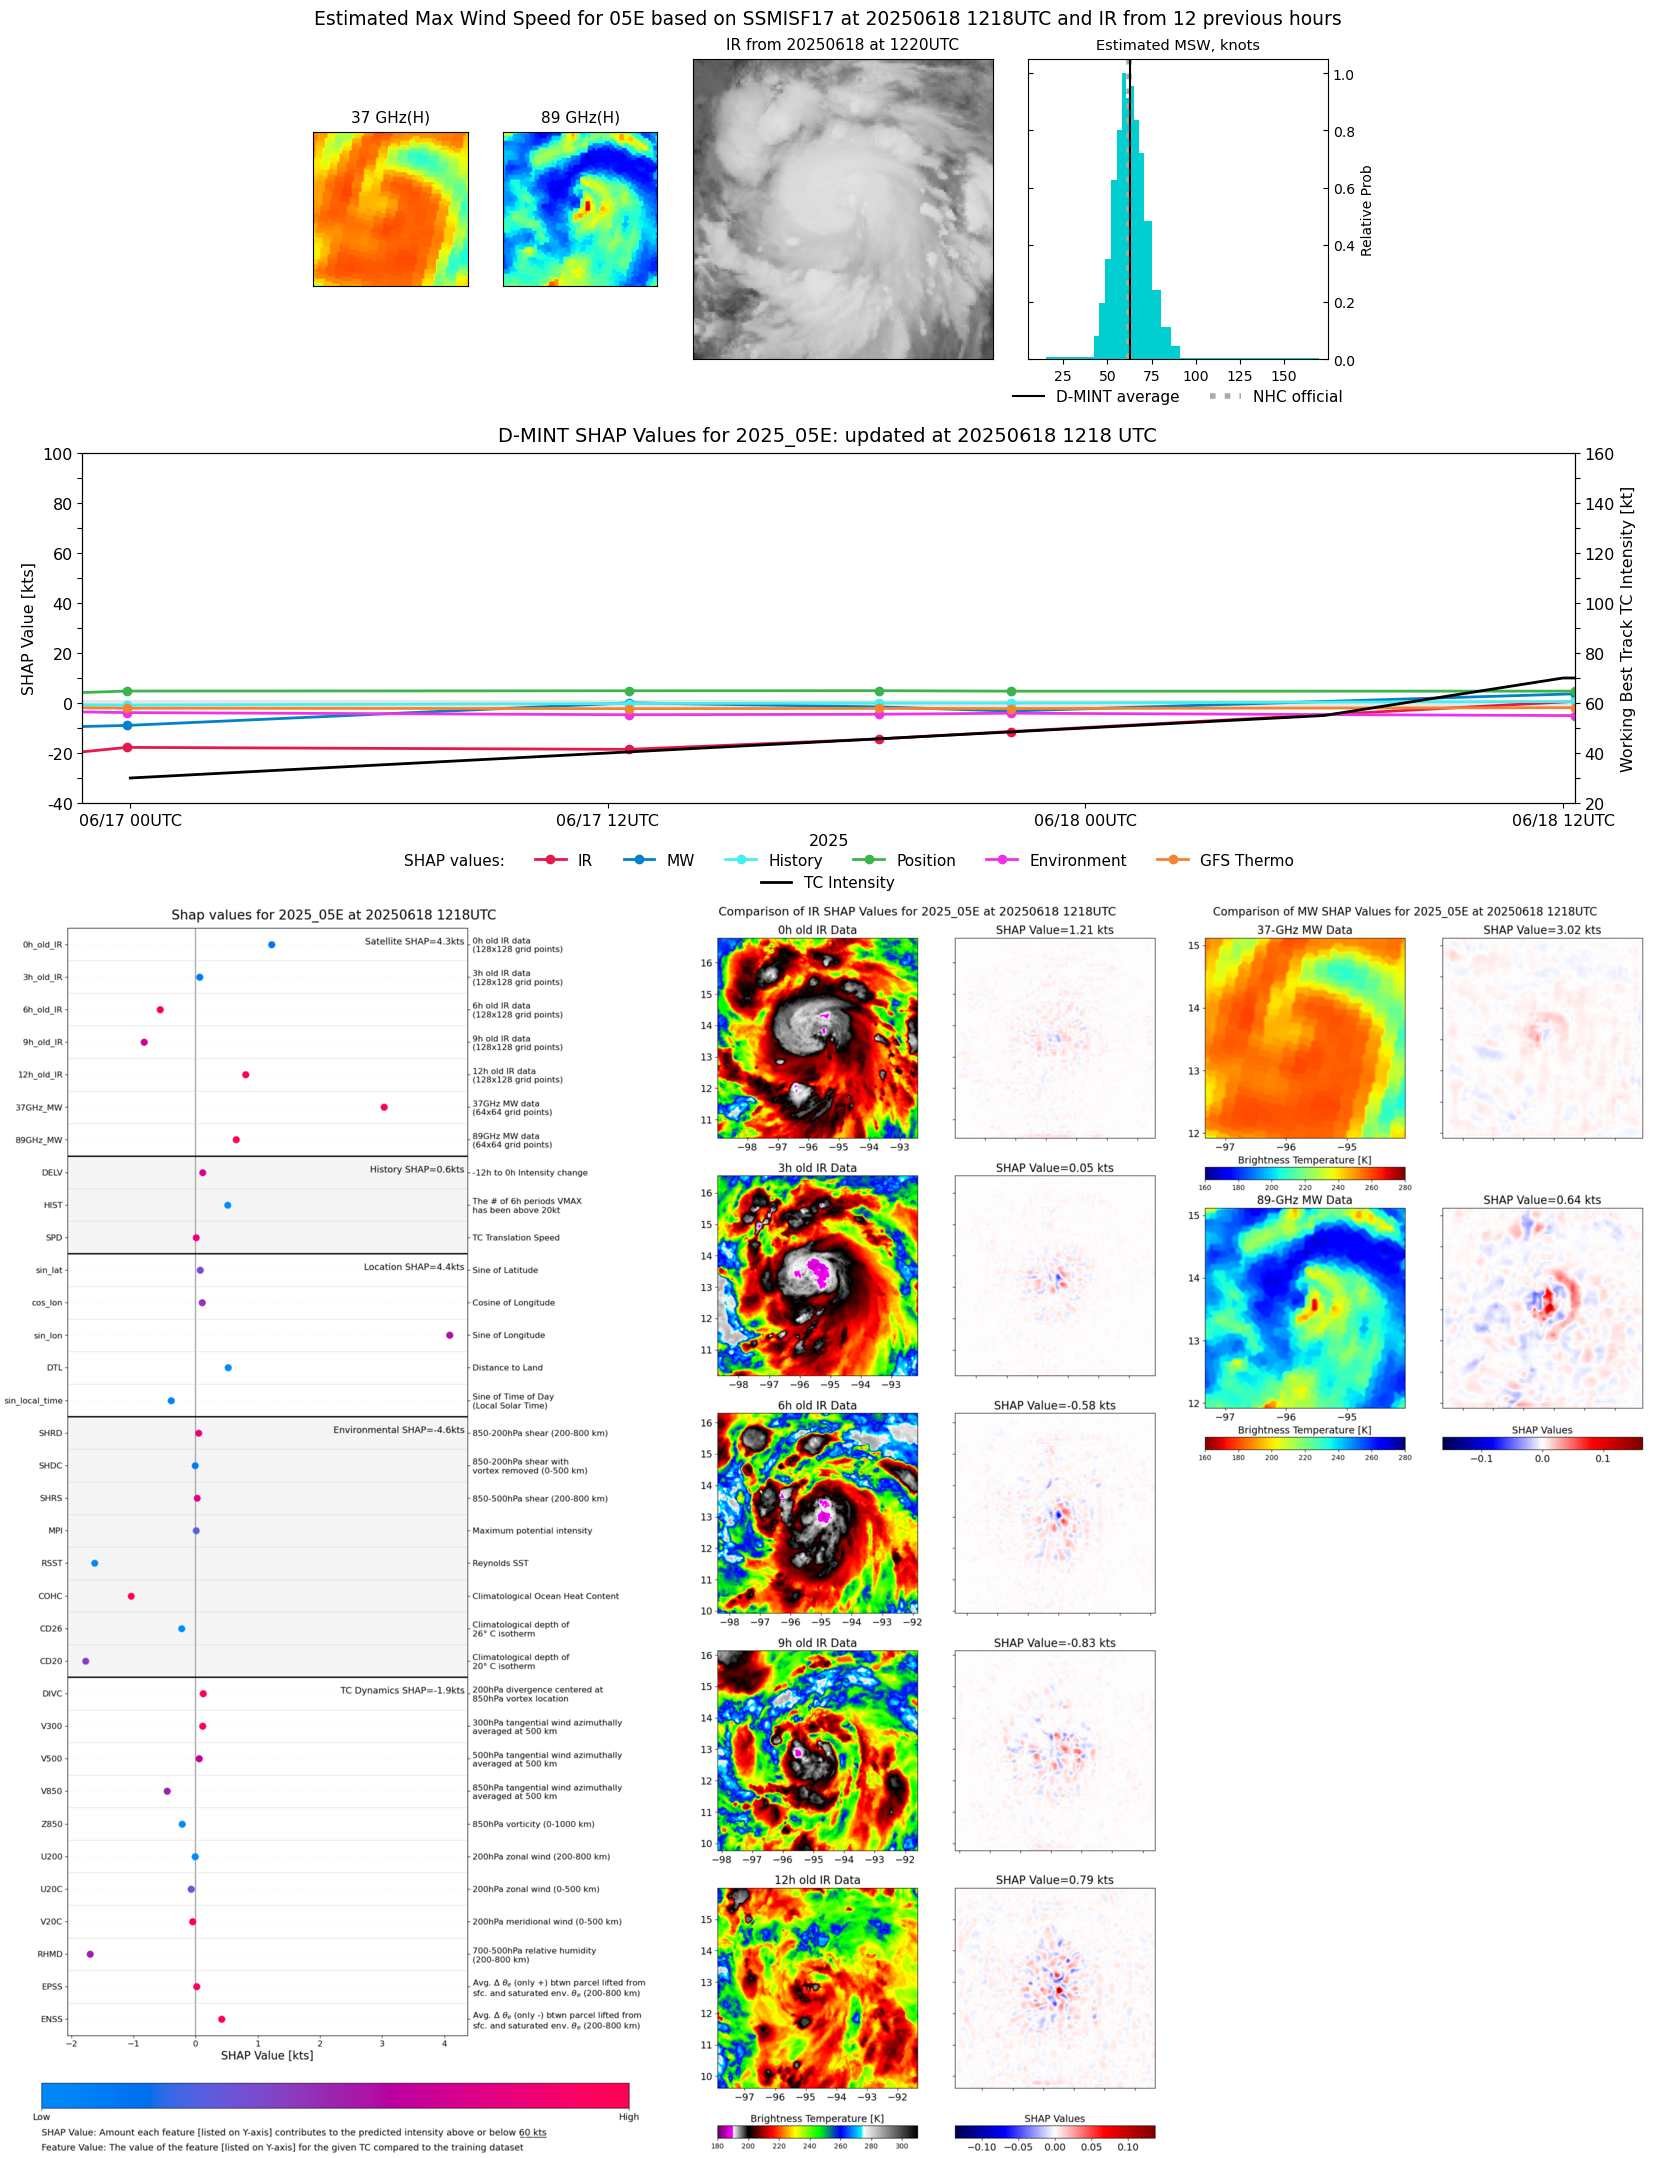 |
| 20250618 | 0444 UTC | TMS02 | 996 hPa | 60 kts | 54 kts | 65 kts | 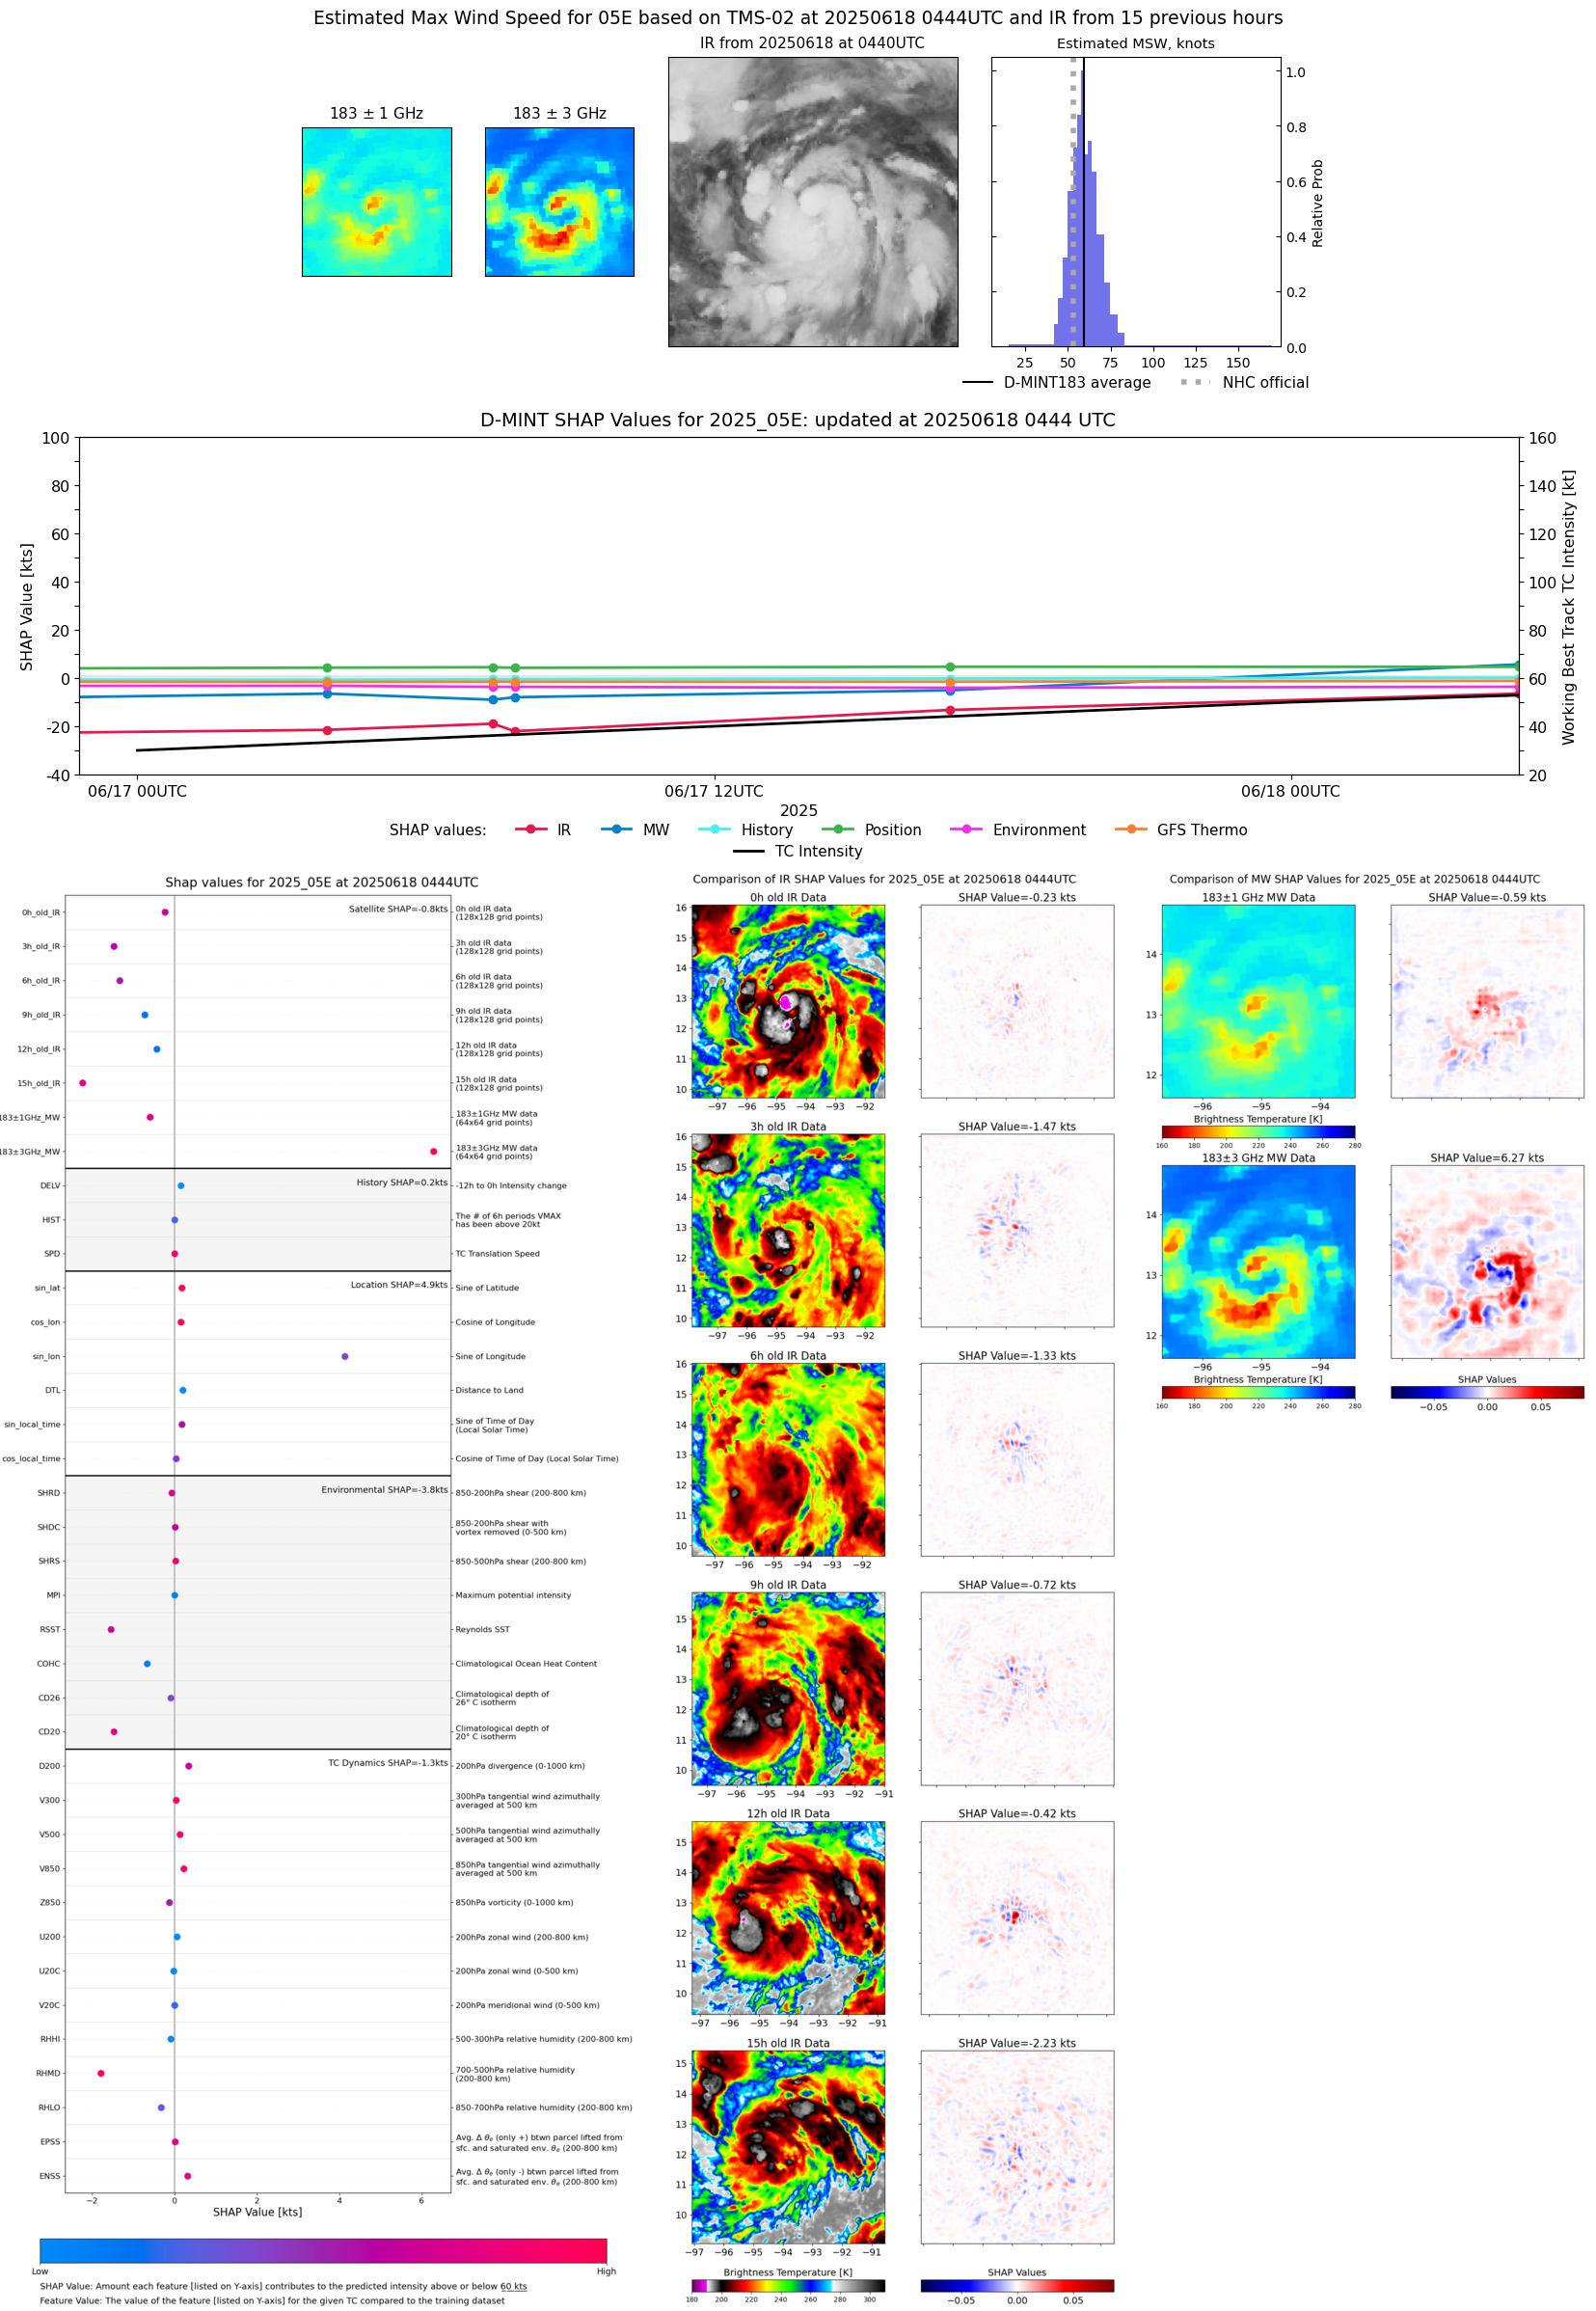 |
| 20250617 | 2207 UTC | SSMISF18 | 1002 hPa | 44 kts | 39 kts | 49 kts | 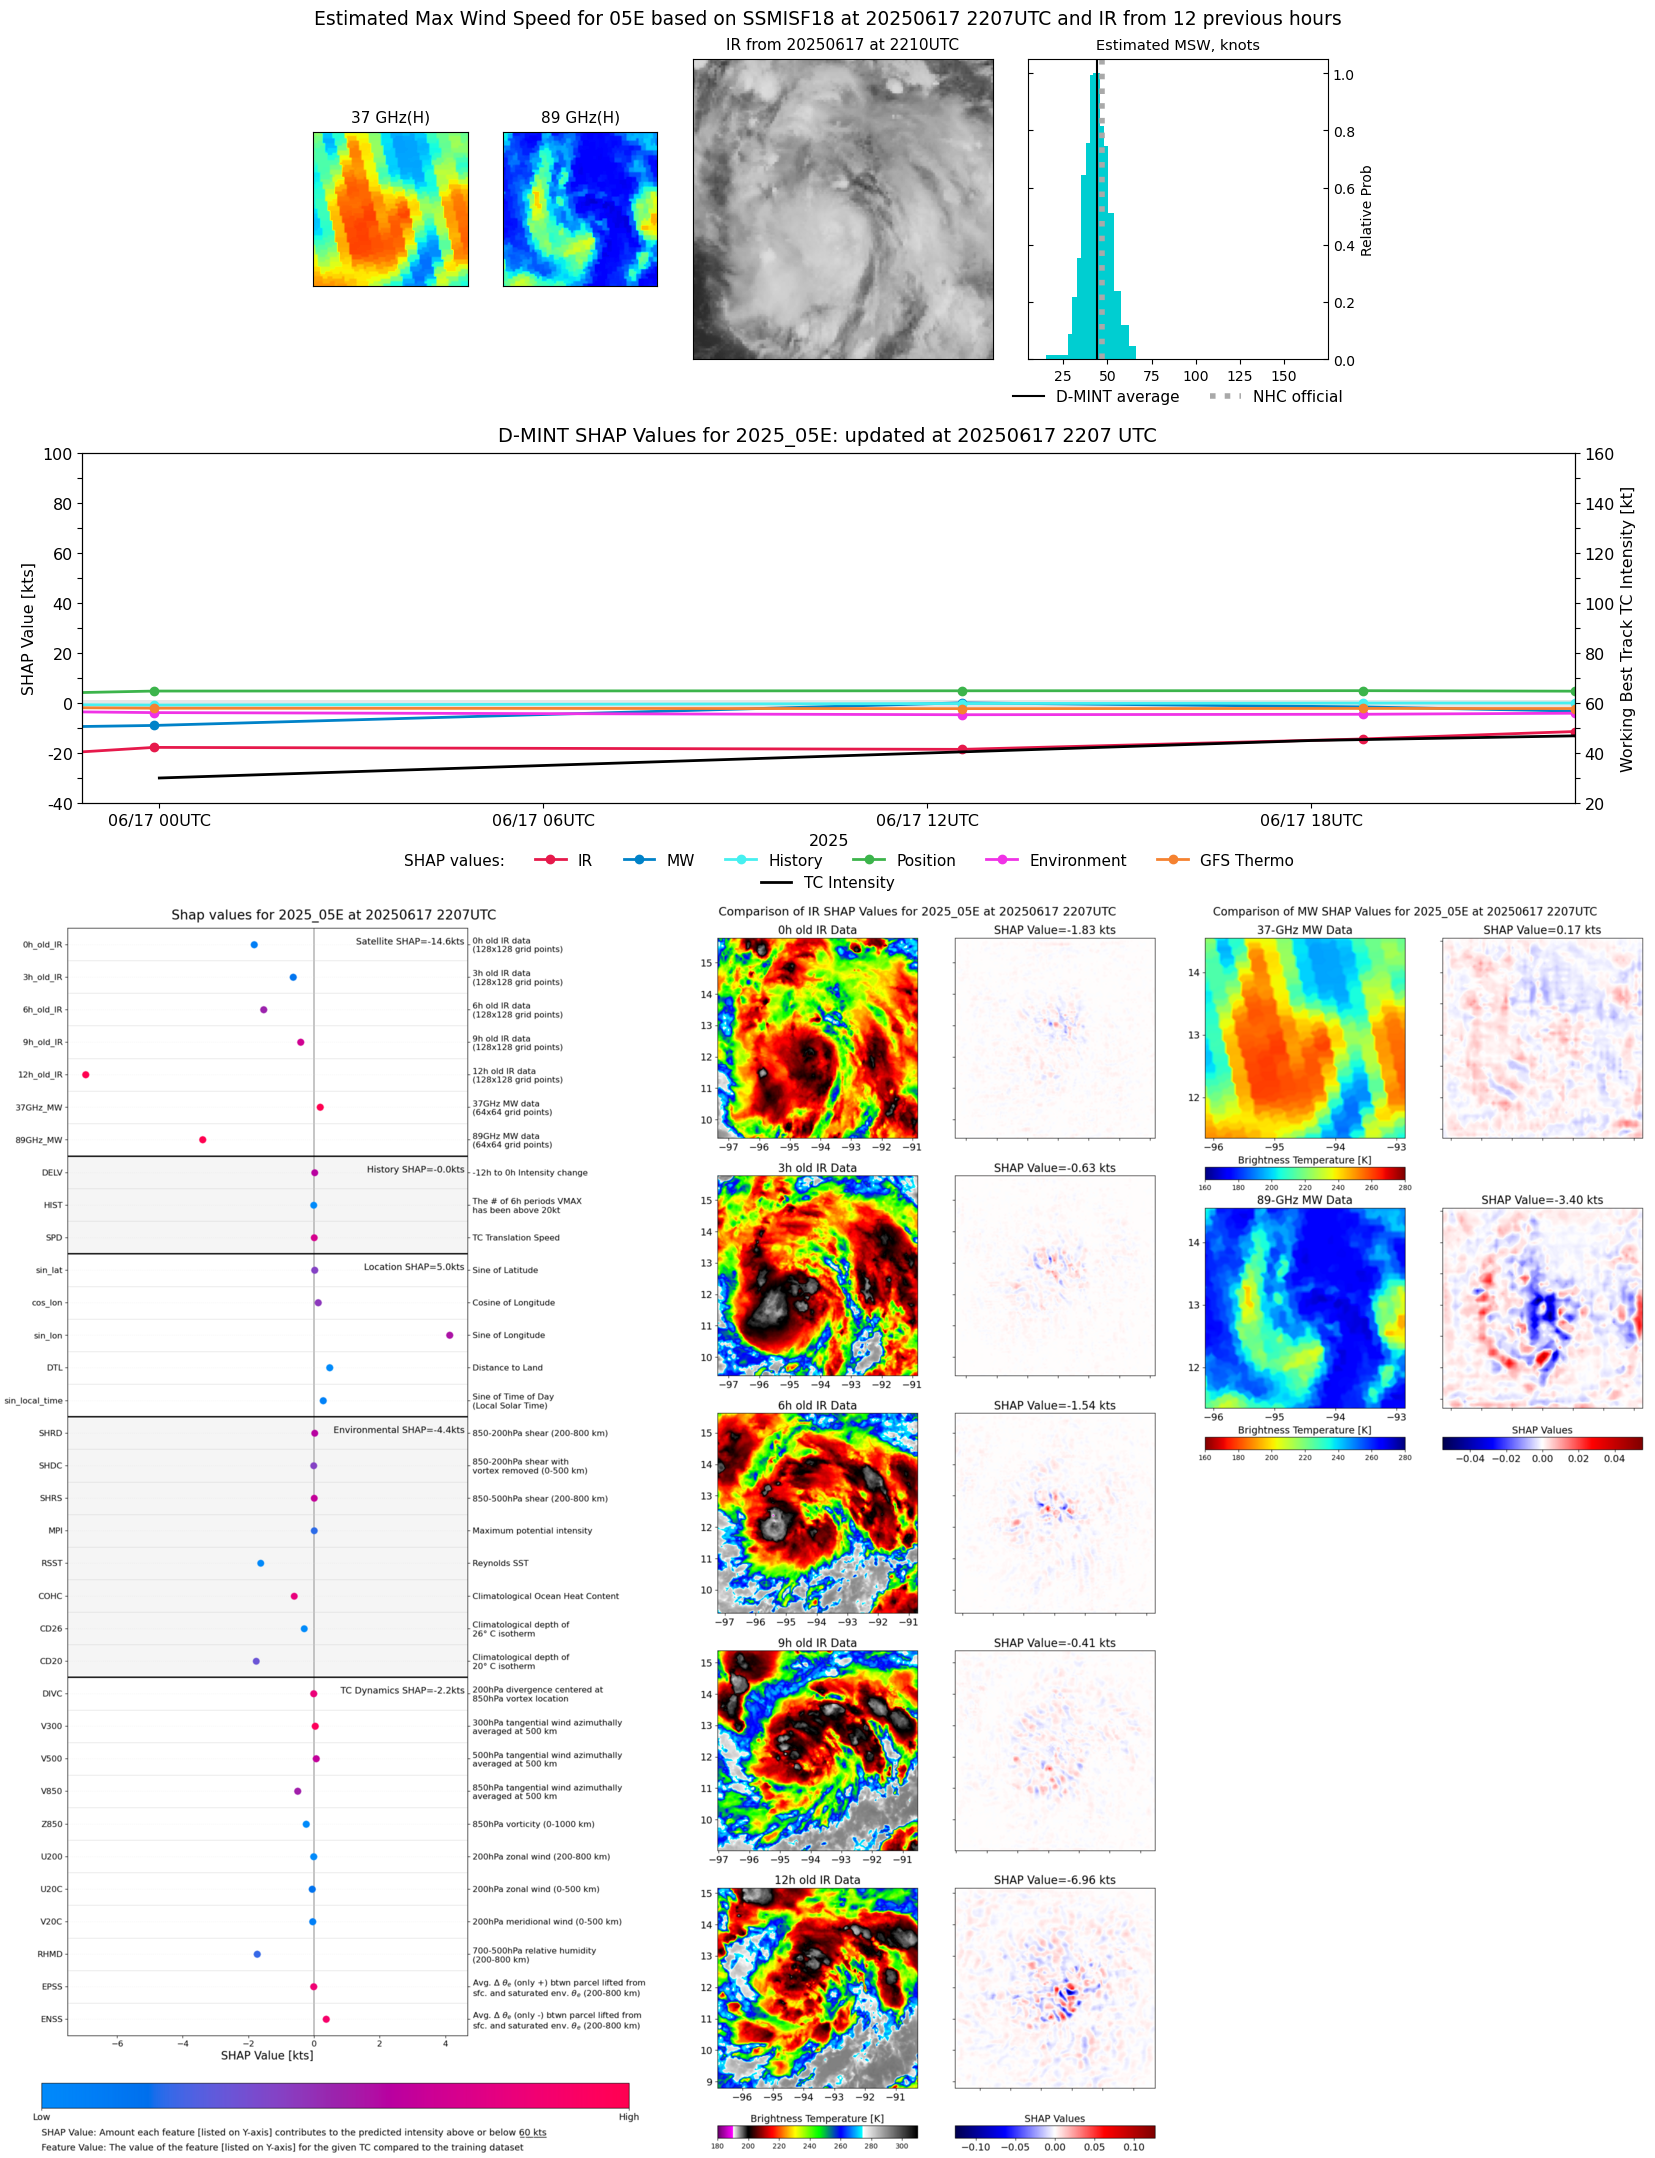 |
| 20250617 | 1848 UTC | GMI | 1002 hPa | 42 kts | 38 kts | 47 kts | 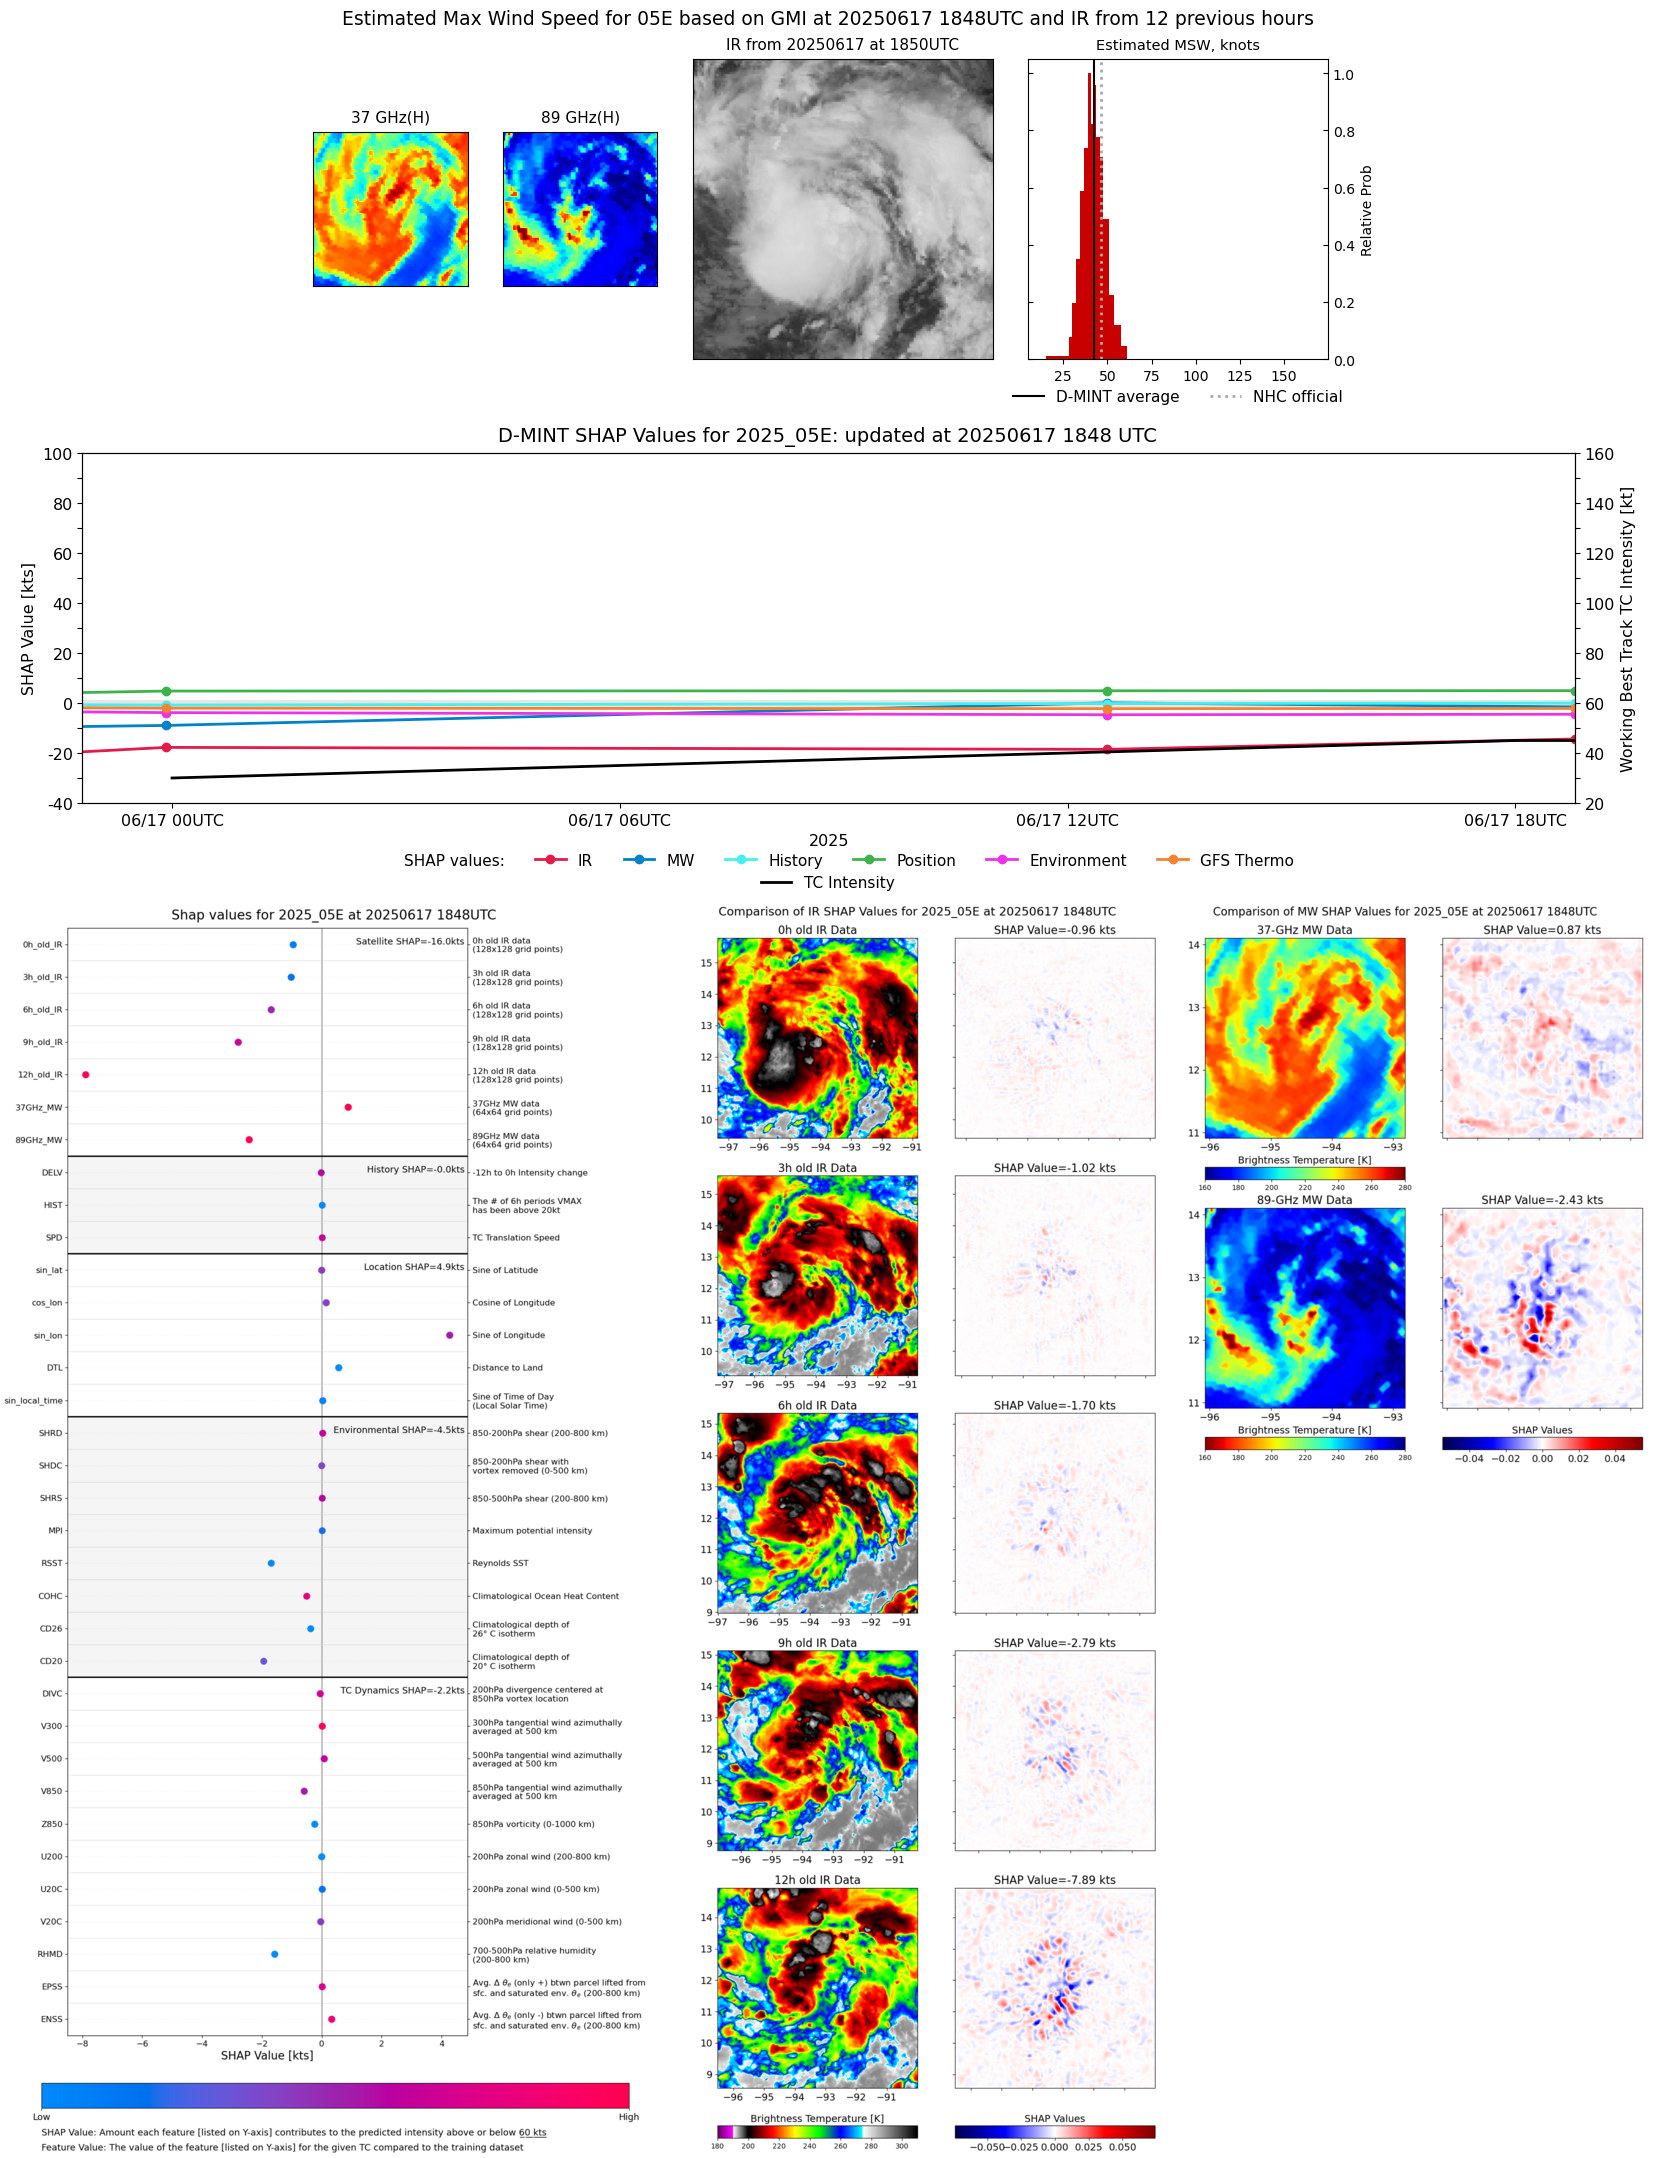 |
| 20250617 | 1654 UTC | TMS02 | 1003 hPa | 41 kts | 37 kts | 46 kts | 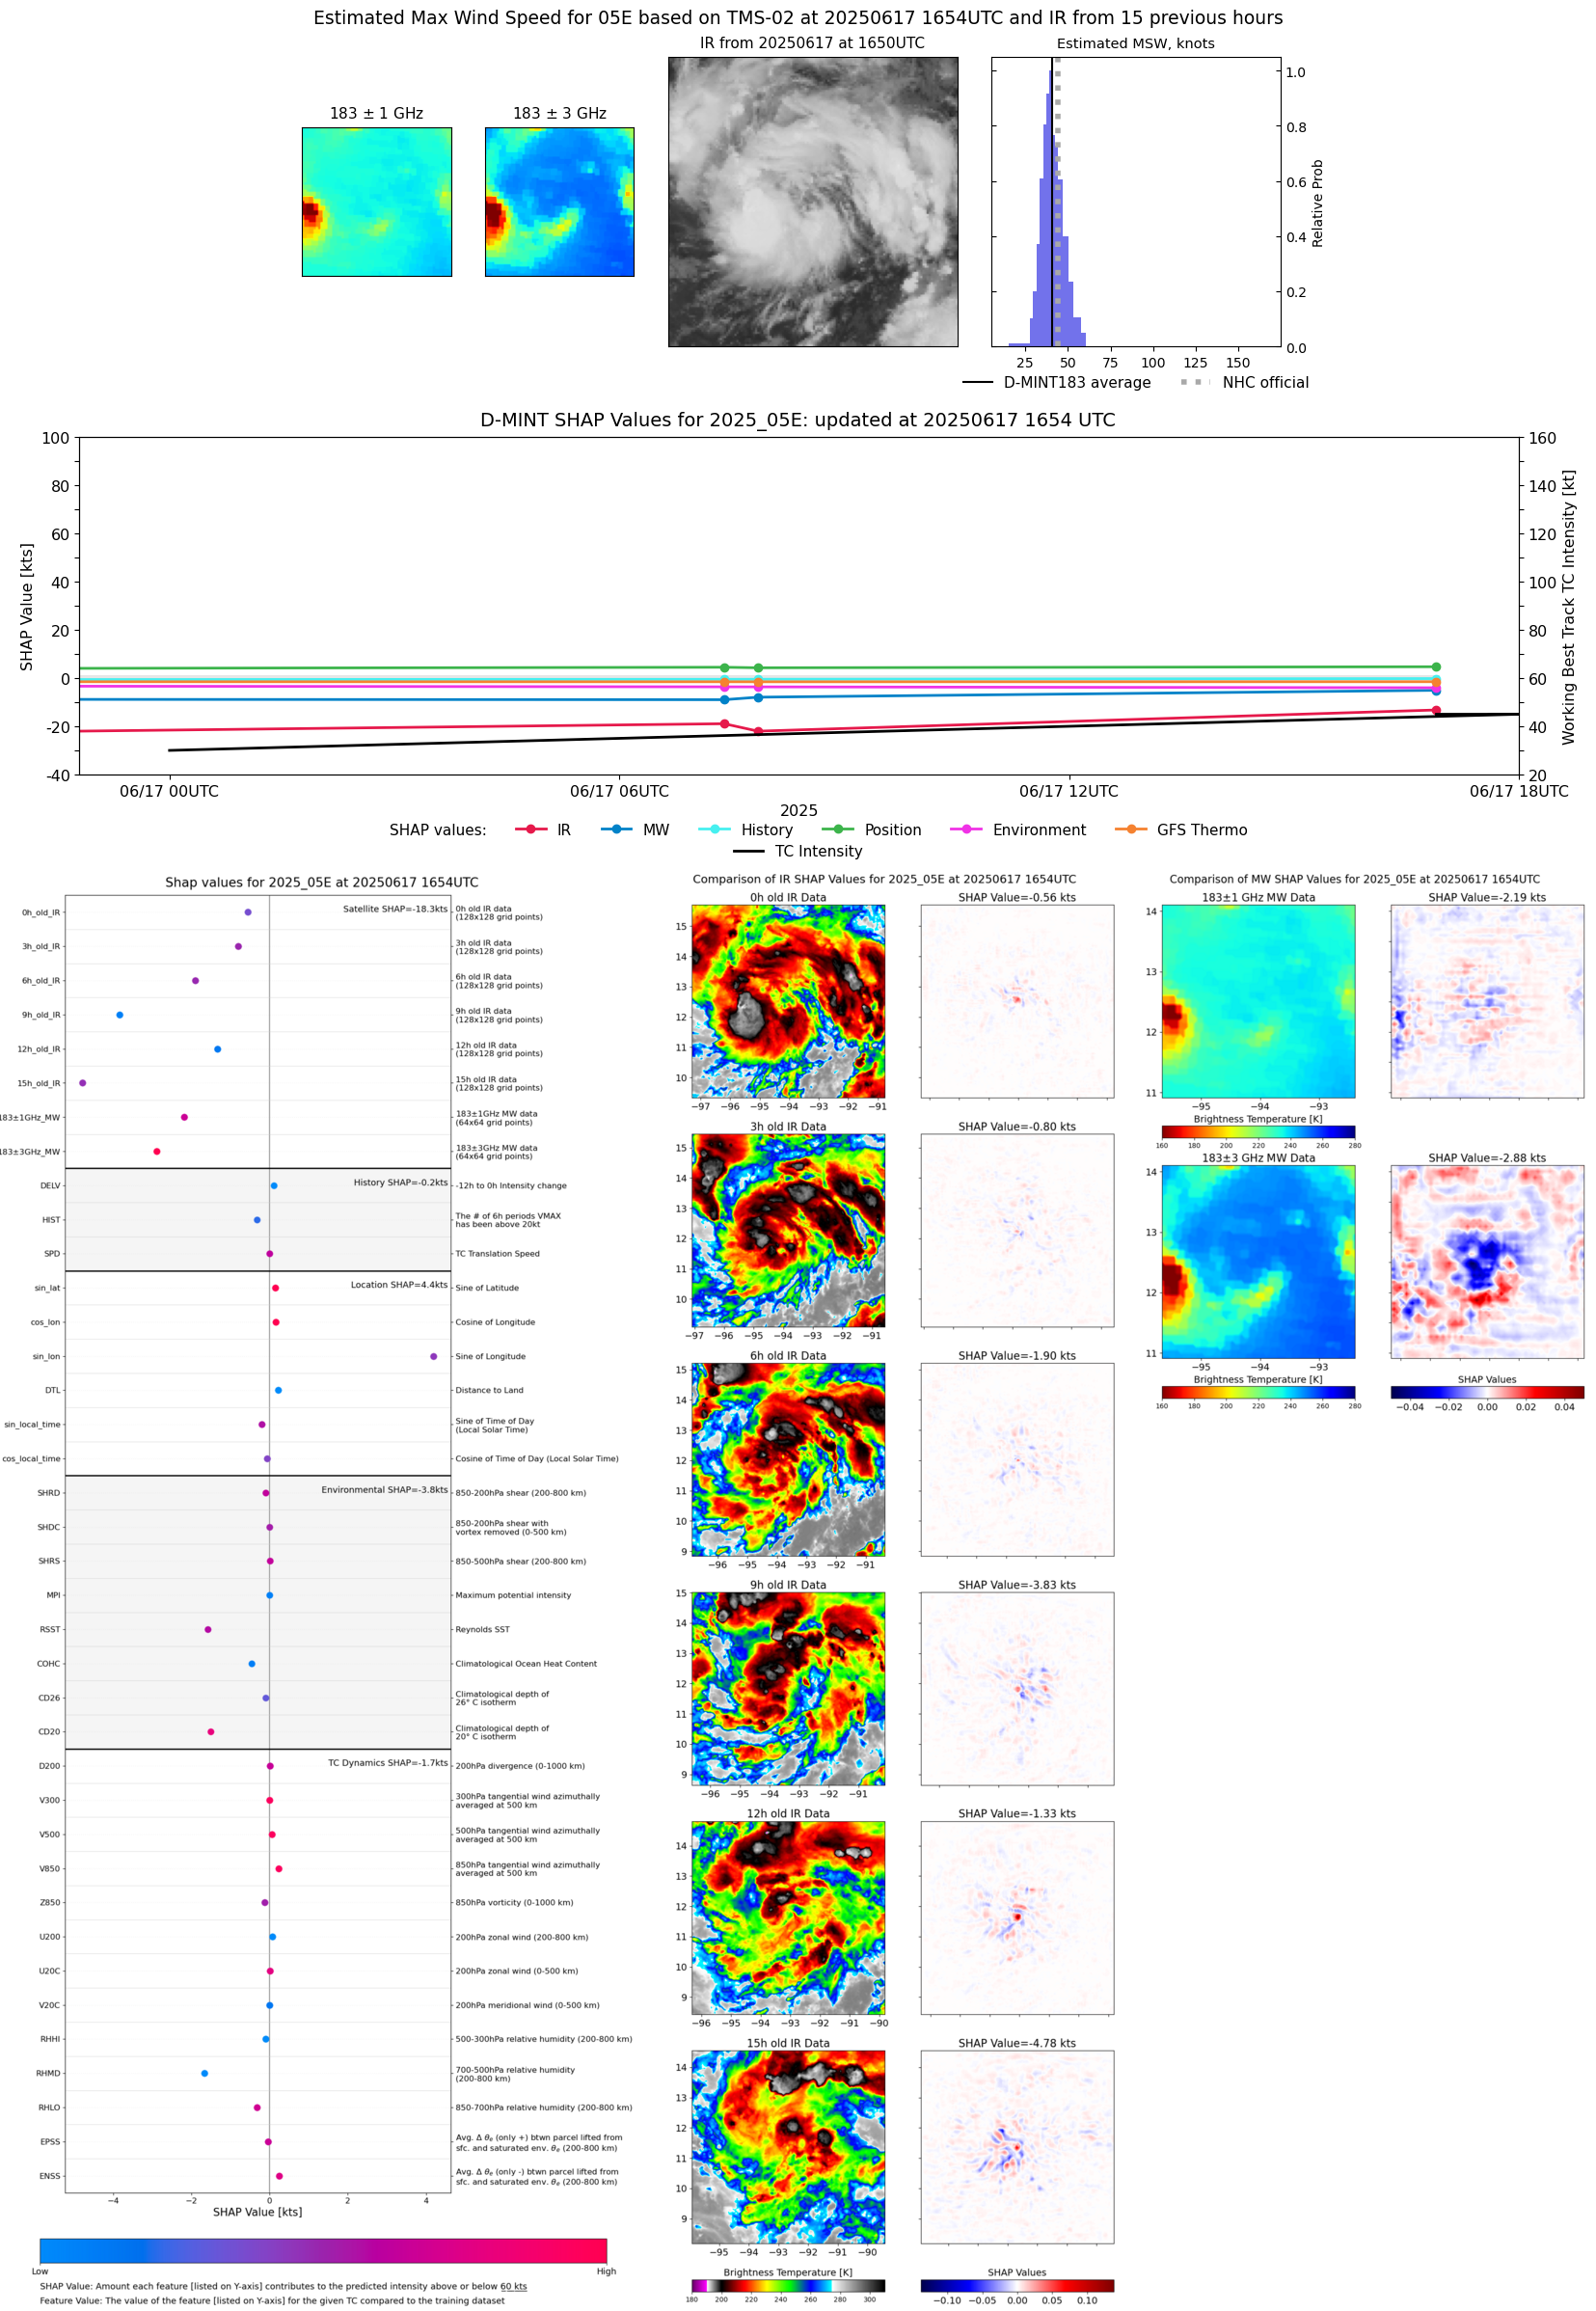 |
| 20250617 | 1232 UTC | SSMISF17 | 1003 hPa | 39 kts | 35 kts | 44 kts | 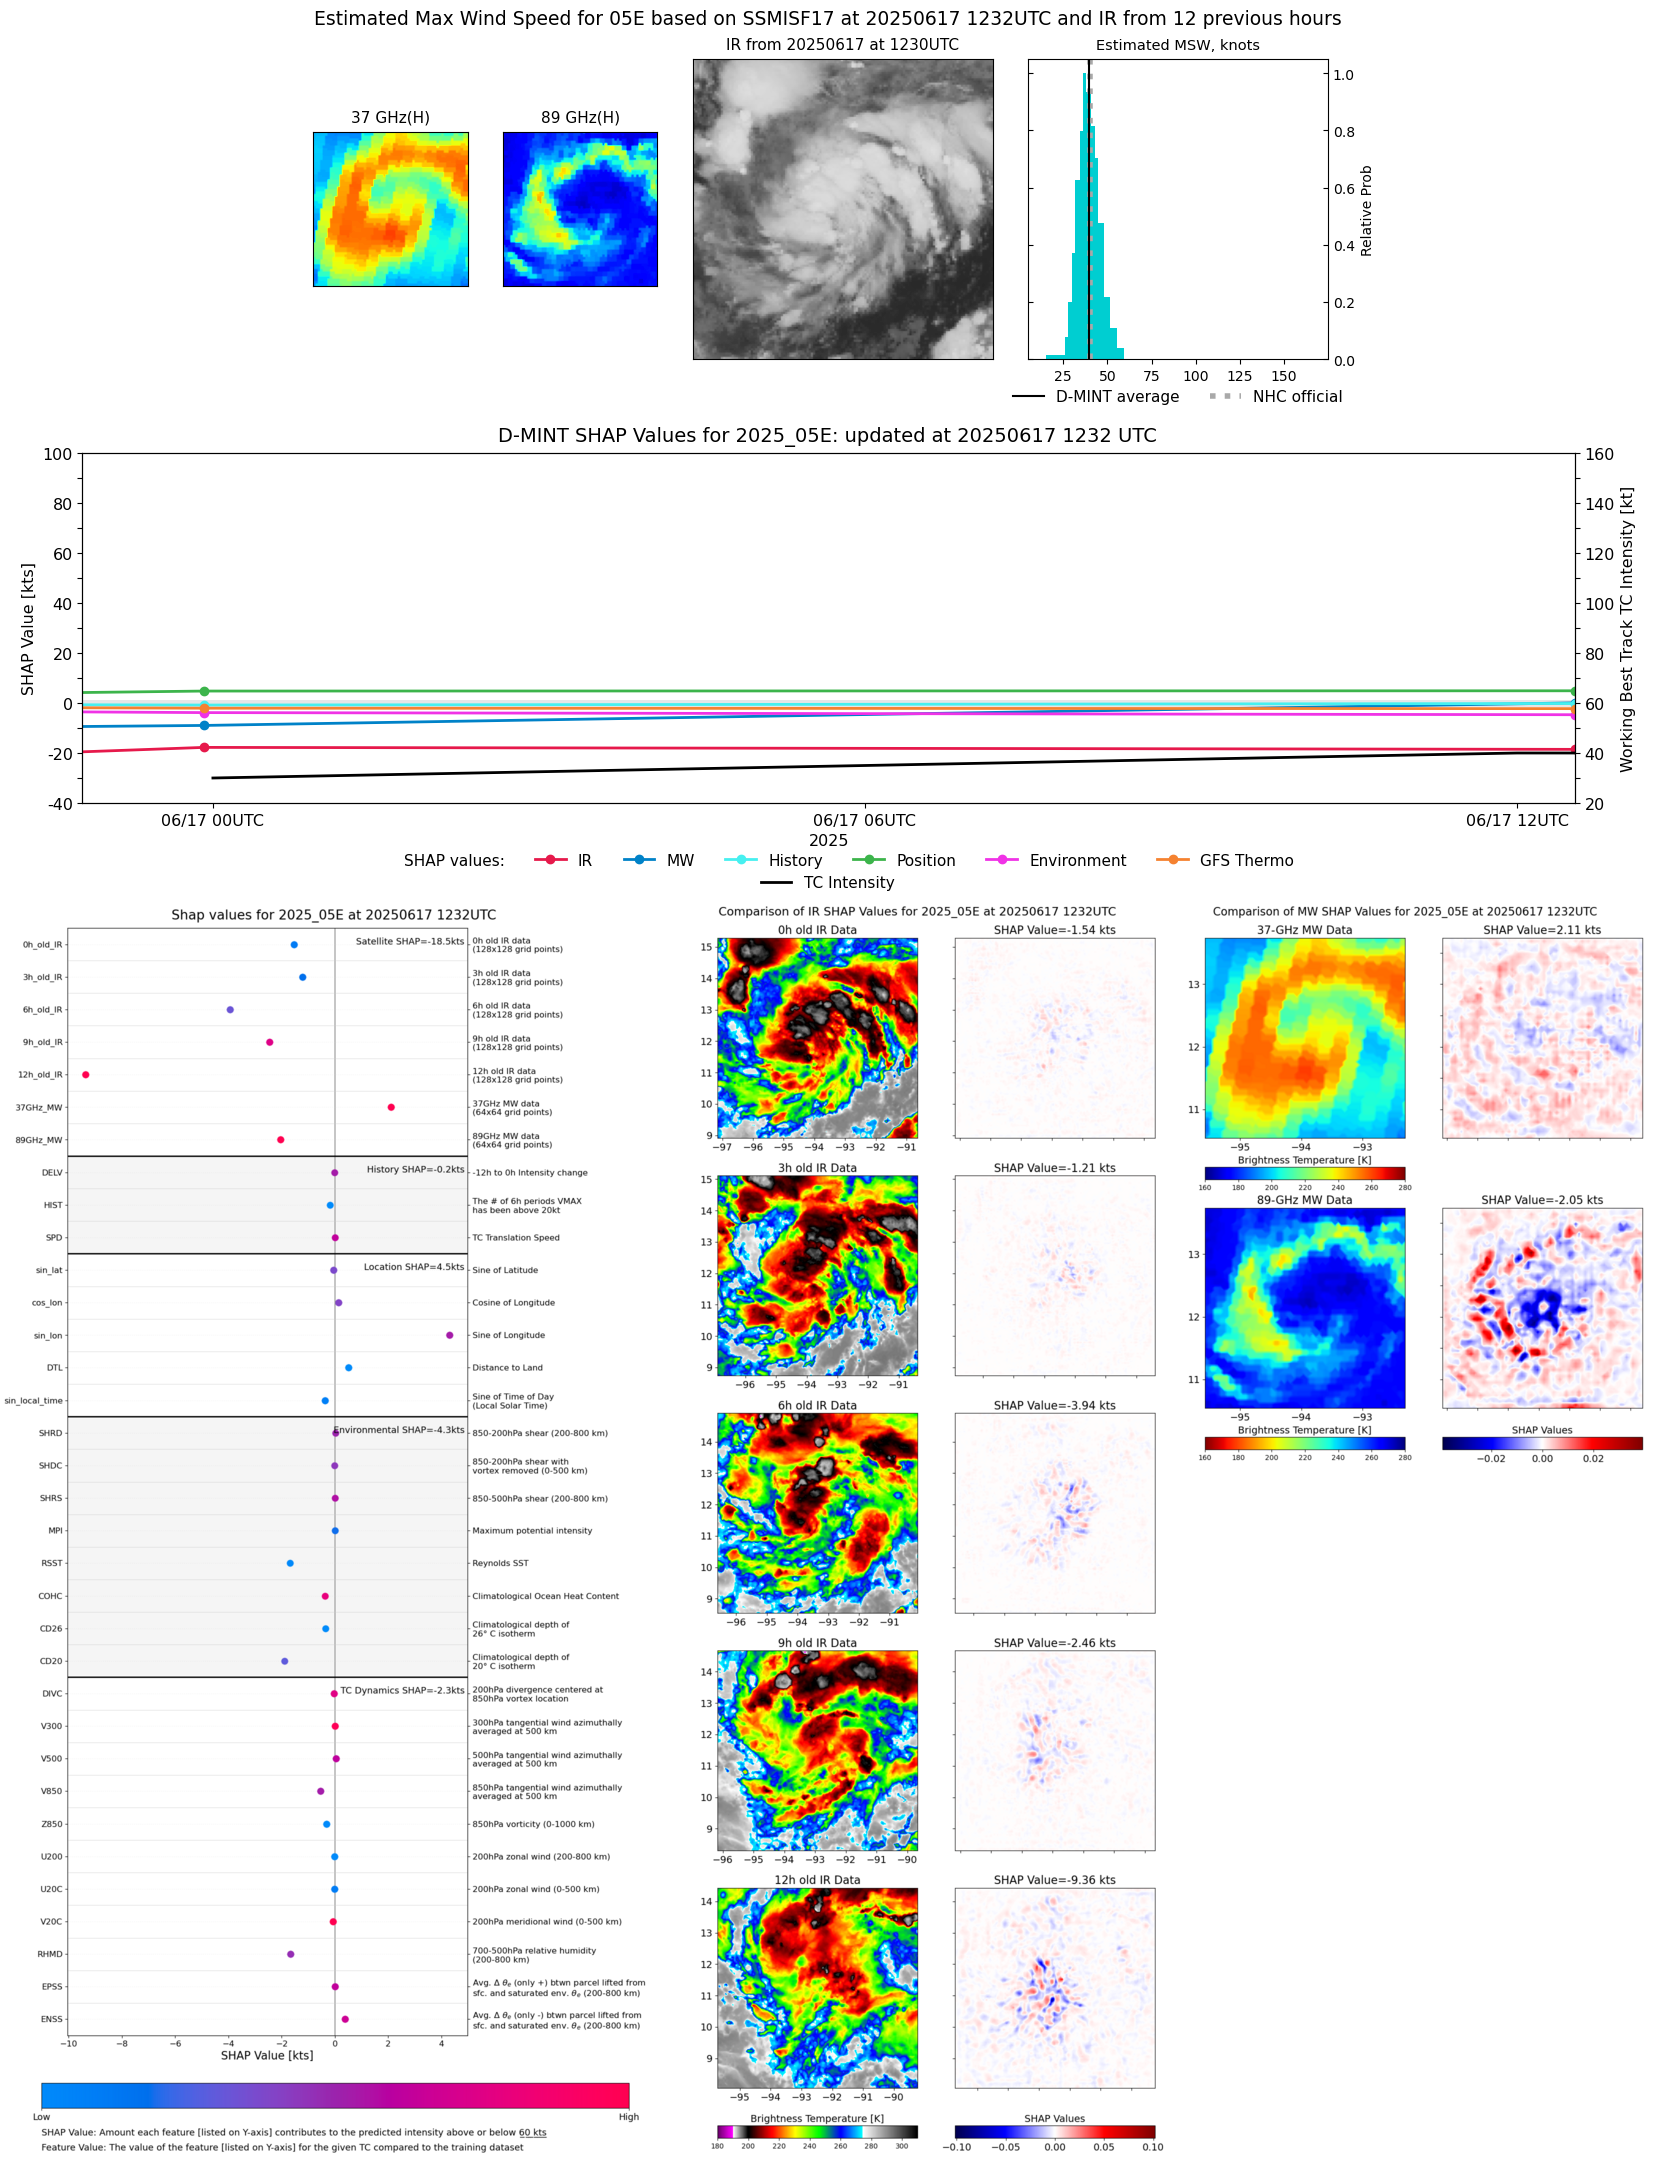 |
| 20250617 | 0751 UTC | ATMS-N20 | 1006 hPa | 29 kts | 26 kts | 32 kts | 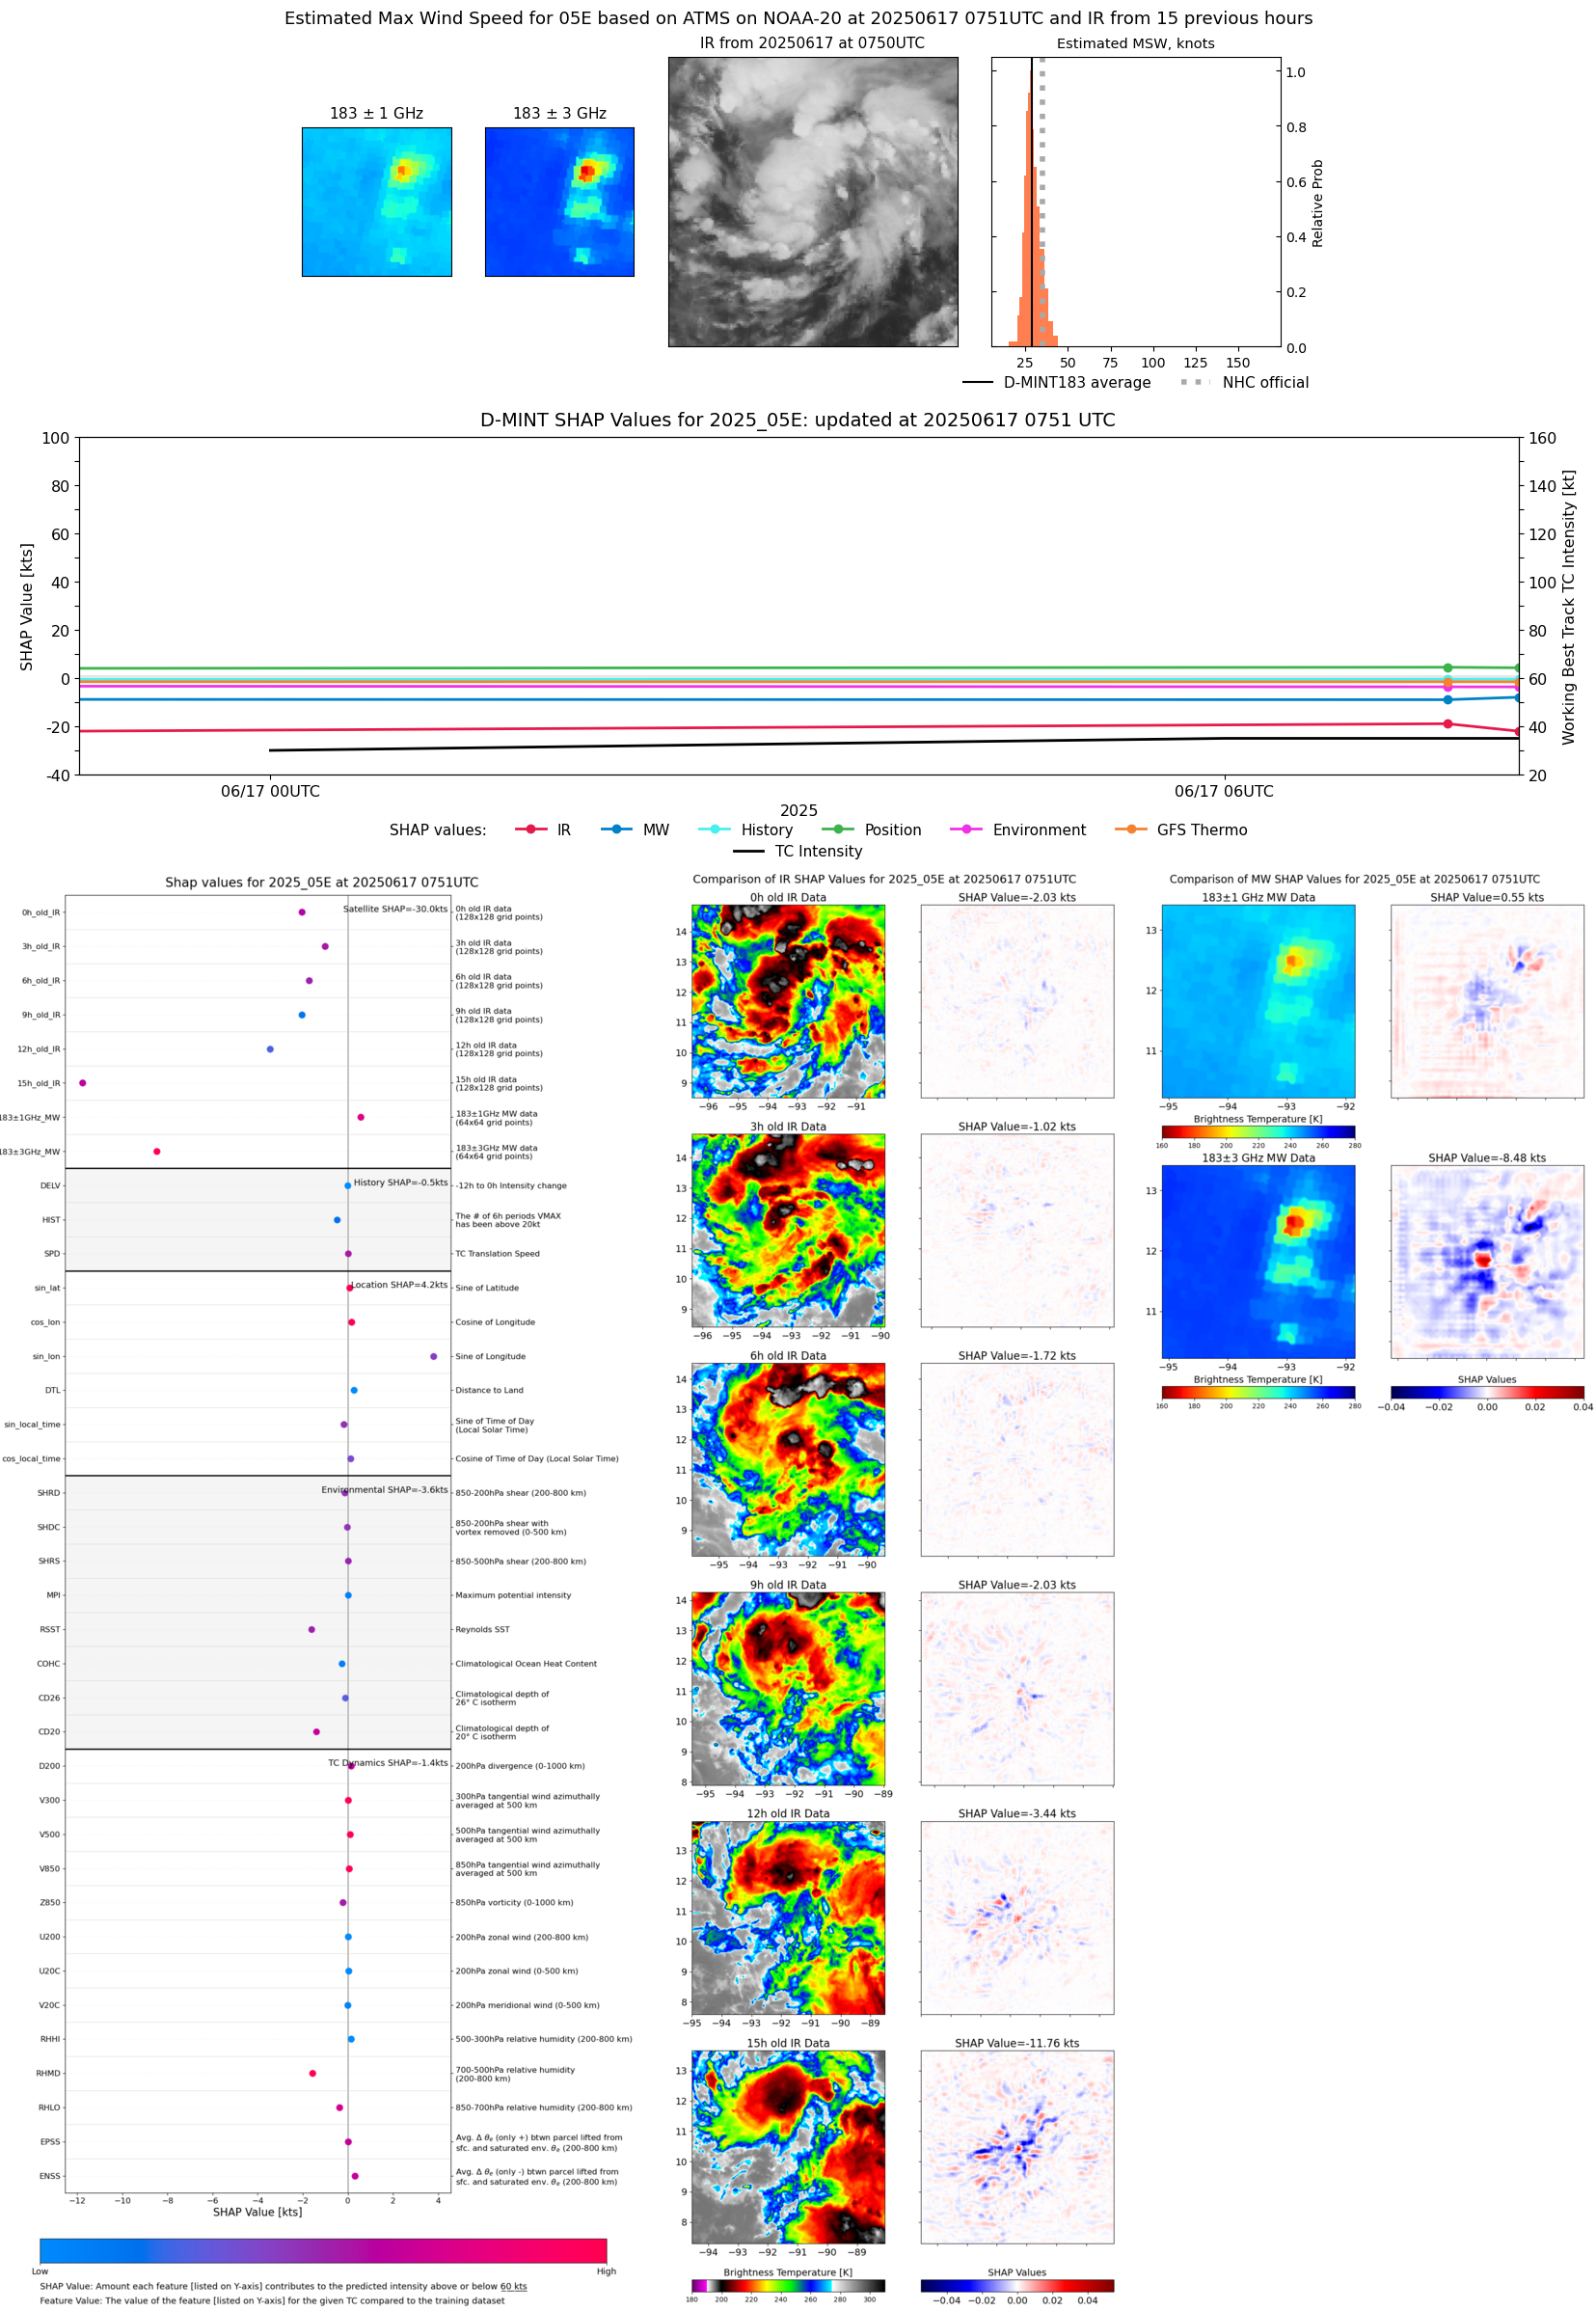 |
| 20250617 | 0724 UTC | ATMS-N20 | 1007 hPa | 31 kts | 28 kts | 35 kts | 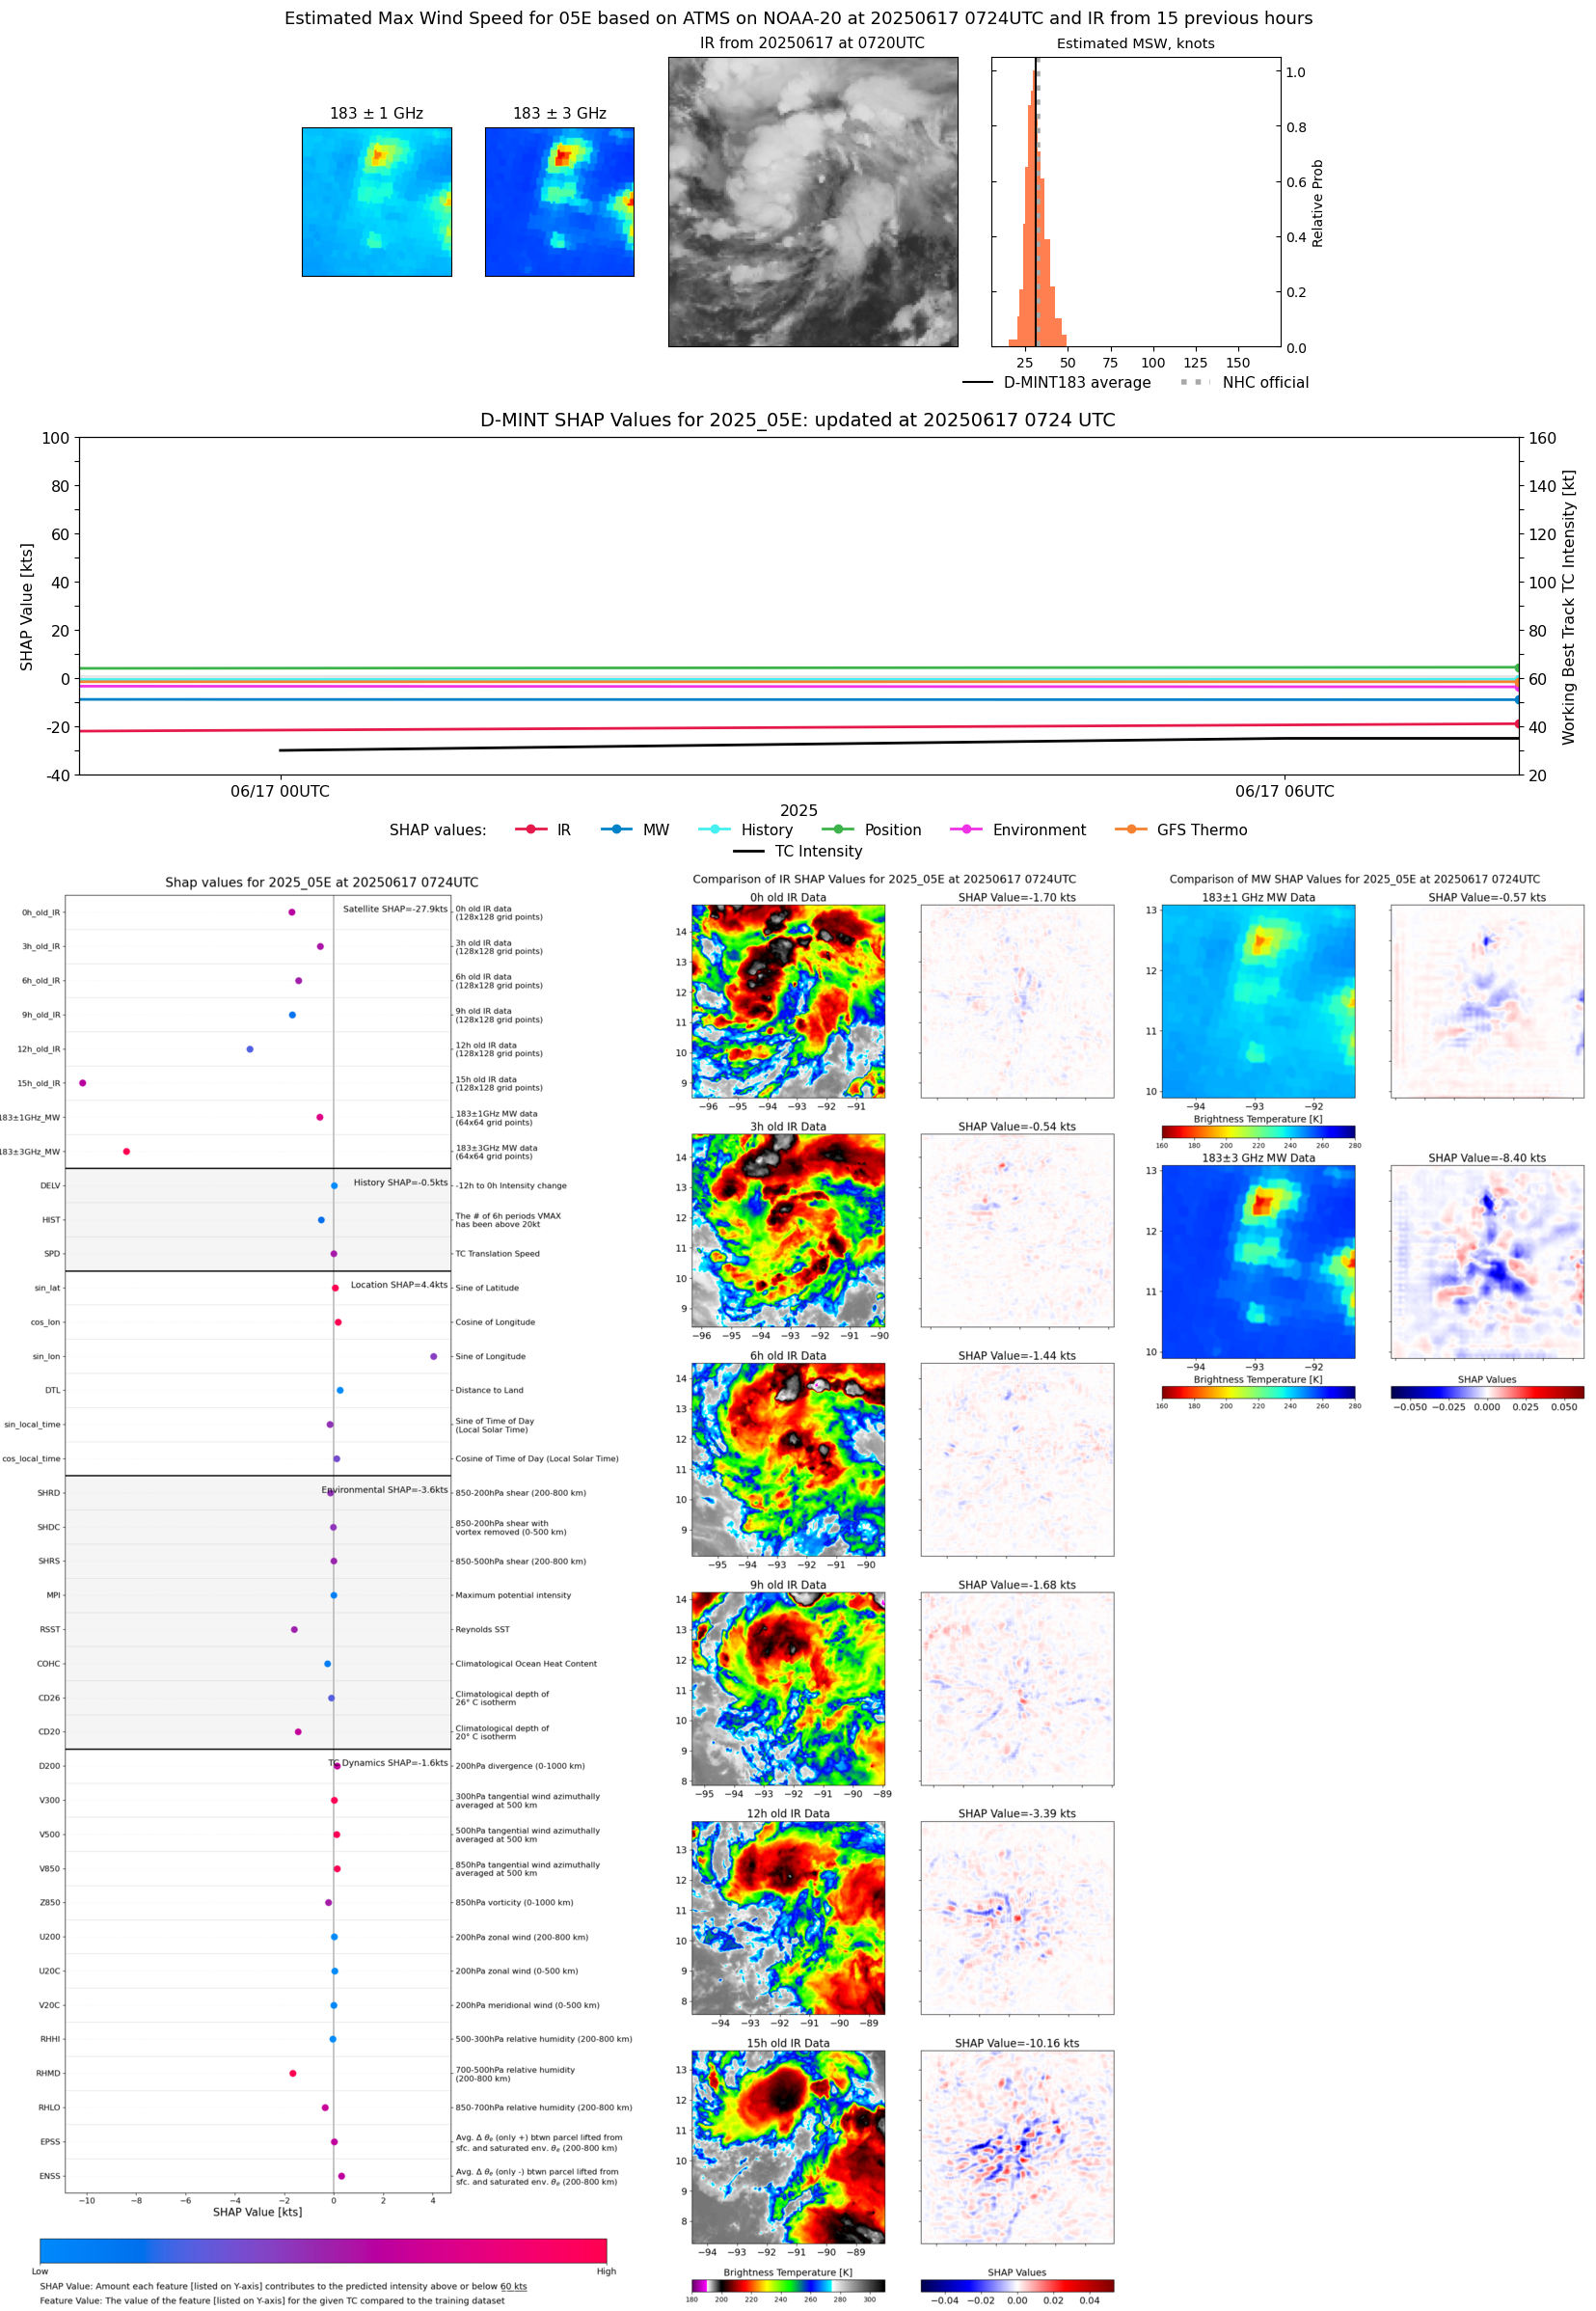 |
| 20250617 | 0357 UTC | TROPICS05 | 1007 hPa | 31 kts | 28 kts | 35 kts | 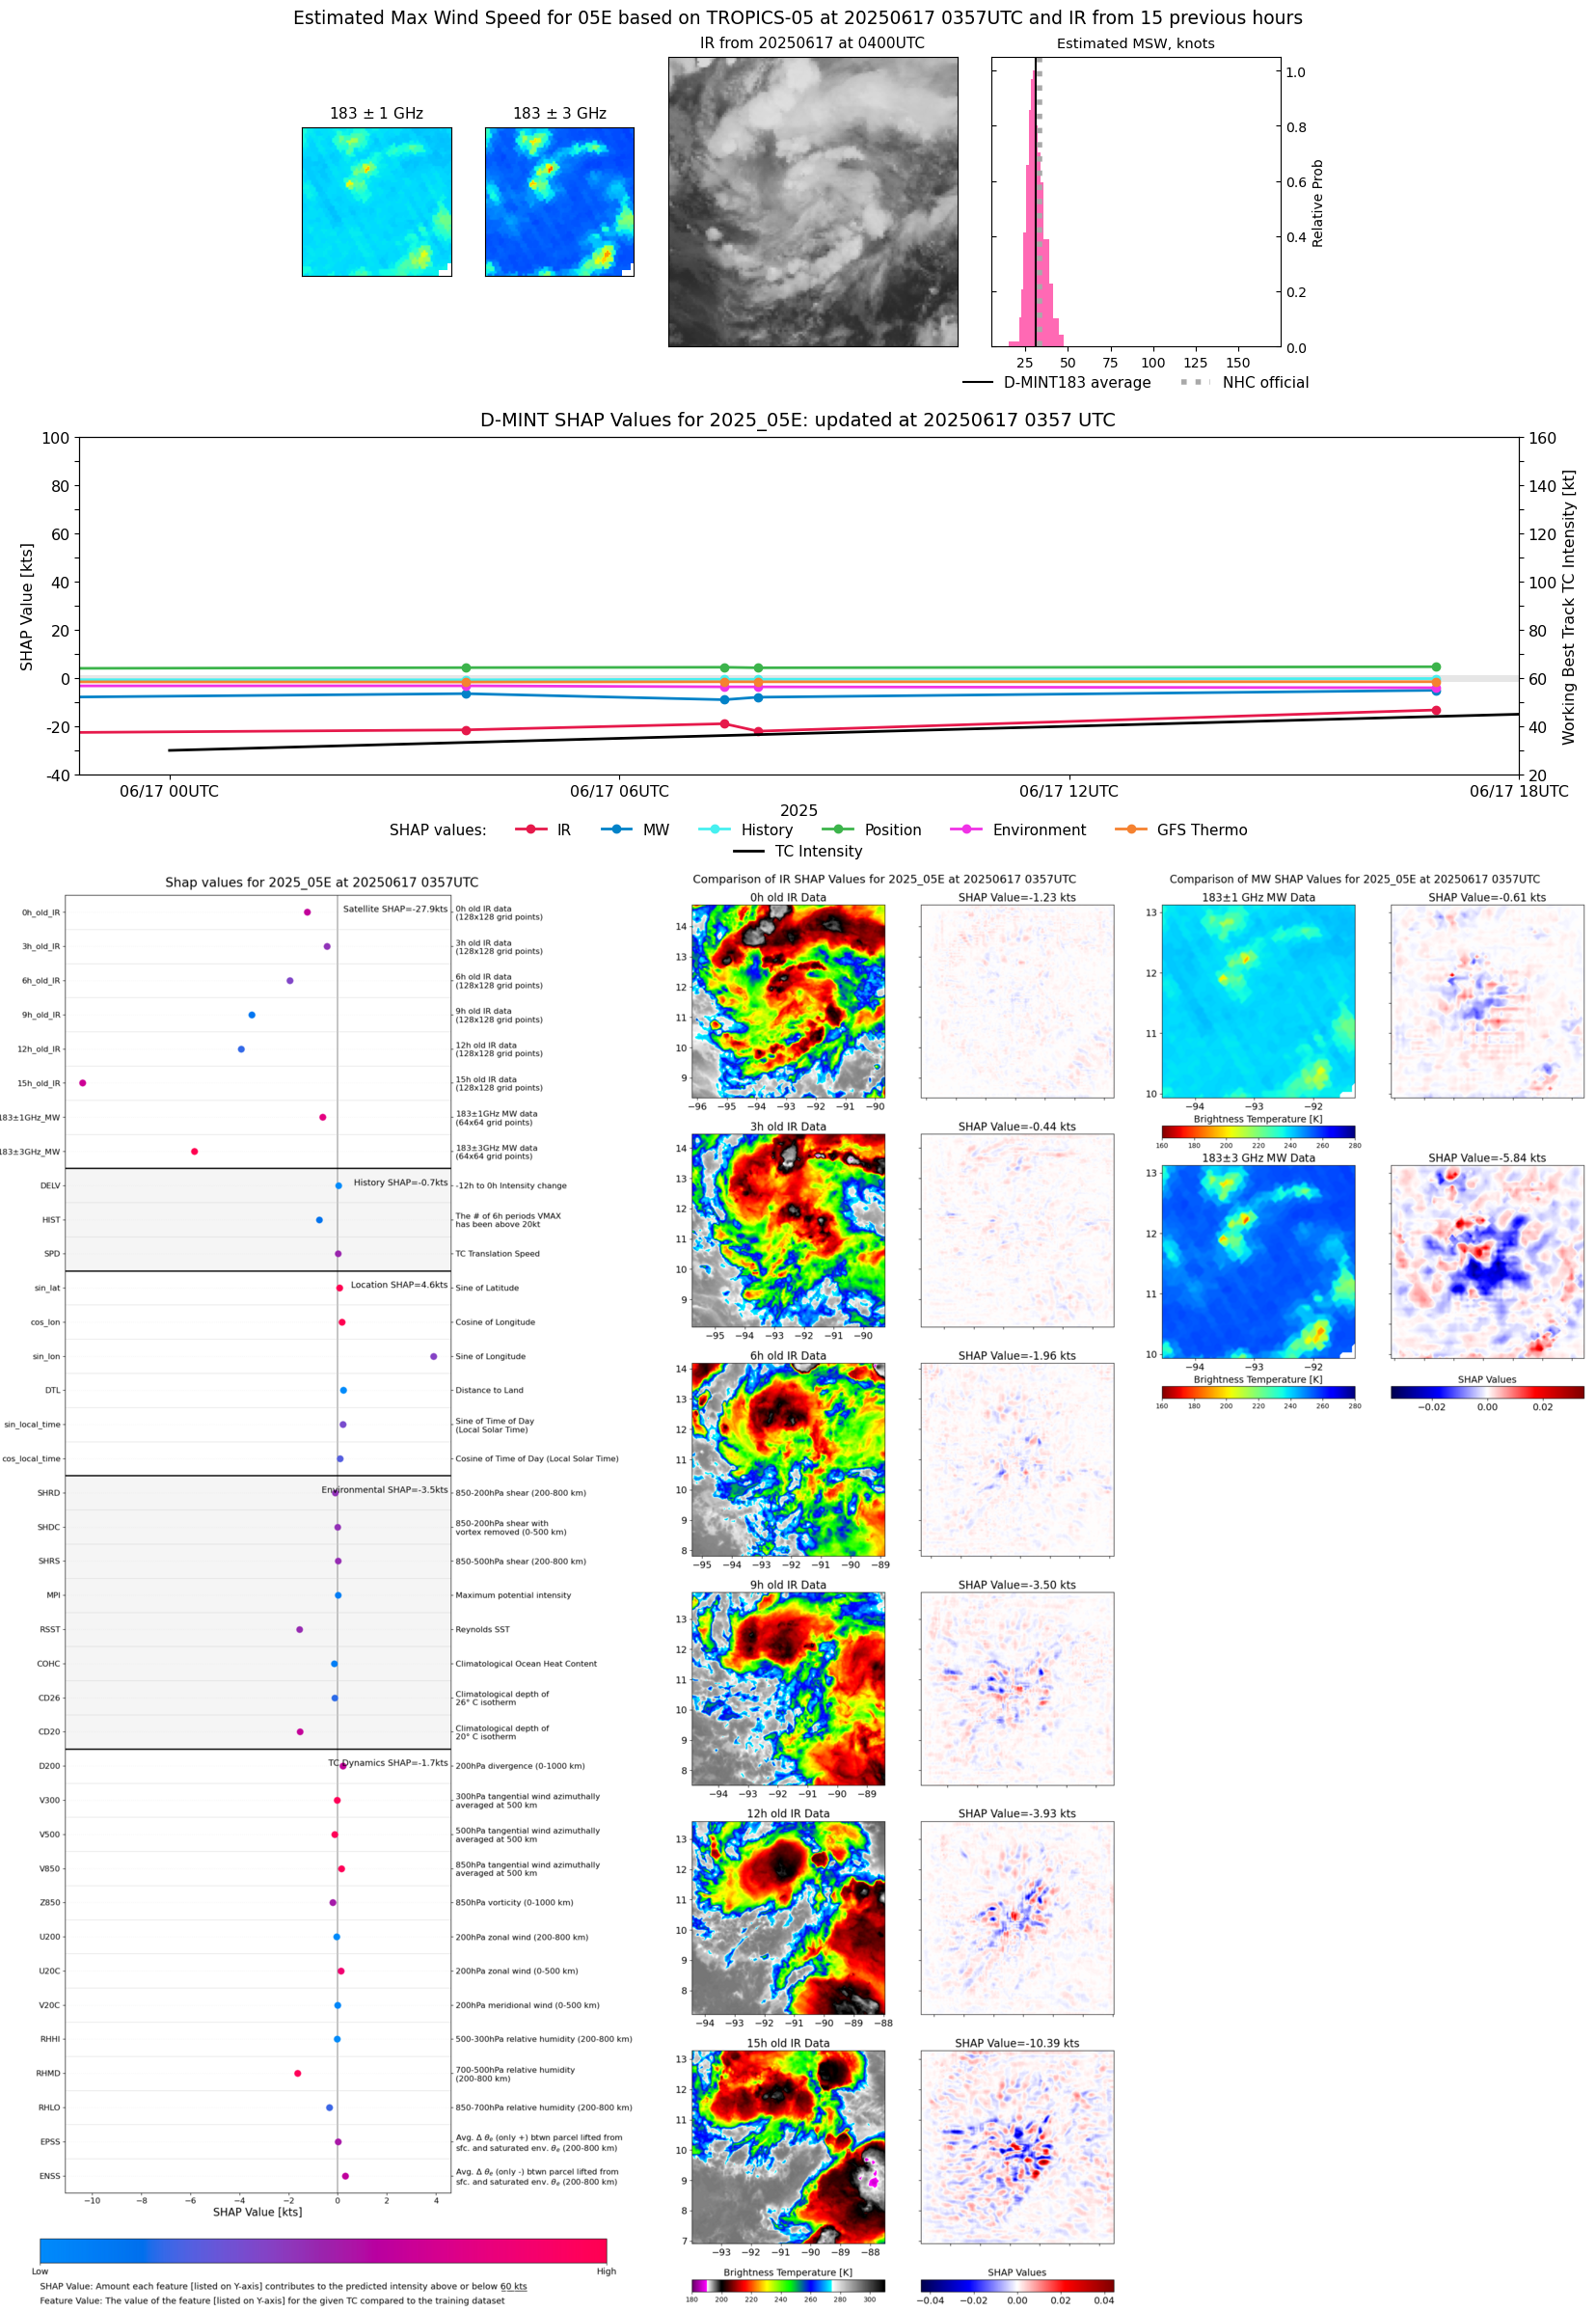 |
| 20250616 | 2355 UTC | SSMISF17 | NaN hPa | 31 kts | 28 kts | 35 kts |  |
| 20250616 | 2221 UTC | SSMISF18 | NaN hPa | 28 kts | 25 kts | 32 kts |  |
| 20250616 | 1917 UTC | ATMS-N20 | 1007 hPa | 0 kts | 0 kts | 0 kts | 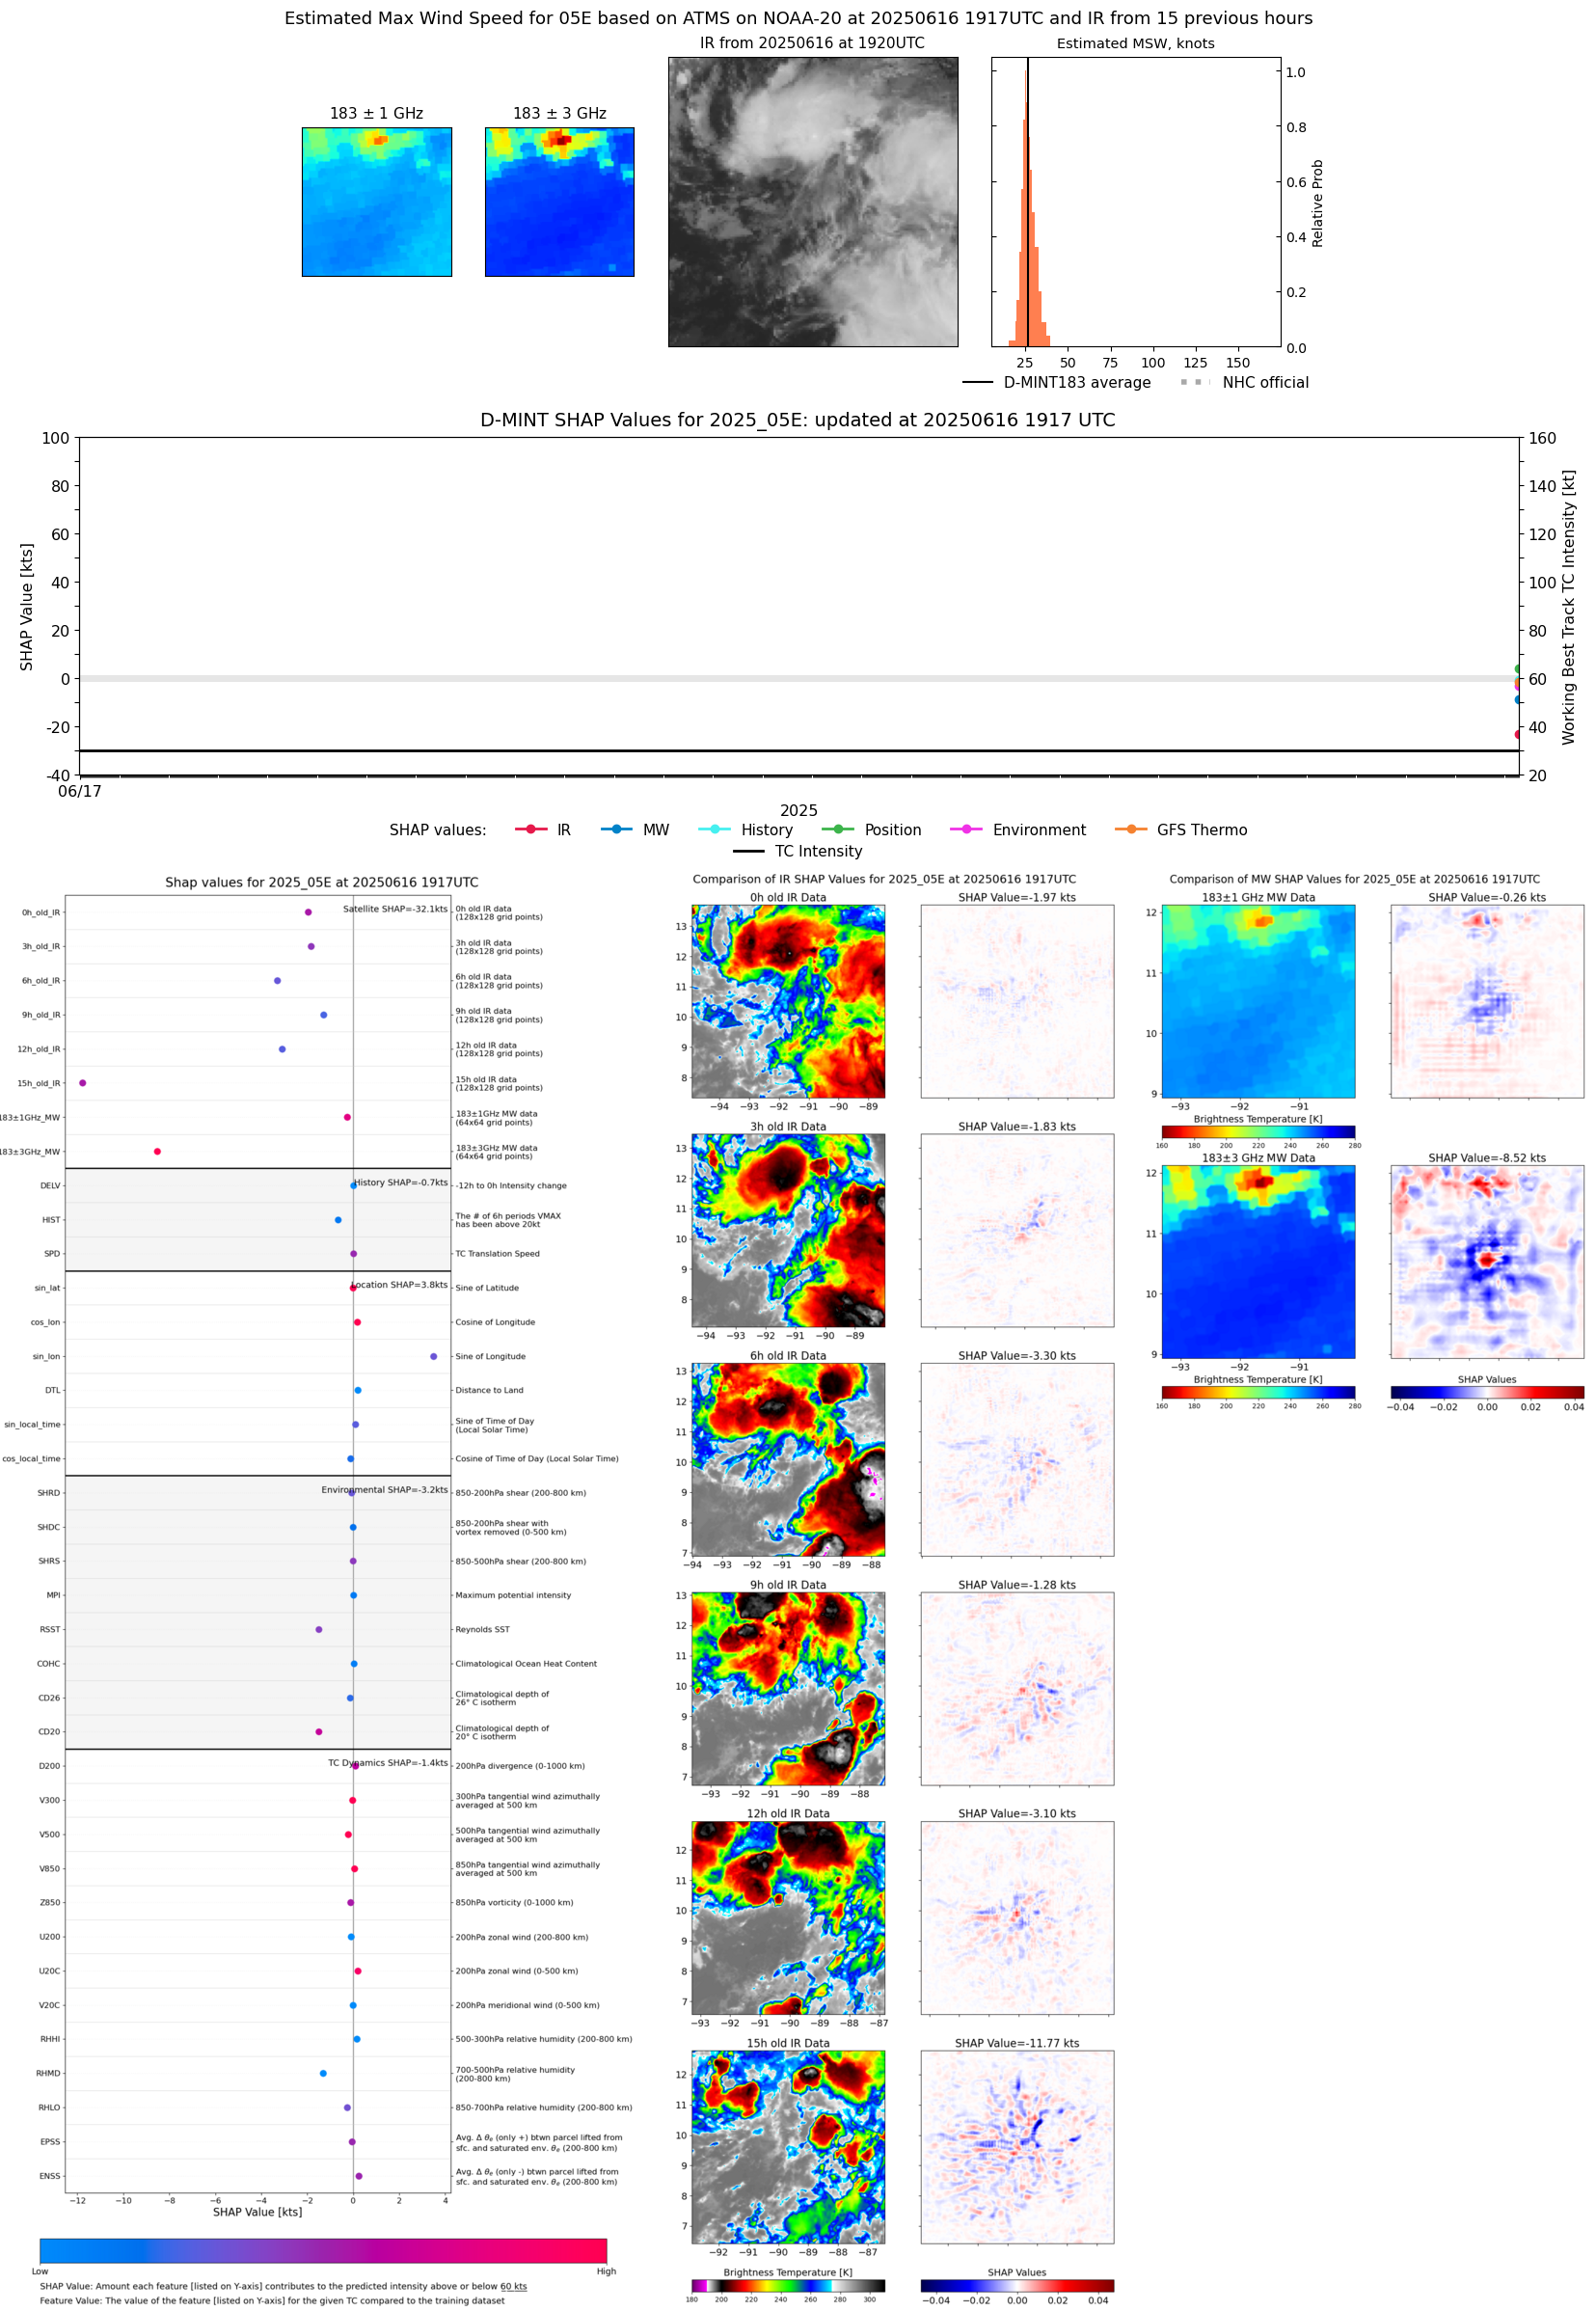 |
| 20250616 | 1245 UTC | SSMISF16 | NaN hPa | 23 kts | 21 kts | 26 kts | 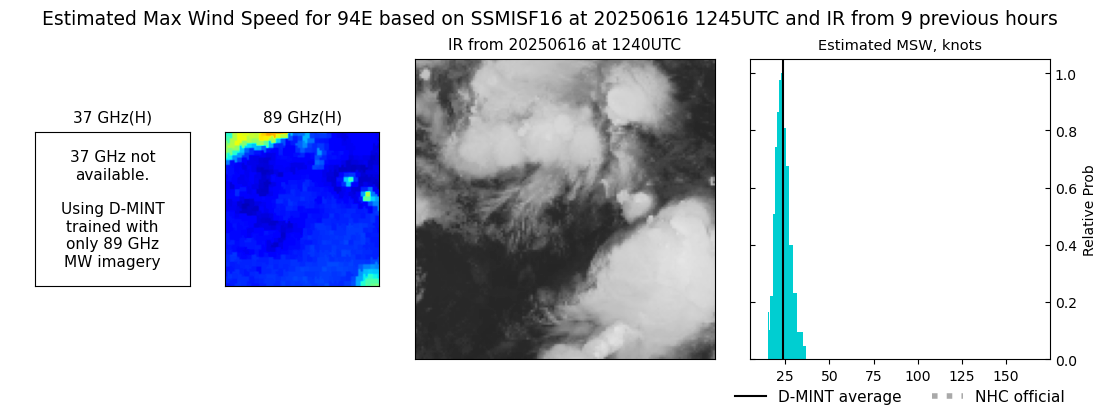 |
| 20250616 | 0744 UTC | ATMS-N20 | 1007 hPa | 0 kts | 0 kts | 0 kts | 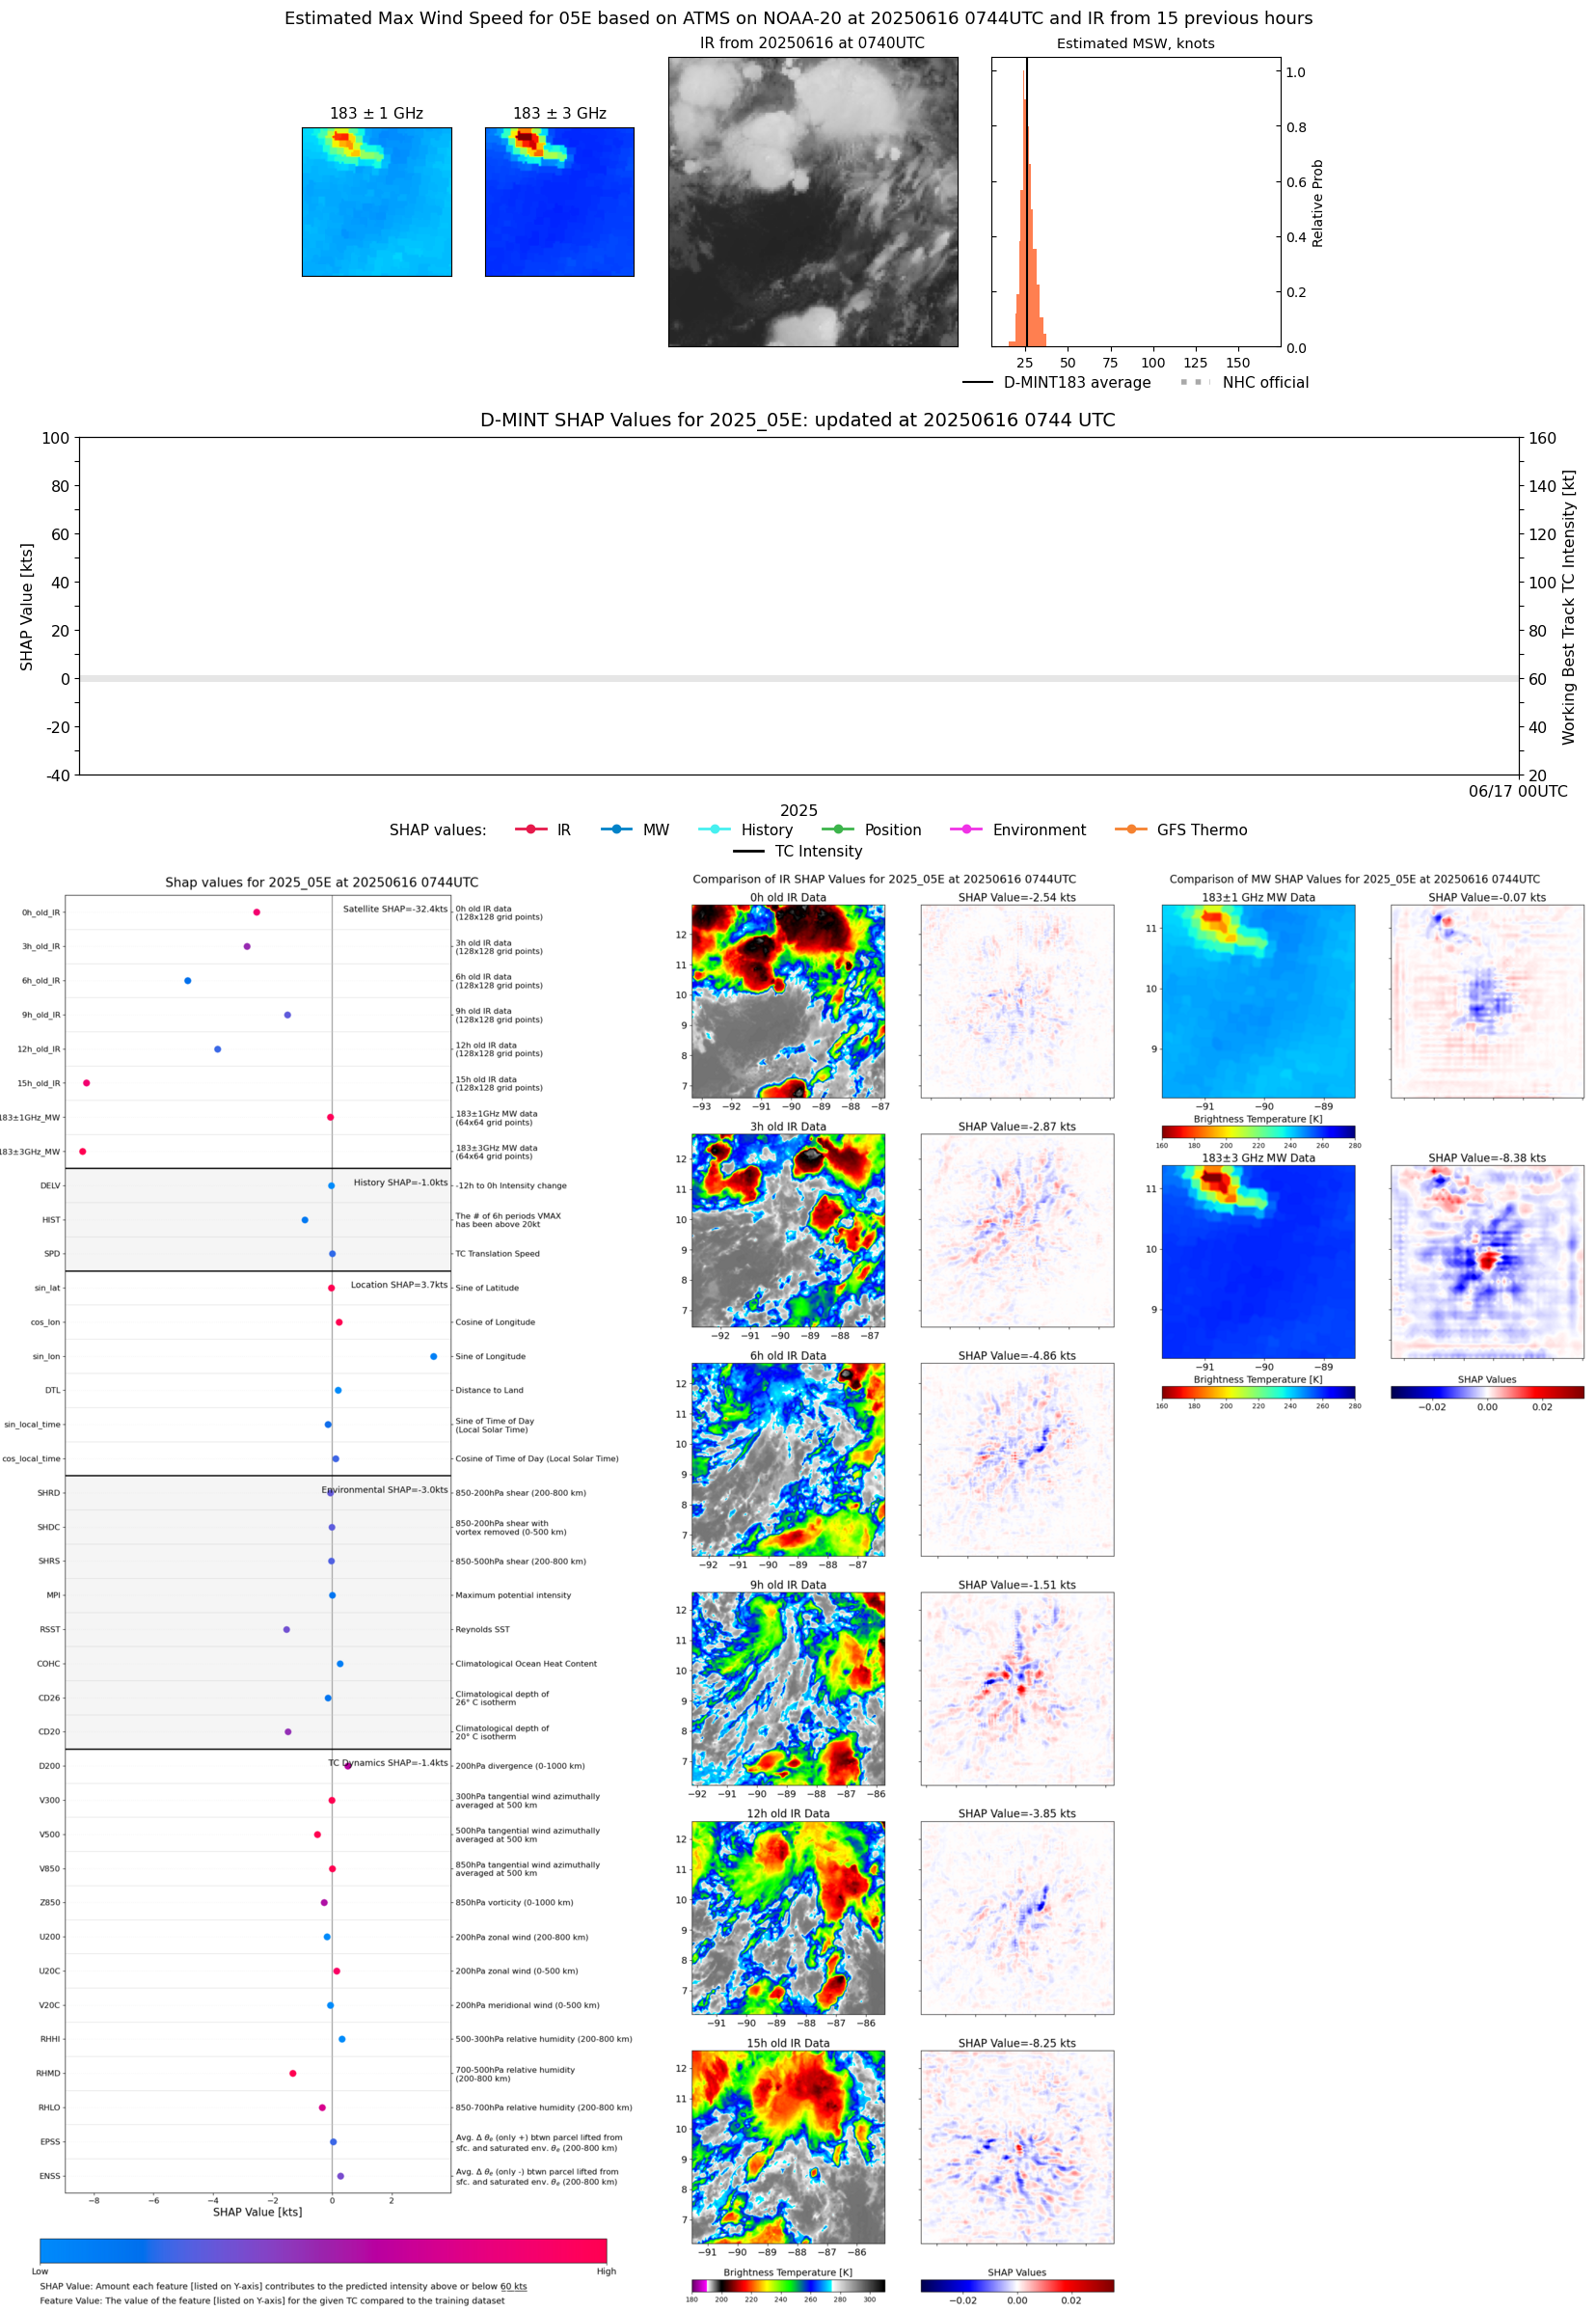 |
| 20250616 | 0738 UTC | AMSR2 | NaN hPa | 22 kts | 20 kts | 25 kts | 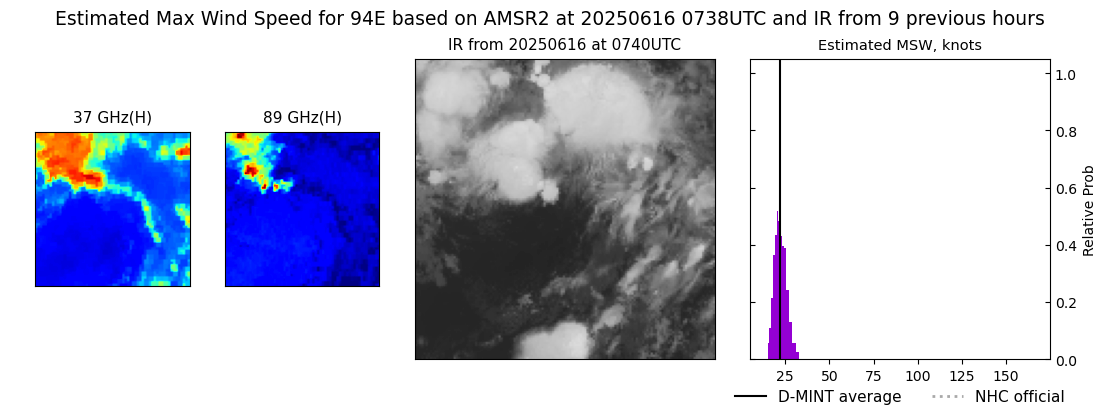 |
| 20250616 | 0615 UTC | GMI | NaN hPa | 21 kts | 19 kts | 23 kts |  |
| 20250616 | 0009 UTC | SSMISF17 | NaN hPa | 24 kts | 21 kts | 26 kts |  |
| 20250615 | 1922 UTC | AMSR2 | NaN hPa | 24 kts | 22 kts | 27 kts |  |
| 20250615 | 1841 UTC | GMI | NaN hPa | 25 kts | 23 kts | 28 kts | 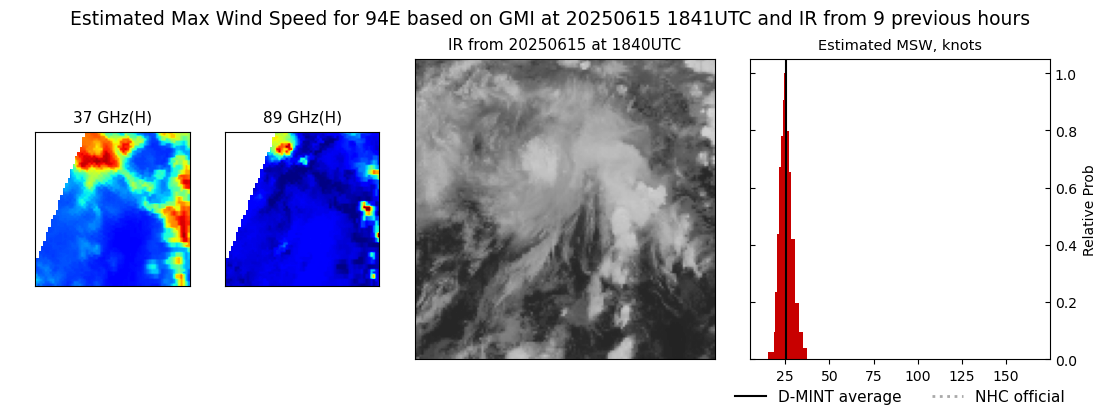 |
| 20250615 | 1359 UTC | TROPICS05 | 1007 hPa | 0 kts | 0 kts | 0 kts | 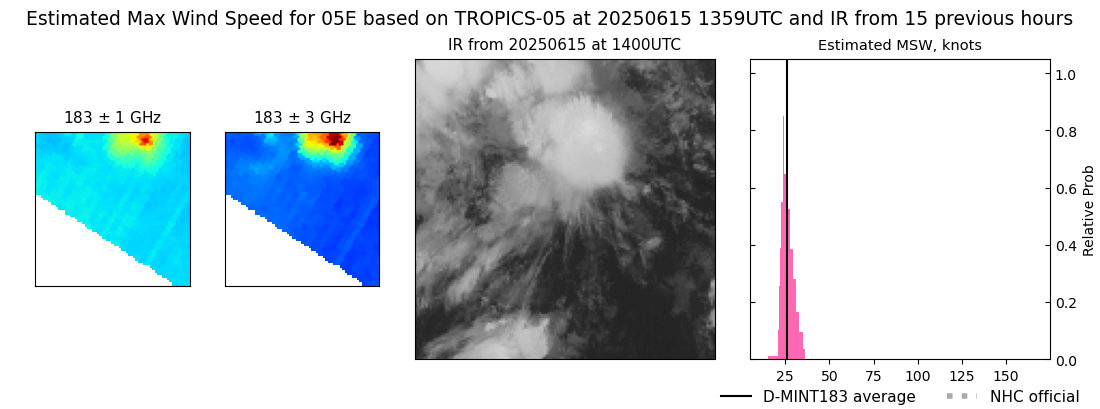 |
| 20250614 | 1925 UTC | GMI | NaN hPa | 23 kts | 20 kts | 25 kts |  |