|
||

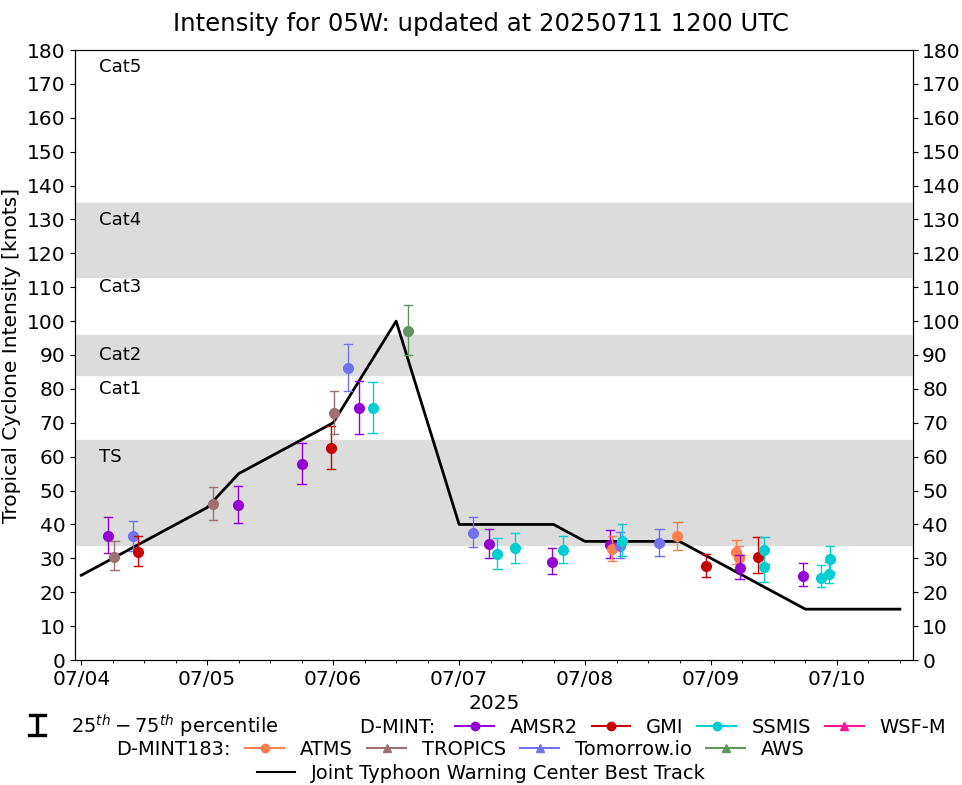 |
D-MINT HISTORY FILE for 2025_05W
| Date | Time | MW Sensor | MSLP | Vmax (30th-70th percentile average) | Vmax 25th percentile | Vmax 75th percentile | Image |
| 20250709 | 2240 UTC | SSMISF16 | NaN hPa | 30 kts | 26 kts | 34 kts |  |
| 20250709 | 2231 UTC | SSMISF17 | NaN hPa | 25 kts | 23 kts | 29 kts | 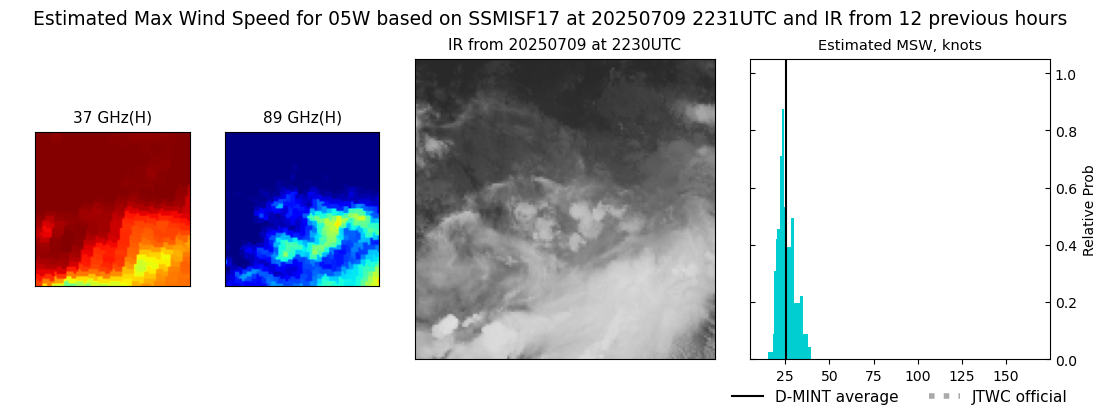 |
| 20250709 | 2101 UTC | SSMISF18 | NaN hPa | 24 kts | 21 kts | 28 kts |  |
| 20250709 | 1734 UTC | AMSR2 | NaN hPa | 25 kts | 22 kts | 29 kts |  |
| 20250709 | 1010 UTC | SSMISF16 | NaN hPa | 32 kts | 28 kts | 36 kts |  |
| 20250709 | 1001 UTC | SSMISF17 | NaN hPa | 27 kts | 23 kts | 33 kts |  |
| 20250709 | 0853 UTC | GMI | NaN hPa | 30 kts | 26 kts | 36 kts | 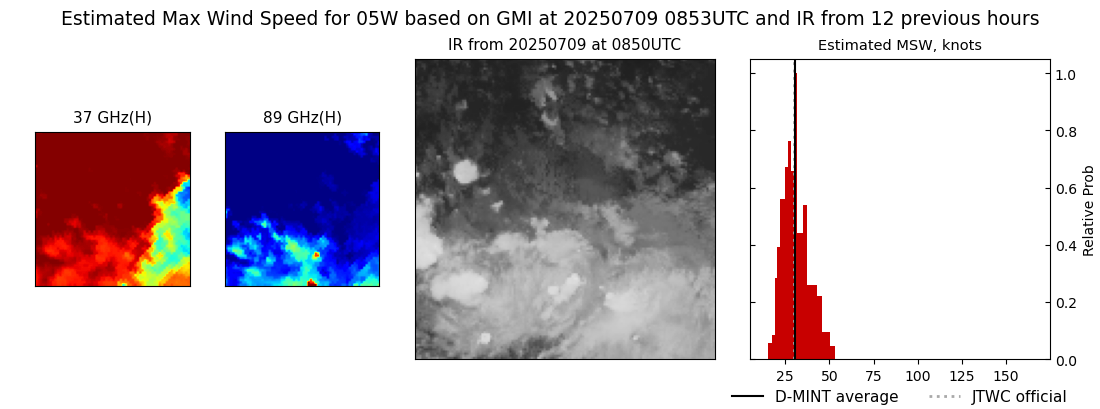 |
| 20250709 | 0526 UTC | AMSR2 | 992 hPa | 27 kts | 24 kts | 31 kts | 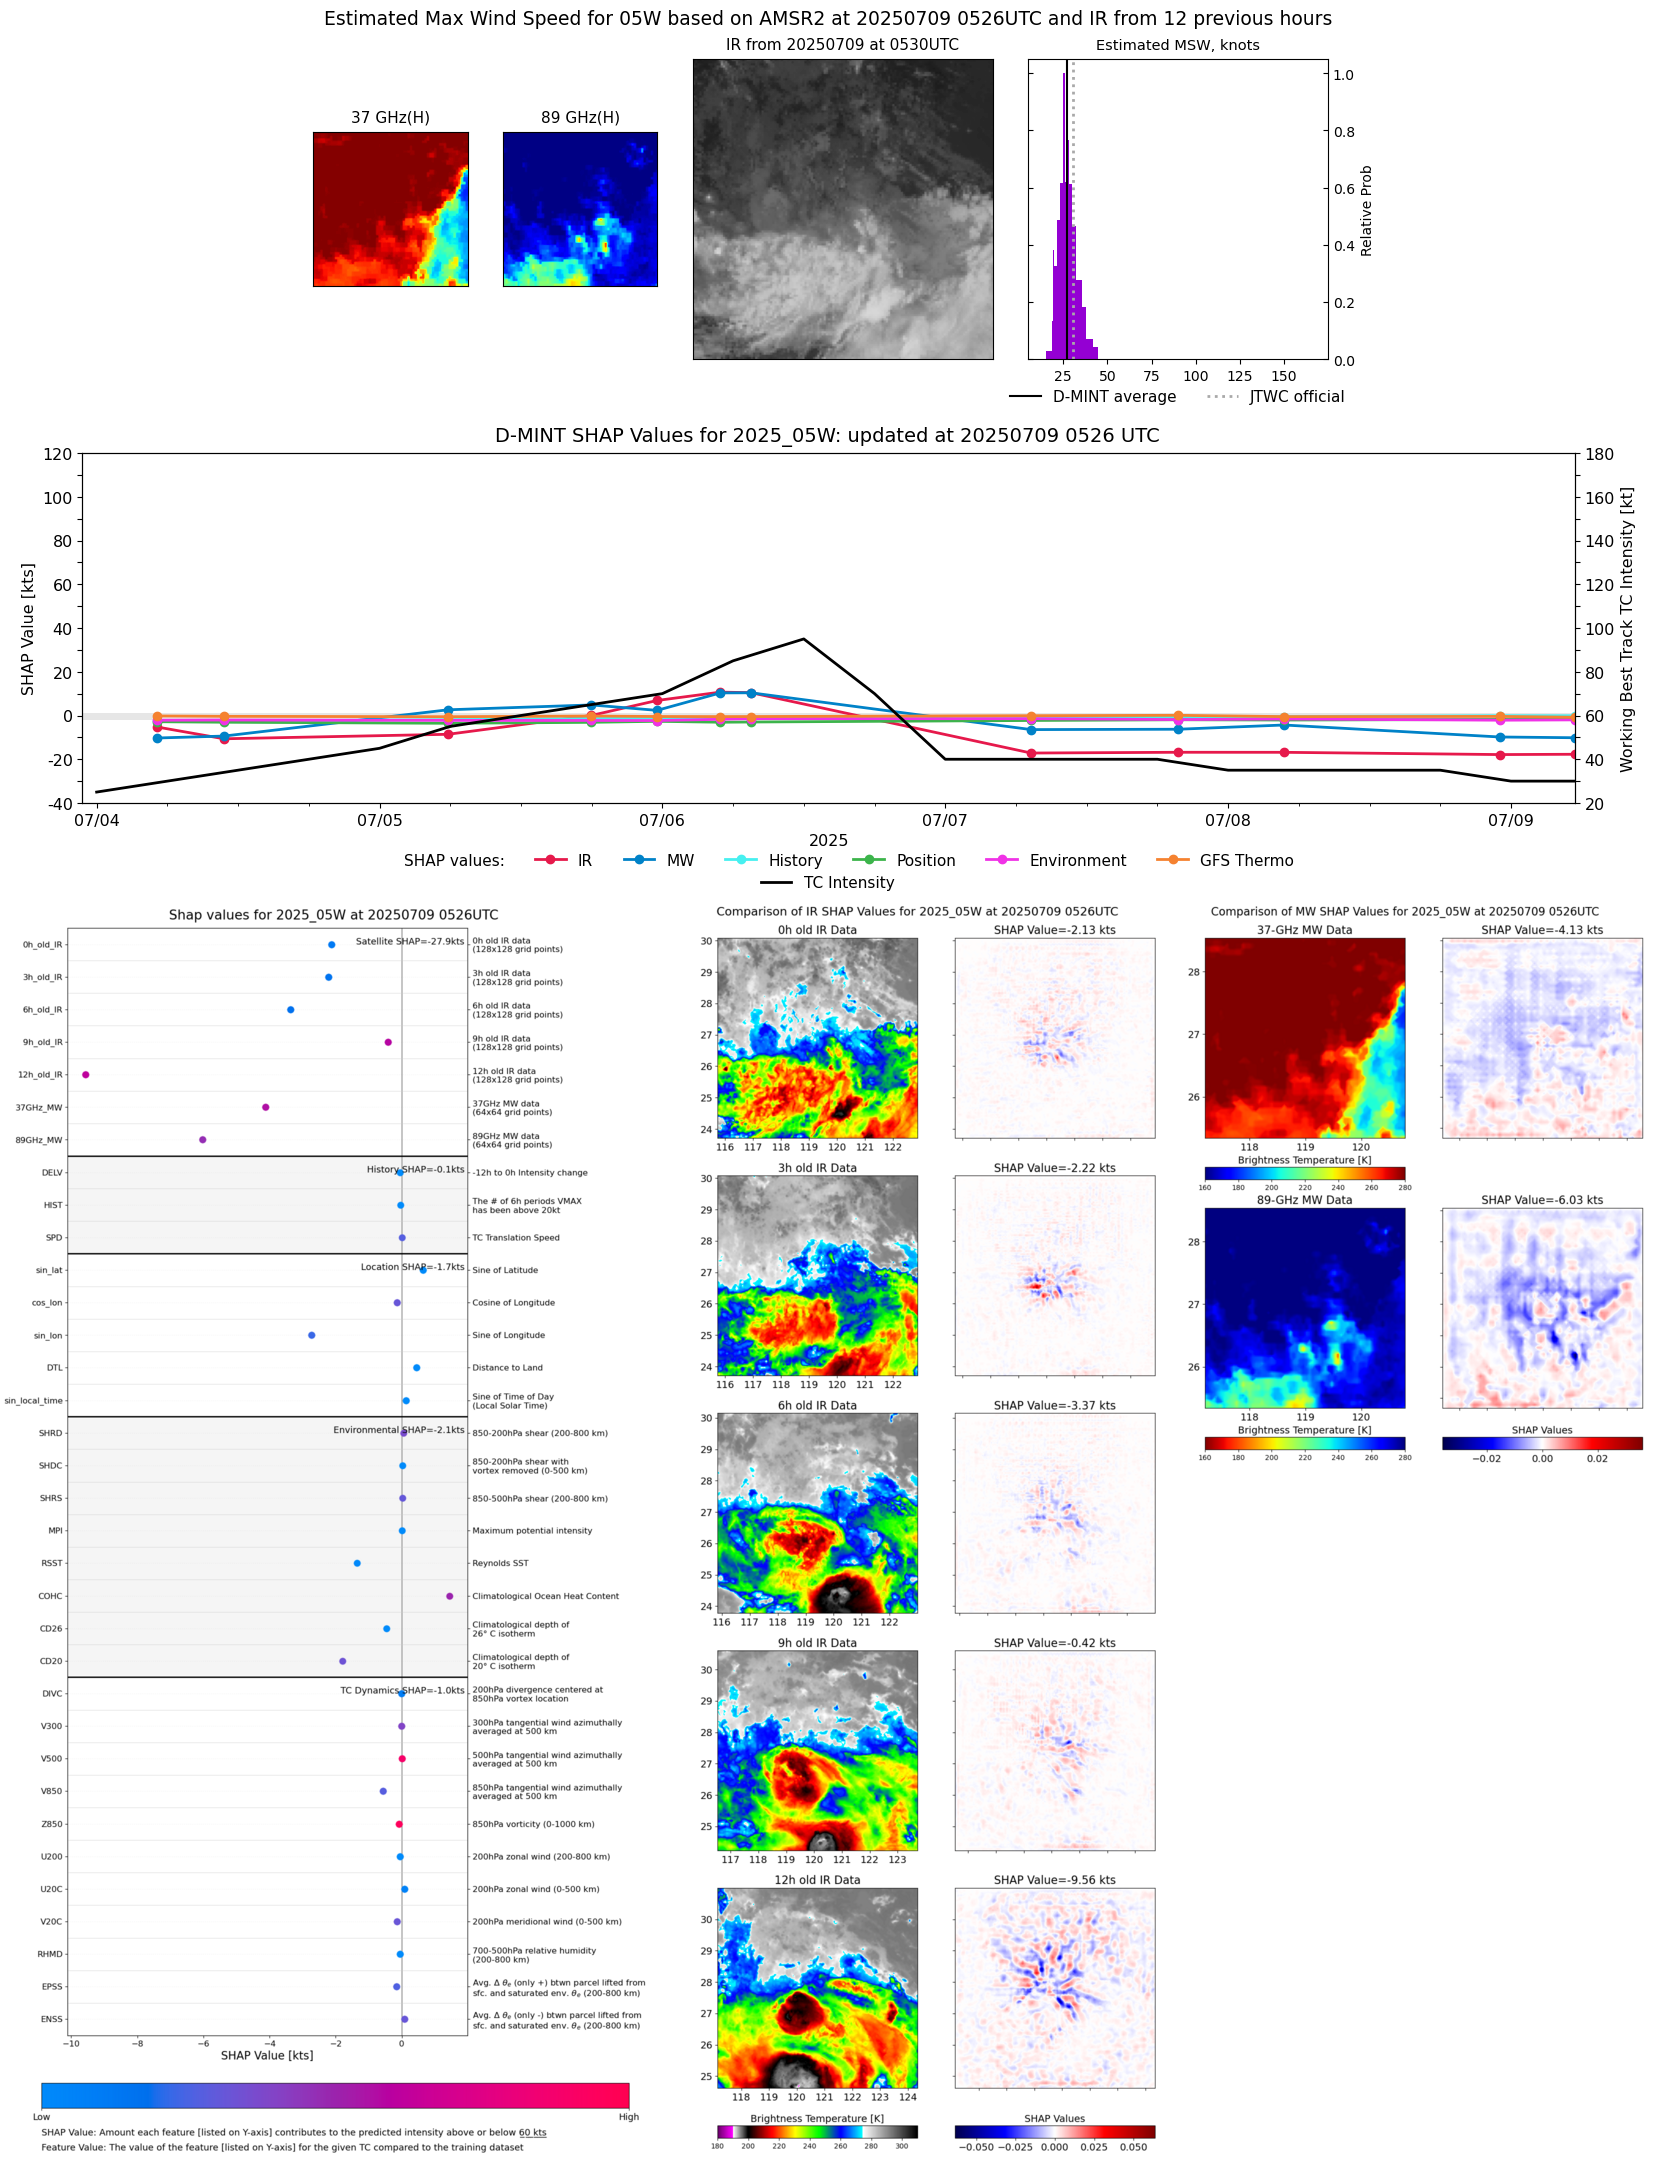 |
| 20250709 | 0518 UTC | ATMS-NPP | 990 hPa | 30 kts | 27 kts | 34 kts |  |
| 20250709 | 0451 UTC | ATMS-N21 | 989 hPa | 32 kts | 28 kts | 35 kts | 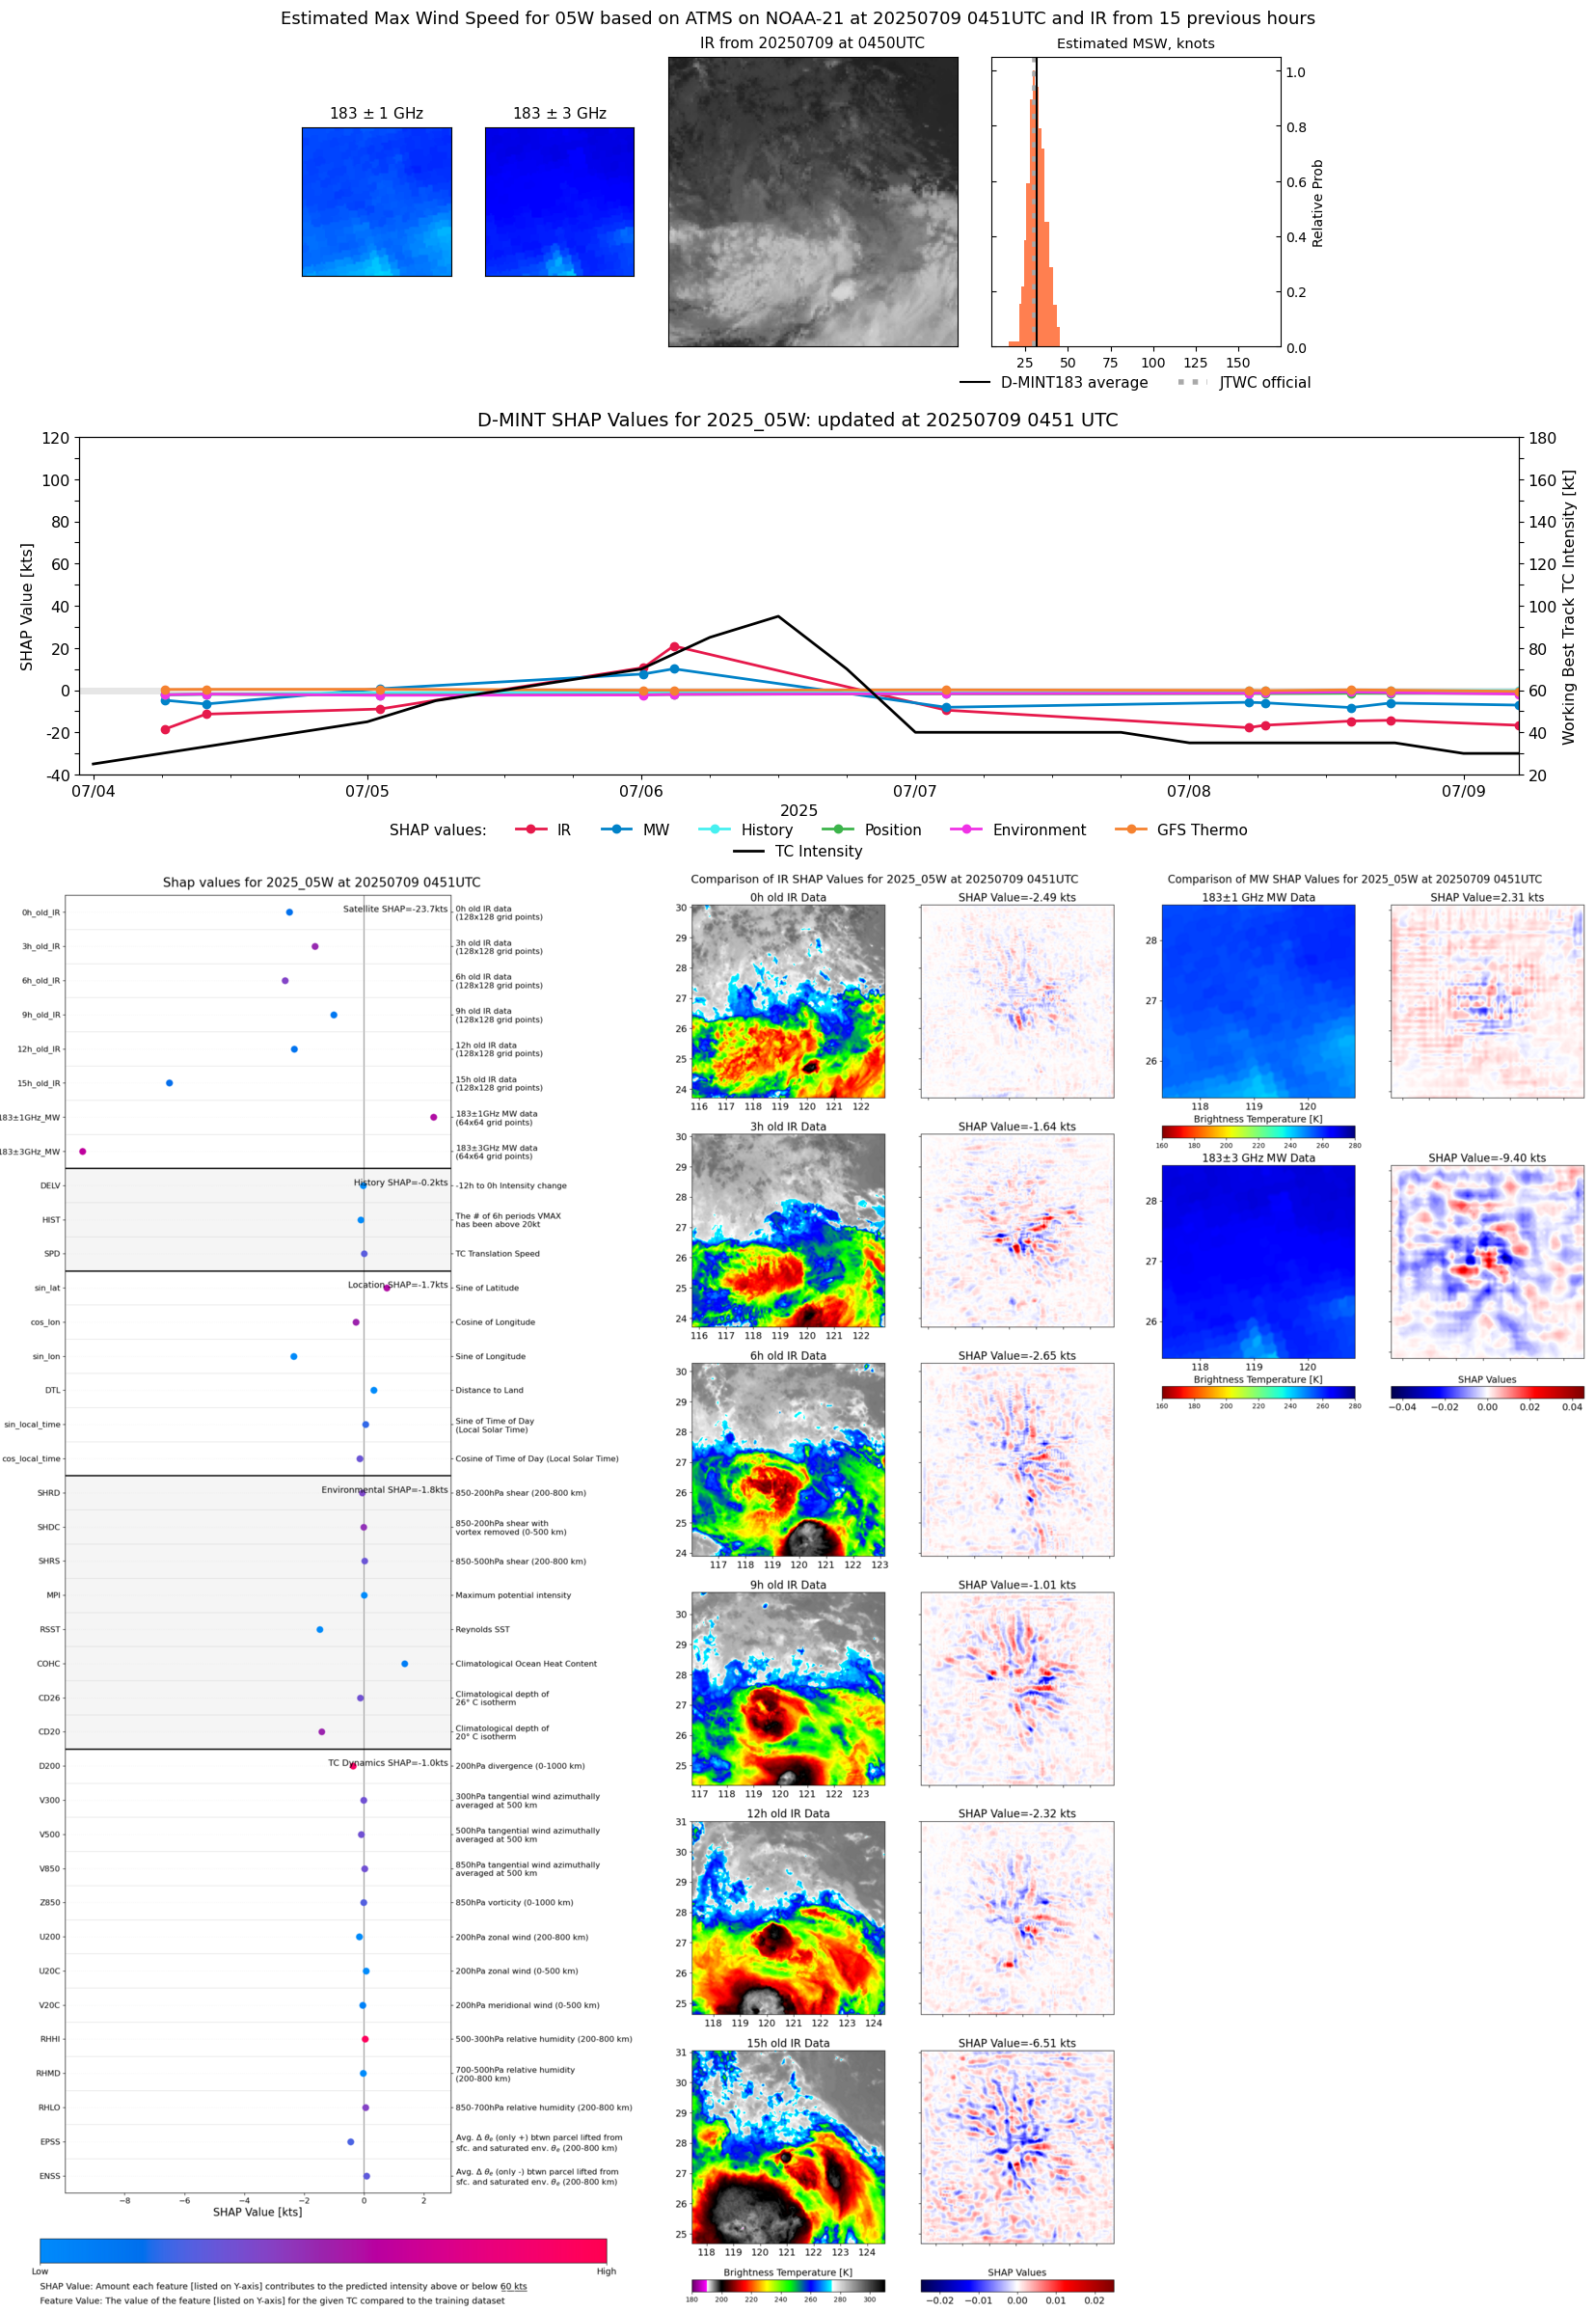 |
| 20250708 | 2303 UTC | GMI | 993 hPa | 28 kts | 24 kts | 31 kts |  |
| 20250708 | 1735 UTC | ATMS-N21 | 987 hPa | 36 kts | 32 kts | 41 kts |  |
| 20250708 | 1410 UTC | TMS02 | 989 hPa | 34 kts | 31 kts | 39 kts | 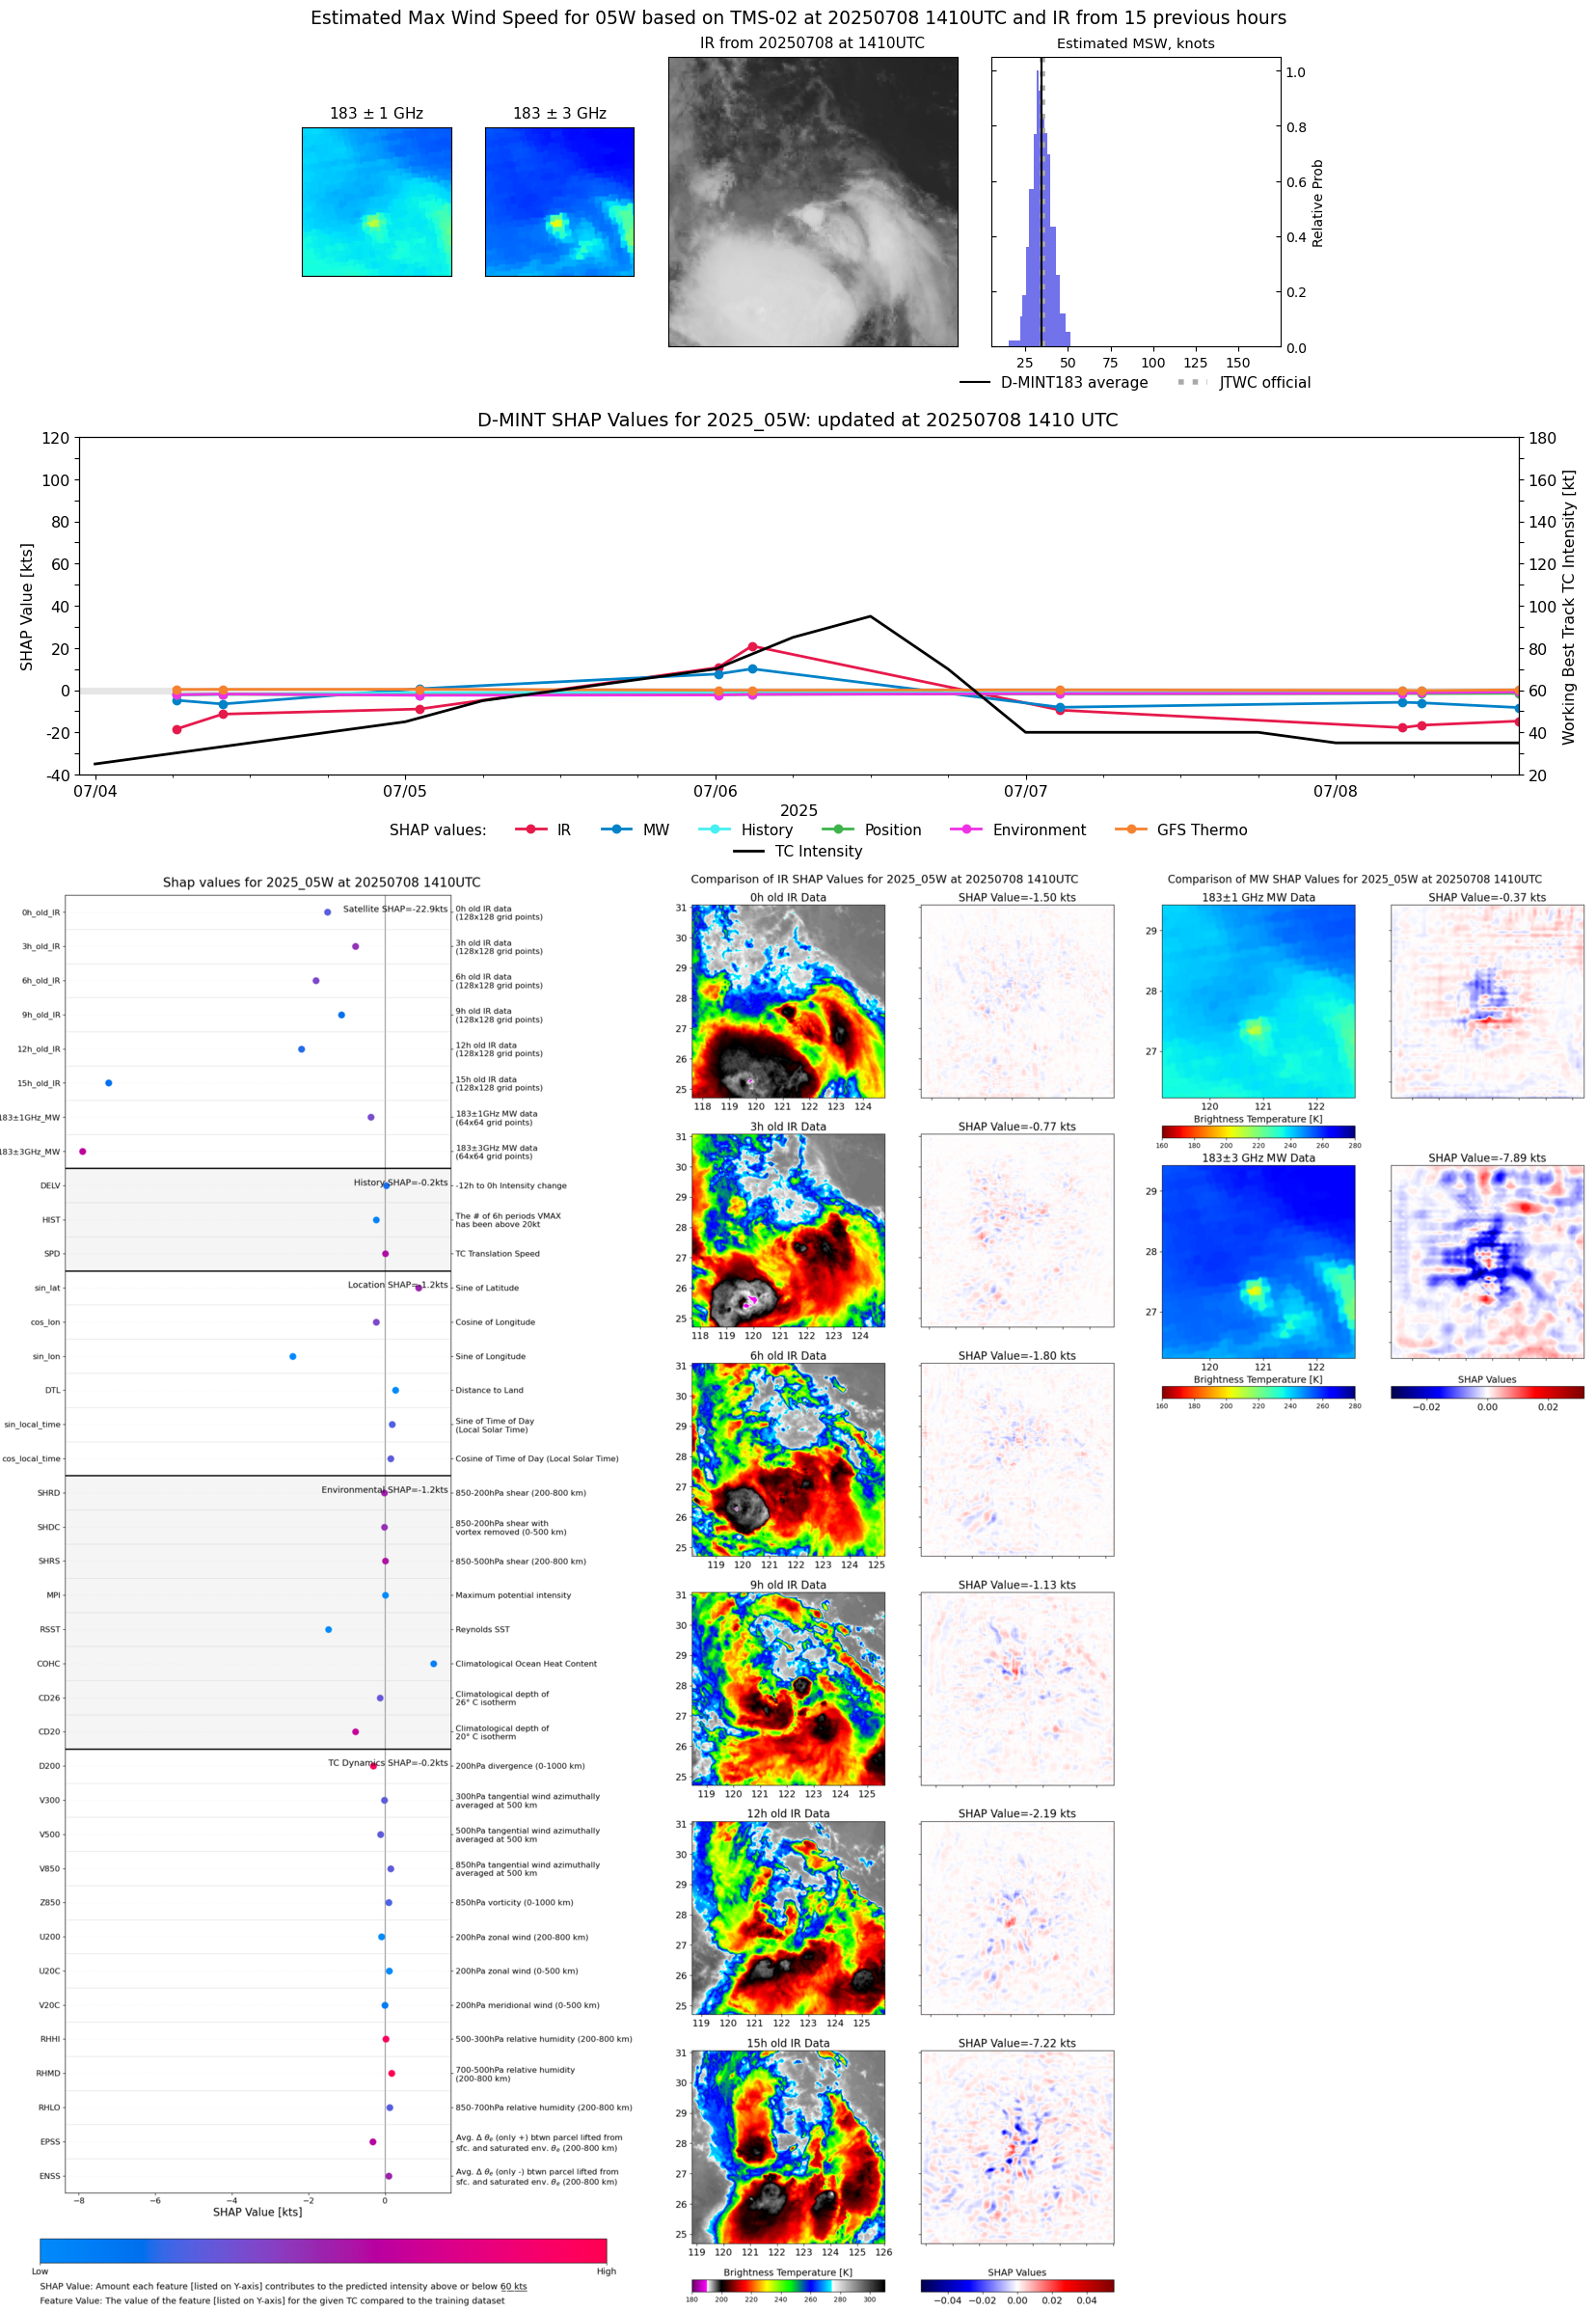 |
| 20250708 | 0704 UTC | SSMISF18 | 988 hPa | 35 kts | 31 kts | 40 kts |  |
| 20250708 | 0638 UTC | TMS03 | 991 hPa | 34 kts | 30 kts | 38 kts | 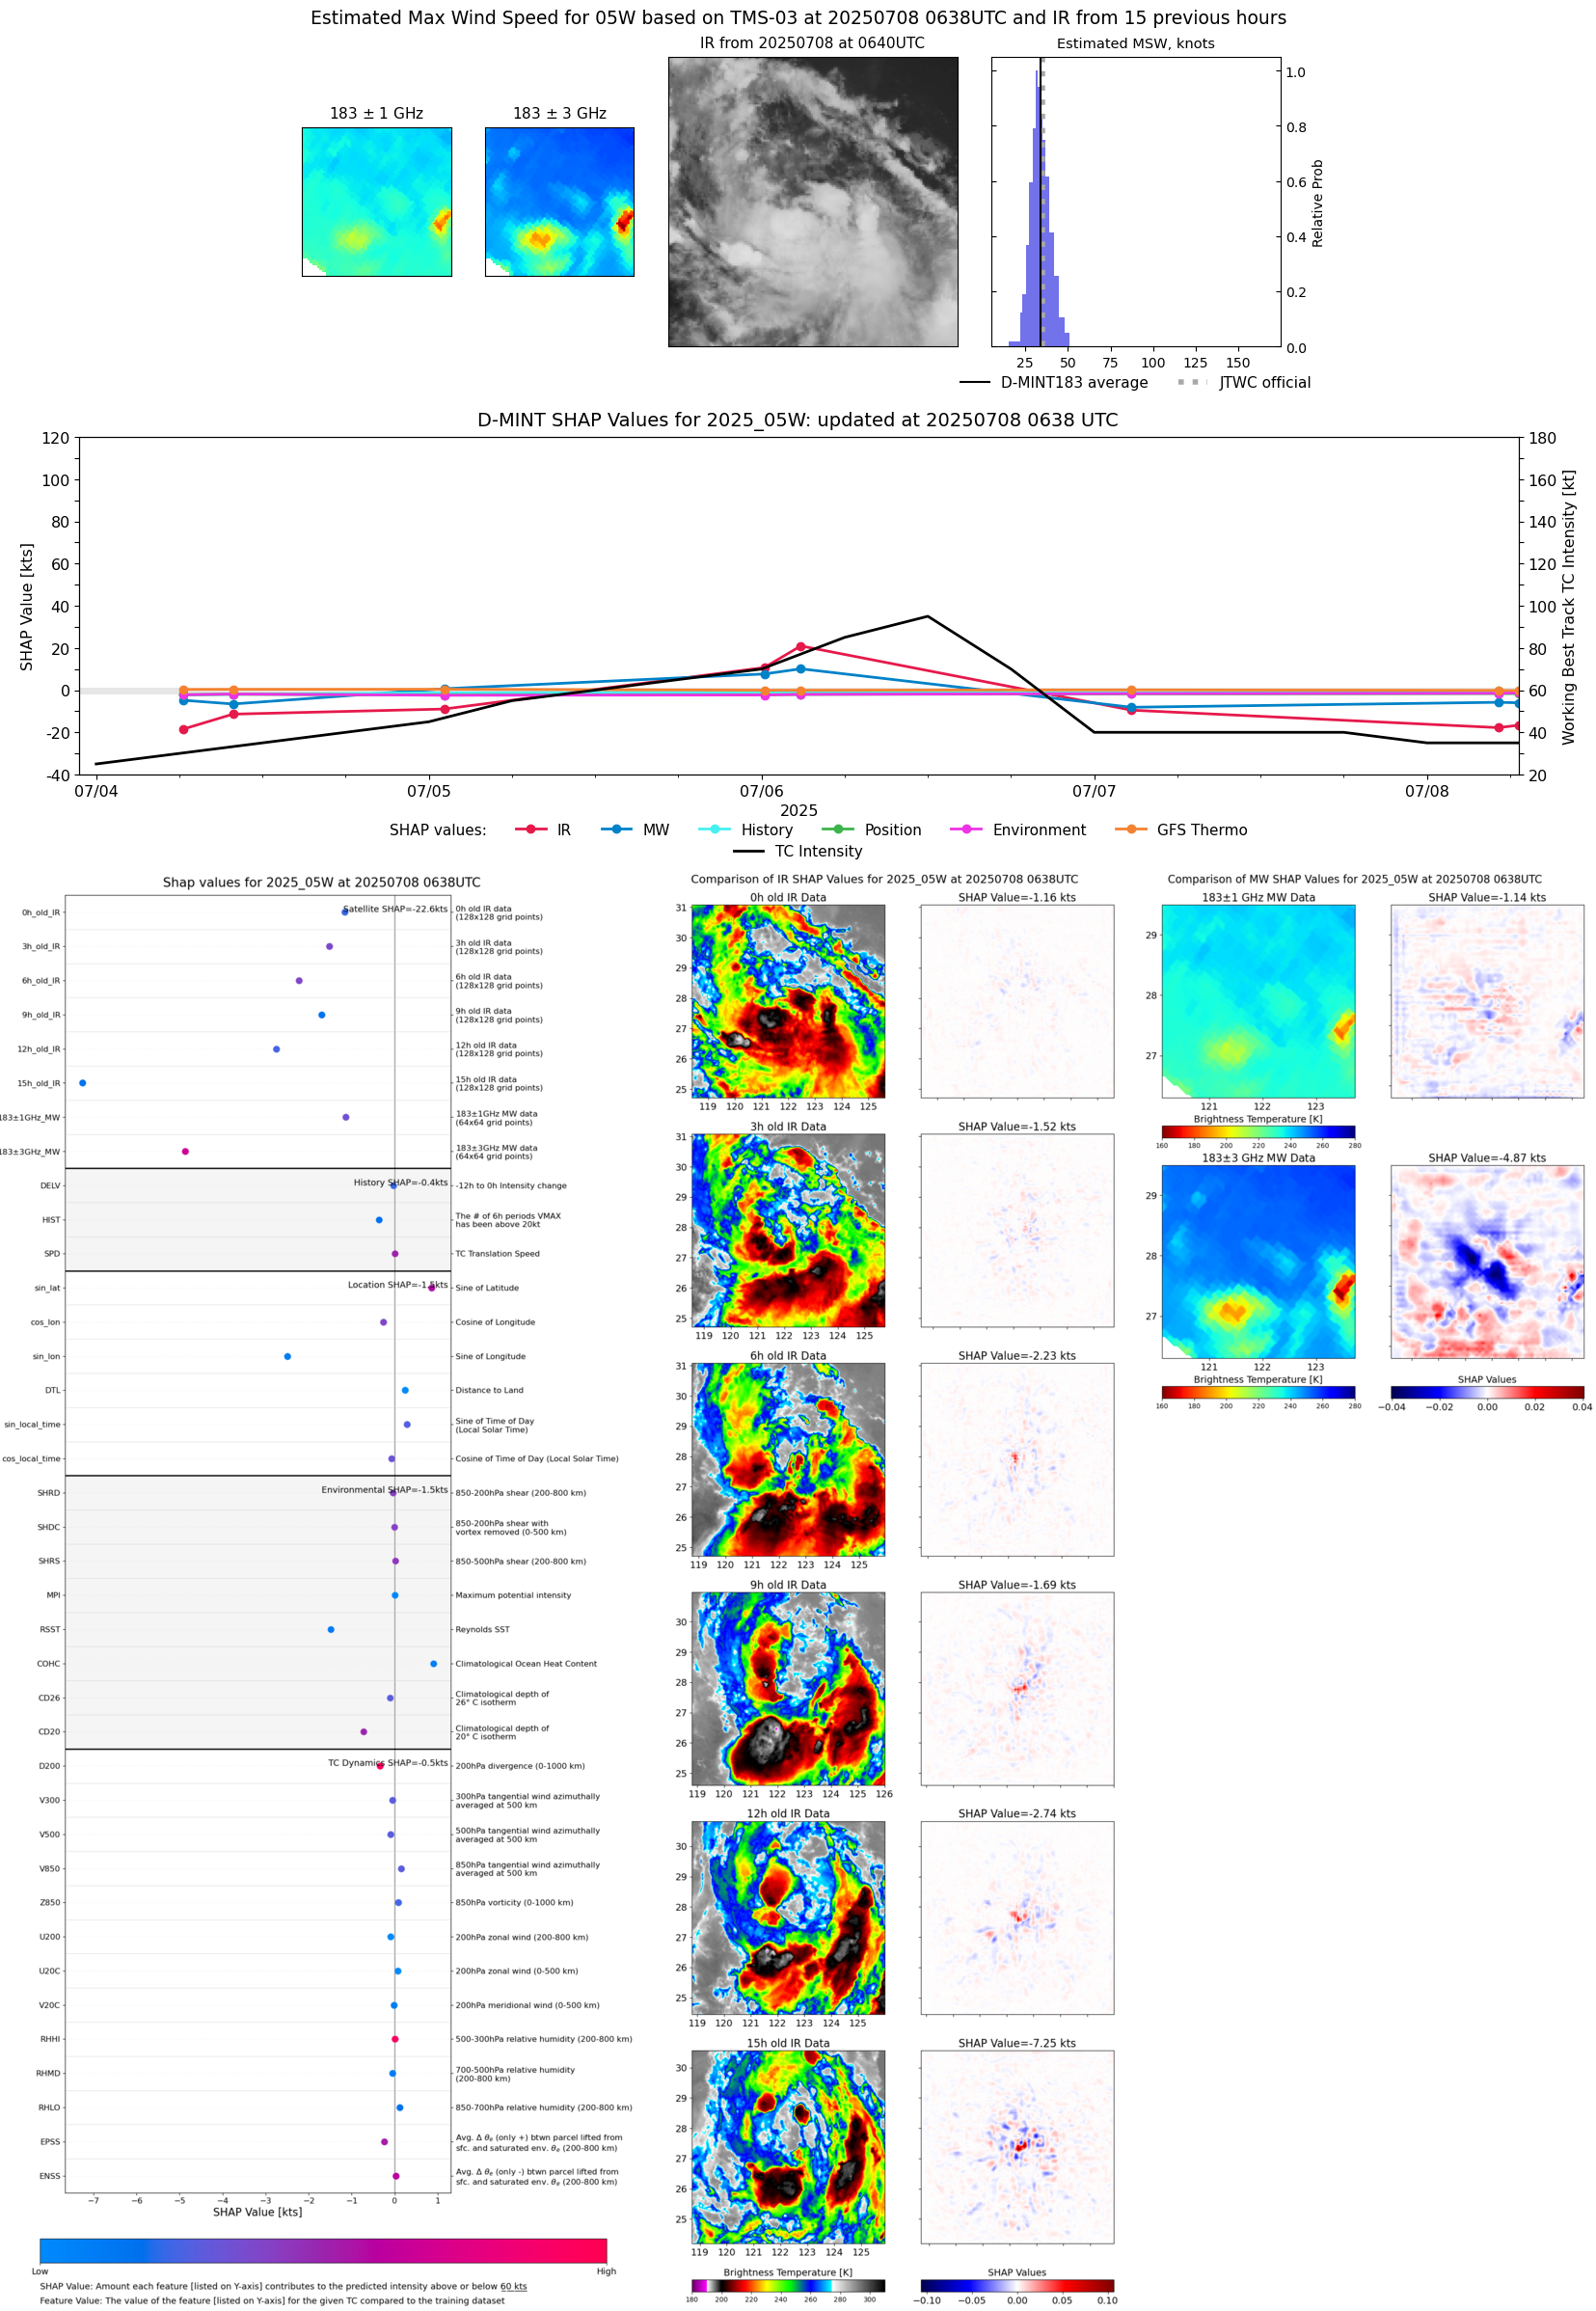 |
| 20250708 | 0510 UTC | ATMS-N21 | 993 hPa | 33 kts | 29 kts | 37 kts | 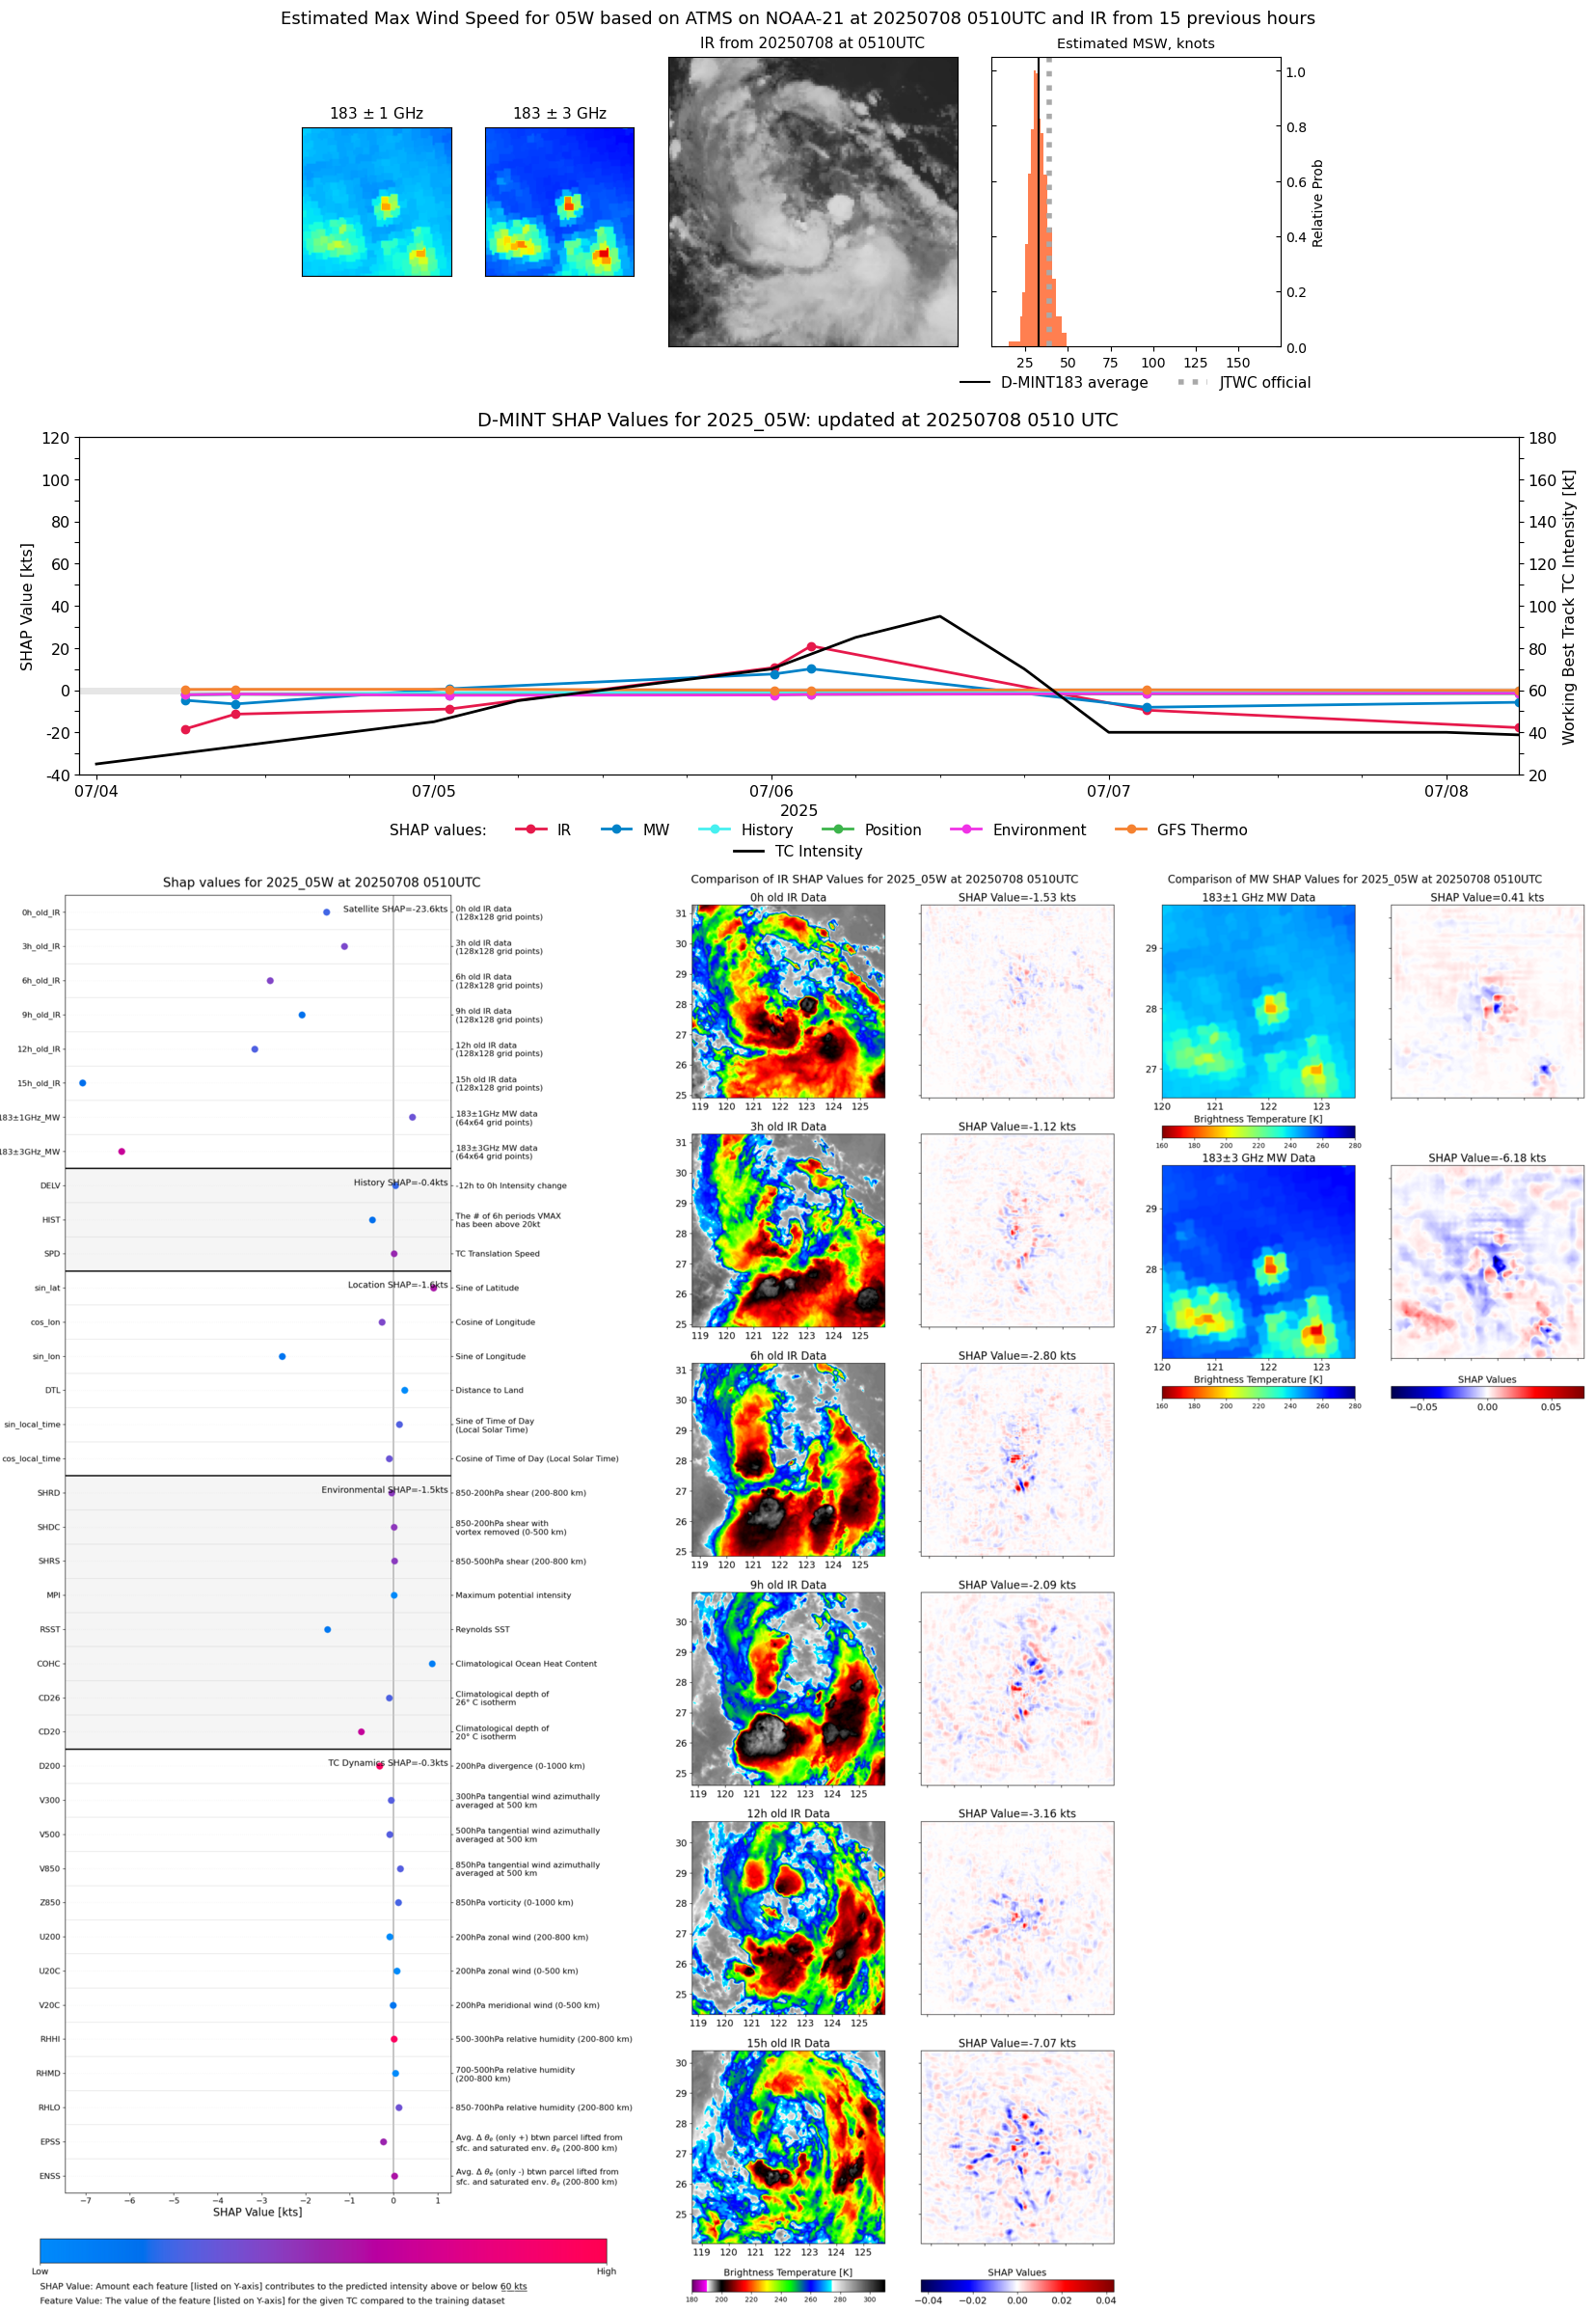 |
| 20250708 | 0444 UTC | AMSR2 | 990 hPa | 34 kts | 30 kts | 38 kts | 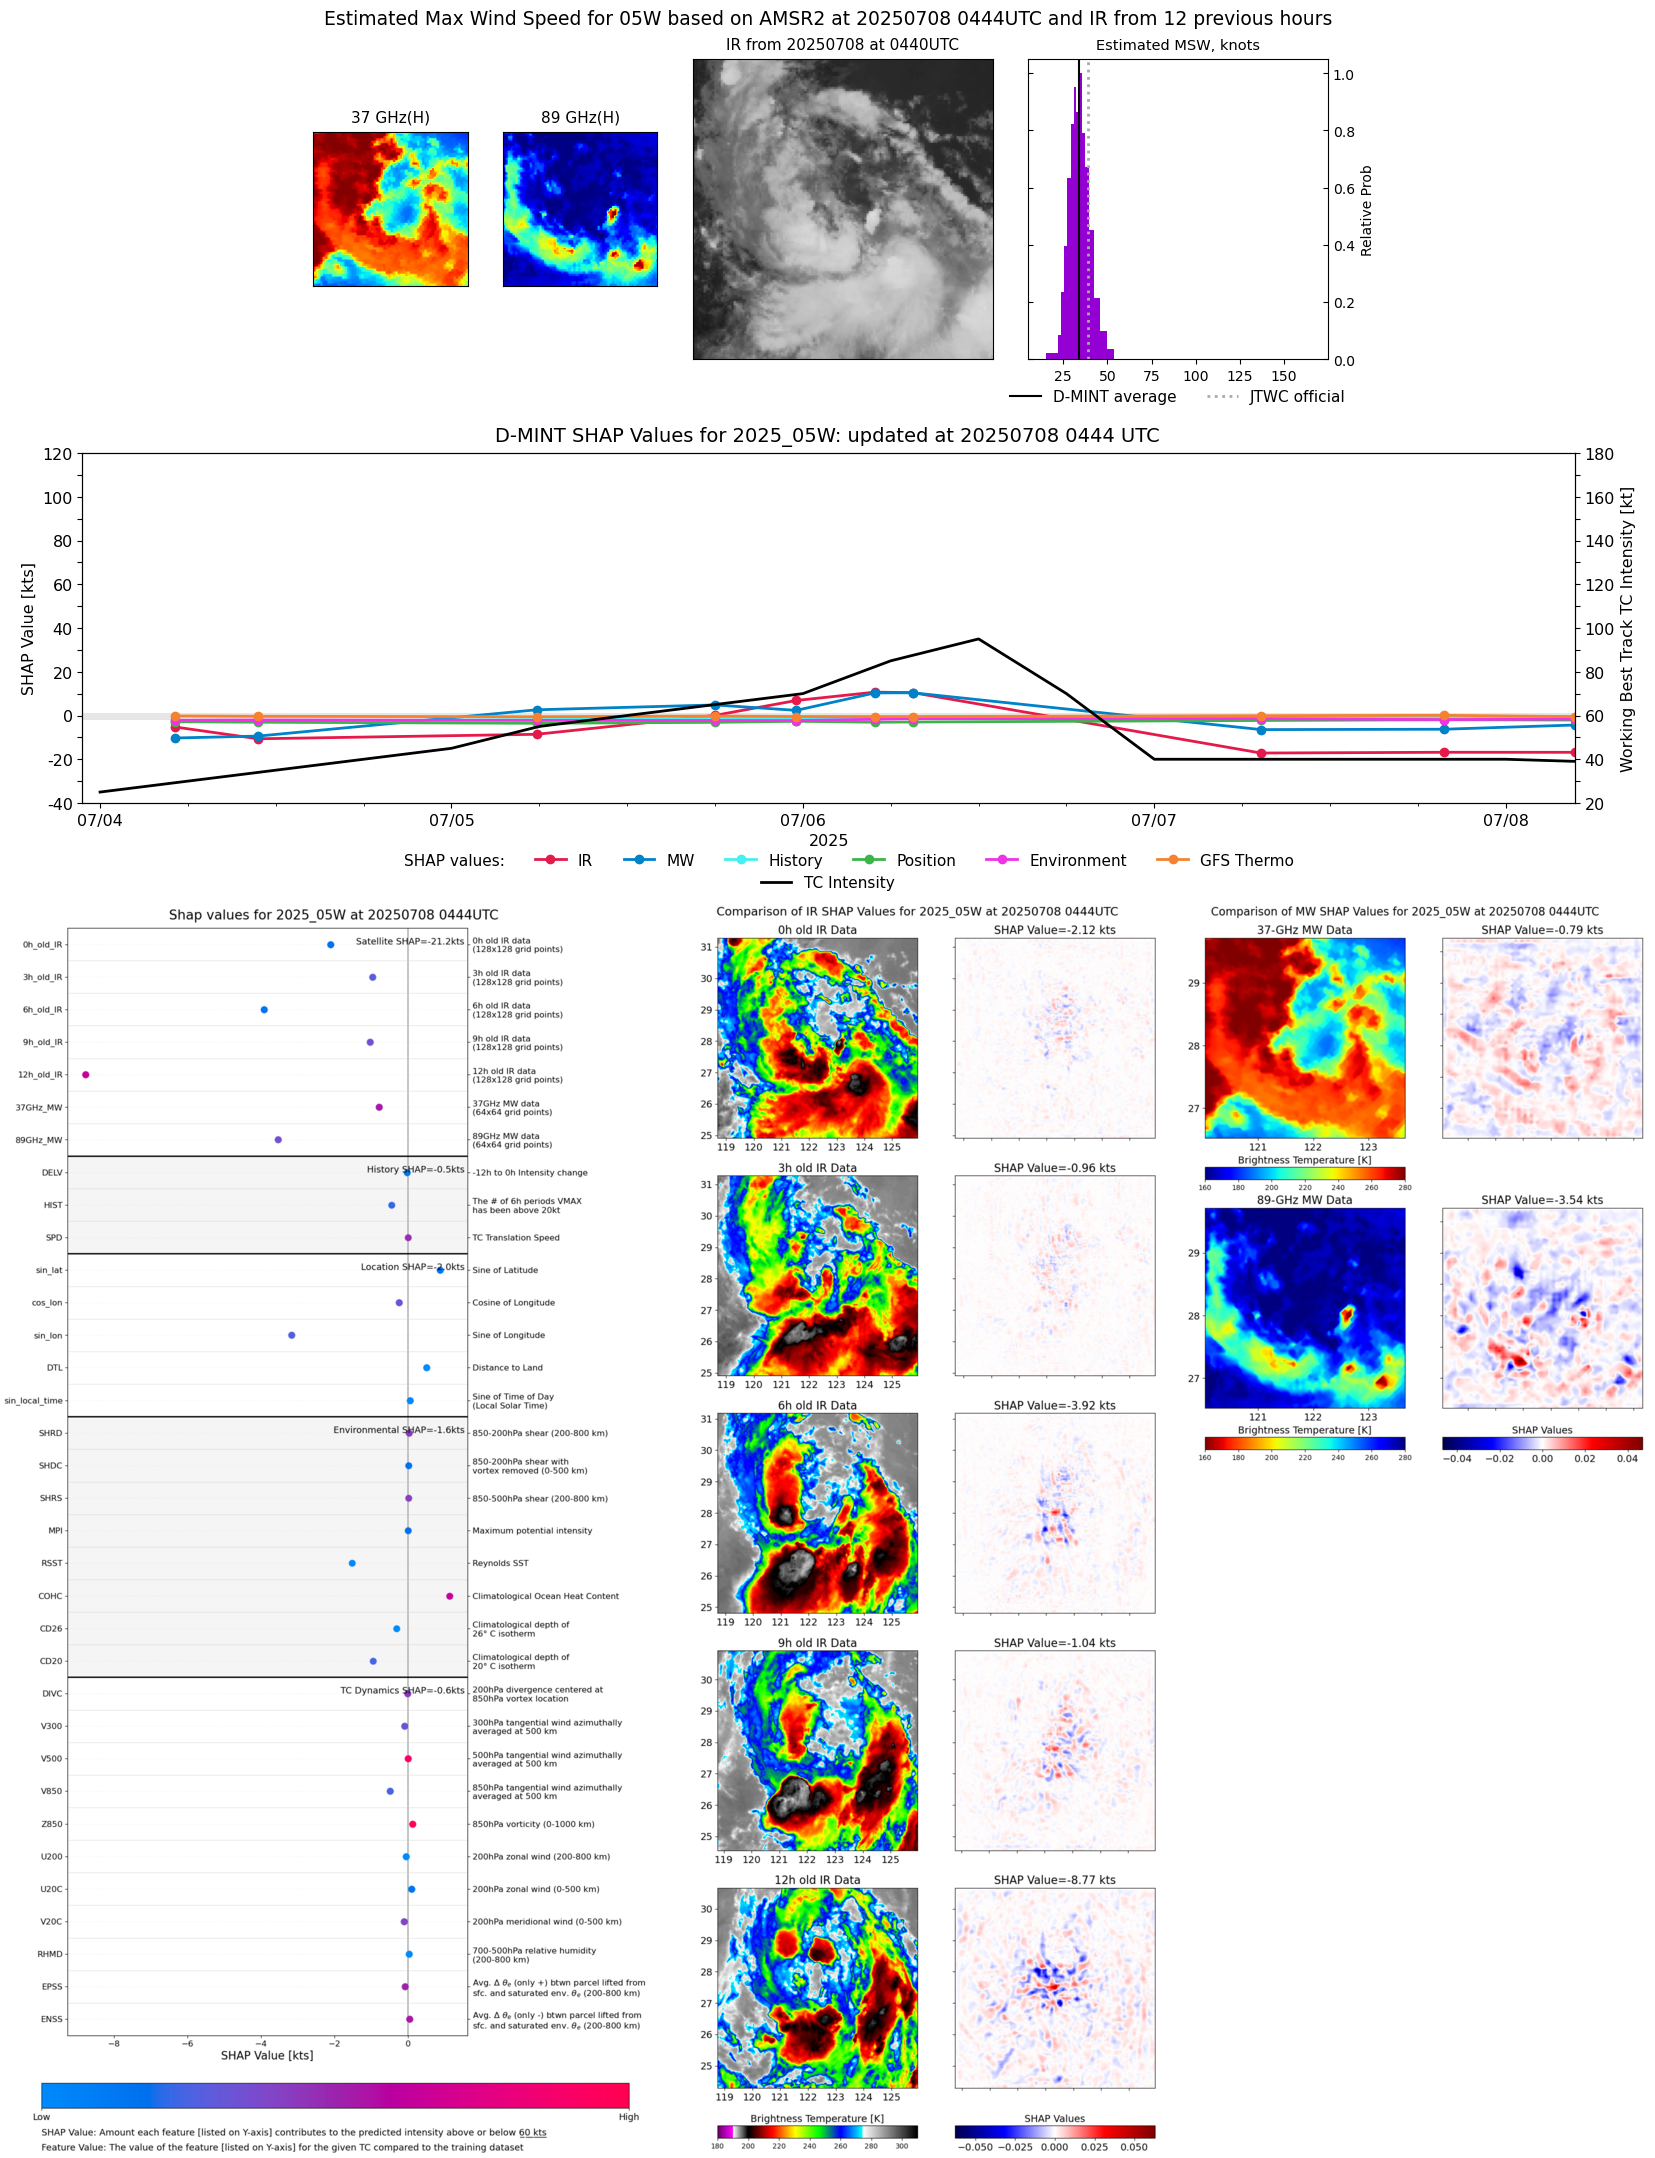 |
| 20250707 | 1947 UTC | SSMISF18 | 989 hPa | 33 kts | 29 kts | 37 kts | 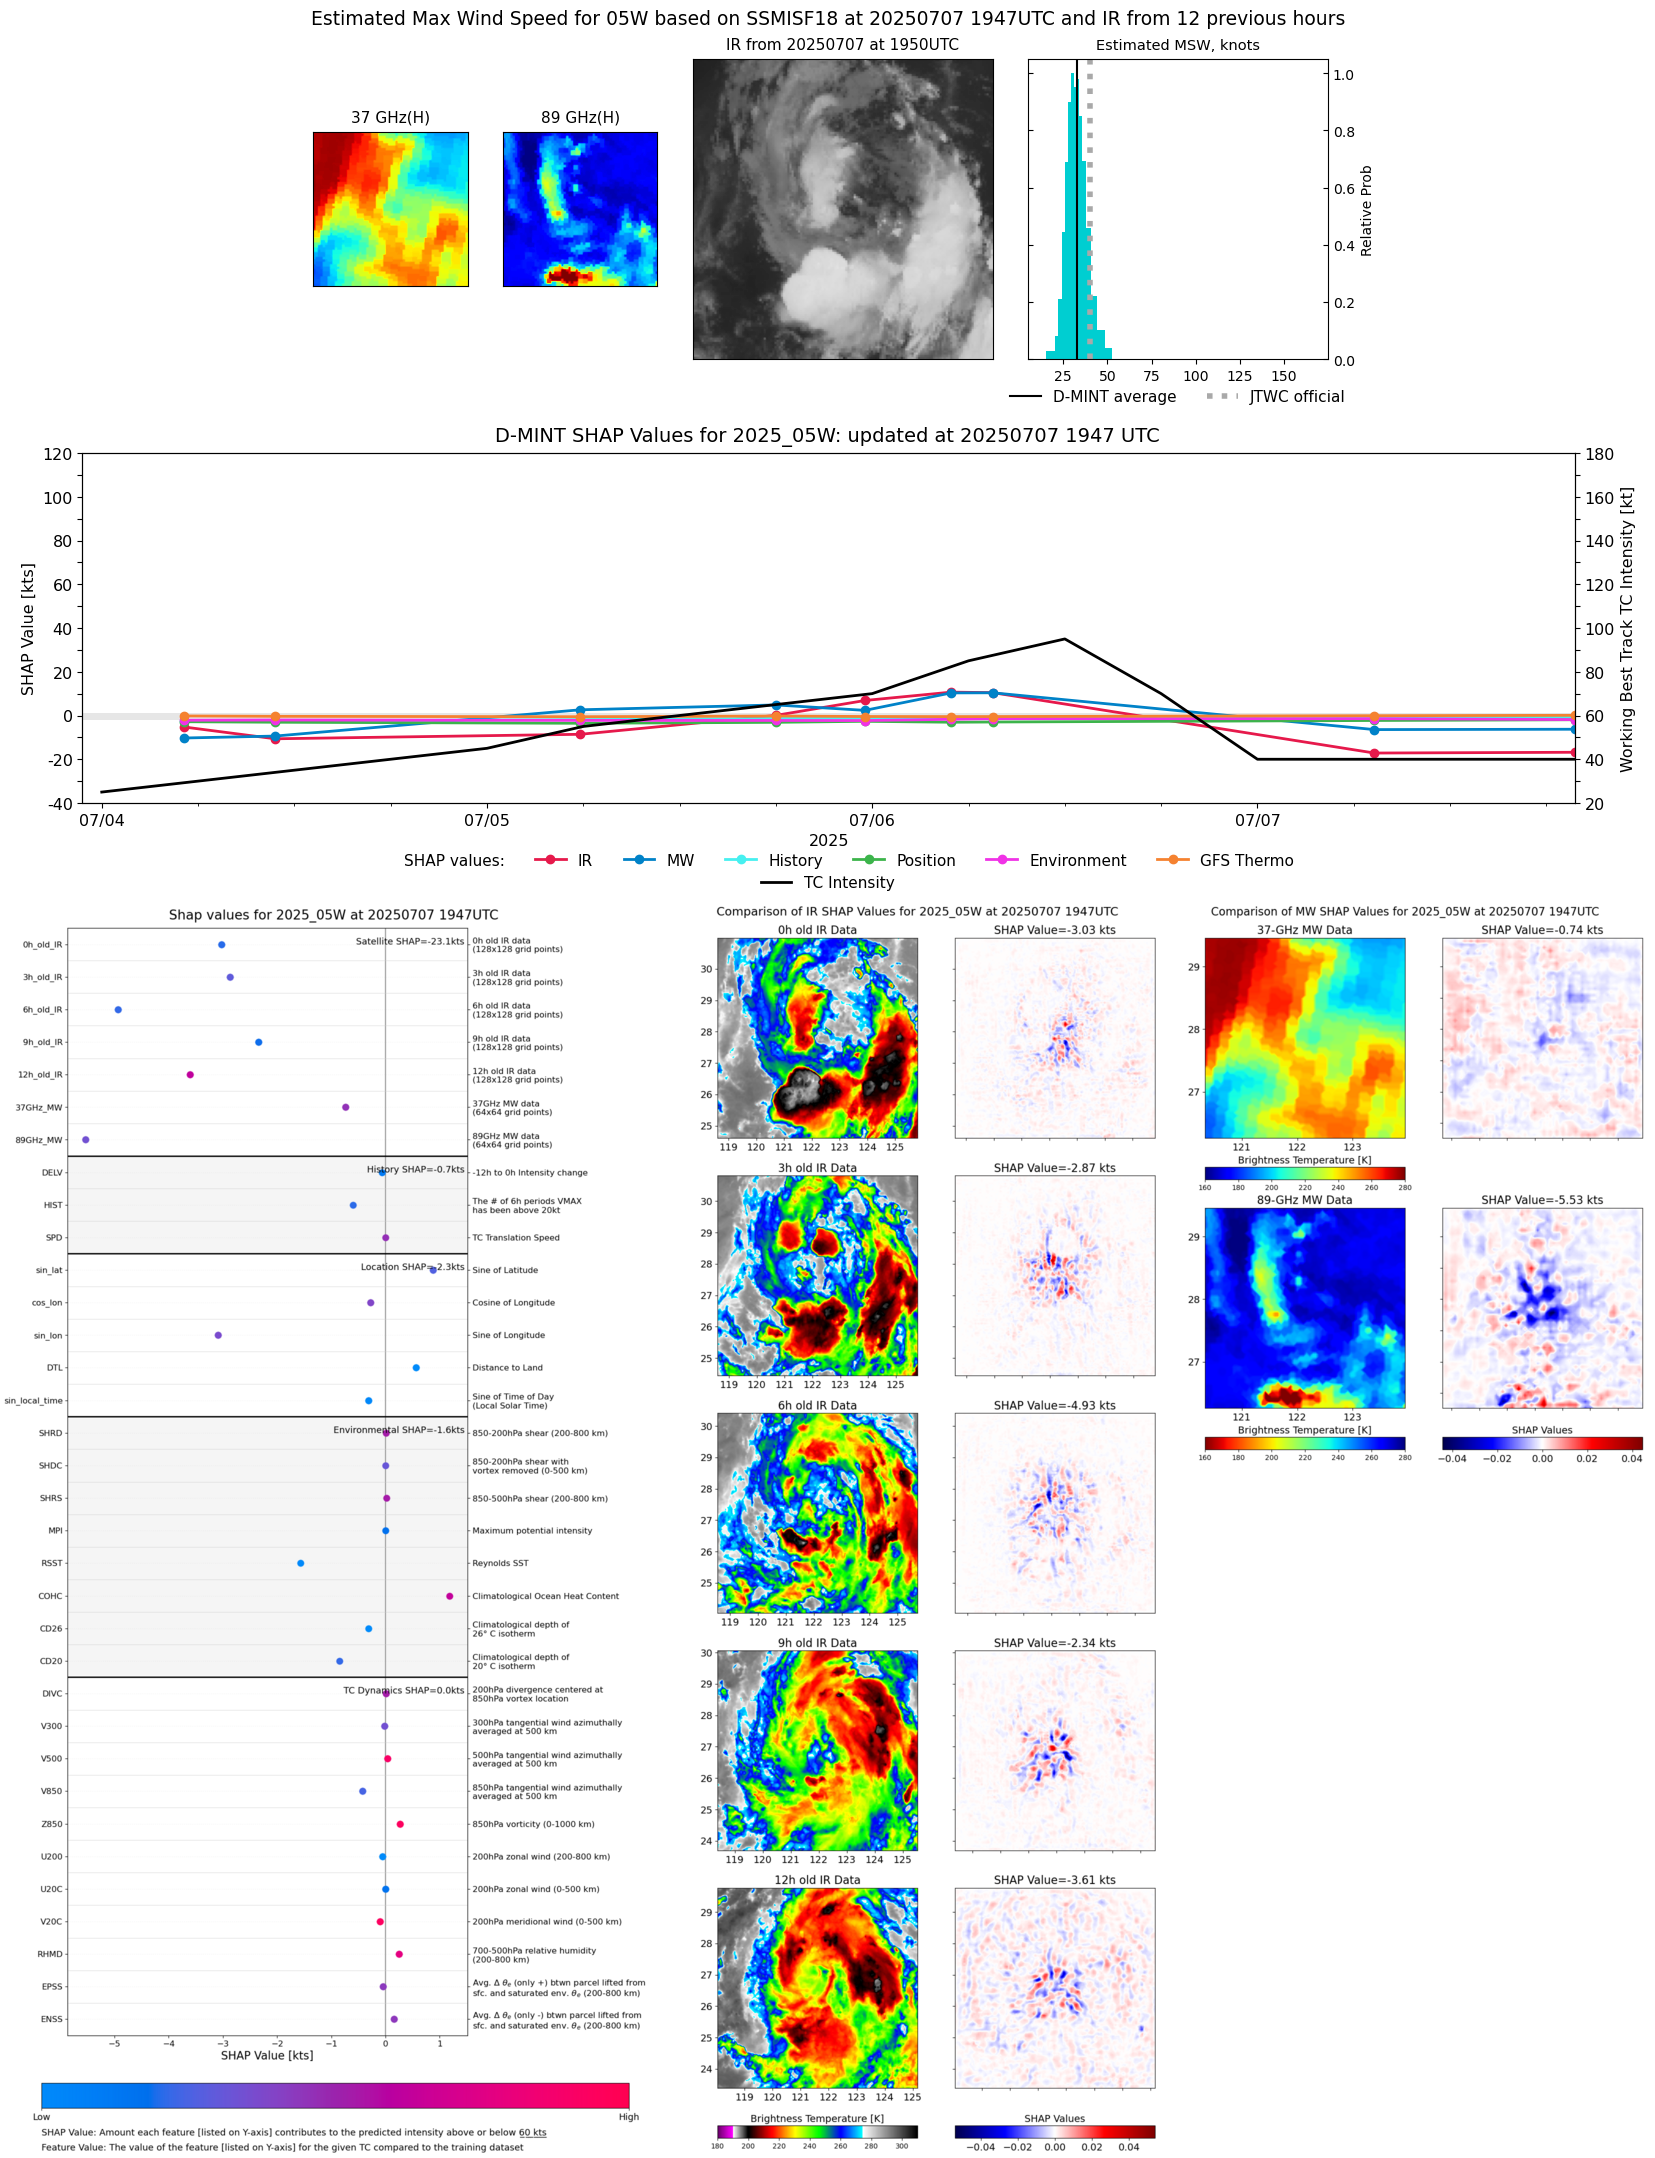 |
| 20250707 | 1744 UTC | AMSR2 | 993 hPa | 29 kts | 25 kts | 33 kts |  |
| 20250707 | 1039 UTC | SSMISF16 | 995 hPa | 33 kts | 29 kts | 37 kts |  |
| 20250707 | 0717 UTC | SSMISF18 | 994 hPa | 31 kts | 27 kts | 36 kts | 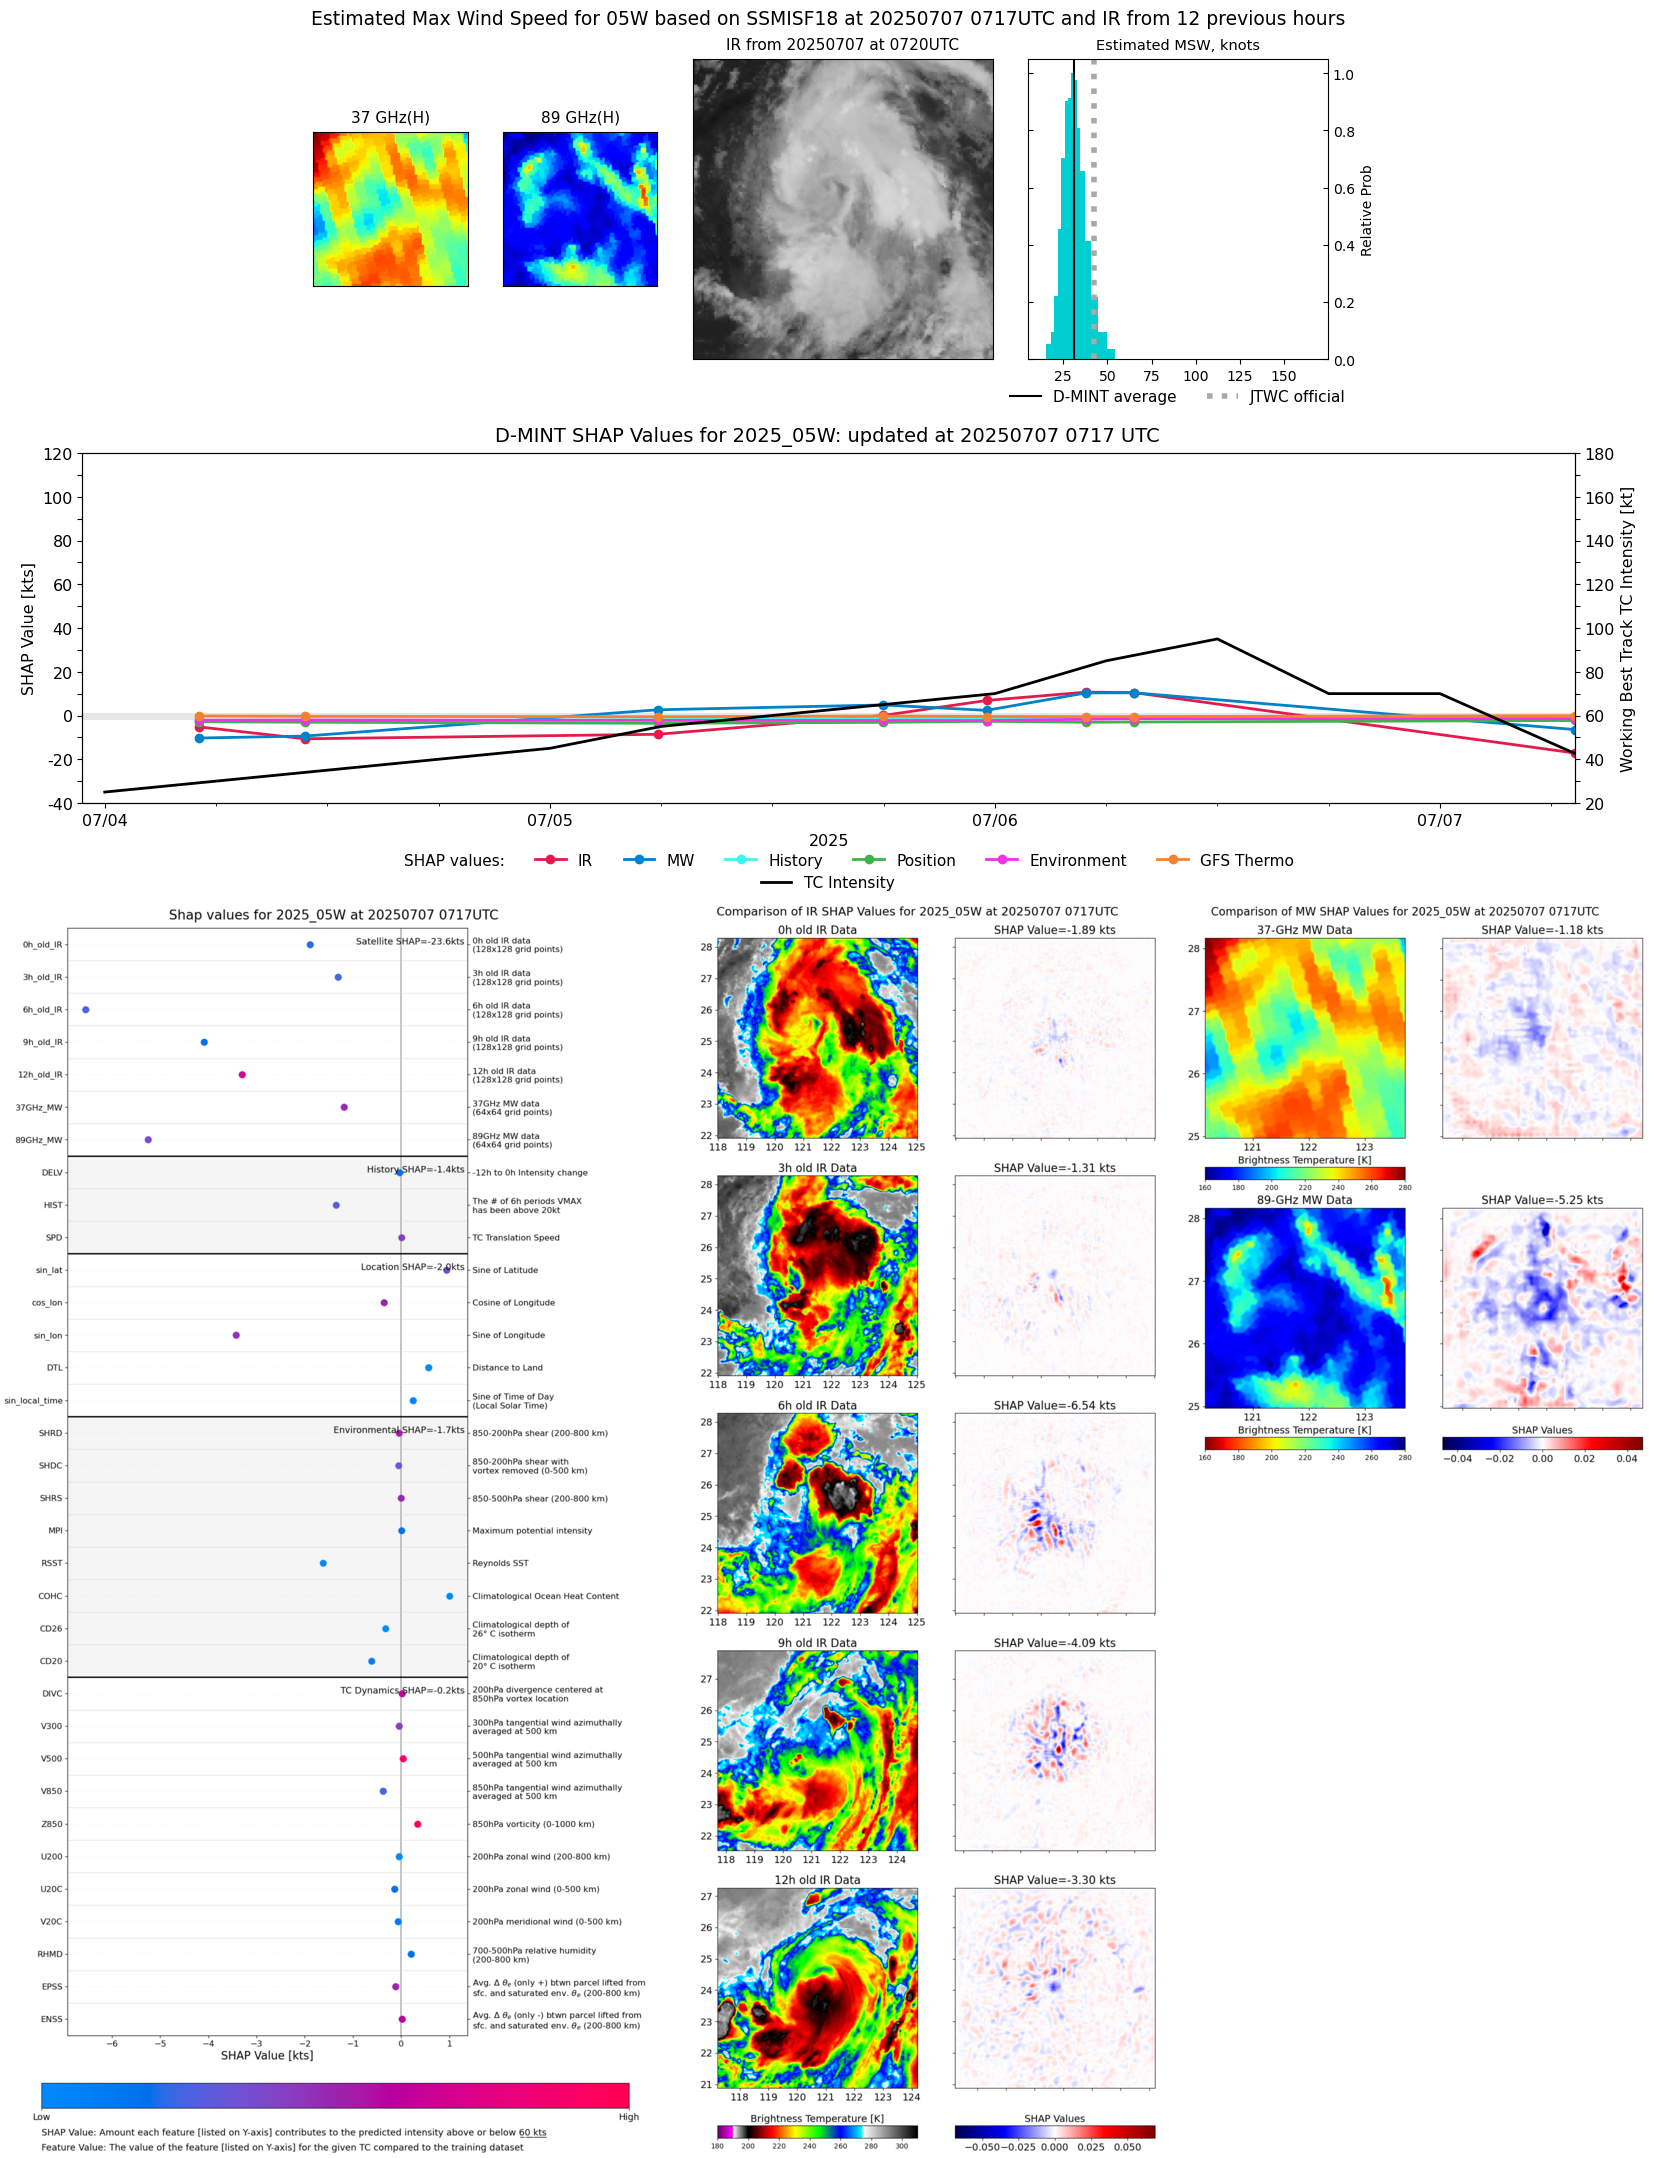 |
| 20250707 | 0539 UTC | AMSR2 | 993 hPa | 34 kts | 30 kts | 39 kts |  |
| 20250707 | 0241 UTC | TMS02 | 985 hPa | 38 kts | 33 kts | 42 kts | 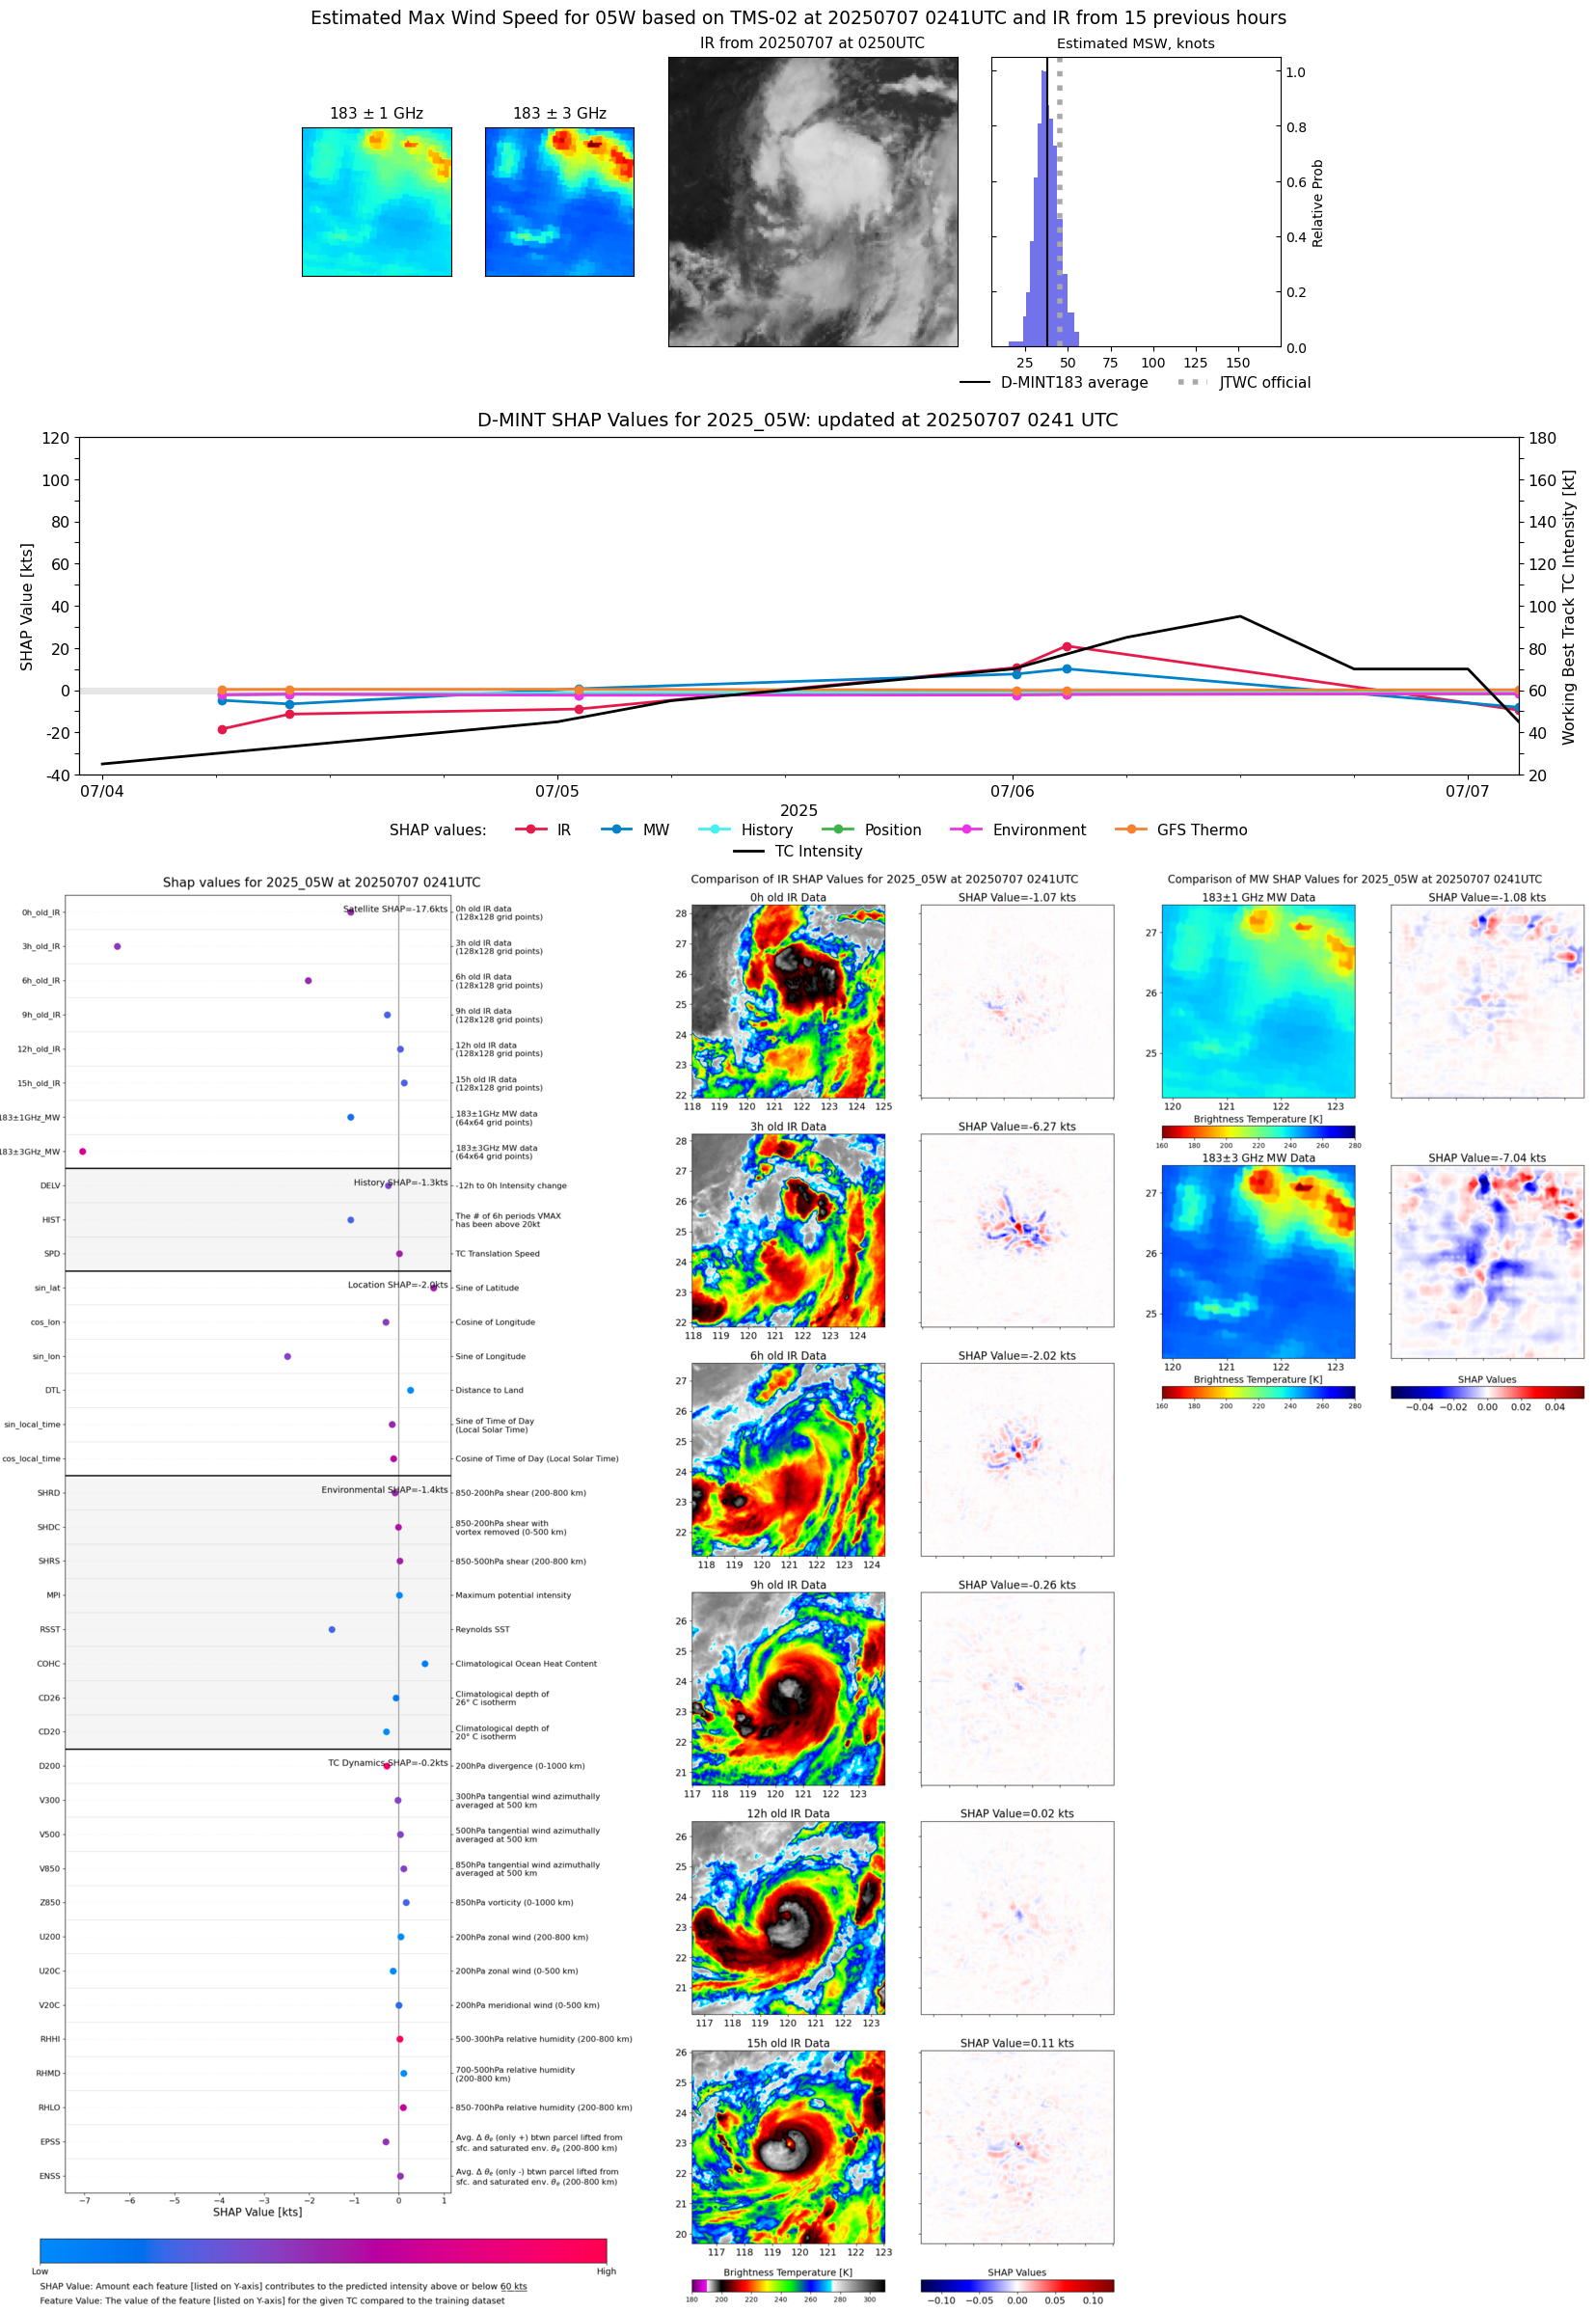 |
| 20250706 | 0731 UTC | SSMISF18 | 964 hPa | 74 kts | 67 kts | 82 kts | 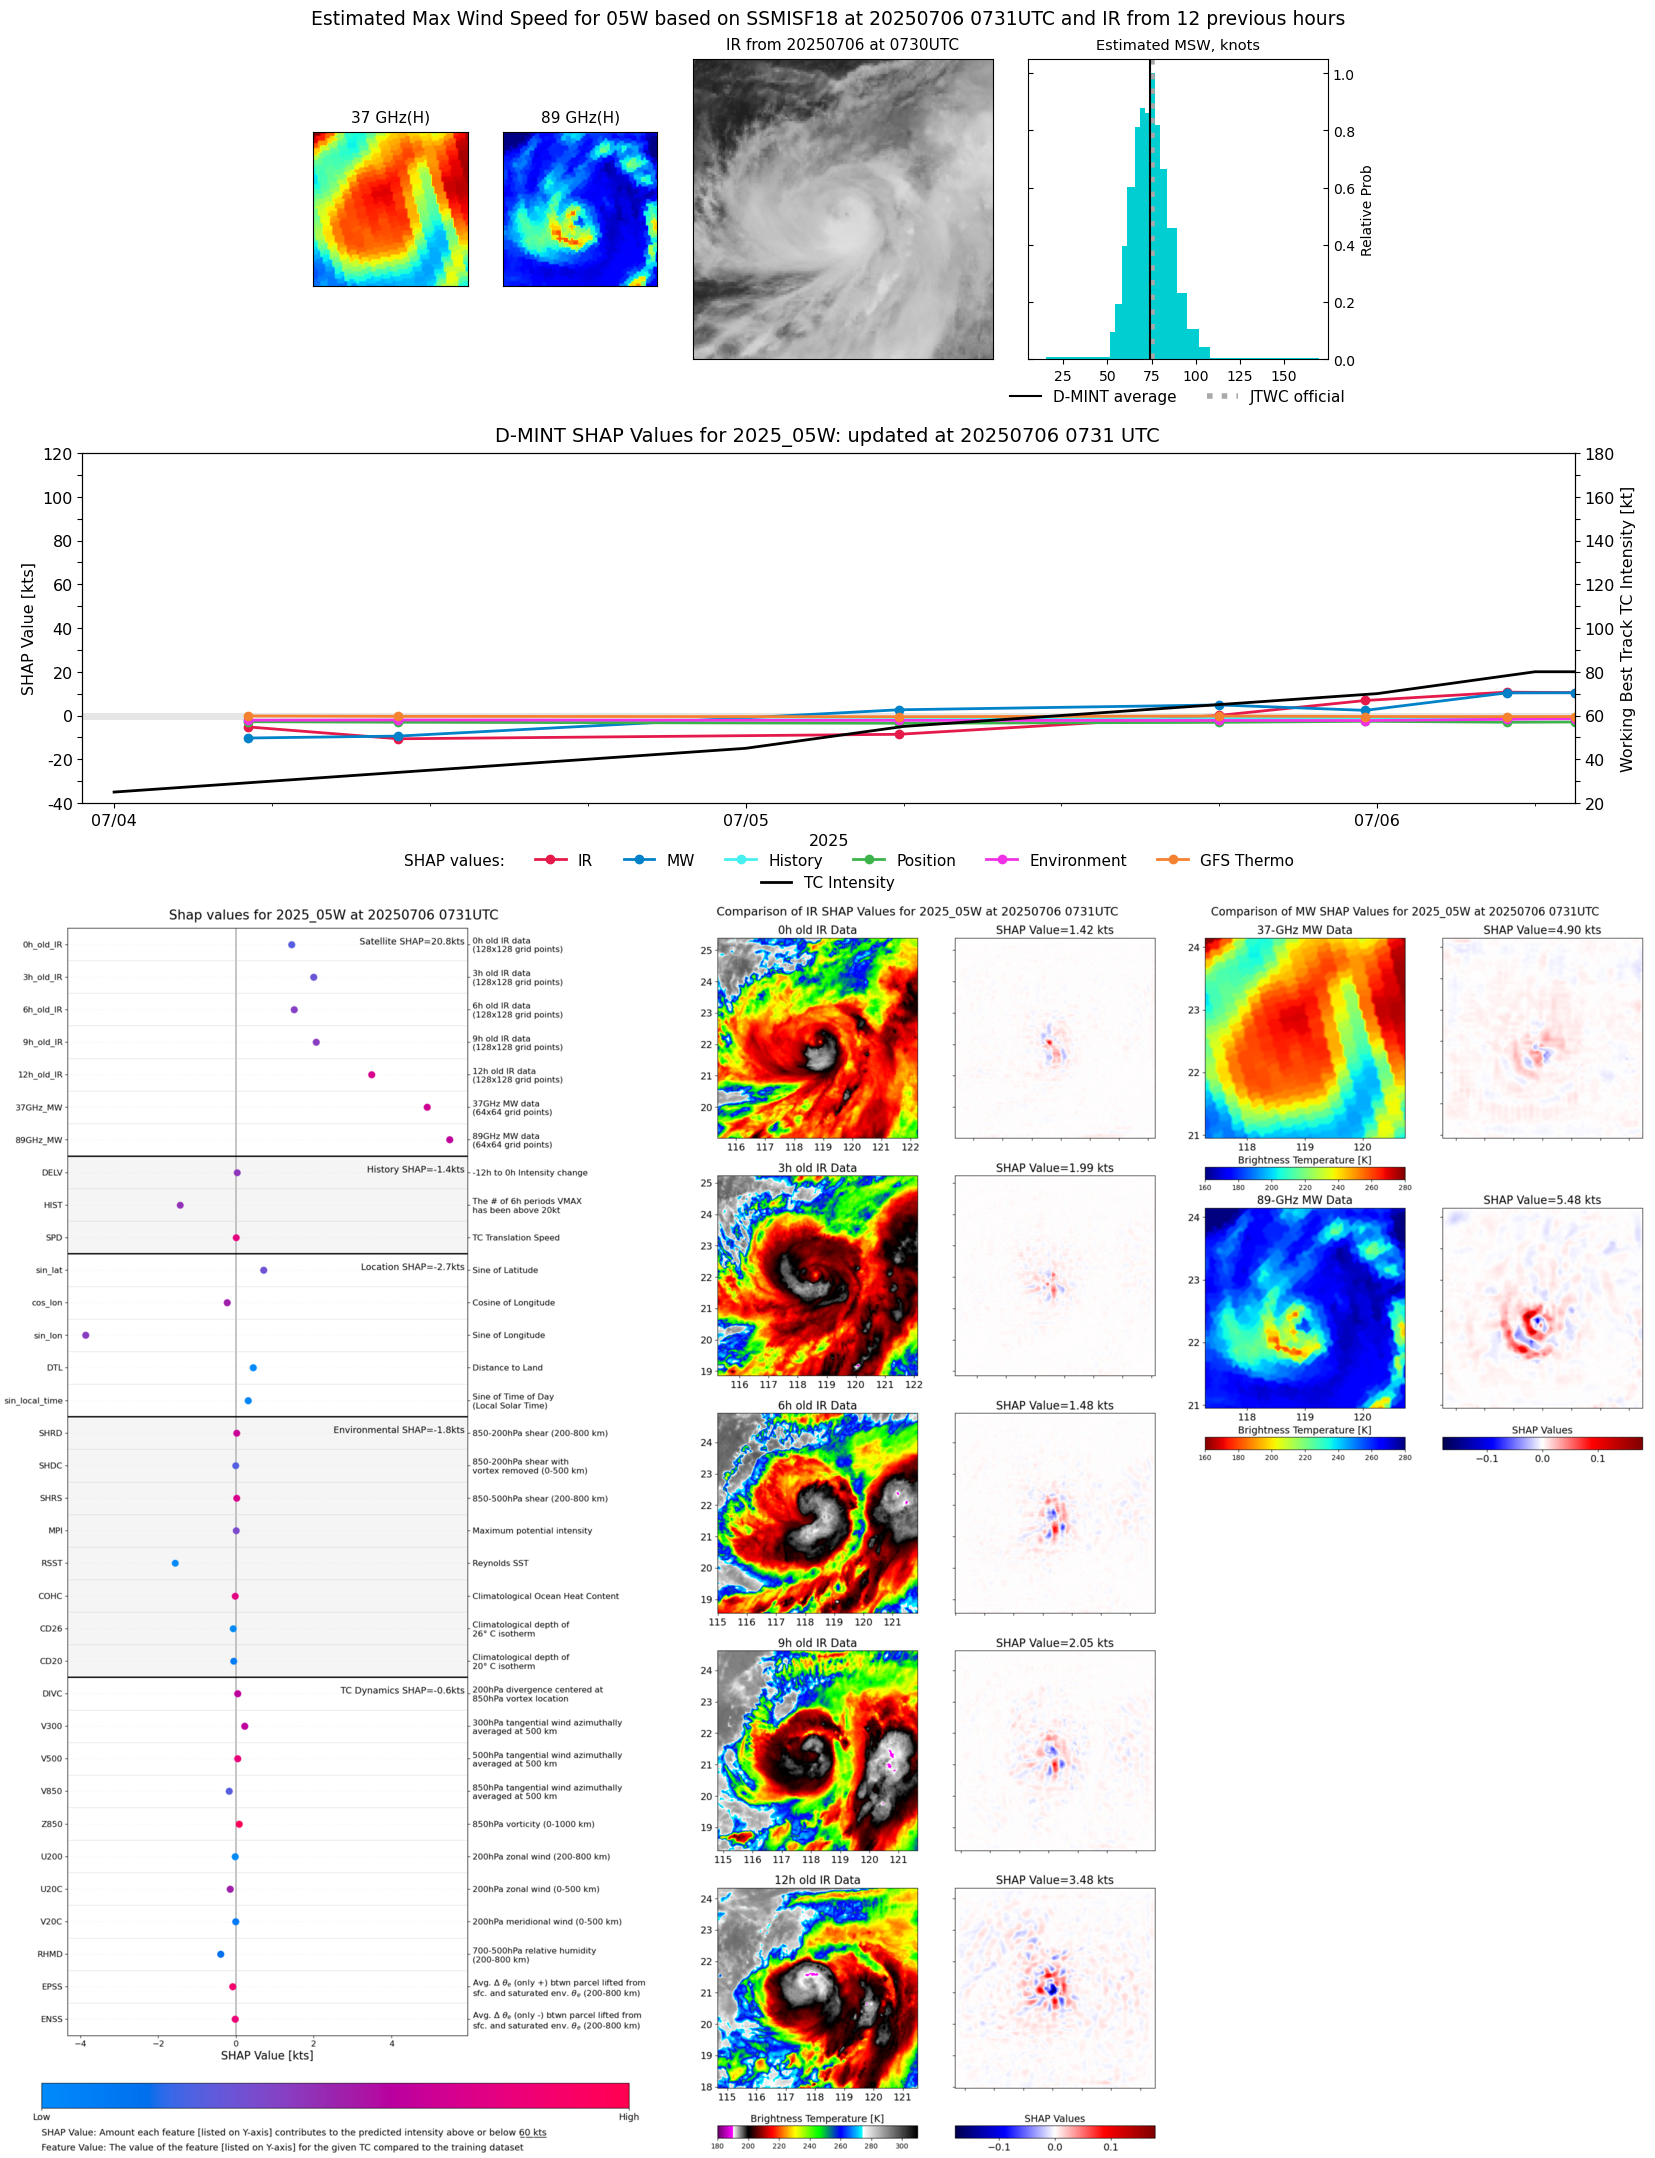 |
| 20250706 | 0455 UTC | AMSR2 | 954 hPa | 74 kts | 67 kts | 82 kts | 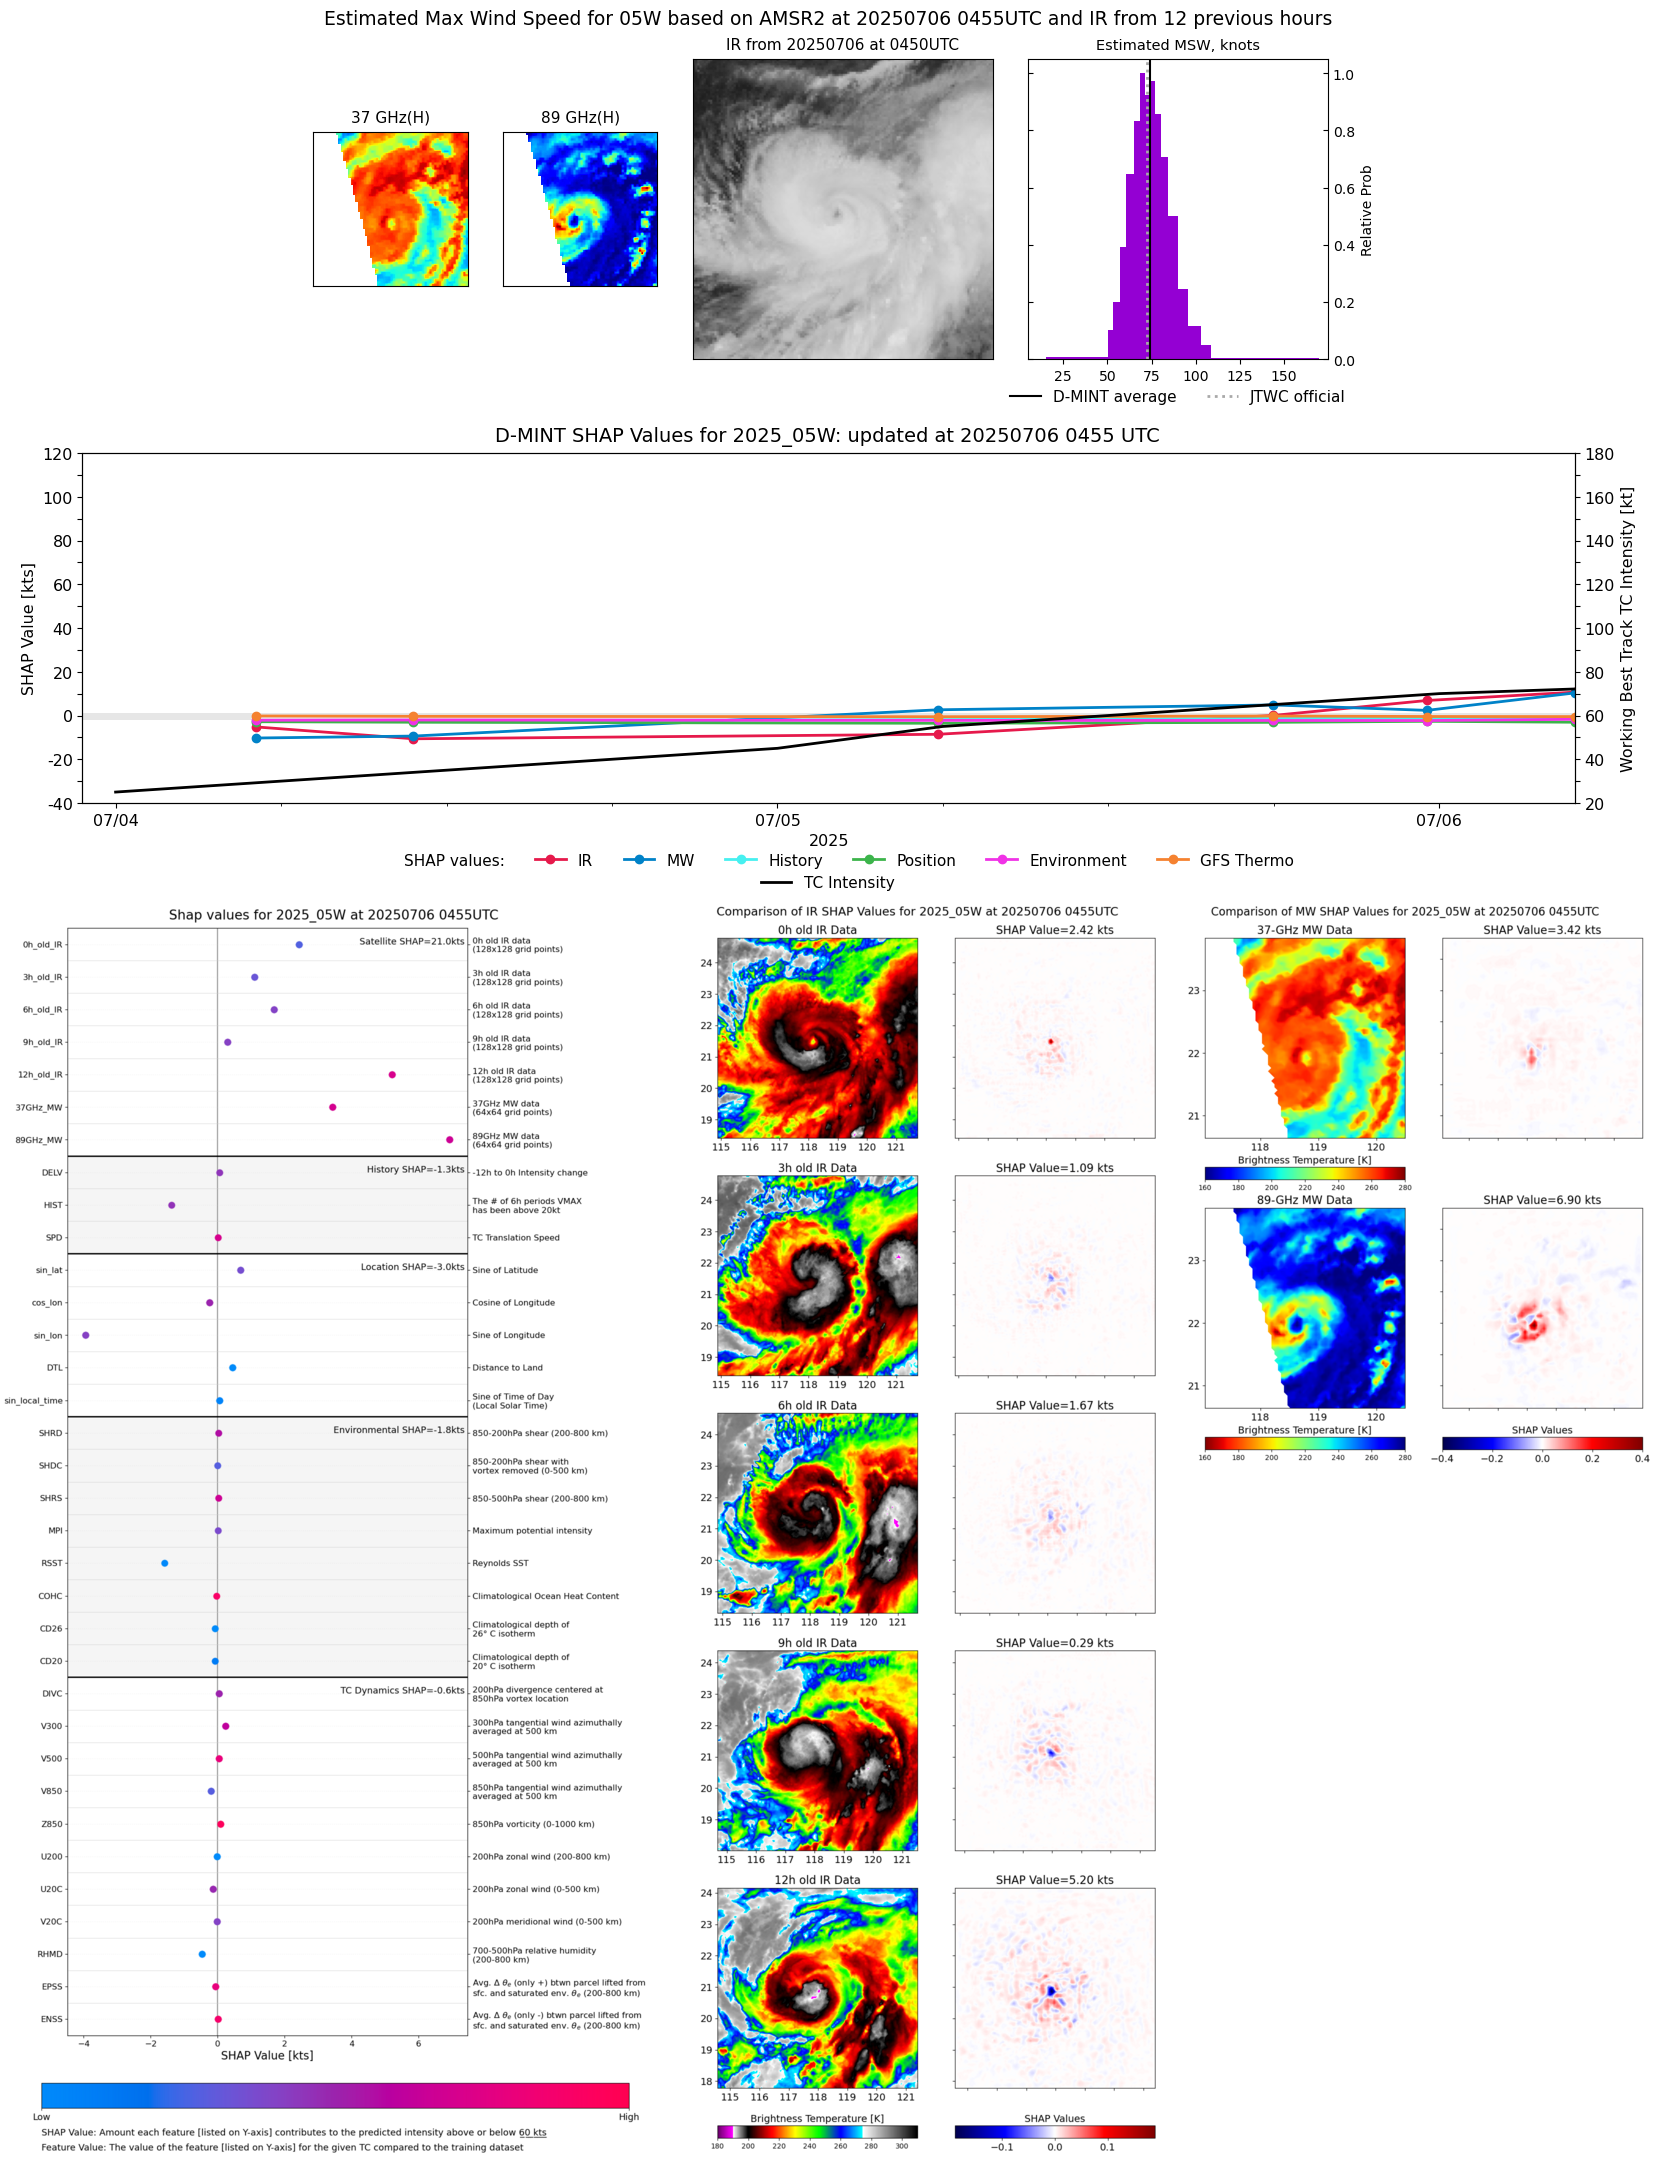 |
| 20250706 | 0250 UTC | TMS02 | 967 hPa | 86 kts | 79 kts | 93 kts | 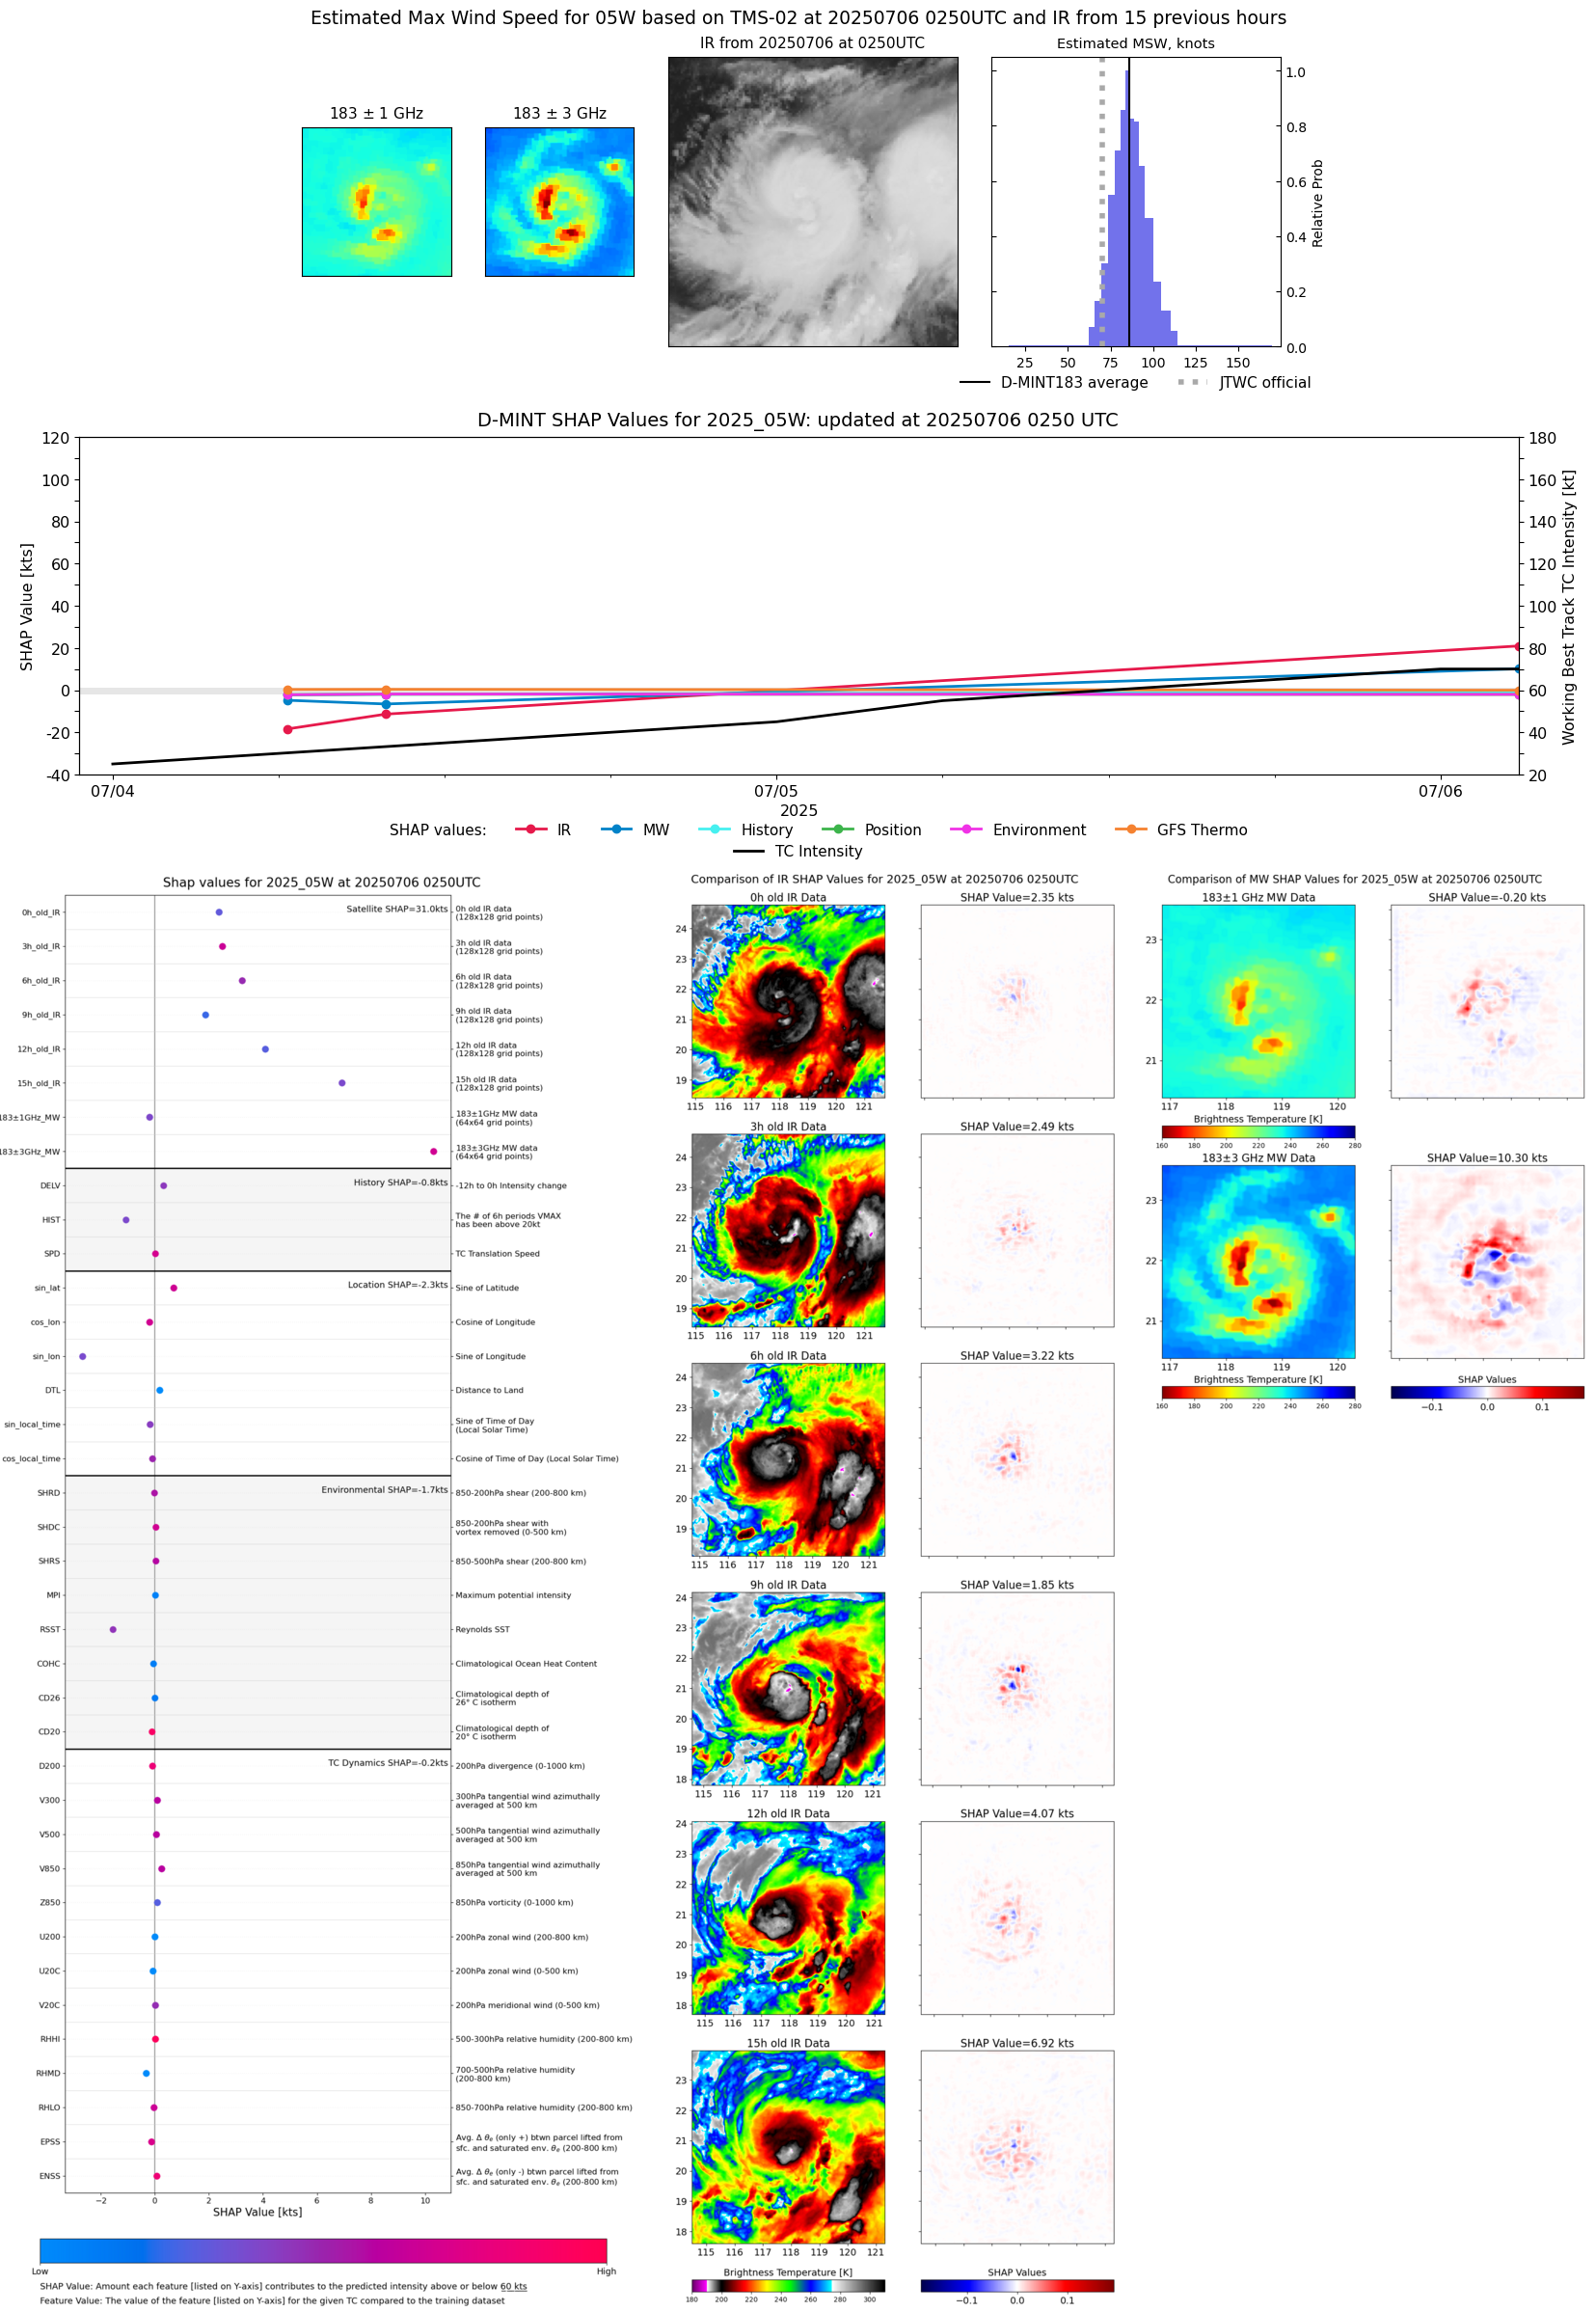 |
| 20250706 | 0012 UTC | TROPICS03 | 968 hPa | 73 kts | 67 kts | 80 kts | 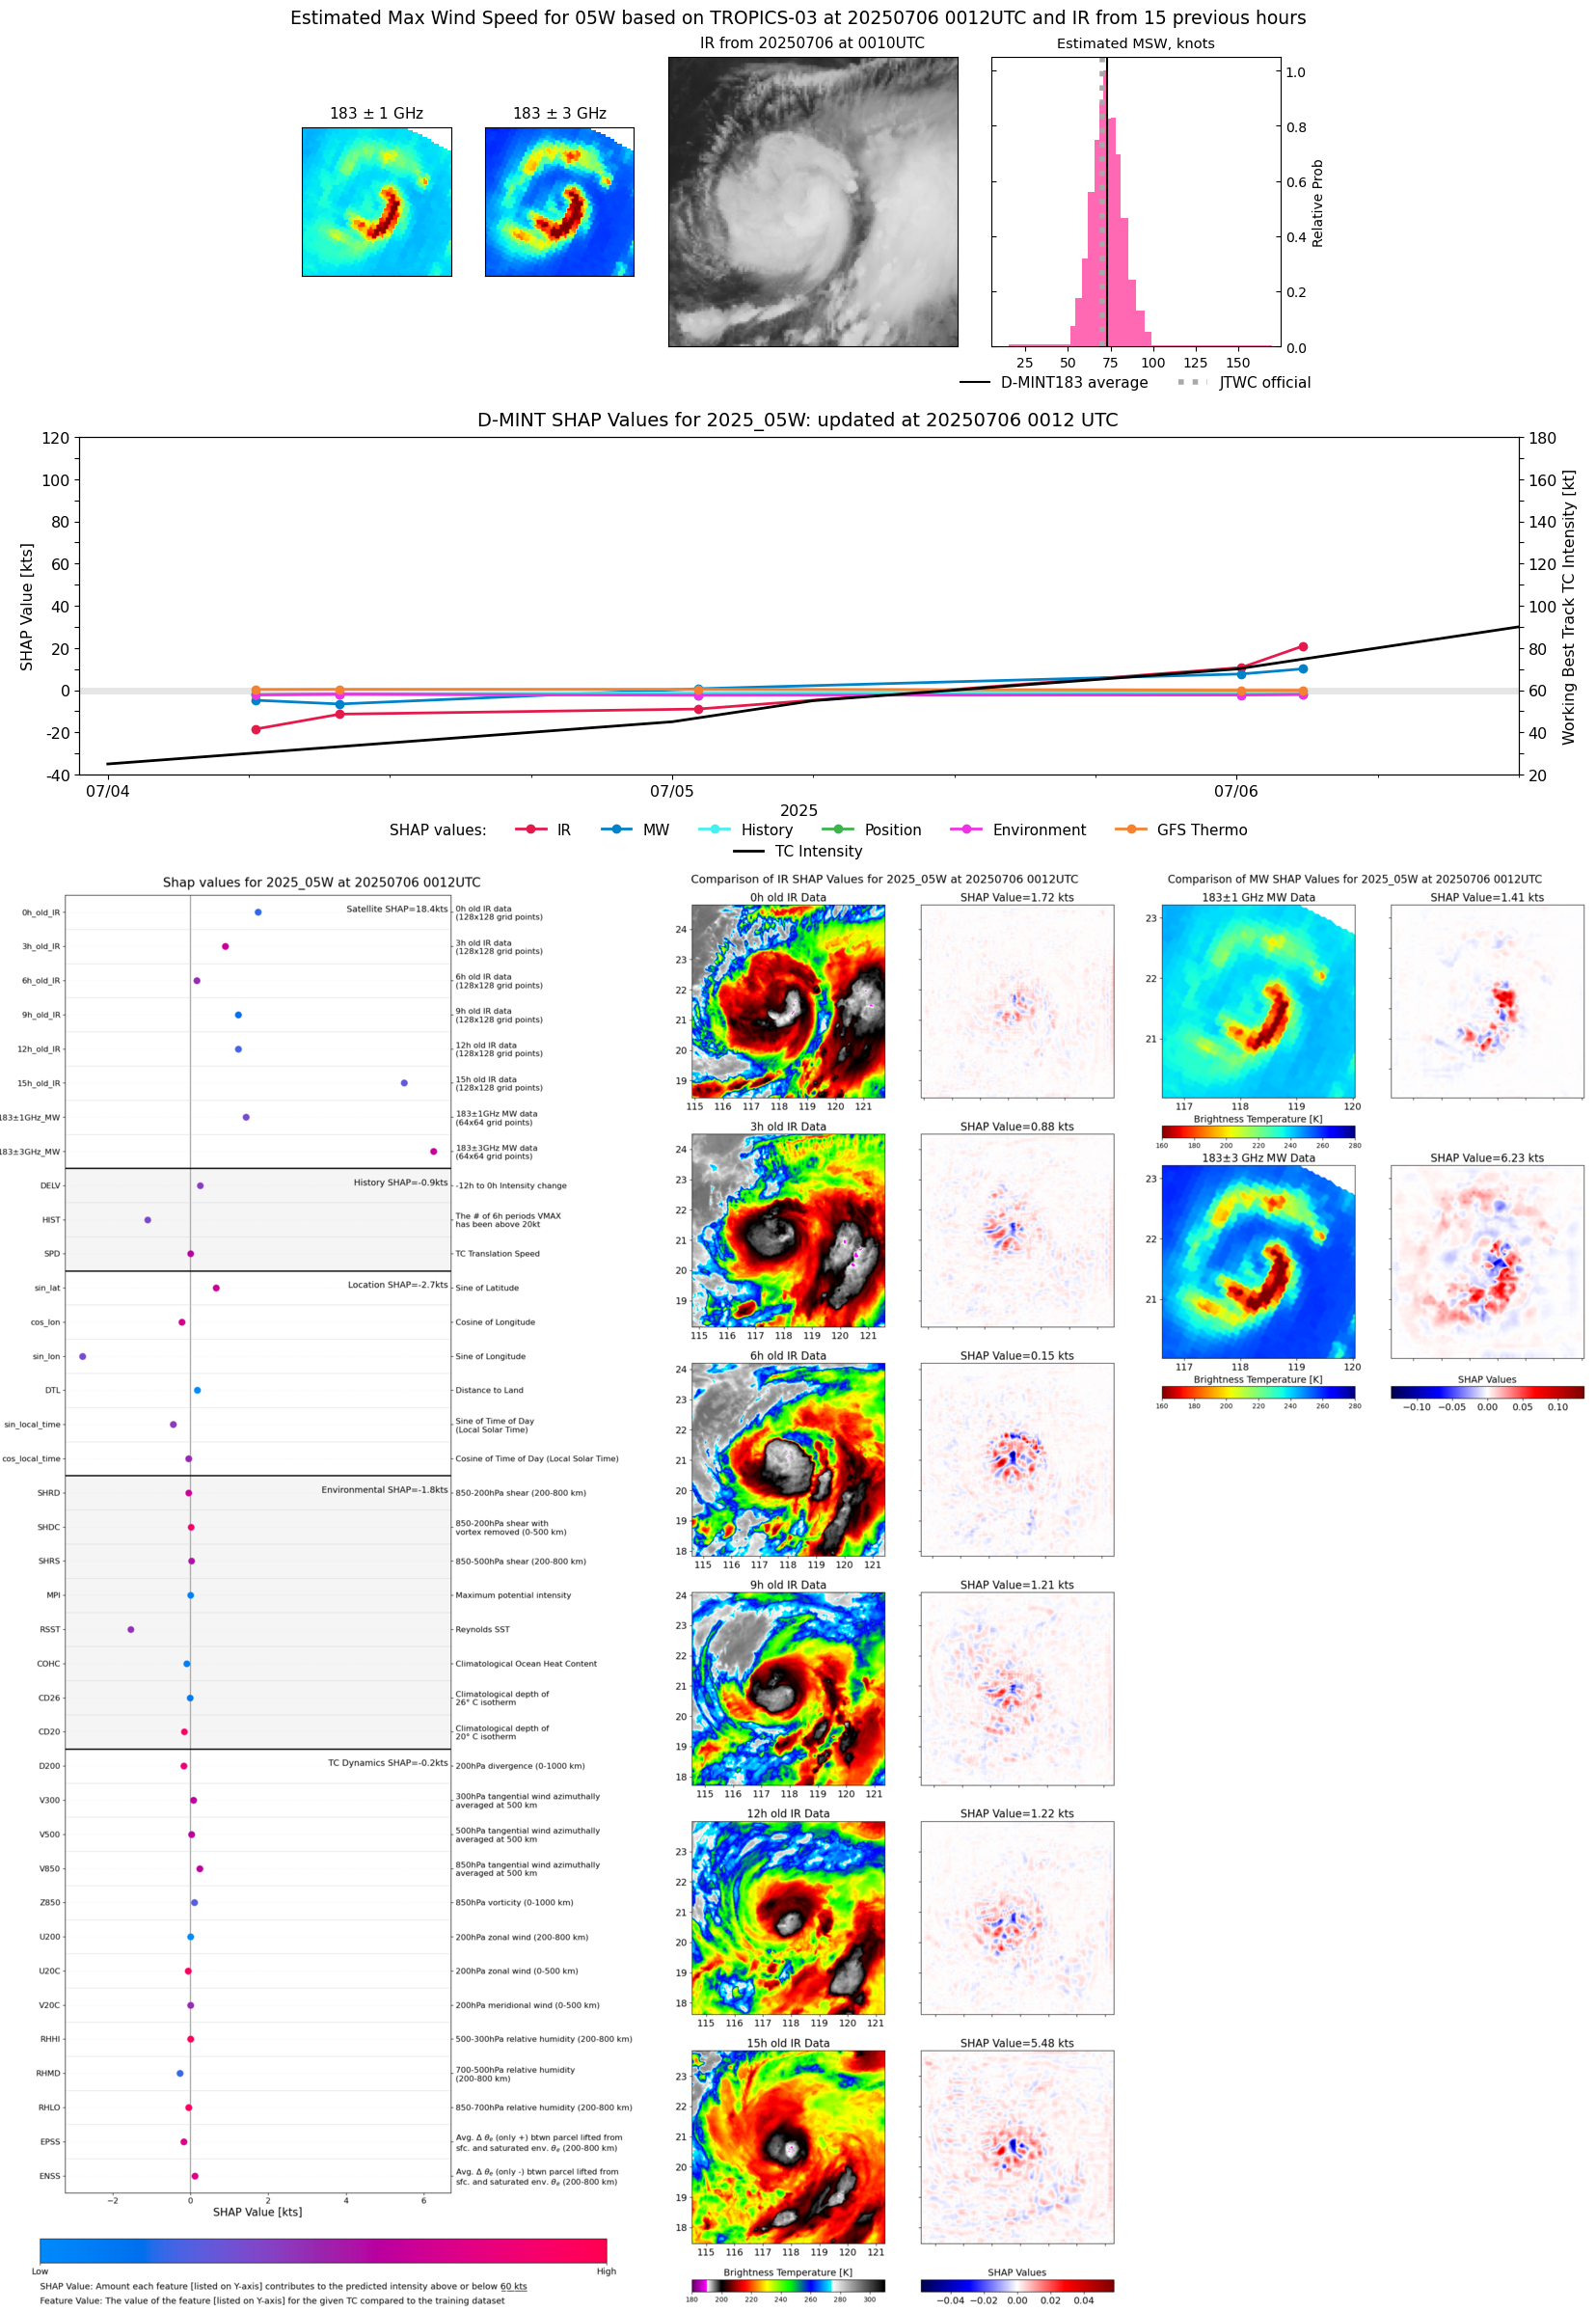 |
| 20250705 | 2333 UTC | GMI | 980 hPa | 62 kts | 56 kts | 69 kts |  |
| 20250705 | 1759 UTC | AMSR2 | 980 hPa | 58 kts | 52 kts | 64 kts | 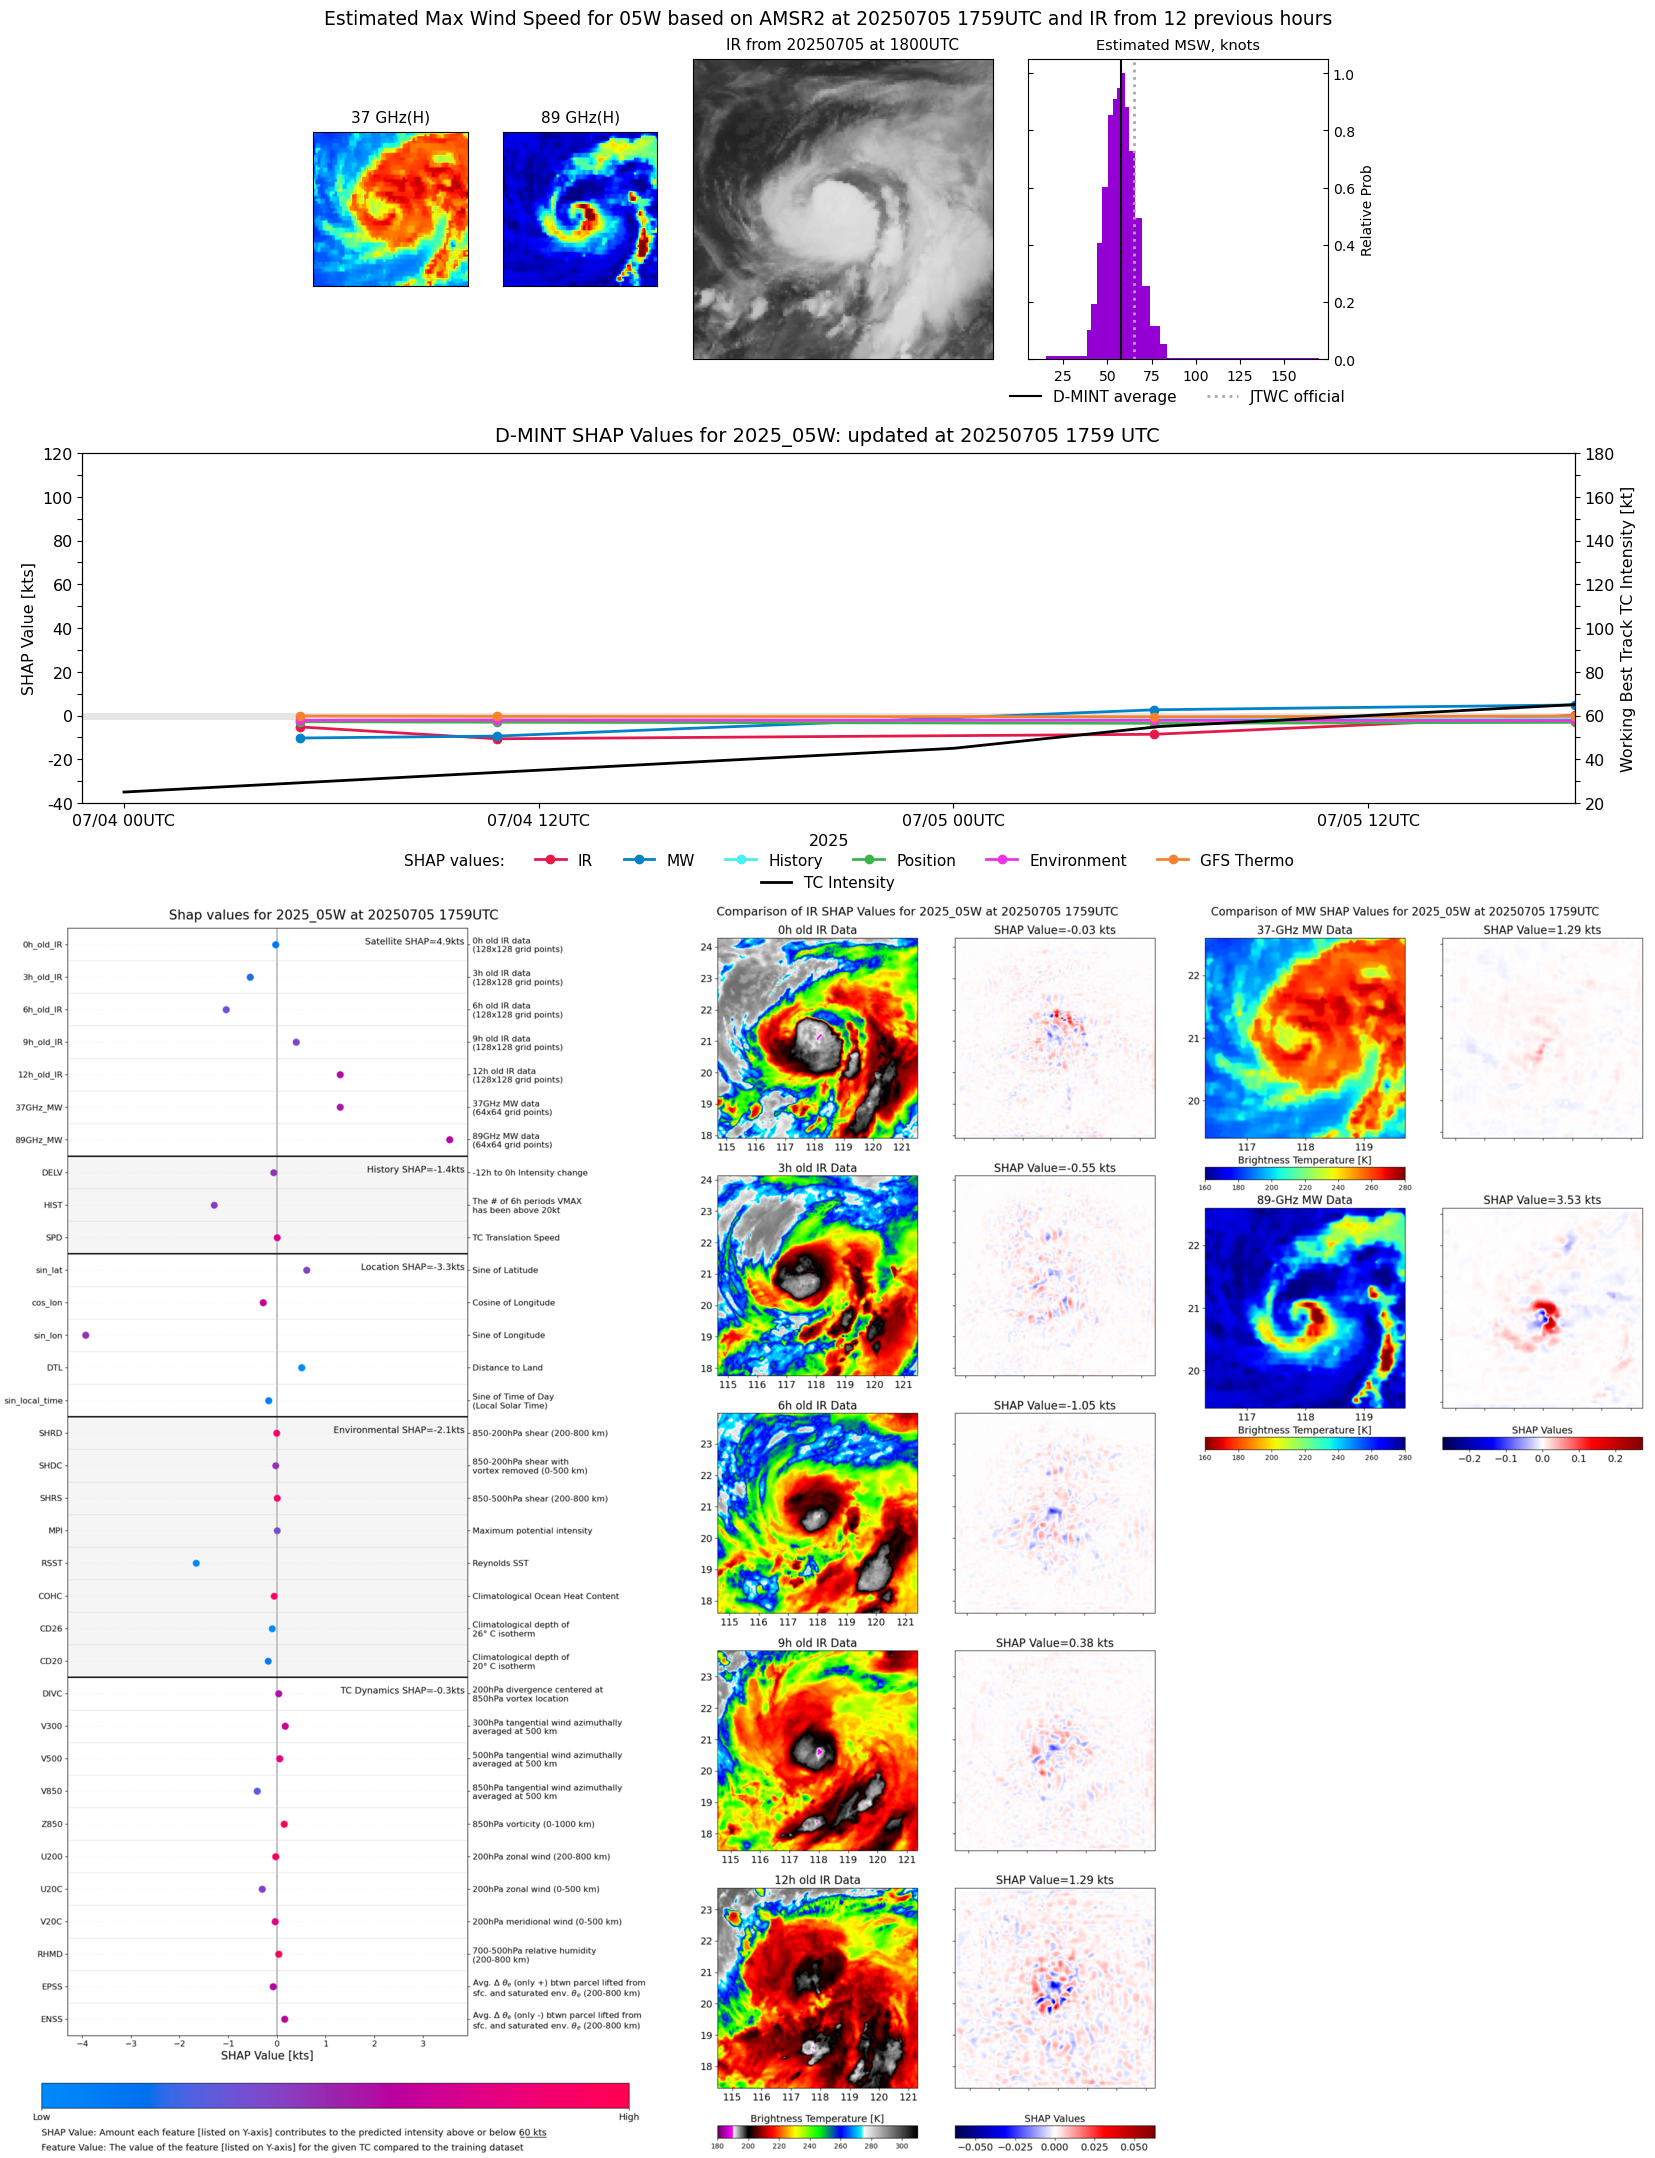 |
| 20250705 | 0549 UTC | AMSR2 | 985 hPa | 46 kts | 40 kts | 51 kts | 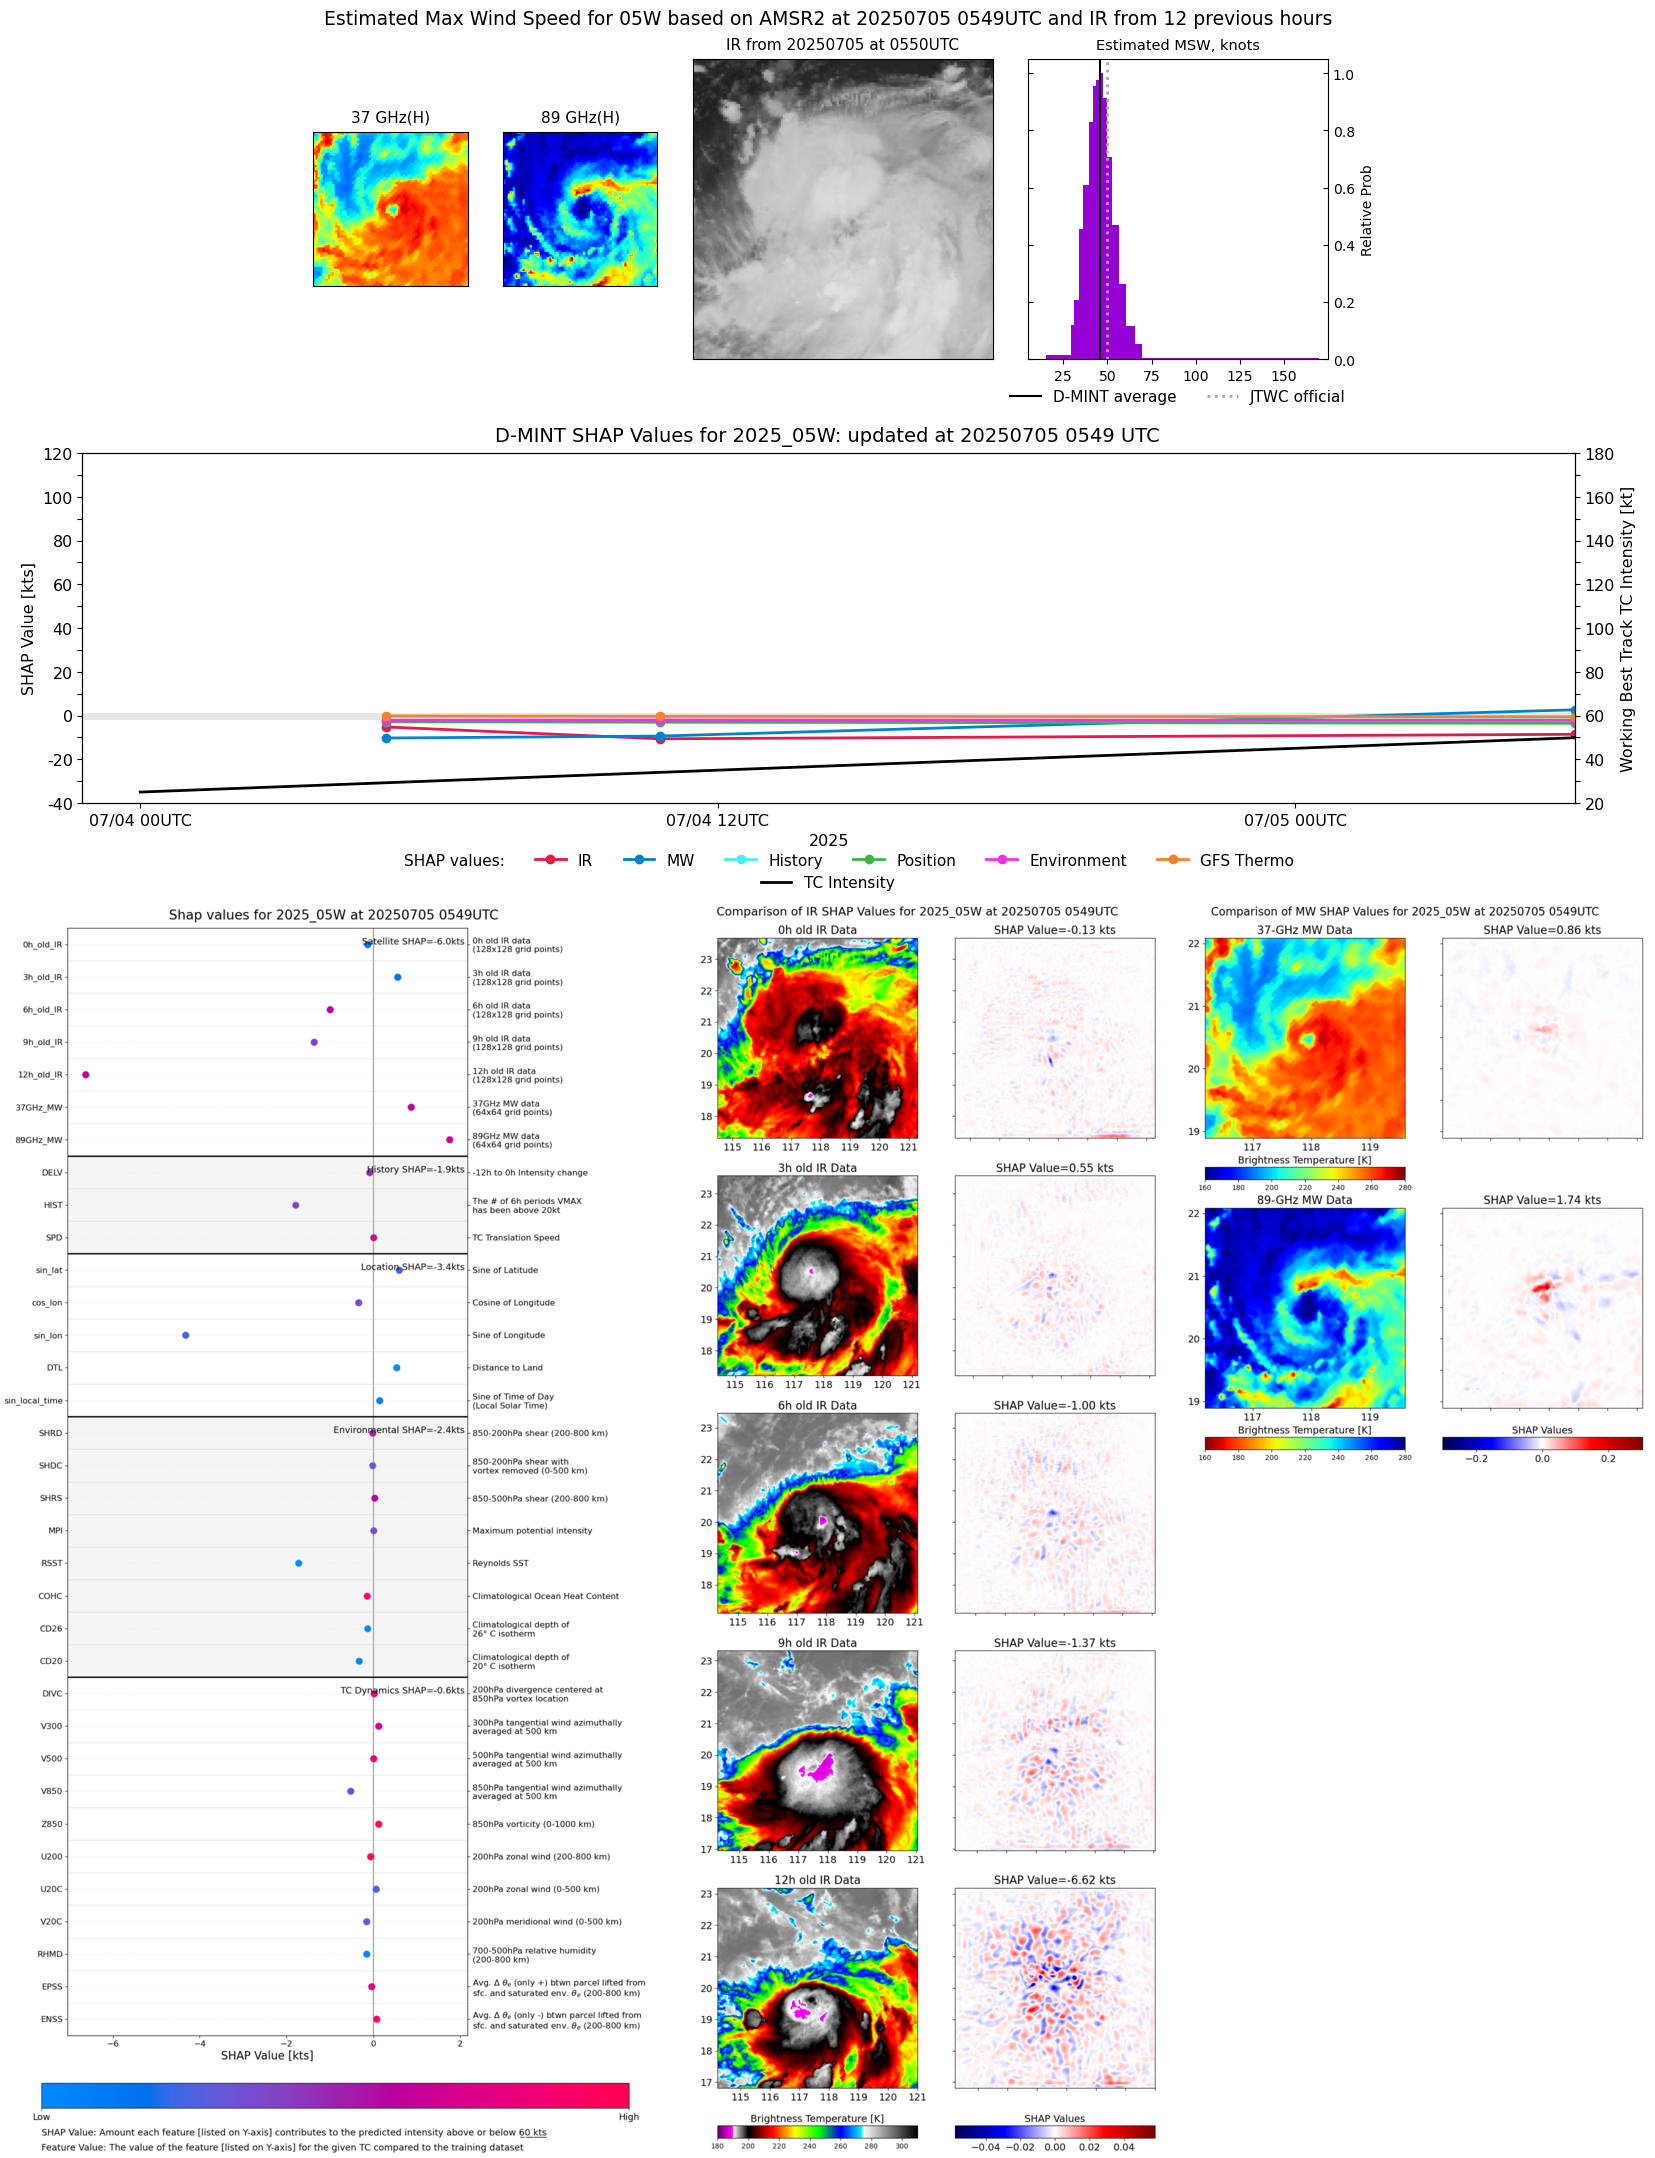 |
| 20250705 | 0106 UTC | TROPICS03 | 985 hPa | 46 kts | 41 kts | 51 kts | 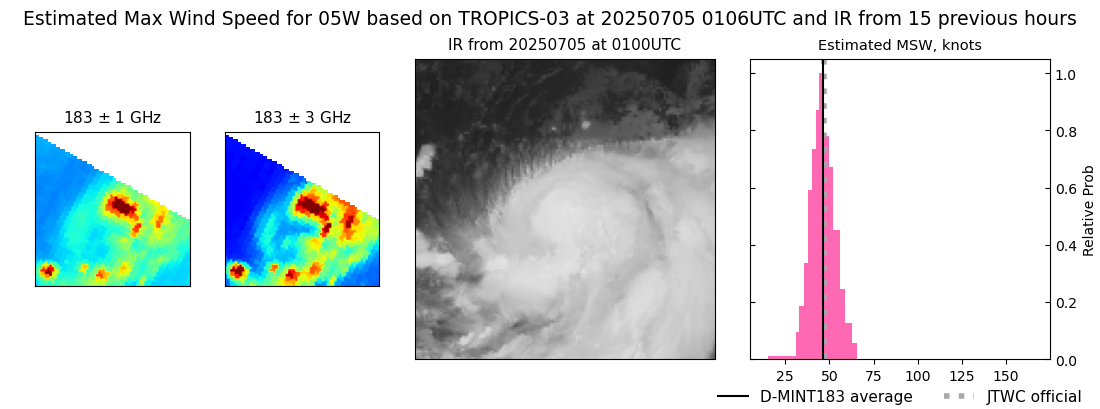 |
| 20250704 | 1048 UTC | GMI | 997 hPa | 32 kts | 28 kts | 37 kts | 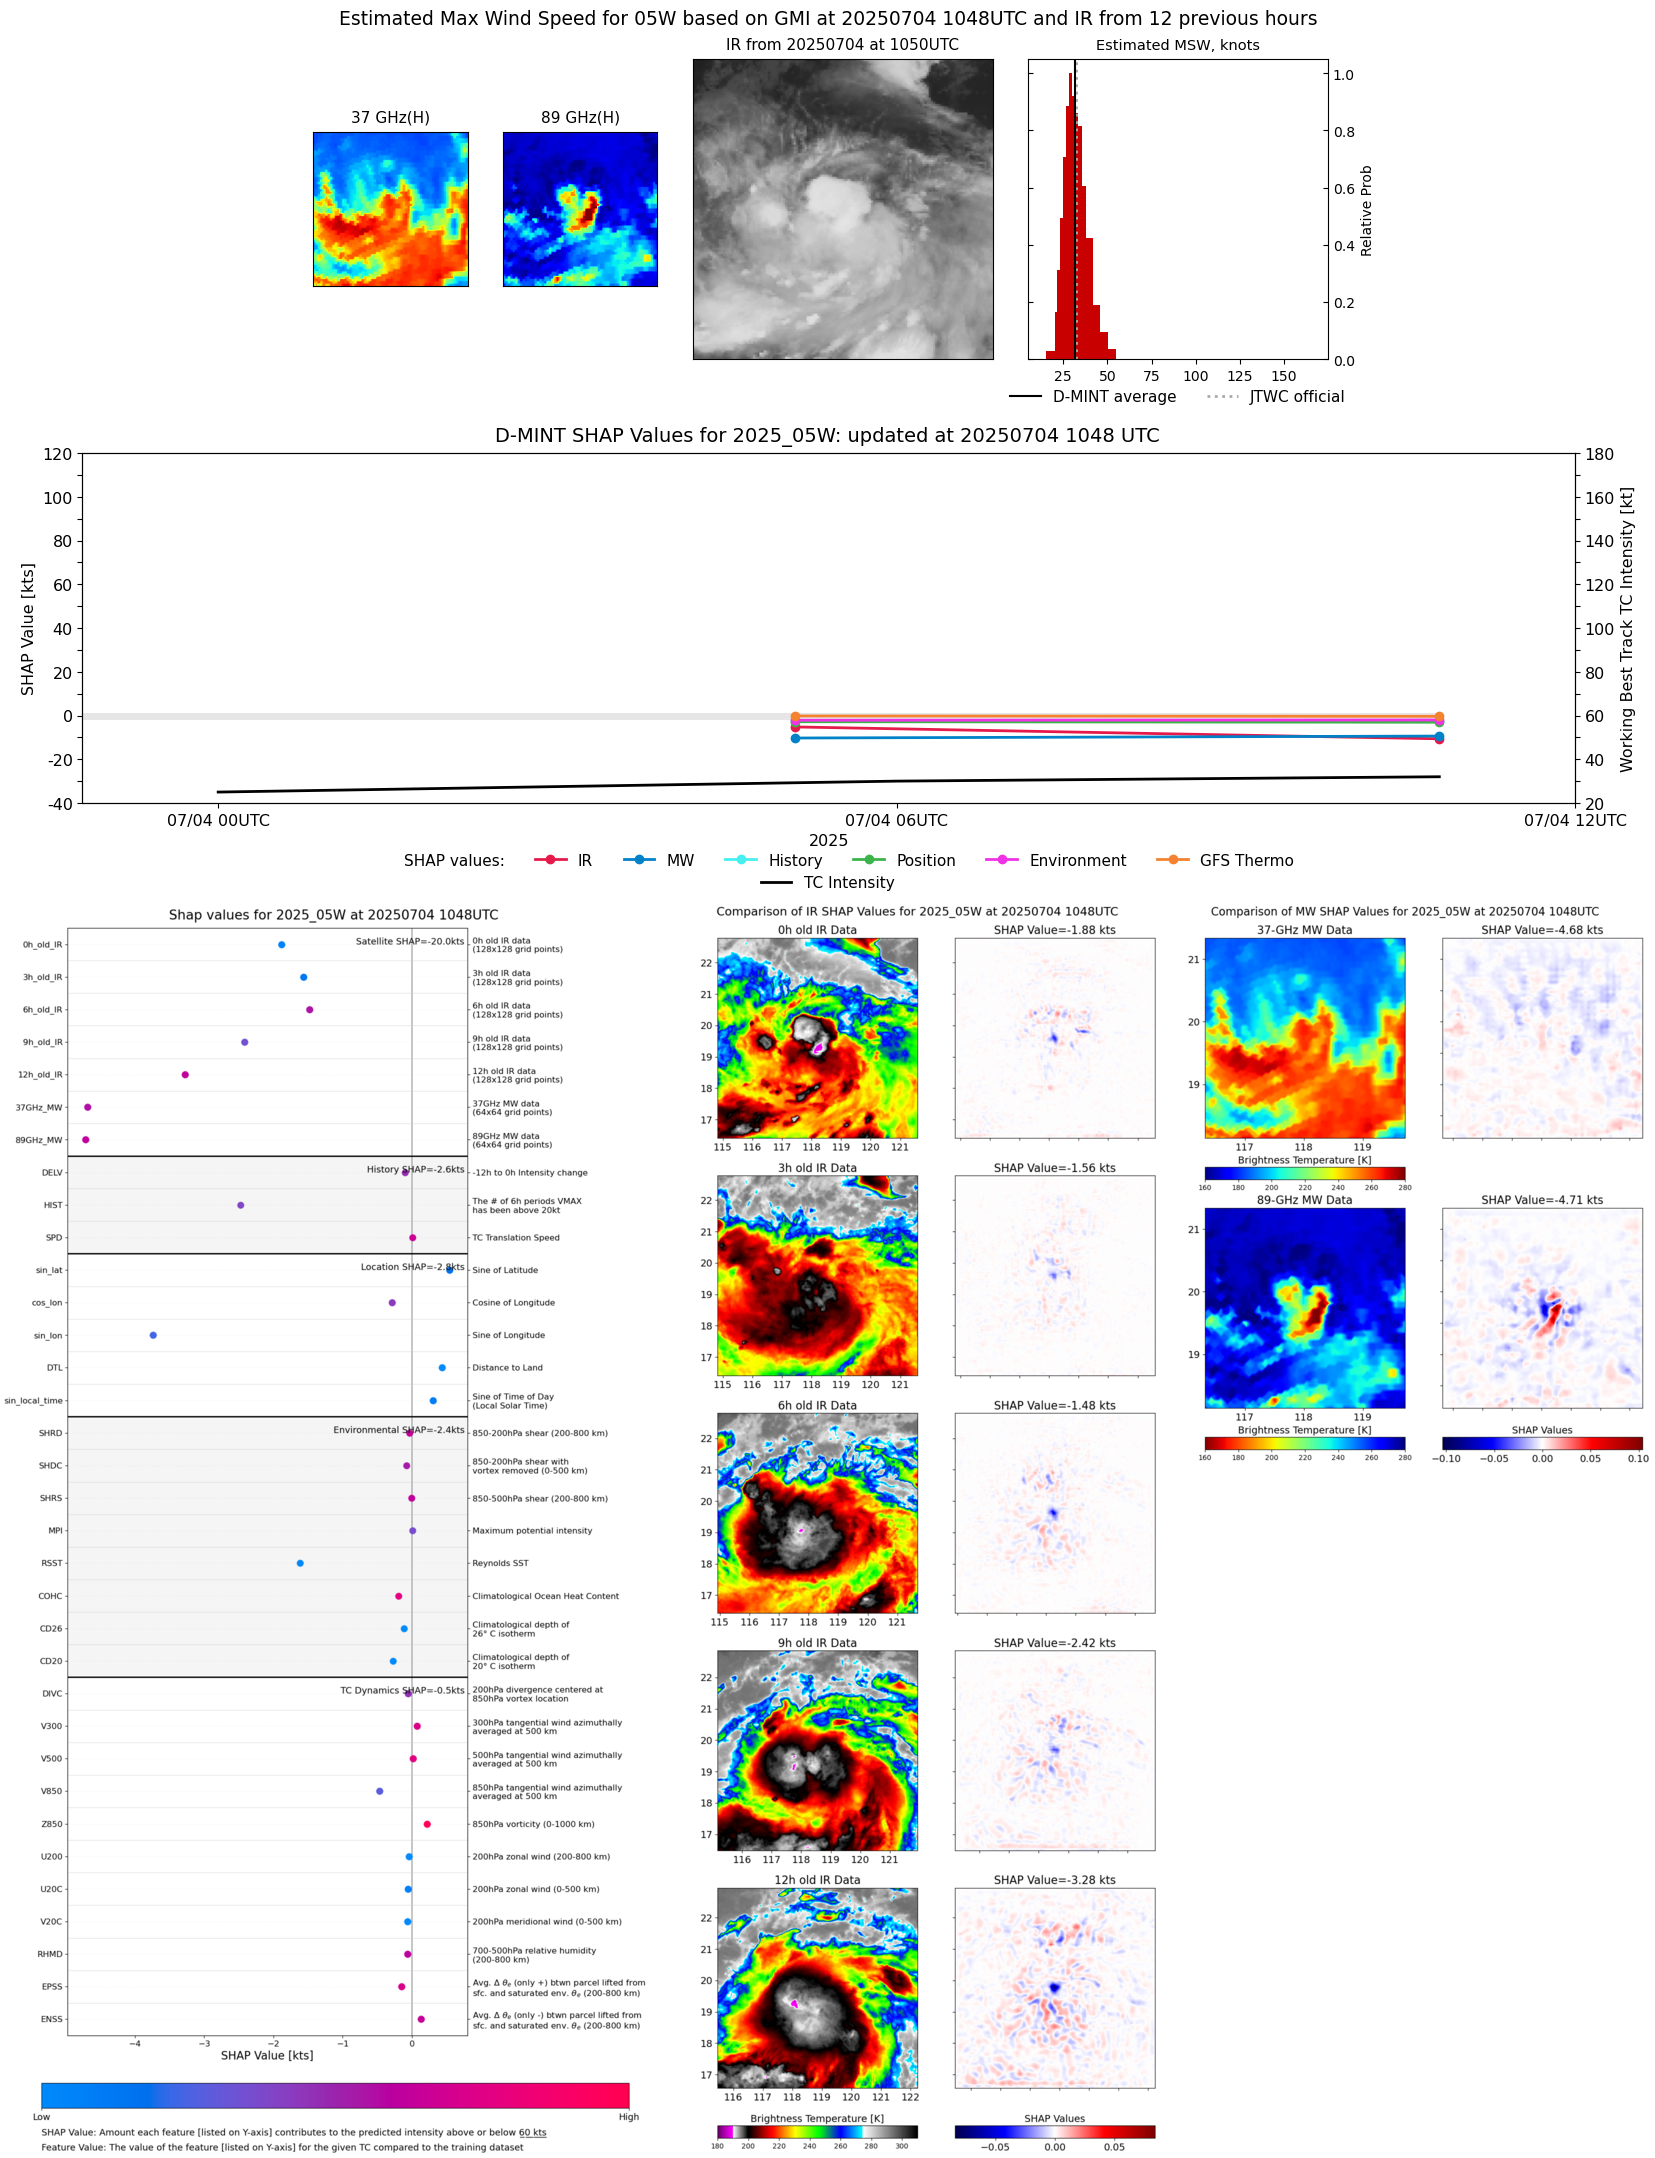 |
| 20250704 | 0952 UTC | TMS03 | 993 hPa | 36 kts | 32 kts | 41 kts | 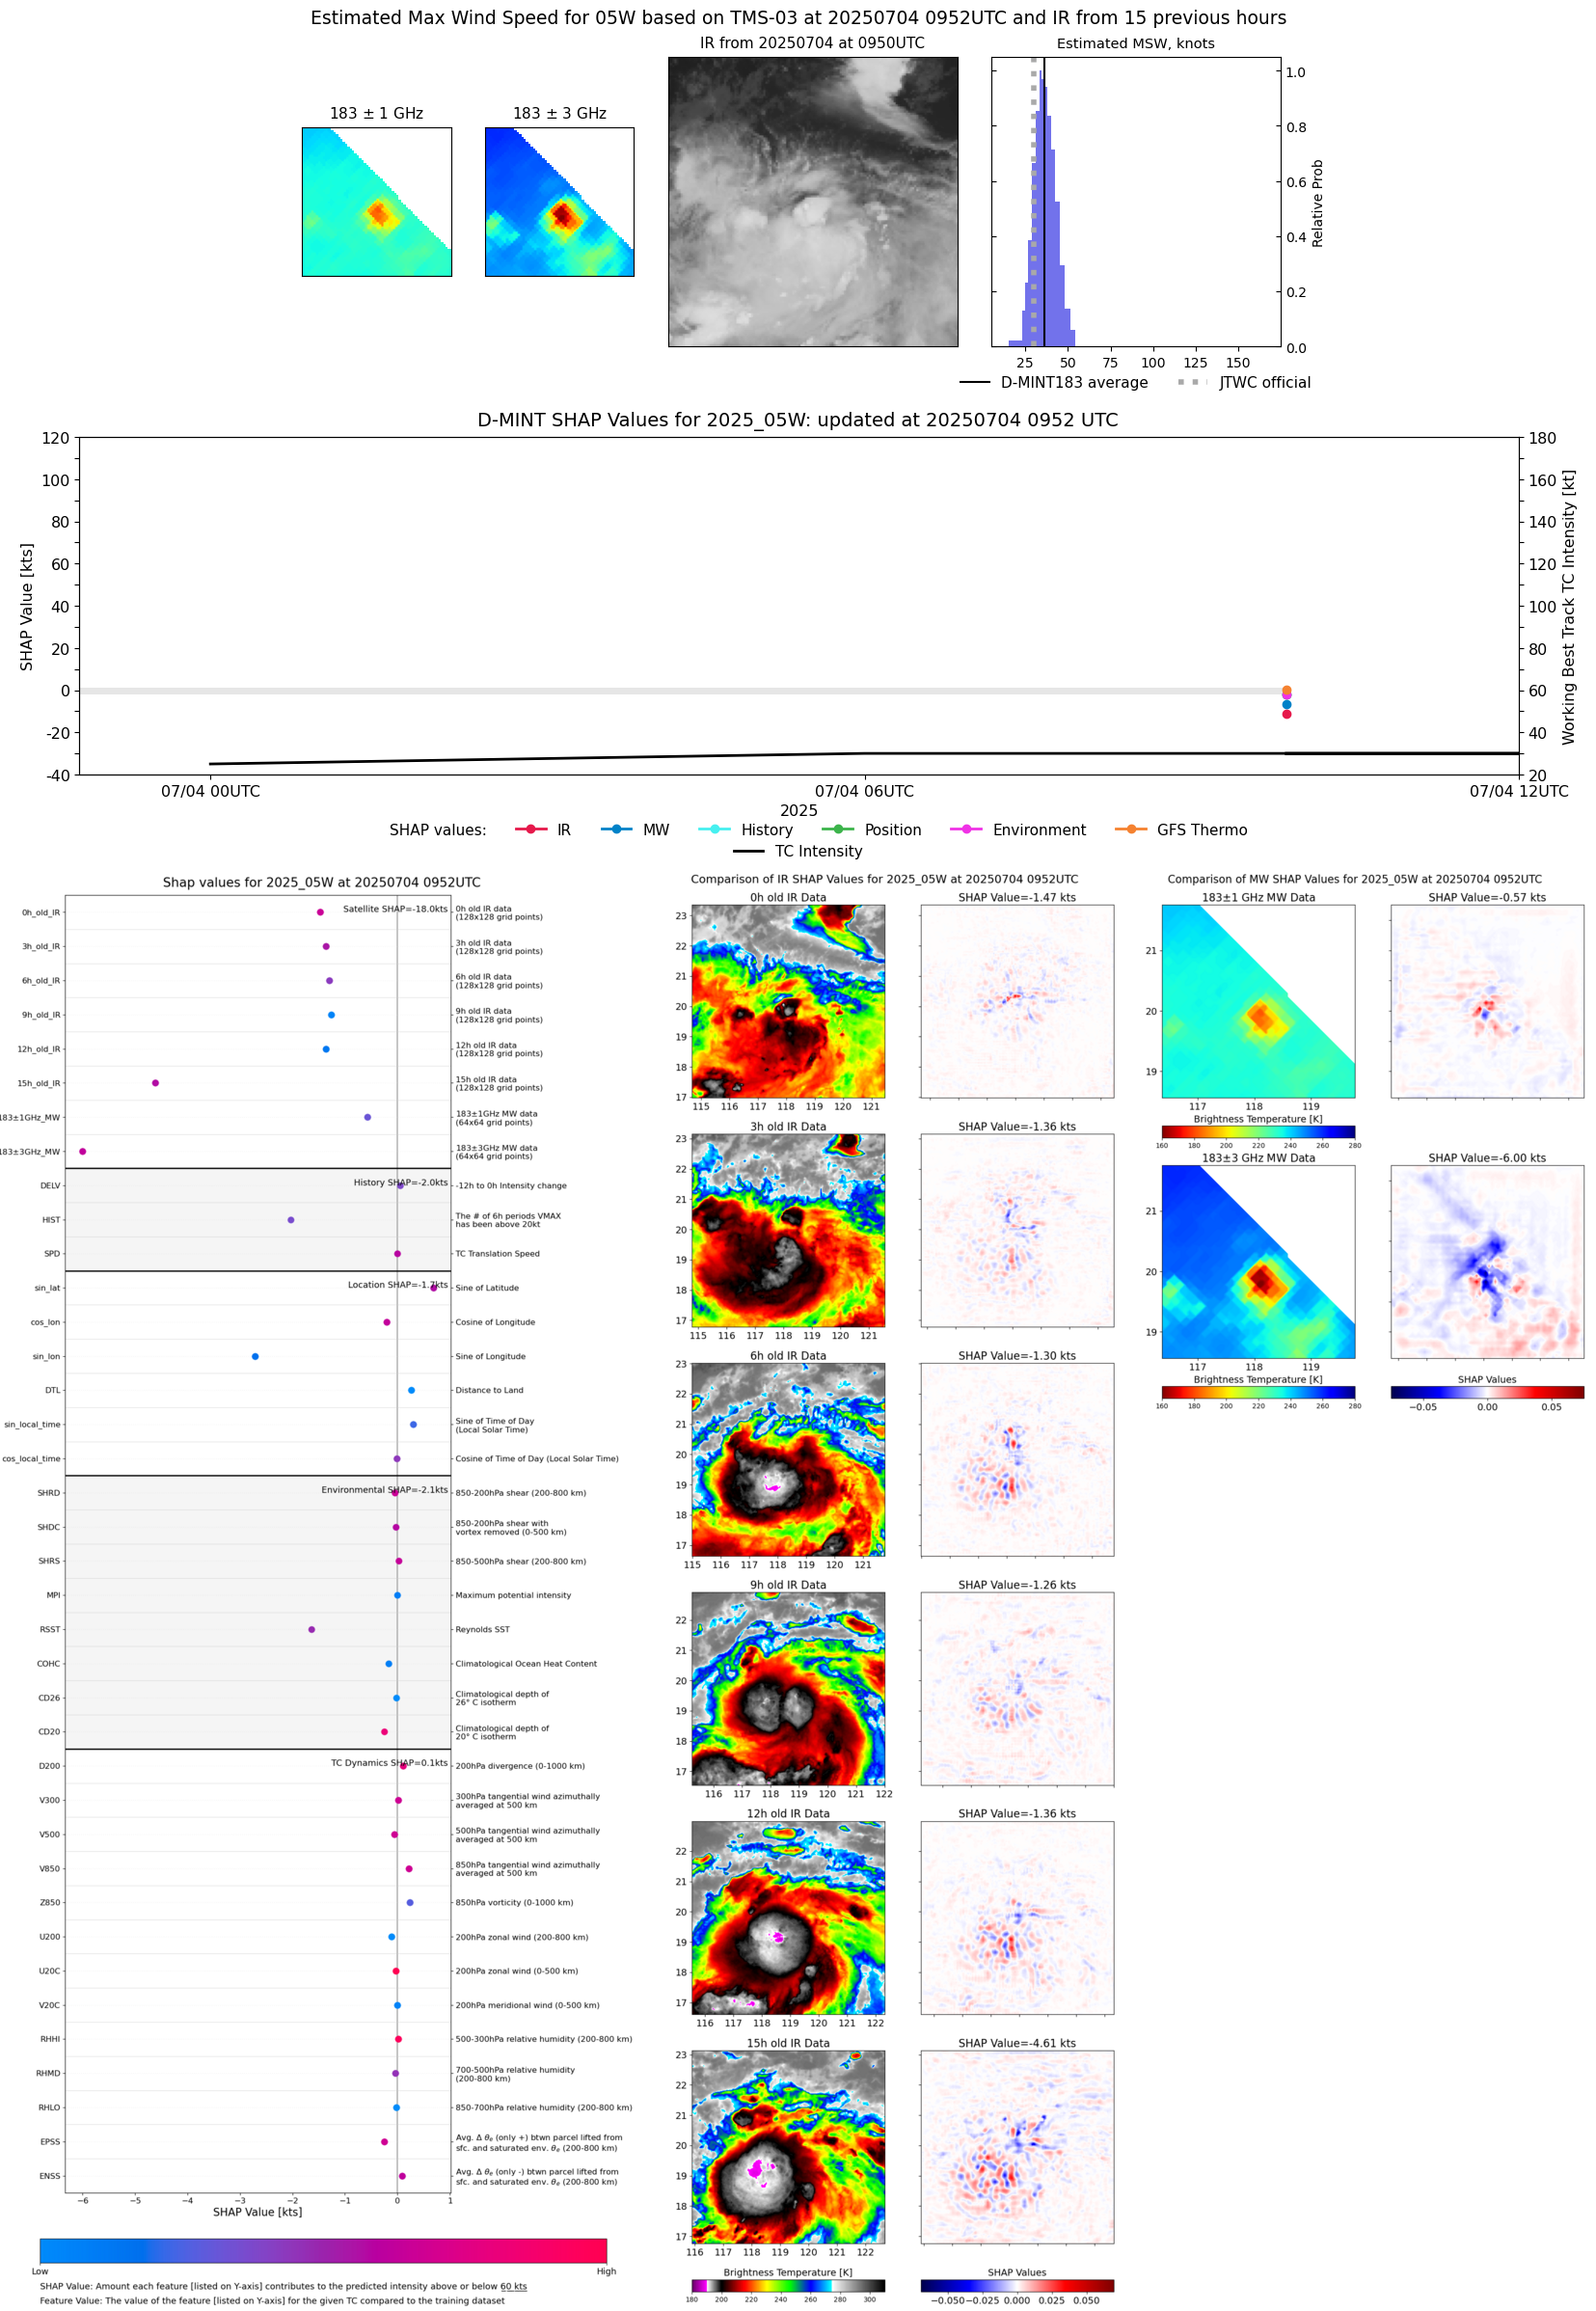 |
| 20250704 | 0618 UTC | TROPICS05 | 1001 hPa | 30 kts | 27 kts | 35 kts | 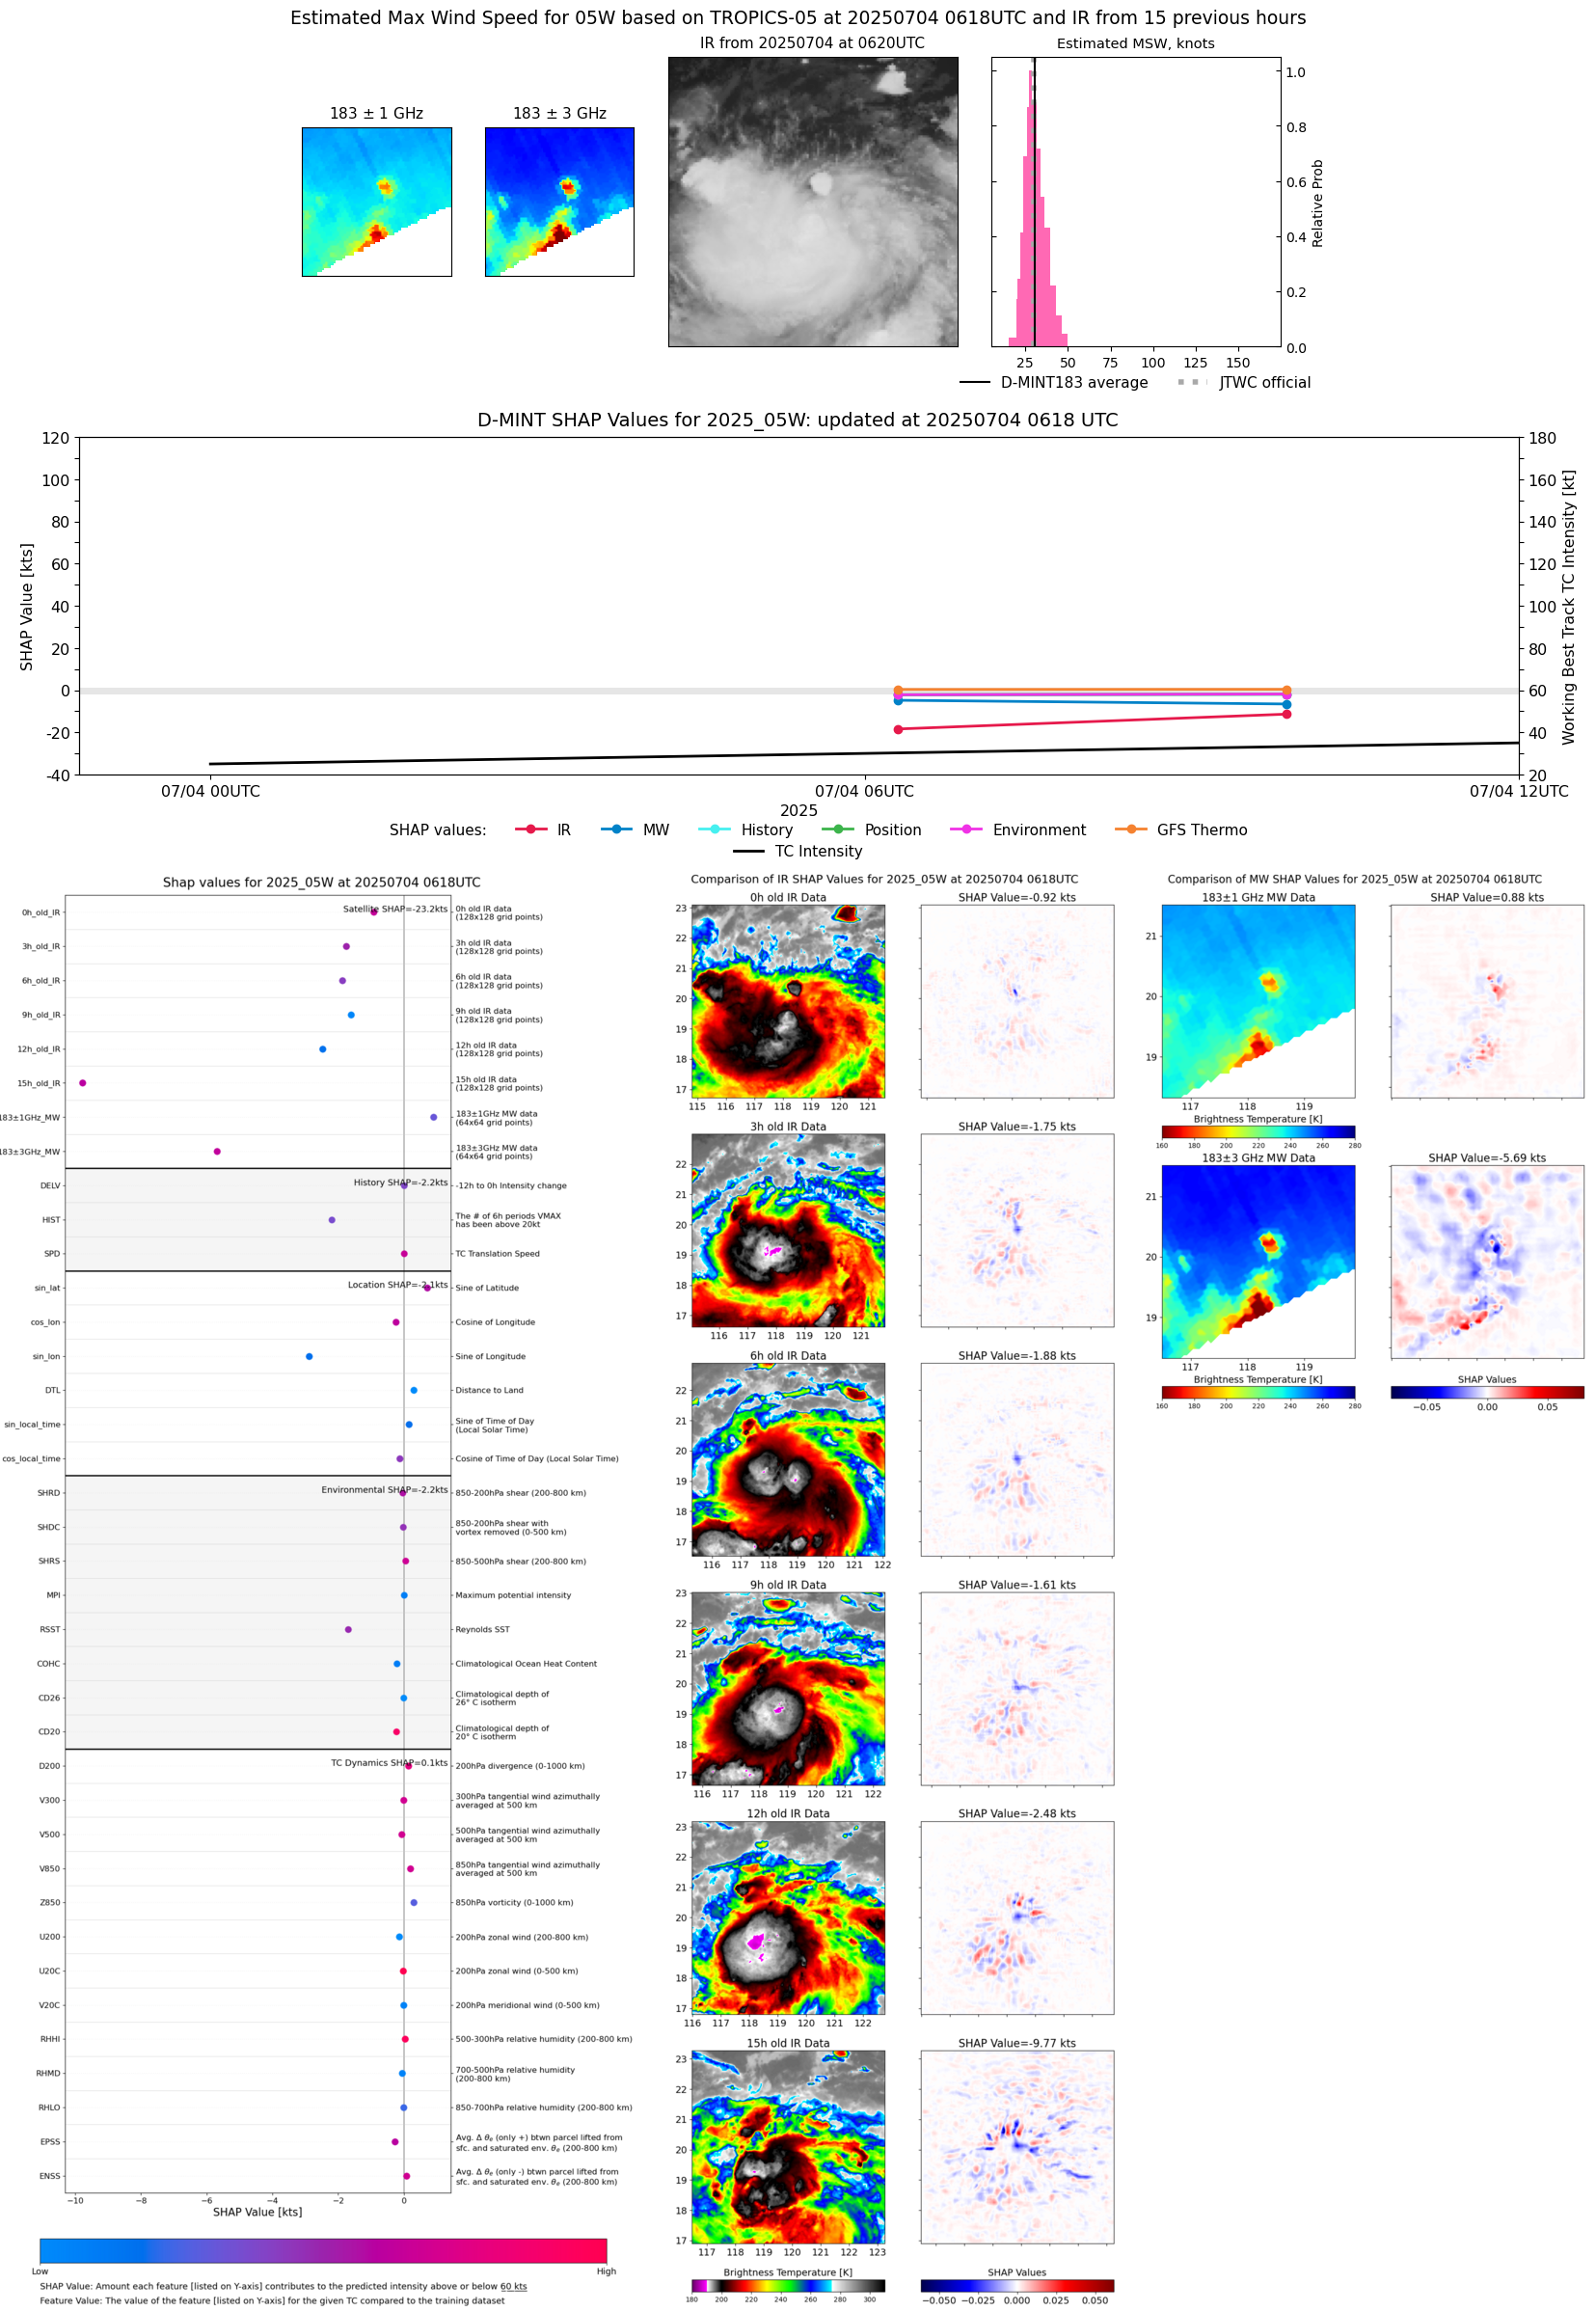 |
| 20250704 | 0506 UTC | AMSR2 | 998 hPa | 37 kts | 32 kts | 42 kts | 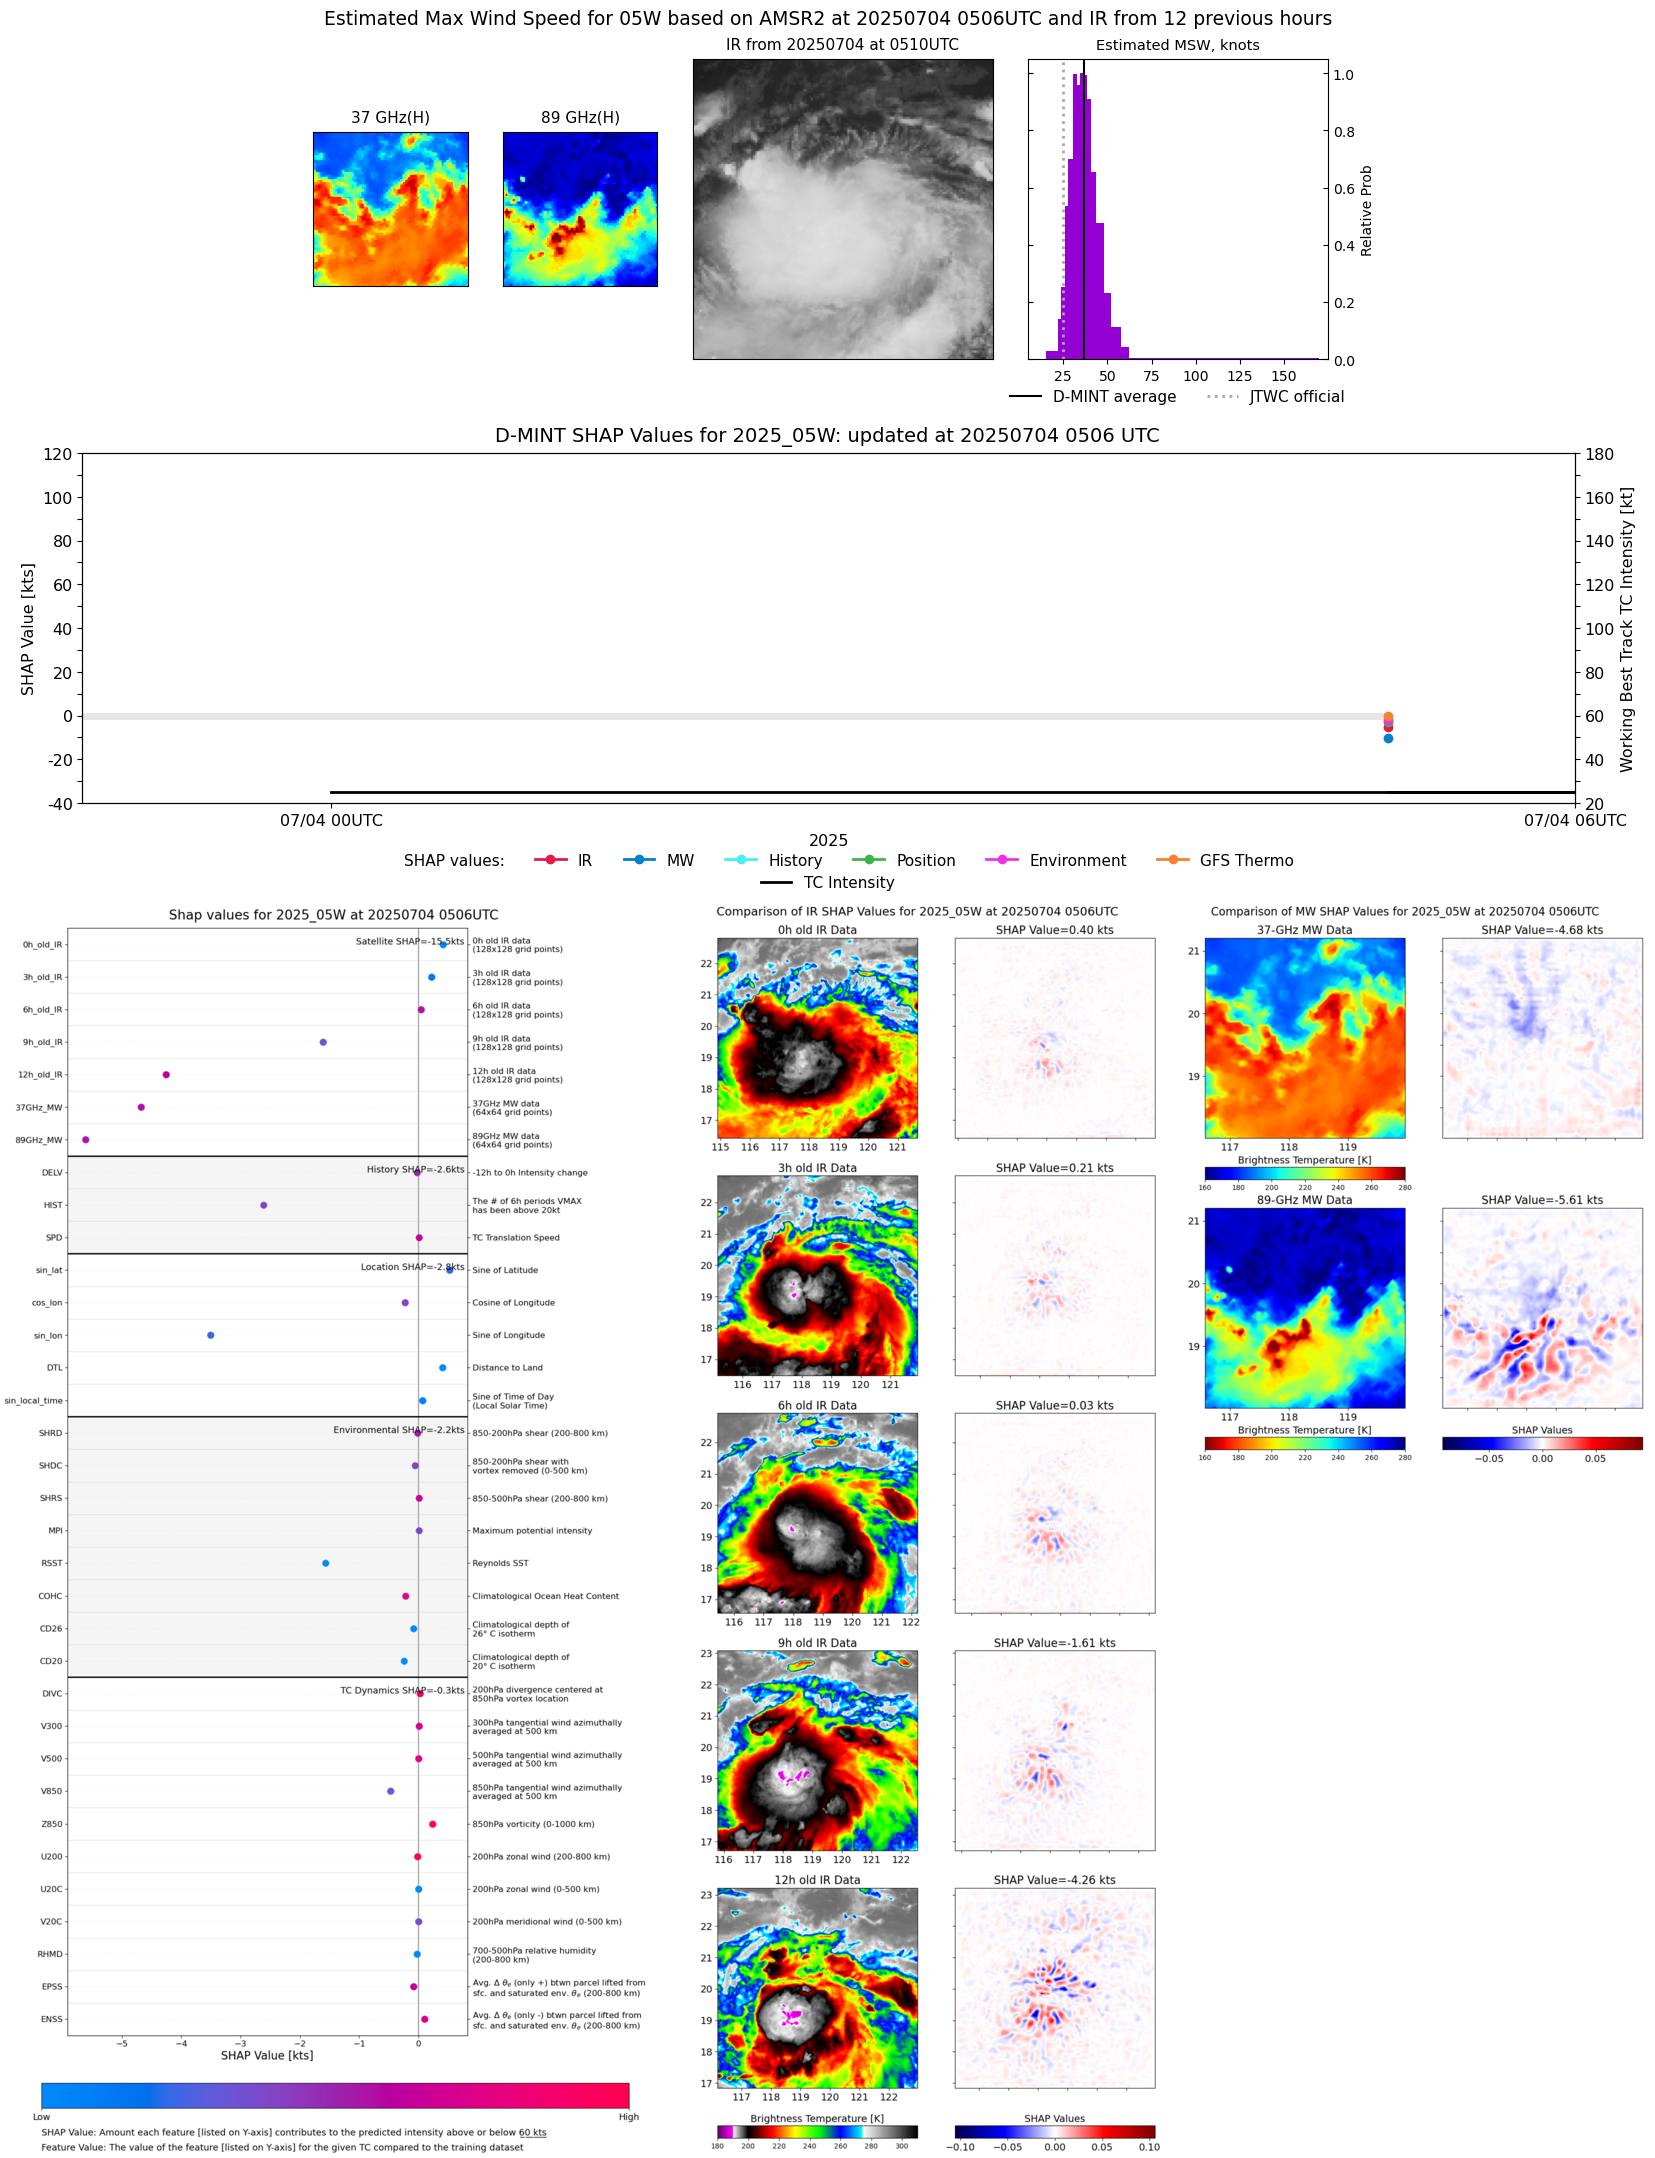 |