|
||

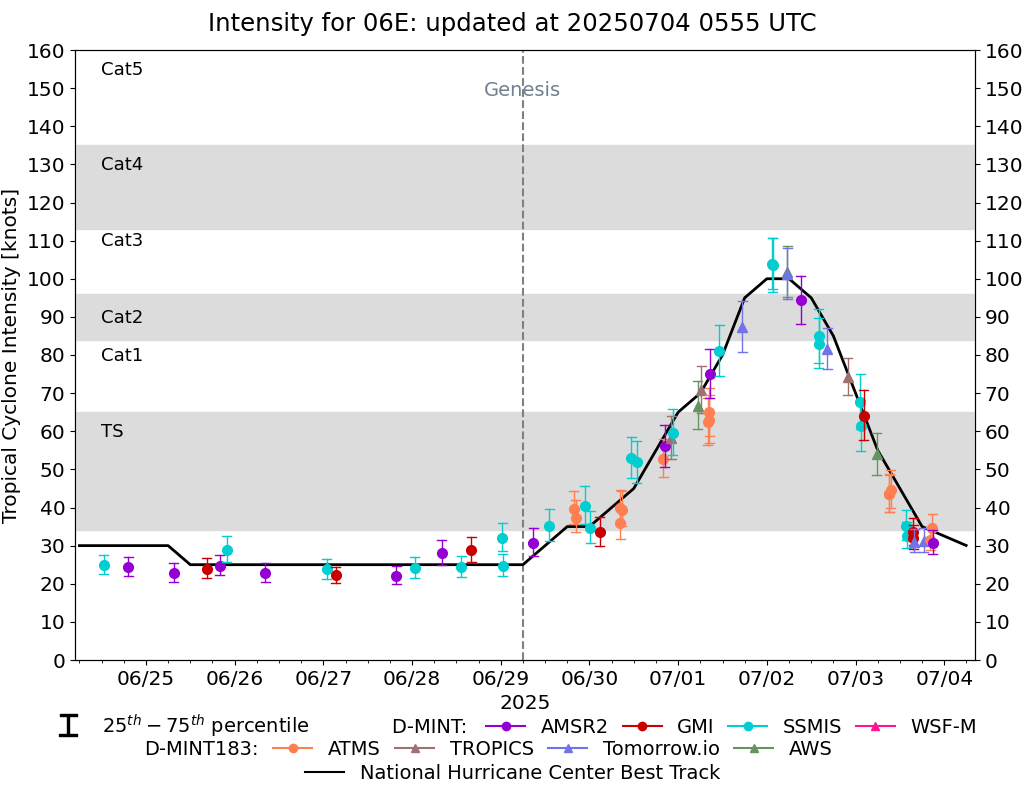 |
D-MINT HISTORY FILE for 2025_06E
| Date | Time | MW Sensor | MSLP | Vmax (30th-70th percentile average) | Vmax 25th percentile | Vmax 75th percentile | Image |
| 20250703 | 2051 UTC | AMSR2 | 1005 hPa | 31 kts | 28 kts | 34 kts | 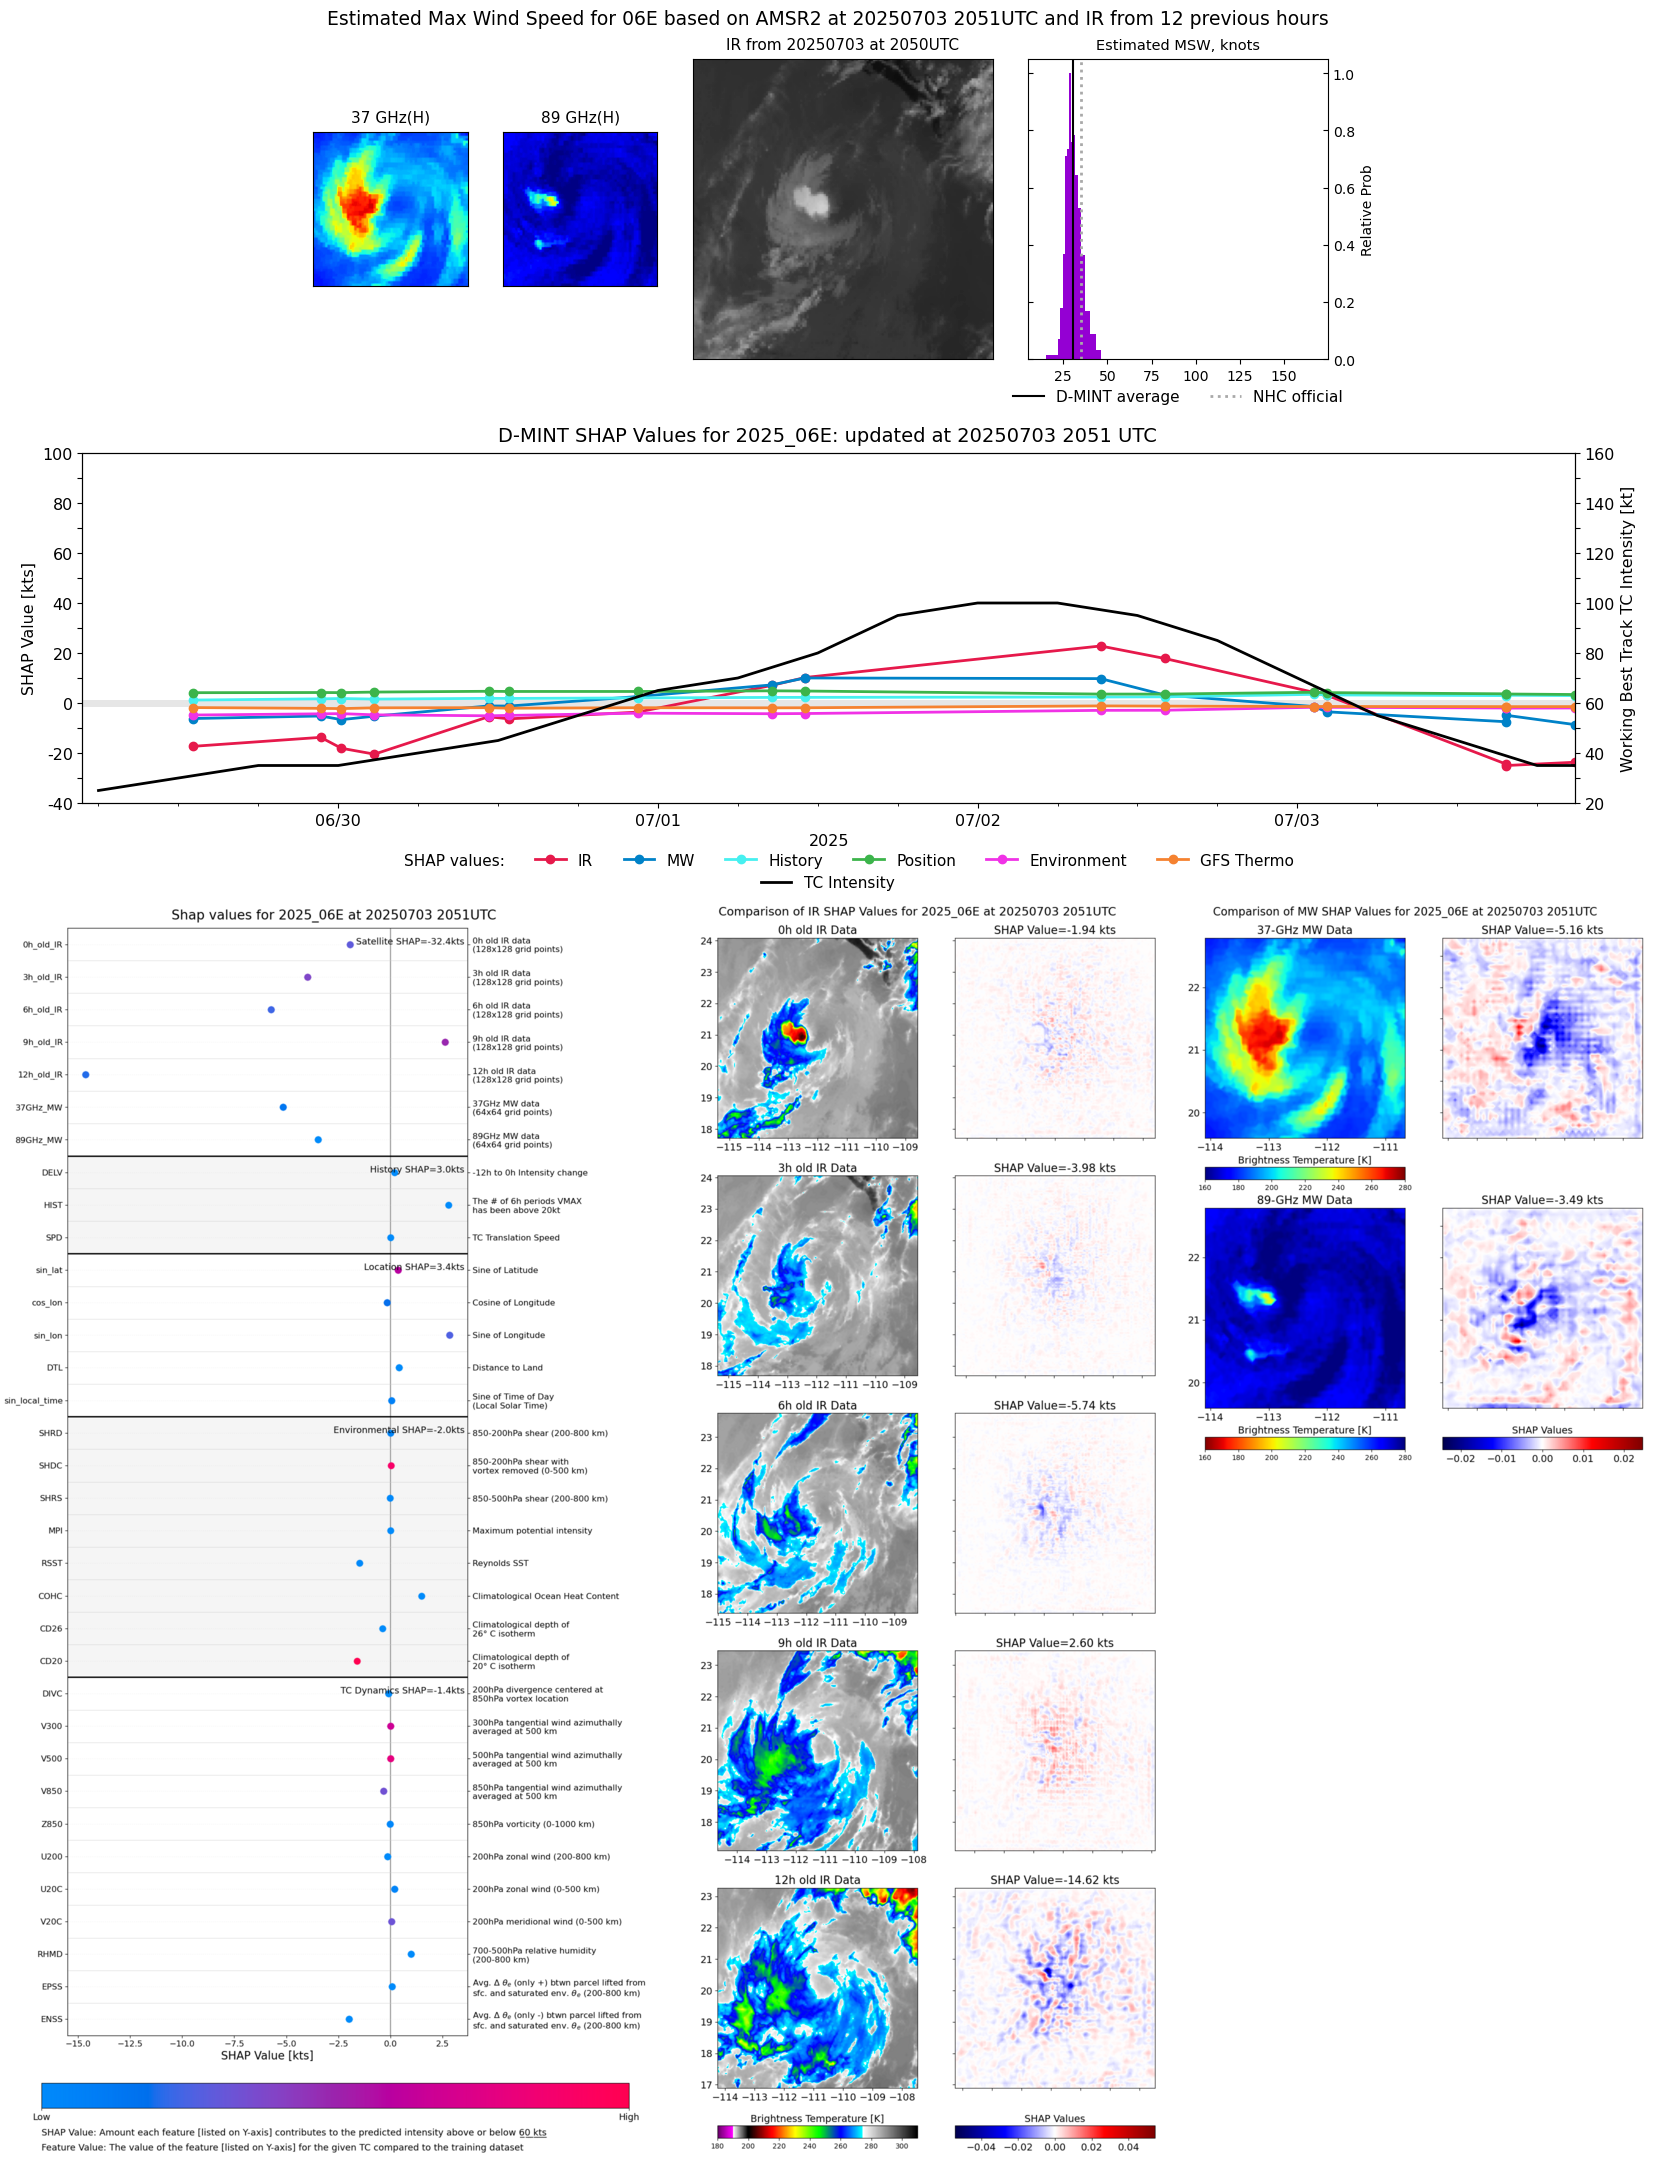 |
| 20250703 | 2042 UTC | ATMS-NPP | 1003 hPa | 35 kts | 31 kts | 38 kts | 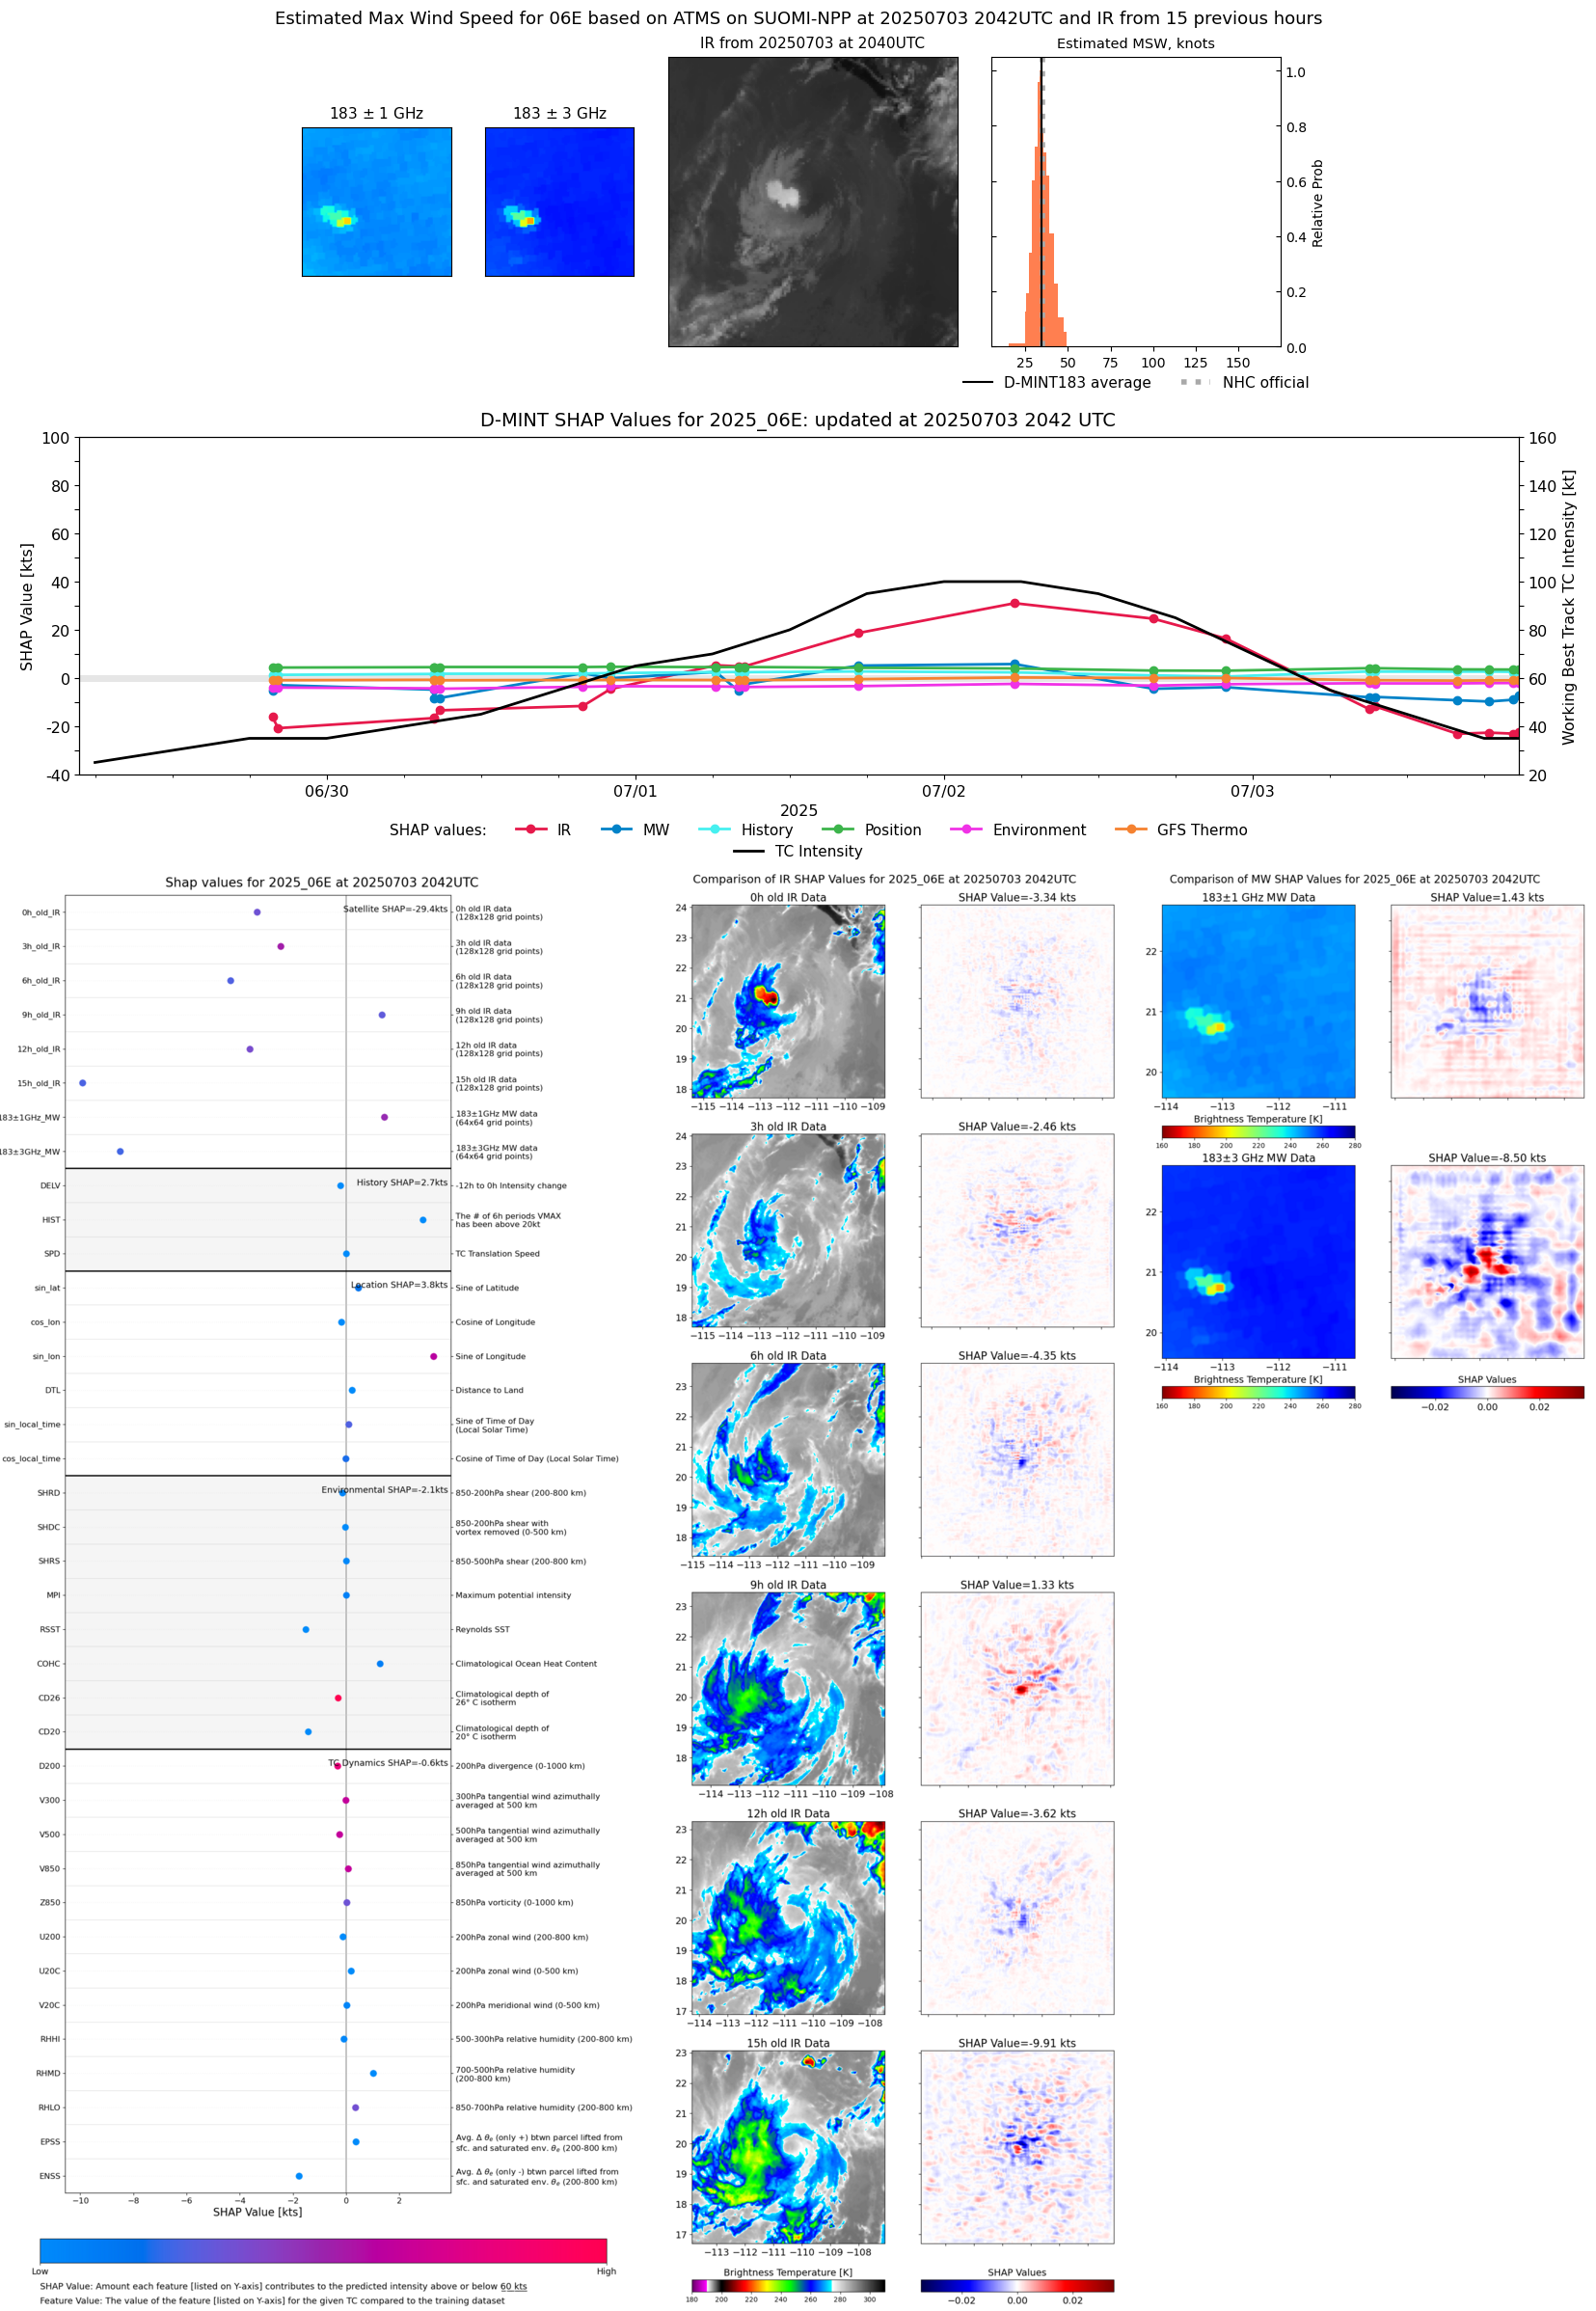 |
| 20250703 | 2015 UTC | ATMS-N21 | 1004 hPa | 32 kts | 29 kts | 35 kts | 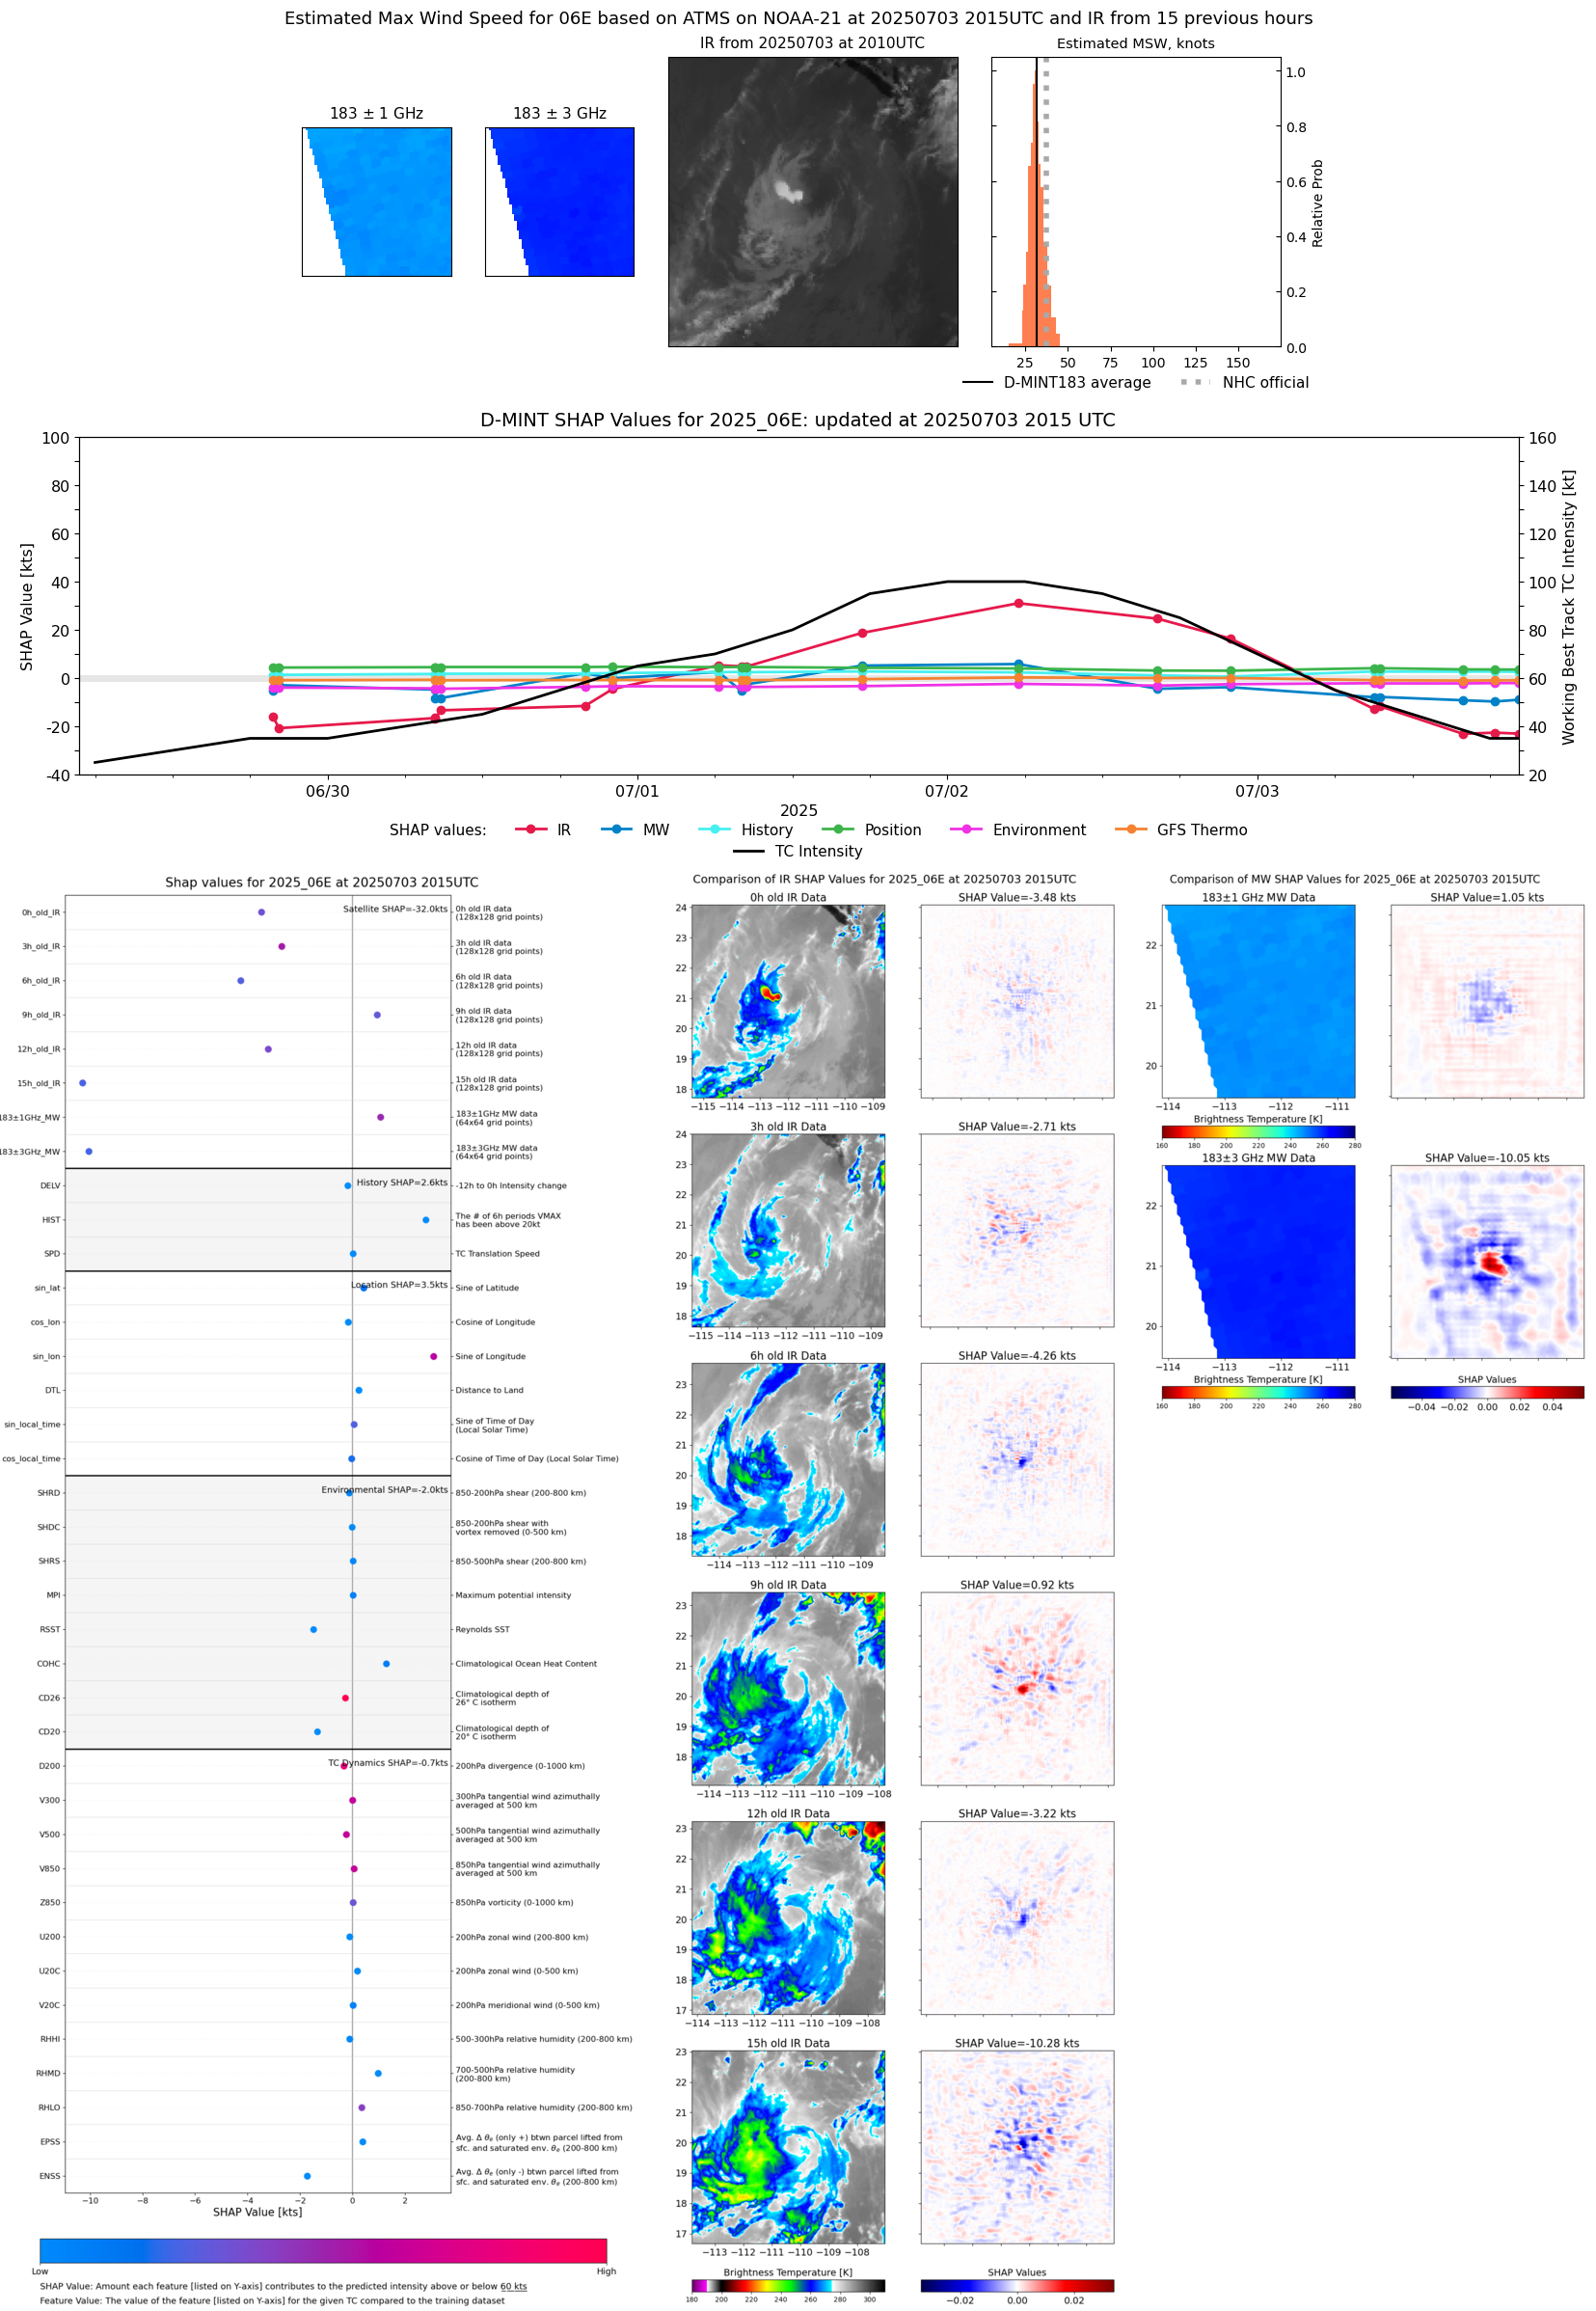 |
| 20250703 | 1823 UTC | TMS02 | 1005 hPa | 31 kts | 28 kts | 35 kts | 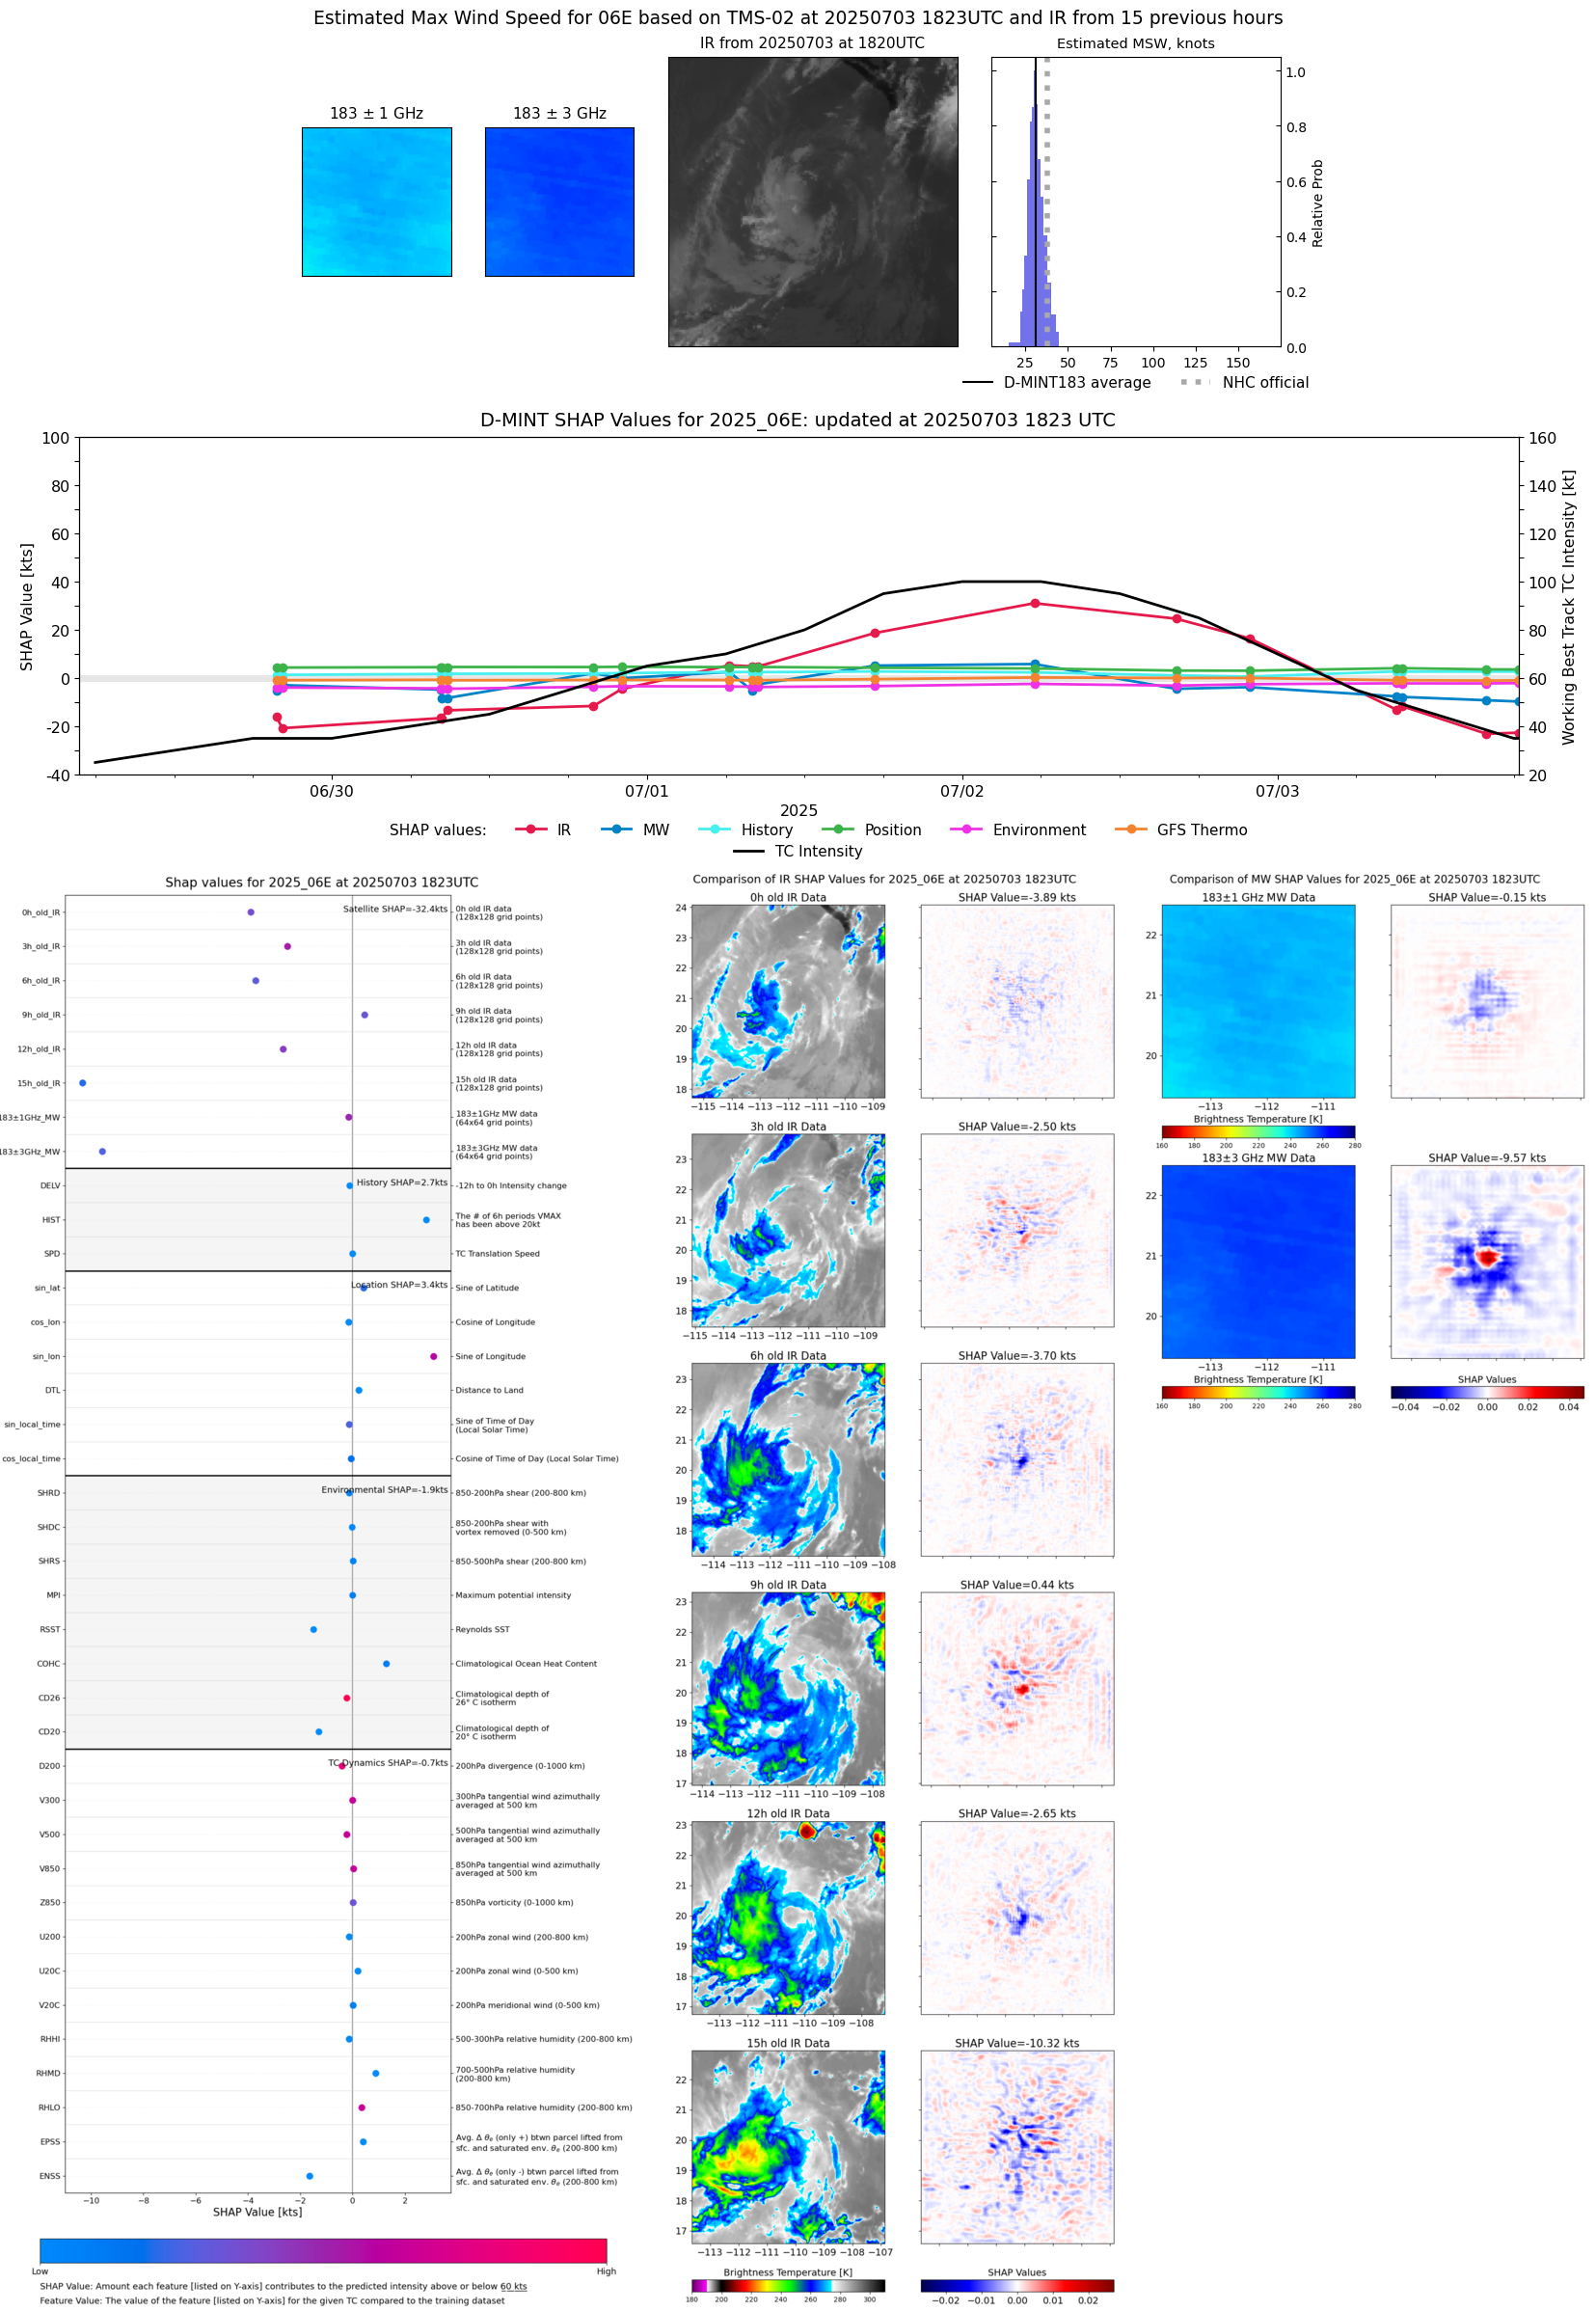 |
| 20250703 | 1555 UTC | TMS03 | 1005 hPa | 31 kts | 28 kts | 34 kts | 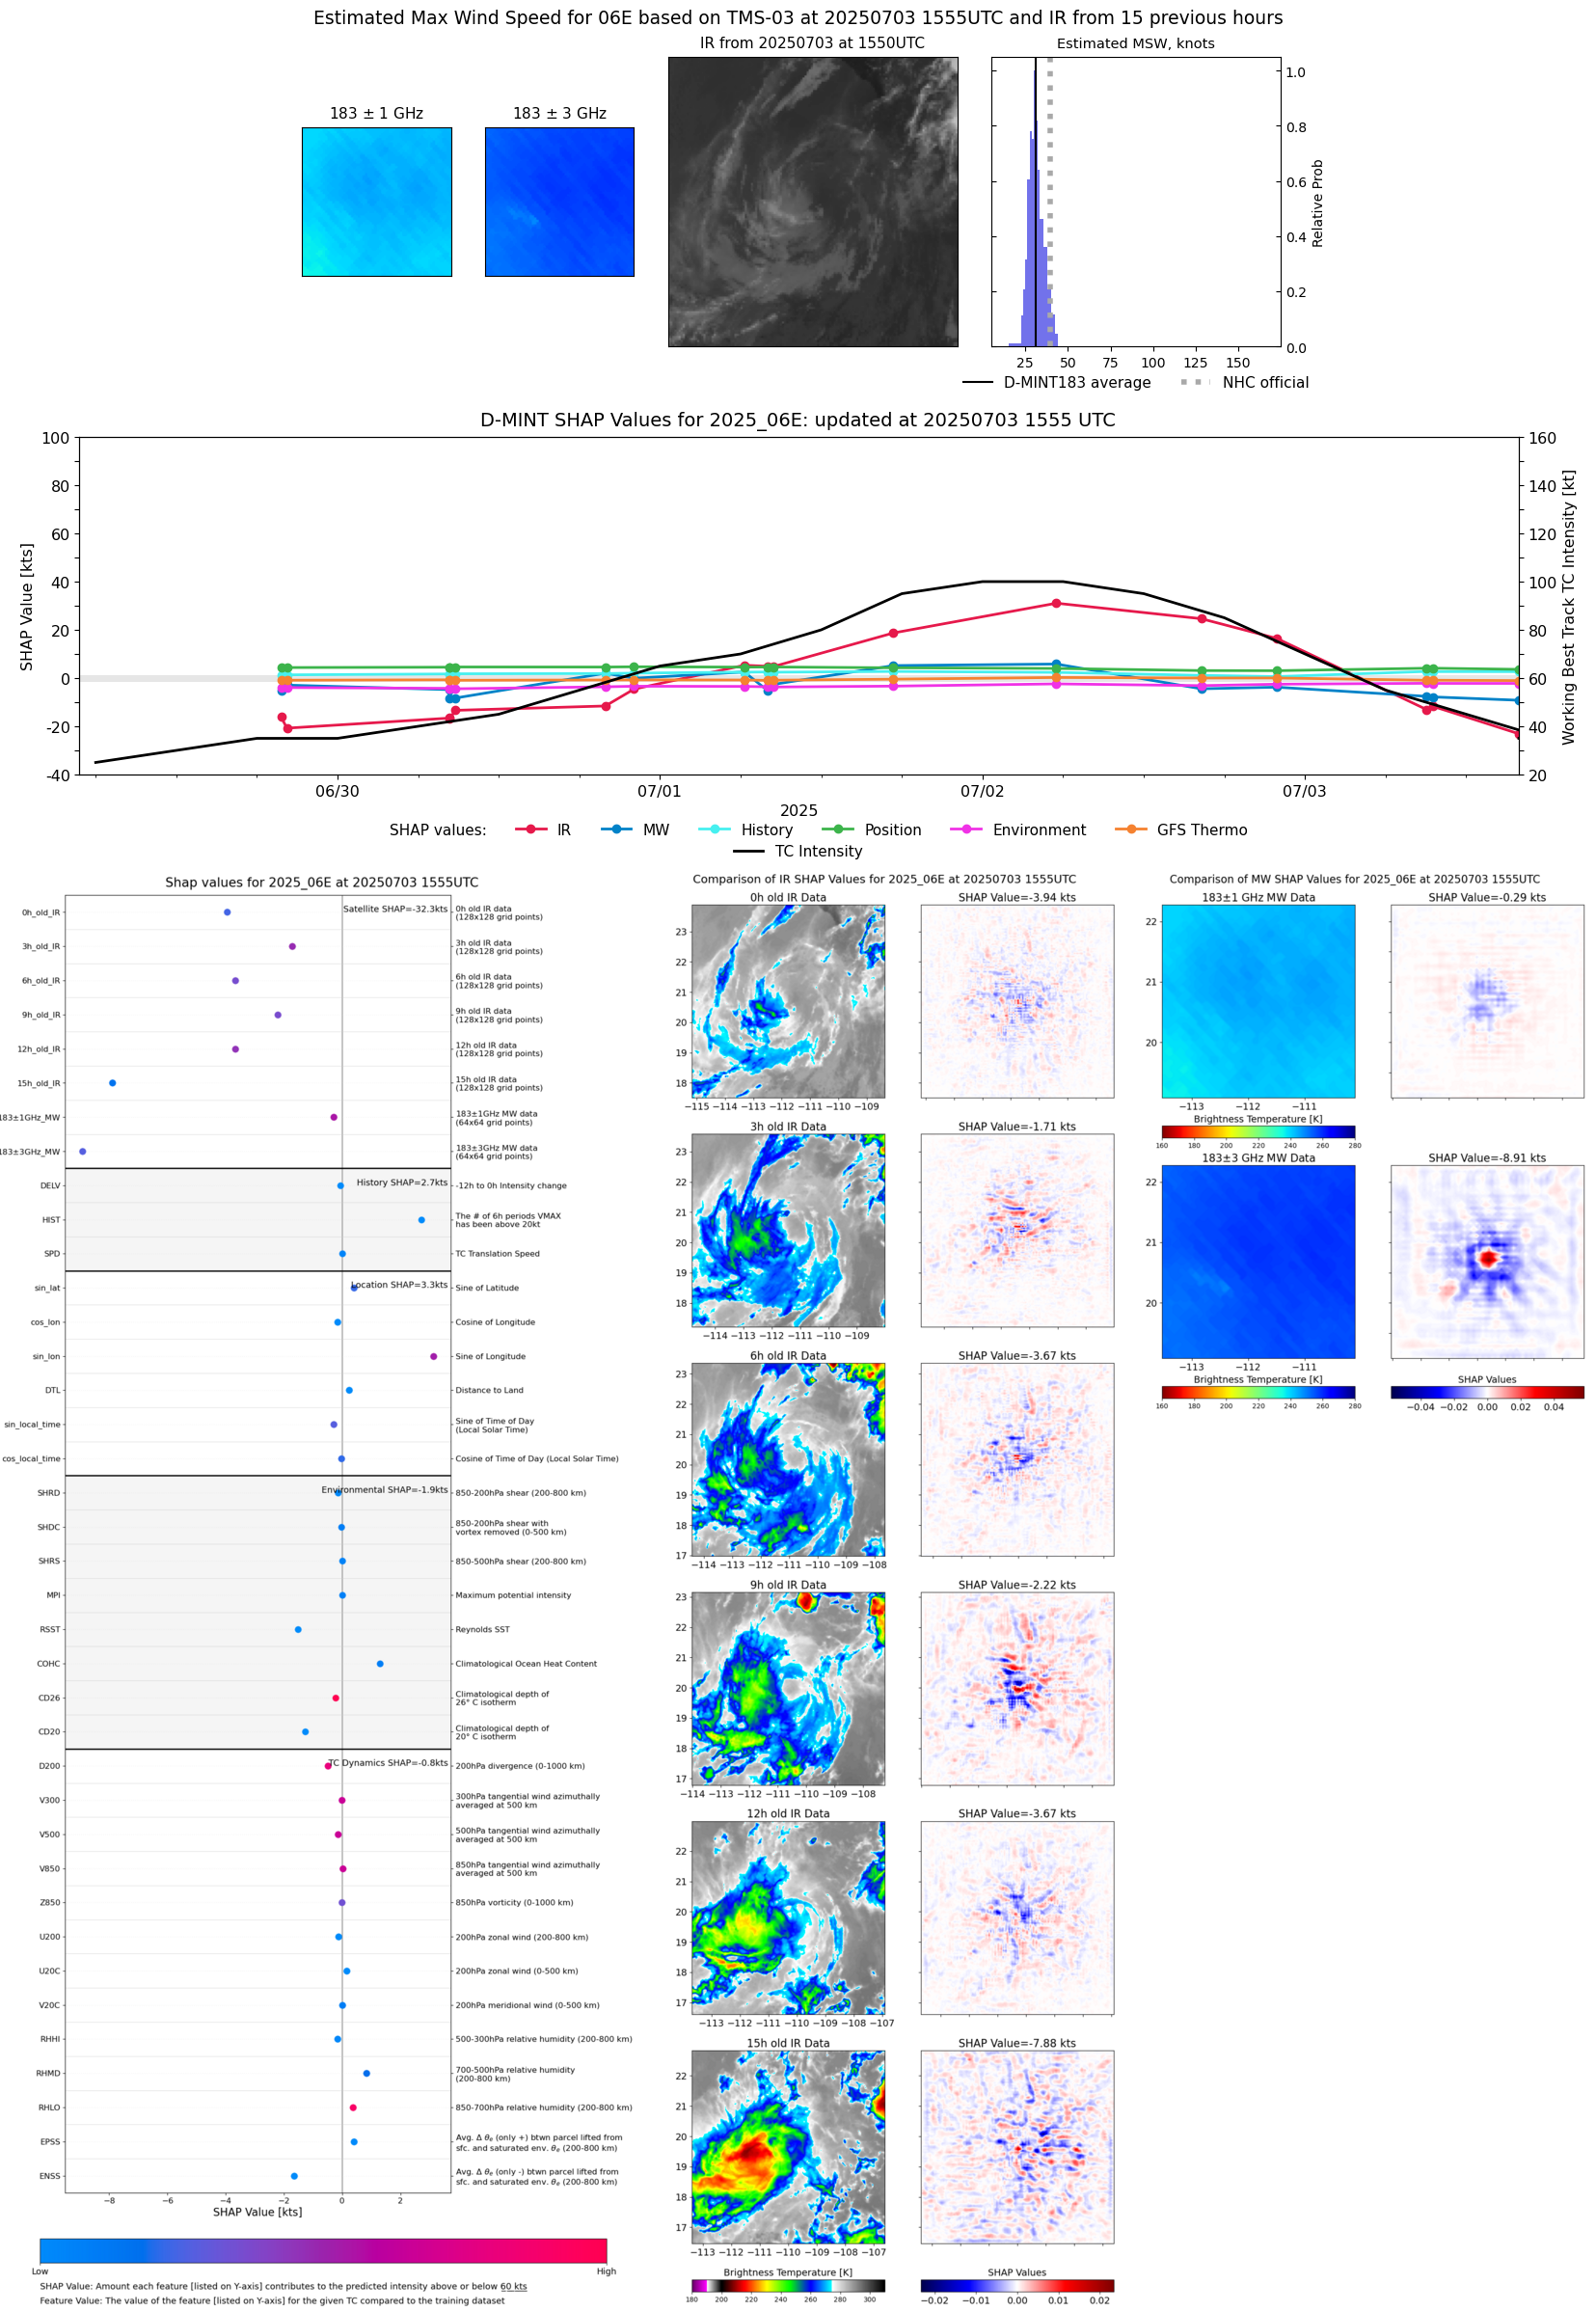 |
| 20250703 | 1540 UTC | GMI | 1003 hPa | 33 kts | 30 kts | 37 kts | 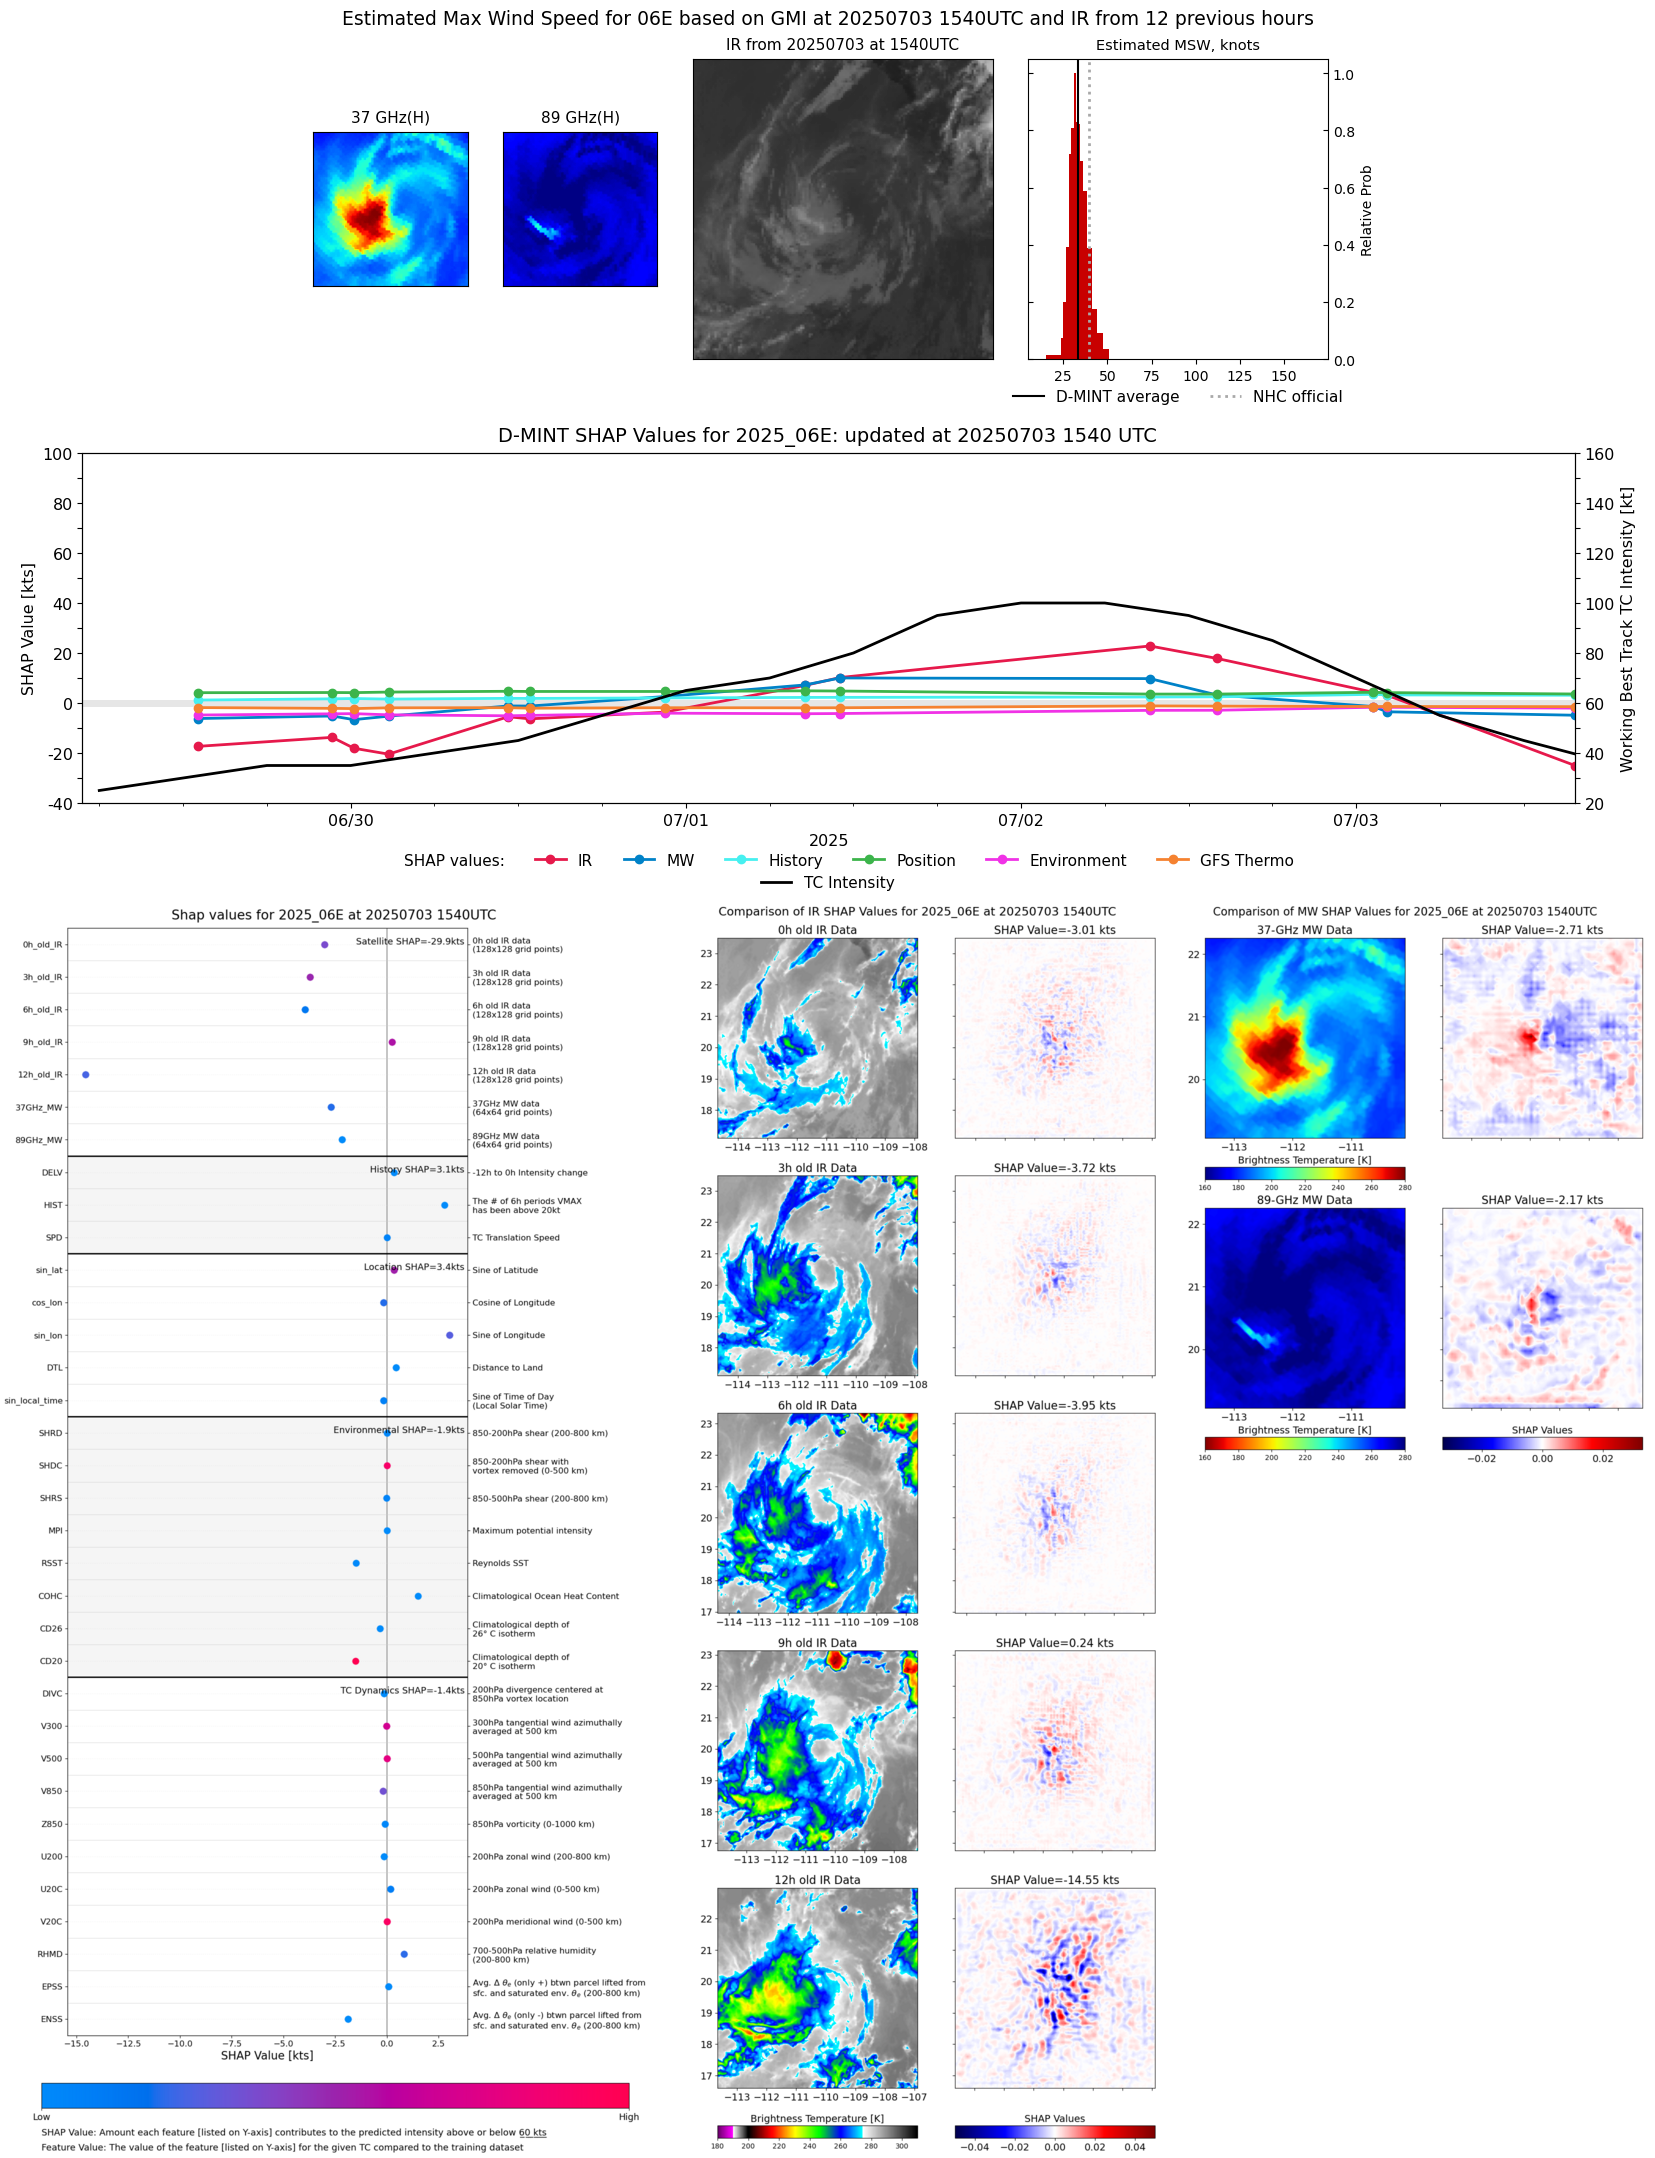 |
| 20250703 | 1538 UTC | GMI | 1005 hPa | 32 kts | 29 kts | 36 kts | 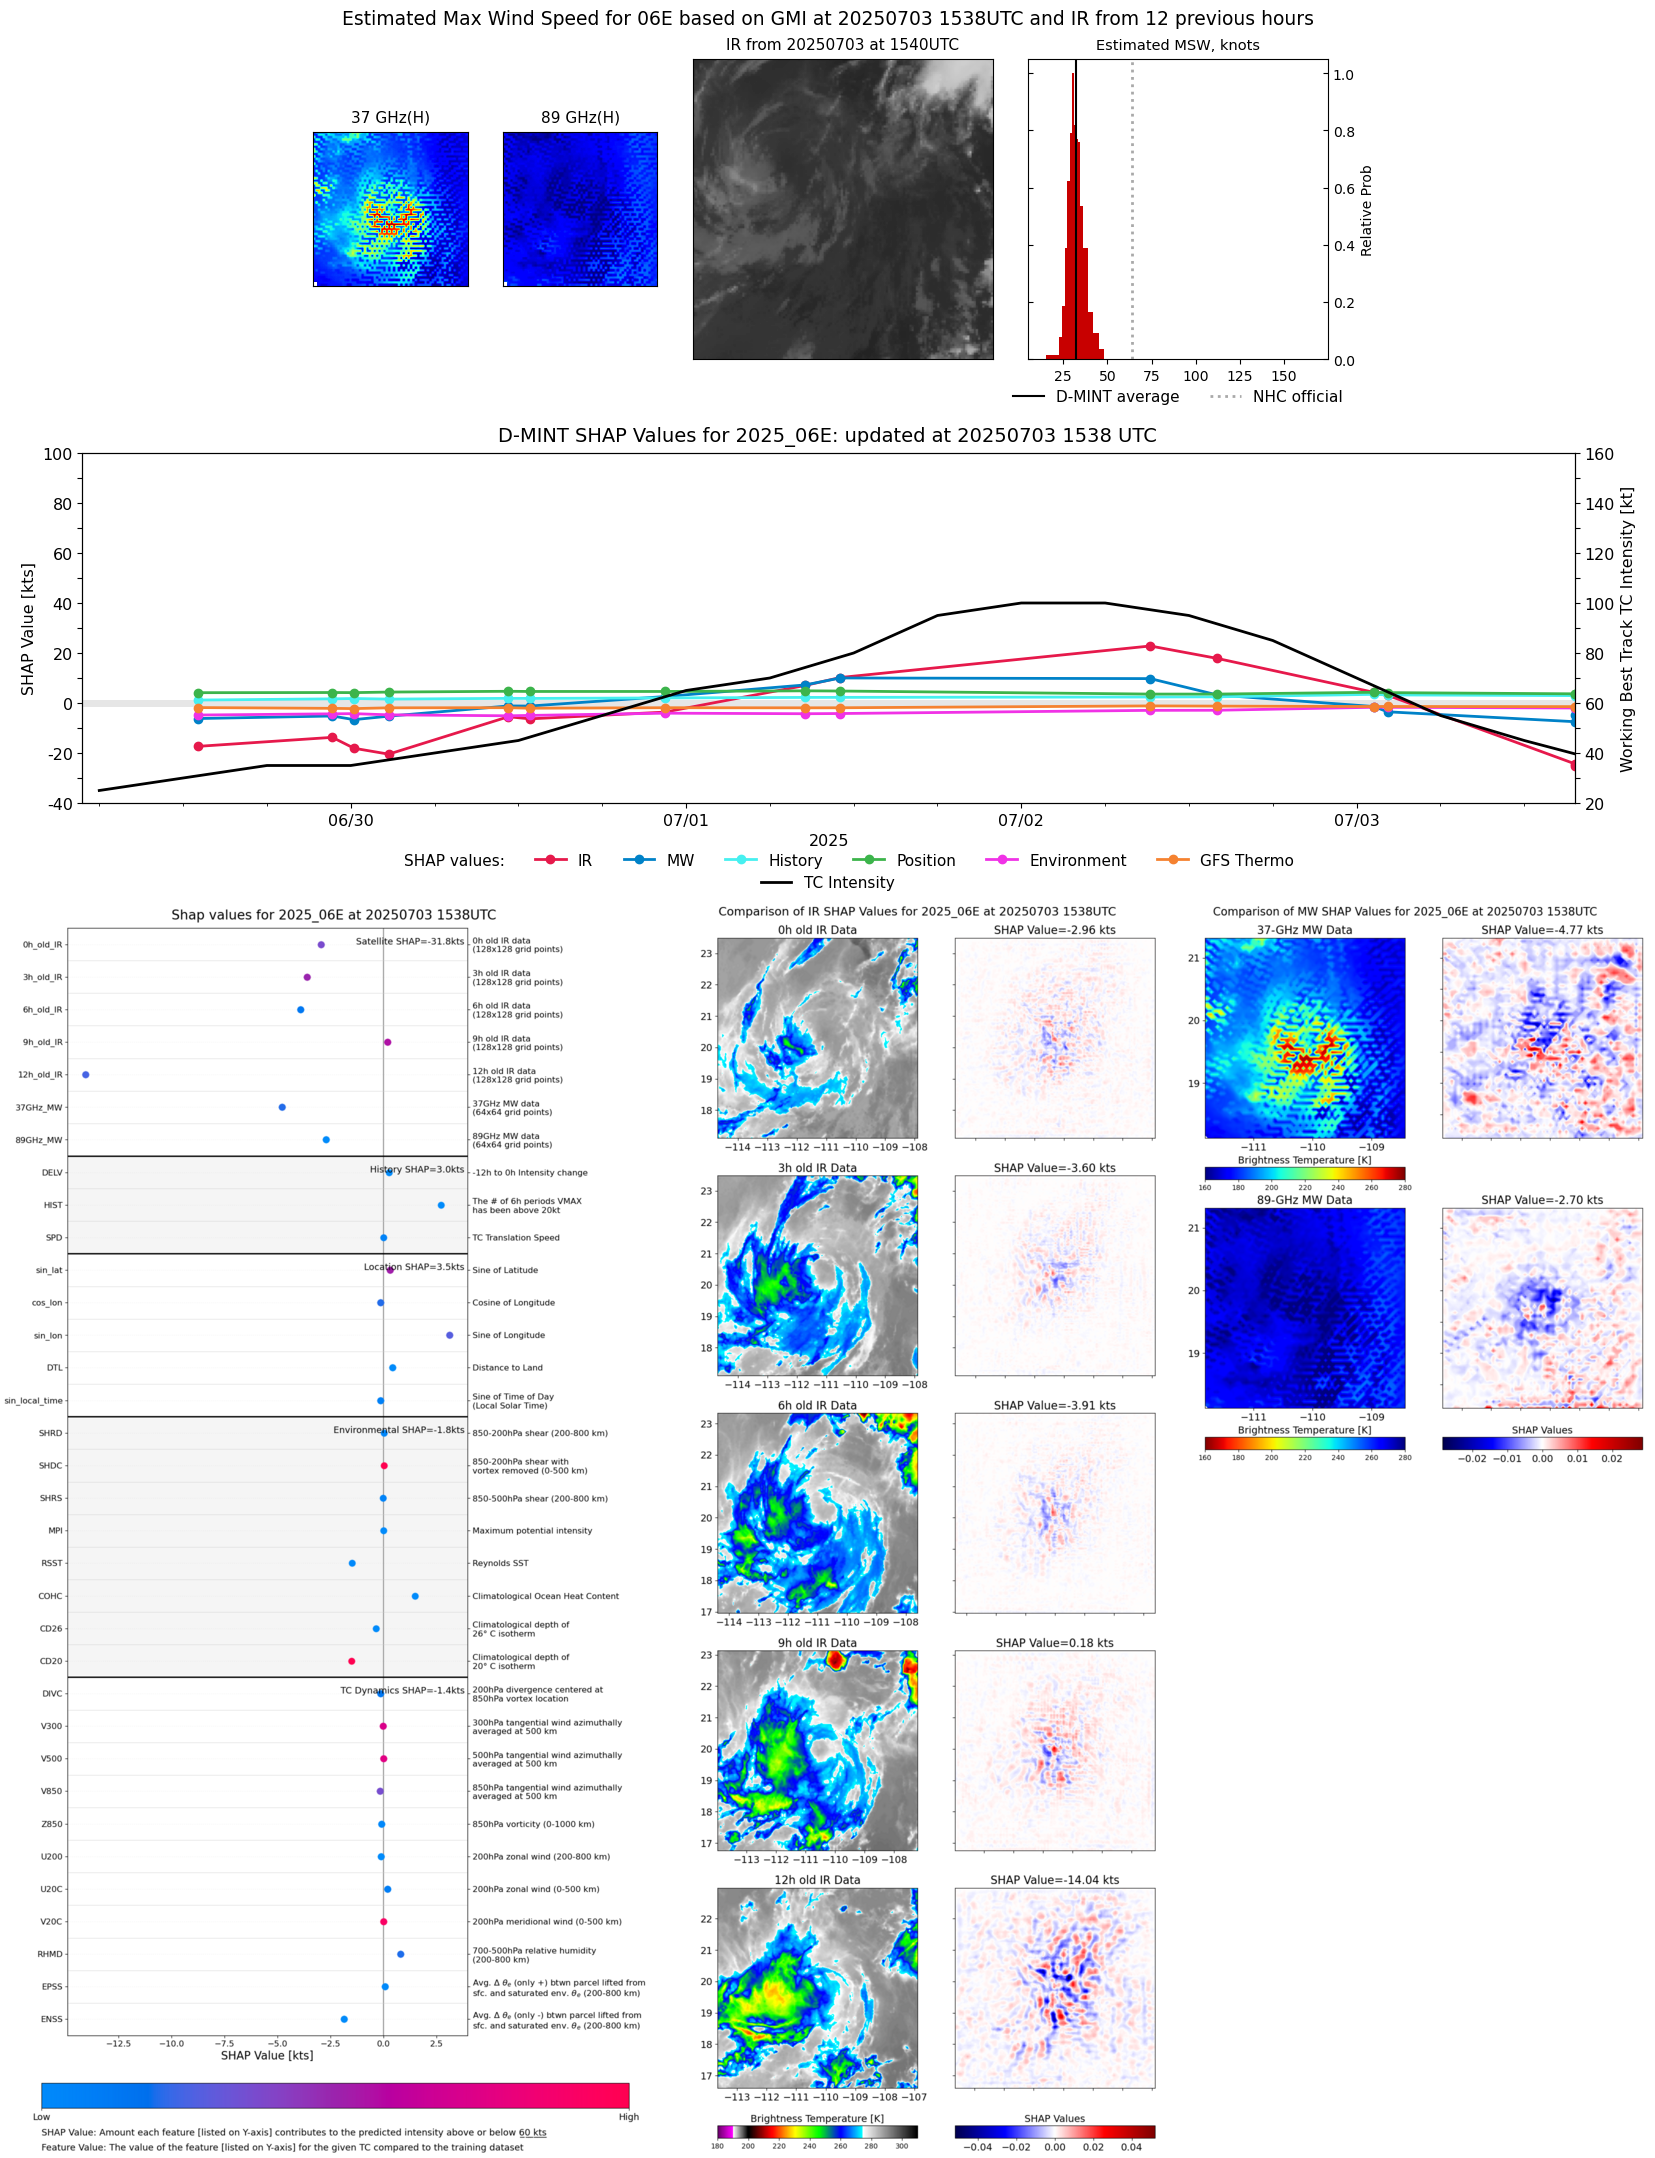 |
| 20250703 | 1352 UTC | SSMISF16 | 1006 hPa | 33 kts | 29 kts | 36 kts | 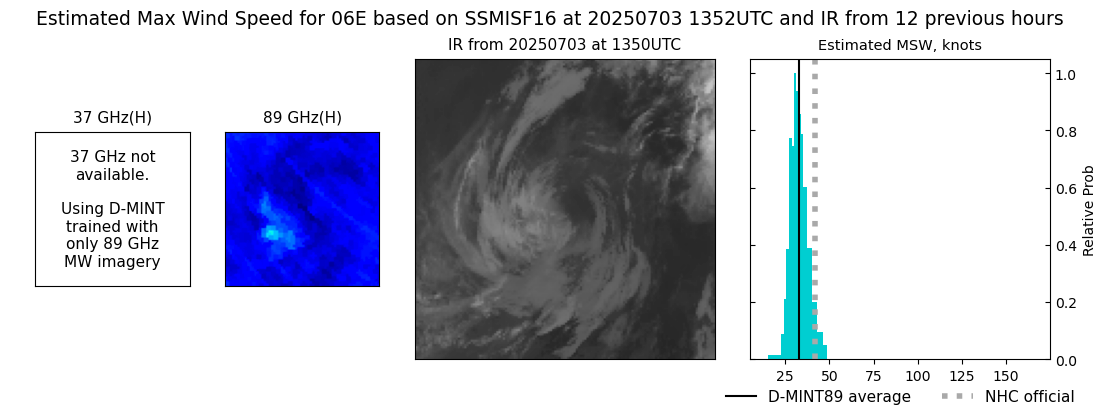 |
| 20250703 | 1346 UTC | SSMISF17 | 1005 hPa | 35 kts | 31 kts | 39 kts | 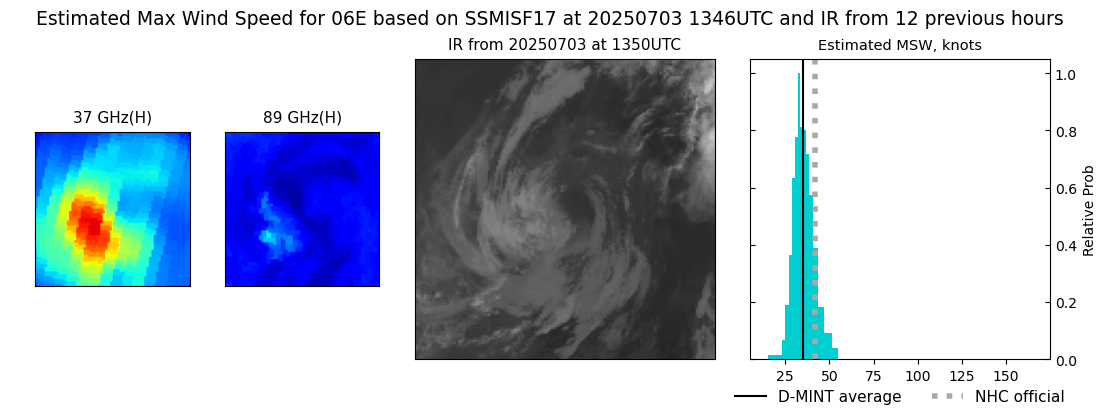 |
| 20250703 | 0930 UTC | ATMS- | 1002 hPa | 45 kts | 40 kts | 50 kts |  |
| 20250703 | 0903 UTC | ATMS- | 1002 hPa | 44 kts | 39 kts | 49 kts | 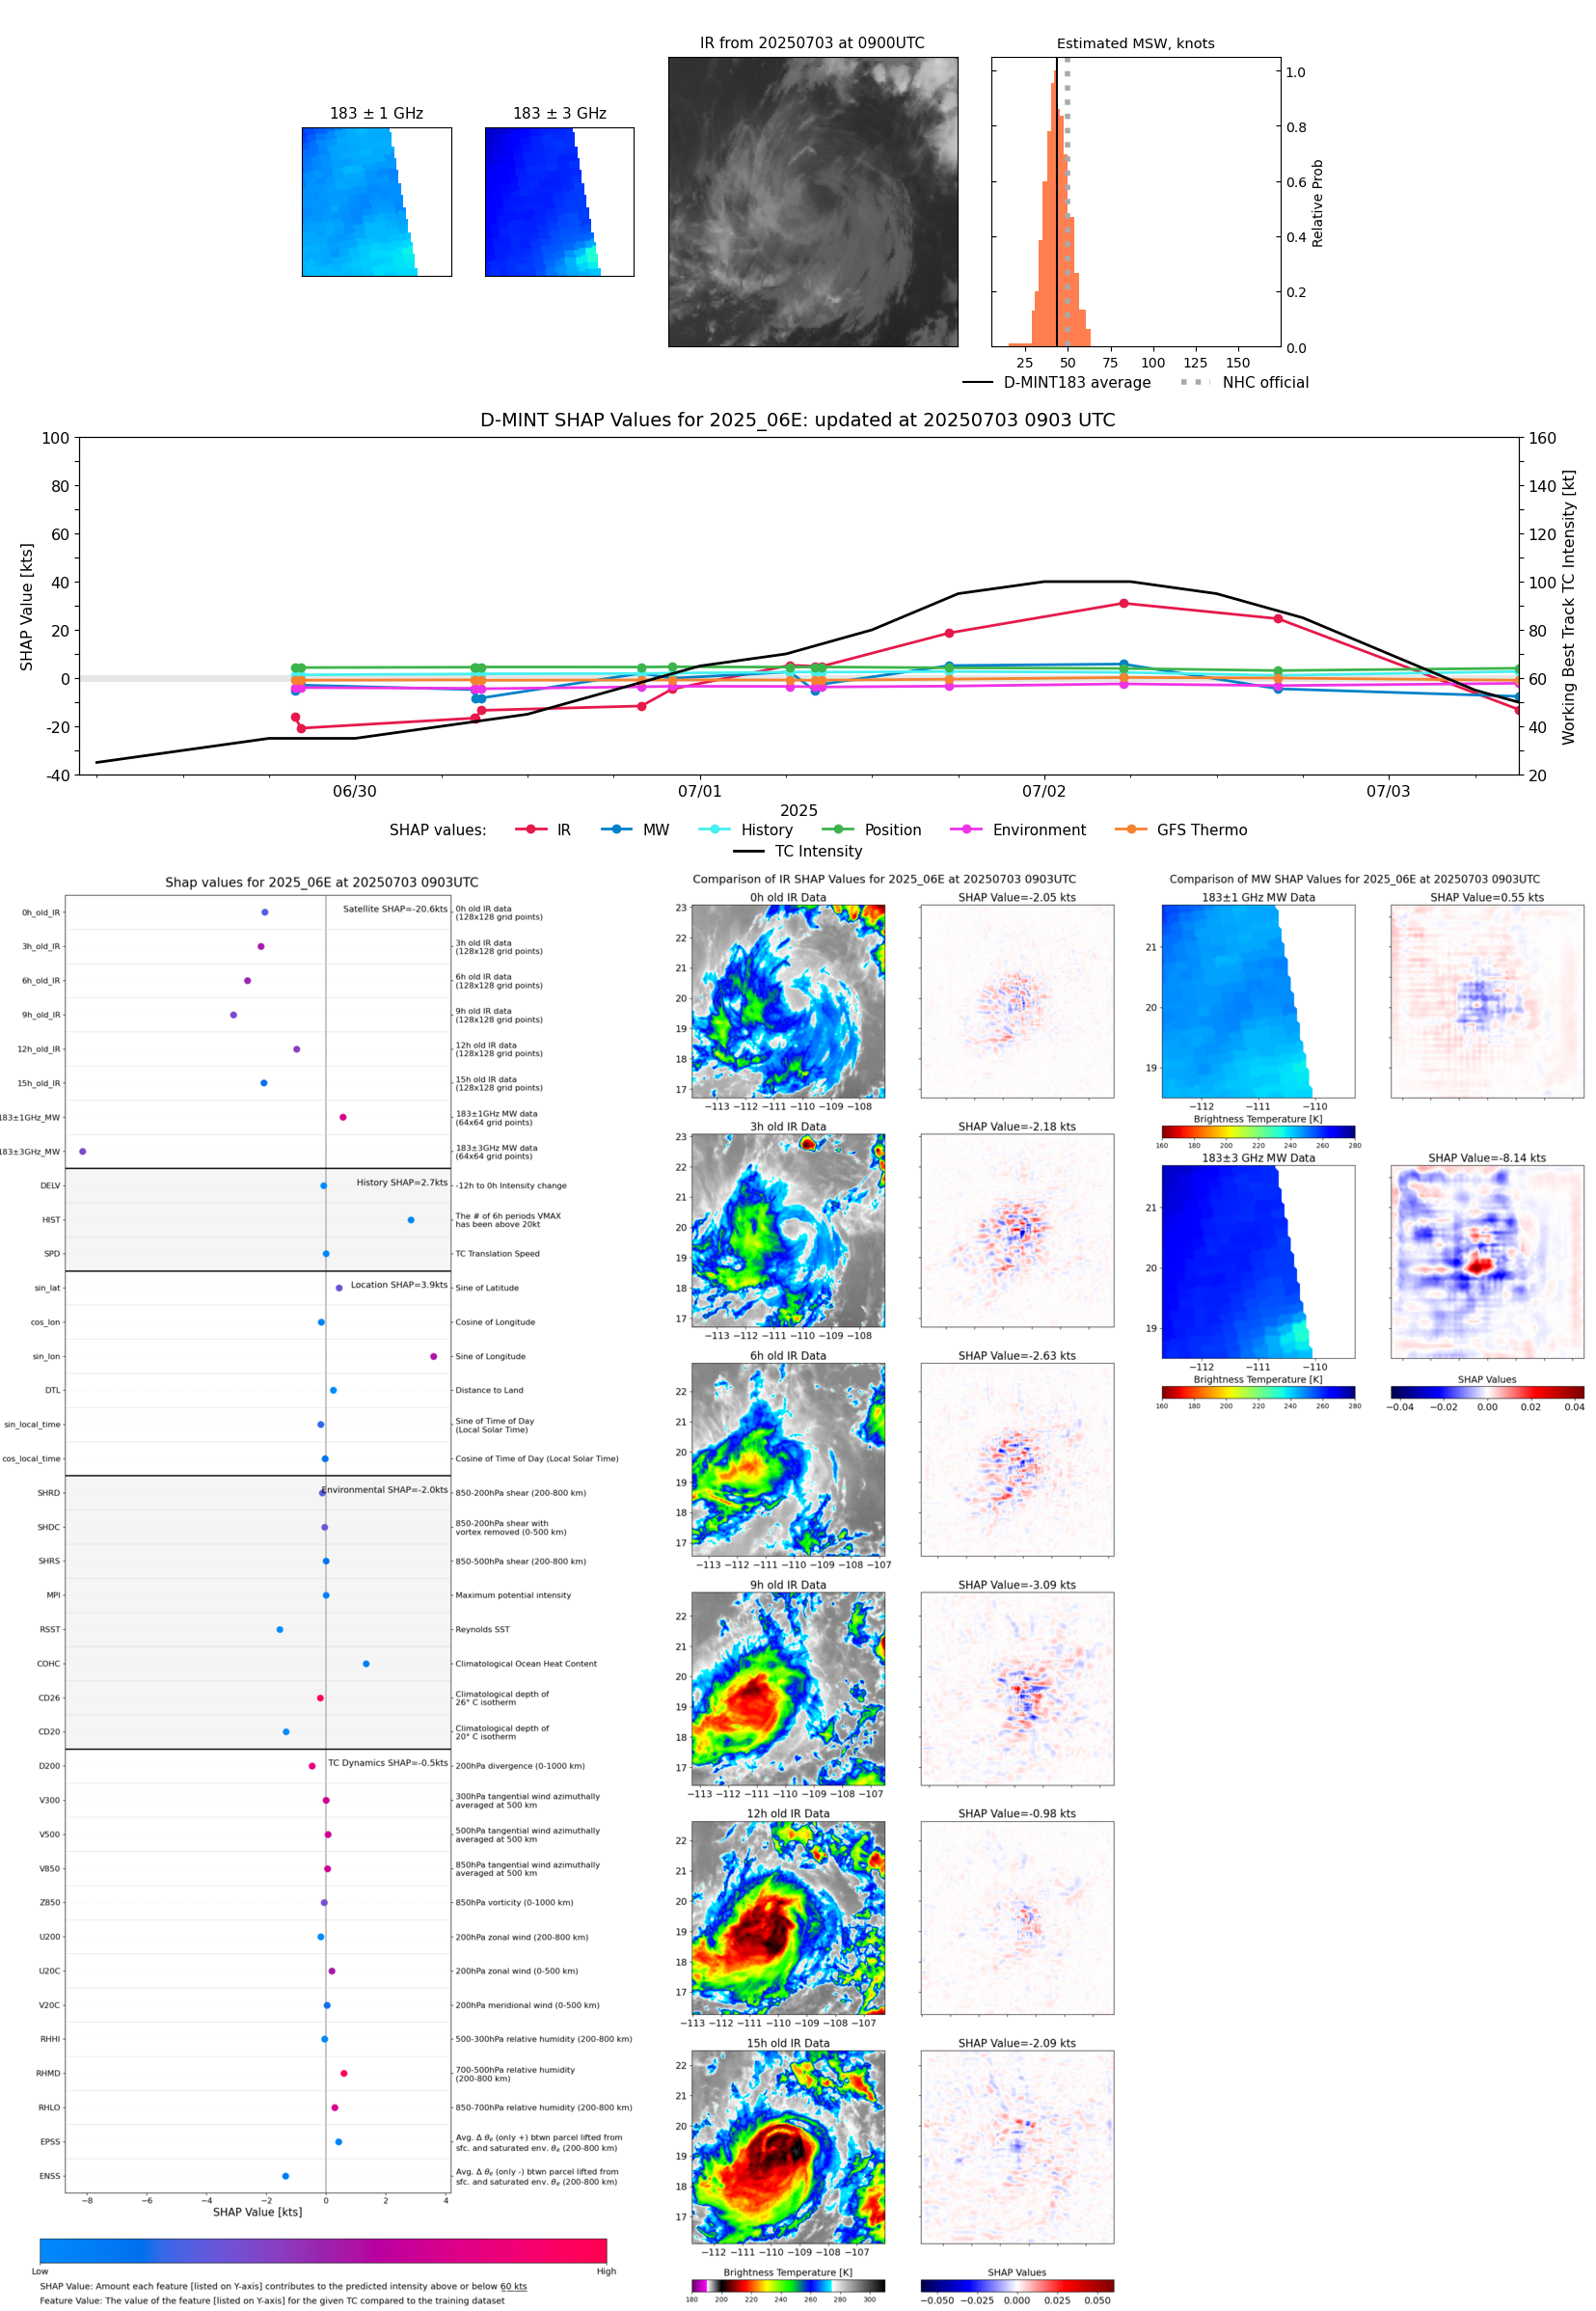 |
| 20250703 | 0903 UTC | ATMS-N21 | 1002 hPa | 44 kts | 39 kts | 49 kts | 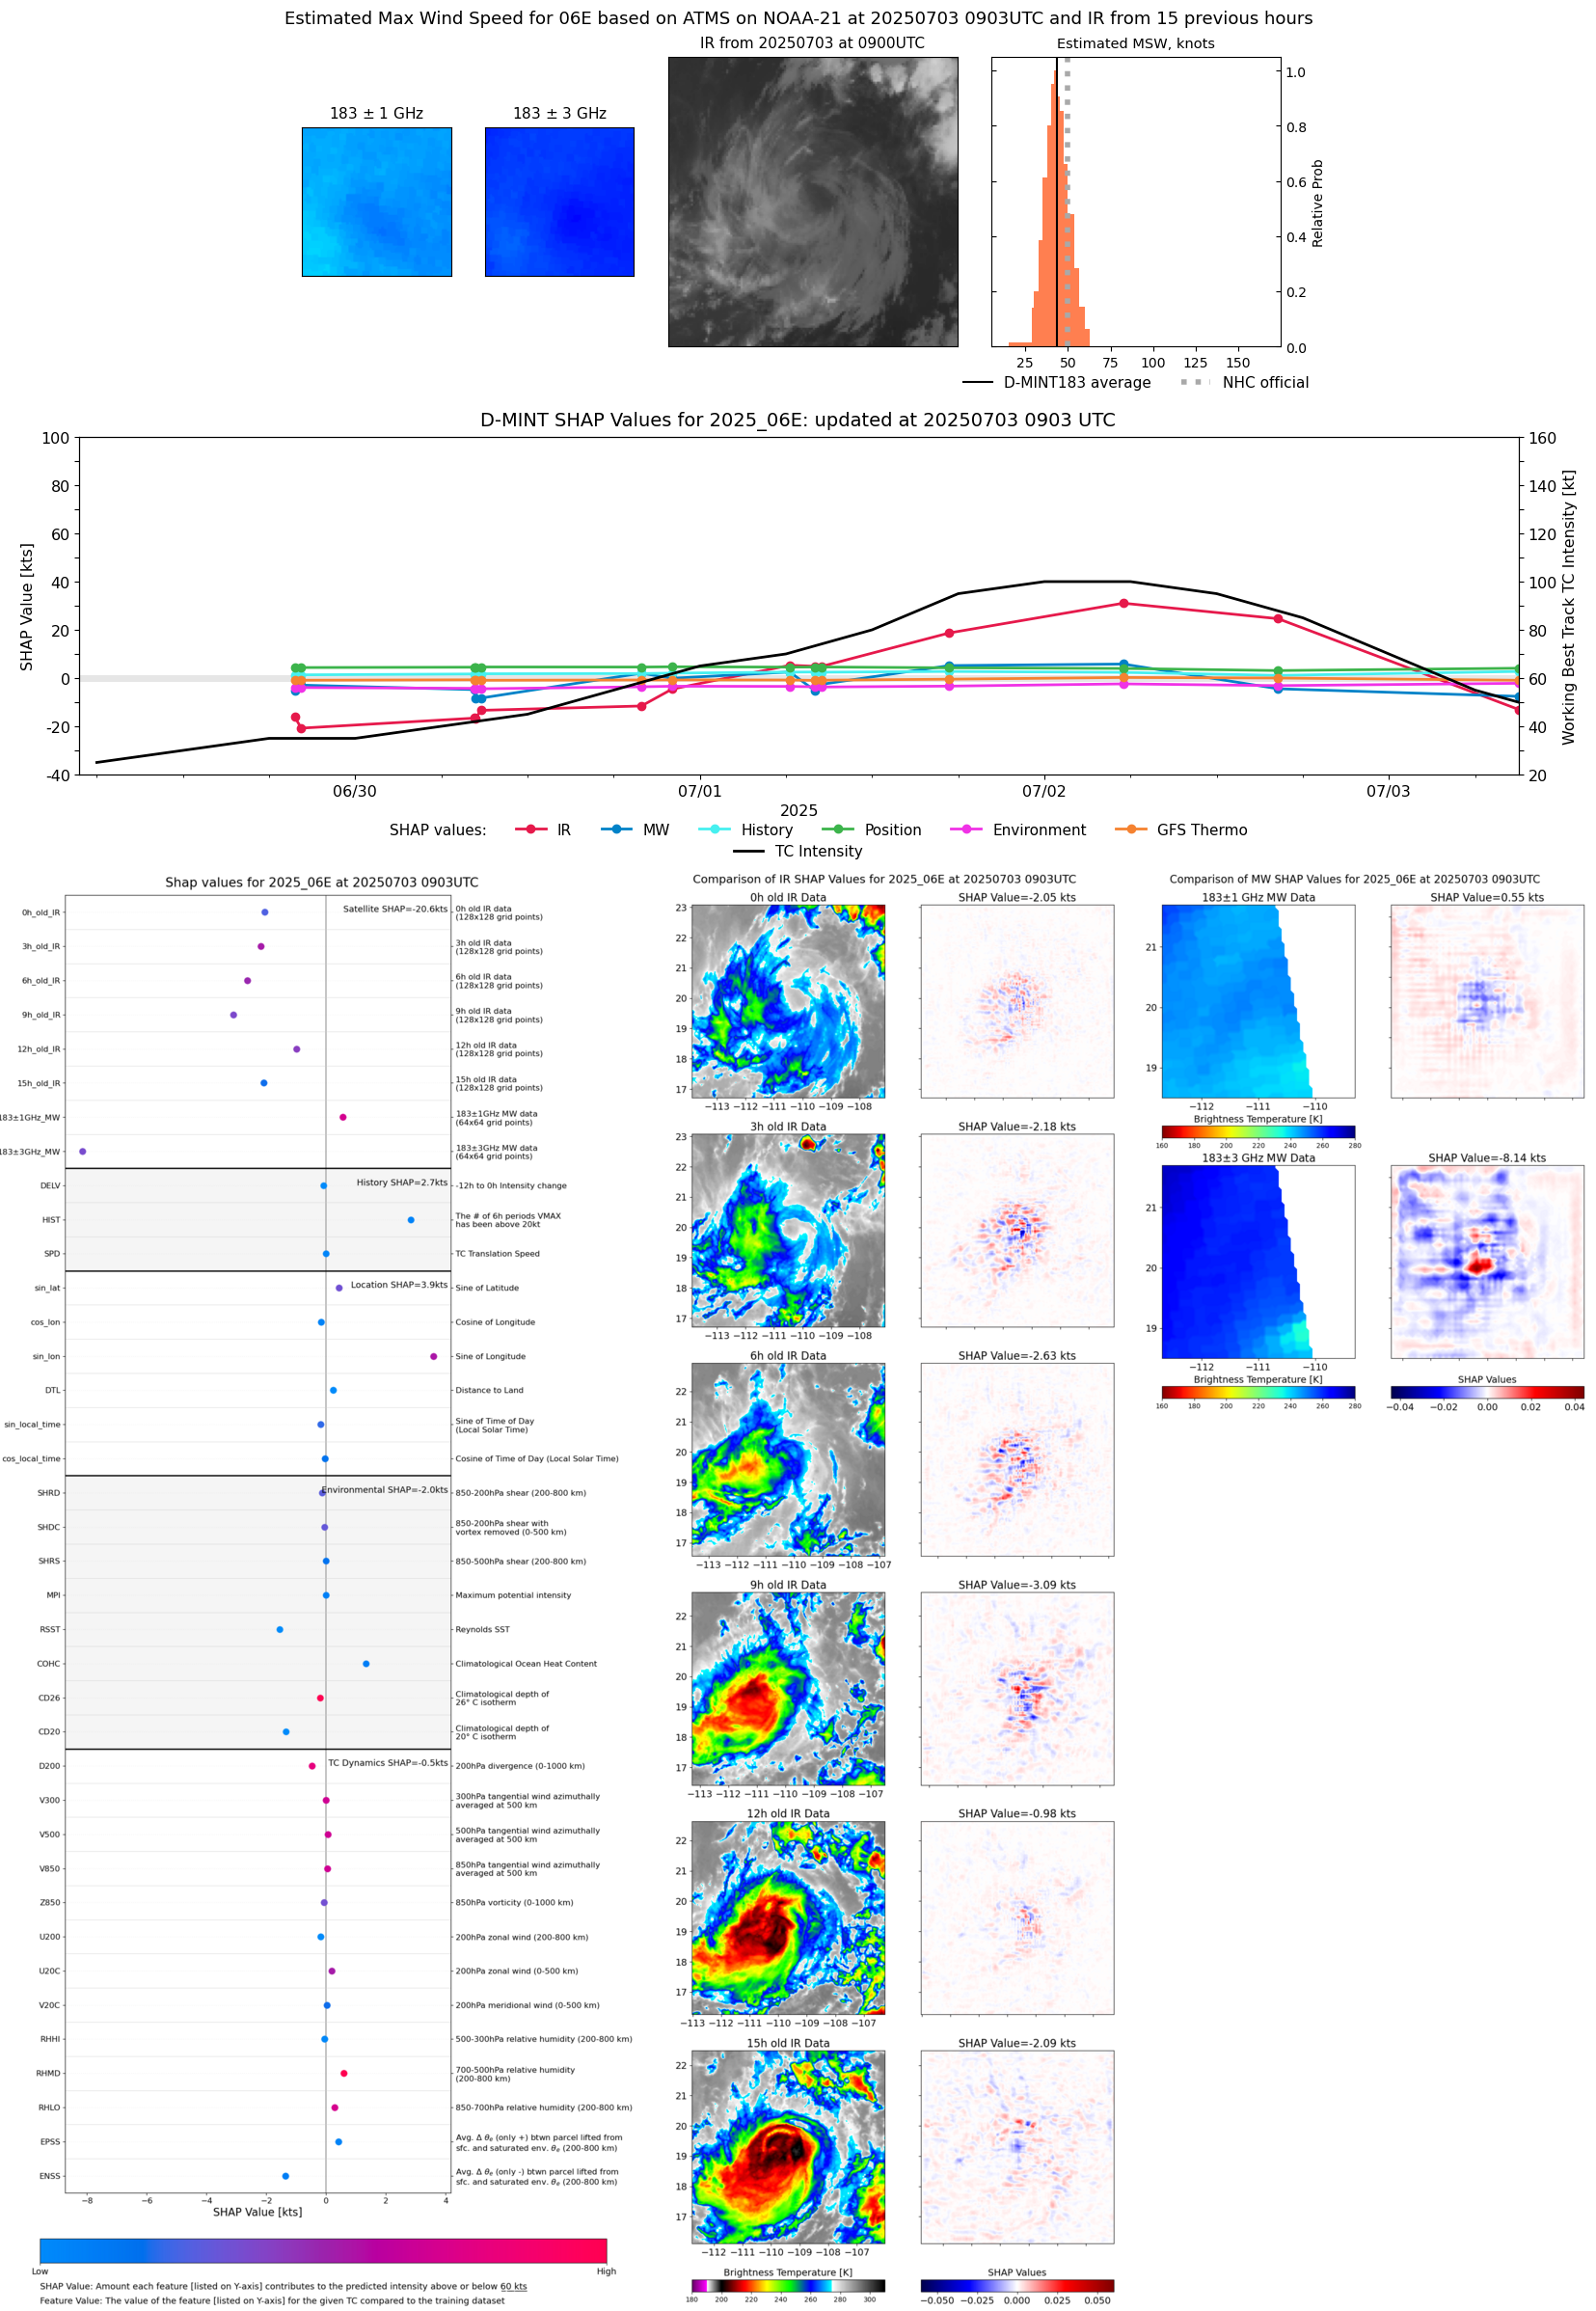 |
| 20250703 | 0541 UTC | AWS | 998 hPa | 54 kts | 49 kts | 60 kts | 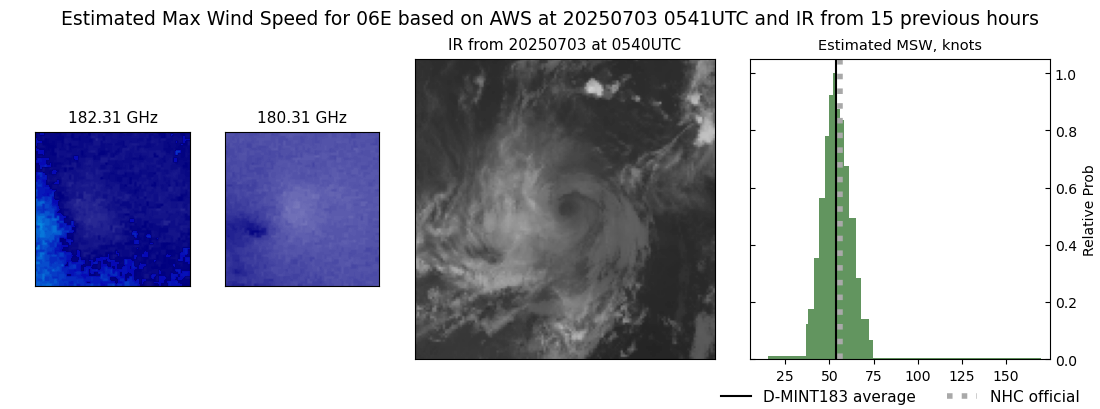 |
| 20250703 | 0213 UTC | GMI | 988 hPa | 64 kts | 58 kts | 71 kts | 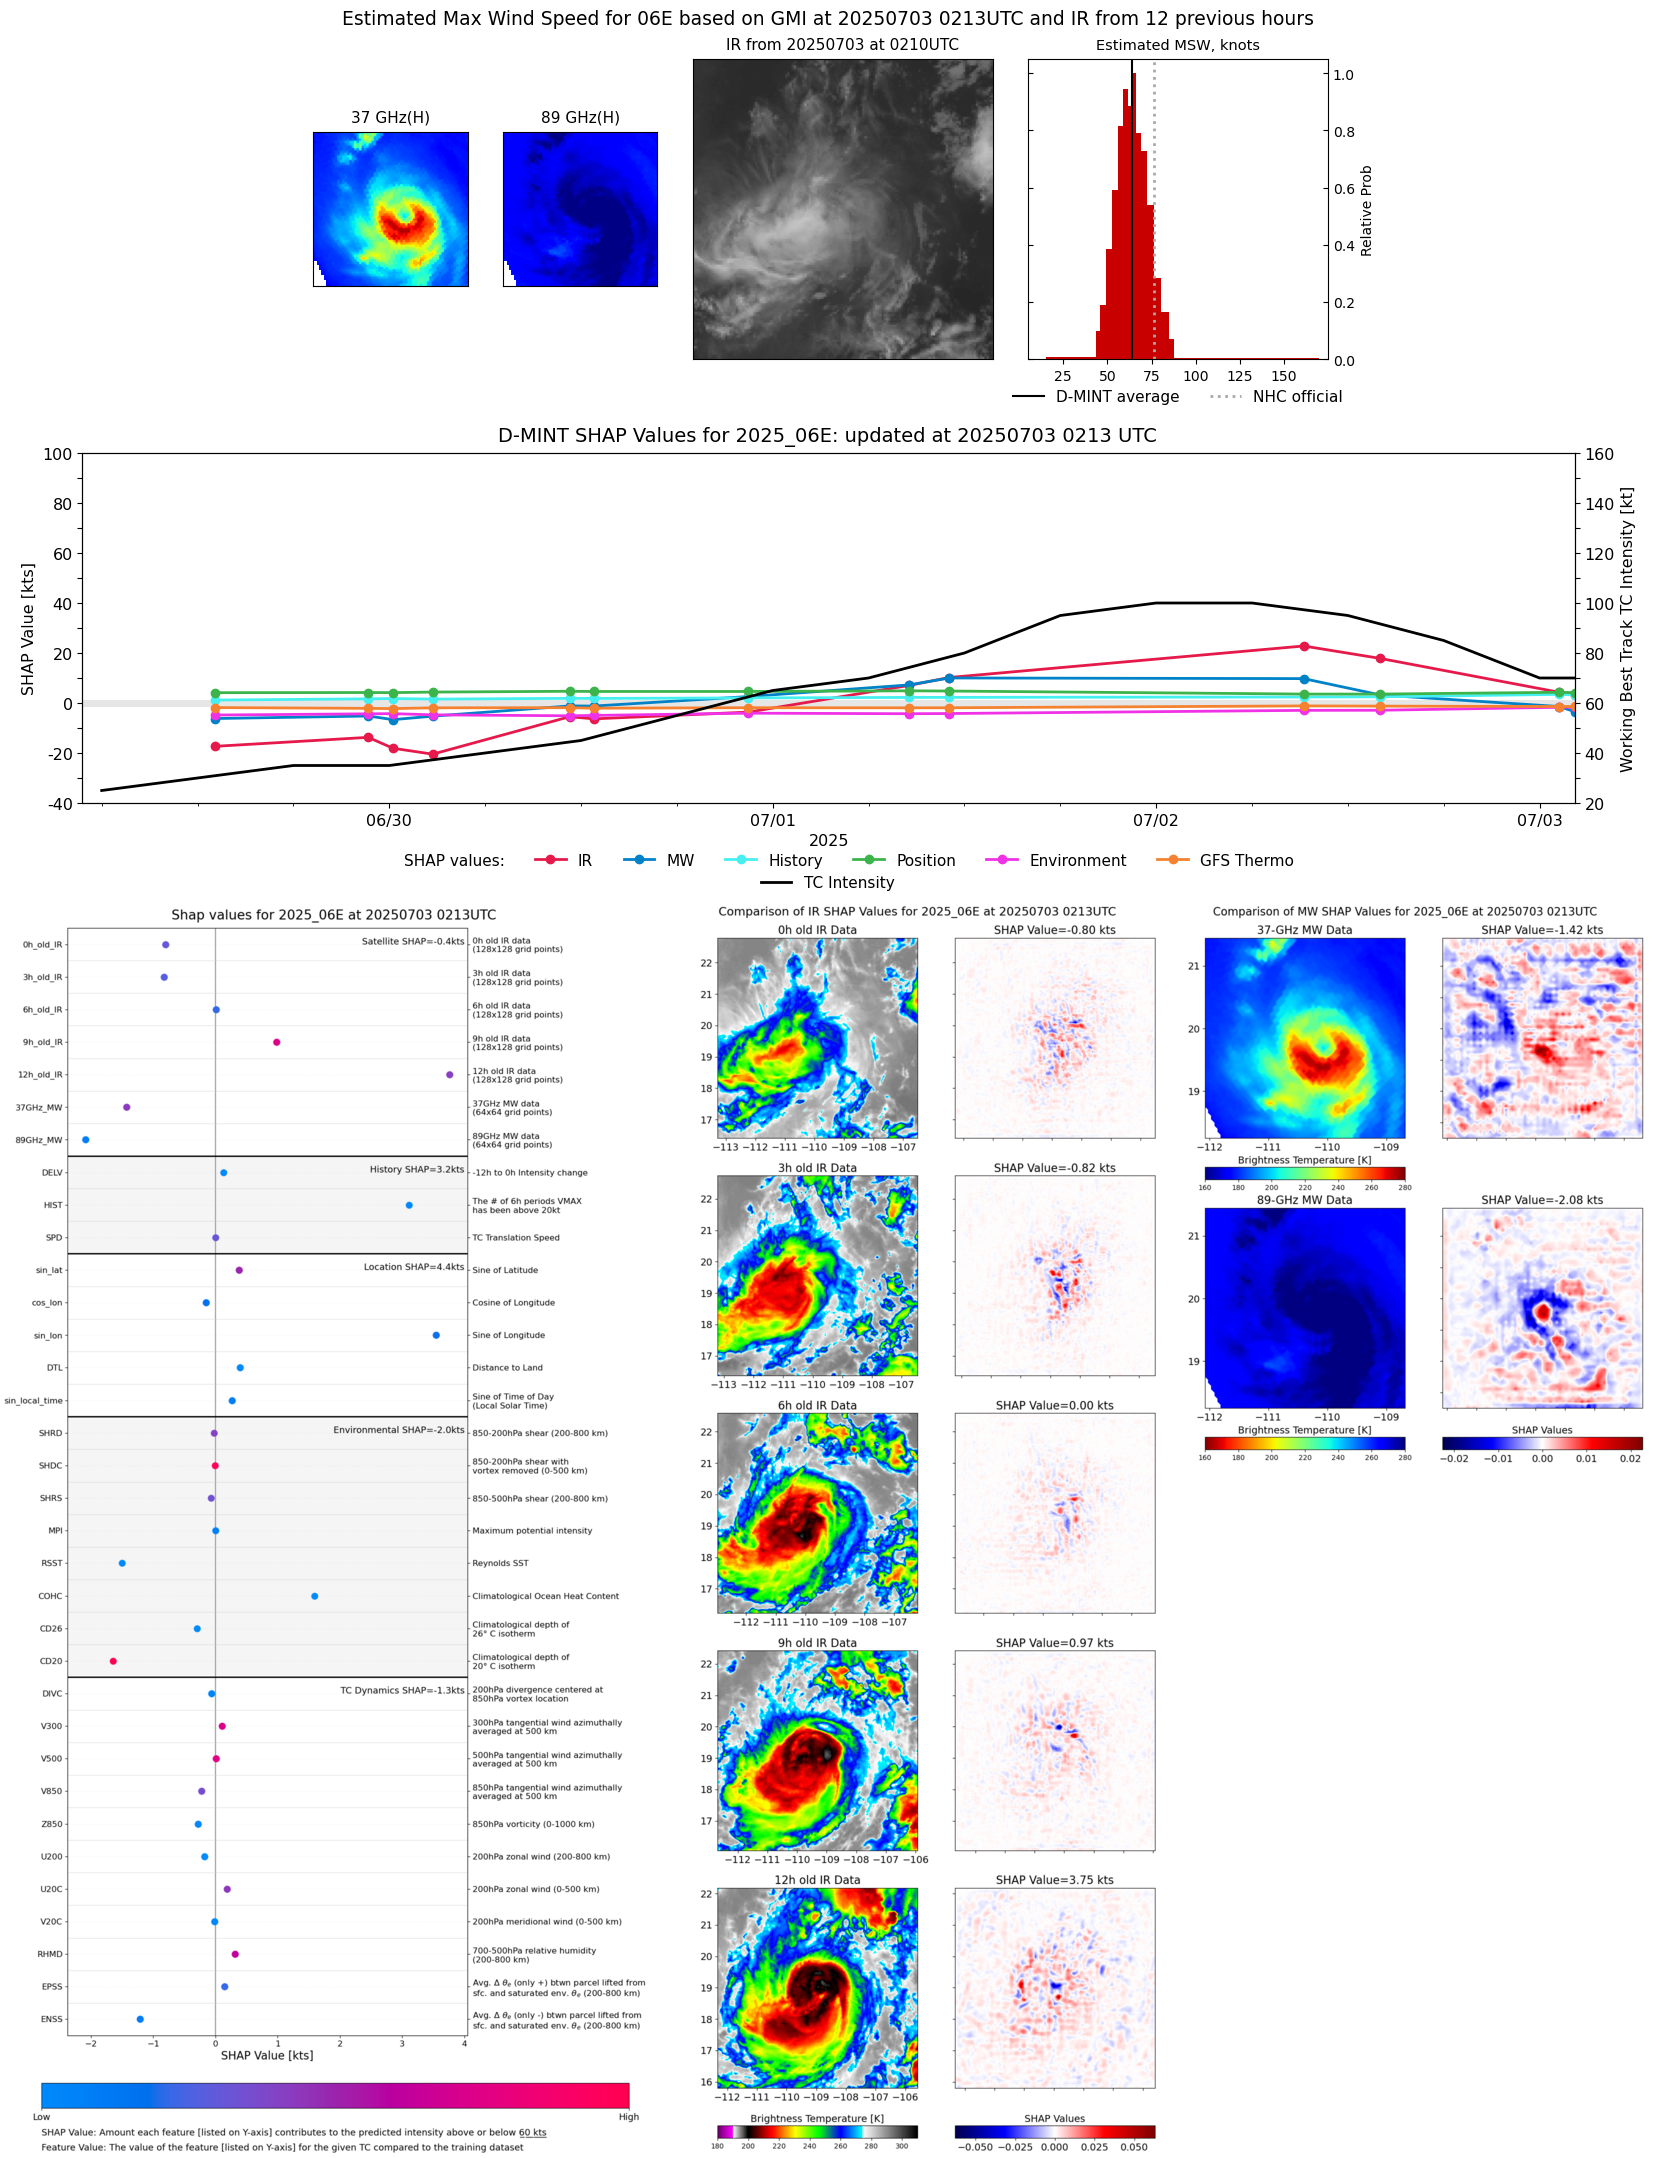 |
| 20250703 | 0121 UTC | SSMISF16 | 991 hPa | 61 kts | 55 kts | 68 kts |  |
| 20250703 | 0114 UTC | SSMISF17 | 988 hPa | 68 kts | 61 kts | 75 kts | 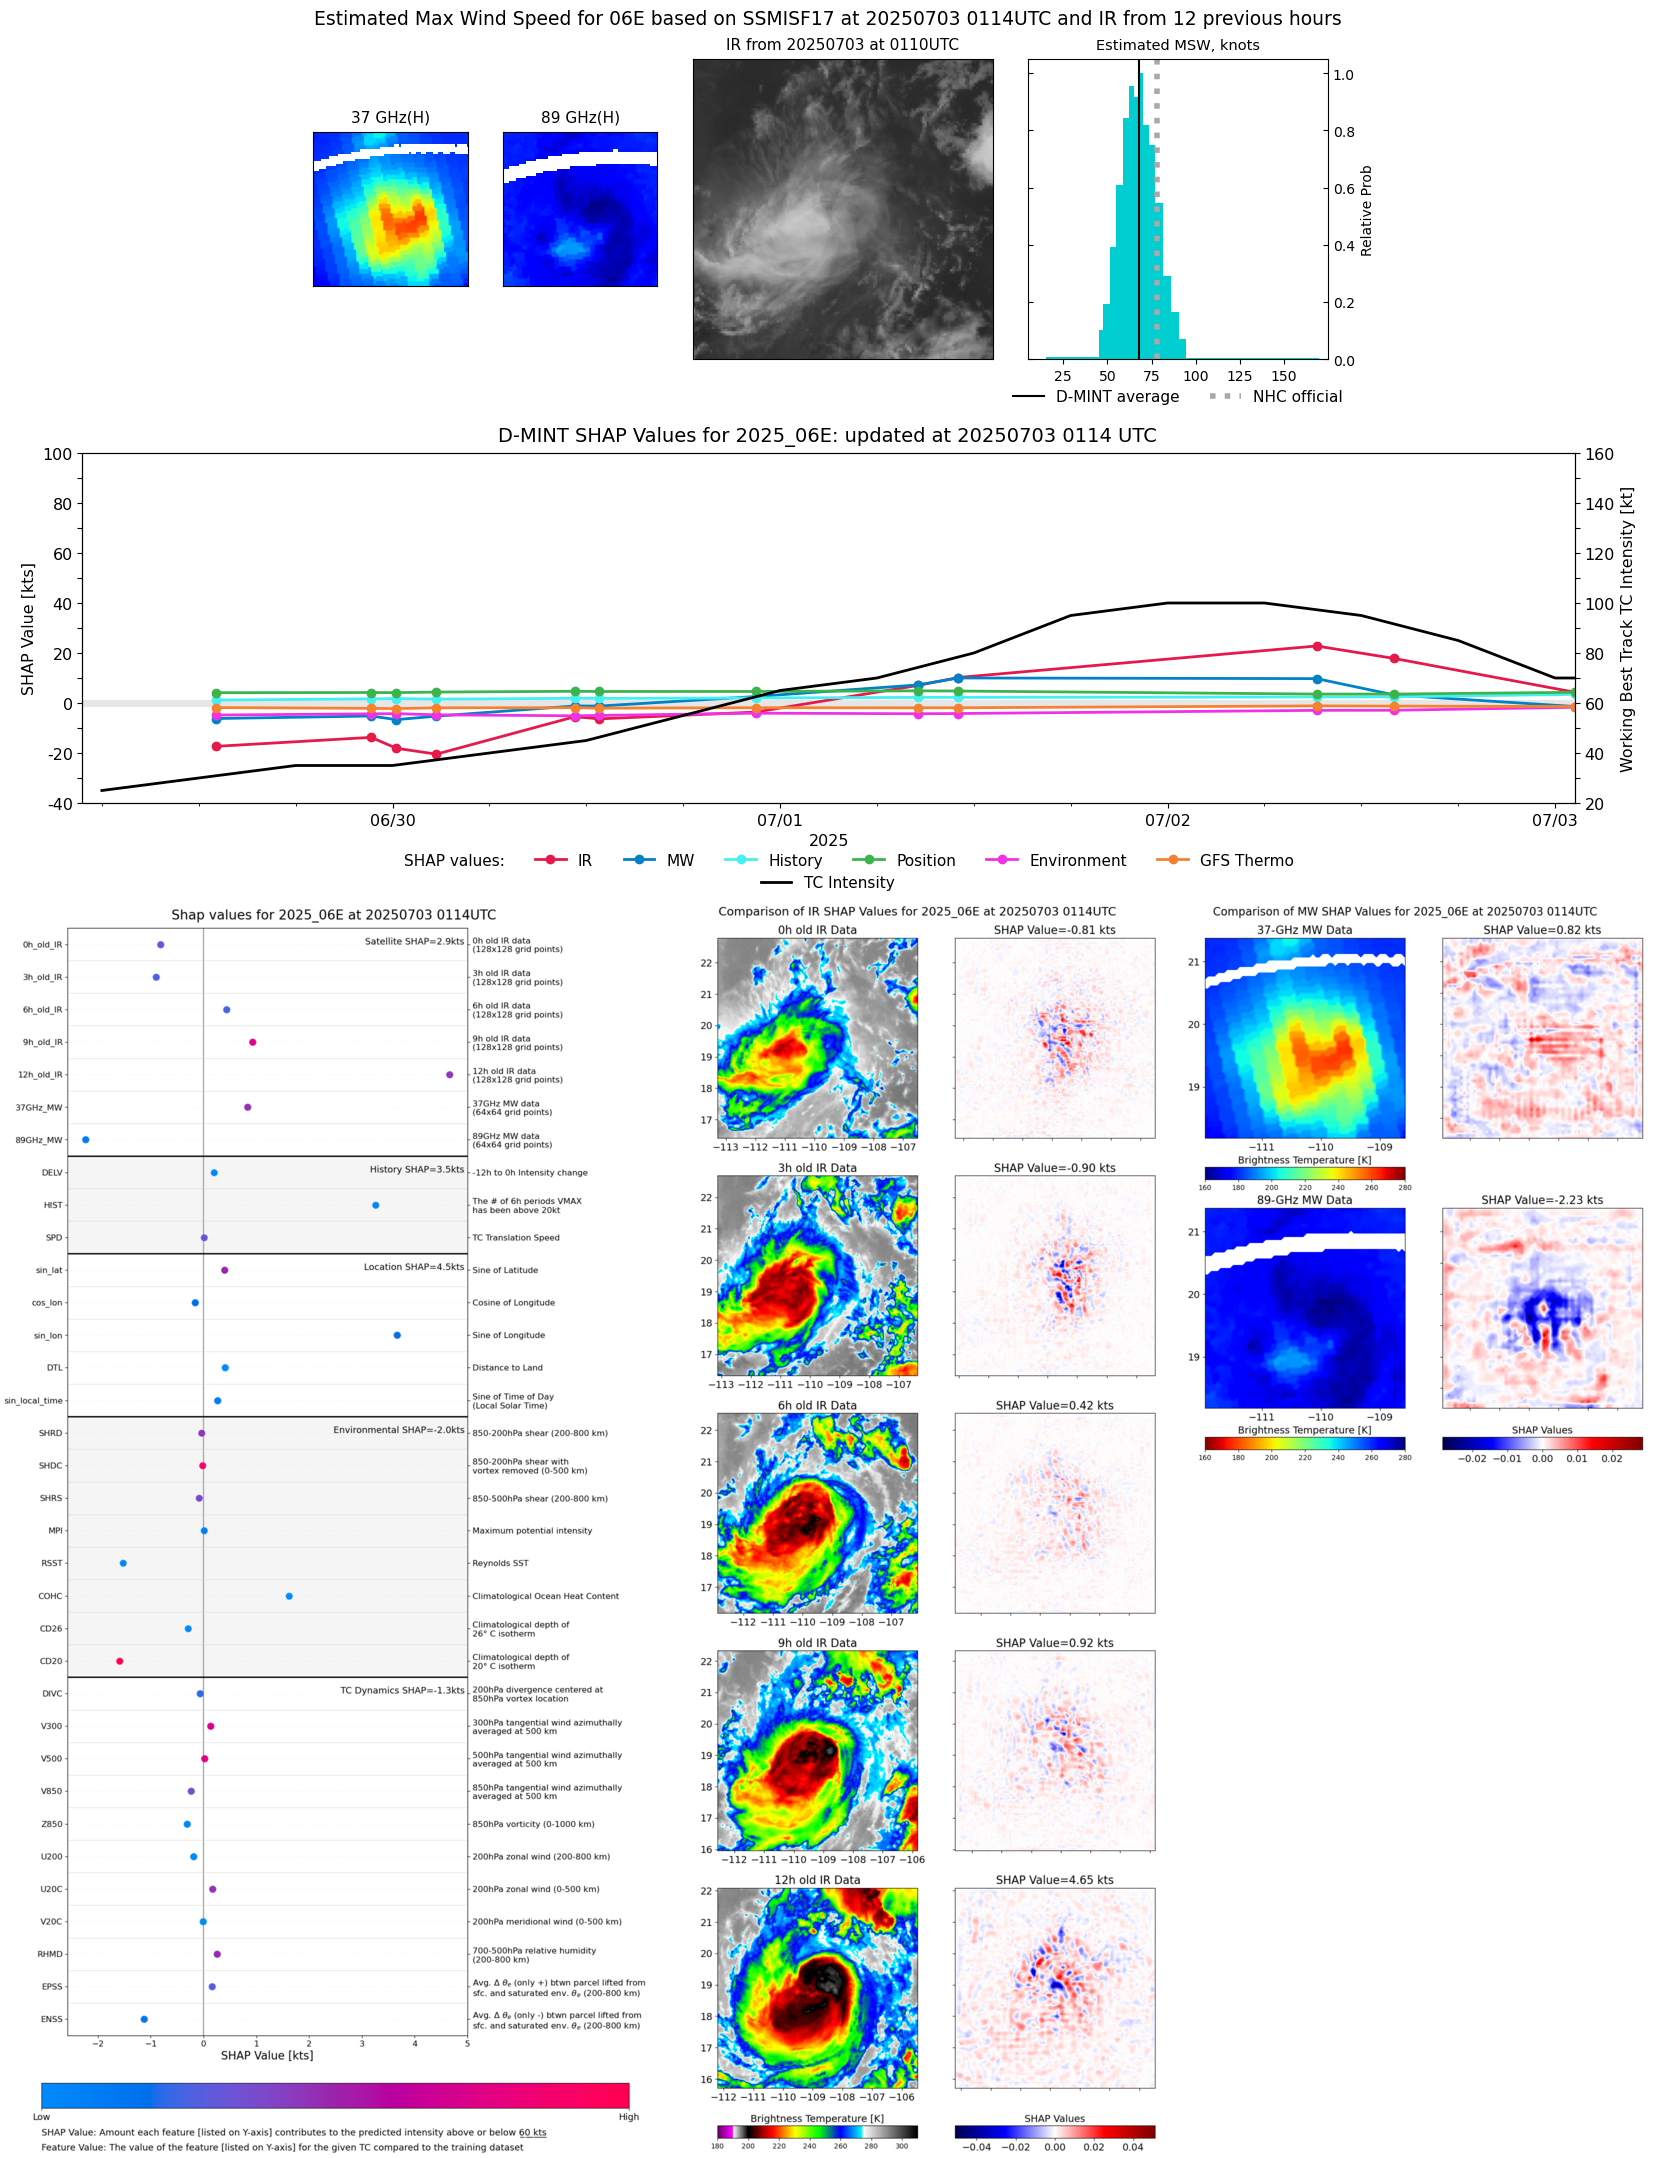 |
| 20250702 | 2154 UTC | TROPICS05 | 981 hPa | 74 kts | 70 kts | 79 kts | 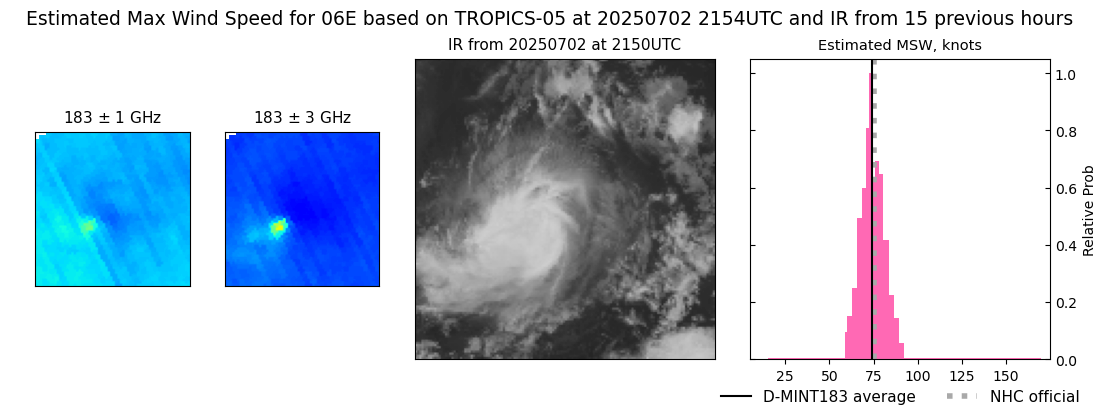 |
| 20250702 | 1617 UTC | TMS03 | 978 hPa | 82 kts | 76 kts | 87 kts | 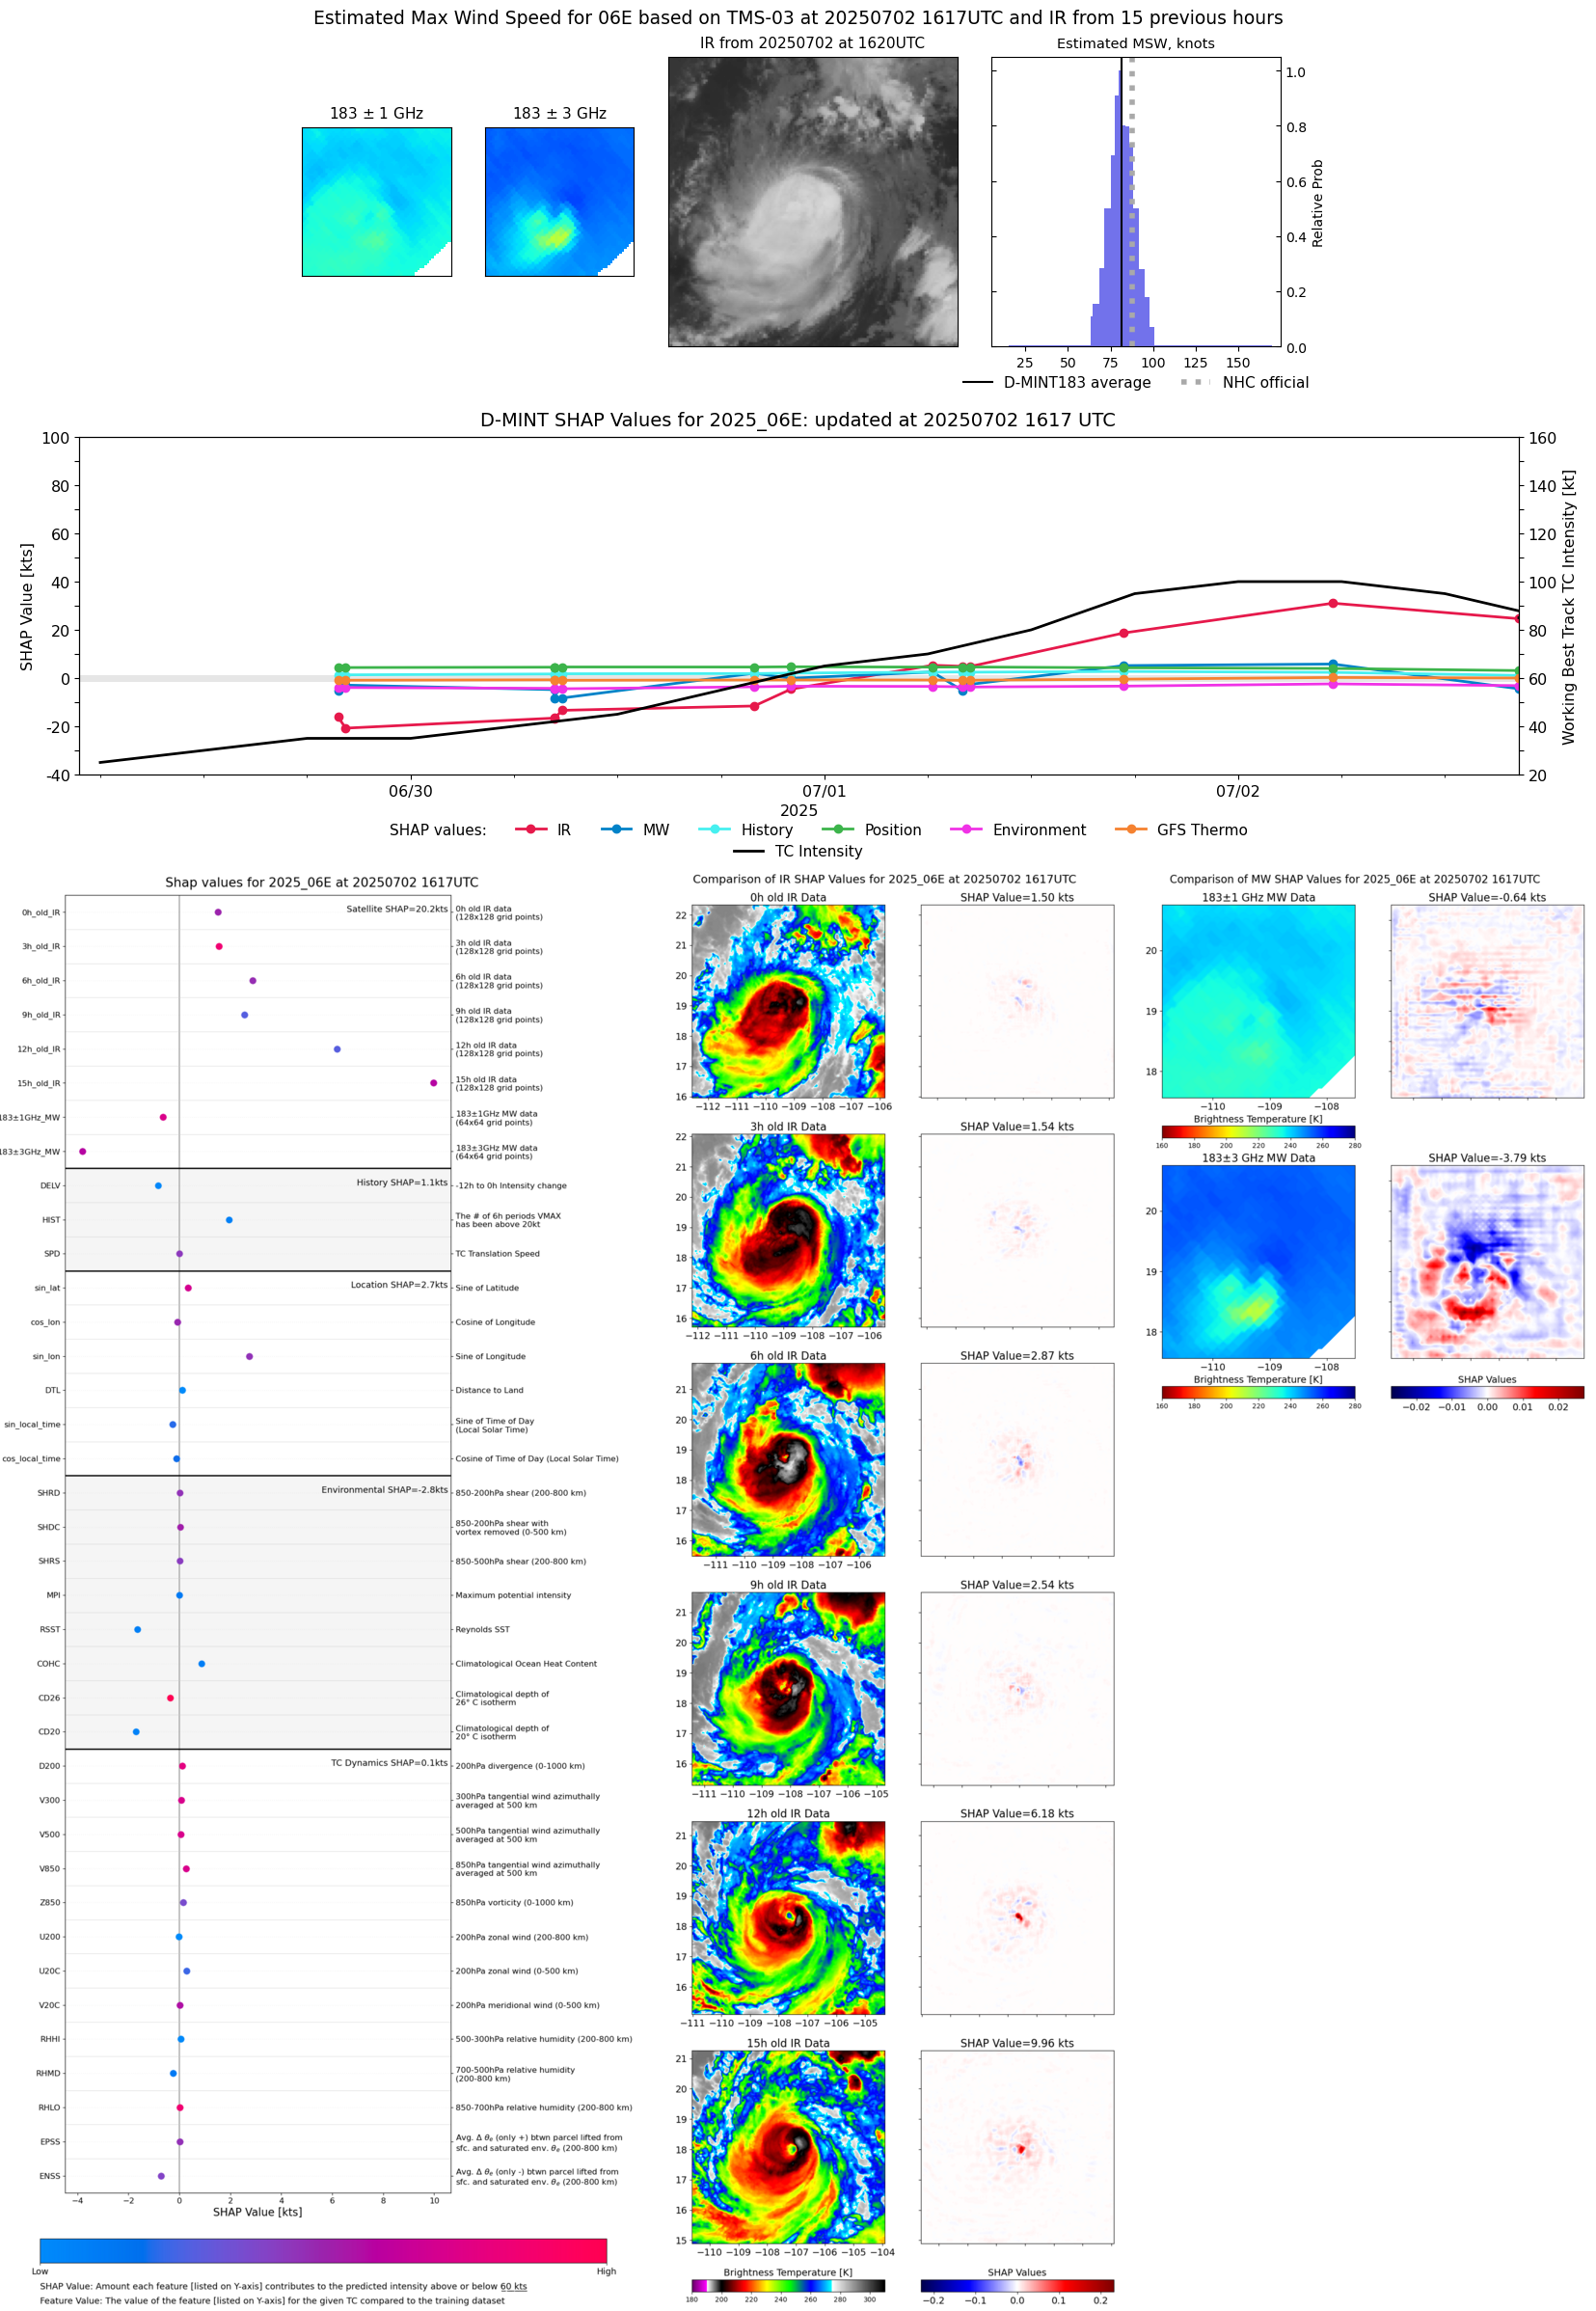 |
| 20250702 | 1406 UTC | SSMISF16 | 976 hPa | 85 kts | 78 kts | 92 kts | 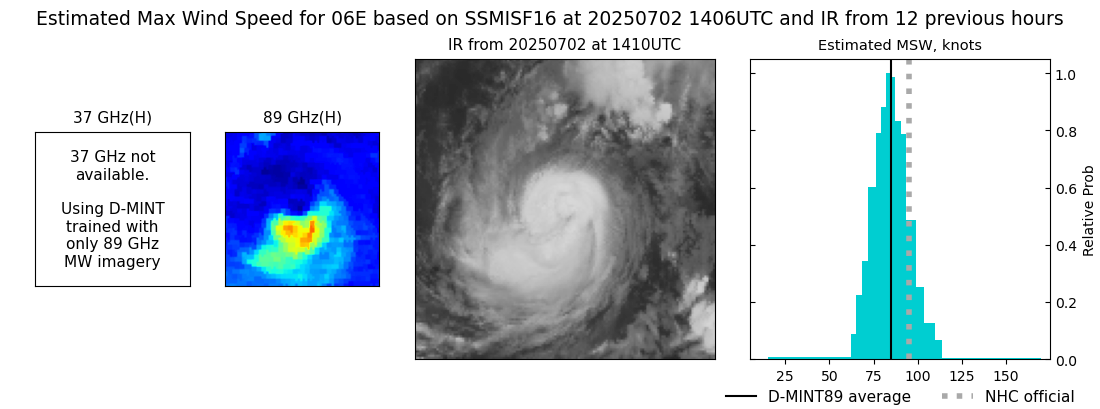 |
| 20250702 | 1402 UTC | SSMISF17 | 974 hPa | 83 kts | 77 kts | 90 kts | 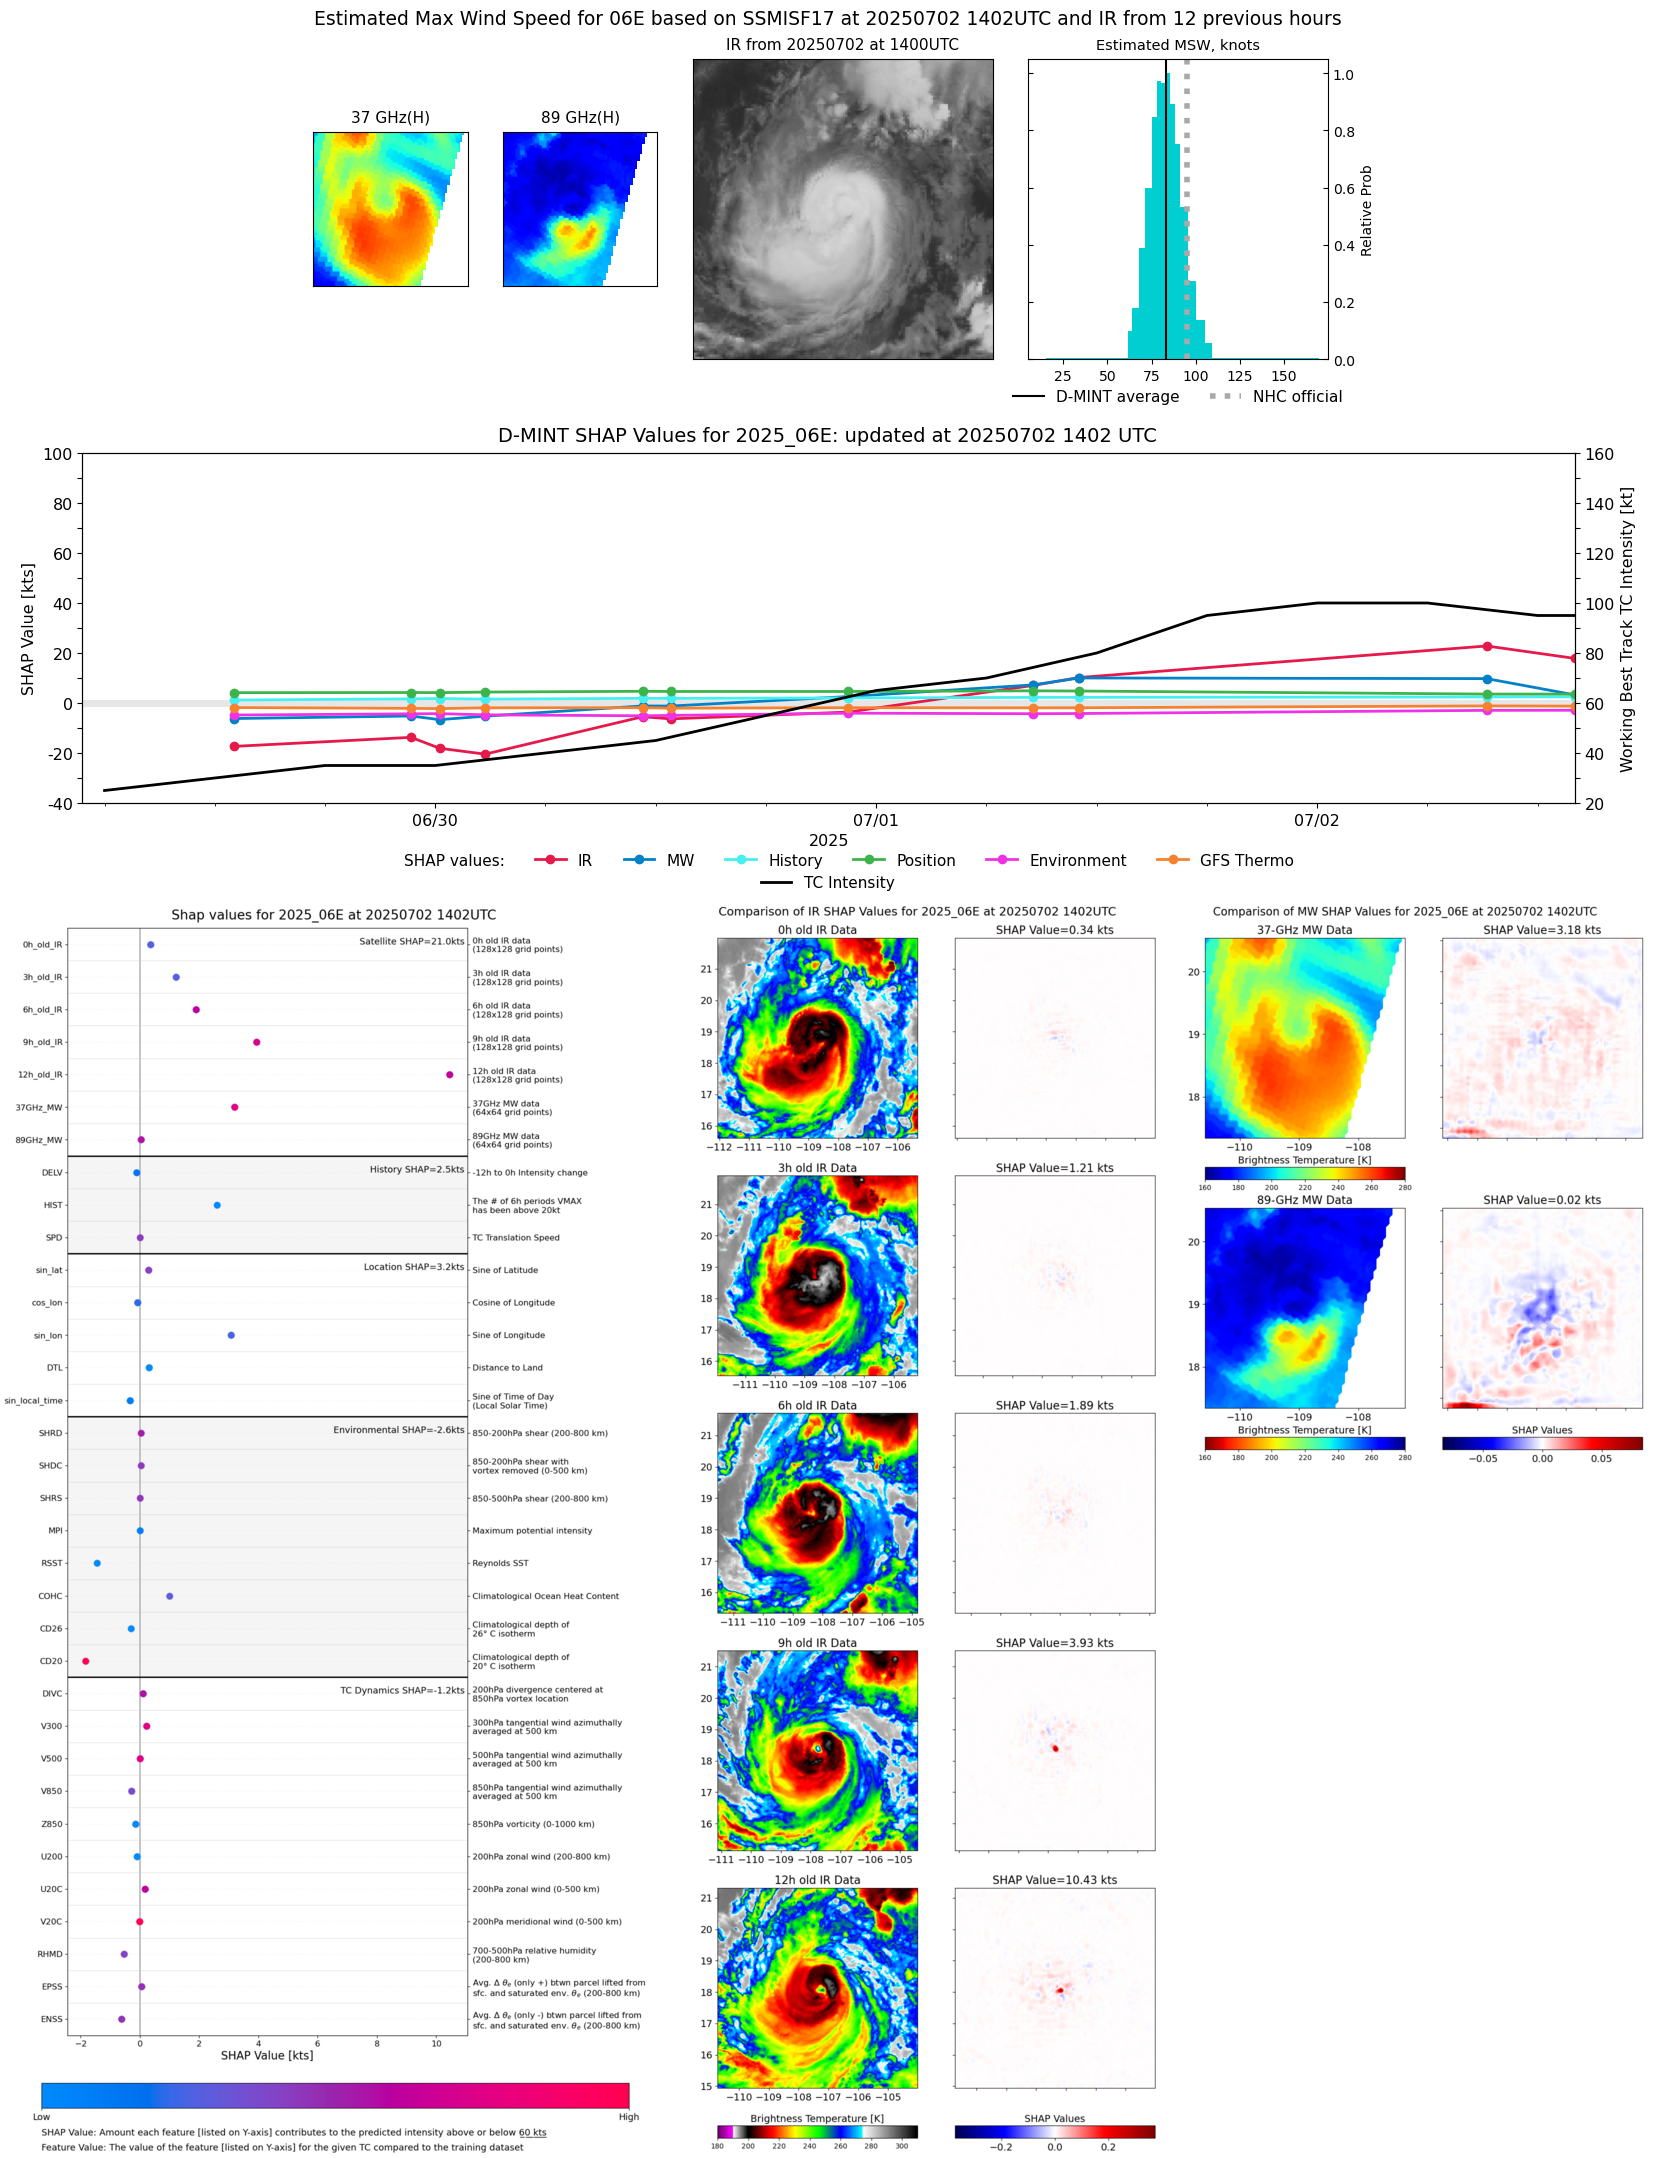 |
| 20250702 | 0914 UTC | AMSR2 | 969 hPa | 94 kts | 88 kts | 101 kts | 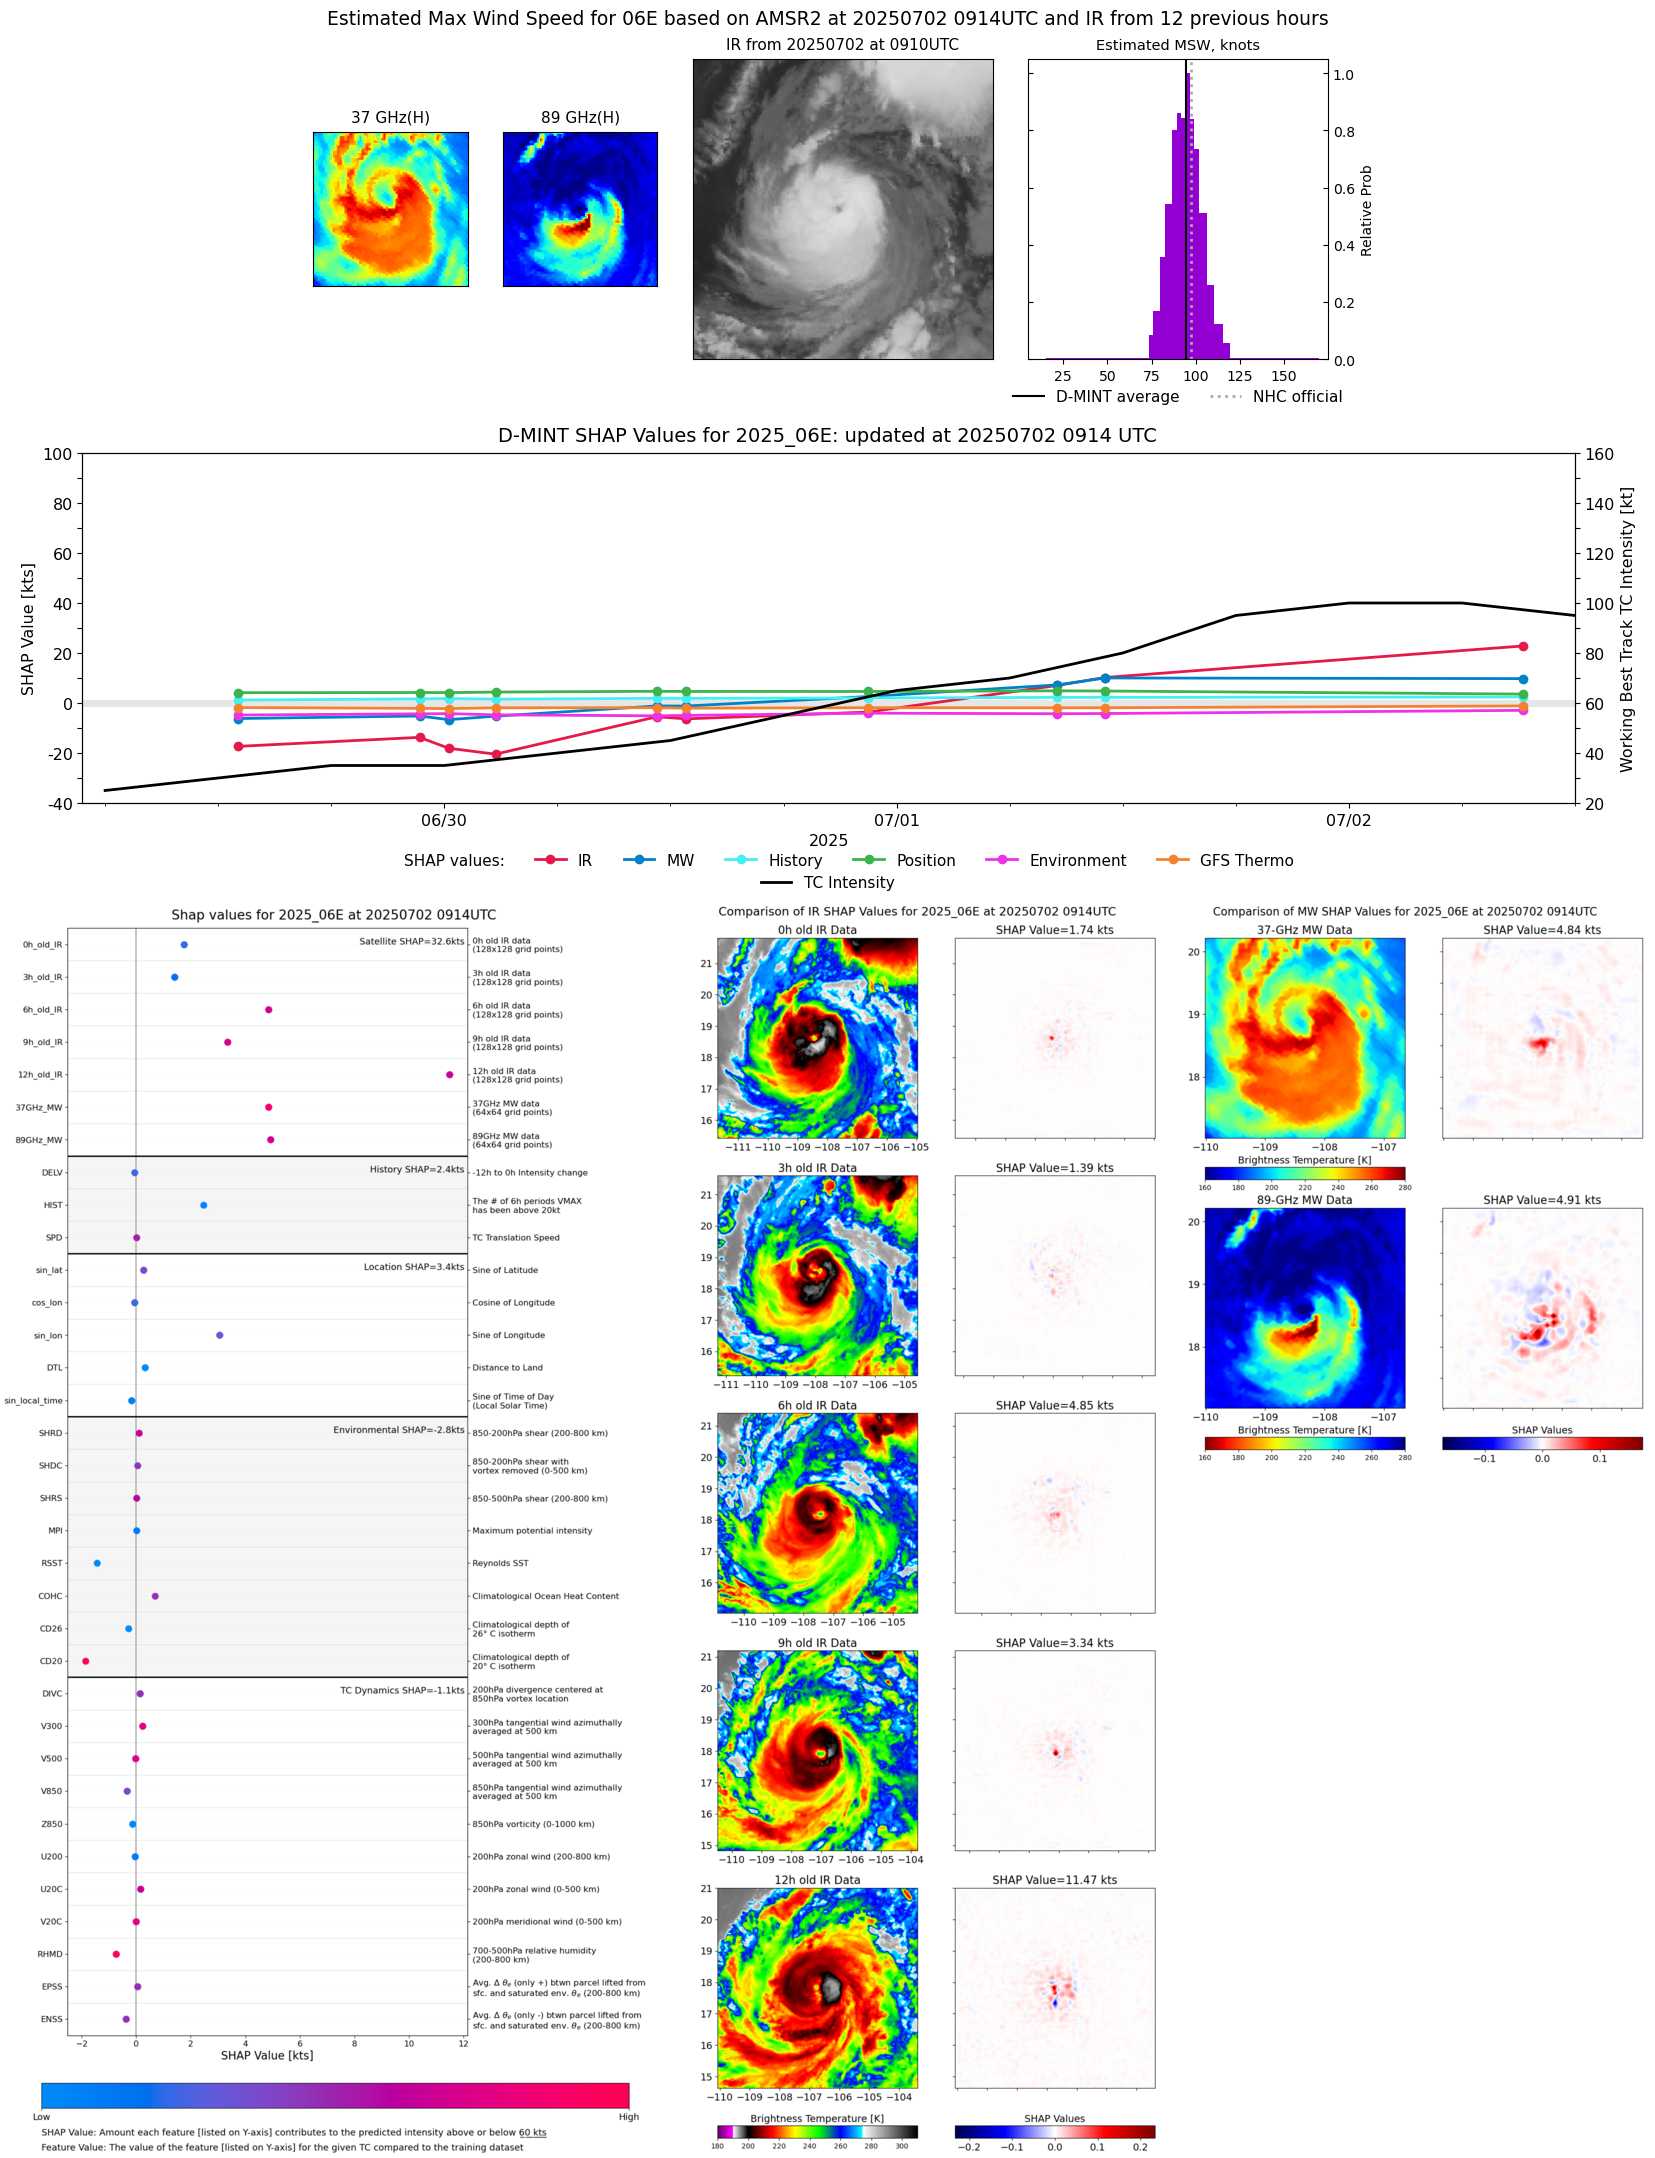 |
| 20250702 | 0530 UTC | TMS02 | 961 hPa | 102 kts | 95 kts | 109 kts | 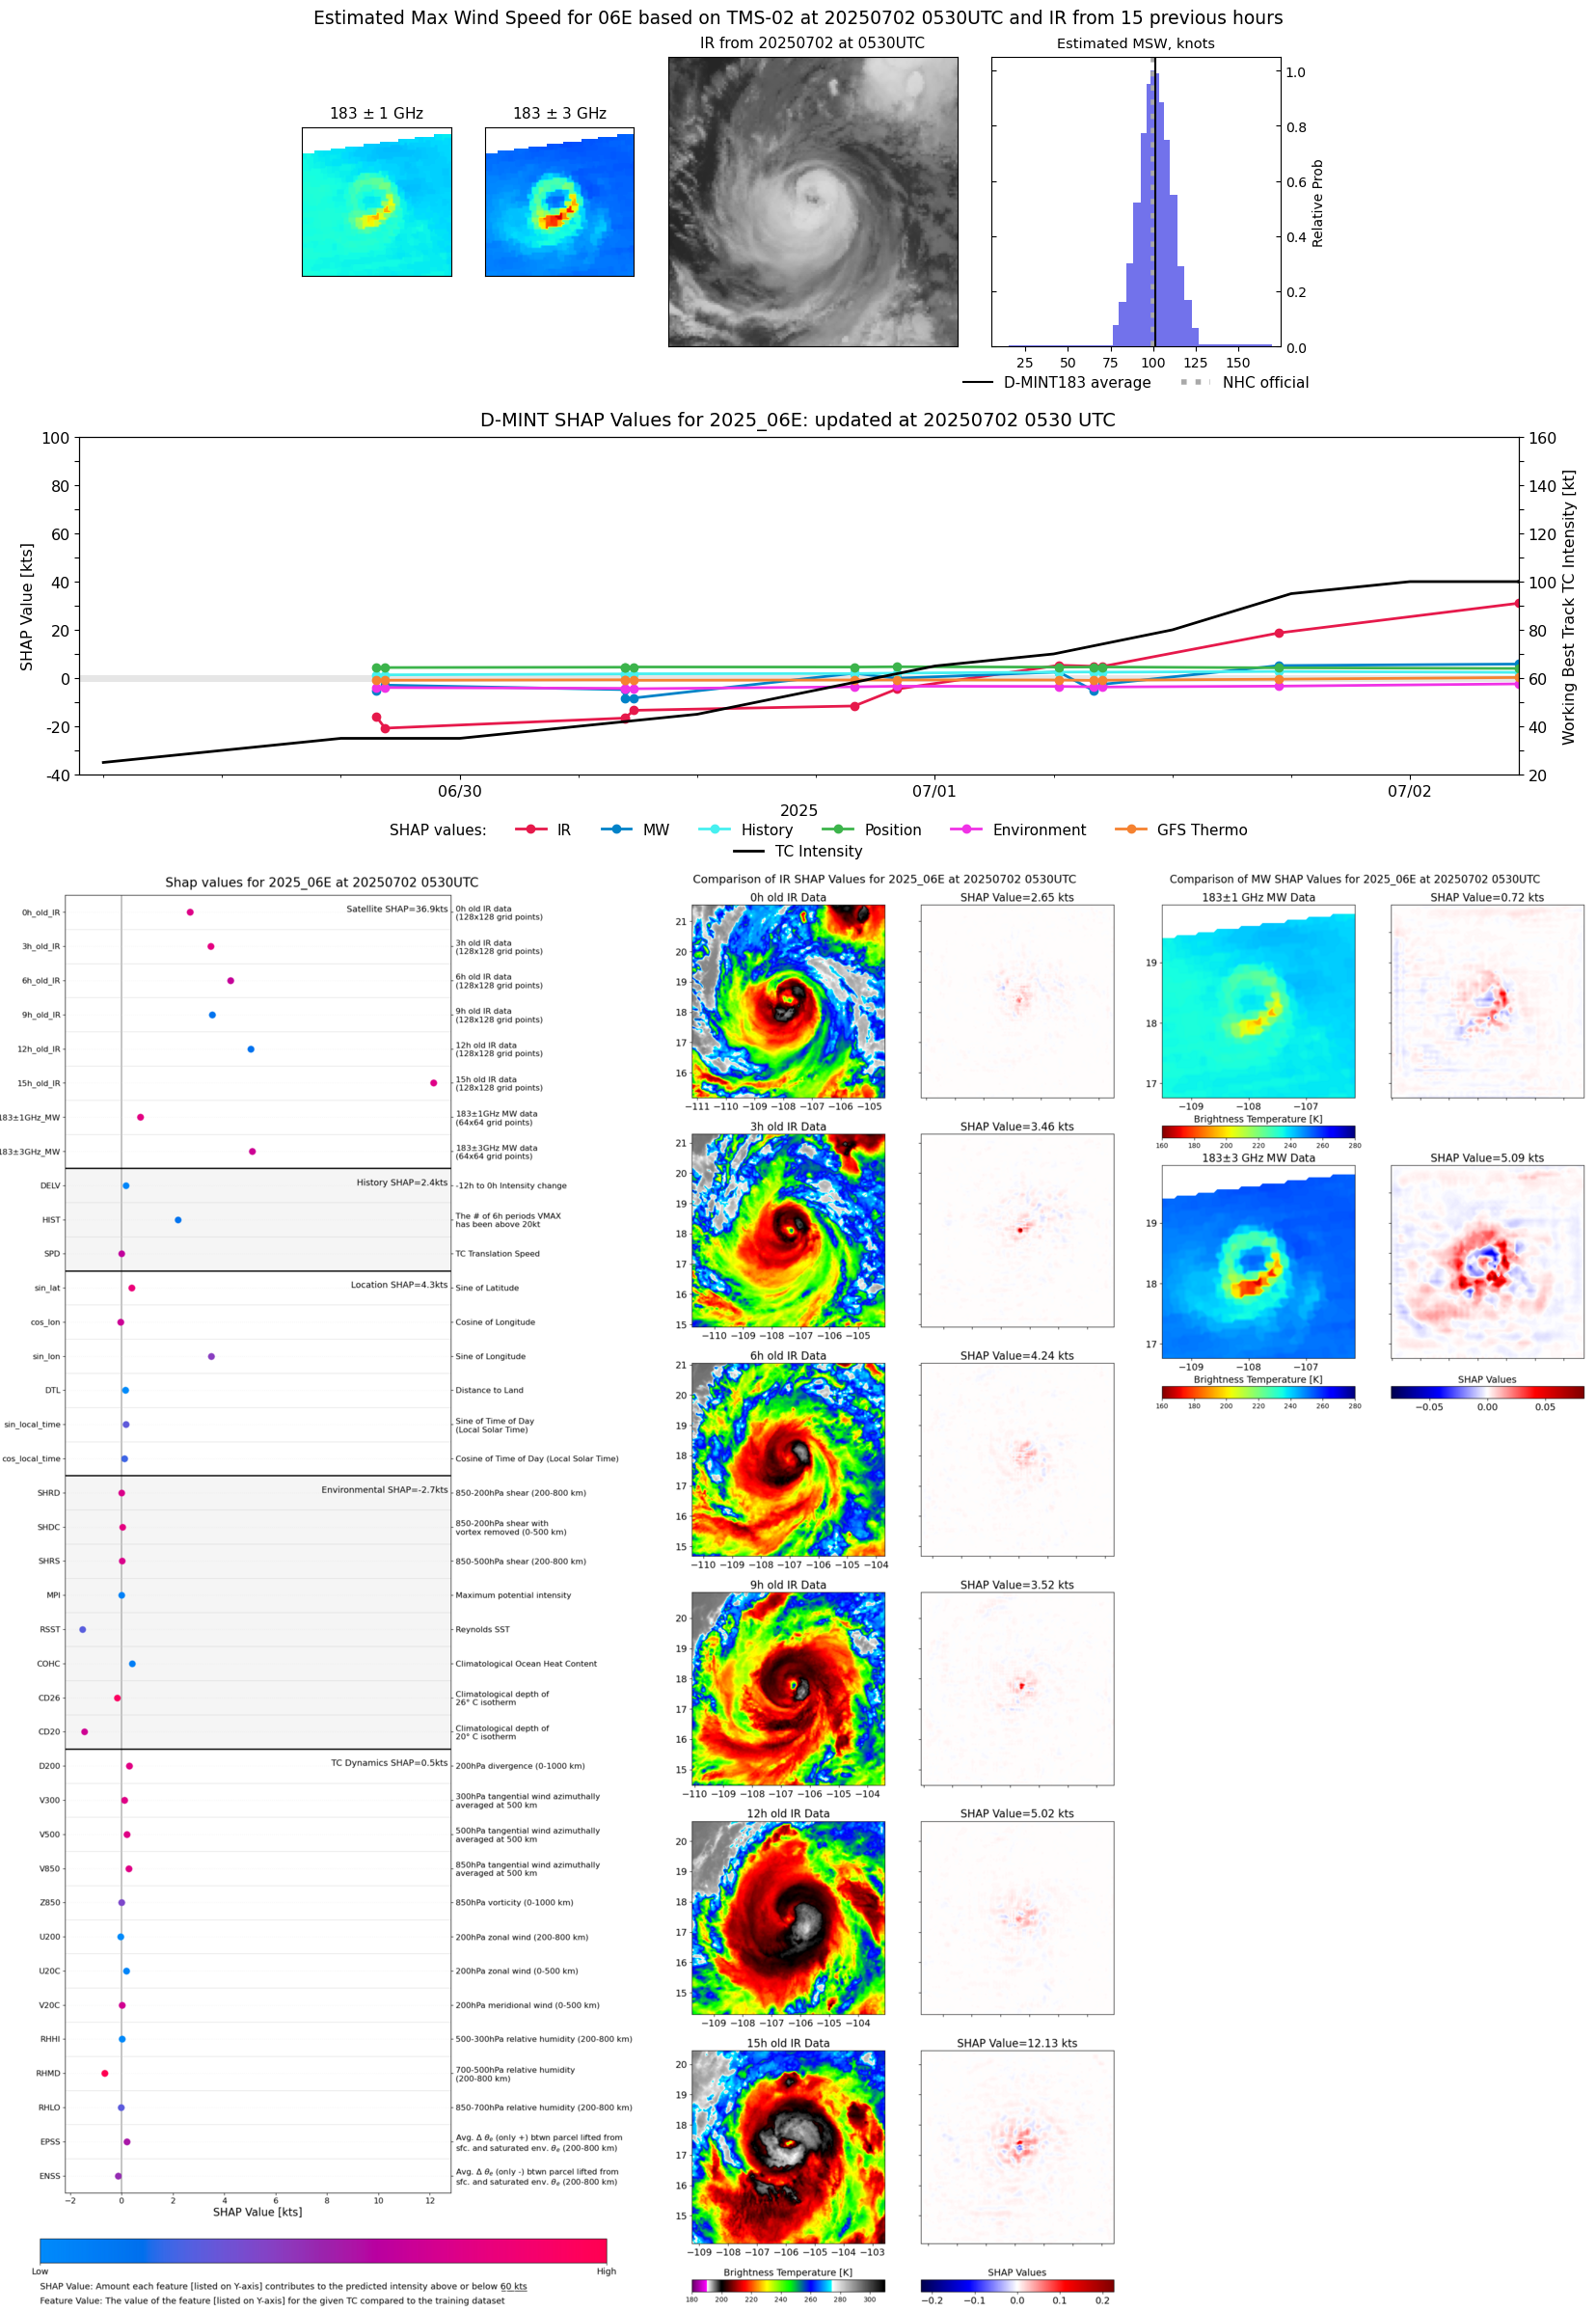 |
| 20250702 | 0530 UTC | AWS | 961 hPa | 102 kts | 95 kts | 109 kts | 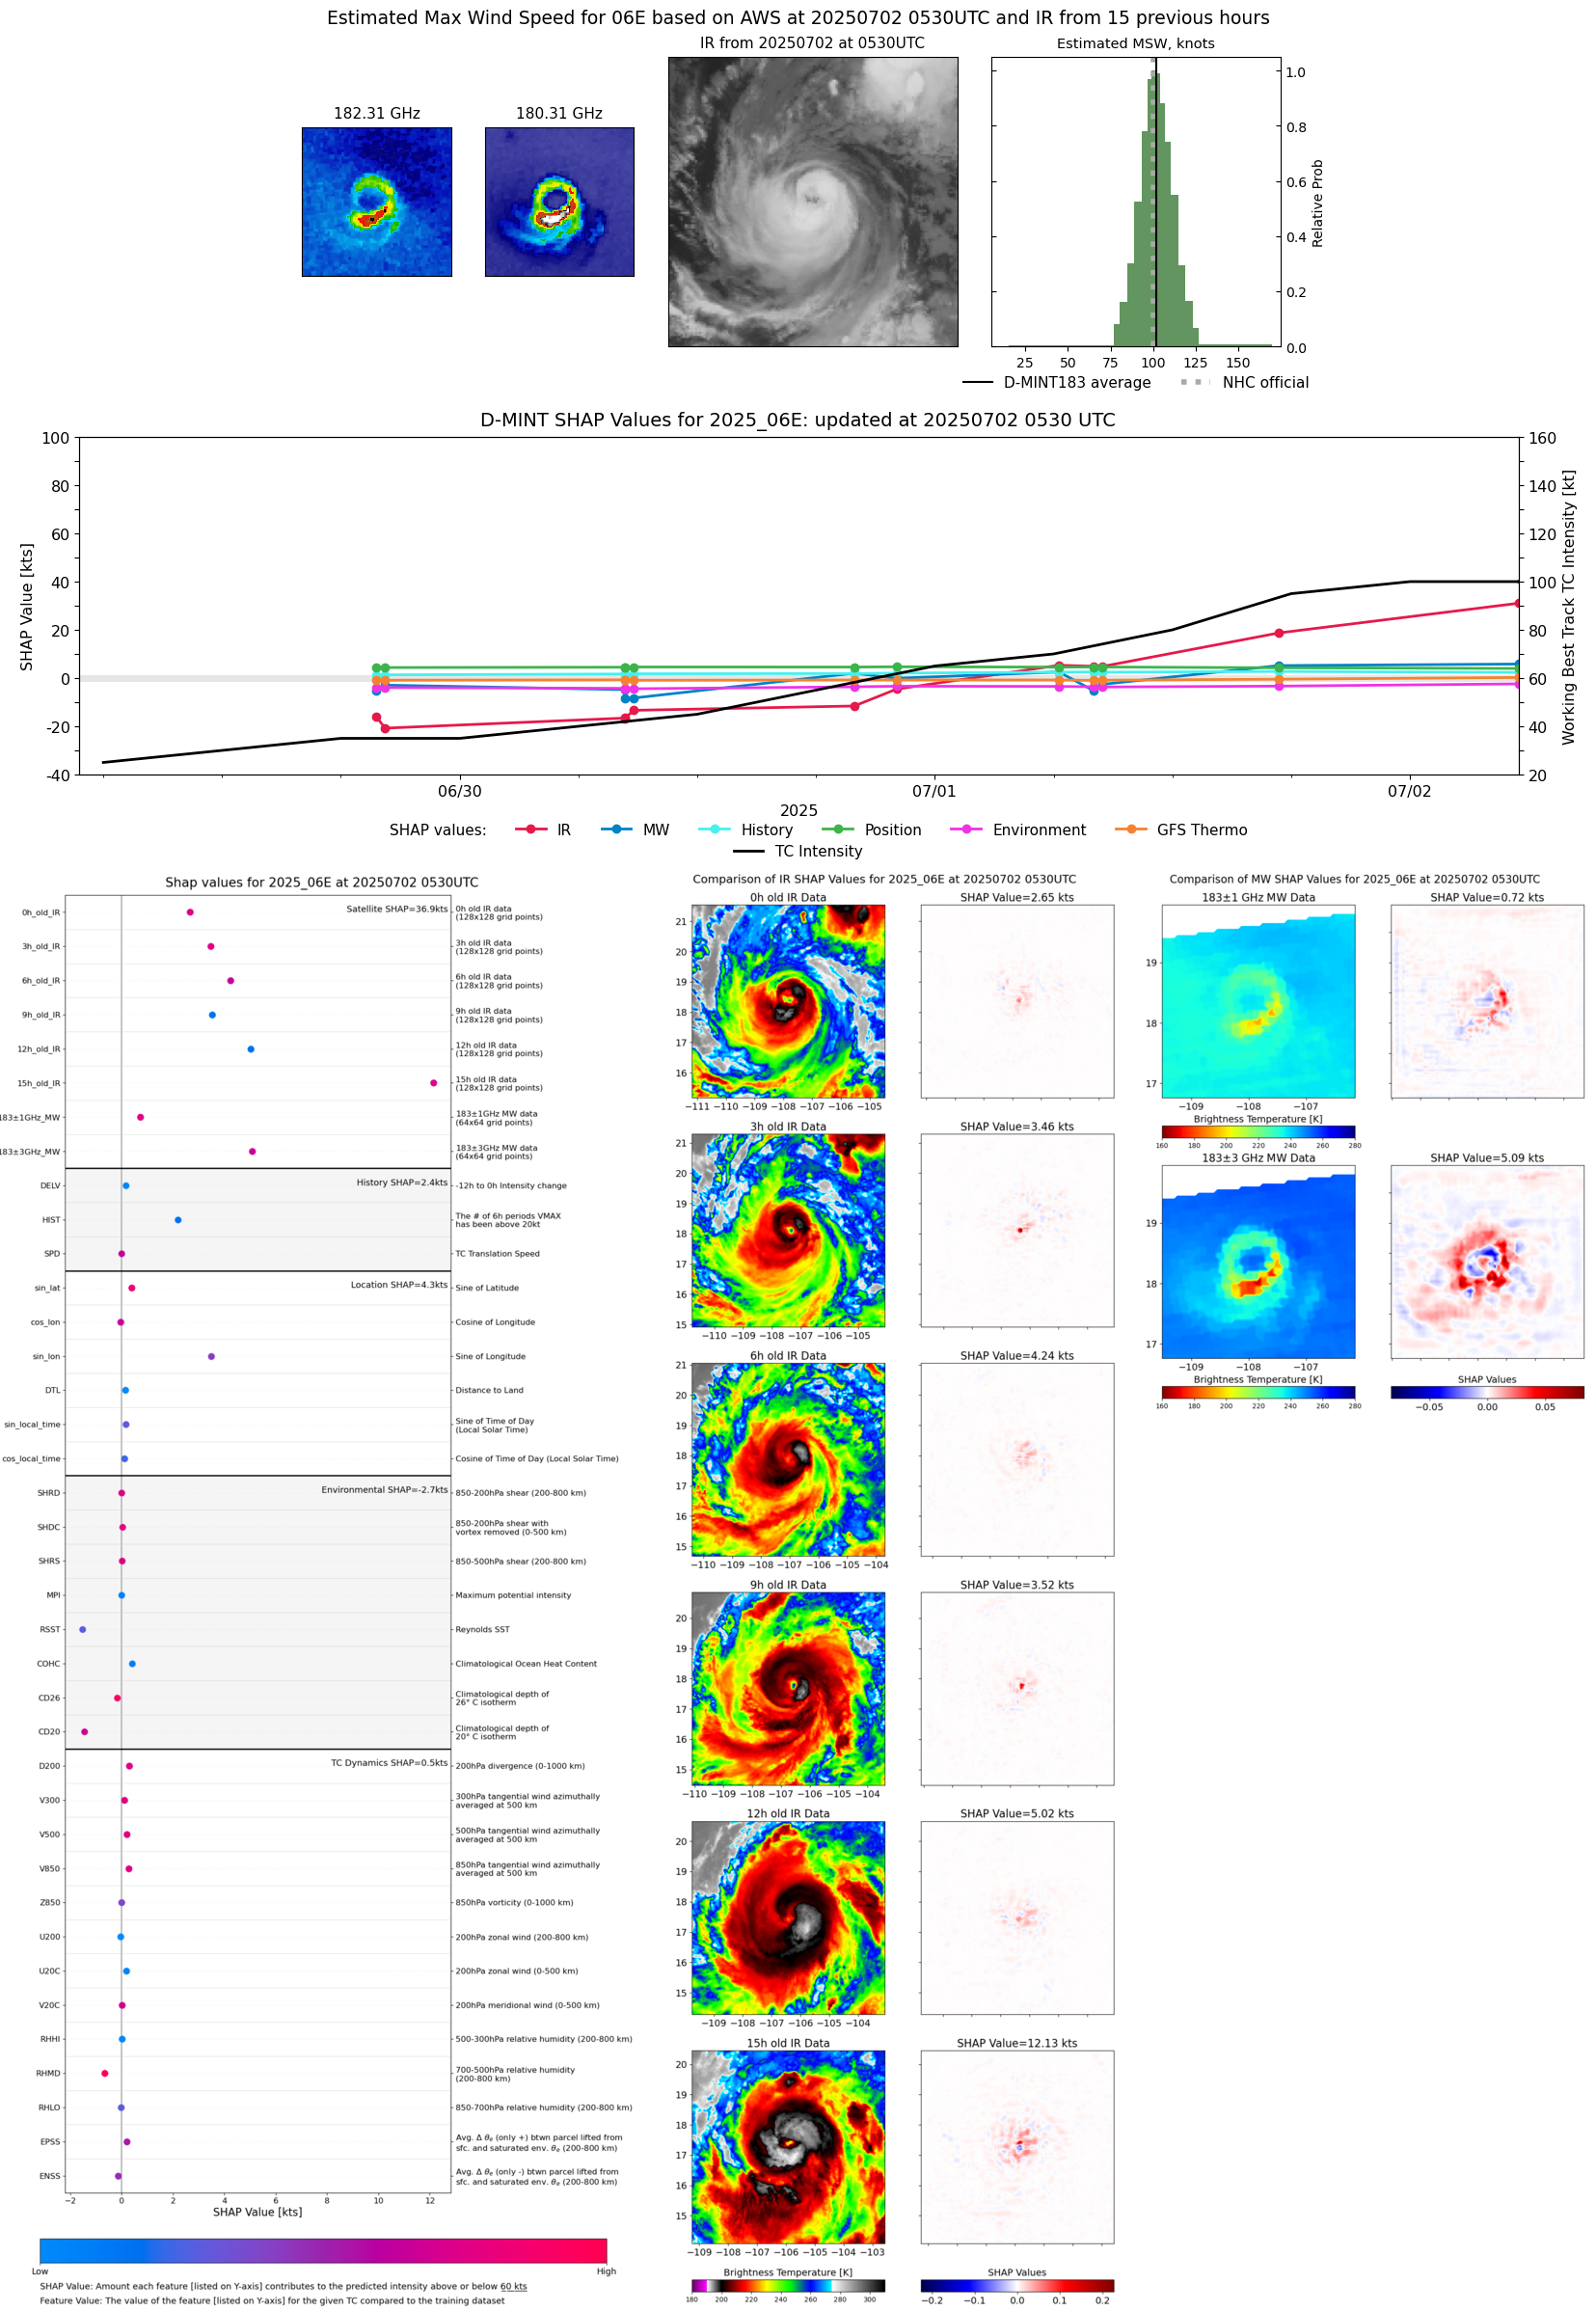 |
| 20250702 | 0133 UTC | SSMISF16 | 961 hPa | 104 kts | 96 kts | 111 kts |  |
| 20250702 | 0128 UTC | SSMISF17 | 961 hPa | 104 kts | 97 kts | 111 kts |  |
| 20250701 | 1722 UTC | TMS02 | 971 hPa | 87 kts | 81 kts | 94 kts |  |
| 20250701 | 1103 UTC | SSMISF18 | 981 hPa | 81 kts | 74 kts | 88 kts | 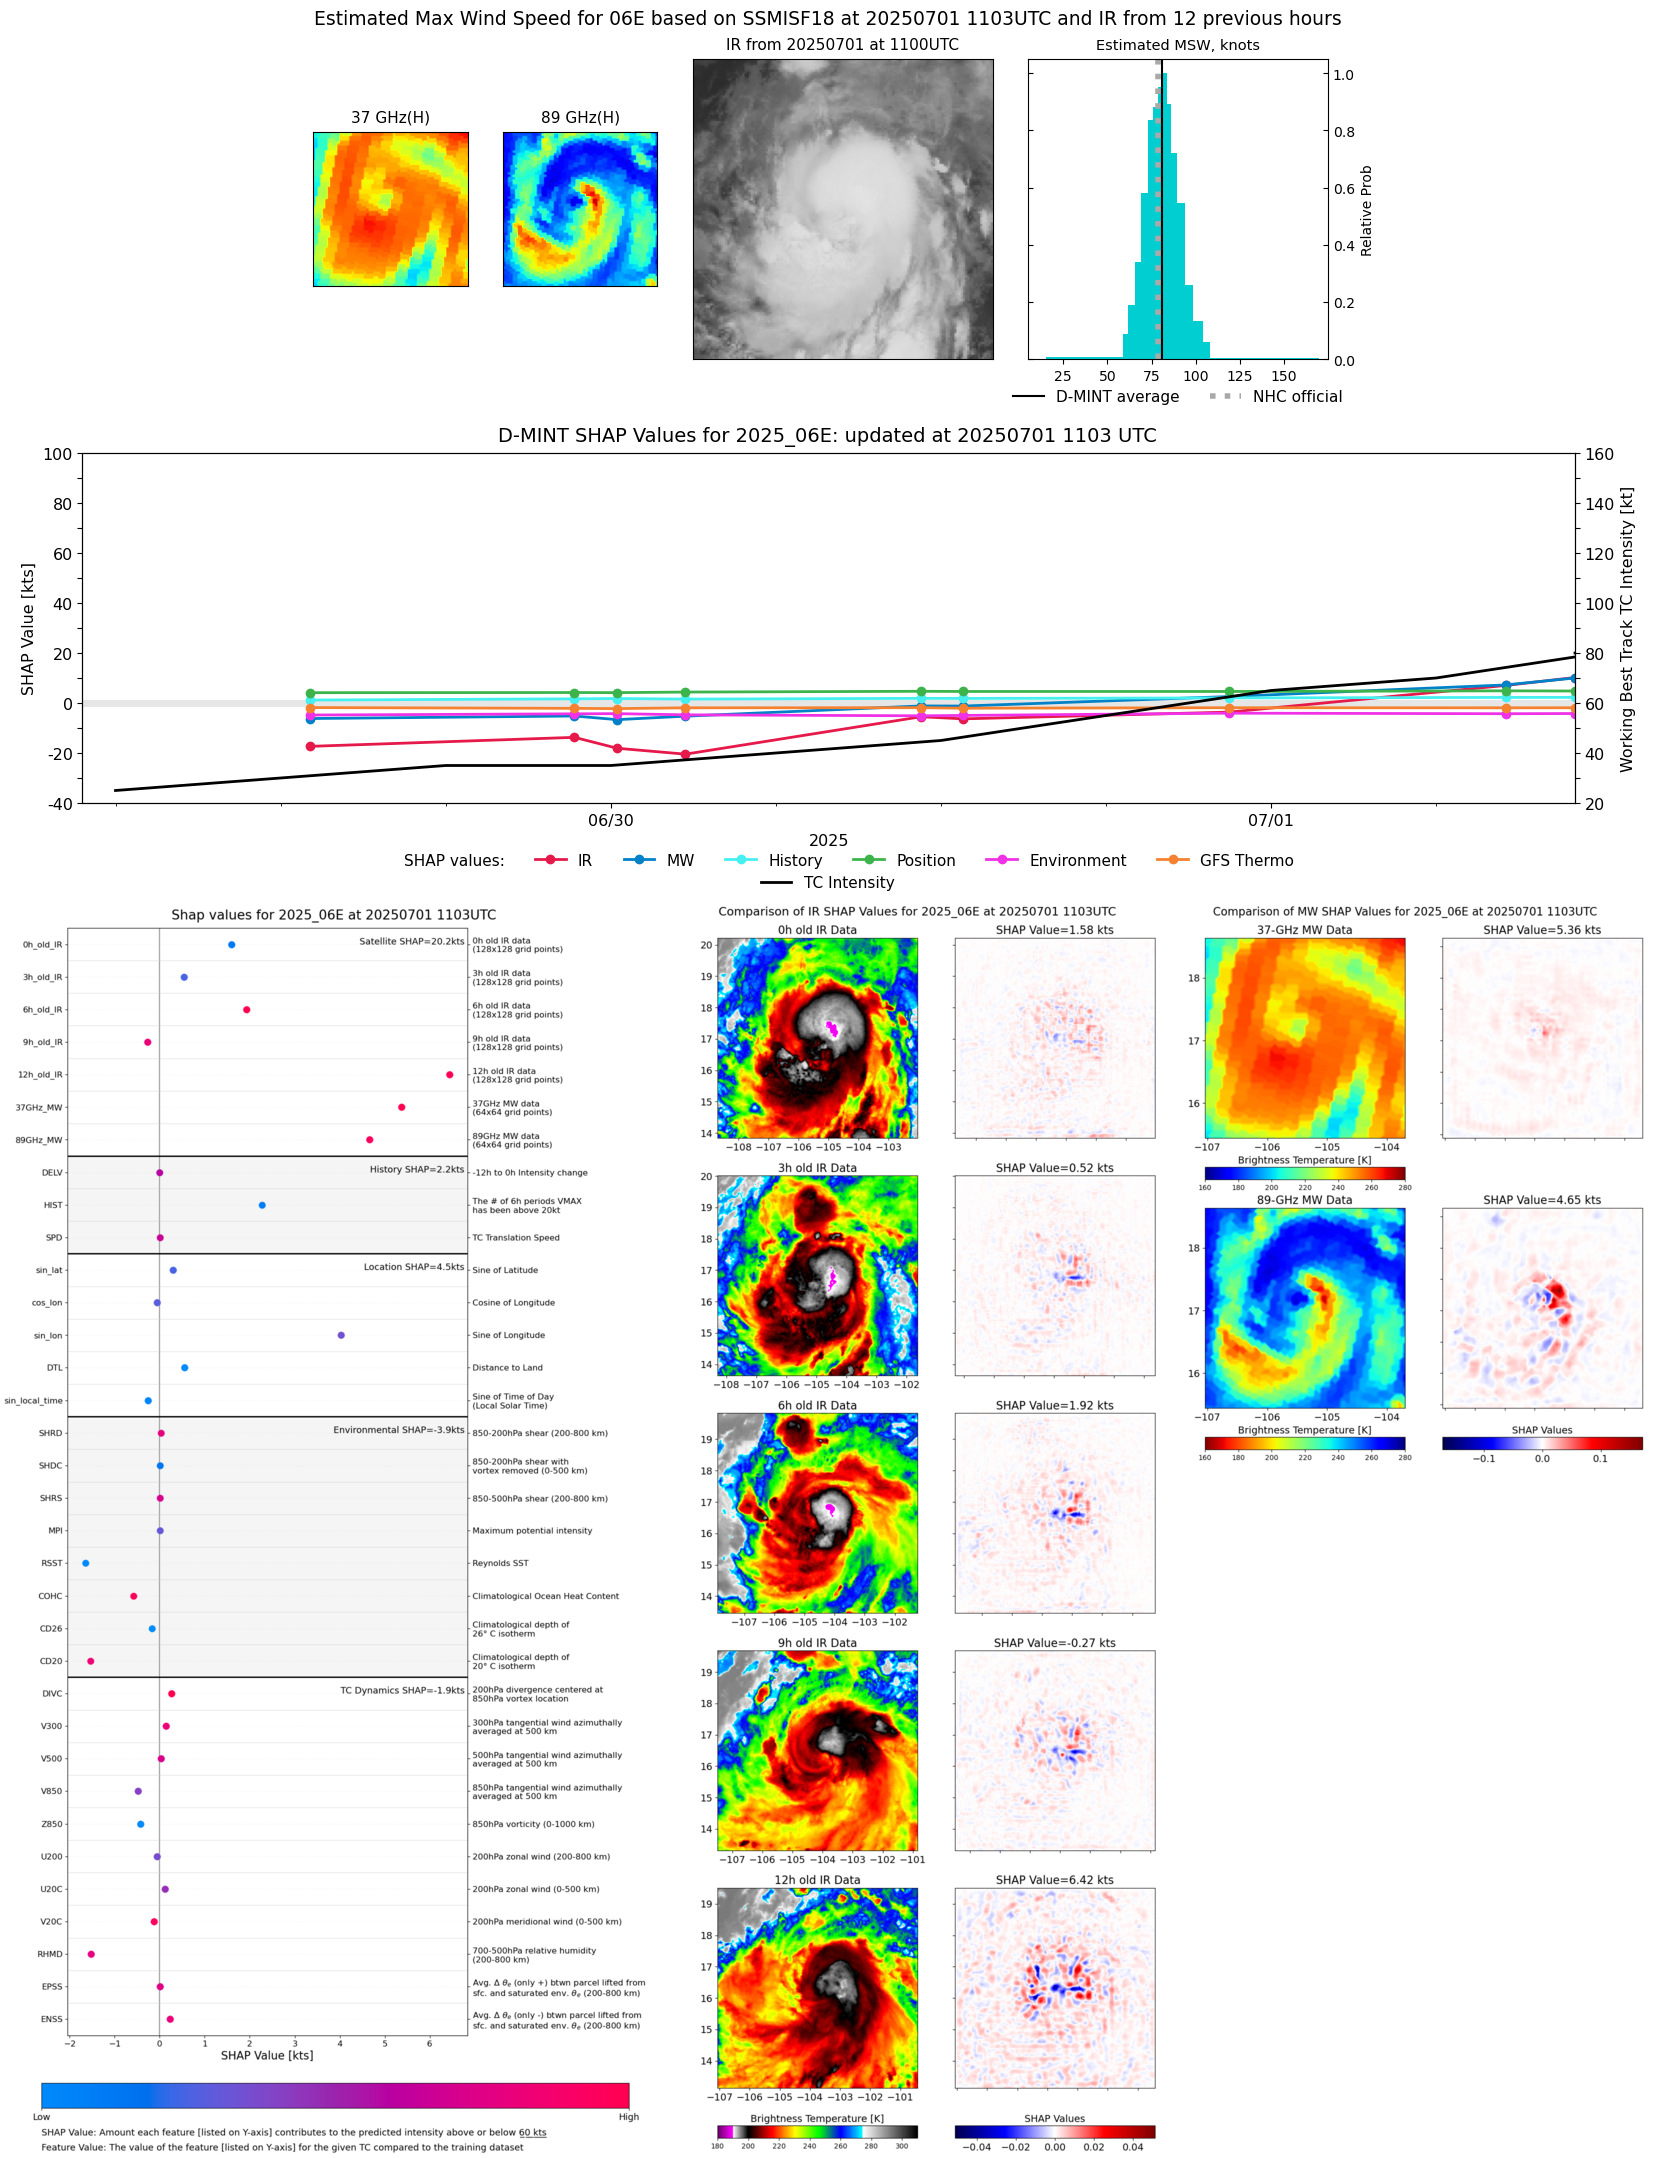 |
| 20250701 | 0832 UTC | AMSR2 | 983 hPa | 75 kts | 69 kts | 82 kts | 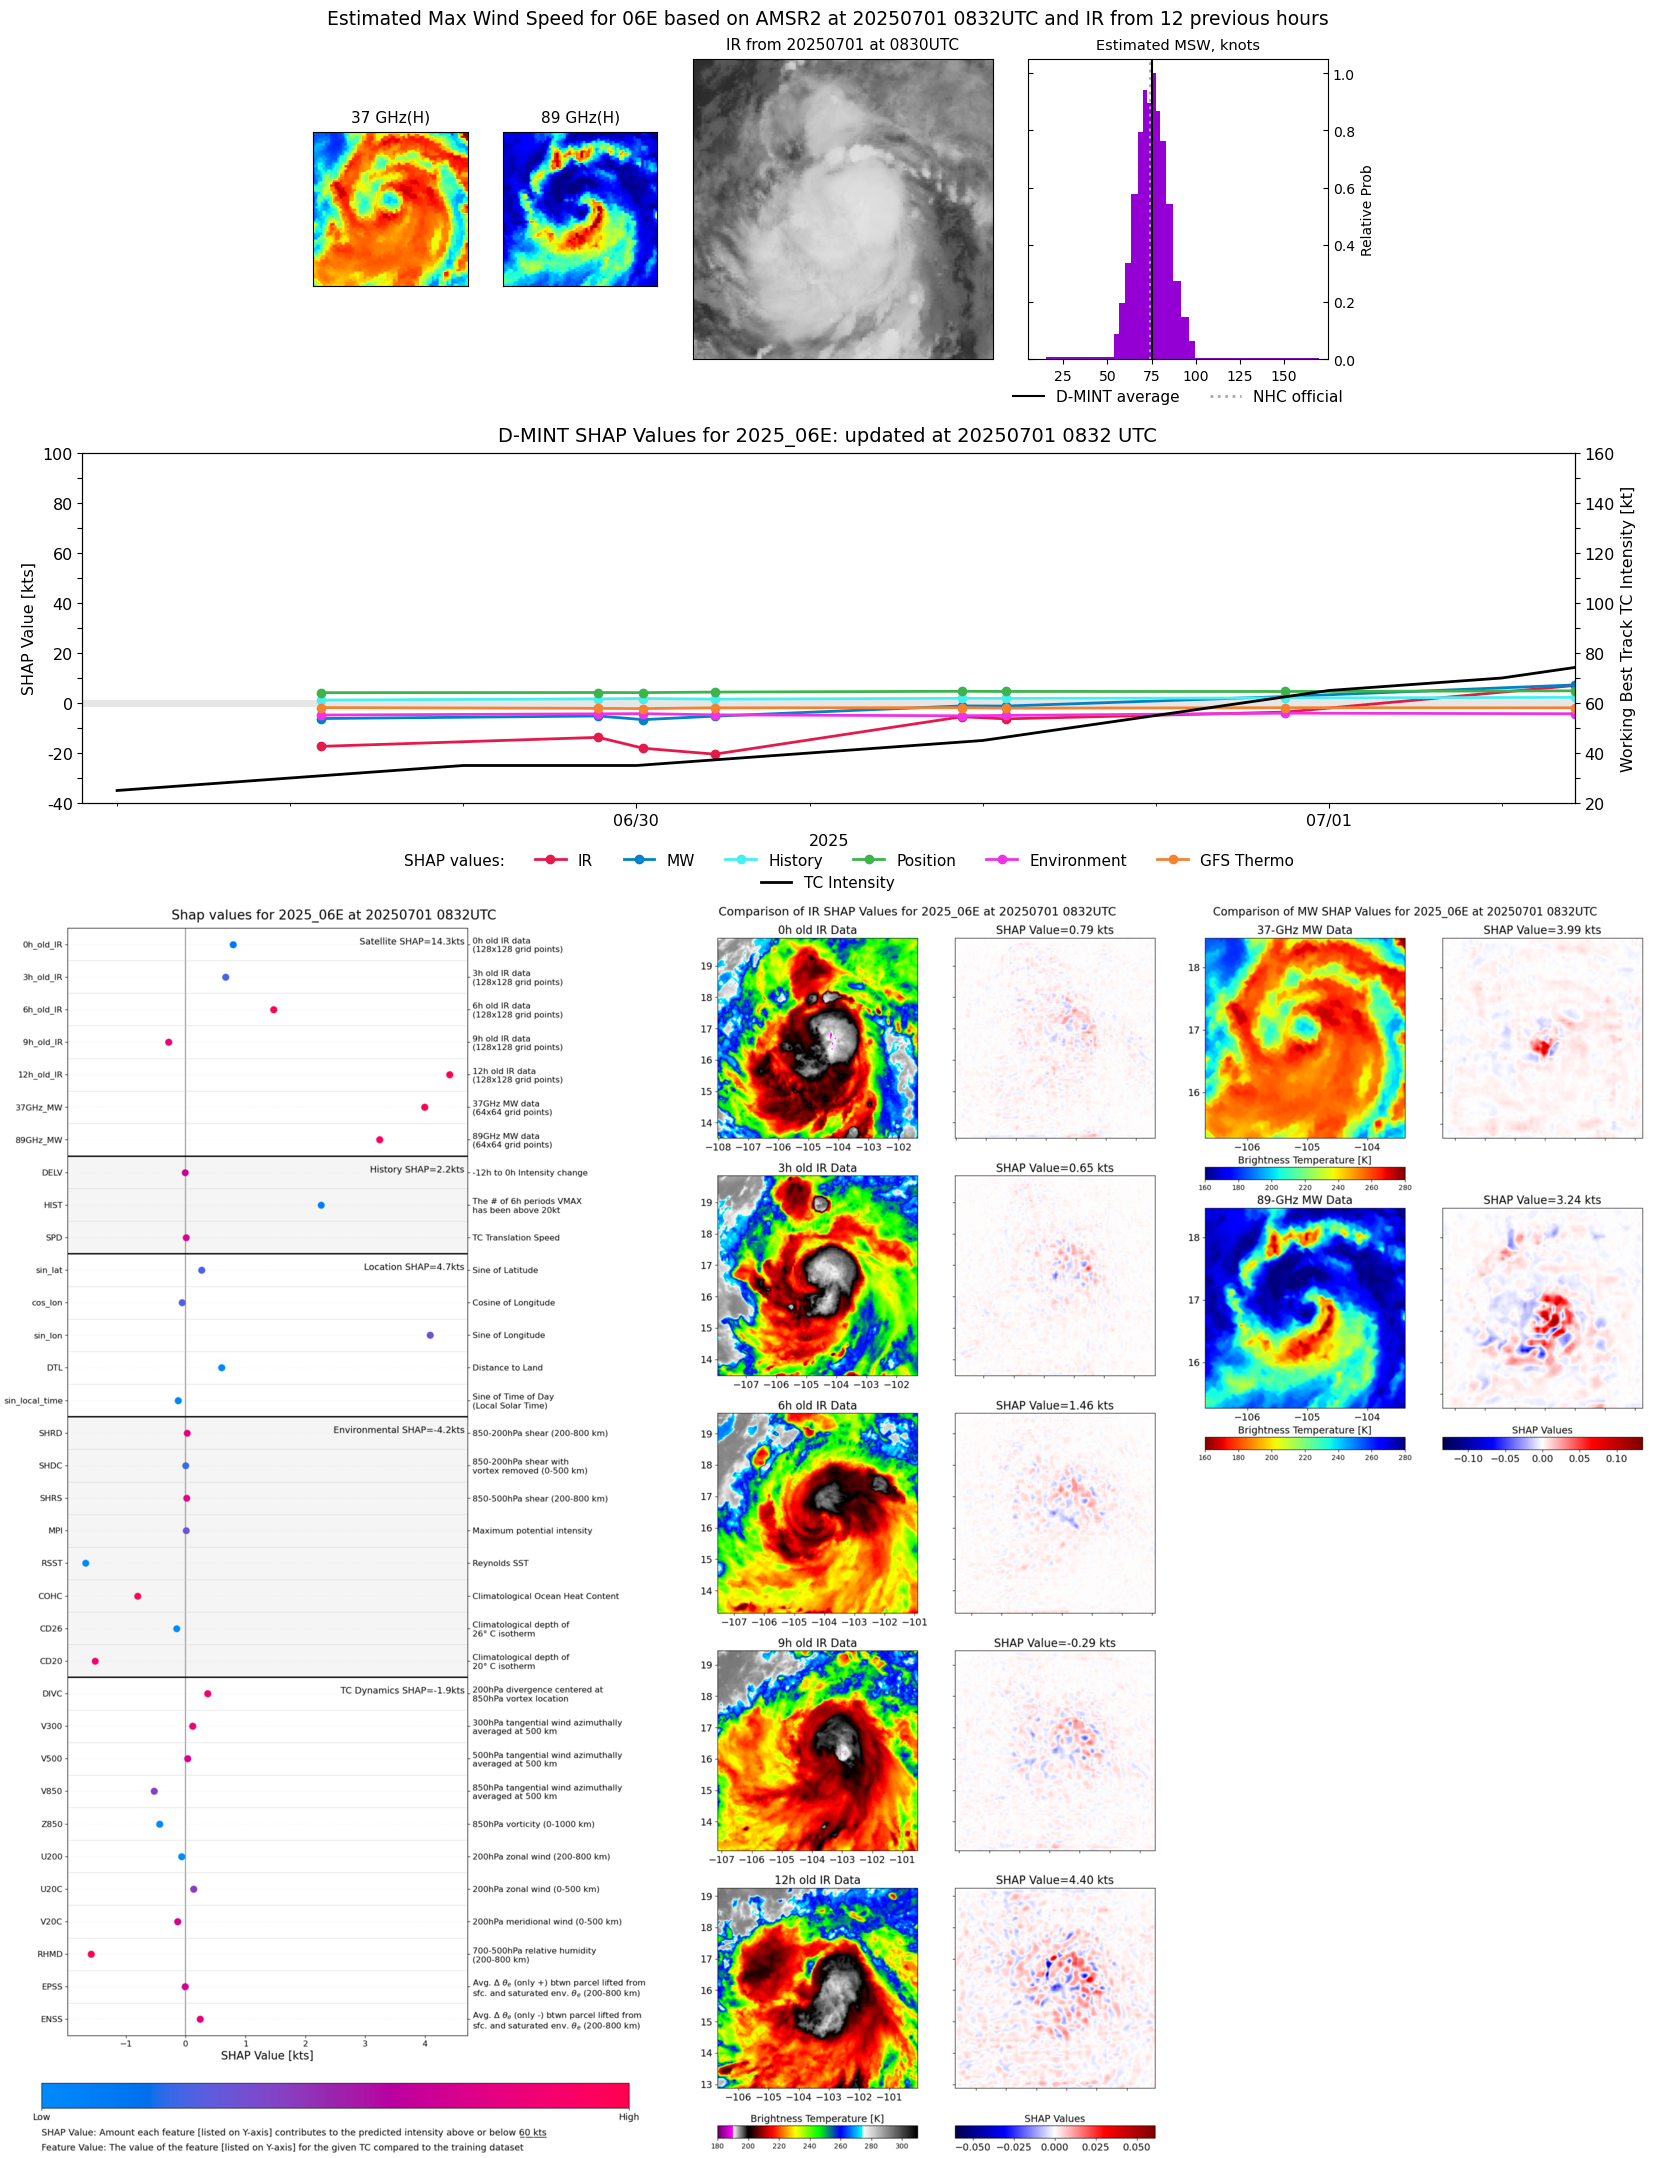 |
| 20250701 | 0828 UTC | ATMS-NPP | 988 hPa | 63 kts | 57 kts | 69 kts | 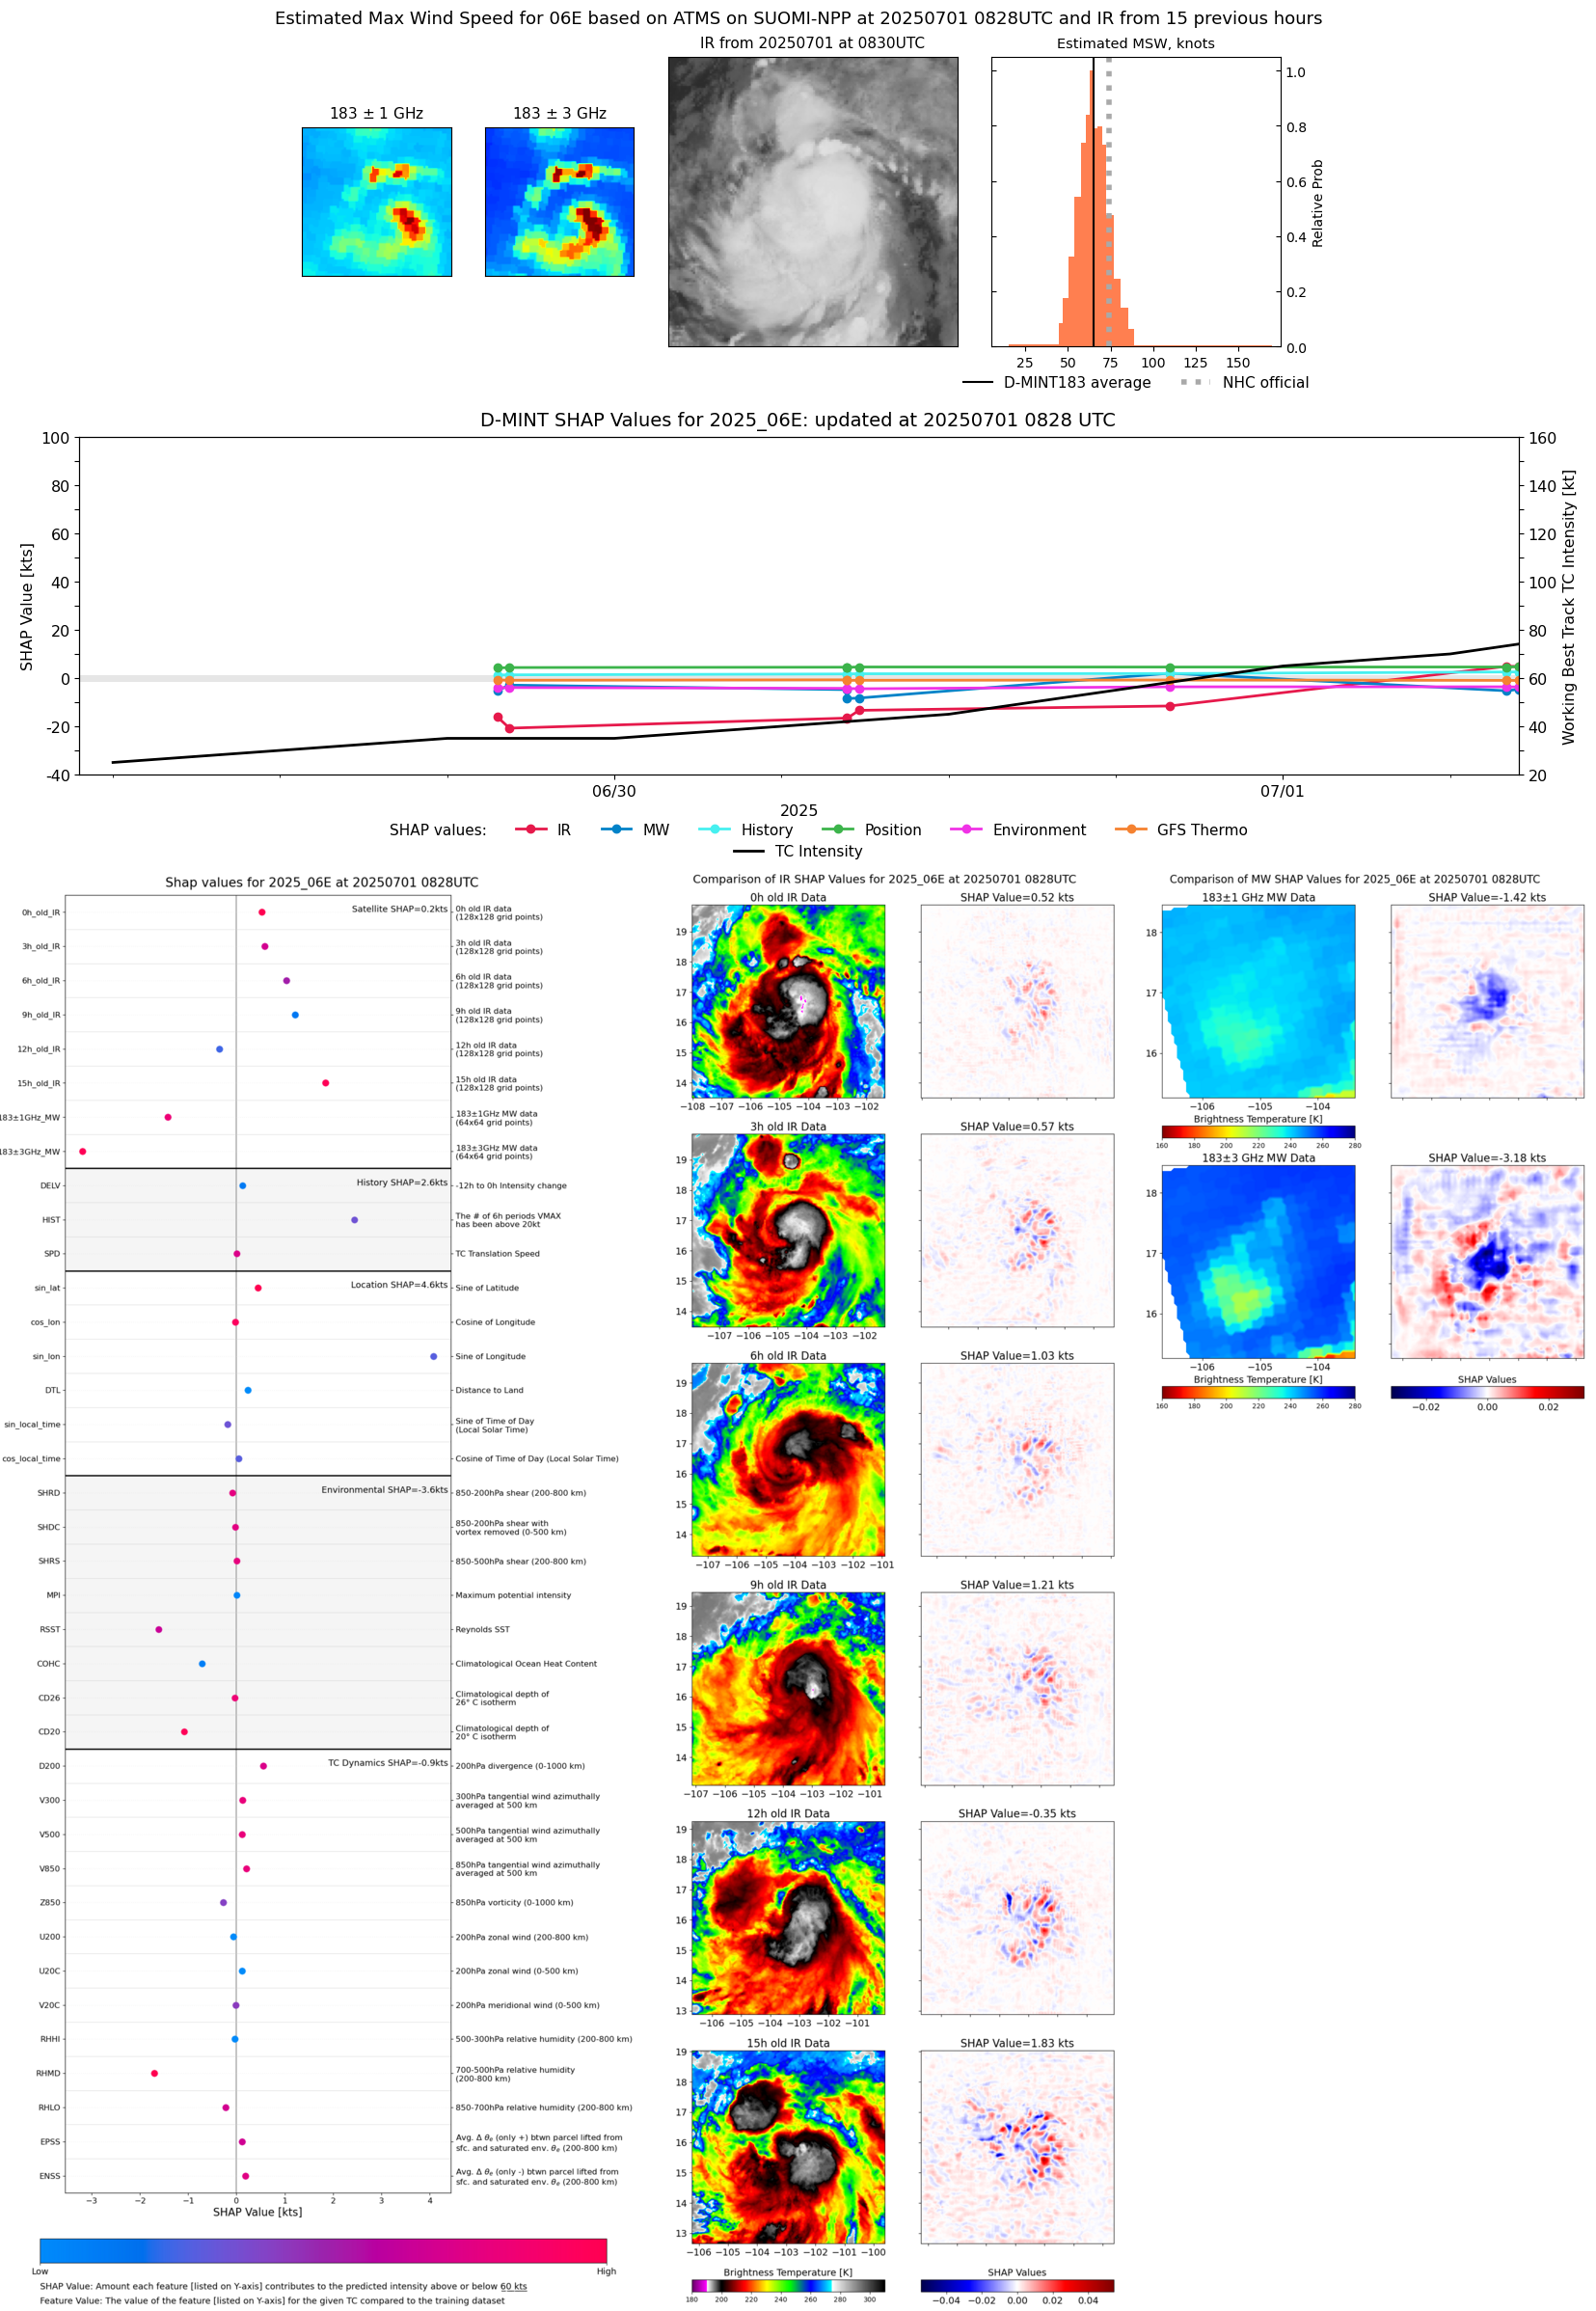 |
| 20250701 | 0828 UTC | ATMS-N20 | 988 hPa | 63 kts | 57 kts | 69 kts | 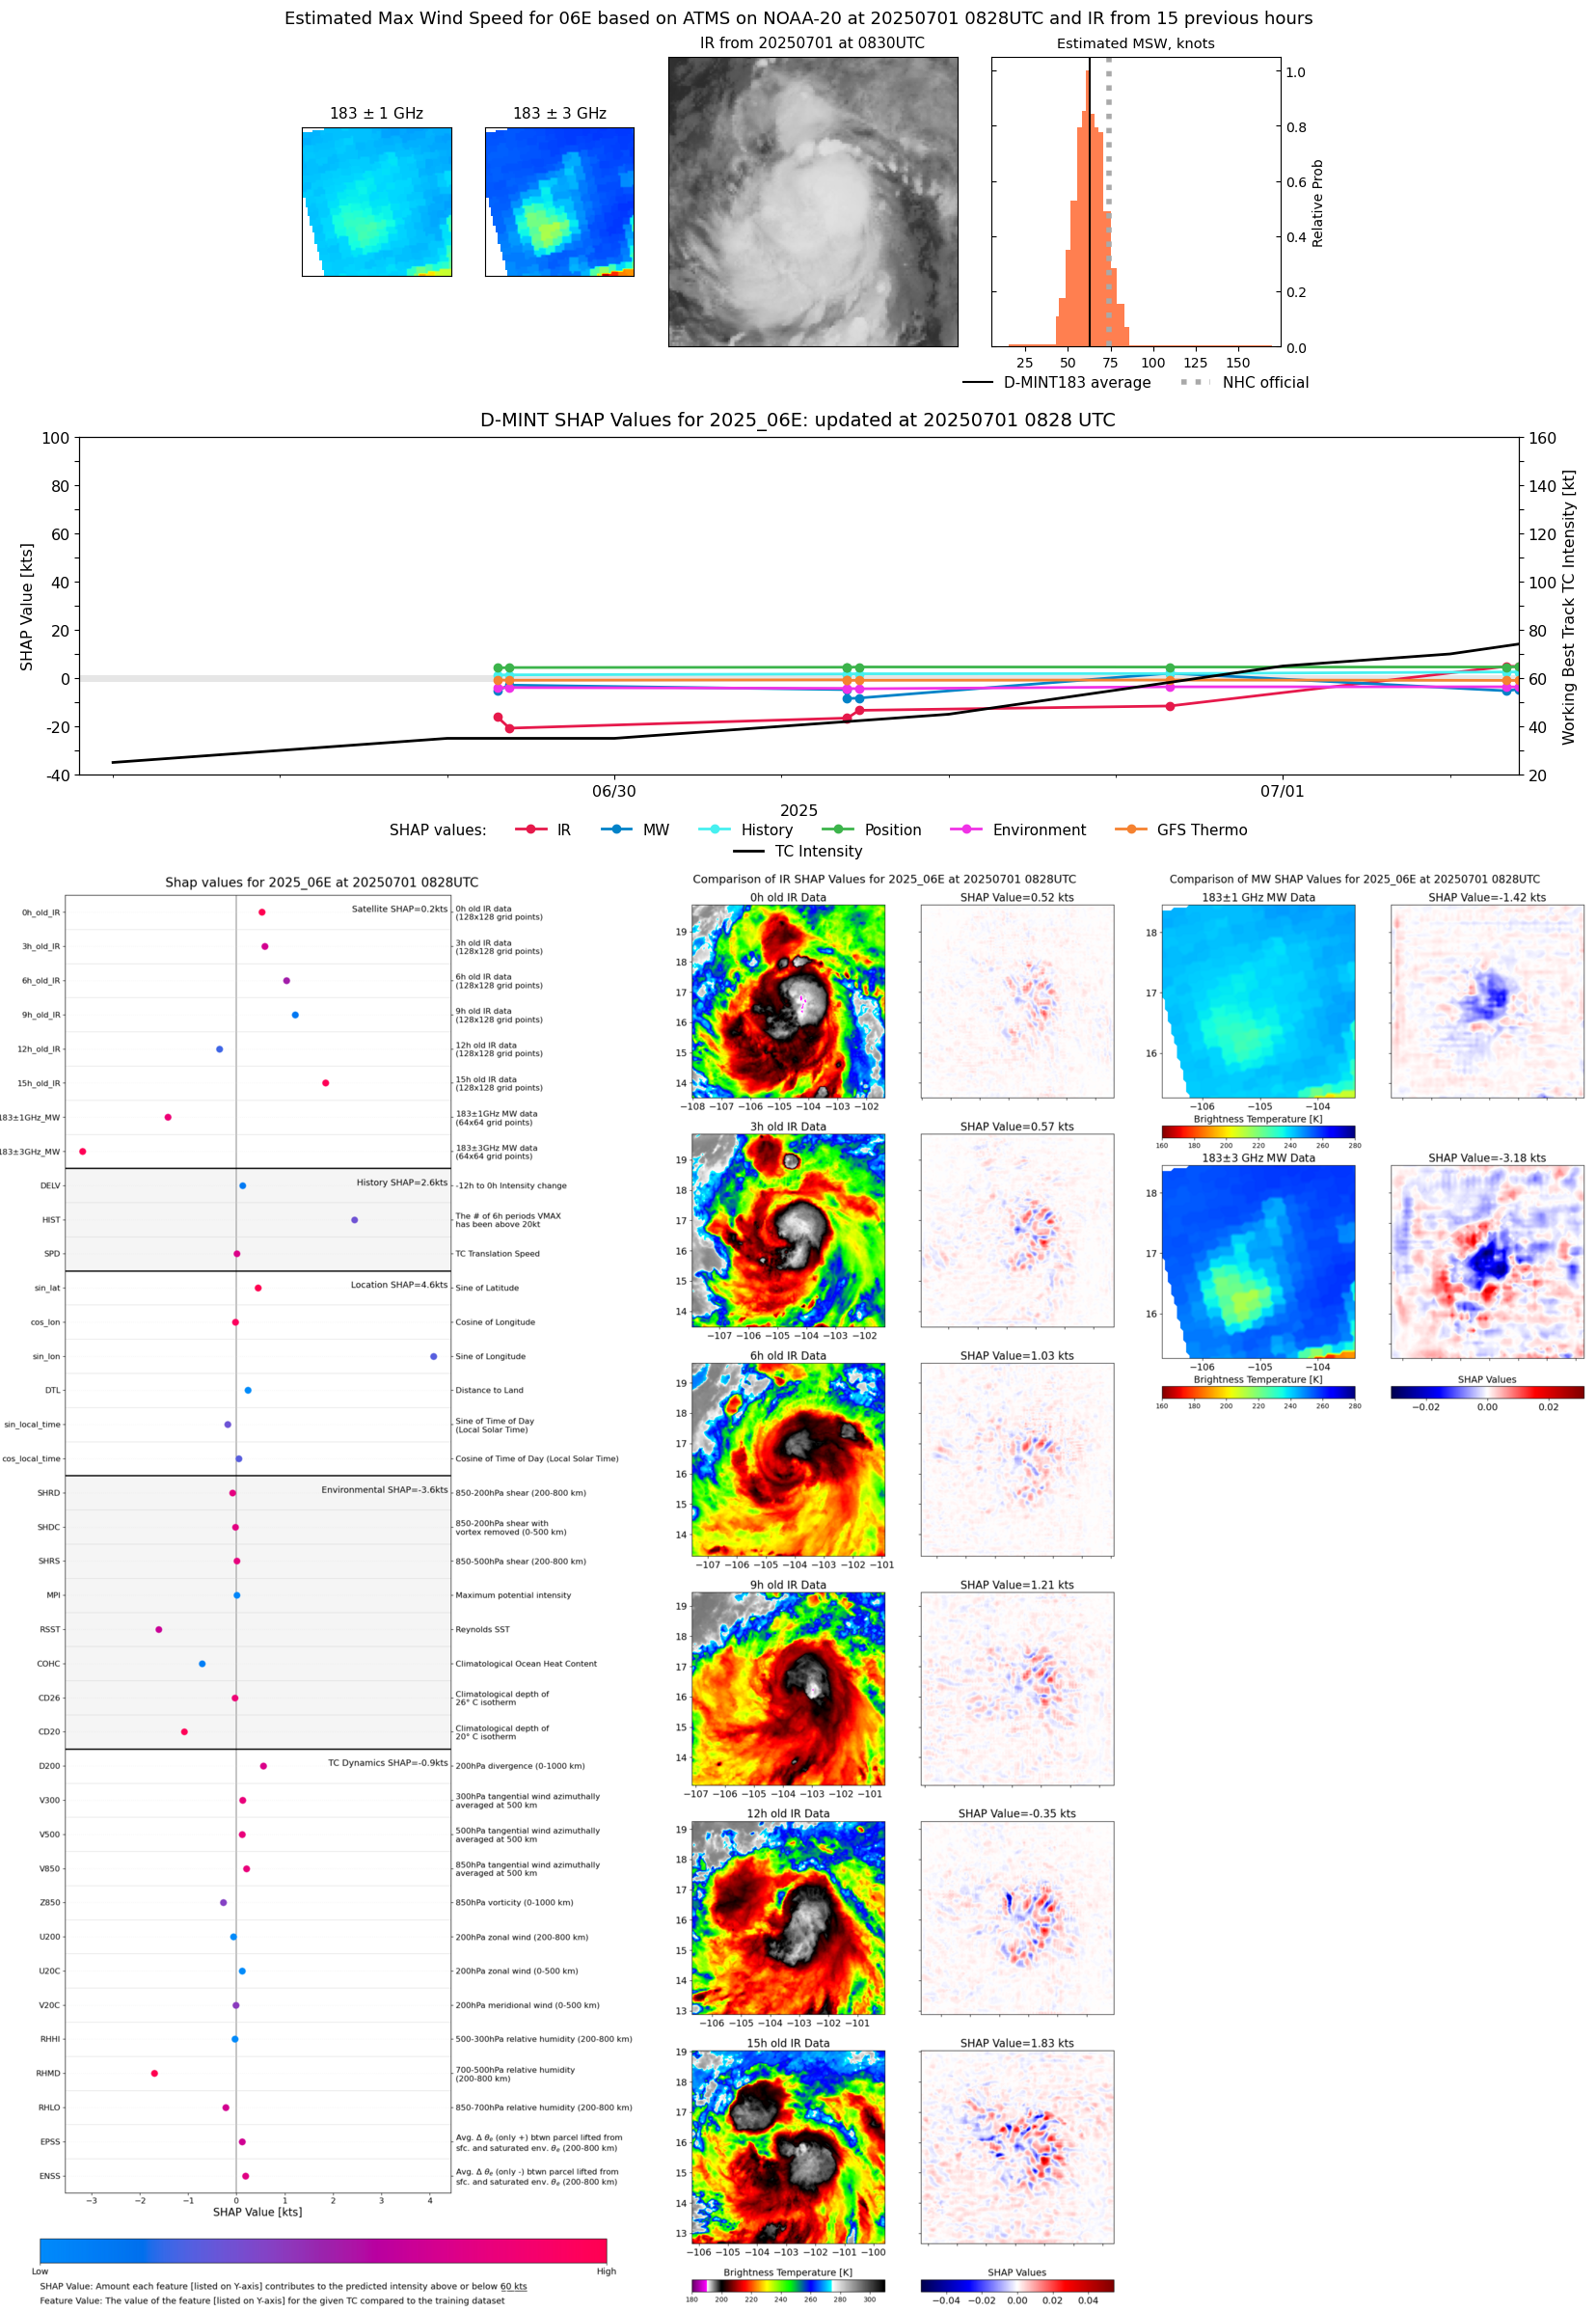 |
| 20250701 | 0802 UTC | ATMS-N20 | 988 hPa | 62 kts | 56 kts | 69 kts |  |
| 20250701 | 0616 UTC | TROPICS05 | 984 hPa | 71 kts | 65 kts | 77 kts |  |
| 20250701 | 0518 UTC | AWS | 983 hPa | 67 kts | 61 kts | 73 kts | 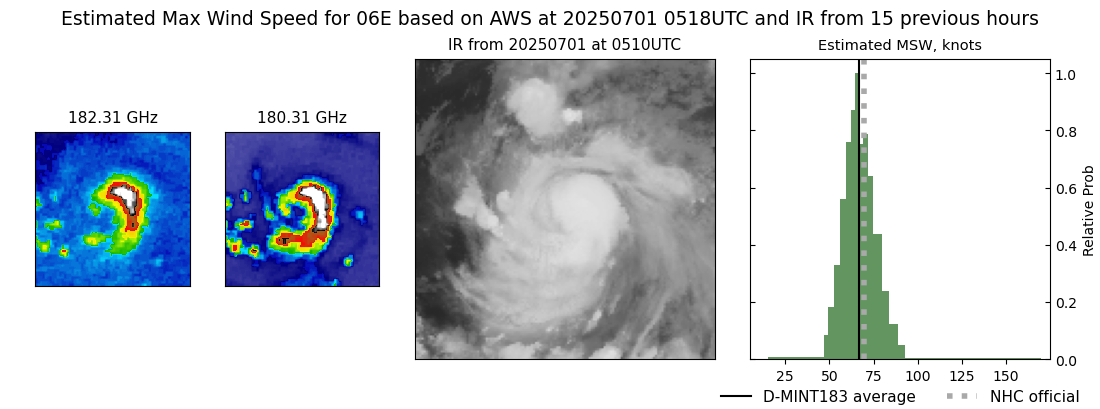 |
| 20250630 | 2229 UTC | SSMISF18 | 991 hPa | 60 kts | 54 kts | 66 kts | 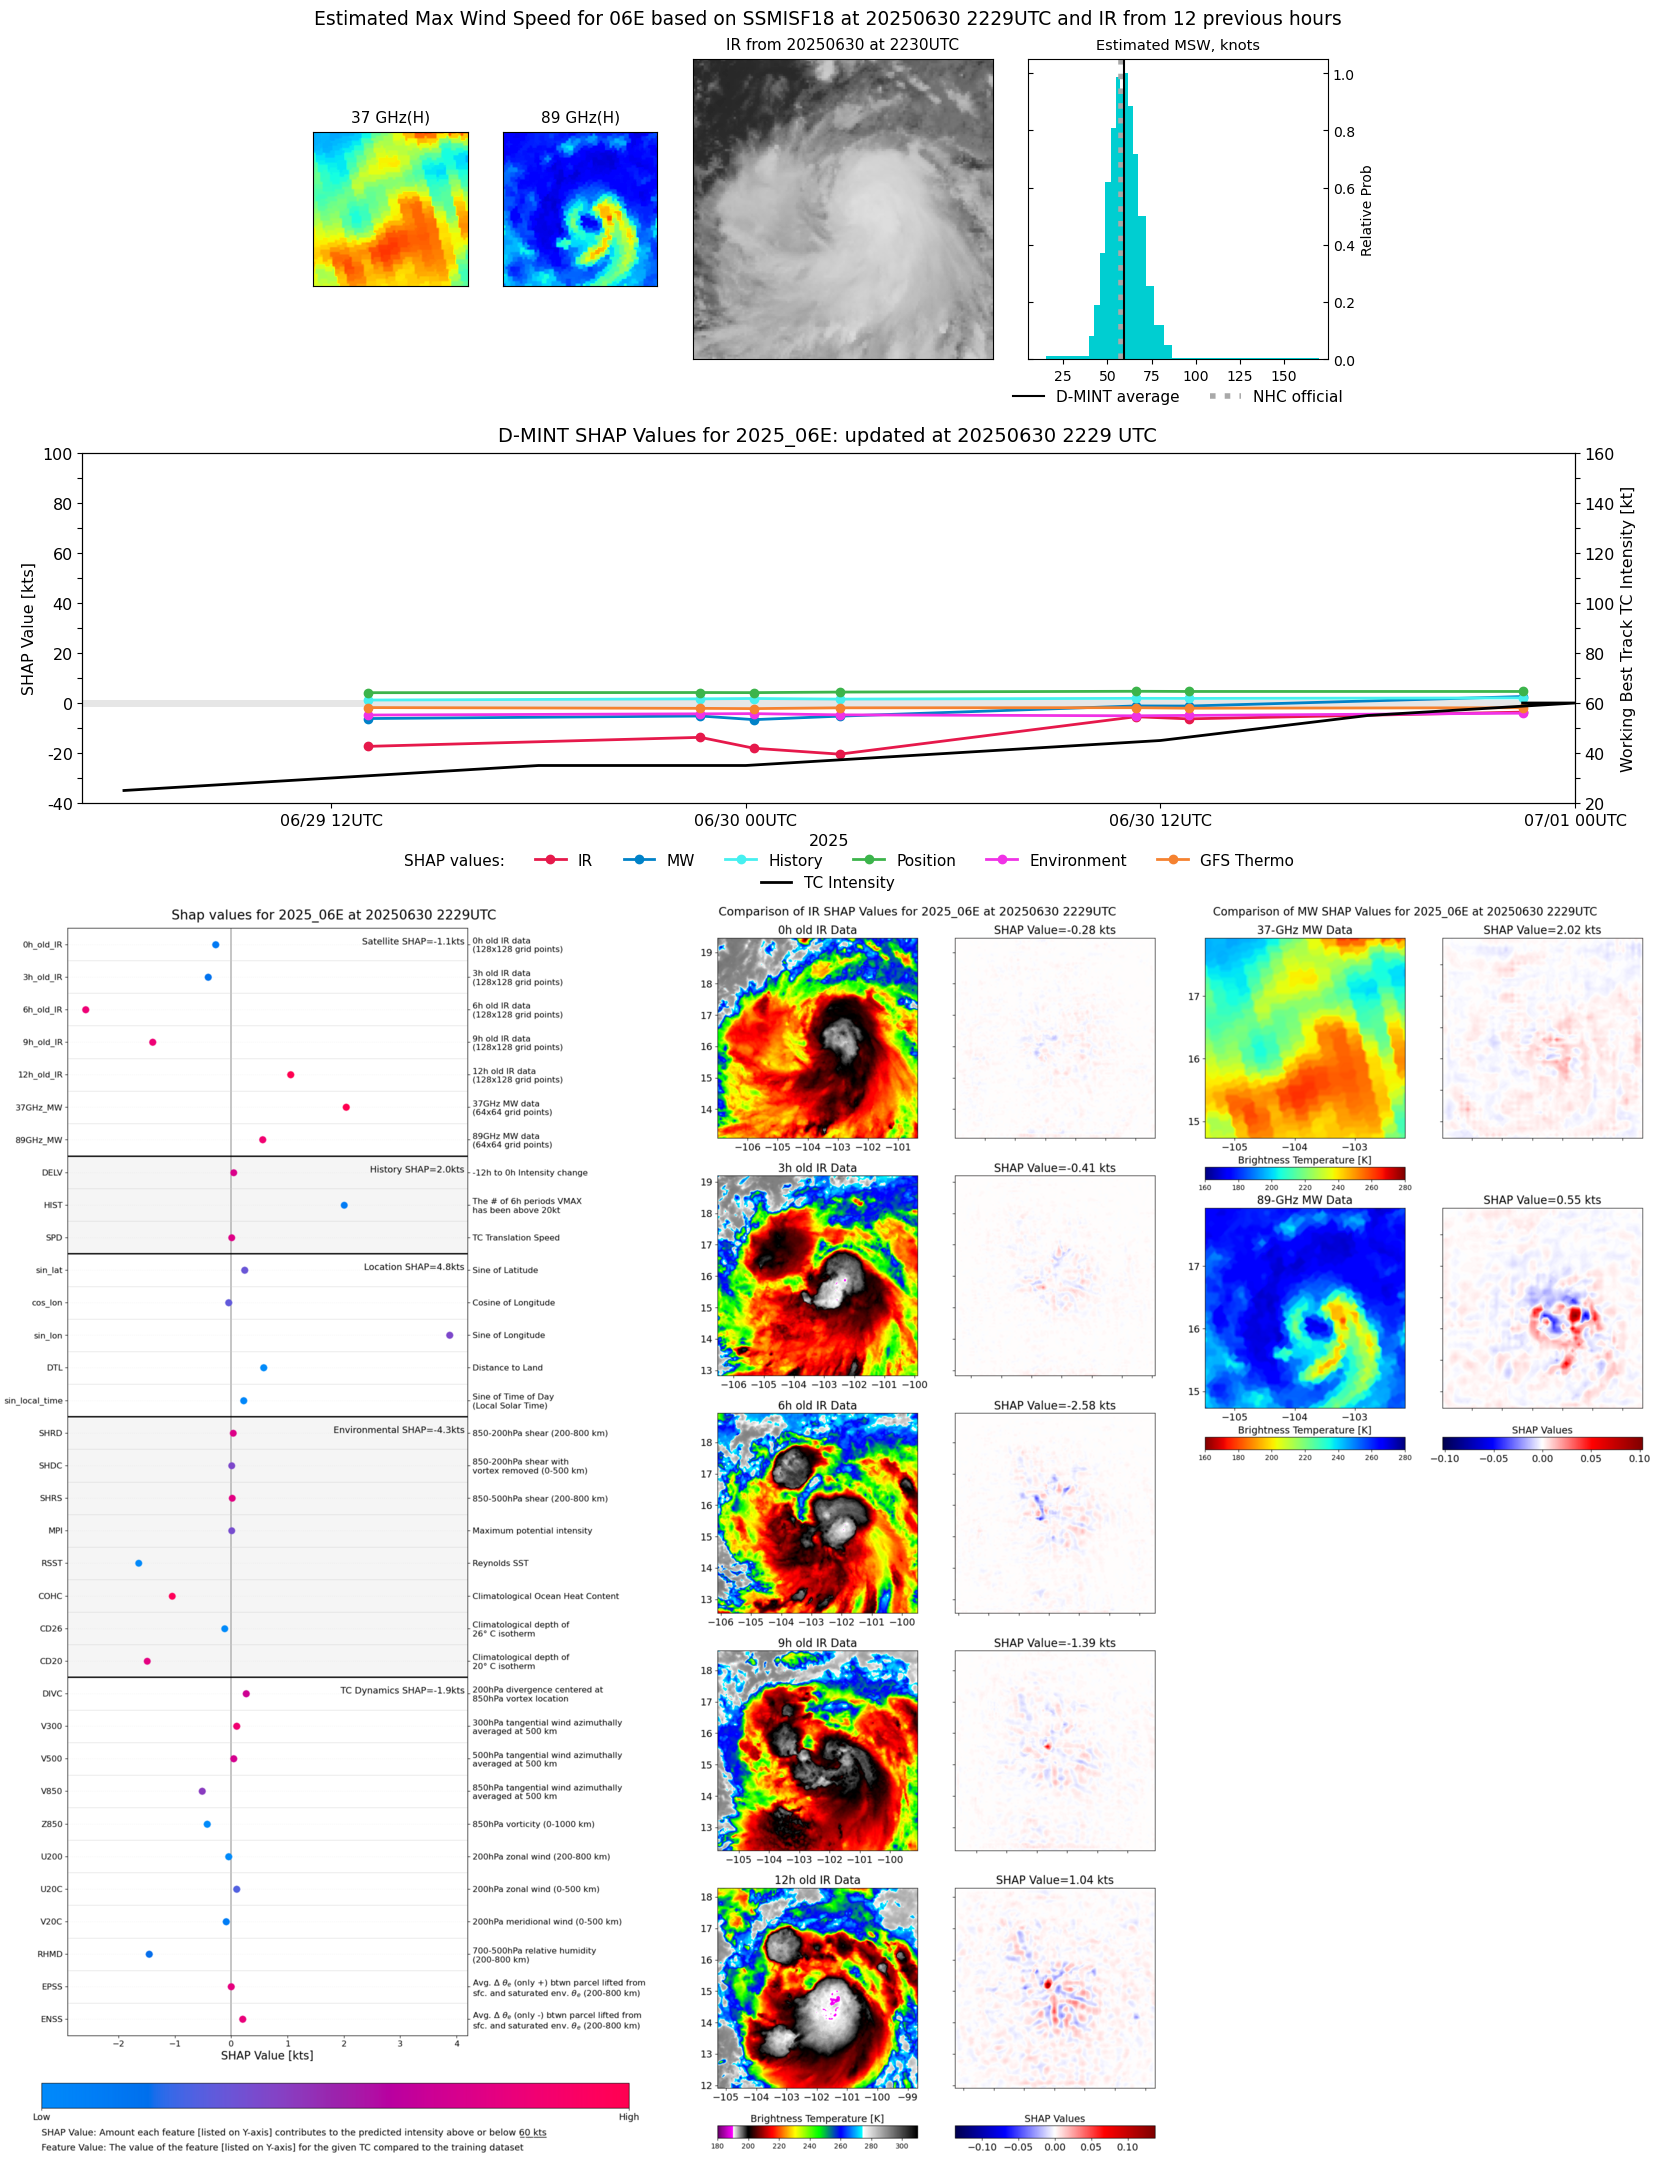 |
| 20250630 | 2204 UTC | TROPICS05 | 992 hPa | 58 kts | 53 kts | 64 kts | 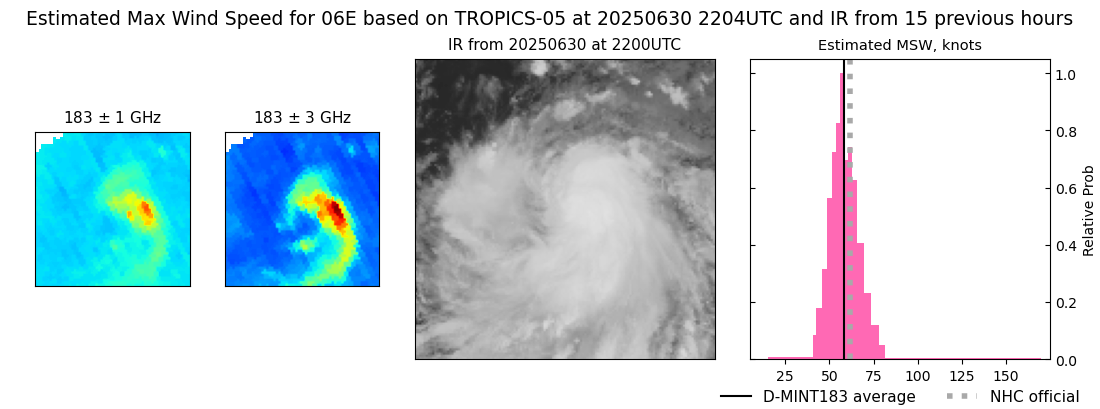 |
| 20250630 | 2019 UTC | AMSR2 | 992 hPa | 56 kts | 51 kts | 62 kts | 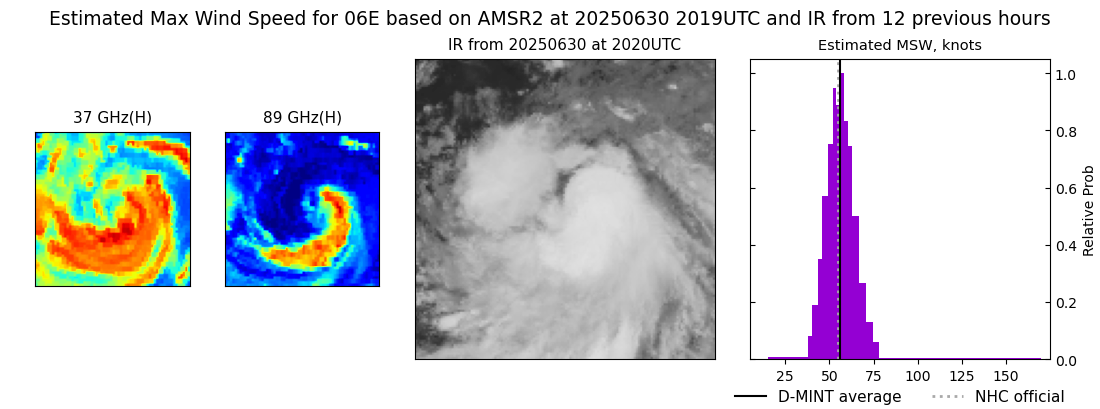 |
| 20250630 | 1956 UTC | ATMS-N20 | 996 hPa | 53 kts | 48 kts | 58 kts | 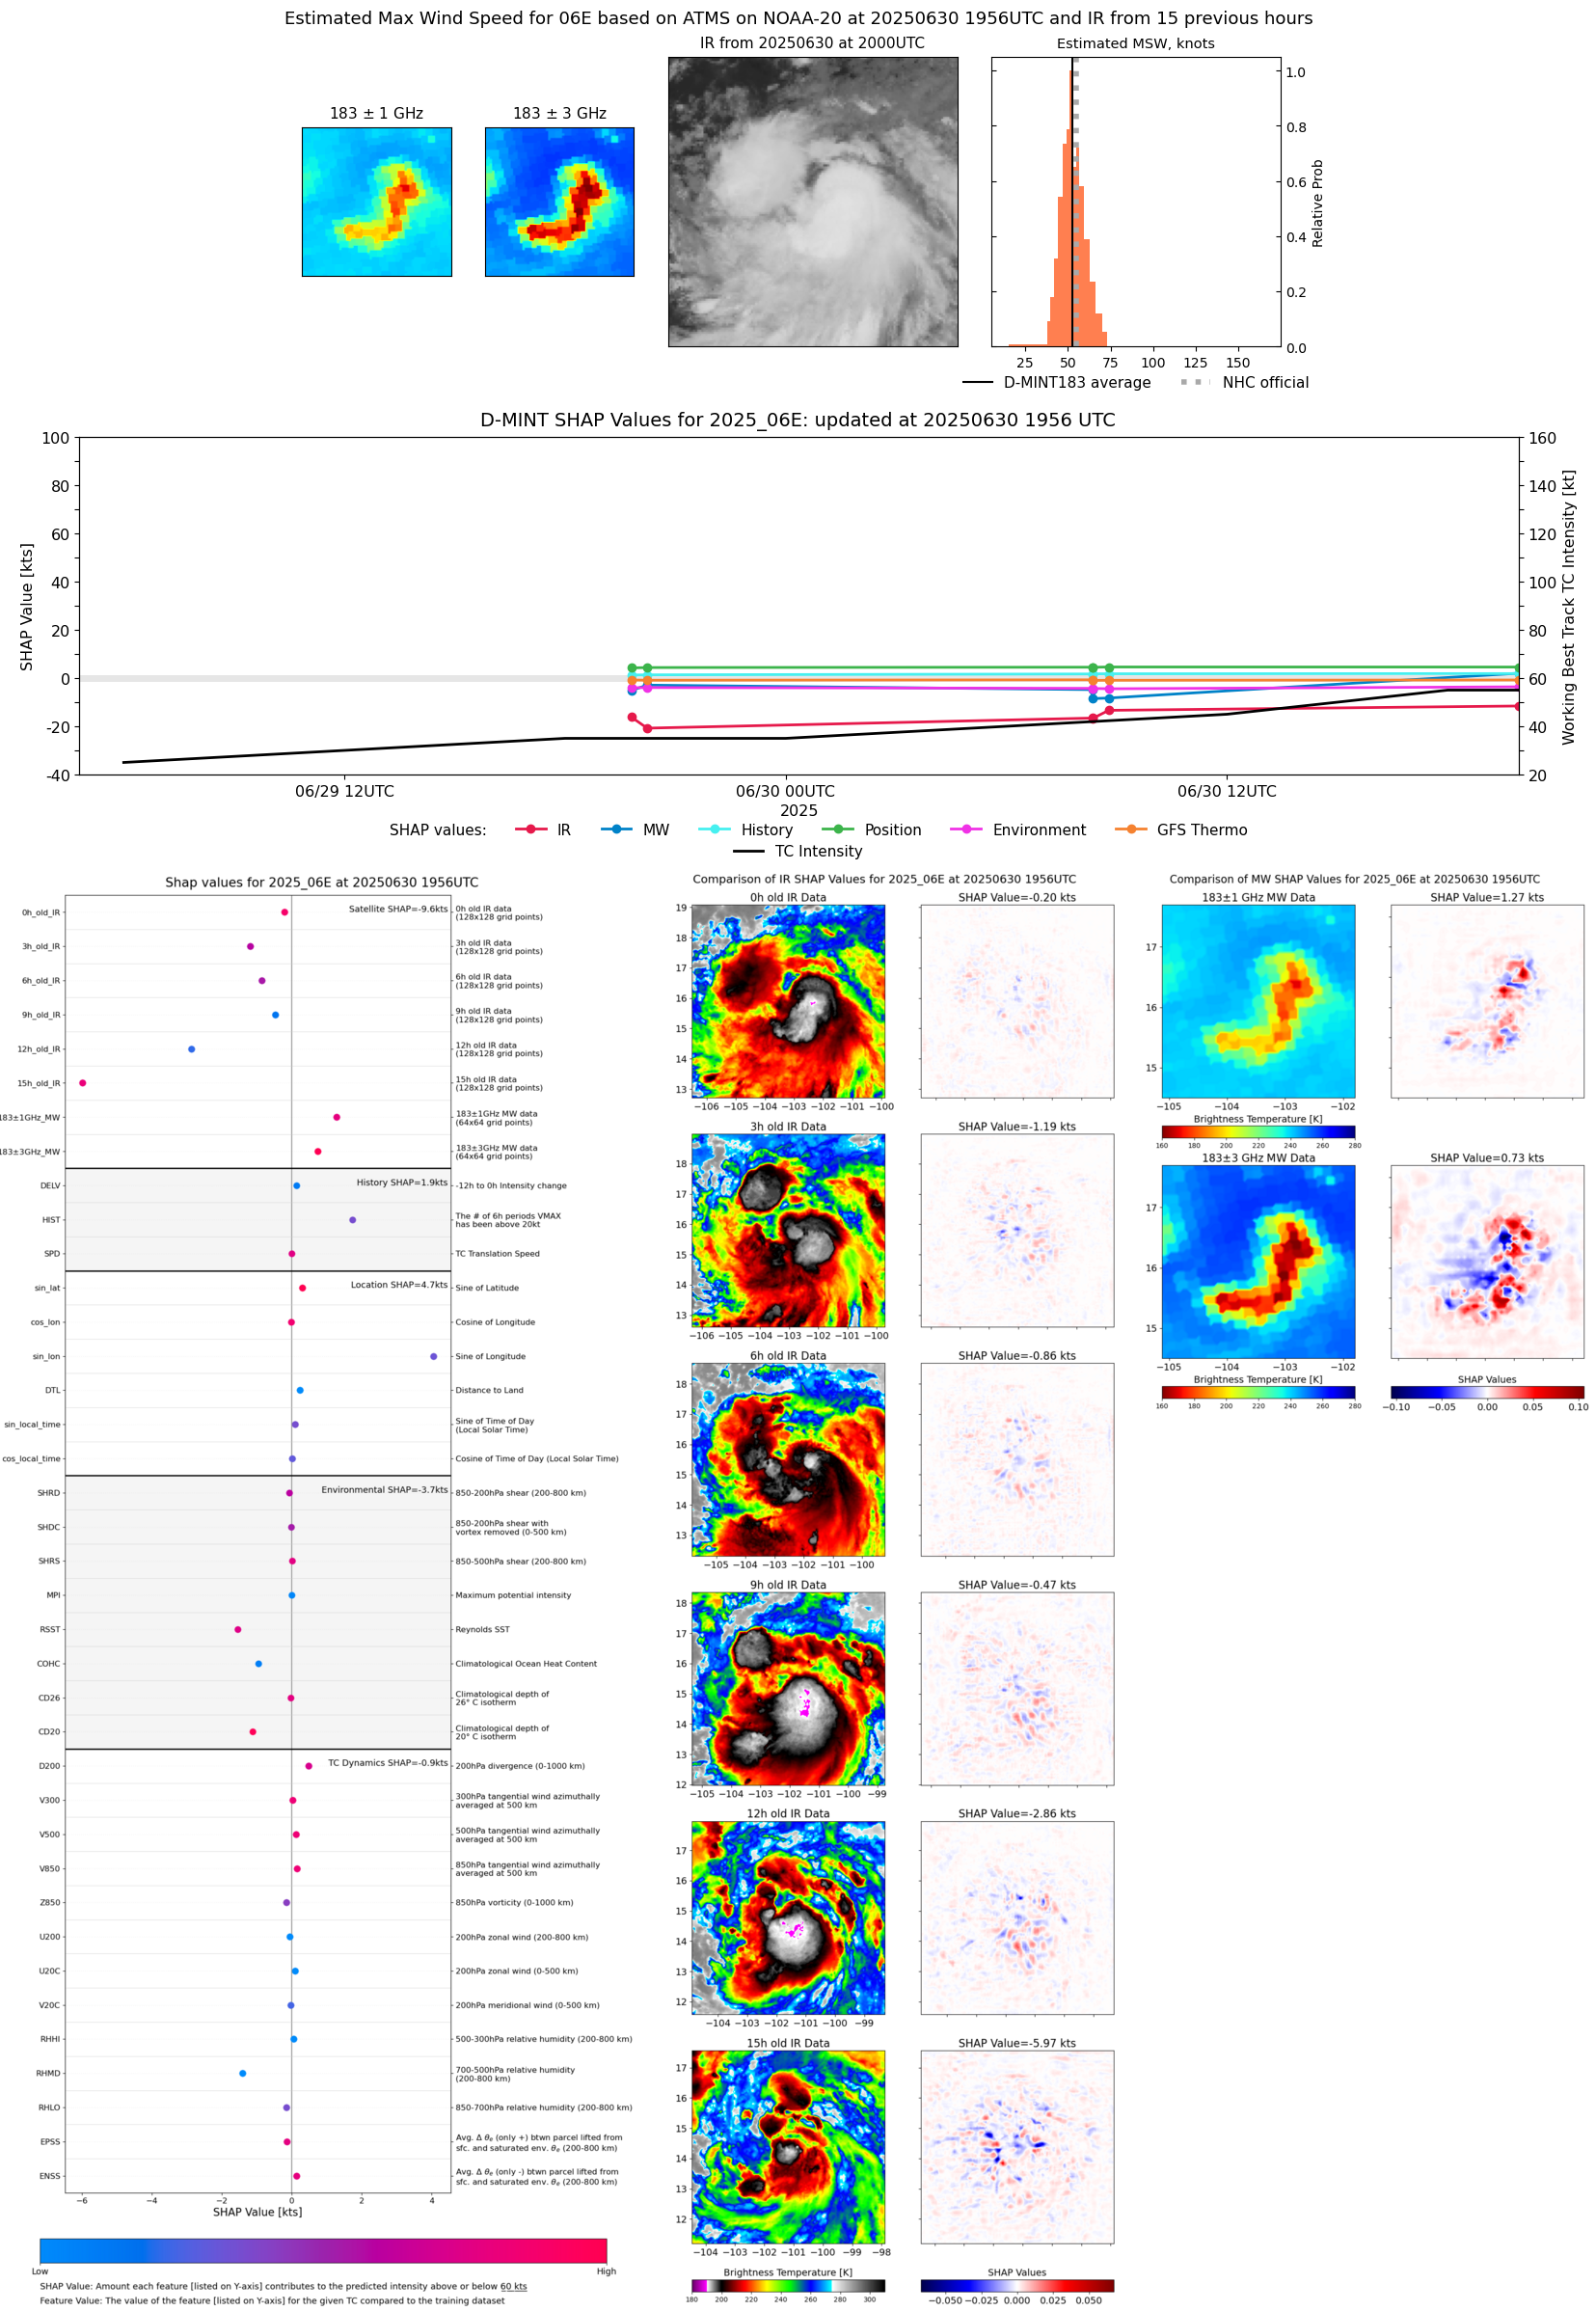 |
| 20250630 | 1249 UTC | SSMISF17 | 996 hPa | 52 kts | 47 kts | 57 kts | 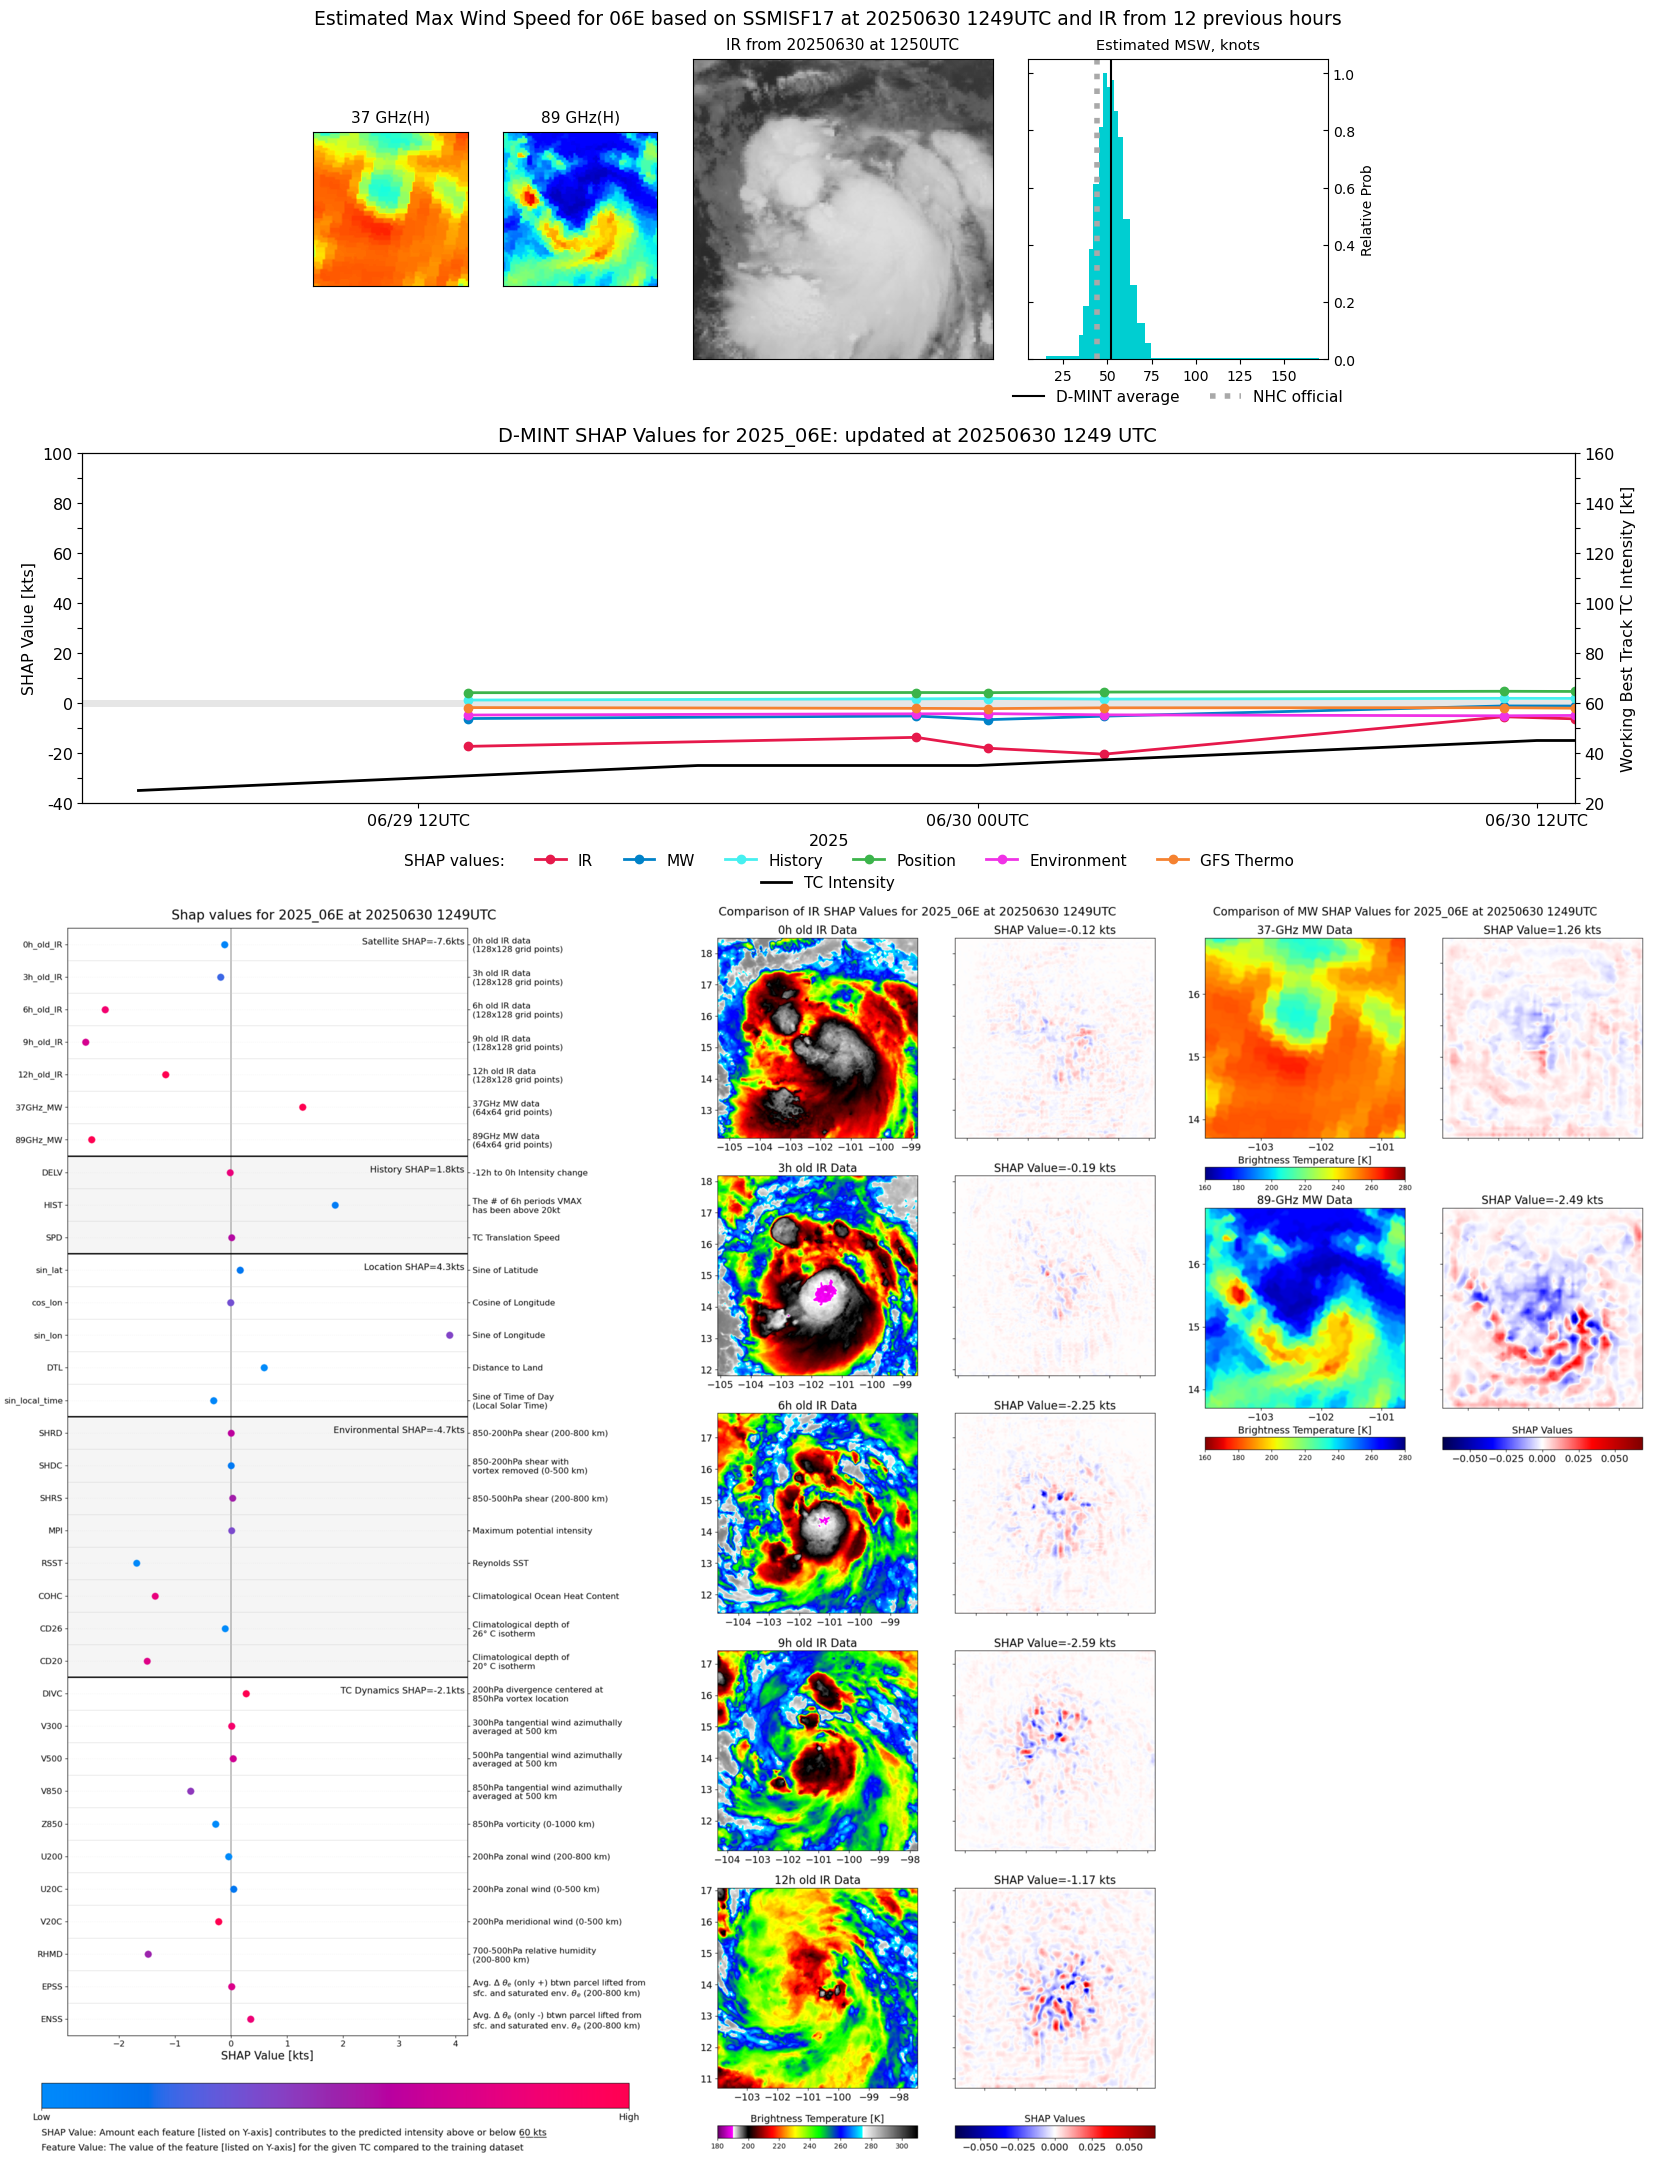 |
| 20250630 | 1117 UTC | SSMISF18 | 998 hPa | 53 kts | 48 kts | 58 kts | 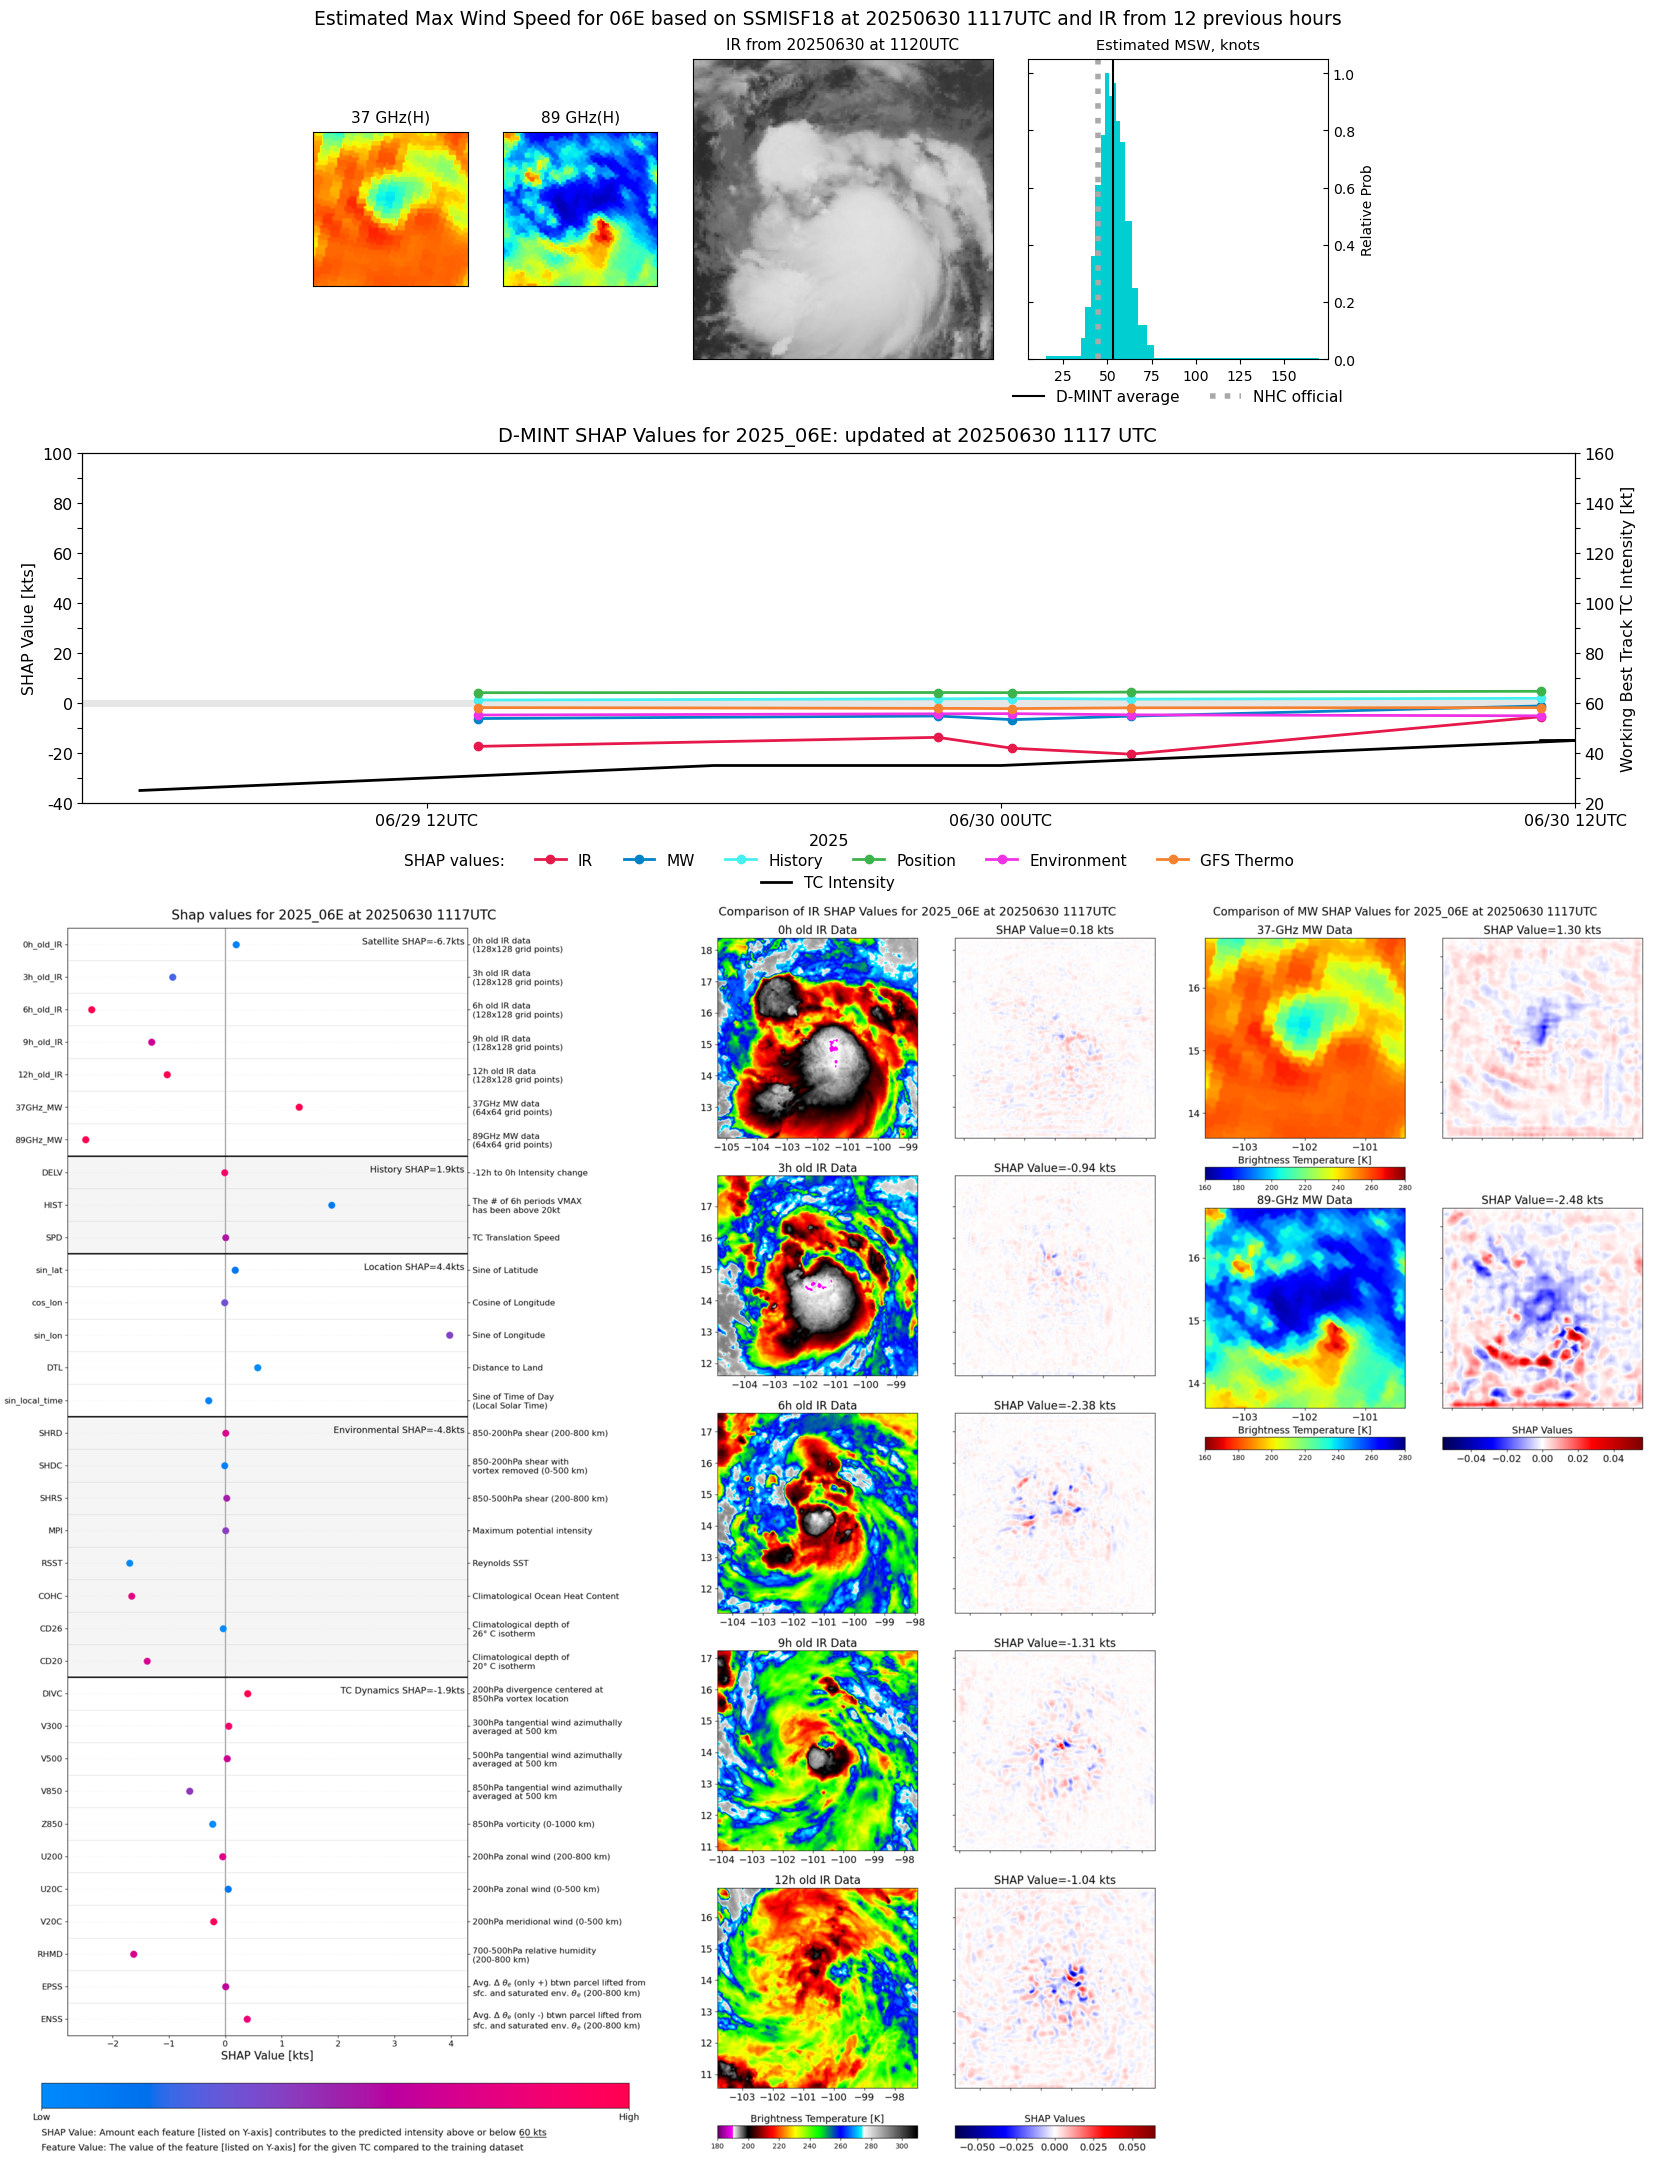 |
| 20250630 | 0847 UTC | ATMS-N20 | 1006 hPa | 39 kts | 35 kts | 44 kts | 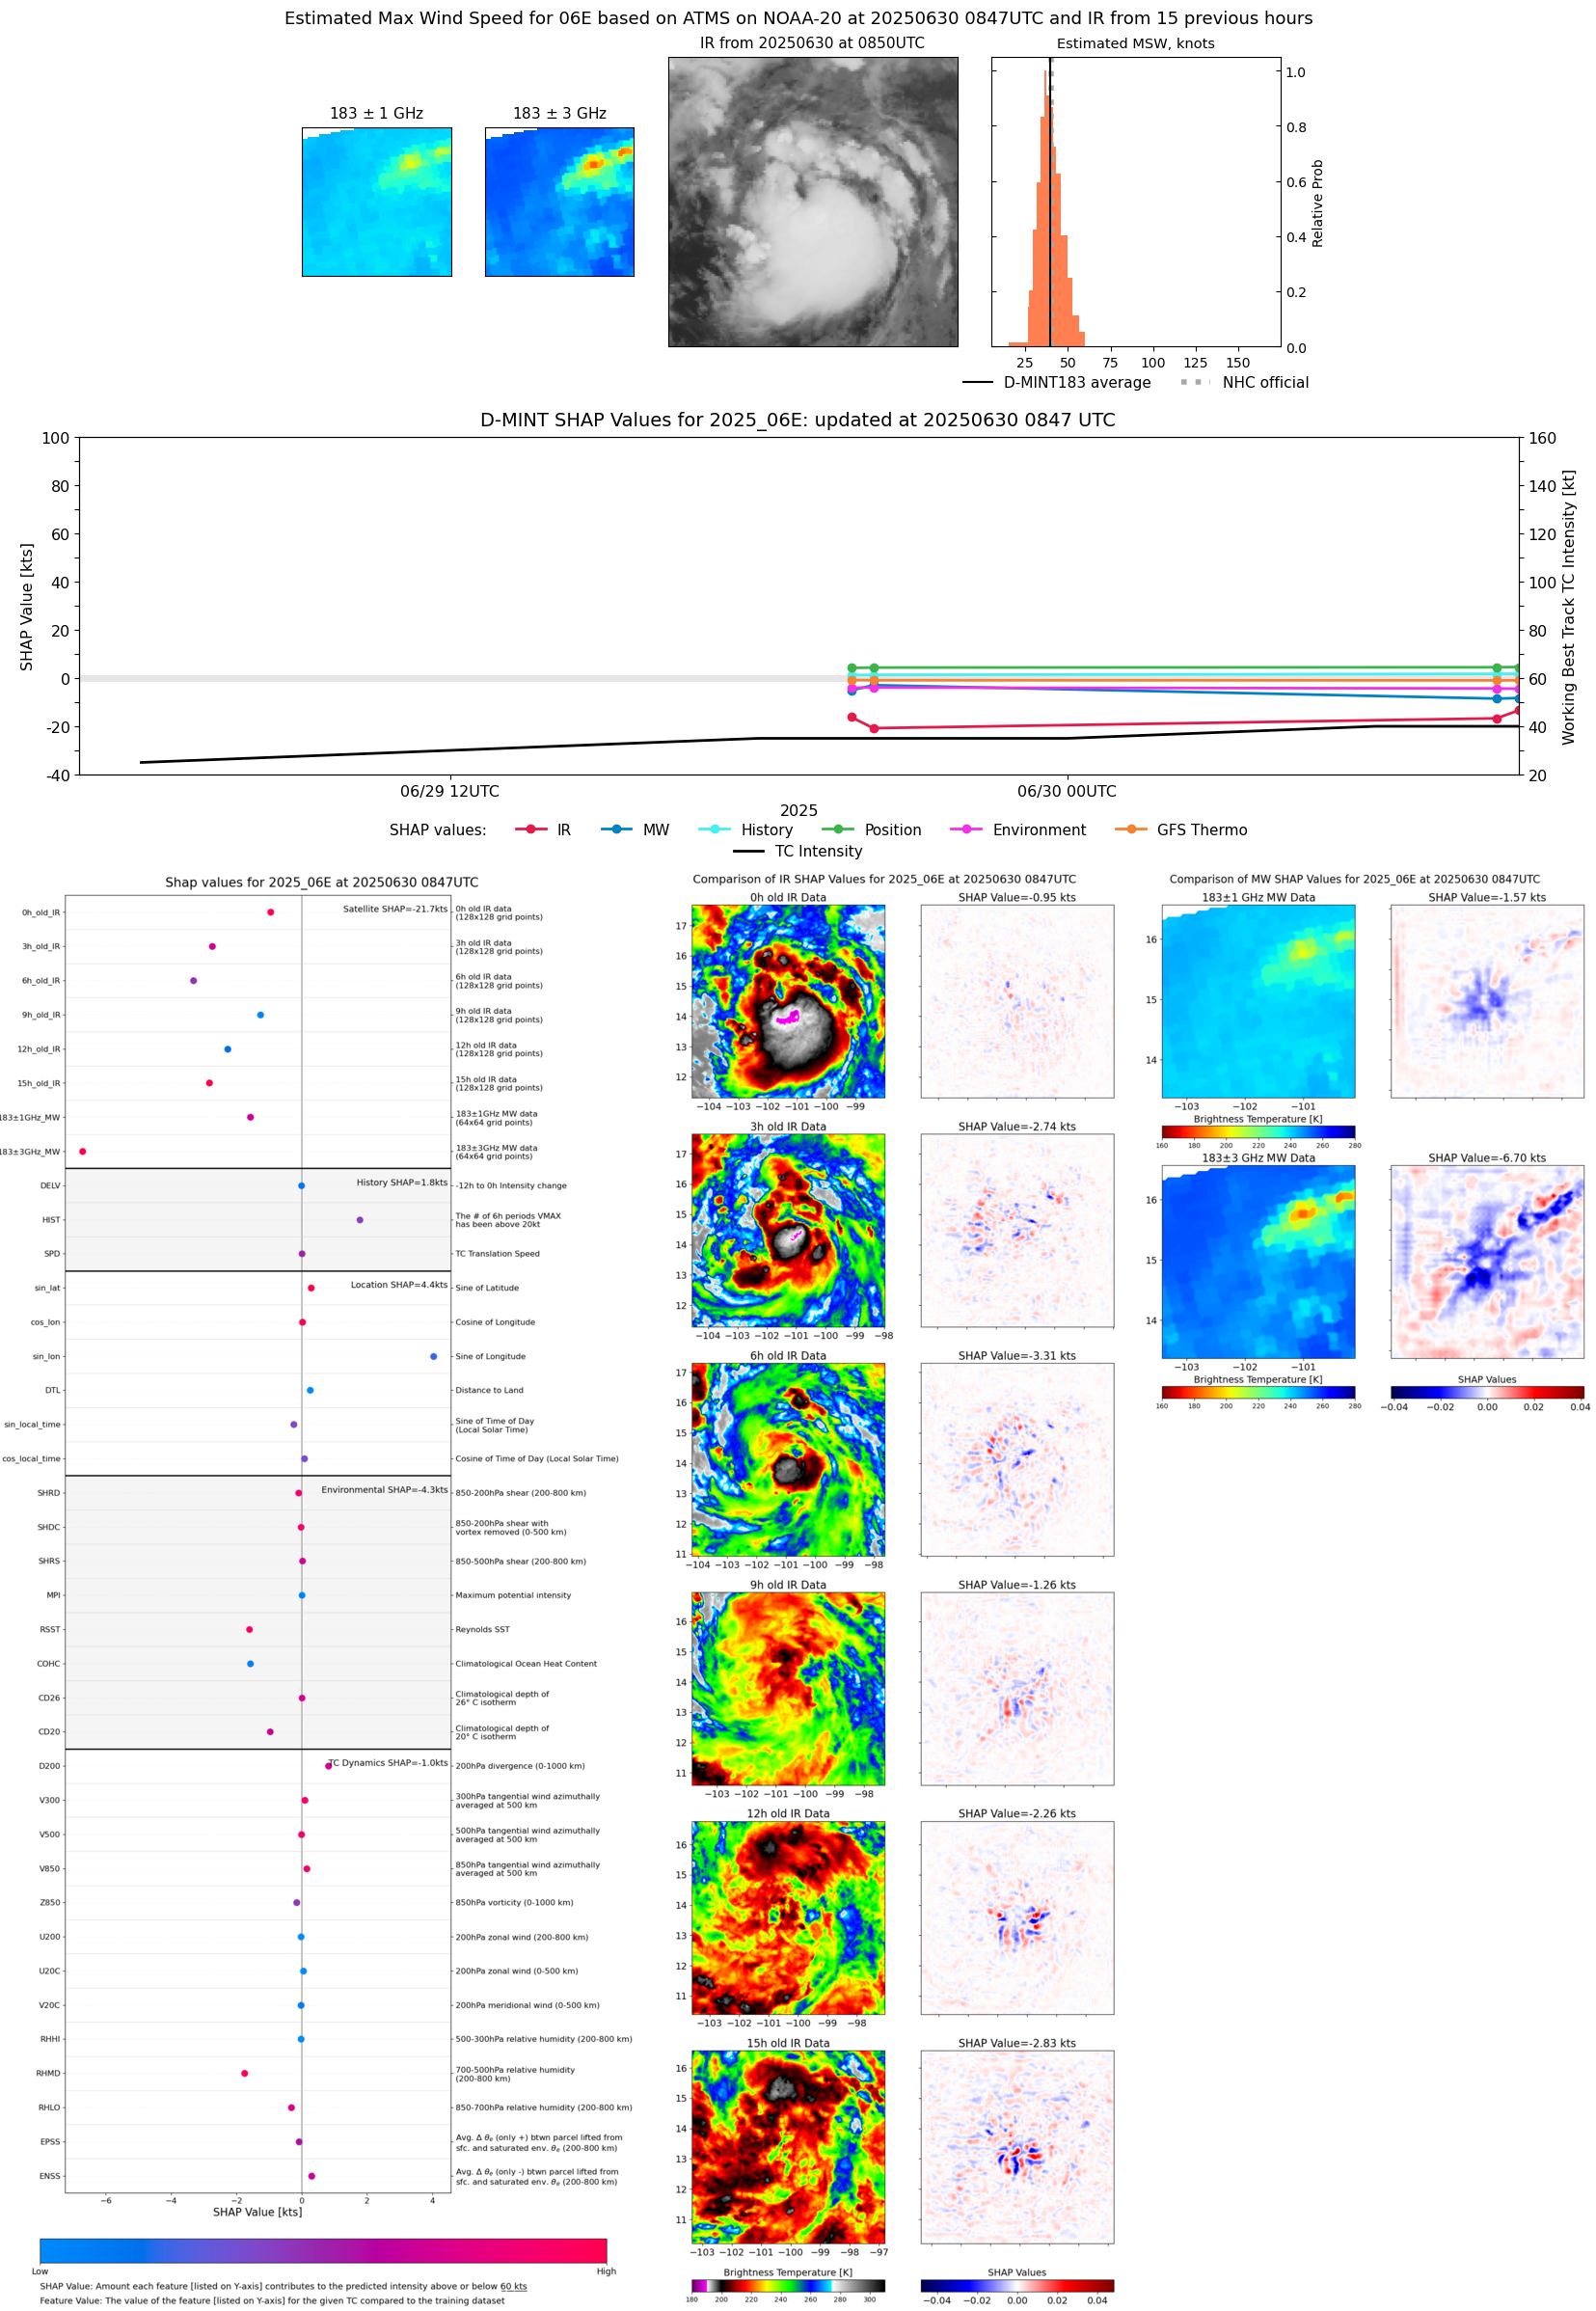 |
| 20250630 | 0821 UTC | ATMS-N20 | 1005 hPa | 36 kts | 32 kts | 40 kts |  |
| 20250630 | 0820 UTC | ATMS-N20 | 1002 hPa | 40 kts | 36 kts | 45 kts | 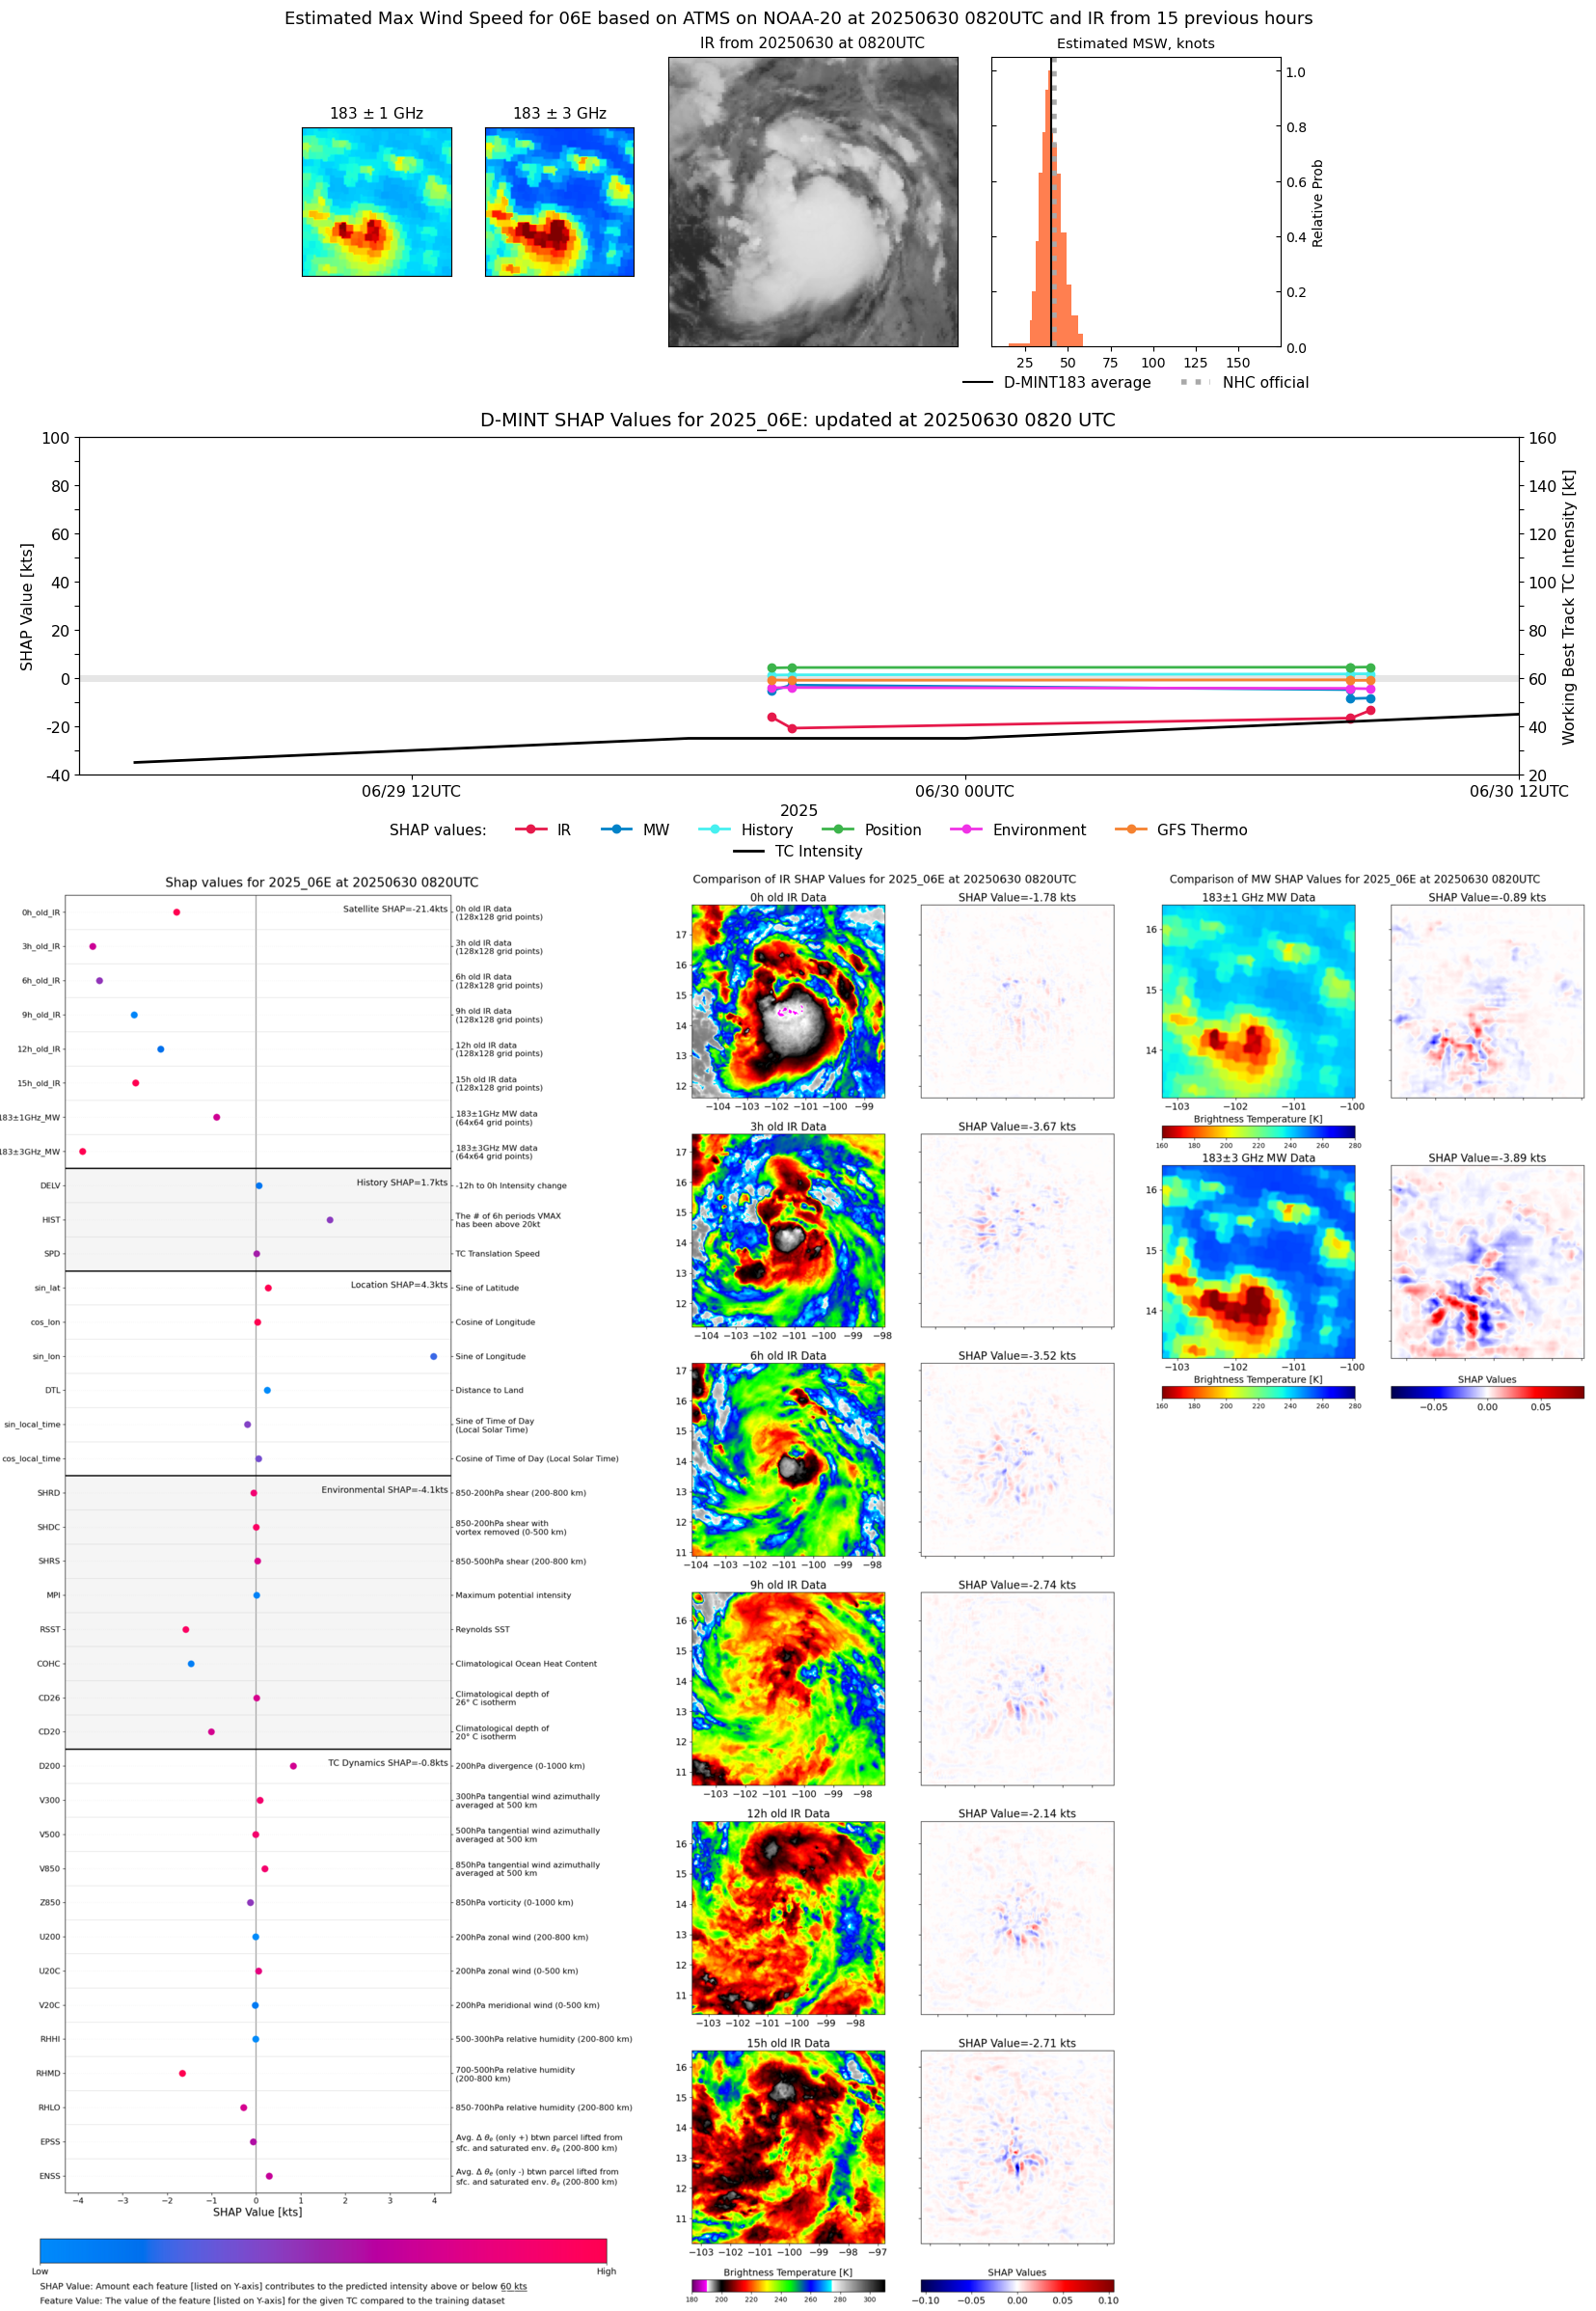 |
| 20250630 | 0243 UTC | GMI | 1006 hPa | 34 kts | 30 kts | 38 kts |  |
| 20250630 | 0014 UTC | SSMISF17 | 1004 hPa | 35 kts | 31 kts | 39 kts | 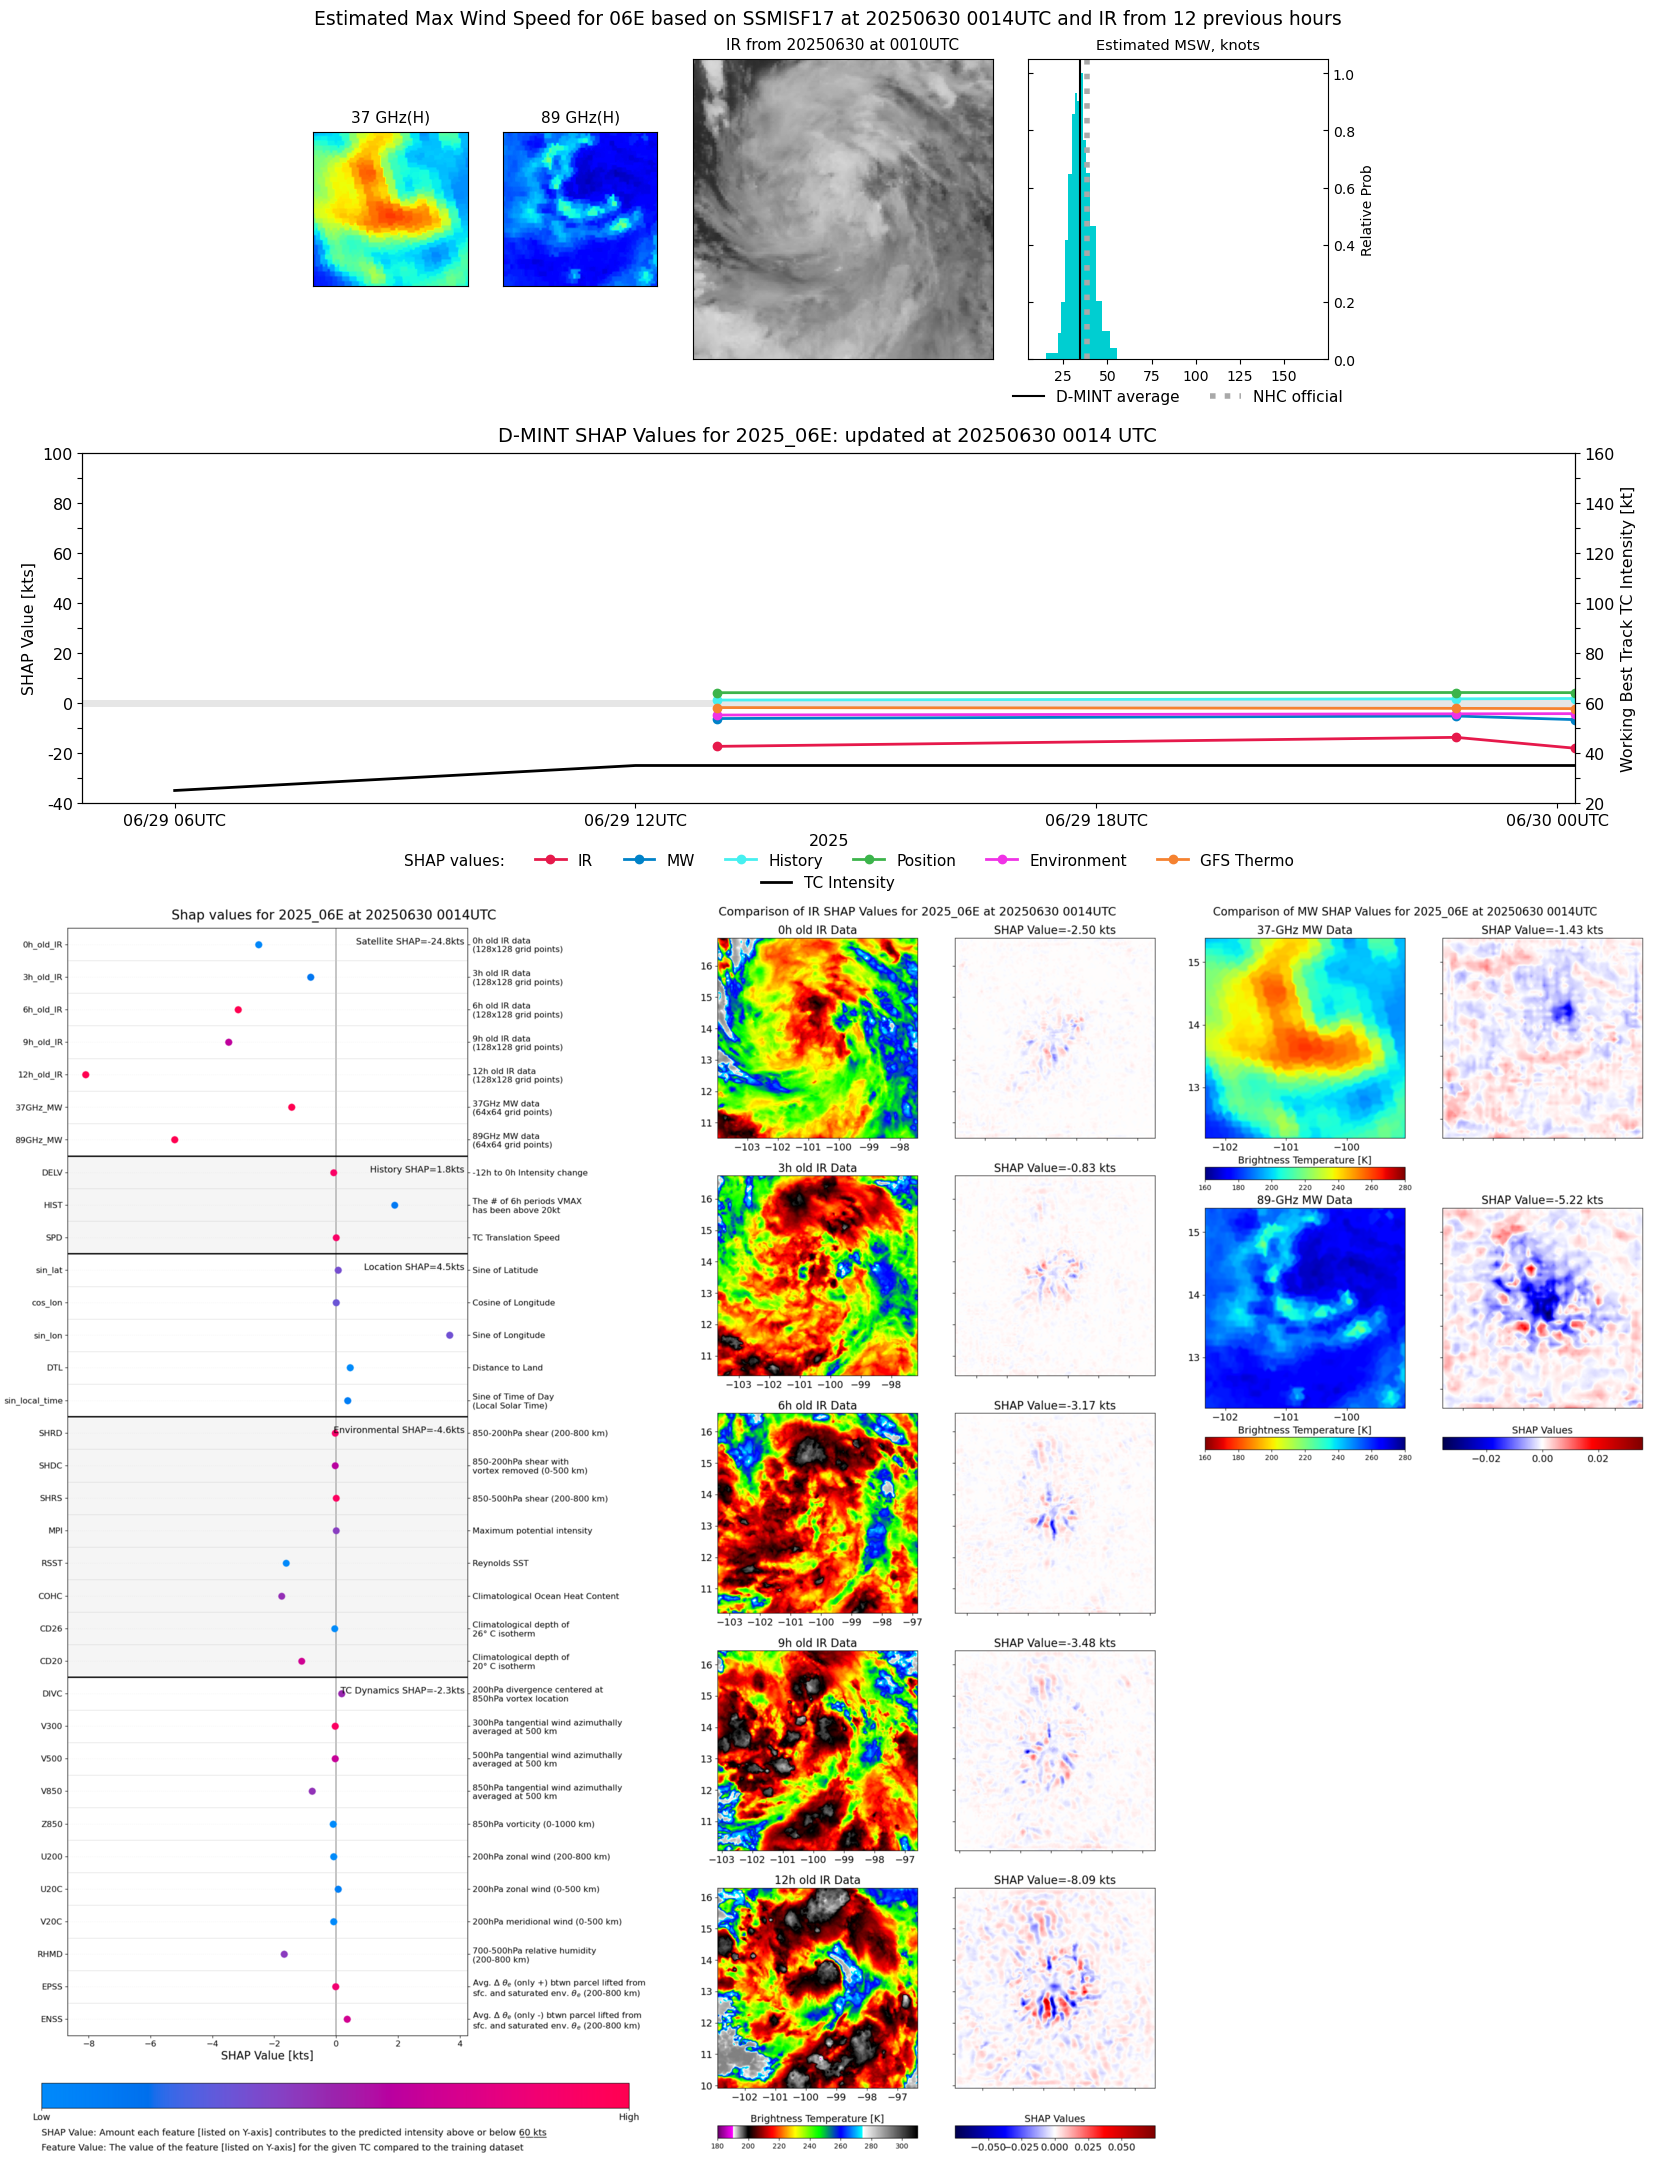 |
| 20250629 | 2241 UTC | SSMISF18 | 1004 hPa | 40 kts | 36 kts | 46 kts |  |
| 20250629 | 2014 UTC | ATMS-N20 | 1004 hPa | 37 kts | 34 kts | 42 kts |  |
| 20250629 | 1948 UTC | ATMS-N20 | 1005 hPa | 40 kts | 36 kts | 44 kts |  |
| 20250629 | 1304 UTC | SSMISF17 | 1004 hPa | 35 kts | 31 kts | 40 kts | 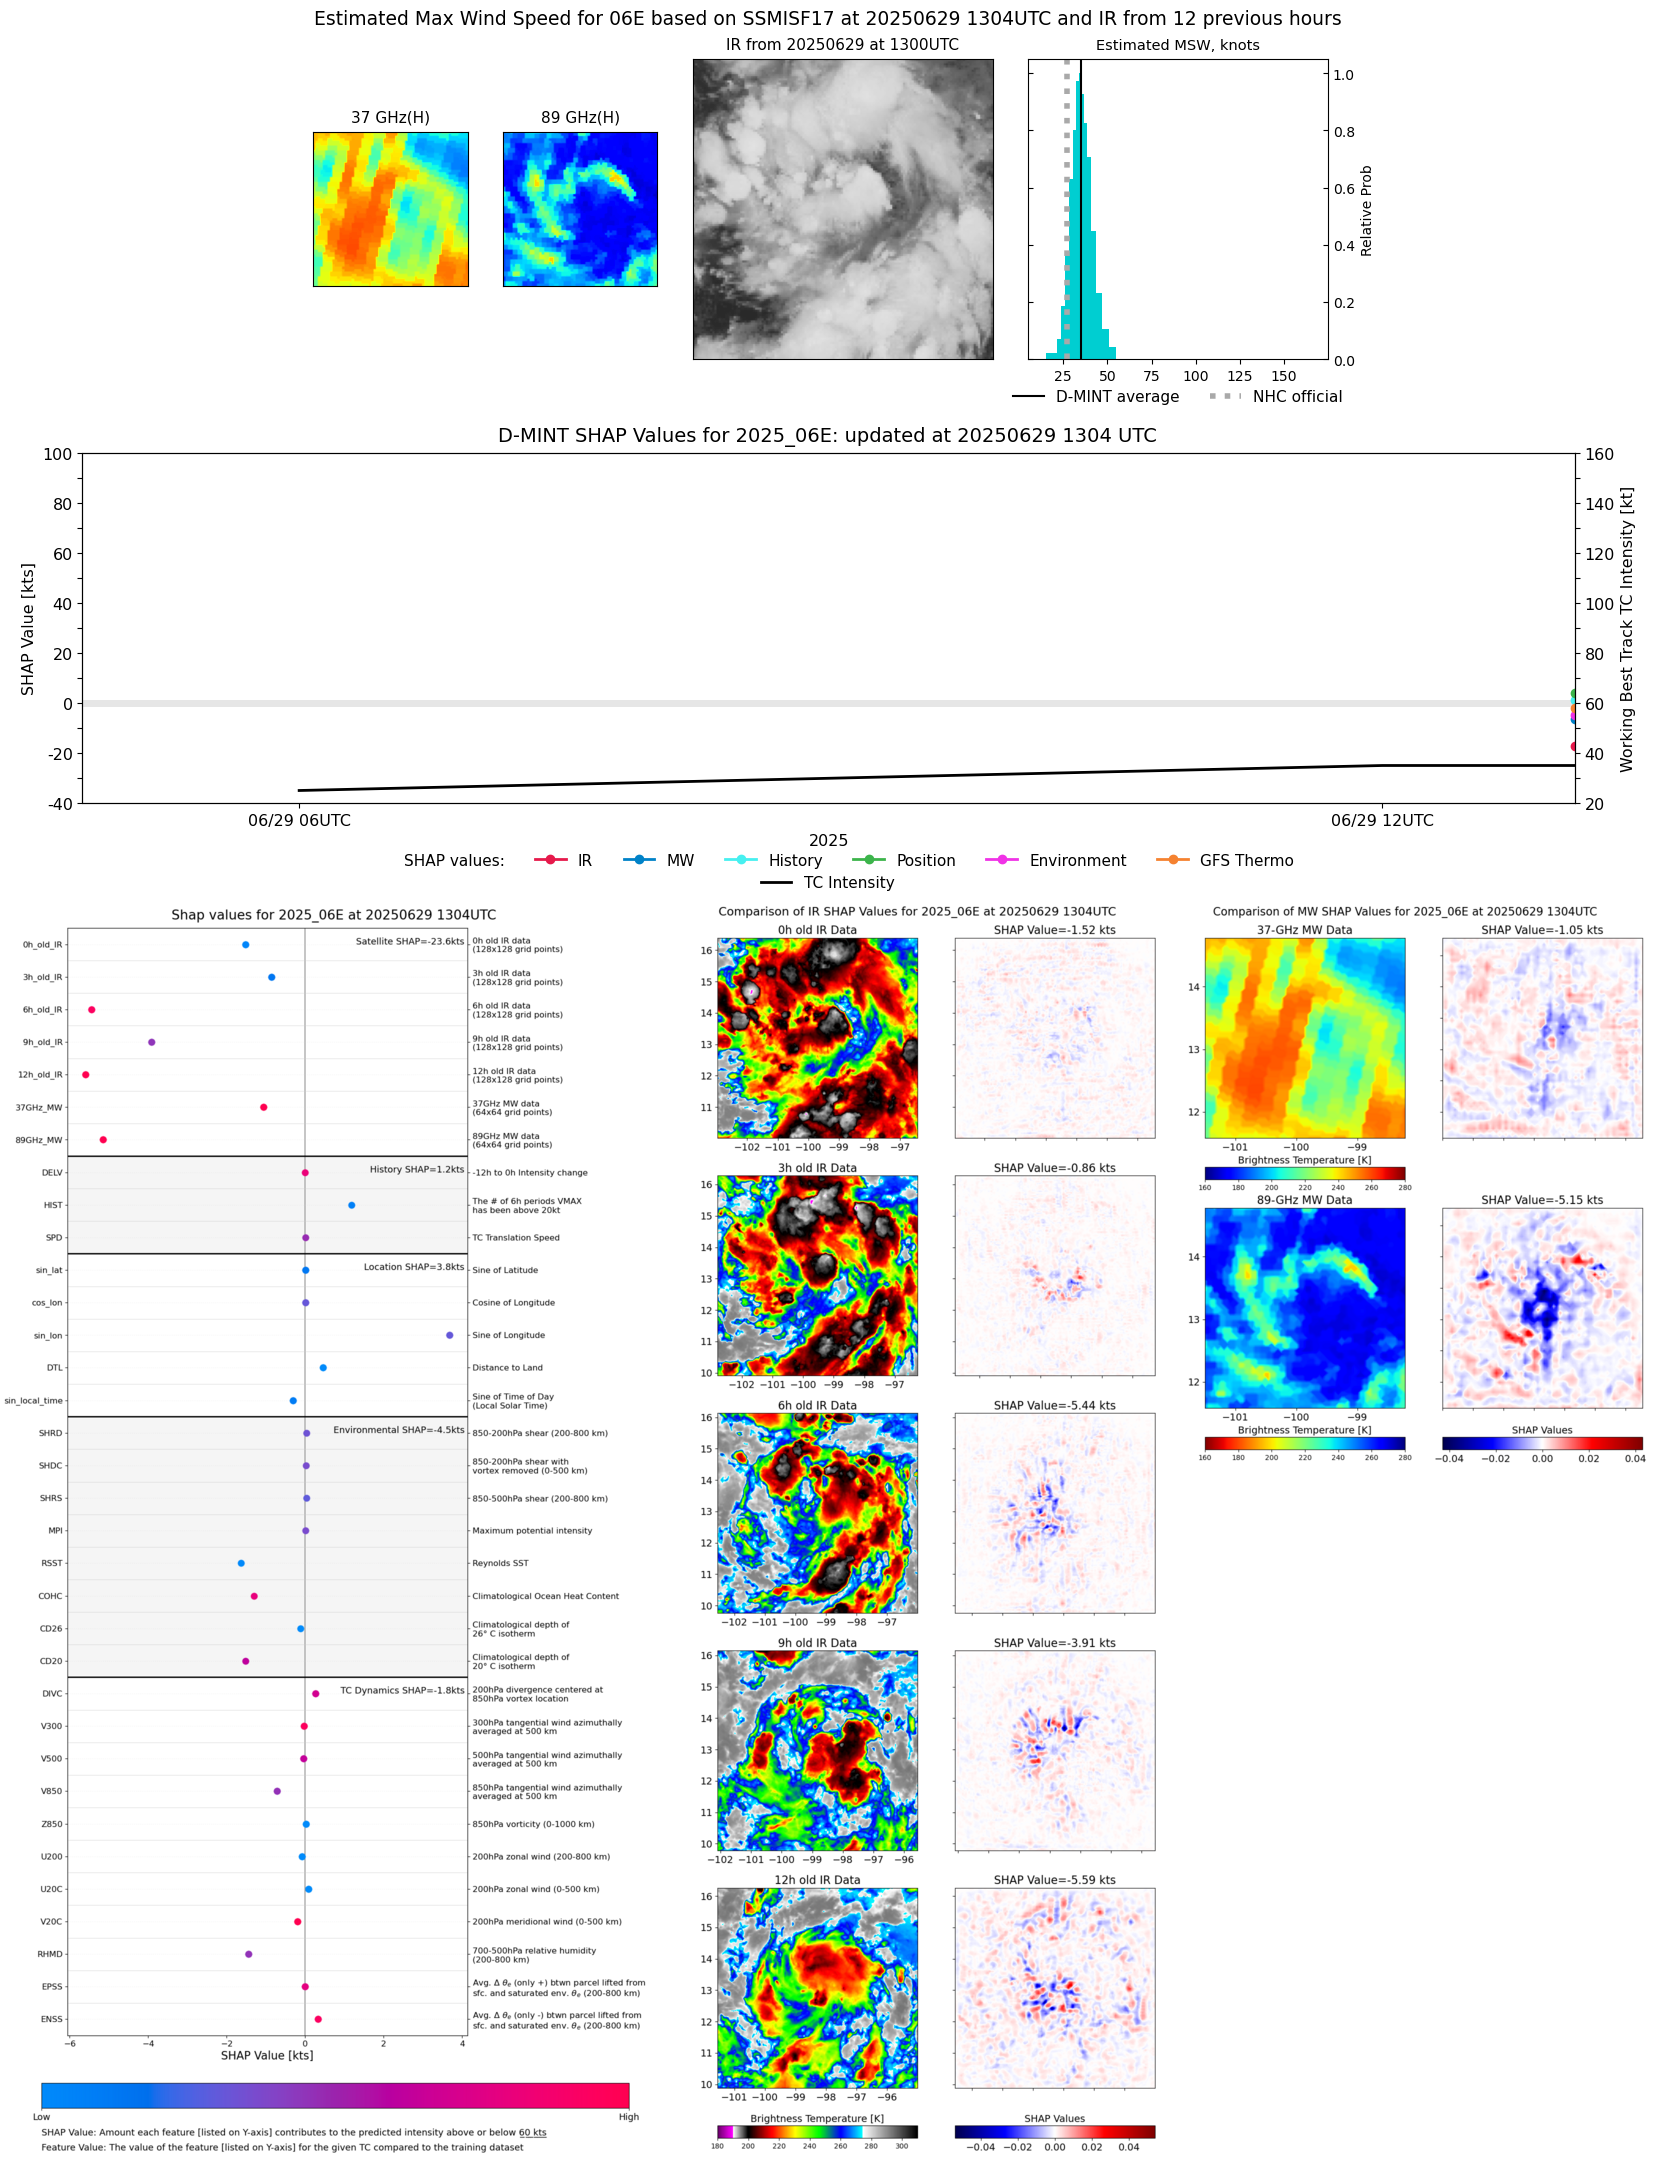 |
| 20250629 | 0846 UTC | AMSR2 | 1005 hPa | 31 kts | 27 kts | 34 kts |  |
| 20250629 | 0032 UTC | SSMISF16 | NaN hPa | 25 kts | 22 kts | 28 kts | 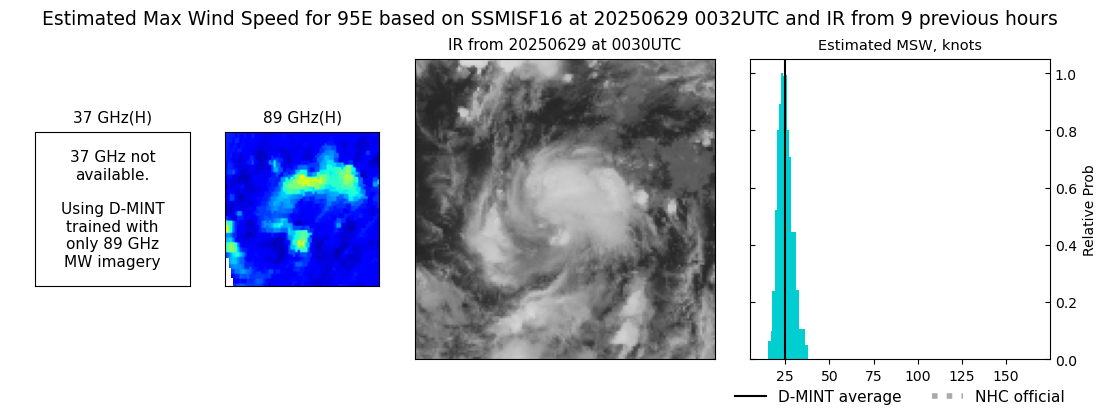 |
| 20250629 | 0028 UTC | SSMISF17 | NaN hPa | 32 kts | 29 kts | 36 kts | 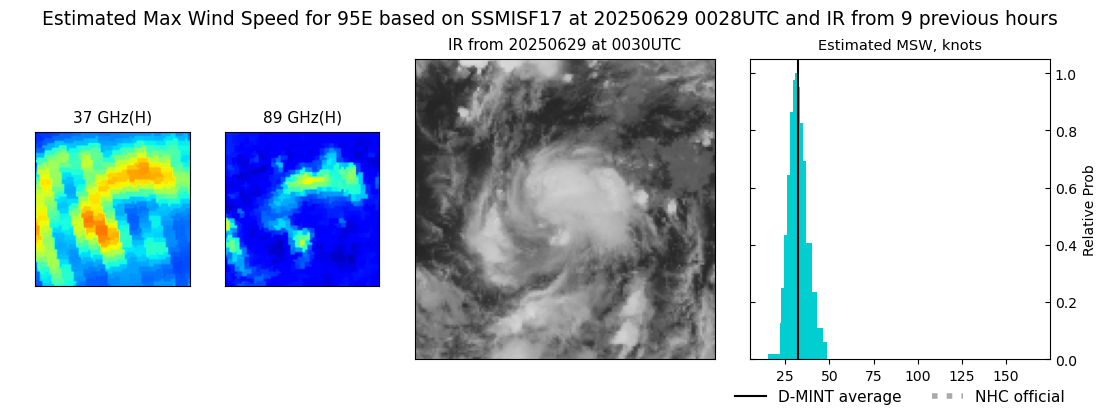 |
| 20250628 | 1558 UTC | GMI | NaN hPa | 29 kts | 26 kts | 32 kts | 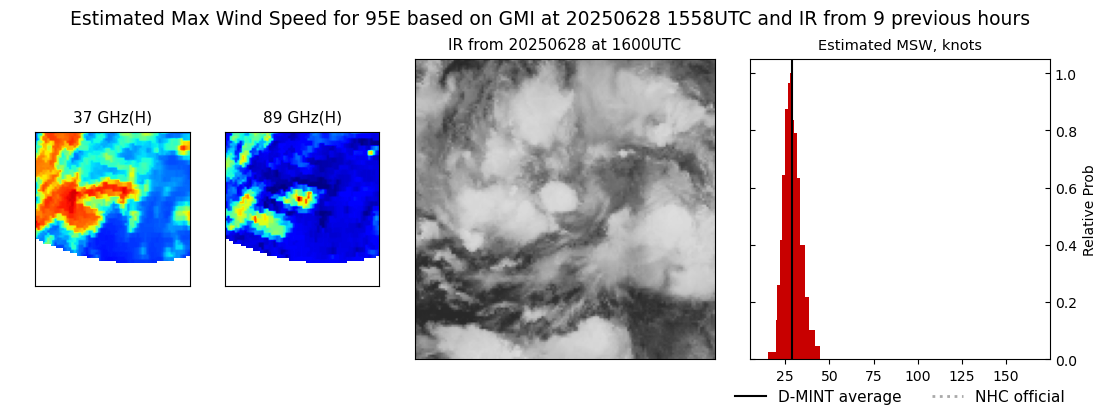 |
| 20250628 | 1322 UTC | SSMISF16 | NaN hPa | 24 kts | 22 kts | 27 kts |  |
| 20250628 | 0802 UTC | AMSR2 | NaN hPa | 28 kts | 25 kts | 32 kts |  |
| 20250628 | 0042 UTC | SSMISF17 | NaN hPa | 24 kts | 22 kts | 27 kts | 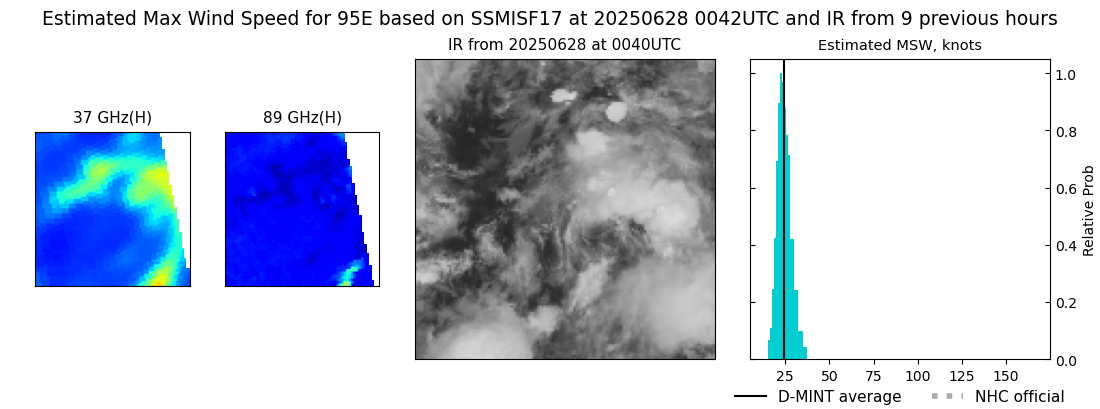 |
| 20250627 | 1947 UTC | AMSR2 | NaN hPa | 22 kts | 20 kts | 25 kts |  |
| 20250627 | 0320 UTC | GMI | NaN hPa | 22 kts | 20 kts | 24 kts |  |
| 20250627 | 0058 UTC | SSMISF16 | NaN hPa | 24 kts | 21 kts | 27 kts |  |
| 20250626 | 0815 UTC | AMSR2 | NaN hPa | 23 kts | 21 kts | 25 kts | 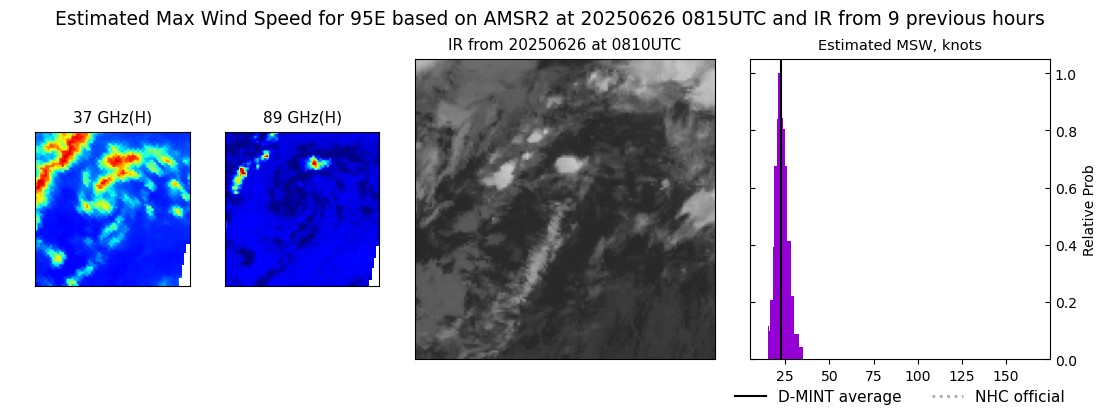 |
| 20250625 | 2155 UTC | SSMISF18 | NaN hPa | 29 kts | 26 kts | 33 kts | 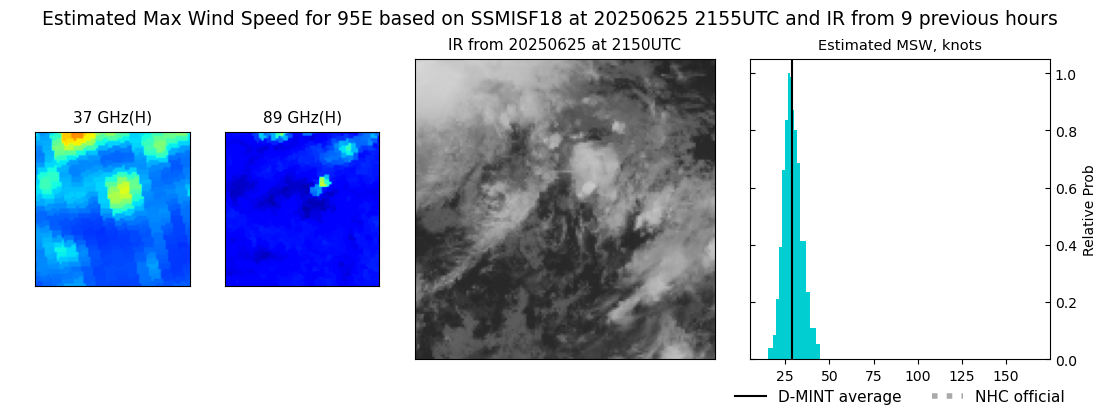 |
| 20250625 | 1959 UTC | AMSR2 | NaN hPa | 25 kts | 22 kts | 27 kts |  |
| 20250625 | 1628 UTC | GMI | NaN hPa | 24 kts | 21 kts | 27 kts | 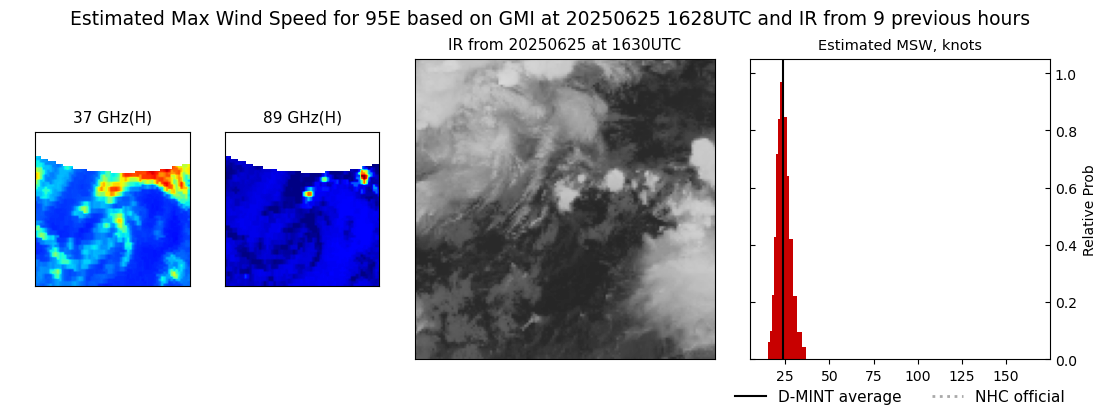 |
| 20250625 | 0732 UTC | AMSR2 | NaN hPa | 23 kts | 21 kts | 25 kts | 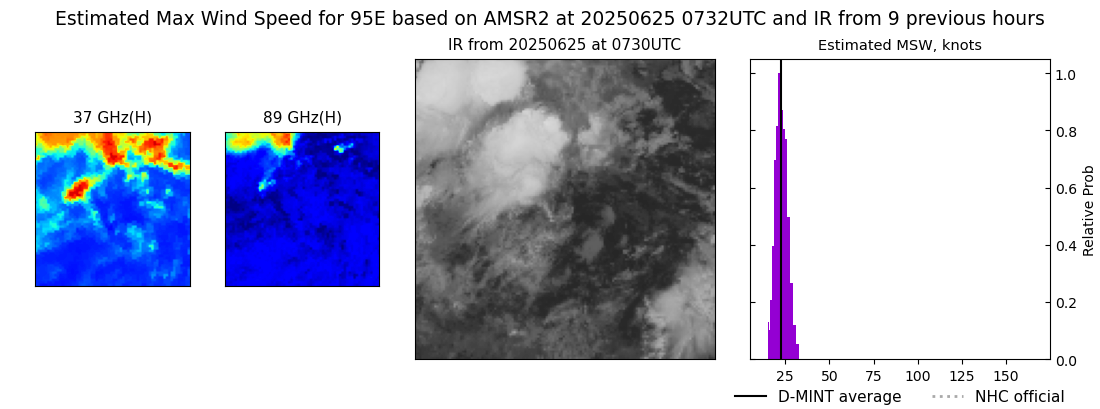 |
| 20250624 | 1916 UTC | AMSR2 | NaN hPa | 24 kts | 22 kts | 27 kts | 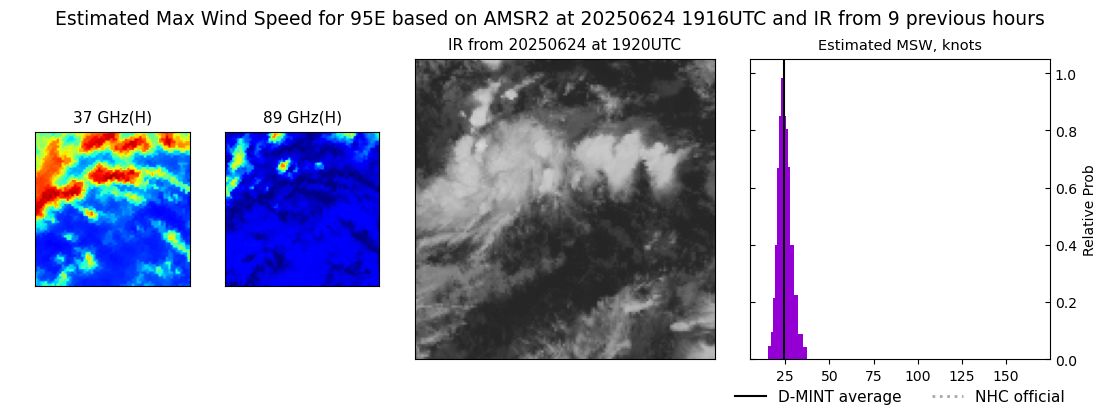 |
| 20250624 | 1235 UTC | SSMISF17 | NaN hPa | 25 kts | 23 kts | 27 kts | 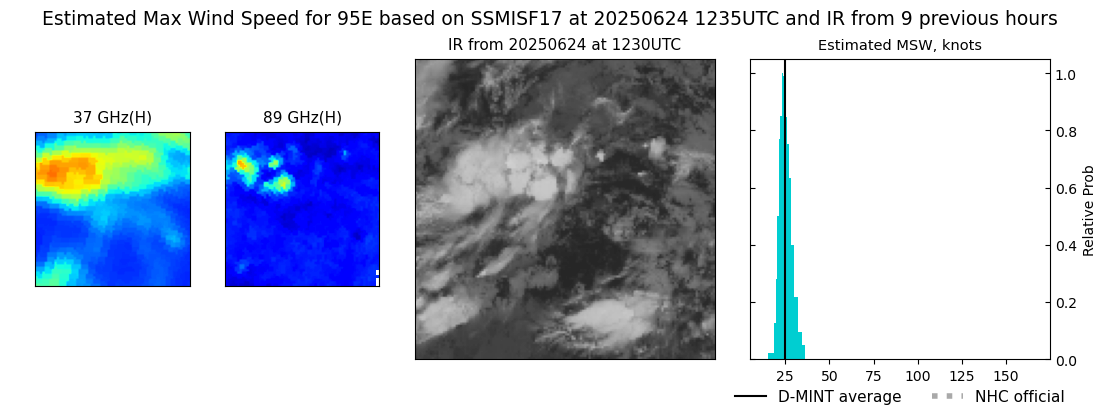 |